3d method for occlusal tooth wear assessment in presence
TRANSCRIPT

University of Groningen
3D Method for Occlusal Tooth Wear Assessment in Presence of Substantial Changes onOther Tooth SurfacesGkantidis, Nikolaos; Dritsas, Konstantinos; Katsaros, Christos; Halazonetis, Demetrios; Ren,YijinPublished in:Journal of Clinical Medicine
DOI:10.3390/jcm9123937
IMPORTANT NOTE: You are advised to consult the publisher's version (publisher's PDF) if you wish to cite fromit. Please check the document version below.
Document VersionPublisher's PDF, also known as Version of record
Publication date:2020
Link to publication in University of Groningen/UMCG research database
Citation for published version (APA):Gkantidis, N., Dritsas, K., Katsaros, C., Halazonetis, D., & Ren, Y. (2020). 3D Method for Occlusal ToothWear Assessment in Presence of Substantial Changes on Other Tooth Surfaces. Journal of ClinicalMedicine, 9(12), [3937]. https://doi.org/10.3390/jcm9123937
CopyrightOther than for strictly personal use, it is not permitted to download or to forward/distribute the text or part of it without the consent of theauthor(s) and/or copyright holder(s), unless the work is under an open content license (like Creative Commons).
The publication may also be distributed here under the terms of Article 25fa of the Dutch Copyright Act, indicated by the “Taverne” license.More information can be found on the University of Groningen website: https://www.rug.nl/library/open-access/self-archiving-pure/taverne-amendment.
Take-down policyIf you believe that this document breaches copyright please contact us providing details, and we will remove access to the work immediatelyand investigate your claim.
Downloaded from the University of Groningen/UMCG research database (Pure): http://www.rug.nl/research/portal. For technical reasons thenumber of authors shown on this cover page is limited to 10 maximum.

Journal of
Clinical Medicine
Article
3D Method for Occlusal Tooth Wear Assessment inPresence of Substantial Changes on OtherTooth Surfaces
Nikolaos Gkantidis 1,2,* , Konstantinos Dritsas 1 , Christos Katsaros 1, Demetrios Halazonetis 3
and Yijin Ren 2
1 Department of Orthodontics and Dentofacial Orthopedics, School of Dental Medicine, University of Bern,CH-3010 Bern, Switzerland; [email protected] (K.D.);[email protected] (C.K.)
2 Department of Orthodontics, W.J. Kolff Institute, University Medical Center Groningen,University of Groningen, 9700RB Groningen, The Netherlands; [email protected]
3 Department of Orthodontics, School of Dentistry, National and Kapodistrian University of Athens,GR-11527 Athens, Greece; [email protected]
* Correspondence: [email protected]; Tel.: +41-(0)-31-632-25-91
Received: 4 November 2020; Accepted: 1 December 2020; Published: 4 December 2020�����������������
Abstract: Early diagnosis and timely management of tooth or dental material wear is imperative toavoid extensive restorations. Previous studies suggested different methods for tooth wear assessment,but no study has developed a three-dimensional (3D) superimposition technique applicable incases where tooth surfaces, other than the occlusal, undergo extensive morphological changes.Here, we manually grinded plaster incisors and canines to simulate occlusal tooth wear of varyingseverity in teeth that received a wire retainer bonded on their lingual surfaces, during the assessmentperiod. The corresponding dental casts were scanned using a surface scanner. The modified toothcrowns were best-fit approximated to the original crowns using seven 3D superimposition techniques(two reference areas with varying settings) and the gold standard technique (GS: intact adjacent teethand alveolar processes as superimposition reference), which provided the true value. Only a specifictechnique (complete crown with 20% estimated overlap of meshes), which is applicable in actualclinical data, showed perfect agreement with the GS technique in all cases (median difference: −0.002,max absolute difference: 0.178 mm3). The outcomes of the suggested and the GS technique were highlyreproducible (max difference < 0.040 mm3). The presented technique offers low cost, convenient,accurate, and risk-free tooth wear assessment.
Keywords: tooth wear; measurement method; quantitative assessment; three-dimensional imaging;surface model; three-dimensional superimposition; orthodontic retention; fixed retainers
1. Introduction
Tooth wear characterizes the superficial loss of tooth matter over time. In humans, tooth wearoccurs as a consequence of normal function, parafunction, or environmental factors, such as veryacidic food. The main issue of concern, when excessive tooth wear occurs, is impaired dental esthetics.However, it may also affect facial morphology and speech, impacting patients’ quality of life. In recentyears, the need for retaining natural teeth intact for several decades has arisen due to the increase inlife expectancy. This, along with increased patient esthetic demands has designated tooth wear as animportant problem that needs to be addressed [1]. Advances in the dental field, including tooth wearmanagement, enabled teeth maintenance till late stages of life [2].
J. Clin. Med. 2020, 9, 3937; doi:10.3390/jcm9123937 www.mdpi.com/journal/jcm

J. Clin. Med. 2020, 9, 3937 2 of 13
Early diagnosis is imperative for the timely management of tooth wear, to avoid subsequentproblems and extensive restorations [2,3]. To facilitate tooth wear assessment, several previousstudies have suggested a variety of qualitative and quantitative methods. Qualitative approachesare subjective and usually suffer from reduced precision and reproducibility [4–6]. On the contrary,certain quantitative techniques have shown adequate reproducibility, usually within the range of15–20 µm, concerning vertical loss of tooth structure. However, the trueness of these techniques remainsquestionable, since studies lack a gold standard reference for comparison [7]. Other shortcomingsinclude the high complexity of these techniques that need special equipment and expertise to beapplied properly, as well as the dental impressions and physical models required. The above increasethe costs, the inaccuracies, and the applicability of the techniques in actual clinical conditions [7–9].
A highly accurate three-dimensional (3D) superimposition technique has been suggested recentlyfor occlusal tooth wear assessment using serial digital dental models [10]. Assuming that relevantsoftware and hardware is accessible, which is realistic for a contemporary practice, this technique isapplicable under regular clinical conditions. The existence of a previous dental model, obtained at acertain point in the past, is a prerequisite to apply this technique. The rapid incorporation of intraoralscanners in contemporary dentistry [11] and the use of relevant software for various applicationsfacilitates this purpose. The aforementioned previous study [10] focused on occlusal tooth wearassessment in cases that only the occlusal tooth surfaces were subjected to changes over time,offering an accuracy of 0.033 mm3, which corresponds to approximately 9 µm of vertical tooth loss [10].This accuracy level is much higher than any level than might be considered clinically significant.However, other tooth surfaces might also be affected by function, pathology, or due to iatrogenicinterventions [12–14]. This might complicate occlusal tooth wear assessment through serial 3D surfacemodel superimpositions. To our knowledge, there is no study in the literature that has addressedthis issue. A common instance where tooth surfaces, other than the occlusal, undergo extensivemorphological changes regards the placement of bonded wire retainers. Such retainers might be bondedfollowing orthodontic treatment, to stabilize teeth after trauma, or in periodontally compromisedpatients [14–17]. Thus, the purpose of the present study was to develop and validate a 3D occlusaltooth wear assessment technique, applicable when the anterior teeth crown morphology is highlyaltered during the testing period, in non-occlusal surfaces.
2. Experimental Section
2.1. Ethical Approval
The research project is registered and approved by the Swiss Ethical Committee of the Canton ofBern (Protocol No. 2019-00326). All experiments were performed under the relevant regulations andaccording to the pre-specified protocol. All participants signed an informed consent prior to the use oftheir data in the study.
2.2. Sample
The present sample was derived from an existing material, which was previously generatedand thoroughly described [10]. In this study, sixteen dental plaster models (type IV plaster,white color, Fujirock EP Premium, GC, Leuven, Belgium) with (n = 8; 4 maxillary and 4 mandibular;crowding ≤ 1 mm) and without (n = 8; 4 maxillary and 4 mandibular; crowding: 4–10 mm) wellaligned dental arches were used. These were retrieved from the archive of the Department ofOrthodontics and Dentofacial Orthopedics, University of Bern, Switzerland. The models representedindividuals with natural permanent dentition and no extreme morphological variation in oral structures(visual inspection).

J. Clin. Med. 2020, 9, 3937 3 of 13
2.3. Tooth Wear Simulation
According to a pre-specified and previously validated protocol, eighteen canines and eighteenincisors, equally distributed among the dental models described above, were manually grindedto simulate occlusal tooth wear of varying severity (approximately 0.5, 1, and 2 mm of verticalloss, respectively) [10]. Grinding was performed both symmetrically and asymmetrically, using adental laboratory straight handpiece or a dental laboratory stone knife, to simulate a variety of normaltooth wear patterns. Additionally, for the needs of the present study, a fixed retainer that is usuallybonded following orthodontic treatment or to stabilize highly mobile teeth following trauma or severeperiodontally compromised teeth, was simulated in the anterior teeth. For this, a twisted whitecoated ligature wire (0.3 mm initial diameter, Dentaurum, Ispringen, Germany) was placed on themiddle of the lingual surfaces of the test anterior teeth. A white modeling compound (Play-Doh putty,Hasbro, Pawtucket, RI, USA) was used to stabilize the wire on the teeth during scanning and simulatethe bonding material placed in vivo. Both materials were selected after pilot testing that confirmedsufficient material surface acquisition by the scanner. The setting resulted in two intact teeth adjacent toeach grinded tooth that received the retainer. The intact teeth and other adjacent anatomical structuresthat were not artificially altered, were used as superimposition reference areas to provide the goldstandard (true) measurement [10,18].
2.4. 3D Model Acquisition
The dental casts of the before (T0) and after wear simulation plus retainer placement (T1) conditions,were scanned using a laboratory 3D surface scanner (stripe light/LED illumination; full dental archaccuracy <20 µm; Laboratory scanner D104a, Cendres + Métaux SA, Biel/Bienne, Switzerland).Repeated single jaw model scans with this scanner, show a distance between corresponding surfacesalways smaller than 5 µm. The subsequent binary 3D Standard Tessellation Language (STL) modelswere imported in Viewbox 4 software (version 4.1.0.1 BETA, dHAL Software, Kifissia, Greece) to applythe methods tested in the study. Each such maxillary or mandibular full dental arch model consistedof 600.000–900.000 triangles.
2.5. Tooth Wear Volume Measurement Workflow
Following 3D superimpositions through seven test techniques and the gold standard technique,the crowns of the grinded teeth (T1) were manually segmented and compared to the segmentedoriginal crowns (T0).
For each tested tooth, the gold standard (GS) measurements were obtained through T0/T1 modelsuperimpositions on intact adjacent teeth and alveolar processes (Figure 1a). Perfect matching isexpected in these areas following a best-fit superimposition, which enables accurate occlusal toothwear assessment [10,11,18].
Measurements were performed according to a modified, previously published protocol [10].The first group of measurements (PC: partial crown) was obtained using part of the T0 clinical crown assuperimposition reference (Figure 1b–d). This aimed to include crown areas that could be consideredunaffected from occlusal wear or retainer placement. On the other hand, the complete T0 clinicalcrown was used as a superimposition reference for the second group (CC: complete crown) (Figure 1e).Each time, the T0/T1 3D models of each patient were superimposed using the software’s implementationof the iterative closest point algorithm (ICP) [19], with predefined settings that are described below.The whole process always started from the original initial position of the models. Thus, the first stepincluded the manual approximation of the two objects to facilitate rapid automatic registration throughthe ICP algorithm. For the same reason, following the manual approximation, in cases of a setting thatincluded less than 50% estimated overlap of meshes, a partial approximation of the two models wasalways performed, using 100% estimated overlap of meshes, before applying the predefined setting.
J. Clin. Med. 2020, 9, 3937 4 of 13J. Clin. Med. 2020, 9, x FOR PEER REVIEW 4 of 13
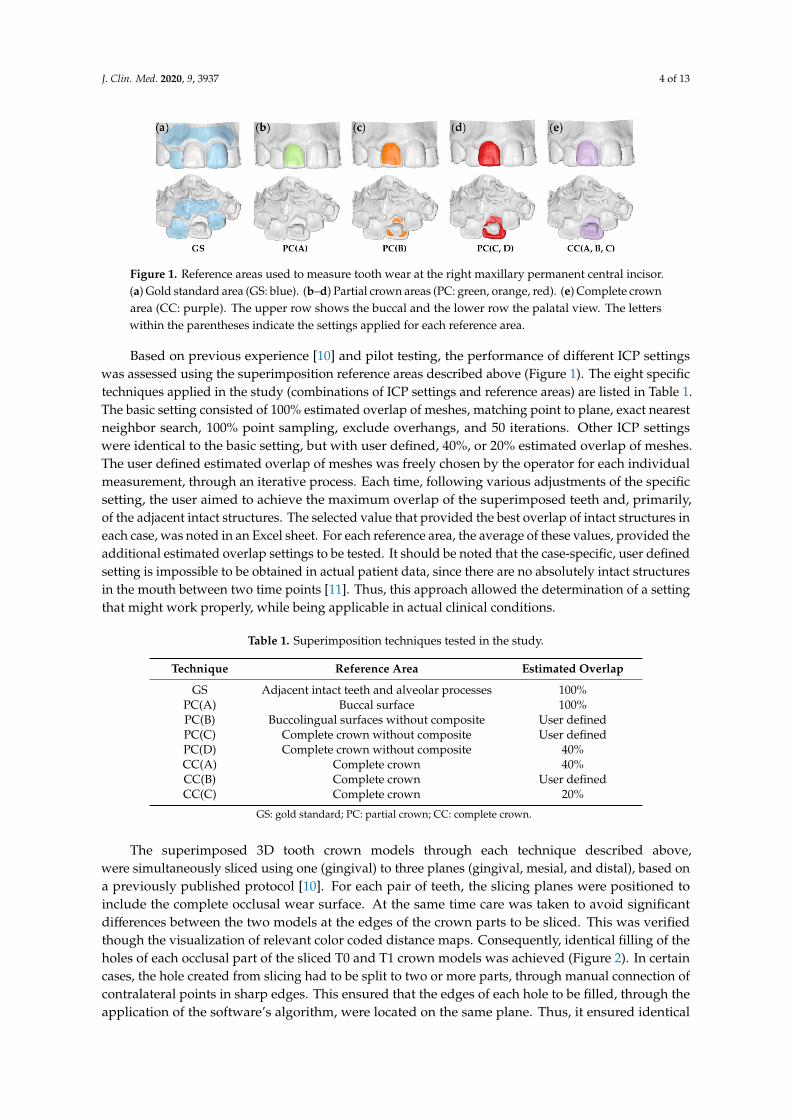
Figure 1. Reference areas used to measure tooth wear at the right maxillary permanent central incisor. (a) Gold standard area (GS: blue). (b–d) Partial crown areas (PC: green, orange, red). (e) Complete crown area (CC: purple). The upper row shows the buccal and the lower row the palatal view. The letters within the parentheses indicate the settings applied for each reference area.
Based on previous experience [10] and pilot testing, the performance of different ICP settings was assessed using the superimposition reference areas described above (Figure 1). The eight specific techniques applied in the study (combinations of ICP settings and reference areas) are listed in Table 1. The basic setting consisted of 100% estimated overlap of meshes, matching point to plane, exact nearest neighbor search, 100% point sampling, exclude overhangs, and 50 iterations. Other ICP settings were identical to the basic setting, but with user defined, 40%, or 20% estimated overlap of meshes. The user defined estimated overlap of meshes was freely chosen by the operator for each individual measurement, through an iterative process. Each time, following various adjustments of the specific setting, the user aimed to achieve the maximum overlap of the superimposed teeth and, primarily, of the adjacent intact structures. The selected value that provided the best overlap of intact structures in each case, was noted in an Excel sheet. For each reference area, the average of these values, provided the additional estimated overlap settings to be tested. It should be noted that the case-specific, user defined setting is impossible to be obtained in actual patient data, since there are no absolutely intact structures in the mouth between two time points [11]. Thus, this approach allowed the determination of a setting that might work properly, while being applicable in actual clinical conditions.
Table 1. Superimposition techniques tested in the study.
Technique Reference Area Estimated Overlap GS Adjacent intact teeth and alveolar processes 100%
PC(A) Buccal surface 100% PC(B) Buccolingual surfaces without composite User defined PC(C) Complete crown without composite User defined PC(D) Complete crown without composite 40% CC(A) Complete crown 40% CC(B) Complete crown User defined CC(C) Complete crown 20%
GS: gold standard; PC: partial crown; CC: complete crown.
The superimposed 3D tooth crown models through each technique described above, were simultaneously sliced using one (gingival) to three planes (gingival, mesial, and distal), based on a previously published protocol [10]. For each pair of teeth, the slicing planes were positioned to include the complete occlusal wear surface. At the same time care was taken to avoid significant differences between the two models at the edges of the crown parts to be sliced. This was verified though the visualization of relevant color coded distance maps. Consequently, identical filling of the holes of each occlusal part of the sliced T0 and T1 crown models was achieved (Figure 2). In certain cases, the hole created from slicing had to be split to two or more parts, through manual connection of contralateral points in sharp edges. This ensured that the edges of each hole to be filled, through the application of the software’s algorithm, were located on the same plane. Thus, it ensured identical
Figure 1. Reference areas used to measure tooth wear at the right maxillary permanent central incisor.(a) Gold standard area (GS: blue). (b–d) Partial crown areas (PC: green, orange, red). (e) Complete crownarea (CC: purple). The upper row shows the buccal and the lower row the palatal view. The letterswithin the parentheses indicate the settings applied for each reference area.
Based on previous experience [10] and pilot testing, the performance of different ICP settingswas assessed using the superimposition reference areas described above (Figure 1). The eight specifictechniques applied in the study (combinations of ICP settings and reference areas) are listed in Table 1.The basic setting consisted of 100% estimated overlap of meshes, matching point to plane, exact nearestneighbor search, 100% point sampling, exclude overhangs, and 50 iterations. Other ICP settingswere identical to the basic setting, but with user defined, 40%, or 20% estimated overlap of meshes.The user defined estimated overlap of meshes was freely chosen by the operator for each individualmeasurement, through an iterative process. Each time, following various adjustments of the specificsetting, the user aimed to achieve the maximum overlap of the superimposed teeth and, primarily,of the adjacent intact structures. The selected value that provided the best overlap of intact structures ineach case, was noted in an Excel sheet. For each reference area, the average of these values, provided theadditional estimated overlap settings to be tested. It should be noted that the case-specific, user definedsetting is impossible to be obtained in actual patient data, since there are no absolutely intact structuresin the mouth between two time points [11]. Thus, this approach allowed the determination of a settingthat might work properly, while being applicable in actual clinical conditions.
Table 1. Superimposition techniques tested in the study.
Technique Reference Area Estimated Overlap
GS Adjacent intact teeth and alveolar processes 100%PC(A) Buccal surface 100%PC(B) Buccolingual surfaces without composite User definedPC(C) Complete crown without composite User definedPC(D) Complete crown without composite 40%CC(A) Complete crown 40%CC(B) Complete crown User definedCC(C) Complete crown 20%
GS: gold standard; PC: partial crown; CC: complete crown.
The superimposed 3D tooth crown models through each technique described above,were simultaneously sliced using one (gingival) to three planes (gingival, mesial, and distal), based ona previously published protocol [10]. For each pair of teeth, the slicing planes were positioned toinclude the complete occlusal wear surface. At the same time care was taken to avoid significantdifferences between the two models at the edges of the crown parts to be sliced. This was verifiedthough the visualization of relevant color coded distance maps. Consequently, identical filling of theholes of each occlusal part of the sliced T0 and T1 crown models was achieved (Figure 2). In certaincases, the hole created from slicing had to be split to two or more parts, through manual connection ofcontralateral points in sharp edges. This ensured that the edges of each hole to be filled, through theapplication of the software’s algorithm, were located on the same plane. Thus, it ensured identical

J. Clin. Med. 2020, 9, 3937 5 of 13
hole filling and creation of watertight T0 and T1 3D models that were matching at all parts, apart fromthe occlusal part that was the one to be assessed (Figure 3). Following this approach, occlusal toothwear was defined as the difference between these two superimposed crown parts. The wear amount,expressed as volume loss of tooth structure (mm3), that was detected through the gold standardtechnique, was then compared to that of the test techniques.
To assess the error of Viewbox 4 software on volumetric assessments, the volumes of ten toothparts similar to those used for the study were measured using Viewbox 4, Artec Studio 12 Professional(Artec 3D, Luxembourg), and MeshLab 2016.12 [20] and compared. The error attributed to the usedsurface scanner was measured in ten teeth of various types, located on ten different models that werescanned twice. Following superimposition of the corresponding identical teeth derived from repeatedscans, volumes similar to those tested in the study were calculated. Zero difference in correspondingvolumes would indicate perfect superimposition of the repeated models and zero scanner error.Reproducibility of tooth wear assessment techniques was tested through repeated measurements often teeth, on four randomly selected models, two maxillary and two mandibular (one with and onewithout crowding each) by one operator, following a 1-month period.
J. Clin. Med. 2020, 9, x FOR PEER REVIEW 5 of 13
hole filling and creation of watertight T0 and T1 3D models that were matching at all parts, apart from the occlusal part that was the one to be assessed (Figure 3). Following this approach, occlusal tooth wear was defined as the difference between these two superimposed crown parts. The wear amount, expressed as volume loss of tooth structure (mm3), that was detected through the gold standard technique, was then compared to that of the test techniques.
To assess the error of Viewbox 4 software on volumetric assessments, the volumes of ten tooth parts similar to those used for the study were measured using Viewbox 4, Artec Studio 12 Professional (Artec 3D, Luxembourg), and MeshLab 2016.12 [20] and compared. The error attributed to the used surface scanner was measured in ten teeth of various types, located on ten different models that were scanned twice. Following superimposition of the corresponding identical teeth derived from repeated scans, volumes similar to those tested in the study were calculated. Zero difference in corresponding volumes would indicate perfect superimposition of the repeated models and zero scanner error. Reproducibility of tooth wear assessment techniques was tested through repeated measurements of ten teeth, on four randomly selected models, two maxillary and two mandibular (one with and one without crowding each) by one operator, following a 1-month period.
Figure 2. Tooth wear measurement process in a maxillary central incisor. (a) Tooth before (yellow) and after (green) tooth wear and retainer simulation. (b) Superimposed tooth crowns using the complete crown technique and setting C (20% estimated overlap) shown from the buccal (left) and the lingual (right) aspect. (c) Color coded distance map showing the tooth wear from the buccal (left) and the lingual (right) side. (d) Level (grey) used to simultaneously slice the two crowns. (e) Sliced tooth crowns. (f) Holes filled to create watertight models, and thus, calculate volumes.
Figure 3. Tooth wear measurement process in a mandibular canine. (a) Tooth before (yellow) and after (green) tooth wear and retainer simulation. (b) Superimposed tooth crowns using the complete crown technique and setting C (20% estimated overlap) shown from the buccal (left) and the lingual (right) aspect. (c) Color coded distance map showing the tooth wear from the buccal (left) and the lingual (right) side. (d) Two levels (grey) used to simultaneously slice the two crowns. (e) Sliced tooth crowns with connected contralateral points (blue) in sharp edges (red line), splitting the hole in two
Figure 2. Tooth wear measurement process in a maxillary central incisor. (a) Tooth before (yellow) andafter (green) tooth wear and retainer simulation. (b) Superimposed tooth crowns using the completecrown technique and setting C (20% estimated overlap) shown from the buccal (left) and the lingual(right) aspect. (c) Color coded distance map showing the tooth wear from the buccal (left) and thelingual (right) side. (d) Level (grey) used to simultaneously slice the two crowns. (e) Sliced toothcrowns. (f) Holes filled to create watertight models, and thus, calculate volumes.
J. Clin. Med. 2020, 9, x FOR PEER REVIEW 5 of 13
hole filling and creation of watertight T0 and T1 3D models that were matching at all parts, apart from the occlusal part that was the one to be assessed (Figure 3). Following this approach, occlusal tooth wear was defined as the difference between these two superimposed crown parts. The wear amount, expressed as volume loss of tooth structure (mm3), that was detected through the gold standard technique, was then compared to that of the test techniques.
To assess the error of Viewbox 4 software on volumetric assessments, the volumes of ten tooth parts similar to those used for the study were measured using Viewbox 4, Artec Studio 12 Professional (Artec 3D, Luxembourg), and MeshLab 2016.12 [20] and compared. The error attributed to the used surface scanner was measured in ten teeth of various types, located on ten different models that were scanned twice. Following superimposition of the corresponding identical teeth derived from repeated scans, volumes similar to those tested in the study were calculated. Zero difference in corresponding volumes would indicate perfect superimposition of the repeated models and zero scanner error. Reproducibility of tooth wear assessment techniques was tested through repeated measurements of ten teeth, on four randomly selected models, two maxillary and two mandibular (one with and one without crowding each) by one operator, following a 1-month period.
Figure 2. Tooth wear measurement process in a maxillary central incisor. (a) Tooth before (yellow) and after (green) tooth wear and retainer simulation. (b) Superimposed tooth crowns using the complete crown technique and setting C (20% estimated overlap) shown from the buccal (left) and the lingual (right) aspect. (c) Color coded distance map showing the tooth wear from the buccal (left) and the lingual (right) side. (d) Level (grey) used to simultaneously slice the two crowns. (e) Sliced tooth crowns. (f) Holes filled to create watertight models, and thus, calculate volumes.
Figure 3. Tooth wear measurement process in a mandibular canine. (a) Tooth before (yellow) and after (green) tooth wear and retainer simulation. (b) Superimposed tooth crowns using the complete crown technique and setting C (20% estimated overlap) shown from the buccal (left) and the lingual (right) aspect. (c) Color coded distance map showing the tooth wear from the buccal (left) and the lingual (right) side. (d) Two levels (grey) used to simultaneously slice the two crowns. (e) Sliced tooth crowns with connected contralateral points (blue) in sharp edges (red line), splitting the hole in two
Figure 3. Tooth wear measurement process in a mandibular canine. (a) Tooth before (yellow) andafter (green) tooth wear and retainer simulation. (b) Superimposed tooth crowns using the completecrown technique and setting C (20% estimated overlap) shown from the buccal (left) and the lingual(right) aspect. (c) Color coded distance map showing the tooth wear from the buccal (left) and thelingual (right) side. (d) Two levels (grey) used to simultaneously slice the two crowns. (e) Sliced toothcrowns with connected contralateral points (blue) in sharp edges (red line), splitting the hole in twoparts to ensure identical hole filling process. (f) Holes filled to create watertight models, and thus,calculate volumes.

J. Clin. Med. 2020, 9, 3937 6 of 13
2.6. Statistical Analysis
The statistical approach followed here is comparable to that of a previous similar study [10].Statistical analysis was carried out by using the IBM SPSS statistics for Windows (Version 26.0.IBM Corp: Armonk, NY, USA). Non-parametric statistics were applied based on abnormal distributionof the raw data of certain variables (Kolmogorov–Smirnov and Shapiro–Wilk tests).
Agreement between different techniques with the gold standard technique (trueness) regardingtooth wear, was shown in box plots. Perfect trueness is indicated by zero median value, whereas thelarger the deviation from zero the lower the trueness. Within techniques, the range of deviation ofindividual values from the median value shows precision. Differences in trueness and precision amongdifferent techniques were tested using Friedman’s test, followed, where applicable, by Wilcoxon’ssigned rank test for pairwise comparisons [10].
Potential effects of presence of crowding, tooth type, or tooth wear amount on the trueness andprecision of each technique were explored through visual inspection of relevant plots and unpairedcomparative tests within techniques [10].
Intra-operator error (reproducibility) of the gold standard and the technique of choice was assessedthrough Bland Altman plots, with markers set by tooth category. Any deviation from zero showsimprecision of the technique. Differences in the reproducibility of the two techniques were tested in anunpaired manner through Mann–Whitney U test [10].
For all tests, a two-sided significance test was carried out at an alpha level of 0.05. When multiplepairwise comparisons were performed, the level of significance was altered according to theBonferroni adjustment.
3. Results
Regarding the volumetric assessment of tooth crown parts of interest, all three tested softwareprovided identical values for all tested models. Following superimposition of corresponding singleteeth, derived from repeated scans, with the CC(C) technique, the median volume difference was0.0115 mm3 (range: 0.0003, 0.0350 mm3) when all differences were transformed to absolute values.The original position of the second scan was randomly altered prior to these tests. This valueindicates the scanner plus the superimposition error regarding tooth wear assessment using singleteeth. Repeated tooth wear measurements with the gold standard technique and the CC(C) techniqueof choice showed no systematic error (one sample t-test, p > 0.05). The amount of tooth wear and thetooth type did not seem to affect reproducibility. The outcomes of both techniques were consideredhighly reproducible overall and in individual measurements (max difference < 0.040 mm3) (Figure 4).There was no difference in the reproducibility of the gold standard and the technique of choice (p = 0.94).The superimposition error of the gold standard technique that provided the reference measurements isshown in Figure 4a and it was on average less than 0.005 mm3 and in all cases less than 0.020 mm3.
There were significant differences in the trueness of the tested techniques (Friedman test: p < 0.001).PC(A) and PC(B) differed clearly from all other techniques. Among the rest, all techniques differedsignificantly to each other apart from CC(A) vs. PC(D), CC(B) vs. PC(C), CC(B) vs. CC(C), and CC(C) vs.PC(C) (Wilcoxon signed rank test: p < 0.01; Figure 5). Analogous differences in precision were evidentamong all techniques (Figure 5). The CC(C) technique was the only technique that showed perfectagreement with the GS technique in all cases (median difference: −0.002, max absolute difference:0.178 mm3) and is applicable in actual clinical conditions.
Tooth type did not affect the trueness of each technique (Mann–Whitney U test, p > 0.05).However, measurements in canines tended to be more precise compared to those of incisors(Figure 6a). Tooth alignment in the dental arches also did not affect the outcomes of any technique(Mann–Whitney U test: p > 0.05). Tooth wear amount did not show any significant effects(Kruskal–Wallis test, p > 0.01), though there was a tendency for slightly reduced trueness andprecision in the group with the highest amount of tooth wear (Figure 6b).

J. Clin. Med. 2020, 9, 3937 7 of 13
The difference between the CC(C) technique of choice and the GS technique was always smallfor any tested tooth type or amount of tooth wear (Supplementary Materials Figure S1). However,there was a tendency for decreased precision in case of 2 mm vertical height loss of tooth structure(Kruskal–Wallis test, p = 0.029). Pairwise comparisons showed a significant difference only betweenthe 0.5 mm and the 2 mm groups (Mann–Whitney U test, p < 0.01).
J. Clin. Med. 2020, 9, x FOR PEER REVIEW 7 of 13
The difference between the CC(C) technique of choice and the GS technique was always small for any tested tooth type or amount of tooth wear (Supplementary Materials Figure S1). However, there was a tendency for decreased precision in case of 2 mm vertical height loss of tooth structure (Kruskal–Wallis test, p = 0.029). Pairwise comparisons showed a significant difference only between the 0.5 mm and the 2 mm groups (Mann–Whitney U test, p < 0.01).
Figure 4. Bland–Altman plots showing intra-operator error on tooth wear volume measurements. (a) Gold standard (GS) technique. (b) Technique of choice: complete crown (CC) with 20% estimated overlap. The axes length represents the true range of measured tooth wear values. The continuous horizontal line shows the mean and the dashed lines the 95% confidence intervals.
Figure 5. Box plots showing in the Y-axis the difference of each technique with the gold standard technique in tooth wear measurements. The upper limit of the black line represents the maximum value, the lower limit the minimum value, the box the interquartile range, and the horizontal black line the median value (trueness). Outliers are shown as black circles (°) or asterisks (*), in more extreme cases, with a step of 1.5 × IQR (interquartile range). Zero value (dashed horizontal line) indicates perfect agreement with the gold standard. The vertical length of each plot indicates precision. The blue box on the left image indicates the area of the graph shown in the right image in a larger scale. PC: partial crown; CC: complete crown.
Figure 4. Bland–Altman plots showing intra-operator error on tooth wear volume measurements.(a) Gold standard (GS) technique. (b) Technique of choice: complete crown (CC) with 20% estimatedoverlap. The axes length represents the true range of measured tooth wear values. The continuoushorizontal line shows the mean and the dashed lines the 95% confidence intervals.
J. Clin. Med. 2020, 9, x FOR PEER REVIEW 7 of 13
The difference between the CC(C) technique of choice and the GS technique was always small for any tested tooth type or amount of tooth wear (Supplementary Materials Figure S1). However, there was a tendency for decreased precision in case of 2 mm vertical height loss of tooth structure (Kruskal–Wallis test, p = 0.029). Pairwise comparisons showed a significant difference only between the 0.5 mm and the 2 mm groups (Mann–Whitney U test, p < 0.01).
Figure 4. Bland–Altman plots showing intra-operator error on tooth wear volume measurements. (a) Gold standard (GS) technique. (b) Technique of choice: complete crown (CC) with 20% estimated overlap. The axes length represents the true range of measured tooth wear values. The continuous horizontal line shows the mean and the dashed lines the 95% confidence intervals.
Figure 5. Box plots showing in the Y-axis the difference of each technique with the gold standard technique in tooth wear measurements. The upper limit of the black line represents the maximum value, the lower limit the minimum value, the box the interquartile range, and the horizontal black line the median value (trueness). Outliers are shown as black circles (°) or asterisks (*), in more extreme cases, with a step of 1.5 × IQR (interquartile range). Zero value (dashed horizontal line) indicates perfect agreement with the gold standard. The vertical length of each plot indicates precision. The blue box on the left image indicates the area of the graph shown in the right image in a larger scale. PC: partial crown; CC: complete crown.
Figure 5. Box plots showing in the Y-axis the difference of each technique with the gold standardtechnique in tooth wear measurements. The upper limit of the black line represents the maximumvalue, the lower limit the minimum value, the box the interquartile range, and the horizontal blackline the median value (trueness). Outliers are shown as black circles (◦) or asterisks (*), in moreextreme cases, with a step of 1.5 × IQR (interquartile range). Zero value (dashed horizontal line)indicates perfect agreement with the gold standard. The vertical length of each plot indicates precision.The blue box on the left image indicates the area of the graph shown in the right image in a larger scale.PC: partial crown; CC: complete crown.

J. Clin. Med. 2020, 9, 3937 8 of 13J. Clin. Med. 2020, 9, x FOR PEER REVIEW 8 of 13
Figure 6. Box plots showing on the Y-axis the difference of each technique from the gold standard technique in tooth wear measurements, (a) by tooth type, and (b) by amount of tooth wear. The upper limit of the black line represents the maximum value, the lower limit the minimum value, the box the interquartile range, and the horizontal black line the median value (trueness). Outliers are shown as black circles or asterisks, in more extreme cases, with a step of 1.5 × IQR (interquartile range). Zero value (dashed horizontal line) indicates perfect agreement with the gold standard. The vertical length of each plot indicates precision. PC: partial crown; CC: complete crown.
4. Discussion
Additional to proper diagnosis, easily applicable methods that facilitate accurate assessment of tooth wear will support the scientific community in better understanding potential causes, acting mechanisms, and contributing factors. Material wear is also very important for materials science when conducting in vitro tests, but also to clinically test the real-life performance of materials [21,22]. Here we present a highly accurate and informative tooth wear assessment method, which is also more convenient than the already available laboratory methods. It allows the measurement and visualization of occlusal tooth wear in three dimensions of space, on patients that received a bonded wire retainer during the assessment period. To our knowledge, this is the first study that addresses this issue. The suggested method requires the existence of two serial dental models to assess wear progress over time. In the era of digitization, this is not considered a limitation, since it is expected that soon an intraoral patient scan will be an integral part of basic dental diagnostic records. Providing that the suggested superimposition method registers sufficiently serial surface models similar to those tested here, it can be used for any relevant purpose, including occlusal material wear testing.
The present method offers the opportunity for detailed assessment of changes over time, in corresponding surfaces, without the need for placing any landmarks, which might be a time-consuming and error prone process [23,24]. Apart from the clinically relevant applications, following the proper superimposition of serial 3D tooth models, which enables the accurate detection of the worn tooth part during a specific time period, this method can be combined with various other types of 3D shape analysis, such as those used for ecometrics in dental ecology [25], including dental topography methods [24]. The method works on a μm scale that is defined by its accuracy, as well as by the resolution of the applied scanning systems. For example, based on scanner resolution of the intraoral, as well as the current dental lab scanners [11], microwear analysis might not be possible, though it might be quite useful for testing certain hypotheses [26].
In a previous study we developed a similar method [10] applicable on teeth that did not undergo significant alterations in any crown surface, apart from the occlusal. Epidemiologic studies indicate that in modern humans, tooth wear, especially of the clinical crown, mainly concerns the occlusal part of the teeth due to the direct contacts with the antagonists [12,13]. Thus, the simulation model
Figure 6. Box plots showing on the Y-axis the difference of each technique from the gold standardtechnique in tooth wear measurements, (a) by tooth type, and (b) by amount of tooth wear. The upperlimit of the black line represents the maximum value, the lower limit the minimum value, the boxthe interquartile range, and the horizontal black line the median value (trueness). Outliers are shownas black circles or asterisks, in more extreme cases, with a step of 1.5 × IQR (interquartile range).Zero value (dashed horizontal line) indicates perfect agreement with the gold standard. The verticallength of each plot indicates precision. PC: partial crown; CC: complete crown.
4. Discussion
Additional to proper diagnosis, easily applicable methods that facilitate accurate assessment oftooth wear will support the scientific community in better understanding potential causes, actingmechanisms, and contributing factors. Material wear is also very important for materials sciencewhen conducting in vitro tests, but also to clinically test the real-life performance of materials [21,22].Here we present a highly accurate and informative tooth wear assessment method, which is also moreconvenient than the already available laboratory methods. It allows the measurement and visualizationof occlusal tooth wear in three dimensions of space, on patients that received a bonded wire retainerduring the assessment period. To our knowledge, this is the first study that addresses this issue.The suggested method requires the existence of two serial dental models to assess wear progress overtime. In the era of digitization, this is not considered a limitation, since it is expected that soon anintraoral patient scan will be an integral part of basic dental diagnostic records. Providing that thesuggested superimposition method registers sufficiently serial surface models similar to those testedhere, it can be used for any relevant purpose, including occlusal material wear testing.
The present method offers the opportunity for detailed assessment of changes over time,in corresponding surfaces, without the need for placing any landmarks, which might be atime-consuming and error prone process [23,24]. Apart from the clinically relevant applications,following the proper superimposition of serial 3D tooth models, which enables the accurate detectionof the worn tooth part during a specific time period, this method can be combined with various othertypes of 3D shape analysis, such as those used for ecometrics in dental ecology [25], including dentaltopography methods [24]. The method works on a µm scale that is defined by its accuracy, as well asby the resolution of the applied scanning systems. For example, based on scanner resolution of theintraoral, as well as the current dental lab scanners [11], microwear analysis might not be possible,though it might be quite useful for testing certain hypotheses [26].
In a previous study we developed a similar method [10] applicable on teeth that did not undergosignificant alterations in any crown surface, apart from the occlusal. Epidemiologic studies indicatethat in modern humans, tooth wear, especially of the clinical crown, mainly concerns the occlusal partof the teeth due to the direct contacts with the antagonists [12,13]. Thus, the simulation model that was

J. Clin. Med. 2020, 9, 3937 9 of 13
previously developed and applied here, represented adequately the most common clinical occurrence.However, certain patients may receive a fixed retainer at their buccal or more often at their lingualsurfaces. This usually consists of a continuous wire bonded with composite resin at the middle ofthe respective tooth surfaces. This type of retainer is common in patients that received orthodontictreatment, but also in severe periodontally compromised patients, or in patients that required toothstabilization following dental trauma [14,16,17]. Thus, we suspected that our previously suggestedmethod might not perform similarly when a fixed retainer has been bonded to the test teeth duringthe assessed period. Indeed, after testing various possibilities for the latter case, we concluded thatthe complete crown with reduced estimated overlap of meshes to 20%, namely the CC(C) technique,provided the most accurate outcomes. The previous study, on intact teeth in non-occlusal surfaces,suggested an estimated overlap of meshes of 30% for optimal outcomes [10].
The present method offers a median accuracy of 0.002 mm3, with the worst individual measurementshowing a difference of 0.178 mm3 from the gold standard measurement. The gold standardmeasurement always showed a precision higher than 0.020 mm3. The scanner plus the superimpositionerror for single teeth measurements, using the suggested technique, was always smaller than 0.035 mm3.Thus, even in the unfavorable scenario of extensive changes in non-occlusal surfaces, this methodperforms quite satisfactorily. A freeware and easy to use software (WearCompare, School of Dentistry,University of Leeds, Leeds, UK) [27] providing tooth wear measurements, following serial toothsurface model superimpositions, showed high performance when identical (duplicated) surfaces wereused as superimposition references. However, when the original position of the duplicated modelswas altered, the software showed errors in volumetric assessment as high as 1 mm3. Furthermore,when actual patient data were considered, it showed considerable and statistically significant differenceson volumetric assessments from Geomagic Control software (3D Systems, Darmstadt, Germany),averaging 0.59 mm3 [27]. This software uses the buccal and lingual surfaces as superimpositionreferences to assess occlusal tooth wear. We also tested this approach both in a previous [10] and in thecurrent study and it did not provide superior outcomes to that of the suggested techniques, which usethe whole crown as superimposition reference. Furthermore, the performance of WearComparesoftware in presence of considerable changes in the used superimposition reference areas remains tobe tested.
The current settings might also be applicable to patients that show extensive tooth wear on buccalor lingual surfaces [12,15]. In such cases, apart from the occlusal surface, another surface is highlyaltered over time, such as with the placement of a retainer. Following the superimposition of serialtooth models, the operator can generate color coded distance maps and confirm the applicability of thesuggested technique, if the detected changes are comparable to those simulated here. For example,in cases of erosion, changes might be present on the entire tooth surface and, thus, the suggestedtechnique might not be applicable. Finally, if the teeth are not subjected to any change between twotime points, the present technique still performs a complete registration of the two surface models(Supplementary Materials Figure S2). However, this will be a rare occasion, since in living humans,minimal changes in form or in spatial relations are always expected over time. Even if there is nomorphological change, two serial intraoral scans will not provide identical models [11].
In actual patients, the gingival margin area, and thus the corresponding clinical crown structures,might also change over time. However, with the present method this is not a limitation, since in case oflarge differences in the gingival part of the crown, the operator can select the shortest clinical crown asthe superimposition reference. Then, by selecting the “exclude overhangs” option, which is includedin the suggested default settings, the software ignores the part of crown that does not exist in bothmodels. The performance of this function has been extensively applied and tested in previous studies,on various types of surface models and has always provided solid outcomes [10,11,18,28–30].
The present study simulated tooth wear amounts of approximately 0.5, 1, and 2 mm to representvariations of clinically significant loss of tooth crown parts, in terms of dental appearance. As evidentin an analogous study [10], the high performance of the technique presented here was not considerably
J. Clin. Med. 2020, 9, 3937 10 of 13
affected by tooth wear amount. Smaller amounts of occlusal tooth wear might be present in actualpatients, but were not simulated here. We considered the tested range more relevant, since theICP algorithm would perform equally well, if not better, in cases of smaller surface changes(Supplementary Materials Figures S1b, S2, and S3) [11,18,28]. Providing adequate superimposition ofserial tooth models under the tested circumstances, the accuracy of the suggested method is defined byits difference from the tooth wear value obtained using the gold standard method. The amount oftooth wear that can be safely detected by the method is determined by the specified accuracy level.However, a potential improvement of the accuracy level in cases of minimal tooth wear remains to beverified by future research.
The high accuracy laboratory scanner used here to generate the surface models, has comparableaccuracy to the current high end intraoral scanners, considering relatively small structures, such assingle tooth crowns [11,18,31]. In the present study, we selected this scanner to eliminate the scannererror effect on the gold standard measurement, which requires a larger superimposition reference area.This measurement is feasible only with the present experimental design, where the structures adjacentto a worn tooth are intact. The true wear amount is measured through the use of these intact structuresas superimposition reference. This measurement is then compared to the measurement obtained usingthe single tooth crown as superimposition reference. Only the latter option is feasible in actual clinicalconditions, where no structure adjacent to single teeth can be considered morphologically stable overtime. This is the main reason why gold standard measurements (true values) cannot be available whenusing actual clinical data.
So far, most methods used to measure tooth wear are based on qualitative assessments withlimited precision or on complex laboratory quantitative approaches that require expertise and specialequipment to be applied [7]. The presented method requires 3D tooth surface models that cannowadays be easily obtained through intraoral scanners [11]. These models can then be processedusing software applications that are widely available under reasonable costs [32]. Thus, following thenecessary short-term training, these methods can be potentially incorporated in a regular dentalpractice environment, enhancing the diagnostic ability of occlusal tooth wear, especially in cases thatthis is considered critical. Apart from this major advantage, the performance of this method is alsocomparable to, if not higher than most available methods [7]. So far, a direct comparison with othermethods is not possible, since no other study has performed quantitative tooth wear assessment in teeththat underwent significant changes in surfaces other than the one tested. Among others, a significantstrength of the present in vitro study is that it allowed the comparison of different techniques with agold standard technique, which provided the true measurement. Thus, apart from reproducibility,the study tested the trueness of the measurements, which is usually a missing part from previousreports [7]. Furthermore, the present method is superior to methods that perform 2D measurements,such as the vertical loss of tooth structure, since it offers much higher amount of 3D information.In addition to the quantification of tooth volume loss, this 3D superimposition technique enablesthe visualization of a color coded distance map that allows a thorough quantitative and qualitativeassessment of tooth wear in the 3D space. Thus, following the proper application of the suggestedtechnique, patterns of tooth wear or any spatial differences in the tooth surfaces, can be easily identifiedand quantified according to the needs of each individual test.
Our research group has worked extensively in testing surface-based 3D superimposition in thecraniofacial area, showing promising results in many different applications [10,11,18,28–30,33]. In theaforementioned studies, the performance of the used software and the specific algorithm has beenthoroughly tested and shown highly reproducible results. Thus, the high reproducibility of the presenttechniques was an expected finding. Furthermore, the technique of choice consistently provided valuesvery close to the true amount of tooth wear. The individual differences of the selected CC(C) techniquefrom the true value were almost always smaller than 0.1 mm3. This accuracy level is comparable to thatachieved on teeth that underwent changes only at their occlusal surfaces [10]. However, the current

J. Clin. Med. 2020, 9, 3937 11 of 13
approach consists a clinically applicable technique in a more challenging scenario, where the usedtooth surfaces have been considerably changed over time.
In diagnostic accuracy studies, it is of utmost importance to assess differences between techniquesor repeated measurements in each individual case and not only between group means [34]. In the latter,positive and negative differences between diverse cases can be eliminated providing the misleadingimpression of similar outcomes. However, it is important to have accurate measurements in eachindividual case, since, for example, this information might affect treatment decisions. Indeed, in thepresent study the mean values of all techniques were very close to each other and to the true value.However, when results of individual cases were considered, the superiority of the selected CC(C)technique became evident.
A limitation of the present study could be that only anterior teeth were thoroughly tested.This approach was followed because these teeth usually require a fixed retainer [14,16,17]. Furthermore,we also included canines in our tests, which are more round-formed teeth. Along with the presentresults, previous results have also shown that tooth type does not considerably affect the outcomes [10].Thus, we expect that this technique will be also applicable on posterior teeth (Supplementary MaterialsFigure S3). Another limitation could be that intra-operator error was only assessed for the gold standardand the technique of choice. This was considered adequate since the two techniques showed satisfactoryagreement and both provided excellent reproducibility outcomes. Furthermore, as described above,thorough error evaluation of similar techniques has been published previously and always providedfavorable outcomes [10].
5. Conclusions
The present report suggests a 3D superimposition technique to assess occlusal tooth wear inanterior teeth that received a bonded wire retainer during the assessment period. Following thesuperimposition of serial tooth crown models, loss of tooth structure can be visualized and quantifiedin all dimensions of space. The technique is highly accurate, informative, and relatively easy touse, and thus, it will facilitate associated research, but it can also be easily incorporated in a clinicalenvironment. Further work is required to verify the performance of the technique on posterior teethand regarding smaller increments of tooth wear.
Supplementary Materials: The following are available online at http://www.mdpi.com/2077-0383/9/12/3937/s1,Figure S1: Box plots showing in the Y-axis the difference of the technique of choice (complete crown, setting C)from the gold standard technique in tooth wear measurements (a) by tooth type and (b) by amount of tooth wear,Figure S2: Superimposition of identical surface models of a maxillary incisor (left) and a mandibular canine (right).Figure S3: Tooth wear measurement in a mandibular molar with limited loss of tooth structure.
Author Contributions: Conceptualization, N.G.; methodology, N.G., K.D., C.K., D.H. and Y.R.; software, D.H.;validation, N.G. and K.D.; formal analysis, N.G.; investigation, N.G. and K.D.; resources, N.G., K.D., C.K., D.H.,Y.R.; data curation, N.G. and K.D.; writing—original draft preparation, N.G. and K.D.; writing—review and editing,N.G., K.D., C.K., D.H., Y.R.; visualization, N.G. and K.D.; supervision, C.K., D.H. and Y.R.; project administration,N.G.; funding acquisition, N.G. All authors have read and agreed to the published version of the manuscript.
Funding: This research was funded by a grant from the European Orthodontic Society, in the context of the W J BHouston Scholarship Award that was granted to author N. Gkantidis.
Conflicts of Interest: D. Halazonetis owns stock in dHAL Software, the company that markets Viewbox 4.Authors N. Gkantidis, K. Dritsas, Y. Ren, and C. Katsaros declare no competing interest. The funders had no rolein the design of the study; in the collection, analyses, or interpretation of data; in the writing of the manuscript,or in the decision to publish the results.
References
1. Lussi, A.; Carvalho, T.S. Erosive tooth wear: A multifactorial condition of growing concern and increasingknowledge. Monogr. Oral Sci. 2014, 25, 1–15. [PubMed]
2. Loomans, B.; Opdam, N.; Attin, T.; Bartlett, D.; Edelhoff, D.; Frankenberger, R.; Benic, G.; Ramseyer, S.;Wetselaar, P.; Sterenborg, B.; et al. Severe tooth wear: European consensus statement on managementguidelines. J. Adhes. Dent. 2017, 19, 111–119. [PubMed]

J. Clin. Med. 2020, 9, 3937 12 of 13
3. Lee, A.; He, L.H.; Lyons, K.; Swain, M.V. Tooth wear and wear investigations in dentistry. J. Oral Rehabil.2012, 39, 217–225. [CrossRef] [PubMed]
4. Wetselaar, P.; Faris, A.; Lobbezoo, F. A plea for the development of an universally accepted modular toothwear evaluation system. BMC Oral Health 2016, 16, 115. [CrossRef]
5. Al-Omiri, M.K.; Sghaireen, M.G.; Alzarea, B.K.; Lynch, E. Quantification of incisal tooth wear in upperanterior teeth: Conventional vs. new method using toolmakers microscope and a three-dimensionalmeasuring technique. J. Dent. 2013, 41, 1214–1221. [CrossRef]
6. Bartlett, D.; Ganss, C.; Lussi, A. Basic Erosive Wear Examination (BEWE): A new scoring system for scientificand clinical needs. Clin. Oral Investig. 2008, 12, S65–S68. [CrossRef]
7. Wulfman, C.; Koenig, V.; Mainjot, A.K. Wear measurement of dental tissues and materials in clinical studies:A systematic review. Dent. Mater. 2018, 34, 825–850. [CrossRef]
8. Heintze, S.D. How to qualify and validate wear simulation devices and methods. Dent. Mater. 2006, 22,712–734. [CrossRef]
9. Rodriguez, J.M.; Bartlett, D.W. The dimensional stability of impression materials and its effect on in vitrotooth wear studies. Dent. Mater. 2011, 27, 253–258. [CrossRef]
10. Gkantidis, N.; Dritsas, K.; Ren, Y.; Halazonetis, D.; Katsaros, C. An accurate and efficient method for occlusaltooth wear assessment using 3D digital dental models. Sci. Rep. 2020, 10, 10103. [CrossRef]
11. Winkler, J.; Gkantidis, N. Trueness and precision of intraoral scanners in the maxillary dental arch: An in vivoanalysis. Sci. Rep. 2020, 10, 1172. [CrossRef]
12. Teixeira, L.; Manso, M.C.; Manarte-Monteiro, P. Erosive tooth wear status of institutionalized alcoholicpatients under rehabilitation therapy in the north of Portugal. Clin. Oral Investig. 2017, 21, 809–819.[CrossRef] [PubMed]
13. Awad, M.A.; El Kassas, D.; Al Harthi, L.; Abraham, S.B.; Al-Khalifa, K.S.; Khalaf, M.E.; Al Habashneh, R.;Bartlett, D. Prevalence, severity and explanatory factors of tooth wear in Arab populations. J. Dent. 2019, 80,69–74. [CrossRef] [PubMed]
14. Iliadi, A.; Kloukos, D.; Gkantidis, N.; Katsaros, C.; Pandis, N. Failure of fixed orthodontic retainers:A systematic review. J. Dent. 2015, 43, 876–896. [CrossRef] [PubMed]
15. Bartlett, D.W.; Lussi, A.; West, N.X.; Bouchard, P.; Sanz, M.; Bourgeois, D. Prevalence of tooth wear onbuccal and lingual surfaces and possible risk factors in young European adults. J. Dent. 2013, 41, 1007–1013.[CrossRef] [PubMed]
16. Gkantidis, N.; Christou, P.; Topouzelis, N. The orthodontic-periodontic interrelationship in integratedtreatment challenges: A systematic review. J. Oral Rehabil. 2010, 37, 377–390. [CrossRef]
17. Kahler, B.; Hu, J.Y.; Marriot-Smith, C.S.; Heithersay, G.S. Splinting of teeth following trauma: A review and anew splinting recommendation. Aust. Dent. J. 2016, 61 (Suppl. 1), 59–73. [CrossRef]
18. Henninger, E.; Vasilakos, G.; Halazonetis, D.; Gkantidis, N. The effect of regular dental cast artifacts on the3D superimposition of serial digital maxillary dental models. Sci. Rep. 2019, 9, 10501. [CrossRef]
19. Besl, P.J.; Mckay, N.D. A Method for Registration of 3-D Shapes. IEEE Trans. Pattern Anal. Mach. Intell. 1992,14, 239–256. [CrossRef]
20. Cignoni, P.; Callieri, M.; Corsini, M.; Dellepiane, M.; Ganovelli, F.; Ranzuglia, G. MeshLab: An Open-SourceMesh Processing Tool. In Proceedings of the Sixth Eurographics Italian Chapter Conference, Salerno, Italy,2 July 2008; pp. 129–136.
21. Lazaridou, D.; Belli, R.; Petschelt, A.; Lohbauer, U. Are resin composites suitable replacements for amalgam?A study of two-body wear. Clin. Oral Investig. 2015, 19, 1485–1492. [CrossRef]
22. Lohbauer, U.; Reich, S. Antagonist wear of monolithic zirconia crowns after 2 years. Clin. Oral Investig. 2017,21, 1165–1172. [CrossRef] [PubMed]
23. Gkantidis, N.; Schauseil, M.; Pazera, P.; Zorkun, B.; Katsaros, C.; Ludwig, B. Evaluation of 3-dimensionalsuperimposition techniques on various skeletal structures of the head using surface models. PLoS ONE 2015,10, e0118810. [CrossRef] [PubMed]
24. Berthaume, M.A.; Lazzari, V.; Guy, F. The landscape of tooth shape: Over 20 years of dental topography inprimates. Evol. Anthropol. 2020, 29, 245–262. [CrossRef] [PubMed]
25. Evans, A.R. Shape descriptors as ecometrics in dental ecology. Hystrix It. J. Mamm. 2013, 24, 133–140.26. Schmidt, C.W. On the relationship of dental microwear to dental macrowear. Am. J. Phys. Anthr. 2010, 142,
67–73. [CrossRef] [PubMed]
J. Clin. Med. 2020, 9, 3937 13 of 13
27. O′Toole, S.; Osnes, C.; Bartlett, D.; Keeling, A. Investigation into the validity of WearCompare, a purpose-builtsoftware to quantify erosive tooth wear progression. Dent. Mater. 2019, 35, 1408–1414. [CrossRef] [PubMed]
28. Vasilakos, G.; Schilling, R.; Halazonetis, D.; Gkantidis, N. Assessment of different techniques for 3Dsuperimposition of serial digital maxillary dental casts on palatal structures. Sci. Rep. 2017, 7, 5838.[CrossRef]
29. Haner, S.T.; Kanavakis, G.; Matthey, F.; Gkantidis, N. Voxel-based superimposition of serial craniofacialCBCTs: Reliability, reproducibility and segmentation effect on hard-tissue outcomes. Orthod. Craniofac Res.2020, 23, 92–101. [CrossRef]
30. Friedli, L.; Kloukos, D.; Kanavakis, G.; Halazonetis, D.; Gkantidis, N. The effect of threshold level on bonesegmentation of cranial base structures from CT and CBCT images. Sci. Rep. 2020, 10, 7361. [CrossRef]
31. Nedelcu, R.; Olsson, P.; Nyström, I.; Thor, A. Finish line distinctness and accuracy in 7 intraoral scannersversus conventional impression: An in vitro descriptive comparison. BMC Oral Health 2018, 18, 27. [CrossRef]
32. Stucki, S.; Gkantidis, N. Assessment of techniques used for superimposition of maxillary and mandibular3D surface models to evaluate tooth movement: A systematic review. Eur. J. Orthod. 2020, 42, 559–570.[CrossRef] [PubMed]
33. Vasilakos, G.; Koniaris, A.; Wolf, M.; Halazonetis, D.; Gkantidis, N. Early anterior crossbite correction throughposterior bite opening: A 3D superimposition prospective cohort study. Eur. J. Orthod. 2018, 40, 364–371.[CrossRef] [PubMed]
34. Bland, J.M.; Altman, D.G. Comparing methods of measurement: Why plotting difference against standardmethod is misleading. Lancet 1995, 346, 1085–1087. [CrossRef]
Publisher’s Note: MDPI stays neutral with regard to jurisdictional claims in published maps and institutionalaffiliations.
© 2020 by the authors. Licensee MDPI, Basel, Switzerland. This article is an open accessarticle distributed under the terms and conditions of the Creative Commons Attribution(CC BY) license (http://creativecommons.org/licenses/by/4.0/).