3d genome organization and transcriptional regulation in
TRANSCRIPT
University of ConnecticutOpenCommons@UConn
Doctoral Dissertations University of Connecticut Graduate School
2-1-2019
3D Genome Organization and TranscriptionalRegulation in Mammalian CellsEmaly PiecuchUniversity of Connecticut - Storrs, [email protected]
Follow this and additional works at: https://opencommons.uconn.edu/dissertations
Recommended CitationPiecuch, Emaly, "3D Genome Organization and Transcriptional Regulation in Mammalian Cells" (2019). Doctoral Dissertations. 2054.https://opencommons.uconn.edu/dissertations/2054
3D Genome Organization and Transcriptional Regulation in Mammalian Cells
Emaly Josephine Piecuch, PhD
University of Connecticut, 2019
Abstract
Remarkably, cell types sharing the same linear genome sequence express different genes
and have distinct functions. 3D genomic arrangement has been demonstrated to play a
critical role in this process. Fine scale organization of genes and regulatory elements
within active and inactive domains underlie gene expression and disruption of this
process has been shown to influence development and disease. Yet, the precise dynamics
of cell type specific 3D genomic interactions mediating mammalian gene expression,
such as those between enhancers and promoters, remain lacking on a genome wide level.
Neurons represent a specialized cell type known to respond to a myriad of physiological
stimuli by changes in transcription of activity dependent (AD) genes. Neuron specific
enhancer activation has been identified genome wide in mouse neurons during AD gene
transcription, yet we lack genome wide 3D connectivity information allowing assignment
of AD enhancer gene targets. Many questions about chromatin structure and how 3D
structural changes influence cell type specificity and function through changes in gene
expression remain unanswered due to technological limitations and the nature of
biological samples required. This thesis specifically addresses such limitations focusing
on application to mammalian genomes.
3D Genome Organization and Transcriptional Regulation in Mammalian Cells
Emaly Josephine Piecuch
B.S., Purdue University, 2012
M.S., University of Connecticut, 2015
A Dissertation
Submitted in Partial Fulfillment of the
Requirements for the Degree of
Doctor of Philosophy
at the
University of Connecticut
2019
i

Copyright by
Emaly Josephine Piecuch
2019
ii
APPROVAL PAGE
Doctor of Philosophy Dissertation
3D Genome Organization and Transcriptional Regulation in Mammalian Cells
Presented by
Emaly Josephine Piecuch, B.S, M.S.
Major Advisor ____________________________________________________
Yijun Ruan
Associate Advisor ____________________________________________________
Stormy Chamberlain
Associate Advisor ____________________________________________________
Blanka Rogina
Associate Advisor ____________________________________________________
Zhengqing Ouyang
University of Connecticut
2019
iii

ACKNOWLEDGEMENTS
I would like to acknowledge my family and friends, especially my parents who have
always encouraged me to learn.
I would like to acknowledge the continued support and encouragement to think creatively
from Yijun. I would like to thank all current and previous members of the lab for their
dedication, patience, and camaraderie.
I would like to acknowledge the UCONN Health Center Biomedical Science Ph.D.
Program and the Department of Genetics and Genomics for support, and especially the
members of my committee for their time and thoughtful input.
iv
3D Genome Organization and Transcriptional Regulation in Mammalian Cells
Emaly Josephine Piecuch, PhD
_____________________________________________________________________
TABLE OF CONTENTS
Abstract
Title Page i
Copyright Page ii
Approval Page iii
Acknowledgements iv
Introduction 1
Chapter I: Transcriptional Regulation and 3D Connectivity in Mouse Cortical Neurons
Results
Modeling Activity Dependent Gene Transcription in Mammalian Neurons 6
ChIA-PET Library Generation and Quality Assessment 8
RNAPII ChIA-PET Anchor Classification 10
Determination of Enhancer Connectivity and Gene Target Refinement 12
Novel Loci Display Activity Associated Genomic Connectivity 16
Methods and Techniques 18
Discussion 24
v

Chapter II: 3D Genome Technology Development
Results
Development of Long-Read ChIA-PET 25
Overview of Long Read ChIA-PET Protocol 25
Quality Control Profiles in the LR ChIA-PET Protocol 28
Development of ChIA-SMS 30
Single Molecule Sequencing of Chromatin Complexes 35
Methods and Techniques 39
Discussion 69
Appendices 72
References 88
vi

1
Introduction
3D Genomic Organization Underlies Regulated Mammalian Gene Expression
Remarkably, cell types sharing the same linear genome sequence express different genes and
have distinct functions. The 3D arrangement of genomic DNA has been demonstrated to play a
critical role in this cell type specificity (Bonev & Cavalli, Nat.Rev.Genet. 2016; Ji et al., Cell
Stem Cell 2016; Bonev et al., Cell 2017).
Evidence currently suggests that within the cell nucleus, the mammalian genome is
partitioned into relatively large structured compartments referred to as topologically associated
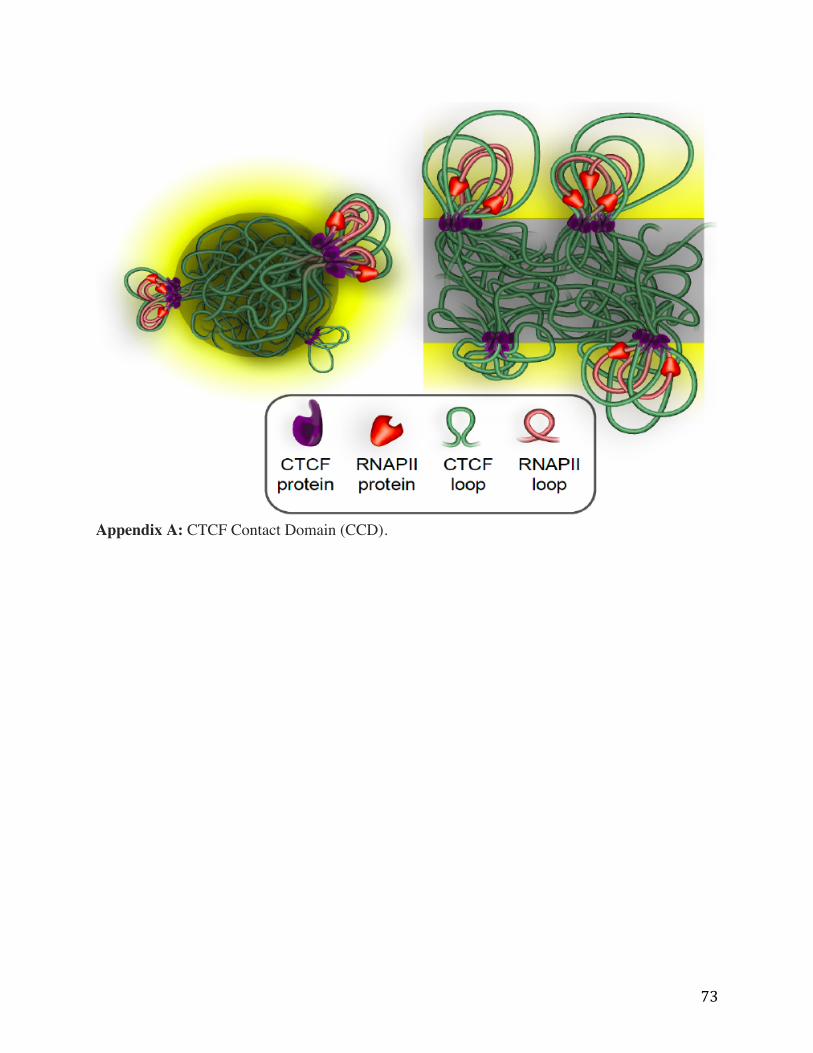
domains (TADs), CTCF Contact Domains (Appendix A), or genomic neighborhoods (Dixon et
al., Nature 2012; Li et al., Cell 2012; Sexton et al., Cell 2012; Rao et al., Cell 2014; Fortin &
Hansen, Genome Biol. 2015; Pombo & Dillon, Nat.Rev.Mol.Cell.Biol. 2015; Tang et al., Cell
2015). It appears that fine scale organization of genes and regulatory elements within active and
inactive domains of the 3D genome underlie regulated gene expression and disruption of this
process has been shown to influence development and disease (Peric-Hupkes et al., Mol.Cell.
2010; Nora et al., Bioessays 2013; Dixon et al., Nature 2015; Fraser et al., Mol.Sys.Biol. 2015;
Lupaniez et al., Cell 2015; Hu & Tee, Biosci.Rep. 2017; Norton & Phillps-Cremins, JCB 2017).
Yet, the precise dynamics of cell type specific 3D genomic interactions mediating mammalian
gene expression, such as those between enhancers and promoters, remain lacking on a genome
wide level.
2
Activity Dependent Transcription as a Model of Regulated 3D Genomic Organization
Mammalian neurons represent a specialized cell type known to respond to a wide variety of
physiological stimuli with rapid changes in transcription of a known set of activity dependent
(AD) genes (Greer & Greenburg, Neuron 2008; Flavell & Greenburg, Annu.Rev.Neurosci. 2008).
Experimentally, a variety of stimuli that mimic neuronal activity (such as membrane
depolarization with potassium chloride) have been demonstrated to induce transcription of AD
genes (Greenburg et al., Science 1986). AD gene transcription is driven by a rise in intracellular
calcium levels leading to phosphorylation and activation of key calcium responsive
transcriptions factors.
These calcium responsive transcription factors (such as Creb and Jun) bind to the DNA
of proximal promoter regions, as well as distal regulatory elements to drive expression of AD
genes. The roles of these AD transcription factors have been the subject of intense study and
current evidence supports their essential role in the neuronal functions (Björkblom et al., MCB
2012). Gene expression mediated by Creb has been shown to broadly be essential for in neuronal
development and functions in mouse (Aguado et al., JNeuroSci 2009). Another AD transcription
factor, Npas4, had been studied for its significant role in “activity and memory” (Sun & Lin,
Trends 2016).
Neuronal Plasticity and Regulated Gene Transcription
3
A variety of known changes at the cellular level occur in response to AD gene expression in
neurons including dendritic outgrowth and synaptic maintenance (Lin, Nature 2008). While
many AD genes bind DNA to regulate transcription (Parra-Damas, Science Reports 2017), others
encode proteins that make up cell type specific components of neurons and synaptic components.
Brain Derived Neuronal Growth Factor (Bdnf) transcription is preferentially activated in
response to neuronal activity and thus is induced primarily in neurons (West et al., PNAS 2001)
and is known to be regulated by calcium and MecP2 (Chen et al., Science 2003), which is know
to be important for “contextual fear and learning” in vivo (Johnson et al., Nature Medicine 2017).
During the process of AD gene transcription, cell type specific enhancer activation has been
identified genome wide in mouse neurons using ChIP-seq targeting histone marking and
transcription factors (Kim et al., Nature 2010; Malik et al., Nat. Neurosci. 2014; Su et al., Nat.
Neurosci. 2017). Further, additional changes in chromatin structure have been shown to be
associated with transcription of AD genes in neurons (Martinowich et al., Science 2003; Walczak
et al., J.Neurosci. 2013; Su et al., Nat.Neurosci. 2017; Watson & Tsai, Curr.Opin.Neurobiol.
2017). Generally, it is known that dysregulation of chromatin structure is linked to a variety of
neurological abnormalities in vivo (Greer & Greenberg, Neuron 2008; Ito et al., Nat.Commun.
2014; Sams et al., Cell.Rep. 2016; Yang et al., Science 2016; Kim et al., J.Neurosci. 2018;
Spiegel et al., Cell 2014; Benito & Barco, Mol.Neurobiol. 2015; Scandagila 2017 Cell Reports).
Although various lines of evidence have consistently indicated the dynamics of cell type specific
enhancer usage during AD gene expression in neurons, they lack genome wide 3D connectivity
information allowing assignment of AD enhancer targets.

4
Currently, 3D genomic connectivity data is publicly available for a wide variety of cell
lines representing range of cell types from the mouse ENCODE project. However this data has
been mostly collected from immortalized cell cultures and tissues. Very few 3D genome
connectivity studies in mammals have focused on the neuronal lineage itself, and none of these
have focused on the dynamics of cell type specific changes occurring during AD gene
transcription. There is currently no 3D genome wide connectivity data focused on the dynamics
of mammalian neurons during depolarization.
Technology Development in the Field of 3D Genomics
The vast majority of 3D genome wide connectivity assays developed have relied on the analysis
of millions of cells in a bulk lysate (Lieberman-Aiden et al., Science 2009; Fullwood et al.,
Nature 2009). Although this approach has yielded genome wide connectivity patterns of many
cell types, studies of many important sample types and of fine scale mechanistic questions have
remained understudied.
Recent incremental improvement of methods including long read ChIA-PET (Li et al.,
Nat. Protoc. 2017) that aim to increase the mapping efficiency of sequenced PETs generated
from a library. Other approaches have focused on decreasing the experimental noise associated
with the random nature of proximity ligation based techniques (Rao et al., Cell 2014; Stevens et
al., Nature 2017). Yet, there are still no genome wide approaches to ask questions concerning
fine scale chromatin interaction dynamics within individual chromatin complexes (such as at the
transcriptionally relevant promoter/gene level, depicted in Appendix B). With this in mind,
5
development of novel single cell and/or single molecule techniques to determine the underlying
individual structures contributing to bulk cell experimental and data analysis are needed. Despite
significant recent advances in the field of 3D genomics, questions remain concerning the details
of chromatin structure and how dynamic 3D structural changes influence cell type specificity and
behaviors through changes in gene expression. Such questions remain open due to technological
limitations and the nature of biological samples required. This thesis specifically addresses such
limitations, focusing on application to mammalian genomes.
Chapter I: Transcriptional Regulation and 3D Connectivity in Mouse Cortical Neurons
Previous genome-wide chromatin immunoprecipitation (ChIP-seq) experiments in models of
depolarization using mouse cortical neuron cell culture have revealed changes in the occupancy
of transcription factors, histone marks, and DNA methylation at promoters of activity dependent
genes and consistently identified AD non-coding regulatory loci (Kim et al., Nature 2010, Malik
et al., Nat.Neurosci. 2014, Rhee et al., Neuron 2016). Additionally, genome-wide ChIP-seq
(Shen et al., Nature 2012; Nord et al., Cell 2013; Yue et al., Nature 2014), ATAC-seq (Su et al.,
Nat.Neurosci. 2017) and DNase HSS (Wilken et al., Epigenetics Chromatin 2015) studies have
been performed in mouse brain and tissues. These and other in vivo studies have importantly
validated the biological accuracy of the in vitro mouse cortical neuron cell culture model.
While published studies have focused on the 3D genome changes that take place during
differentiation of the neuronal lineage in vitro (Ji et al., Cell Stem Cell 2016; Bonev el al. Cell
2017), there are currently no 3D genome wide connectivity studies focused on the dynamics of

6
the mammalian neuron cell during the physiologically relevant event of depolarization. Here, we
have comprehensively captured RNAPII-mediated chromatin structural changes that occur
during this essential process, and analyze the genome-wide connectivity of AD enhancers and
their gene targets.
Results
Modeling Activity Dependent Gene Transcription in Mammalian Neurons
In order to fully understand the activity dependent gene regulatory connectome, we first
generated RNA-seq libraries before and after depolarization of in vitro cortical mouse neuron
cell cultures. We conducted differential gene expression analysis and were able to detect
significantly differentially (p<0.05) expressed genes, including known activity dependent marker
genes fos and bdnf.
7
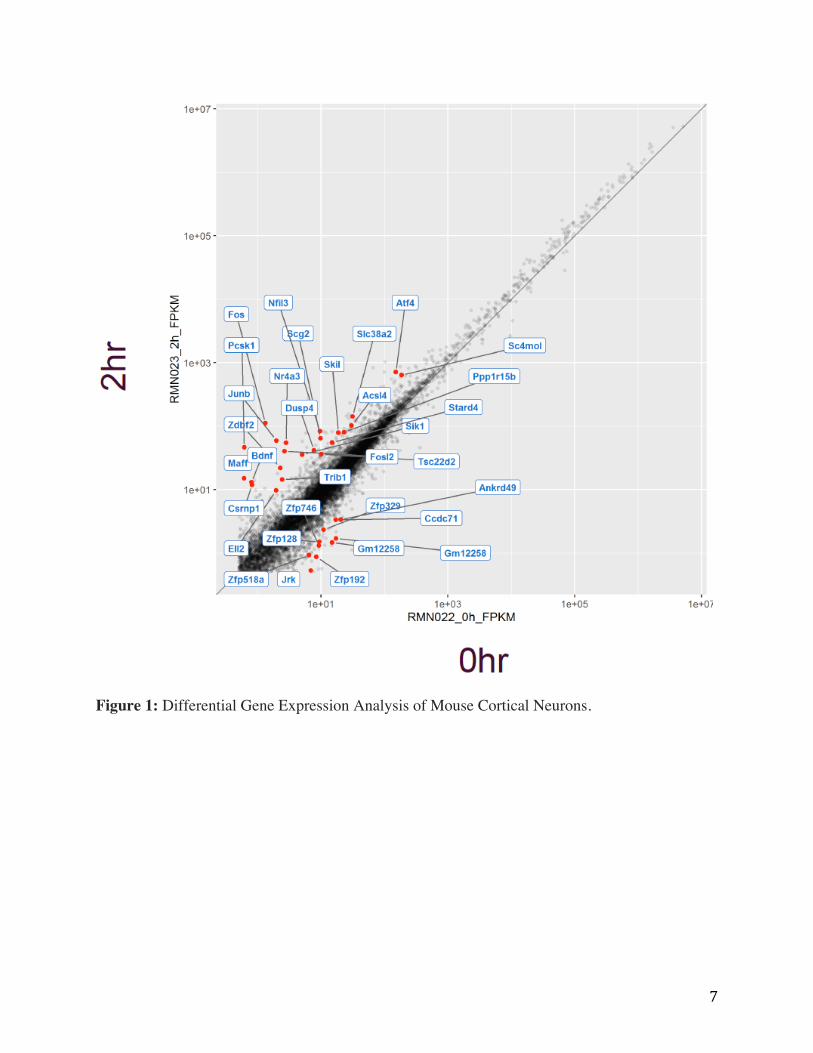
Figure 1: Differential Gene Expression Analysis of Mouse Cortical Neurons.

8
Figure 1 shows the scatter plot for showing RNAseq data and the differential expression
analysis of genes before and after depolarization in mouse cortical neuron cell cultures. On the x-
axis, gene expression values for the no treatment control condition are shown. With the y-axis
representing the gene expression values for the 2 hr KCl treated condition. Each dot represents
the expression of a gene under both conditions. Differentially expressed genes of interest are
highlighted in red and labeled. Satisfied that our in vitro conditions could faithfully recapitulate
depolarization-mediated AD gene expression, we wanted to determine the genome wide
connectivity changes occurring during depolarization in cortical neuron cultures.
ChIA-PET Library Generation and Quality Assessment
To map functionally interacting genomic loci associated with activity dependent transcription,
we conducted Chromatin Interaction Analysis by Paired End Tag Sequencing (ChIA-PET)
targeting RNA Polymerase II (RNAPII) in cortical mouse neuron cultures before and after
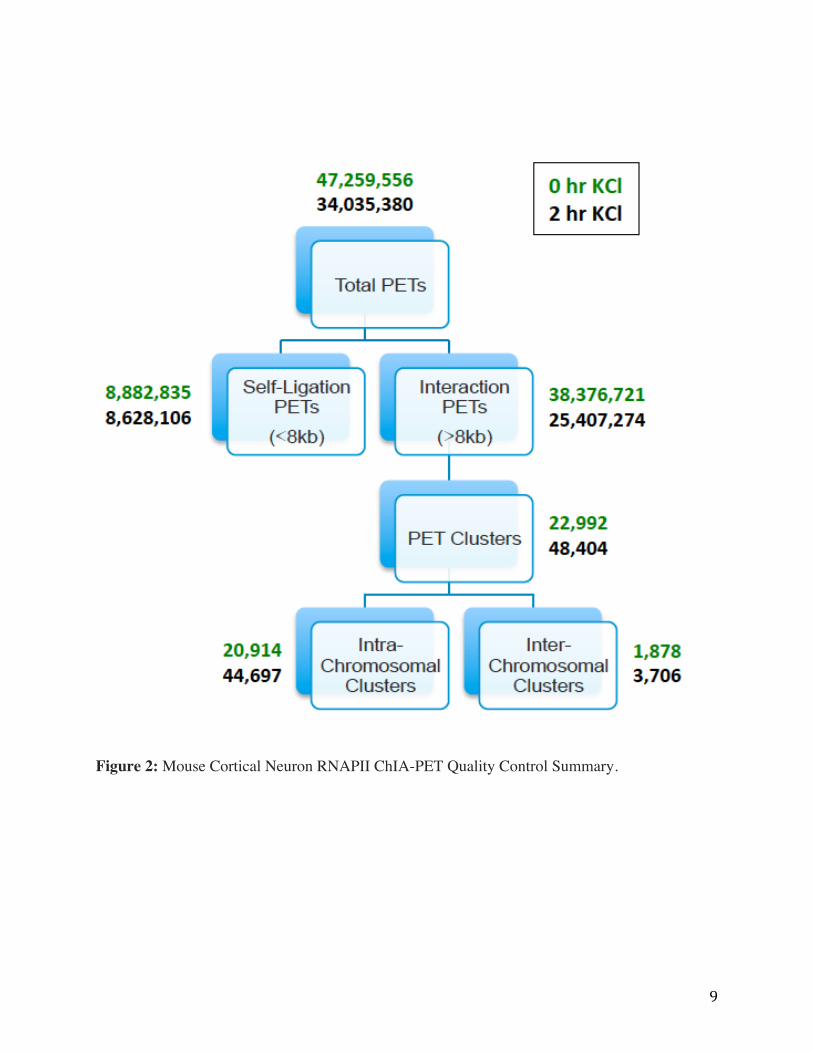
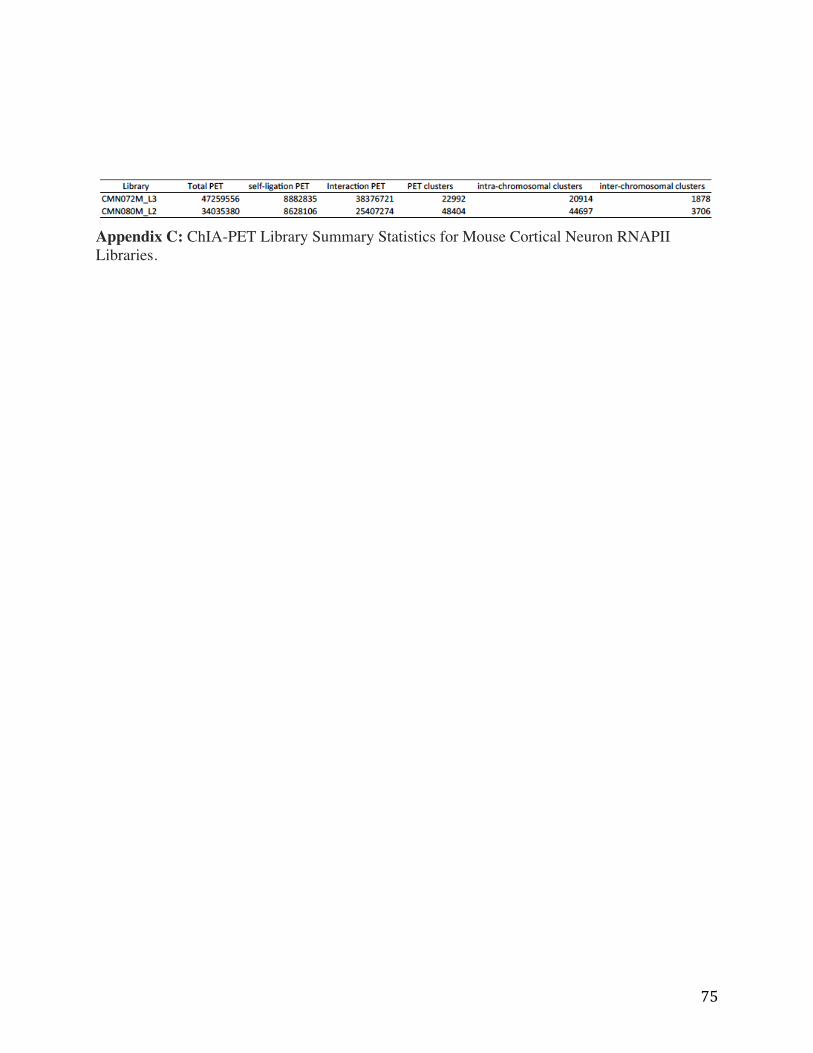
depolarization. In total, we identified 47,259,556 and 34,035,380 Paired End Tag Reads (PETs)
in the 0 hour and 2 hour KCl depolarized neuronal cultures, respectively (Appendix C).
9
Figure 2: Mouse Cortical Neuron RNAPII ChIA-PET Quality Control Summary.

10
Figure 2 shows the pipeline processing steps of total PETs using ChIA-PET tool led to
the generation of 22,992 and 48,404 PET clusters, of which, 20,914 and 44,697 were intra-
chromosomal, respectively. Comparison of the total numbers of sequence reads generated from
the neuronal ChIA-PET libraries before and after depolarization were indeed similar, indicating
no major differences in experimental variation, for example in ChIP efficiency or proximity
ligation.
RNAPII ChIA-PET Anchor Classification
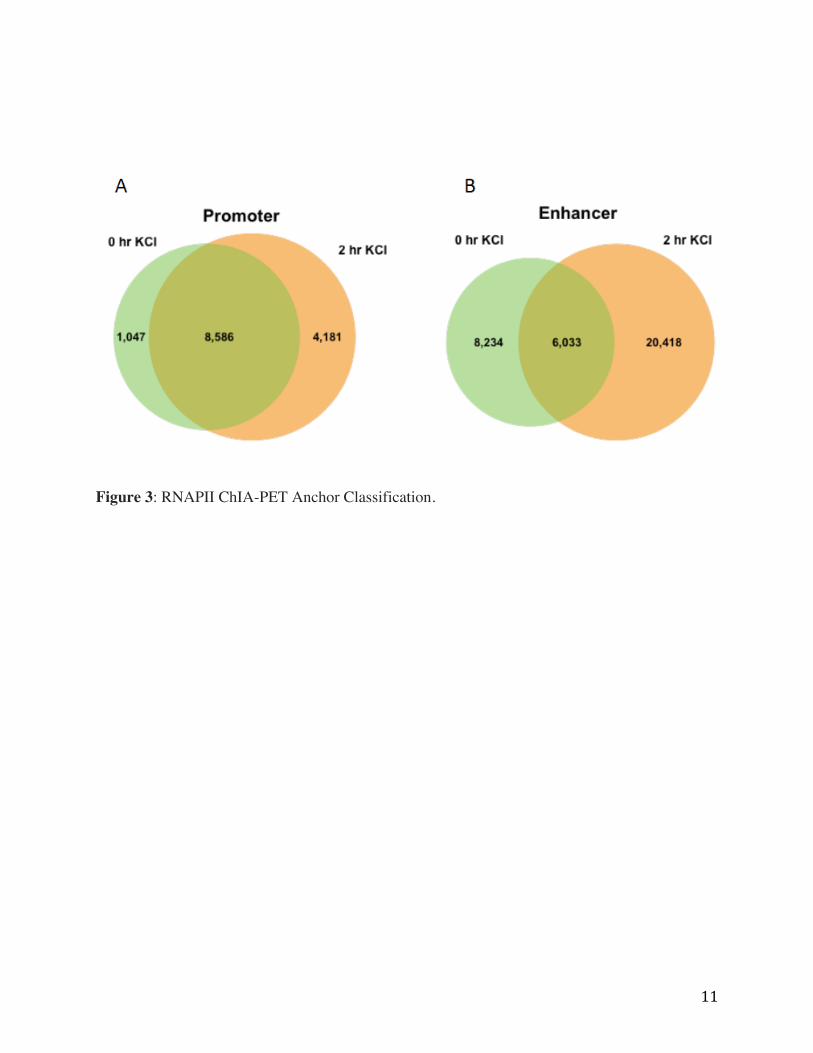
Using filtered PET clusters, RNAPII ChIA-PET anchors were detected genome wide. In total
23,900 and 37,053 RNAPII ChIA-PET anchors were identified in the control and treatment
conditions, respectively. Briefly, anchors were categorized as promoters based on genomic
annotation, requiring anchors to fall within +/-1kb of annotated TSS. We detected a similar
number of promoter anchors before and after KCl treatment, 9,633 and 10,401, respectively
(Figure 3A). Next, we classified all other RNAPII ChIA-PET anchors as putative neuron
specific enhancers, resulting in 14,267 and 26,652 before and after depolarization (Figure 3B).
11
Figure 3: RNAPII ChIA-PET Anchor Classification.

12
While most promoter anchors are common between conditions, we observed a substantial
increase in the number of unique putative neuron specific enhancer anchors induced in the 2 hour
KCl treatment, and we wanted to further investigated if these induced anchors could be
underlying AD regulatory elements such as enhancers. To validate the specificity of our RNAPII
ChIA-PET libraries, we compared our mouse cortical neuron RNAPII ChIA-PET data to
published studies in mouse cortical cell culture and tissues (mouse ENCODE: LINK). Indeed,
we found that RNAPII ChIA-PET defined anchors defined in our study overlapped with RNAPII
ChIP-seq peaks from adult mouse cortical tissue. Importantly, putative enhancers defined by
mouse cortical RNAPII ChIA-PET analysis significantly overlap with previously identified
activity dependent enhancers found in AD mouse cortical neuron cell cultures.
Determination of Enhancer Connectivity and Gene Target Refinement
We next investigated the extensive RNAPII mediated interactions in genomic loci containing
genes known to be crucial for neuronal cell identity and activity dependent gene expression, such
as FOS, BDNF and NPAS4 by comparing RNAPII mediated genomic connectivity before and
after 2 hr KCl treatment. Figure 4 shows the Fos genomic locus browser screenshot. In gold, the
peaks and loops derived from RNAPII ChIA-PET 0 hr KCl treatment condition is shown. In
black, the peaks and loops derived from the 2 hr treatment condition are shown. Along the
bottom, RNA-seq profiles are show, and fos transcription is detected.

13
Figure 4: Fos Locus in Mouse Cortical Neurons.

14
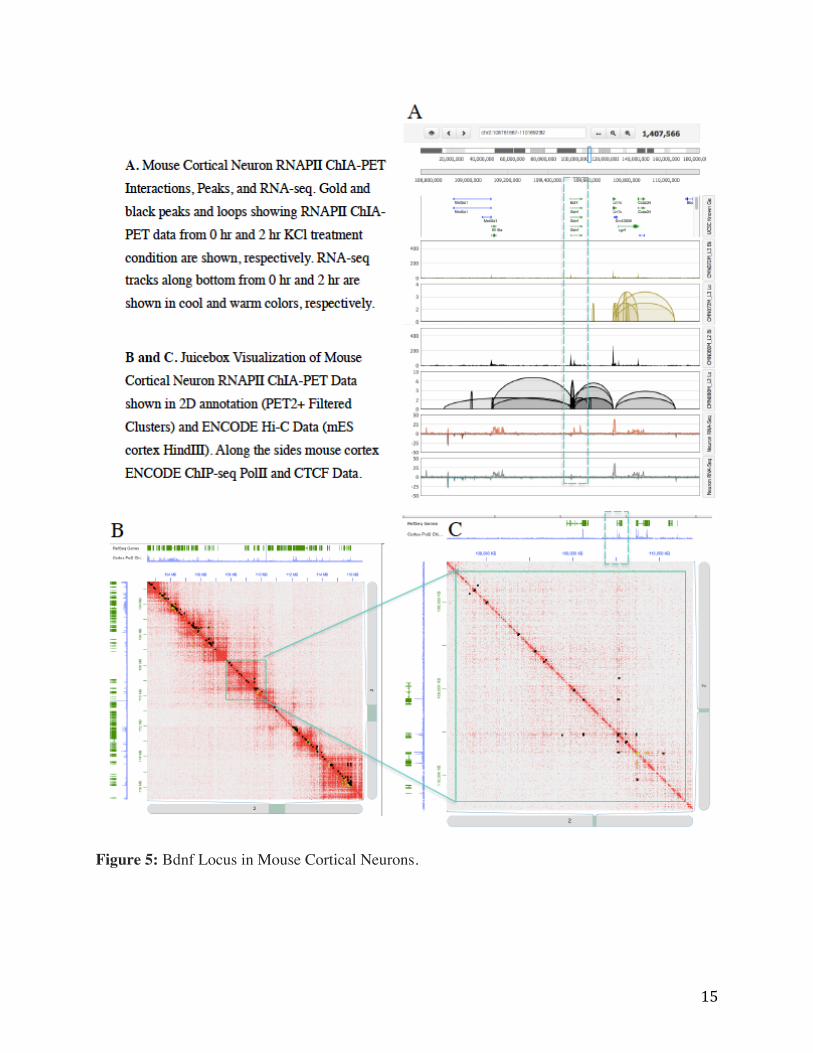
Figure 5 shows the multiple interactions were detected between the BDNF promoters and
classically described essential BDNF transcriptional enhancer sequences (n=7/14 enhancer
interactions), which are known to contain AP-1 binding sites for AD transcription factors.
15
Figure 5: Bdnf Locus in Mouse Cortical Neurons.

16
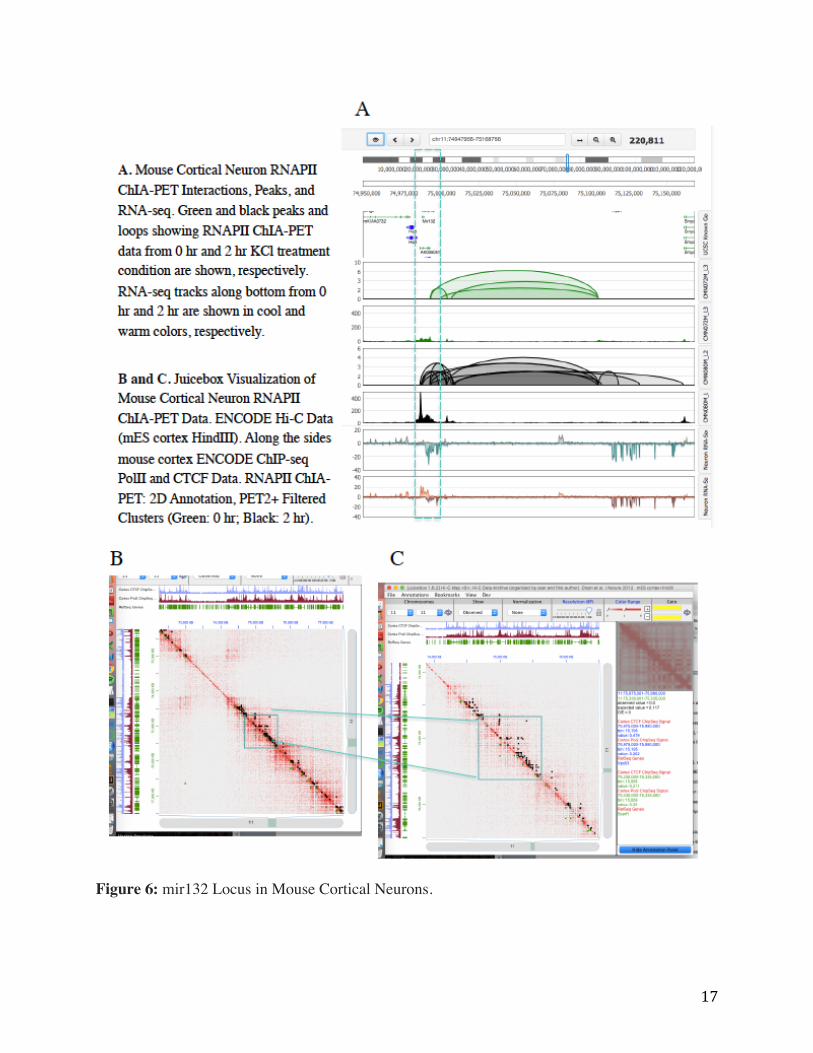
Novel Loci Display Activity Associated Genomic Connectivity
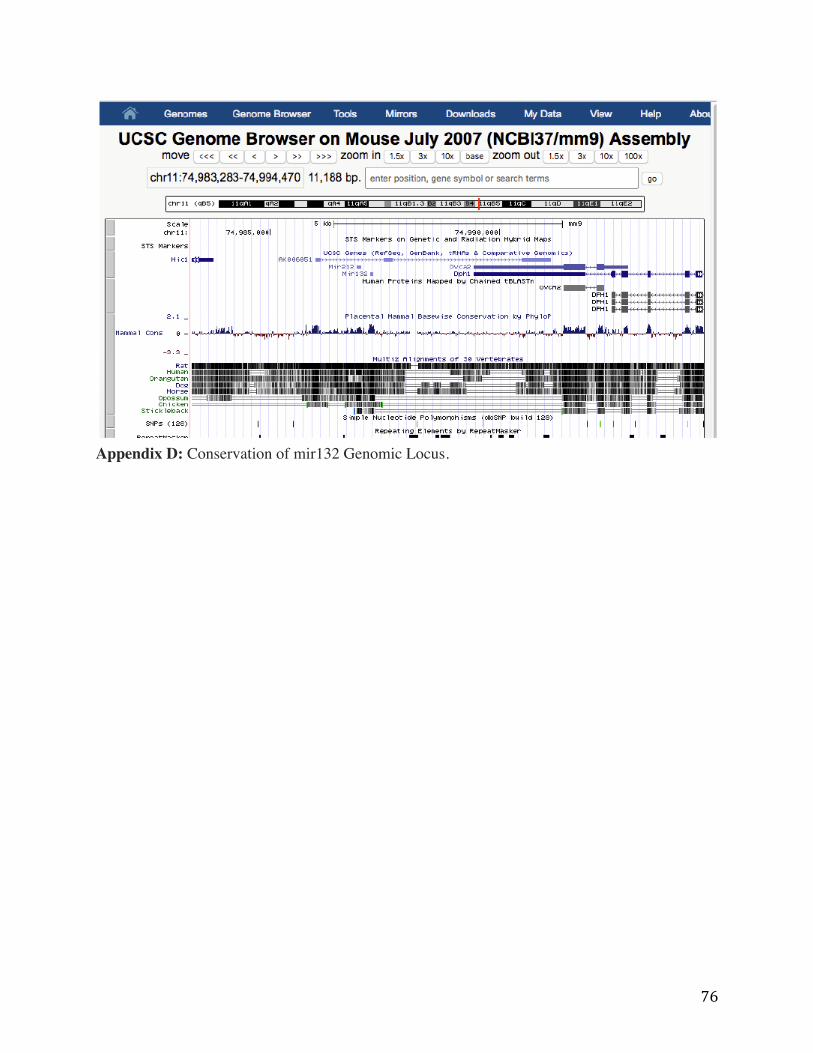
Figure 6 depicts an AD loci of interest that contains miR132, a microRNA that has been
previously shown to be involved in the regulation of BDNF protein in cultured rat neurons
(Klein et al., Nature Neuroscience 2007) but has not been described in terms of its 3D genomic
connectivity, and little is known about its transcriptional regulation. This miRNA has been
implicated in phosphorylation of the Ca2+ responsive transcription factor CREB (Gou et al.,
IntJClinExpMed 2014), and shown to play an essential role in the regulation of synaptic structure
and function. Interestingly, this region has been previously identified as a conserved enhancer
region between human and mouse (Appendix D), which would support a functional role in
mammalian neuronal gene regulation. Our ChIA-PET analysis found a significant increase in
intensity and loci in which binding of RNAPII in this region was detected which was correlated
with increased transcription of the miR132 miRNA.
17
Figure 6: mir132 Locus in Mouse Cortical Neurons.
18
Methods and Techniques
Cortical Mouse Neuron Cell Culture
Mouse cortical neurons were cultured and passaged as previously described (Kim et al. 2010;
Malik et al. 2015). Briefly, E16.5 C57BL/6 embryonic mouse cortices were dissected and
dissociated. After dissociation, neurons in were kept on ice in dissociation medium until plating.
Cell culture plates were pre-coated overnight with a solution containing 20 μg/mL poly-D-lysine
(Sigma) and 4 μg/mL mouse laminin (Invitrogen) in deionized water. Before plating neurons,
pre-coated culture plates were washed three times with sterile distilled water and then washed
once with Neurobasal medium (Life Technologies). Neurons were grown for up to 7 days in
cortical neuronal medium consisting of Neurobasal medium containing B27 supplement (2%;
Invitrogen), penicillin-streptomycin (50 g/mL penicillin, 50 U/mL streptomycin; Sigma) and
glutamine (1 mM; Sigma). Cells were plated at a density of approximately 600,000 cells/cm2.
Plated neurons were incubated at 37 °C with a CO2 concentration of 5%. Two hours after plating
cells, the medium was completely aspirated and replaced with fresh warm neuronal medium.
Neurons were grown in vitro until DIV7, in 30 mL neuronal medium with half media changes
every other day. All cell and tissues used in this study were collected and prepared previously for
analysis in this project.
Depolarization of Cortical Neuron Cell Culture
Prior to KCl depolarization, neuron cell cultures were silenced with 1 μM tetrodotoxin (TTX;
Fisher) and 100 μM DL-2-amino-5-phosphopentanoic acid (DL-AP5; Fisher). Neurons were
subsequently stimulated by adding warmed KCl depolarization buffer [170 mM KCl, 2 mM
19
CaCl2, 1 mM MgCl2 and 10 mM 4-(2-hydroxyethyl)-1-piperazineethanesulfonic acid (HEPES)]
directly to the neuronal culture to a final concentration of 31%.
RNA-seq Library Preparation
Total RNA was extracted and purified from mouse cortical neuron cell cultures using Trizol®
according to protocol (Invitrogen). polyA+RNA was purified with the Dynabeads mRNA
purification kit (Invitrogen). The mRNA libraries were prepared for strand-specific sequencing
as described previously.
RNA-seq Analysis
Trimmed reads were aligned to the mouse genome (mm9) using STAR version 2.53 (Dobin et
al., Bioinformatics 2013) with default parameters and expression levels of all genes were
determined using QoRTs version 1.2.42 (Hartley and Mullikin, BMC Bioinformatics 2015) with
default parameters and Gencode v19 transcript annotations. Reads were analyzed using the set of
open source software programs of the Tuxedo suite: TopHat and Cufflinks. TopHat was used to
align RNA-seq reads to the mm9 reference genome, and Cufflinks was used to assemble mapped
reads into possible transcripts and generates a final transcriptome assembly. Cufflinks includes
Cuffdiff, which accepts the reads assembled from two or more biological conditions and
analyzes their differential expression of genes and transcripts. The accessory tool CummeRbund
was used to process processes the output files of Cuffdiff and give outputs of plots and figures.
Red dots represent the statistically detectable genes with differential expression (p-value < 0.05)
between libraries. While the red dots above and below the blue lines means the up- and down-
20
regulated genes with log2 fold change more than 1, those genes were considered differentially
expressed between two cell lines.
ChIA-PET Library Construction
For each ChIA-PET library, 100 million mouse cortical neurons were collected and processed.
Cells were dual cross-linked with FA and EGS and subject to cellular and nuclear lysis.
Chromatin was sonicated to achieve an average DNA fragment length of 8kb. Chromatin
immunoprecipitation (ChIP) was carried out to select for chromatin complexes containing
RNAPII. On-bead chromatin complexes were subjected to ChIA-PET library construction
following the protocol as previously described (Fullwood et al., 2009; Fullwood et al., 2010)
with some modifications. Briefly, on-bead chromatin complexes were divided into two aliquots
for DNA linker ligation with Linker A and Linker B, respectively. A and B linkers consists of
the same nucleotide sequences, except four nucleotides in the middle (Linker A: TAAG; Linker
B: ATGT) to serve as distinguishable molecular barcodes after sequencing. Linkers were
incubated with chromatin complexes in molar excess so as to saturate DNA fragment ends. After
ligation and washing of excess linkers, the A and B aliquots were combined for proximity
ligation. Ligation was conducted under diluted conditions allowing DNA fragments within
individual chromatin complexes to ligate preferentially. After proximity ligation, Paired-End-
Tag (PET) constructs were extracted from the ligation products, and the PET templates were
subjected to Illumina GAIIx sequencing. Quality control was performed at key steps using Qubit
and Bioanalyzer to determine DNA concentration and fragment size distribution, respectively.
ChIA-PET Data Processing
21
ChIA-PET reads were processed by ChIA-PET Tool (Li et al., Genome Biology 2010), a
software package designed for ChIA-PET data analysis, with a few modifications. Briefly, non-
redundant PETs were first analyzed for linker barcode composition and identified as sequences
with hetero-dimer AB linker (barcode TAAG / ATGT) derived from nonspecific ligation
products, or sequences with homo-dimer AA or BB linker (barcodes TAAG / TAAG or ATGT /
ATGT) derived from specific ligation products. This linker composition information was used
later for noise analysis. Then, the linker sequences were trimmed, and the PET tag sequences
were mapped to the mouse genome (mm9). To further remove possible redundant PET
sequences after genome mapping, the PETs with genomic locations from both head and tail tags
within 2 bp were merged to further reduce the library sequence redundancy arising from clonal
PCR amplification. This processing step also takes into account any Single Nucleotide
Polymorphisms (SNPs) between the reference and the test genome and sequencing errors that
may have occurred and resulted in a 1 base pair or 2 base pair difference in the tag sequences.
PET Classification
Mapping ChIA-PETs to the mm9 reference genome reveals whether they are self-ligation
products (between the two ends of the same DNA fragment) or inter-ligation products
(interactions between two DNA fragments that were captured in the same chromatin complex by
protein interactions). Since chromatin fragment sizes were sonicated within a relatively narrow
range from 100 base pairs up to around 3 kilobase pairs, the mapping orientation and distance
between the tags of a PET sequence can indicate if the PET was derived from self-ligation or
interligation interaction.

22
Peak Calling of RNAPII Binding
The coverage of all self-ligation PET sequences across the genome reflects the enrichment by
RNAPII ChIP on specific locations, just as ChIP-Seq read mapping reflects the binding profile
for a protein. Using a similar method as that of the ChIP-Seq peak calling program MACS
(Zhang et al., Genome Biology 2008), we performed peak calling on our ChIA-PET data. The
local summits of the sequence coverage were called as potential peaks. The significances of the
potential peaks were estimated with p-values from a Poisson distribution. The background
parameters in the Poisson distribution were estimated from: 1) the maximum of the global tag
density, 2) tag density in a 10 kilobase window around the peak, and 3) the tag density in a 20
kilobase window around the peak. The p-value was corrected as false discovery rate (FDR) with
the Benjamini-Hochberg (B-H) method for multiple hypothesis testing. The criteria for our final
peaks were that 1) the sequence coverage is at least 5 and 2) the FDR is smaller than 0.05.
Defining Interaction PET Clusters
Inter-ligation PETs potentially reflect long-range chromatin interactions. However, in this class
of PETs there is inevitably technical noise from various sources. To distinguish true long-range
interaction signals from non-specific interaction noise, we reasoned that for true interactions,
multiple unique interaction PETs would be generated from the same general interacting regions.
To identify such legitimate long-range chromatin interactions, mapping locations of the inter-
ligation PETs were extended 1.5 kilobase pairs downstream, and the PETs that overlapped at
both ends formed interaction PET clusters. Overlapping PET clusters are used to distinguish
detectable interaction signals over background noise represented by singleton PETs, which could
also include weak interaction events that are not distinct from background noise. The PET count
23
of a PET cluster is the frequency of the interaction between the two locations involved. The
statistical significance of such interactions was evaluated with p values from a hyper-geometric
distribution. The hyper-geometric model takes into consideration the tag counts from both
anchor regions and the sequencing depth for p value calculation, thus normalizing the effects of
random ligations between two highly-enriched regions that would give rise to potentially noisy
inter-ligation PETs. The p values were corrected as false discovery rate (FDR) with the B-H
method for multiple hypothesis testing and the FDR cutoff is 0.05.
Downloaded Data Used
Raw fastq files for the following datasets were obtained from associated databases (Kim et al
2010 Nature, Malik et al 2014 Nature Neuro), mouse mm9 ENCODE (Shen et al. Nature 2012;
Stamatoyannopoulos et al. Genome Biology 2012), additional ChIA-PET libraries previously
published.

24
Discussion
Here, we report the first RNAPII ChIA-PET map of genome wide chromatin interactions
in cortical mouse neurons. We have found that depolarization induces dynamic changes in the
intensity of chromatin interactions that are associated with regulation of transcription of activity
dependent genes. In addition to validating chromatin interactions previously reported, ChIA-PET
identified new interactions between RNAPII bound active promoter and enhancer regions,
potentially involved in the regulation of AD transcription. Comparisons of RNAPII ChIA-PET
anchors before and after KCl depolarization revealed the overwhelming majority of enhancer
anchors were unique to the depolarization condition. However, due to high cell input
requirements (100 million cells) for ChIA-PET library construction, we were unable to validate
these findings in human cells at this time.
The data generated in this study should serve as a resource for future studies to explore
the complexity of mammalian neuronal cell regulatory programs uncovered in this study and to
guide targeted mechanistic studies of gene regulatory networks of relevance to neuronal biology.
Risk variant loci in the human genome for myriad of neurological diseases have been found to
mark gene regulatory elements that are active in the human brain (Ng et al. Nature Neuro 2017;
Allen et al. Neurol Genetics 2015; Short et al. Nature 2018; O’Roak et al. Nature 2011; Brandler
et al. Science 2018; Lim et al. Nature Neuro 2017). Variation in imprinted genes has been shown
to be associated with various forms of Alzheimer’s disease (Chaundhry et al. JAlzDis 2015) and
genome wide changes have been shown to accompany autism and spectrum like disorders
(Papikshak et al. Nature 2016).
25
Chapter II: 3D Genome Technology Development
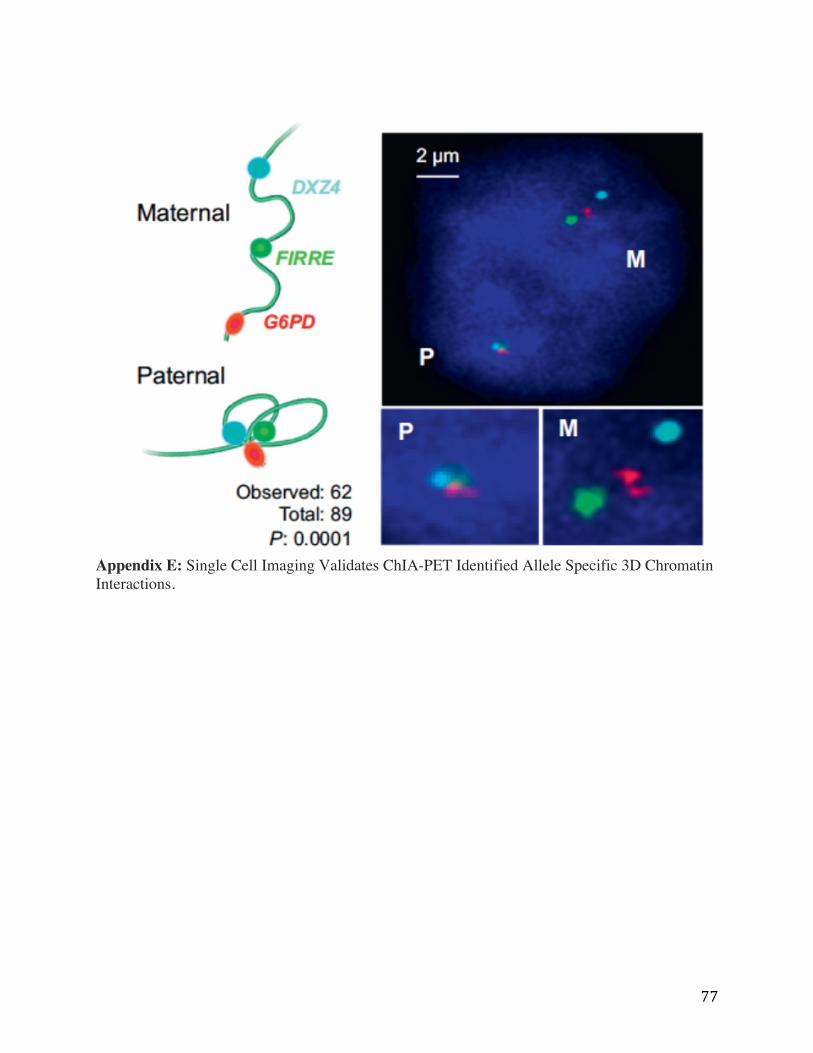
To date, the overwhelming majority of 3D genome connectivity sequence data has been
obtained from bulk cell lysate of millions of cells at a time or from imaging in single cells
(Appendix E). This approach has allowed the modeling of chromosome structure, but has
inhibited the detailed study of many biological questions concerning cell-to-cell heterogeneity
and finite genomic structural details of transcription. To overcome this issue, we will develop a
variety of complementary methods to probe the 3D genome at nucleotide resolution. The
following is a description of a selection of approaches used to target significant common
bottlenecks in the core molecular biology of chromosome capture experiments such as: mean
read length of PET reads, decreasing false positive and noise during proximity ligation, and
increasing molecular resolution of the chromatin sample to allow direct visualization.
Results
Development of Long-Read (LR) ChIA-PET
The LR ChIA-PET protocol involves three major sections: chromatin immunoprecipitation
(ChIP), library construction, and library sequencing. The use of a bridged linker and
tagmentation are the key distinguishing steps of long read ChIA-PET when compared to
traditional ChIA-PET.
Overview of the LR ChIA-PET Protocol
26
Figure 7 shows an illustrative depiction of the molecular biology steps involved in the LR ChIA-
PET protocol. Cross-linked cells are harvested and ChIP is performed using an antibody of
interest; typically targeted at a known transcription factor or structural chromatin protein. A
high-quality ChIP is crucial to the successful construction of a ChIA-PET library and great care
should be taken to select an antibody and optimize crosslinking conditions before proceeding to
any further library construction steps. Following ChIP is library construction, which includes
proximity ligation of chromatin bound DNA fragments and tagmentation of ligated products by
Tn5 transposase. Tagmented fragments are selected and PCR amplified, then subject to size
selection for optimal sequencing. The LR ChIA-PET library is sequenced using Illumina Mi-Seq,
Next-seq, or Hi-Seq with paired-end sequencing mode.
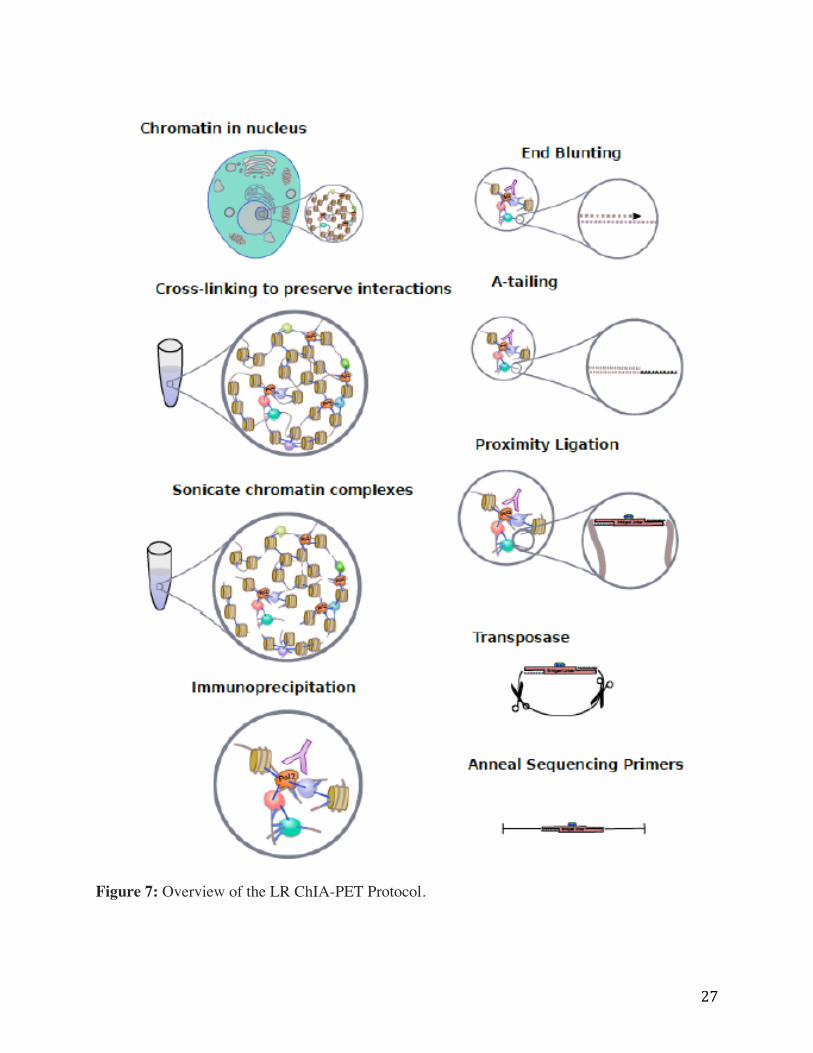
27
Figure 7: Overview of the LR ChIA-PET Protocol.

28
Protocol steps for long-read ChIA-PET library preparation are highlighted in Figure 8 in
boxes, indicating the timeline on the left and corresponding steps in the protocol are labeled
above each box. Five quality control steps are shown displaying a typical DNA fragment
distribution profile as captured by Agilent 2100 Bioanalyzer High Sensitivity DNA Assay. QC1,
CTCF ChIP DNA fragment distribution with a peak near 3.5 kb (arrow); QC2 proximity ligation
DNA distribution with a peak near 4.3 kb (arrow); QC3 shows the typical size range for Tn5
tagmentation DNA product between 140 bp and 1 kb, peaking around 200 bp (arrow); QC4, the
DNA fragment size distribution of the PCR amplified product typically falls between 200-900 bp
(arrow); and QC5, the final DNA library is ready for sequencing after size selection from 320-
500 bp (arrow). FU, fluorescence units. Long Read ChIA-PET pipeline data processing steps are
shown in Appendix F.
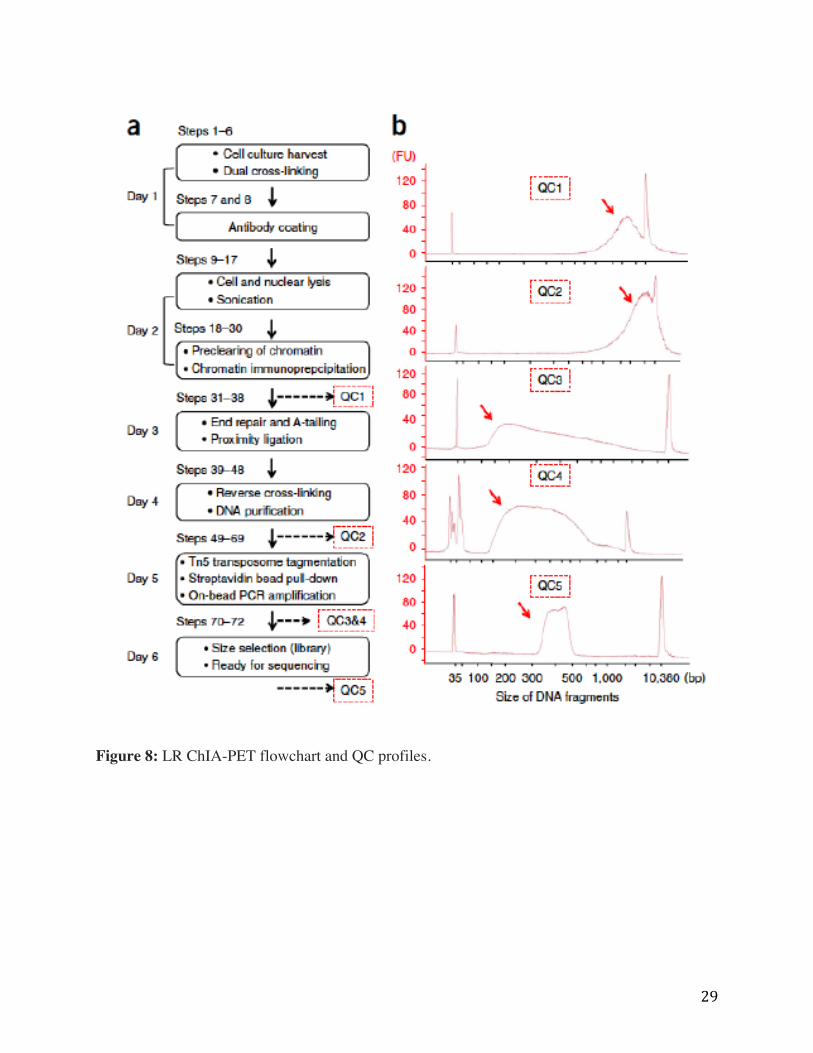
29
Figure 8: LR ChIA-PET flowchart and QC profiles.

30
Development of ChIA-SMS (Chromatin Interaction Analysis by Single Molecule Sequencing)
A prototype single-molecule platform has been demonstrated for simultaneous detection
of histone modifications and genomic positions of individual nucleosomes (Shema et al., Science
2016). Using this sequencing platform, the unamplified DNA complexed within a single
nucleosome has been directly detected. We will adapt this platform to enable single-molecule
Chromatin Interaction Analysis (ChIA-SMS) in single nuclei. The ChIA-SMS approach will
detect individual, unamplified chromatin complexes. Development of this unique method will
allow determination of the nature of individual chromatin complexes, including their protein
composition and genomic sequence (Appendix B). A set of customized, barcoded DNA linker
oligonucleotides containing a terminal biotin were designed and synthesized (Appendix J and
K). Using a cleavable fluorescent tag we additionally labeled one of the barcoded DNA linker
oligonucleotides (Linker 1) to serve as a marker for sample density and binding on the flowcell.
Single Molecule Sequencing and Alignment To Reference Genome
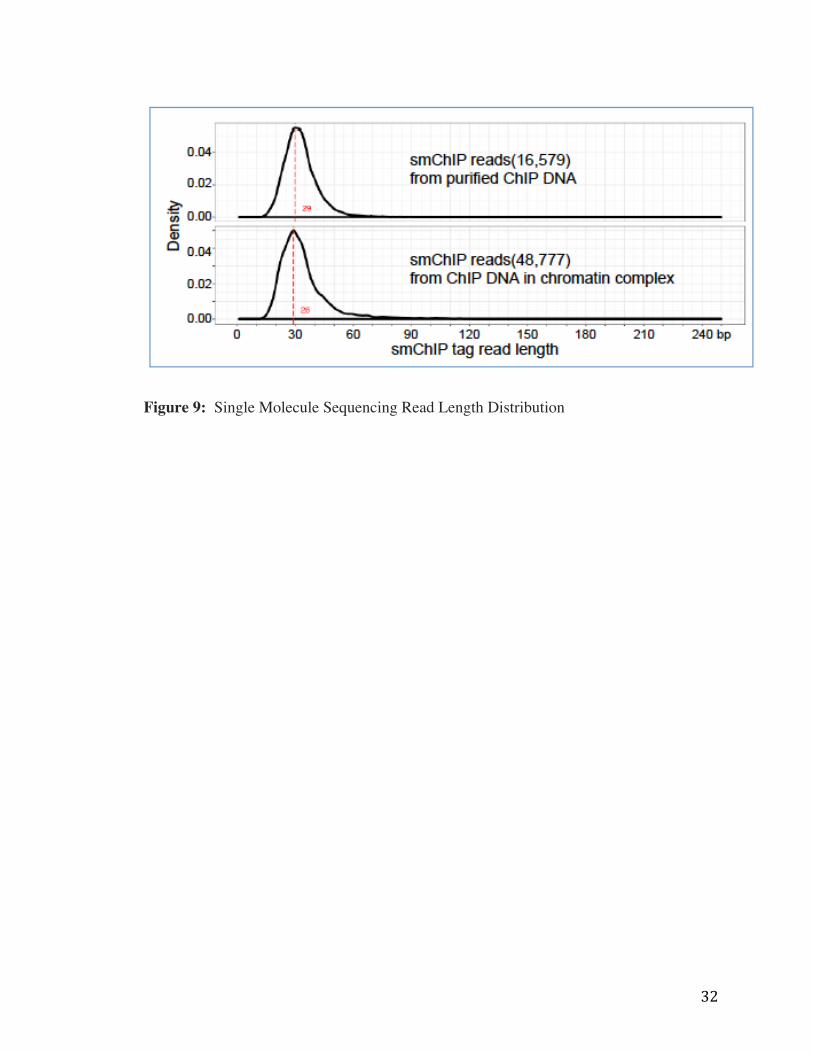
We sought to demonstrate the feasibility of single molecule sequencing ChIP DNA and
downstream mapping of reads to previously known RNAPII ChIA-PET peaks in the genome,
similar to what was done in the Shema et al. science paper, but in the case, with the addition of
chromatin crosslinking. To test this, we dual cross linked Drosphila S2 cells, sonicated to an
average fragment size of 3kb, then immunoprecipitated for the general transcription factor
RNAPII. These RNAPII-enriched chromatin complexes were ligated with a mixture of barcoded

31
biotinylated and flourescent linkers, then loaded to the flowcell for sequencing. In one test run,
we loaded complexes, de-cross linked proteins on the flow cell, and generated about 16k quality
reads of average length, 30bp (Figure 9, top panel). We then aimed to directly sequence in the
context of cross linked chromatin, and found we could indeed generate about 48k high quality
reads of average length of 30bp in the presence of cross-linked chromatin (Figure 9, bottom
panel).
32
Figure 9: Single Molecule Sequencing Read Length Distribution
33
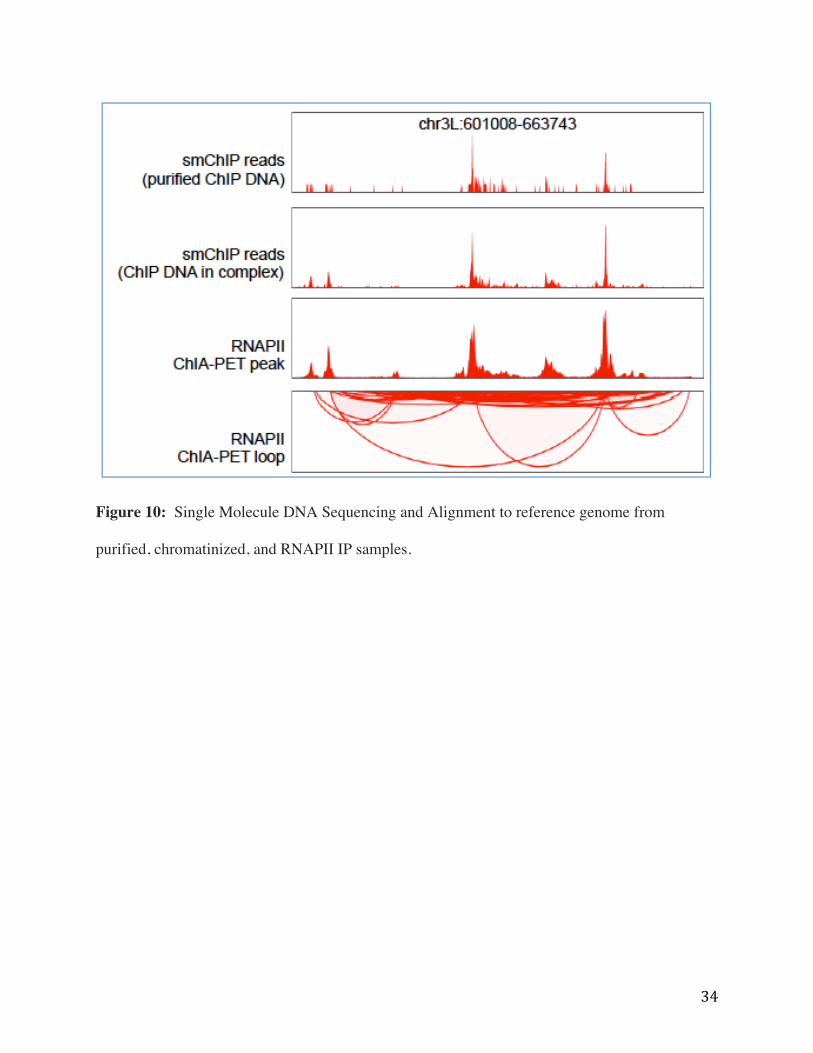
When reads were mapped to the dm3 drosophila reference genome, we found enrichment
for sequence reads to align to know RNAPII ChIA-PET peaks, confirming the ability of our
method for detection of sequences from RNAPII-bound chromatin complexes (Figure 10). The
top panel of Figure 10 shows sequence reads generated from purified DNA that came from an
RNAPII ChIP, the second panel shows sequence reads generated directly from unpurified ChIP
DNA, and the third panel shows ChIA-PET RNAPII sequence reads. The bottom panel shows
RNAPII ChIA-PET reference anchors.
34
Figure 10: Single Molecule DNA Sequencing and Alignment to reference genome from
purified, chromatinized, and RNAPII IP samples.

35
Single Molecule Sequencing of Chromatin Complexes
To detect multiple DNA fragments originating from the same 400 nm optical spot (two examples
are circled below in Figure 11A), and theoretically from the same individual chromatin
complex, we generated a set of barcoded linkers to allow the initiation of multiple rounds of
sequencing from the same sample. The aggregate fluorescence intensity plot (below, B) shows
the incorporation of the first sequencing primer, followed by the synthesis and decay of
fluorescence signal. With the incorporation of the second primer, the fluorescence signal spikes,
and decays again. This is a typical profile for the SeqLL platform single molecule sequencing. In
(Figure 11C), we show two examples of multiple genomic sequences (uniquely mapped
genomic loci highlighted in red) being detected using distinct barcoded primers (index sequences
in blue and purple), coming from the same 400 nm optical spot. We were able to align such
sequences to previously know RNAPII ChIA-PET interaction anchors generated previously.

36
Figure 11: ChIA-SMS Identifies Known RNAPII ChIA-PET Anchor Interactions.
37
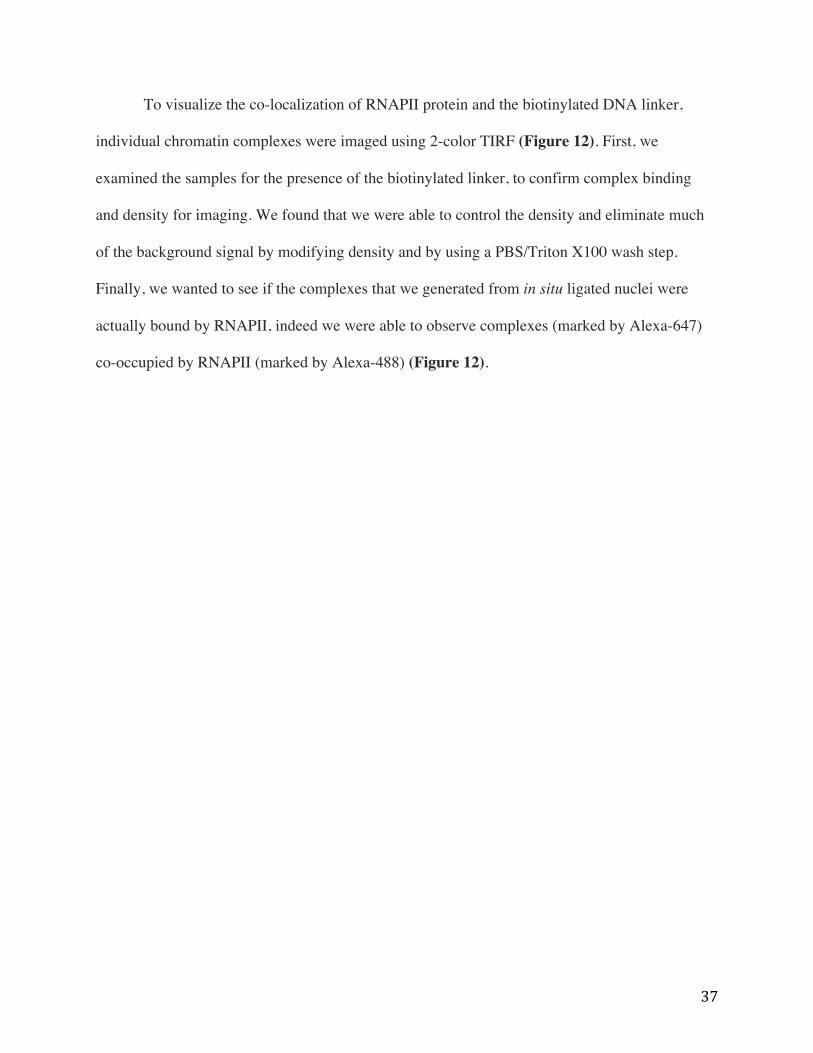
To visualize the co-localization of RNAPII protein and the biotinylated DNA linker,
individual chromatin complexes were imaged using 2-color TIRF (Figure 12). First, we
examined the samples for the presence of the biotinylated linker, to confirm complex binding
and density for imaging. We found that we were able to control the density and eliminate much
of the background signal by modifying density and by using a PBS/Triton X100 wash step.
Finally, we wanted to see if the complexes that we generated from in situ ligated nuclei were
actually bound by RNAPII, indeed we were able to observe complexes (marked by Alexa-647)
co-occupied by RNAPII (marked by Alexa-488) (Figure 12).

38
Figure 12: Co-localization of RNAPII and DNA Linker Within Individual Chromatin Complex

39
Methods and Techniques
Long Read (LR)-ChIA-PET
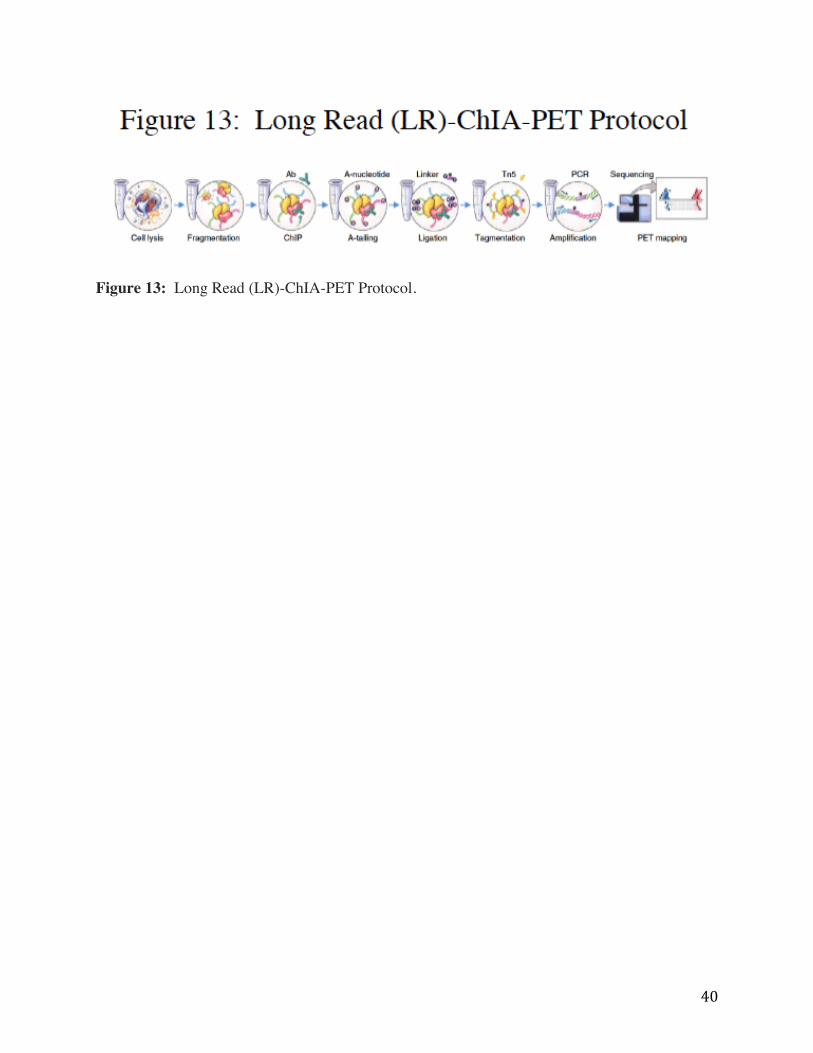
This protocol was optimized using 100 million cells of the Drosophila S2 cell line and RNAPII
antibody. Different cell type and antibody may require alterations in sonication and
immunoprecipitation conditions. The major molecular biology steps of LR-ChIA PET are
depicted in Figure 13.
40
Figure 13: Long Read (LR)-ChIA-PET Protocol.

41
Chromatin immunoprecipitation (ChIP)
Cell Harvesting and Dual Cross-linking
Note that cross-linking was done using an adherent cell line- cells in suspension will therefore
require optimization of crosslinking conditions.
Reagents Required:
1. 1X PBS
2. 1.5 mM EGS / 1 X PBS solution (Refer to the EGS product manual)
3. 37% formaldehyde
4. 2.5 M glycine
Procedure:
1. Count cells and transfer 1 x10⁸ cells in to a 50 mL falcon tube, spin at 1000 rpm for 5
min.
2. Wash pellet with 20 mL warm PBS twice, spin at 1000 rpm for 5 min.
3. Add 20 ml of EGS / 1 X PBS solution to each tube (About 20 mL per tube/1 x 108 cells)
and shake for 45 min at room temperature (RT).
4. Add of 37% formaldehyde (final concentration: 1%) and shake the plate or tube on
rotator for 20 min at RT.
5. Add glycine to achieve final concentration of 0.2 M, and shake the plate or tube on
rotator for 10 min at RT.
6. Centrifuge collected cells at 2000 rpm for 10 min at 4 °C.

42
7. Discard media by pipetting and wash cells with 20 mL-chilled PBS then centrifuge the
tube at 2000 rpm for 5 min at 4 °C.
8. Repeat washing step and discard supernatant.
9. Freeze cells at -80 °C to store, or continue to cell lysis.
Prepare Antibody-Bead Coating Reaction and Lysis Solutions
Reagents Required:
1. ChIP Grade Antibody (PolII antibody used as an example below)
2. 0.1% Triton X-100 / 1 X PBS
3. Dynabeads® Protein G beads
Procedure:
1. Thaw antibody of interest on ice.
2. Mix magnetic bead solution well and transfer 1 mL bead mixture into a new 1.5 mL
microcentrifuge tube.
3. Place the tube on magnetic rack, wait for pellet to form, and remove supernatant.
4. Wash beads with 1 mL 0.1%Triton X-100 / 1 X PBS by mixing, then return to magnetic
rack to remove supernatant.
5. Repeat wash two times.
6. Add a fresh 1 mL 0.1% Triton X-100 / 1 X PBS to the washed beads and 80 μL PolII
antibody, mix gently.
7. Incubate the tube at 4°C, overnight on rotating mixer.

43
Cell Lysis, Sonication, Preclearing Chromatin, Input QC, and Preparation of IP
Cell Lysis
Reagents Required:
1. 1 X PBS
2. 0.1% SDS FA Cell Lysis Buffer
3. Proteinase Inhibitor (+PI) Cocktail Tablets (Roche)
Procedure:
1. Thaw cell pellet, wash once with 30 mL 1 X PBS in 50 mL tube by gently resuspending,
then spin down at 4 °C, 2000 rpm for 5 min and remove supernatant.
2. Add 30 mL 0.1% SDS FA Cell Lysis buffer (+PI) to resuspend pellet.
3. Incubate at 4 °C for 15 min on circular shaker.
4. Spin down at 2000 rpm, 4 °C, for 5 minutes and discard supernatant.
5. Repeat cell lysis steps 2-4, two more times.
Nuclear Lysis:
Reagents Required:
1. 1% SDS FA Cell Lysis buffer (+PI)
2. 0.1% SDS FA Cell Lysis buffer (+PI)
3. Proteinase inhibitor (PI) Cocktail Tablets (Roche)
Procedure:

44
1. Add 30 mL of 1% SDS FA Cell Lysis buffer (+PI) to resuspend pellet.
2. Incubate at 4 °C for 15-30 min on circular shaker (this time and temperature should be
optimized for different cell types)
3. Spin down at 4000 rmp, 4 °C for 10 min, the discard supernatant.
4. Resuspend pellet in 30 mL 0.1% SDS FA Cell Lysis buffer (+PI).
5. Incubate at 4 °C for 15 min on circular shaker.
6. Spin down at 4000 rmp, 4 °C for 10 min, discard supernatant.
7. Repeat nuclear lysis steps 4-6, once.
8. Store nuclear pellet at -80°C or continue to next step.
Sonication and Preparation of Input Quality Control (QC) Sample
Reagents Required:
1. 0.1% SDS FA Cell Lysis buffer
2. Proteinase inhibitor (PI) Cocktail Tablets (Roche)
3. TE buffer
4. ChIP elution buffer (1% SDS in TE buffer)
5. Proteinase K (Ambion)
Procedure:
1. Add 4 mL 0.1% SDS FA Cell Lysis buffer (+PI), and gently resuspend nuclei pellet the
aliquot 1 mL nuclei solution into (4) 14 mL tubes taking care not to generate bubbles.
2. Sonicate chromatin in cold room using ice bath. The sonication probe should be cleaned
with ethanol before use and centered in the sample volume. (For the development of this
45
protocol, the sonicator programmed to 6 min: pulsing on for 30 seconds and off for 30
seconds at amplitude of 36%, and lasted for 12 minutes.)
3. After sonication, take 20 μL of sonicated chromatin as “total input chromatin” into a
sample tube.
4. Add 300 μL elution buffer and 5 μL proteinase K, incubate the input chromatin at 55 °C
for reverse cross-linking overnight.
5. Purify the DNA. Run a High Sensitivity Bioanalyzer to determine the size range of
sonicated ChIP DNA fragments in the second day. Using Qubit, confirm the
concentration of DNA in the sample falls within indicated range required for library
construction.
Preclearing Chromatin
Reagents Required:
1. 0.1% Triton X-100 in1 X PBS
Procedure:
1. Aliquot 1 mL of magnetic beads into a new tube and place on magnet rack.
2. Wash beads twice with 0.1% Triton X-100 / 1 X PBS.
3. Spin down the remaining sonicated chromatin at 4000 rpm, 4 °C for at least 10 min.
4. Collect supernatant and resuspend washed bead. Transfer to a new 15 mL tube and
incubate using rotating shaker at 4°C for at least 1 hour or overnight.
Immunoprecipitation (IP) of Chromatin Complexes
46
Procedure:
1. Place the antibody-bound beads (from overnight incubation) on magnetic rack.
2. Wash the antibody beads two times with 1 mL 0.1% Triton X-100 / 1 X PBS.
3. Transfer supernatant from precleared chromatin tube to the antibody-covered bead tube,
and pipette gently to resuspend.
4. Incubate antibody-coupled beads with chromatin overnight at 4° C.
Wash of On-Bead Chromatin Complexes and Elution of QC Sample
Reagents Required:
1. 0.1% SDS FA Cell Lysis buffer (low salt buffer)
2. 0.1% SDS FA Cell Lysis buffer/ 0.35M NaCl (high salt buffer)
3. LiCl wash buffer
4. TE buffer
5. ChIP elution buffer
6. Proteinase K (Ambion)
Procedure:
1. Remove supernatant from immunoprecipitated beads using magnetic rack.
2. Wash three times (3x) using 5 mL of 0.1% SDS FA Cell Lysis buffer (low salt buffer).
3. Add 5 mL of low salt buffer to resuspend, incubate on rotating rack at 4 °C for 5 min.
4. Short spin the tube and place back on magnetic rack, remove supernatant.
47
5. Wash twice (2x) using 1mL 0.1% SDS FA Cell Lysis buffer/ 0.35M NaCl (high salt
buffer).
6. Add 5 mL high salt buffer and gently resuspend, incubate rotating at 4 °C for 5 min.
7. Short spin the tube and place back on magnet rack, then remove supernatant.
8. Wash once (1x) using 1 mL LiCl wash buffer.
9. Add 5 mL LiCl wash buffer to resuspend, place on rotating rack at 4 °C for 5 min.
10. Short spin the tube and place back on magnet rack to assist removal of supernatant.
11. Wash twice, (2x) using 1 mL TE buffer.
12. Add 5 mL TE buffer to resuspend, place on rotating rack at 4 °C for 5 min.
13. Short spin and place tube back on mag rack, remove supernatant.
14. Remove TE buffer from mag beads. Resuspend with 1 mL TE buffer, aliquot 20-50 μL
beads to a new tube for “ChIP enrichment QC” sample, remaining beads are kept at 4 °C
for following library preparation steps after QC is performed and quality is considered
acceptable.
15. For elution of ChIP-DNA to be used for QC, place aliquot tube with 20-50 μL beads on
magnet rack, remove the TE buffer, resuspend beads using 200 μL ChIP elution buffer
then shake at 900 rmp, 65 °C for 15 min.
16. Move 200 μL of eluted ChIP DNA to a new tube using magnet rack.
17. Add 400 μL of Qiagen elution buffer to the magnet tube, mix well, place on magnet rack
and transfer supernatant to elution tube, totaling 600 μL of eluted DNA solution.
18. Add 10 μL of Proteinase K to tube, incubate at 65 °C overnight.
Column Purification and Collection for ChIP-DNA QC Sample:

48
Reagents Required:
1. Zymo Genomic DNA Clean & Concentrator Kit
Procedure:
1. Add (2x) volume-binding buffer to sample. For example, 600 μL of eluted DNA would
require the addition of 1200 μL of Zymo binding buffer.
2. Load mixture into column that is placed in collection tube.
3. Spin down at 13000 rpm for 30 sec at RT.
4. Load the flow through again, spin down at 13000 rpm for 30 sec, RT.
5. Discard the flow through.
6. Add 200 μL of wash buffer to the column and spin-down at 13000 rpm, RT for 30 sec,
discard flow through.
7. Add 200uL of wash buffer to the column again, spin down at 13000 rpm, RT for 30 sec,
discard flow through.
8. Spin down 13000 rpm, RT for 1 min to remove residual wash buffer from column.
9. Move column to a new 1.5mL eppendorf collection tube.
10. Add 10 μL of elution buffer directly on top of column filter spin down at 13000 rpm, RT
for 1 min.
11. Repeat with another 10 μL Elution Buffer directly on top of column filter, spin down at
13000 rpm, RT for 1 min.
12. 20μL of eluted DNA is collected in the 1.5mL eppendorf tube.
49
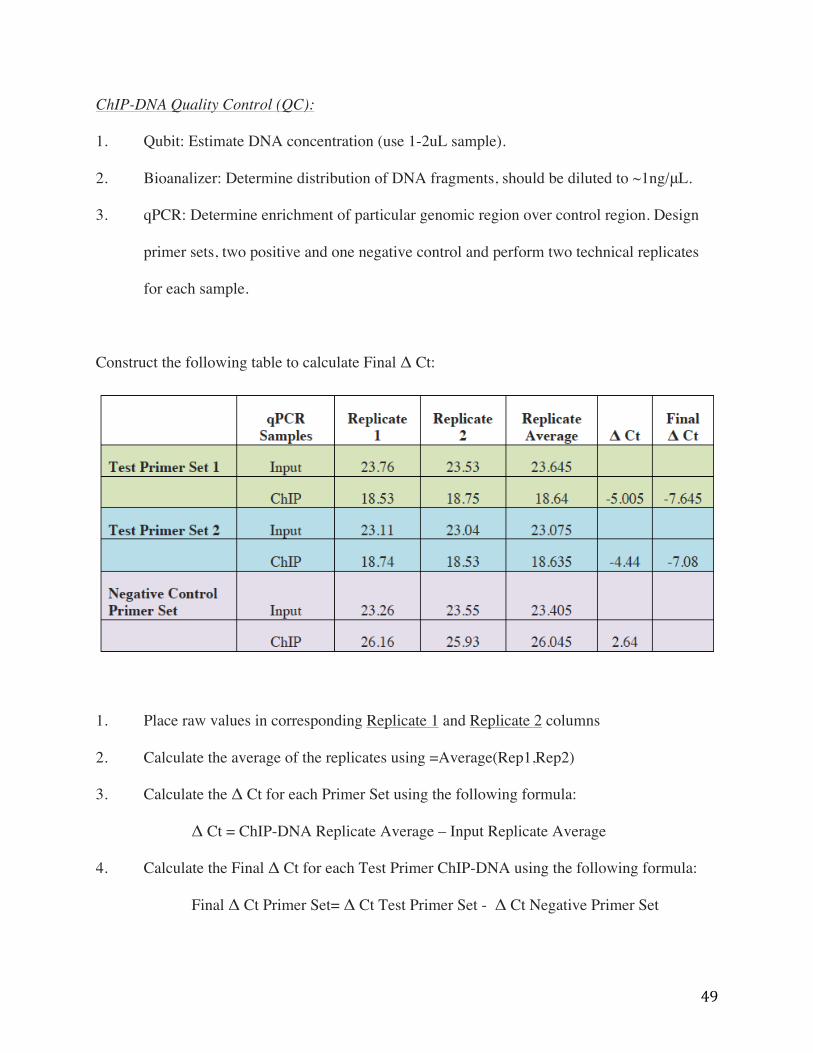
ChIP-DNA Quality Control (QC):
1. Qubit: Estimate DNA concentration (use 1-2uL sample).
2. Bioanalizer: Determine distribution of DNA fragments, should be diluted to ~1ng/μL.
3. qPCR: Determine enrichment of particular genomic region over control region. Design
primer sets, two positive and one negative control and perform two technical replicates
for each sample.
Construct the following table to calculate Final Δ Ct:
1. Place raw values in corresponding Replicate 1 and Replicate 2 columns
2. Calculate the average of the replicates using =Average(Rep1,Rep2)
3. Calculate the Δ Ct for each Primer Set using the following formula:
Δ Ct = ChIP-DNA Replicate Average – Input Replicate Average
4. Calculate the Final Δ Ct for each Test Primer ChIP-DNA using the following formula:
Final Δ Ct Primer Set= Δ Ct Test Primer Set - Δ Ct Negative Primer Set
50
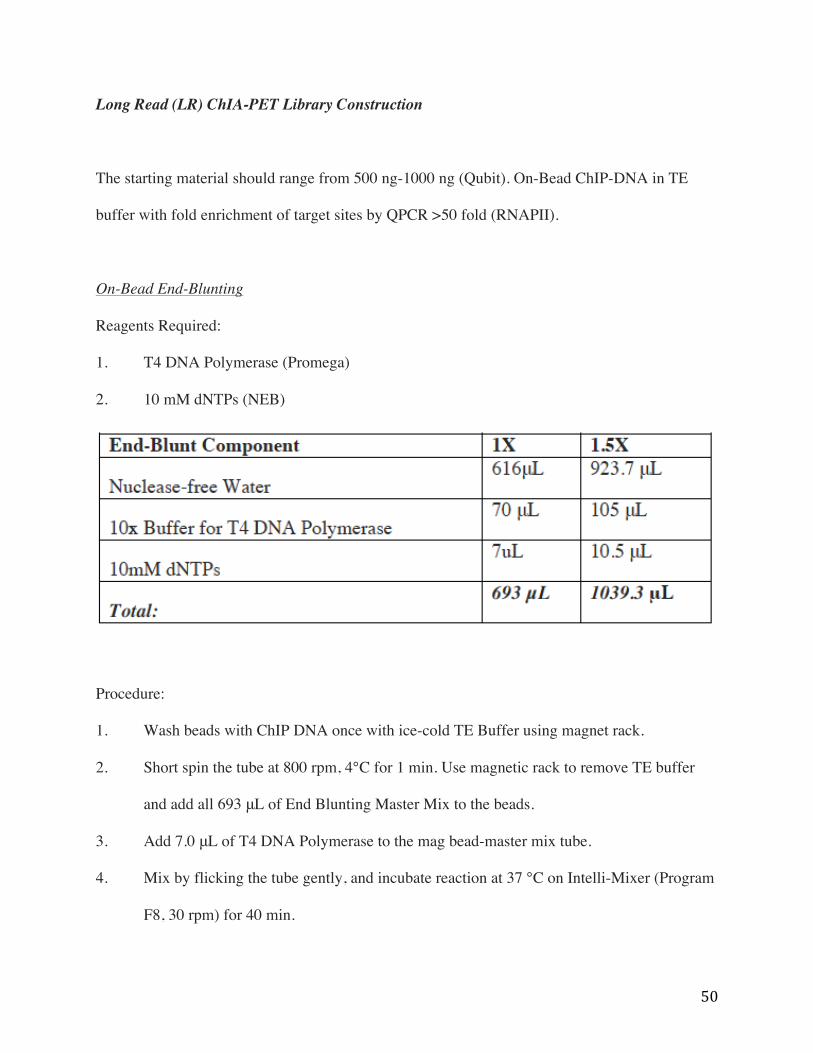
Long Read (LR) ChIA-PET Library Construction
The starting material should range from 500 ng-1000 ng (Qubit). On-Bead ChIP-DNA in TE
buffer with fold enrichment of target sites by QPCR >50 fold (RNAPII).
On-Bead End-Blunting
Reagents Required:
1. T4 DNA Polymerase (Promega)
2. 10 mM dNTPs (NEB)
Procedure:
1. Wash beads with ChIP DNA once with ice-cold TE Buffer using magnet rack.
2. Short spin the tube at 800 rpm, 4°C for 1 min. Use magnetic rack to remove TE buffer
and add all 693 μL of End Blunting Master Mix to the beads.
3. Add 7.0 μL of T4 DNA Polymerase to the mag bead-master mix tube.
4. Mix by flicking the tube gently, and incubate reaction at 37 °C on Intelli-Mixer (Program
F8, 30 rpm) for 40 min.
51
5. Discard End-Blunting Reaction by using magnet rack.
6. Wash beads with ice-cold ChIA-PET wash buffer three times using 1 mL each time.
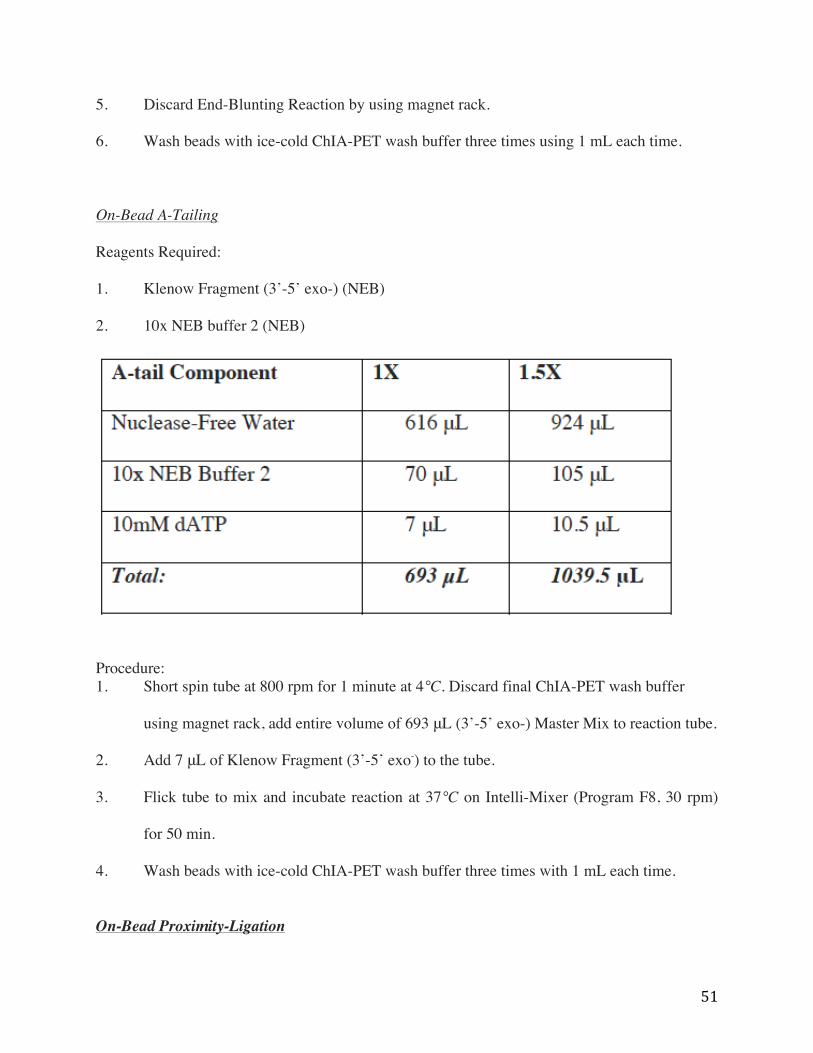
On-Bead A-Tailing
Reagents Required:
1. Klenow Fragment (3’-5’ exo-) (NEB)
2. 10x NEB buffer 2 (NEB)
Procedure: 1. Short spin tube at 800 rpm for 1 minute at 4°C. Discard final ChIA-PET wash buffer
using magnet rack, add entire volume of 693 μL (3’-5’ exo-) Master Mix to reaction tube.
2. Add 7 μL of Klenow Fragment (3’-5’ exo-) to the tube.
3. Flick tube to mix and incubate reaction at 37°C on Intelli-Mixer (Program F8, 30 rpm)
for 50 min.
4. Wash beads with ice-cold ChIA-PET wash buffer three times with 1 mL each time.
On-Bead Proximity-Ligation

52
Reagents Required:
1. T4 DNA ligase (Fermentas)
2. 5X T4 DNA Ligase Buffer with PEG (Invitrogen)
3. Bridge Linker (IDT, 200ng/ul)
Procedure:
1. Short spin at 800 rpm, 4°C for 1 minute, discard end-blunting reaction using magnetic
rack, add all 1394 μL of proximity ligation mixture.
2. Add 6 μL of T4 DNA ligase to mixture, flick to mix reaction, parafilm cap immediately.
3. Incubate overnight at 16°C (Program F8, 30 rpm).
Elution of Proximity Ligation DNA
Reagents Required:
1. ChIP wash buffer
2. ChIP elution buffer
3. Elution Buffer (Qiagen)
53
4. Proteinase K
Procedure:
1. Short spin the ligated bead mix at 800 rpm for 2 minutes, discard the supernatant and
wash the beads with 800 μL ChIA-PET wash buffer 3 times then add 200 μL fresh-made
ChIP elution buffer to the tube.
2. Incubate at 900 rpm, 65°C for 35 minutes on Thermomixer.
3. Short spin the tube, place on magnet rack, then remove and save supernatant in a new
tube.
4. Add 400 μL of Qiagen elution buffer to recover remaining DNA from the beads.
5. Short spin the tube, place on mag rack, remove and save supernatant into tube containing
200 μL, for a total of 600 μL of eluted chromatin.
6. Add 10 μL of Proteinase K to the tube containing 600 μL of eluted proximity ligated
chromatin, flick to mix, spin down briefly, and incubate overnight at 65°C to reverse
cross-link chromatin complexes.
Purification, Tagmentation, Immobilization, PCR Amplification, and Size Selection of LR ChIA-
PET Library
Purification of DNA using MaXtract High Density Tubes
Reagents Required:
1. Phenol:Chloroform:IAA, 25:24:1, pH 6.6 (Ambion)
2. 3 M Sodium Acetate pH 5.5 (Ambion)
3. GlycoBlue (Ambion)

54
4. Ice-cold Isopropanol
5. 75% ice-cold ethanol
Procedure:
1. Centrifuge the MaXtract tube at 13000 rpm, RT for 2 minutes to collect gel to bottom.
2. Add equal volume of Phenol-Chloroform-Isoamyl alcohol (pH 7.9) to de-crosslinked
proximity ligated product (in this example, add 600 μL to a final volume of 1200 μL
mixture).
3. Mix tube vigorously for 10 seconds, then transfer entire volume to MaXtract tube.
4. Centrifuge at 13000 rpm, RT for 5 minutes.
5. Carefully collect upper aqueous layer to a new 1.5 mL tube.
6. Add the following components to the tube as listed:
7. Invert tube to mix well, incubate at -80°C for 30-60 minutes to freeze mixture.
8. Centrifuge at 13000 rpm, 4°C for 30 minutes to precipitate DNA.
9. Carefully wash blue pellet with 1 mL of 75% ice-cold ethanol twice, then remove all
ethanol and dry pellet for 2 minutes using vacuum.
10. Resuspend pellet in 20 μL Qiagen elution buffer.
11. Preform Qubit and Agilent high sensitivity ChIP to determine the quantification and
quality of proximity ligated DNA product.

55
Tagmentation by Tn5 Transposase and Zymo Purification
Reagents Required:
1. Nextera DNA Library Preparation Kit (Illumina)
2. Nuclease free water
3. Zymo Genomic DNA Clean & Concentrator Kit
Procedure:
1. Prepare the reaction system in a PCR tube as stated below, pipette mix well after each
addition:
2. Short spin the tube, incubate reaction at 55°C for 5 minutes, then at 10°C for 10 minutes.
3. Purify tagmented DNA using Zymo column as described previously.
4. Quality Control: Assay sample using Agilent Bioanalyzer and Qubit, if profile is
acceptable, repeat tagmentation reaction and purification on remainder of proximity
ligated product. Typically, 5-6 tagmentation reactions are required to obtain enough
material for a single library.
5. Combine all purified tagmentation DNA in preparation for next step.

56
Immobilization of DNA Library to Dynabeads
Reagents Required:
1. M-280 streptavidin dynabeads (Invitrogen)
2. 2 X Binding & Washing buffer
3. iBlock buffer
4. Sheared genomic DNA (500 ng / 100 uL 1 X Binding & Washing buffer)
5. 1 X Binding & Washing buffer
6. 0.5% SDS / 2 X SSC
7. EB buffer (Qiagen)
Procedure:
1. Let M280 streptavidin Dynabeads come to room temperature for 30 minutes, mix well
then take 30 μL of suspended Dynabeads into a new 1.5 mL tube.
2. Place tube on mag rack, discard supernatant and wash beads with 150 μL 2X Binding &
Washing buffer twice.
3. Resuspend beads in 100 μL iBlock Buffer, mix and incubate at RT for 45 minutes on
rotating Intelli-mixer (UU, 50 rpm).
5. When beads have finished incubating, short spin the tube and place tube on magnet rack,
discard iBlock buffer, then wash beads with 200 μL of 1X Binding and Washing buffer
twice.

57
6. Discard wash buffer, add the 100 μL genomic DNA mixture, mix well with the i-Blocked
beads, then incubate on Intelli-mixer with rotation for 30 minutes (UU, 50 rpm) at RT.
7. Discard the blocking DNA mixture, wash beads with 200 μL of 1X Binding and Washing
buffer twice.
8. Add all of fragmented DNA library product (volume in 50 μl is appropriate) to the tube,
add equal volume 2X Binding and Washing buffer, mix well, Incubate at RT for 45
minutes using Intelli-Mixer (UU, 50 rpm).
9. Short spin the tube, place tube on Magnet rack, discard supernatant, wash beads with 500
μL 0.5% SDS / 2 X SSC, five times.
10. Wash beads with 500 μL 1X Binding and Washing buffer twice, discard all the buffer,
gently resuspend immobilized DNA library on beads in 30 μL EB buffer. Store at -20 °C
or continue to next step.
PCR Amplification of DNA Library
First, only using 10 μL of beads from previous step as template, test optimum PCR cycle number
to use for library amplification. This is done in order to prepare a library with the least
redundancy (usually starting from 12 PCR cycles).
Reagents Required:
1. PCR Kit Reagents (Nextera DNA Library Preparation Kit- Illumina)
2. AMPure beads XP
3. 80% ethanol
4. TE buffer

58
Procedure:
1. Prepare the following reaction in a PCR tube:
2. Set up the following PCR program and run sample:
59
3. Allow beads to come to RT for 30 minutes before using.
4. Transfer 50 μl PCR product supernatant from the reaction tube to a new 1.5 mL tube with
magnet rack; vortex AMPure XP beads to resuspend. Add equal volume of AMPure
beads to reaction tube, pipette mix well ~10 times. Incubate mixture at RT for 5 minutes
using Intelli-Mixer (F8, 30 rpm).
5. Spin down tube briefly, place on magnetic rack and allow beads clear from solution (~3-5
minutes).
6. Discard the supernatant, add 200 μL of freshly prepared 80% ethanol to wash, carefully
discard ethanol and repeat once.
7. Remove all ethanol; leave tubes open on mag rack to air dry on the bench top for up to 10
minutes to ensure evaporation is complete.
8. Elute DNA from beads by washing with 20 μL TE Buffer.
9. Quantify concentration and determine size distribution of sample using Qubit and Agilent
2100 respectively.
10. Increase or reduce the PCR cycle number accordingly to generate sufficient quantity of
PCR product for upcoming size-selection step.
Size Selection and Sequencing of Long Read ChIA-PET Library
Refer to the blue pippin manual for detailed operation instructions of size selection. For Long
Read ChIA-PET libraries, size selection is typically done using a range of 300-500 bp. Paired-
end sequencing is then performed using 2*150bp module with the Mi-Seq 300 cycle sequencing

60
kit, Nextseq-500 300 cycle sequencing kit or Hi-seq 2500 300 cycles sequencing kit (RAPID
module).
ChIA (chromatin interaction analysis)- SMS (by Single Molecule Sequencing) ChIA-SMS:
In the ChIA (chromatin interaction analysis)- SMS (by Single Molecule Sequencing) method,
intact chromatin interaction complexes are detected allowing single molecule resolution of DNA
fragment in contact. This method allows simultaneous detection of at least two and up to eight
DNA sequences physically associated with one another in 3D nuclear space as well as detection
of the protein components of the complex (Appendix K). The ChIA-SMS method has been
developed in the following steps and is illustrated below in (Figure 14):
1. Crosslinking cells is required to allow chromatin to remain intact, permeabilization of
nuclei allows in-situ digestion, alternatively chromatin can also be successfully prepared
using sonication based methods.
2. Restriction enzyme digestion is used to generate individual chromatin complexes to allow
ligation of adapters, end blunting, and a tailing.
3. Biotinylated and fluorescently labeled adapters are ligated genome wide.
4. Chromatin complexes are bound to streptavidin coated flowcell then imaged and
sequenced using TIRF microscopy on the SeqLL single molecule sequencing platform
(Appendix L).

61
Figure 14: ChIA-SMS Protocol.
62
ChIA-SMS Cell Preparation:
GM12878 or Drosophila S2 cells are single or dual cross linked with EGS and 1% FA and stored
at -80 °C.
ChIA-SMS Adaptor Preparation (Appendix J):
1. ChIA-SMS adaptors contain a biotin modification and fluorescent labeling and
synthesized by IDT, see appendix for details of oligonucleotide design.
2. Dissolved smChIA adaptor in 1× TNE buffer at 4 °C overnight.
3. Annealed smChIA adaptor, running PAGE for quality control.
4. Diluted smChIA adaptor at 200 ng/μl for the following experiments.
Chromatin Complex Generation and Preparation:
(Optimized with: GM12878-RNAPII-ChIP)
1. RNAPII antibody bounded to protein G beads: 1 mL of protein G beads, wash with
PBS/0.1% triton-100 twice. The beads are then suspended with 7 mL of PBS/0.1% triton-
X100 and incubated at 4 °C (F1 12rpm) about 6-8 hr.
2. 1x10⁸ GM12878 were washed with RT PBS (+PI) twice.
Cell and Nuclear Lysis
1. 10 mL of 0.1%FA without triton (PI) RT for 6 min, then added 900 μl of 10% SDS, 37
°C, rotate at F1 10 rpm for 10 min, check under microscope, if not lysis well then repeat
again.

63
2. Then wash with 0.1% FA (no triton, +PI) twice, suspended in ice-cold 10ml of 0.1% FA
with triton (PI) for sonication.
3. Aliquot to tubes for sonication, optimized using program 38% 20 sec on/30 sec off 6 min,
then spin down for 5 min at 4000 rpm.
Preclearing Chromatin
1. Aliquot 1 mL of protein G beads and incubated with the Chromatin for at least 2 hours.
2. Washed RNAPII bounded antibody with 0.1%triton/PBS three times.
Immunoprecipitation
1. Discard the supernatant of antibody bounded beads and transfer the precleared chromatin
into the tube with the antibody bounded beads, incubate rotating at 4 °C overnight.
2. Take out 20 μl of chromatin for fragment size QC.
3. Wash using 0.1%FA (+PI) three times; 0.1% FA/350 mM (+PI) once; LiCl buffer once;
TE (+PI) three times.
End-blunting of Sonicated DNA Fragments
1. Wash the chromatin on beads with wash buffer and then wash with ice cold TE Buffer
(Ambion, AM9849, nuclease free).
2. Prepare T4 Polymerase master mix (in 1.2X) in the tube as stated below on ice.
64
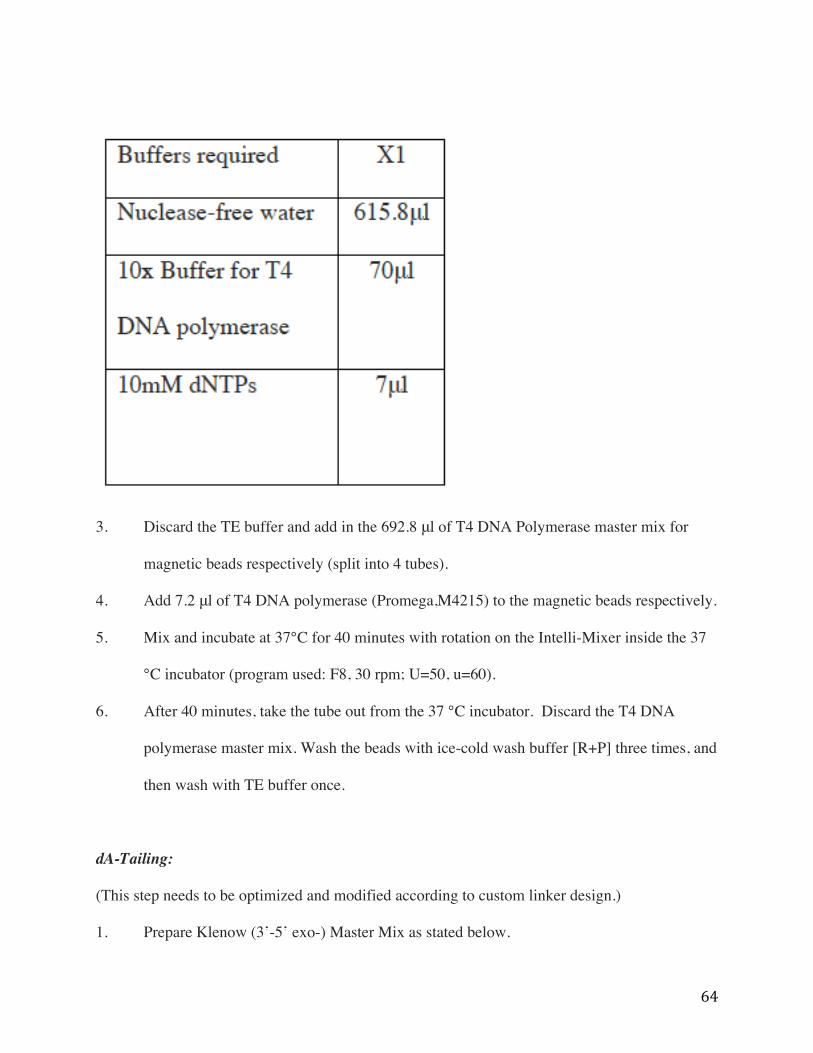
3. Discard the TE buffer and add in the 692.8 μl of T4 DNA Polymerase master mix for
magnetic beads respectively (split into 4 tubes).
4. Add 7.2 μl of T4 DNA polymerase (Promega,M4215) to the magnetic beads respectively.
5. Mix and incubate at 37°C for 40 minutes with rotation on the Intelli-Mixer inside the 37
°C incubator (program used: F8, 30 rpm; U=50, u=60).
6. After 40 minutes, take the tube out from the 37 °C incubator. Discard the T4 DNA
polymerase master mix. Wash the beads with ice-cold wash buffer [R+P] three times, and
then wash with TE buffer once.
dA-Tailing:
(This step needs to be optimized and modified according to custom linker design.)
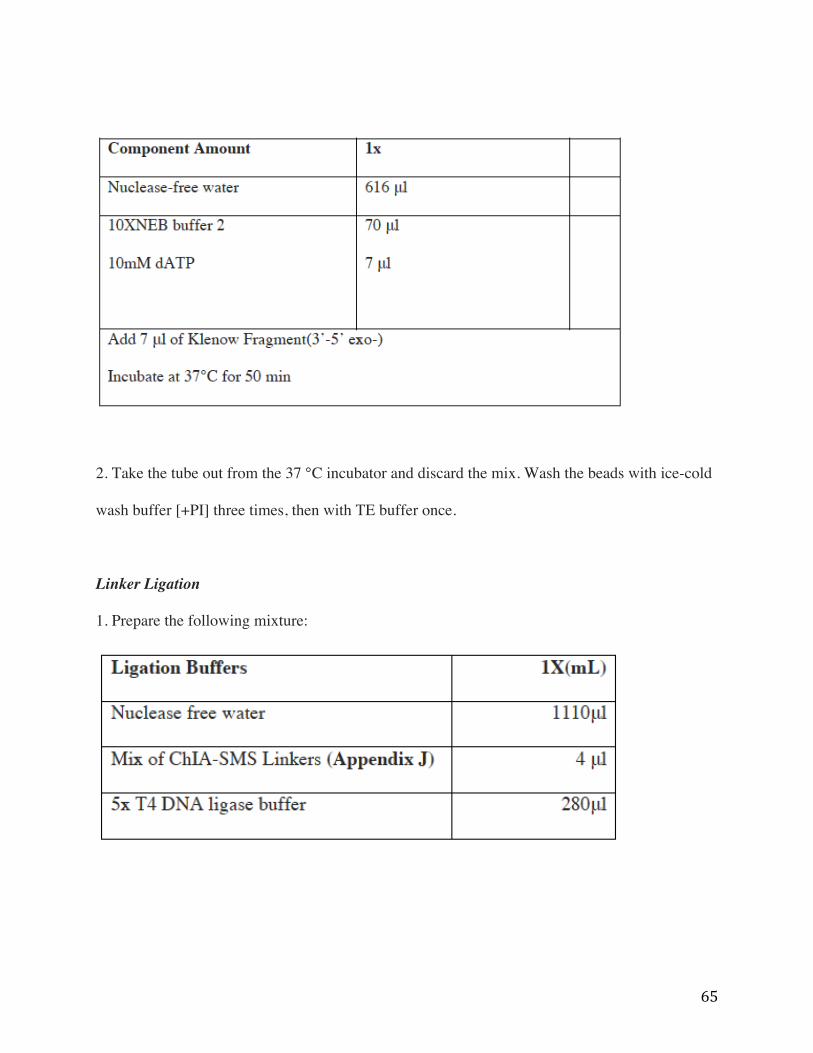
1. Prepare Klenow (3’-5’ exo-) Master Mix as stated below.
65
2. Take the tube out from the 37 °C incubator and discard the mix. Wash the beads with ice-cold
wash buffer [+PI] three times, then with TE buffer once.
Linker Ligation
1. Prepare the following mixture:
66
2. Add the mixture to the beads, mix by flicking.
3. Add 6µl T4 DNA ligase and mix by flicking followed by a short spin and light swirl.
4. Incubate at 16 °C, overnight.
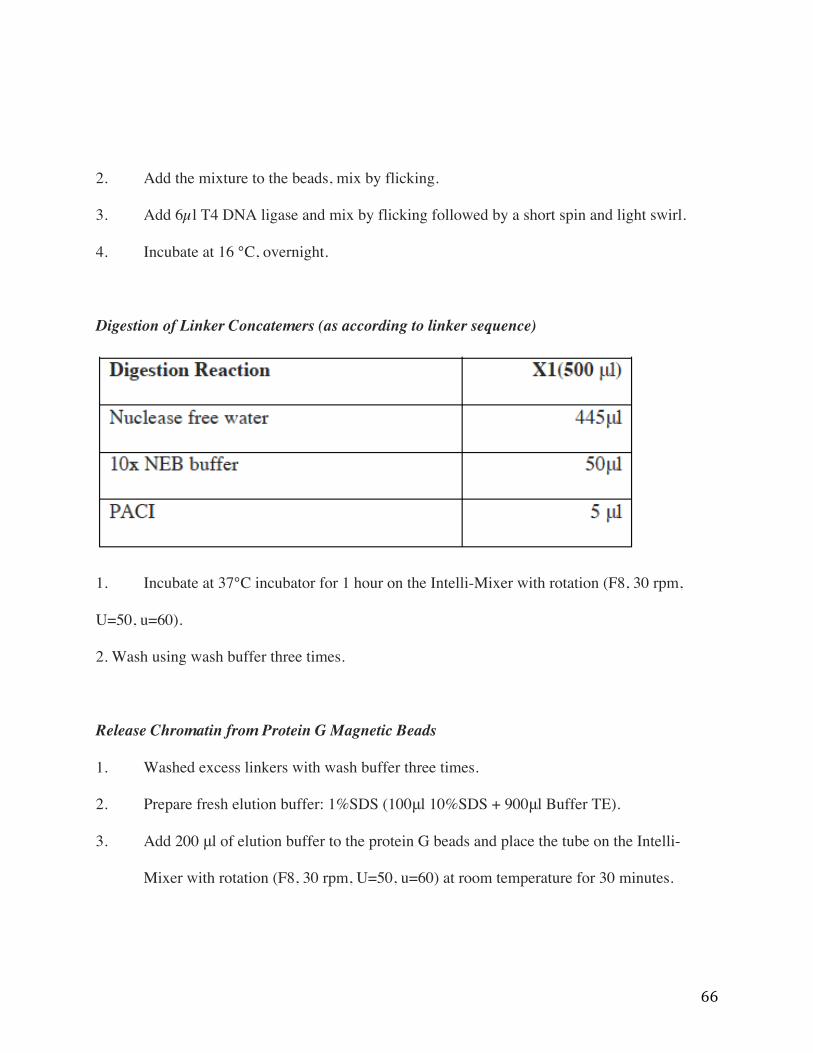
Digestion of Linker Concatemers (as according to linker sequence)
1. Incubate at 37°C incubator for 1 hour on the Intelli-Mixer with rotation (F8, 30 rpm,
U=50, u=60).
2. Wash using wash buffer three times.
Release Chromatin from Protein G Magnetic Beads
1. Washed excess linkers with wash buffer three times.
2. Prepare fresh elution buffer: 1%SDS (100μl 10%SDS + 900μl Buffer TE).
3. Add 200 μl of elution buffer to the protein G beads and place the tube on the Intelli-
Mixer with rotation (F8, 30 rpm, U=50, u=60) at room temperature for 30 minutes.
67
4. Transfer the 200 µl elution buffer-containing chromatin DNA complex from Protein G
beads to a fresh tube.
5. Quench SDS by adding 1.6% triton X-100 buffer and incubate at 37 °C for 1 hour in the
37 °C incubator.
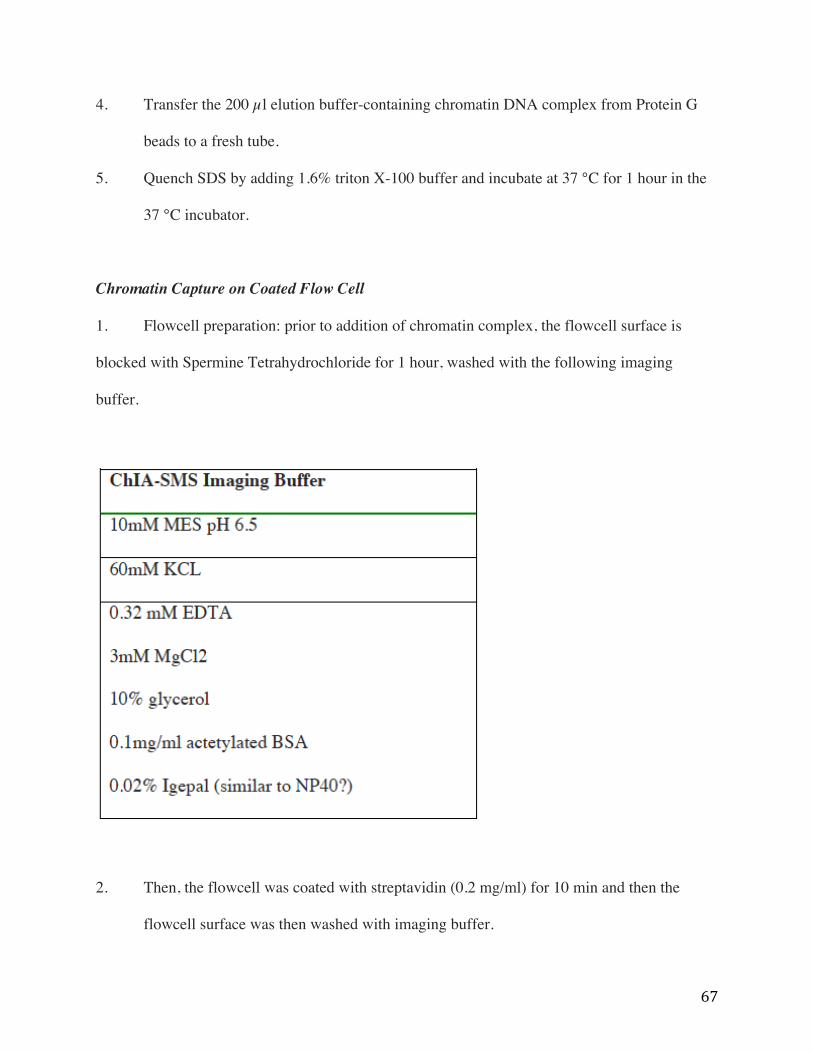
Chromatin Capture on Coated Flow Cell
1. Flowcell preparation: prior to addition of chromatin complex, the flowcell surface is
blocked with Spermine Tetrahydrochloride for 1 hour, washed with the following imaging
buffer.
2. Then, the flowcell was coated with streptavidin (0.2 mg/ml) for 10 min and then the
flowcell surface was then washed with imaging buffer.
68
3. The chromatin complexes were incubated onto the surface and allowed to hybridized
onto the flowcell.
Single Molecule Imaging
1. A customized TIRF microscope with two lasers, 532nm/75mW and 640 nm/40mW, for
fluorescence excitation (Compass 215M Cube-40C, Coherent) was used for imaging of
chromatin complexes.
2. Both laser beams were filtered through band pass filters (Chroma) and spectrally
separated by a dichroic mirror (T: 640nm, R: 532nm).
3. They then pass through the TIRF lens and total internal reflection is achieved through a
60 × TIRF oil objective with index of refraction 1.49 (Nikon), and imaged onto a CCD
camera.
4. After imaging the chromatin complex, the fluorophore labeled at the linkers is cleaved
via addition of TCEP diluted 1:10 in imaging buffer.
5. After incubation with TCEP for 10 min, the flowcell is washed with imaging buffer.
6. All positions are imaged again and residual spots excluded from further analysis (less
than 2% of spots remain).
Immunostaining
1. Antibody specificity Dot-Blot Assay: array is blocked with 4 mL of blocking buffer
(TBST containing 5% non-fat dried milk) for 4 hours. Next, array is washed 3 times with

69
TBST, and primary antibody is added. Antibody is incubated overnight for 4°C on a
rotor. Then the array is washed 3 times in TBST. Second antibody is added for 1 hour at
room temperature. Array is washed again 3 times in TBST, and signal is detected by
FlourChemQ.
2. Antibodies are diluted in imaging buffer to a final concentration of 50-100ng/ml, and
images are taken every 15 min for total incubation time of 3 hours. (For experiments
requiring imaging of more than two marks, the flowcell is washed extensively with
imaging buffer (10 washes x 5 min incubation for each wash). All positions are imaged
again and residual spots excluded from further analysis. Next, we can apply and image
the second round of antibodies as in the first round.
Single Molecule Sequencing Image Analysis
Single molecule scripts were adapted to disable fluidics while imaging flowcell for
binding and dissociated events over time.
Discussion
Here we have developed two distinct methods to detect chromatin interactions, LR-ChIA
PET and ChIA-SMS. LR ChIA-PET is currently matured and appropriate for production level
3D genome connectivity assays and for library construction. This essential protocol can be
optimized directly to decrease the current cell numbers to allow application to a wider variety of
cells and sample types. When compared directly to the original ChIA-PET method, LR-ChIA
70
PET performs better in key areas including uniquely mappable reads, uniquely mapped PETS,
and SNP coverage (Appendix G). When subject to a direct comparison with the current in situ
Hi-C method, while LR ChIA-PET knowingly requires many more cells, the number of libraries
required to generate a meaningful dataset are 2 opposed to 29 (Appendix H). Additionally, the
total number of sequence reads generated per library is a fraction of what is required for a single
Hi-C library and leads to the generation of about twice as many more chromatin loop anchors per
library.
The ChIA-SMS fundamental protocol has been developed with the capability to be
expanded to allow the detection of many thousands of chromatin complexes (each made up of
multiple molecules of DNA and protein) with application to single cells. Distinct to this method
for chromatin conformation capture, chromatin complexes are ligated in situ with blunt end
boitinylated adapters, hybridized to a streptavidin-coated substrates serving as the flowcell for
sequencing and subject to TIRF microscopy based single molecule sequencing. This method has
simultaneous detected two DNA sequences physically associated with one another in 3D nuclear
space as well as detection of the protein component of the complex. Expansion of the ChIA-SMS
method to individualized single cells (Appendix M) is anticipated to provide unique insight into
the dynamics of chromatin as mediated by regulated transcription among cells of the same type
and tissue.
While ChIA-SMS has been shown to provide a novel view of chromatin conformation
that is distinct from other methods, it should be mentioned that in order to glean meaningful
biological insight about the dynamics of high-resolution chromatin structure complementary
methods should also be developed and used in tandem. This is especially important considering
the inherently low throughput and nature of the assay design. Complementary approaches
71
should focus on automation and preservation of cellular individualization. One such approach
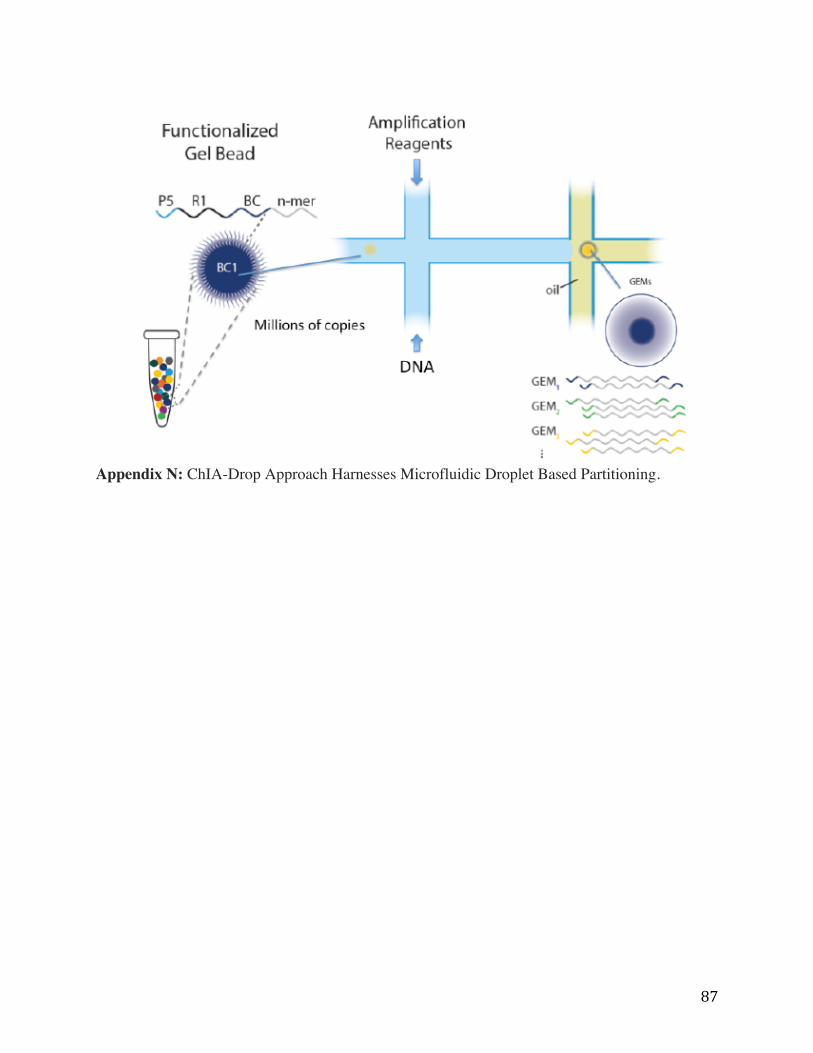
under current development is (Chromatin Interaction Analysis by droplet sequencing) ChIA-
Drop approach will utilize microfluidic droplet based partitioning and molecular barcoding to
specifically identify the sequence of interacting DNA fragments from individual chromatin
complexes (Appendix N). This approach will allow many distinct chromatin complexes from
different cells to be partitioned and analyzed in an automated and simultaneous way. In this
method, chromatin complexes are first isolated using a microfluidics device (10X Genomics’
Chromium instrument), which produces Gel Beads in Emulsion (GEMs). This platform has been
optimized for RNAseq and genome sequencing approaches, but has yet to be applied to
chromatin complexes. The microfluidics system we adopted for multi-ChIA was developed for
high molecular weight genomic DNA analysis (Zhang et al, 2017 Nature Commun.).

72
APPENDICES
73
Appendix A: CTCF Contact Domain (CCD).
74
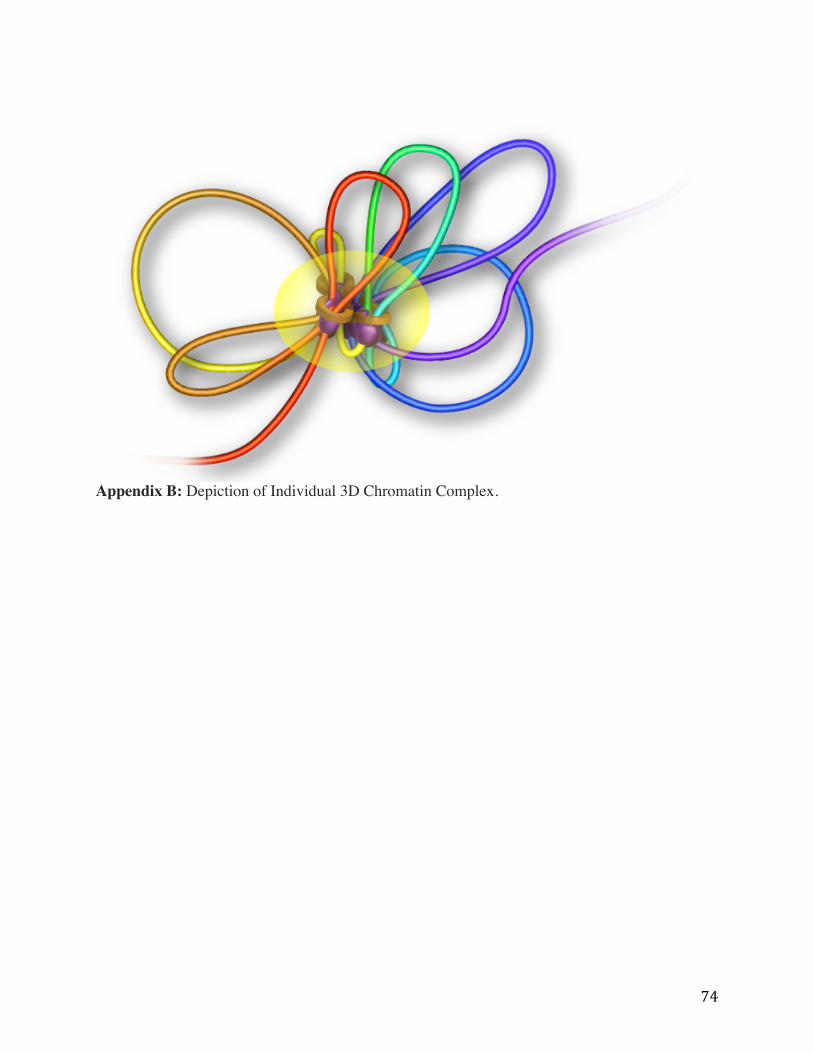
Appendix B: Depiction of Individual 3D Chromatin Complex.
75
Appendix C: ChIA-PET Library Summary Statistics for Mouse Cortical Neuron RNAPII Libraries.
76
Appendix D: Conservation of mir132 Genomic Locus.
77
Appendix E: Single Cell Imaging Validates ChIA-PET Identified Allele Specific 3D Chromatin Interactions.

78
Appendix F: Data Processing Steps and Data Features of LR ChIA-PET Libraries.
79
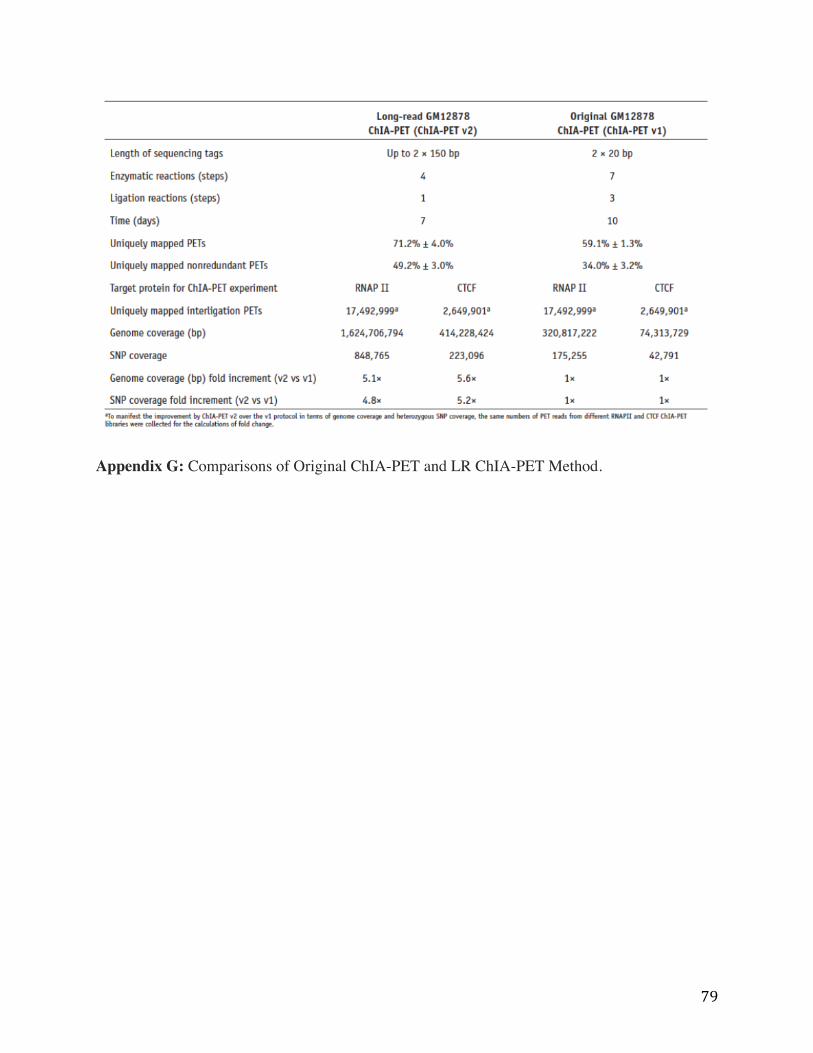
Appendix G: Comparisons of Original ChIA-PET and LR ChIA-PET Method.
80
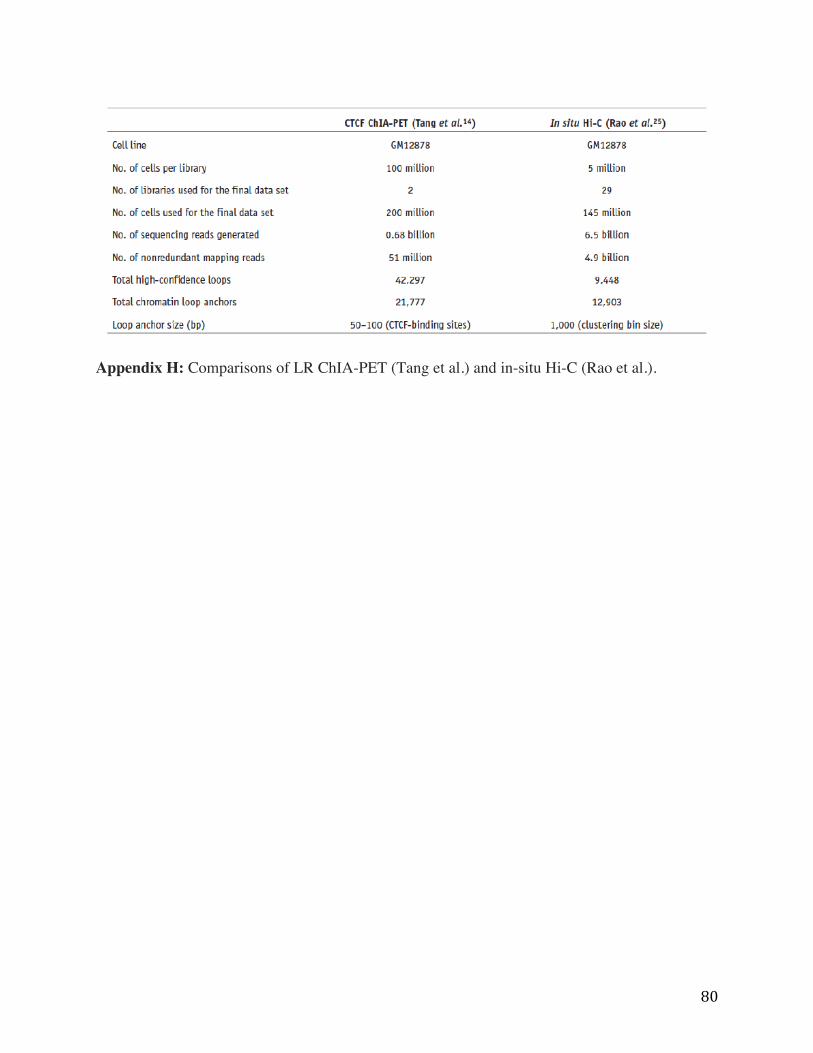
Appendix H: Comparisons of LR ChIA-PET (Tang et al.) and in-situ Hi-C (Rao et al.).
81
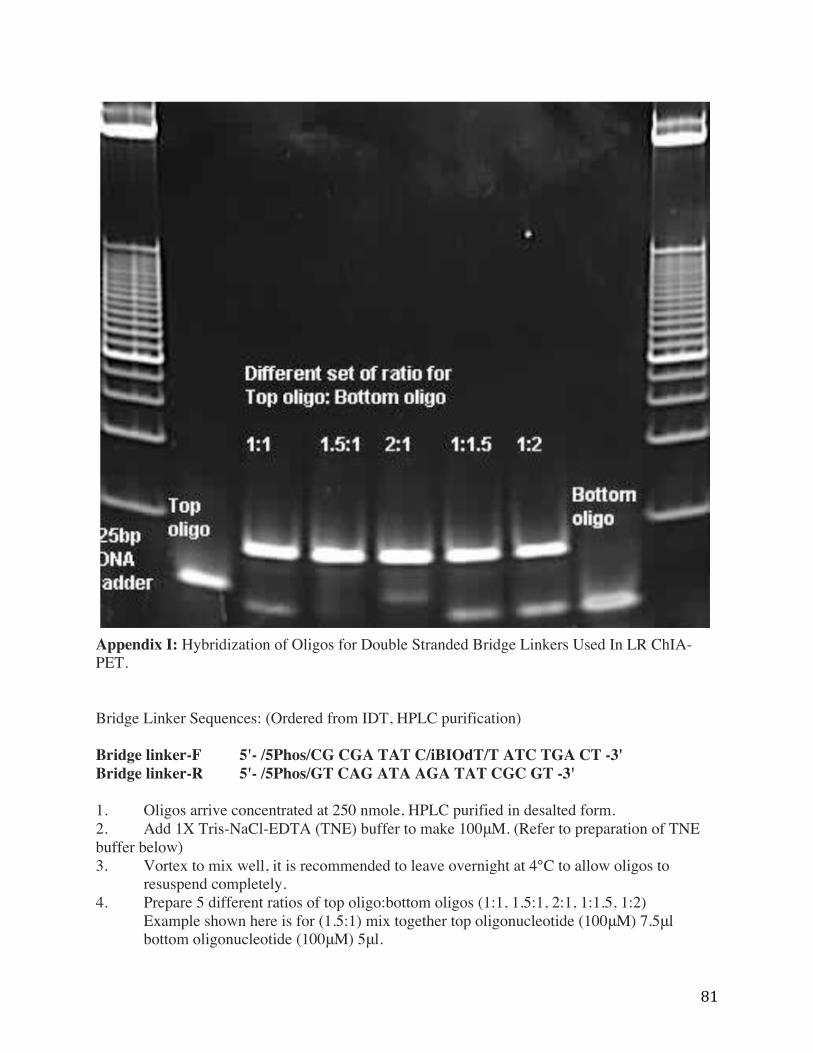
Appendix I: Hybridization of Oligos for Double Stranded Bridge Linkers Used In LR ChIA-PET. Bridge Linker Sequences: (Ordered from IDT, HPLC purification) Bridge linker-F 5'- /5Phos/CG CGA TAT C/iBIOdT/T ATC TGA CT -3' Bridge linker-R 5'- /5Phos/GT CAG ATA AGA TAT CGC GT -3' 1. Oligos arrive concentrated at 250 nmole, HPLC purified in desalted form. 2. Add 1X Tris-NaCl-EDTA (TNE) buffer to make 100μM. (Refer to preparation of TNE buffer below) 3. Vortex to mix well, it is recommended to leave overnight at 4°C to allow oligos to
resuspend completely. 4. Prepare 5 different ratios of top oligo:bottom oligos (1:1, 1.5:1, 2:1, 1:1.5, 1:2)
Example shown here is for (1.5:1) mix together top oligonucleotide (100μM) 7.5μl bottom oligonucleotide (100μM) 5μl.
82
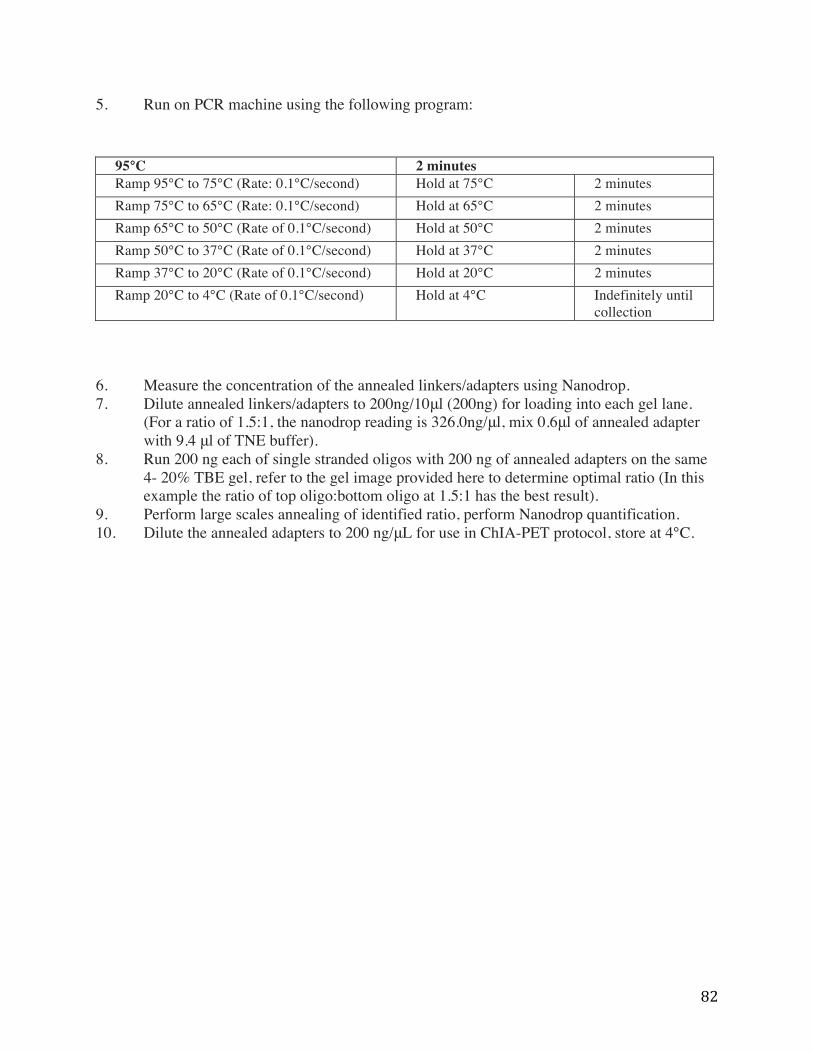
5. Run on PCR machine using the following program:
6. Measure the concentration of the annealed linkers/adapters using Nanodrop. 7. Dilute annealed linkers/adapters to 200ng/10μl (200ng) for loading into each gel lane.
(For a ratio of 1.5:1, the nanodrop reading is 326.0ng/μl, mix 0.6μl of annealed adapter with 9.4 μl of TNE buffer).
8. Run 200 ng each of single stranded oligos with 200 ng of annealed adapters on the same 4- 20% TBE gel, refer to the gel image provided here to determine optimal ratio (In this example the ratio of top oligo:bottom oligo at 1.5:1 has the best result).
9. Perform large scales annealing of identified ratio, perform Nanodrop quantification. 10. Dilute the annealed adapters to 200 ng/μL for use in ChIA-PET protocol, store at 4°C.
95°C 2 minutes Ramp 95°C to 75°C (Rate: 0.1°C/second) Hold at 75°C 2 minutes Ramp 75°C to 65°C (Rate: 0.1°C/second) Hold at 65°C 2 minutes Ramp 65°C to 50°C (Rate of 0.1°C/second) Hold at 50°C 2 minutes Ramp 50°C to 37°C (Rate of 0.1°C/second) Hold at 37°C 2 minutes Ramp 37°C to 20°C (Rate of 0.1°C/second) Hold at 20°C 2 minutes Ramp 20°C to 4°C (Rate of 0.1°C/second) Hold at 4°C Indefinitely until
collection

83
Appendix J: ChIA-SMS Bridged Linker Oligonucleotide Design.
84
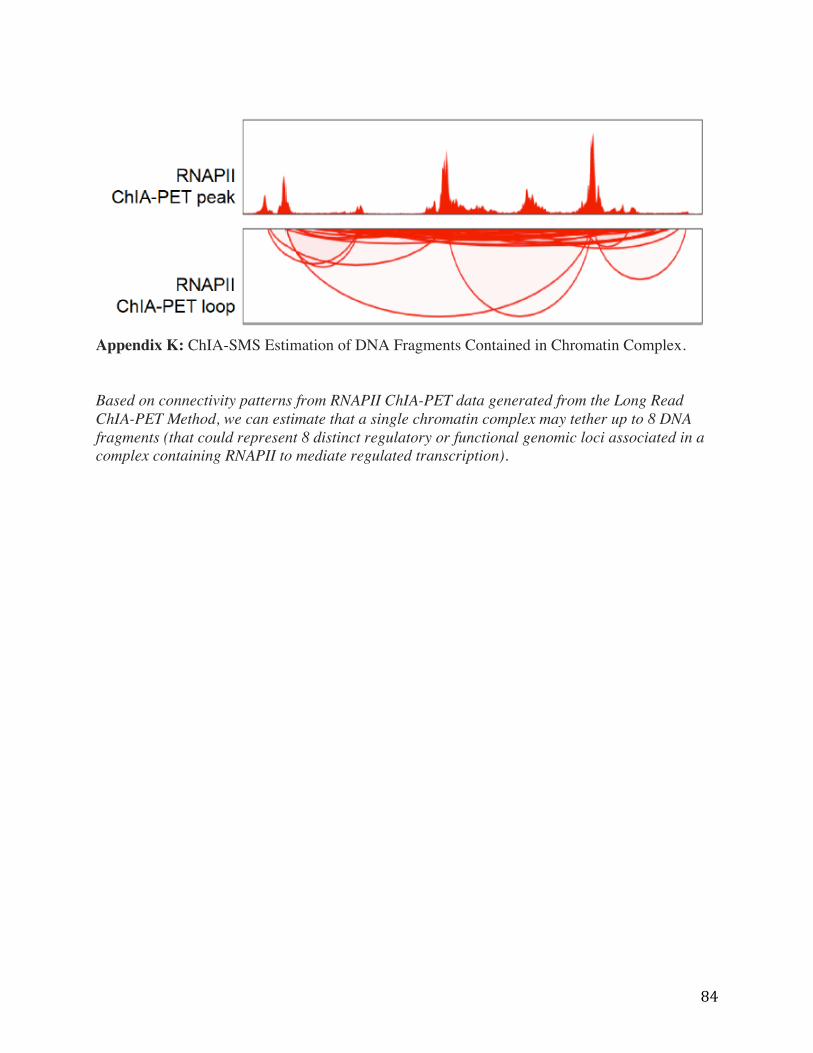
Appendix K: ChIA-SMS Estimation of DNA Fragments Contained in Chromatin Complex. Based on connectivity patterns from RNAPII ChIA-PET data generated from the Long Read ChIA-PET Method, we can estimate that a single chromatin complex may tether up to 8 DNA fragments (that could represent 8 distinct regulatory or functional genomic loci associated in a complex containing RNAPII to mediate regulated transcription).
85
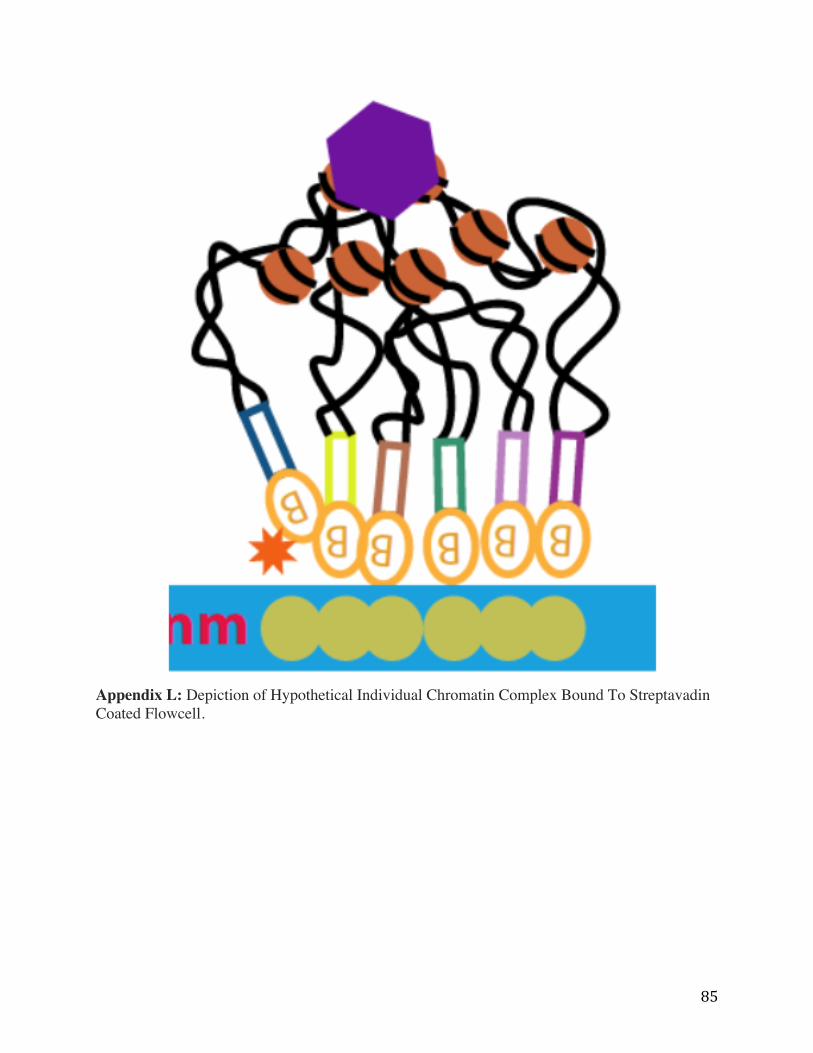
Appendix L: Depiction of Hypothetical Individual Chromatin Complex Bound To Streptavadin Coated Flowcell.
86
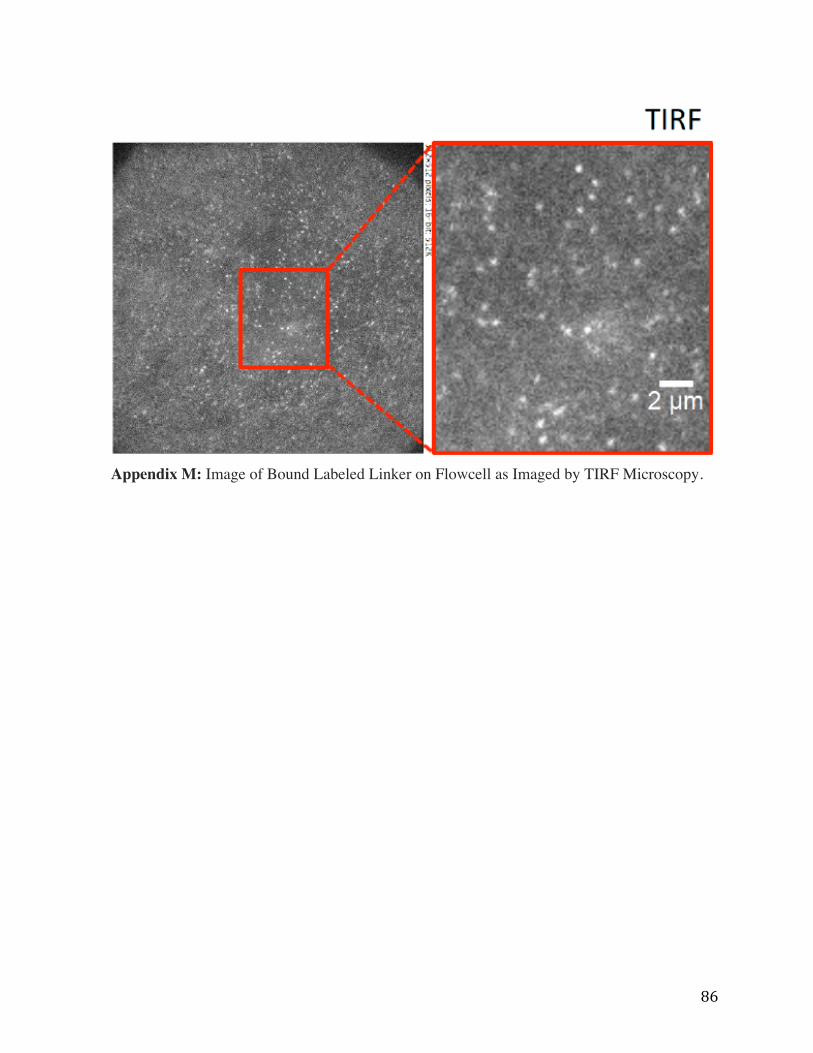
Appendix M: Image of Bound Labeled Linker on Flowcell as Imaged by TIRF Microscopy.
87
Appendix N: ChIA-Drop Approach Harnesses Microfluidic Droplet Based Partitioning.

88
REFERENCES Aguado et al. (2009) The CREB/CREM transcription factors negatively regulate early
synaptogenesis and spontaneous network activity. J. Neurosci. PMID: 19144833 Allen et al. (2015) Late-onset Alzheimer disease risk variants mark brain regulatory loci
Neurology Genetics PMID: 27066552 Benito & Barco. (2015) The Neuronal Activity-Driven Transcriptome. Mol. Neurobiology
PMID: 24935719 Björkblom et al. (2012) c-Jun N-terminal kinase phosphorylation of MARCKSL1 determines
actin stability and migration in neurons and in cancer cells. MCB. PMID: 22751924 Bonev el al. (2017) Multiscale 3D Genome Rewiring during Mouse Neural Development. Cell
PMID: 29053968 Bonev & Cavalli. (2016) Organization and function of the 3D genome. Nature Reviews Genetics
PMID: 27739532 Brandler et al. (2018) Paternally inherited cis regulatory structural variants are associated with
autism. Science PMID: 29674594 Chaundhry et al. (2015) Genetic variation in imprinted genes is associated with risk of late-onset
Alzheimer's disease. J Alzheimers Dis. PMID: 25391383 Chen et al. (2003) Derepression of BDNF transcription involves calcium-dependent
phosphorylation of MeCP2. Science PMID: 14593183 Dixon et al. (2012) Topological Domains in Mammalian Genomes Identified by Analysis of
Chromatin Interactions. Nature PMID: 22495300 Dixon et al. (2015) Chromatin architecture reorganization during stem cell differentiation.
Nature PMID: 25693564 Dobin et al. (2013) STAR: ultrafast universal RNA-seq aligner. Bioinformatics PMID: 23104886 Durand et al. (2016) Juicebox Provides a Visualization System for Hi-C Contact Maps with
Unlimited Zoom. Cell Syst. PMID: 27467250 Flavell & Greenburg. (2009) Signaling Mechanisms Linking Neuronal Activity to Gene
Expression and Plasticity of the Nervous System. Annual Rev Neuro. PMID: 18558867 Fortin & Hansen. (2015) Reconstructing A/B compartments as revealed by Hi-C using long-
range correlations in epigenetic data. Genome Biol. PMID: 26316348
89
Frasier et al. (2015) Hierarchical folding and reorganization of chromosomes are linked to transcriptional changes in cellular differentiation. Mol Sys Bio. PMID: 26700852
Fullwood et al. (2009) An oestrogen-receptor-alpha-bound human chromatin interactome.
Nature PMID: 19890323 Fullwood et al (2010) Chromatin interaction analysis using paired-end tag sequencing. Curr
Protoc Mol Biol PMID: 20069536 Greenburg et al. (1986) Stimulation of neuronal acetylcholine receptors induces rapid gene
transcription. Science PMID: 3749894 Greer & Greenberg. (2008) From Synapse to Nucleus: Calcium-Dependent Gene Transcription
in the Control of Synapse Development and Function. Neuron PMID: 18817726 Guo et al. (2014) Expression of p-CREB and activity-dependent miR-132 in temporal lobe
epilepsy. Int J Clin Exp Med PMID: 24995086 Hartley & Mulliken (2015) QoRTs: a comprehensive toolset for quality control and data
processing of RNA-Seq experiments. BMC Bioinformatics PMID: 26187896 Hu & Tee. (2017) Enhancers and chromatin structures: regulatory hubs in gene expression and
diseases. Bioscience Reports PMID: 28351896 Ito et al. (2014) Loss of neuronal 3D chromatin organization causes transcriptional and
behavioural deficits related to serotonergic dysfunction. Nature Communications. PMID: 25034090
Ji et al. (2016) “3D Chromosome Regulatory Landscape of Human Pluripotent Cells” Cell Stem
Cell PMID: 26686465 Johnson et al. (2017) Biotin tagging of MeCP2 in mice reveals contextual insights into the Rett
syndrome transcriptome. Nature Medicine PMID: 28920956 Kehayova et al. (2011) Regulatory elements require for the activation and repression of the
protocadherin a gene cluster. PNAS PMID: 21949399 Kim et al. (2010) Widespread transcription at neuronal activity-regulated enhancers. Nature
PMID: 20393465 Kim et al. (2018) Remote Memory and Cortical Synaptic Plasticity Require Neuronal CCCTC-
Binding Factor (CTCF). J Neuroscience PMID: 29712785 Klein et al. (2007) Homeostatic regulation of MeCP2 expression by a CREB-induced
microRNA. Nature Neuroscience PMID: 17994015
90
Li et al. (2010) ChIA-PET tool for comprehensive chromatin interaction analysis with paired-end tag sequencing. Genome Biol. PMID: 20181287
Li et al. (2012) Extensive promoter-centered chromatin interactions provide a topological basis
for transcription regulation. Cell PMID: 22265404 Li et al. (2017) Long-read ChIA-PET for base-pair-resolution mapping of haplotype-specific
chromatin interactions. Nat Protoc. PMID: 28358394 Lieberman-Aiden et al. (2009) Comprehensive mapping of long range interactions reveals
folding principles of the human genome. Science PMID: 19815776 Lim et al. (2017) Rates, distribution and implications of postzygotic mosaic mutations in autism spectrum disorder. Nature Neuroscience PMID: 28714951 Lin et al. (2008) Activity-dependent regulation of inhibitory synapse development by Npas4.
Nature PMID: 18815592 Lupianez et al. (2016) Disruptions of Topological Chromatin Domains Cause Pathogenic
Rewiring of Gene-Enhancer Interactions. Cell PMID: 25959774 Malik et al. (2014) Genome-wide identification and characterization of functional neuronal
activity-dependent enhancers. Nature Neuroscience PMID: 25195102 Martinowich et al. (2003) DNA Methylation–Related Chromatin Remodeling in Activity-
Dependent Bdnf Gene Regulation. Science PMID: 14593184 Ng et al. (2017) An xQTL map integrates the genetic architecture of the human brain's
transcriptome and epigenome. Nature Neuroscience PMID: 28869584 Nora et al. (2013) Segmental folding of chromosomes: A basis for structural and regulatory
chromosomal neighborhoods? Bioessays PMID: 23832846 Nord et al. (2014) Rapid and Pervasive Changes in Genome-wide Enhancer Usage during
Mammalian Development. Cell PMID: 24360275 Norton & Philips-Cremens. (2017) Crossed wires: 3D genome misfolding in human disease.
JCB. PMID: 28855250 O’Roak (2011) Exome sequencing in sporadic autism spectrum disorders identifies severe de
novo mutations. Nature Genetics PMID: 21572417 Parikshak et al. (2016) Genome-wide changes in lncRNA, splicing, and regional gene expression
patterns in autism. Nature PMID: 27919067
91
Parra-Damas et al. (2017) CRTC1 mediates preferential transcription at neuronal activity-regulated CRE/TATA promoters. Scientific Reports PMID: 29269871
Peric-Hupkes et al. (2010) Molecular Maps of the Reorganization of Genome-Nuclear Lamina
Interactions during Differentiation. Cell PMID: 20513434 Pombo & Dillon. (2015) Three-dimensional genome architecture: players and mechanisms.
Nature Reviews PMID: 25757416 Rao et al. (2014) A 3D map of the human genome at kilobase resolution reveals principles of
chromatin looping. Cell PMID: 25497547 Rhee et al. (2016) Expression of Terminal Effector Genes in Mammalian Neurons Is Maintained
by a Dynamic Relay of Transient Enhancers. Neuron PMID: 27939581 Sams et al. (2016) Neuronal CTCF Is Necessary for Basal and Experience-Dependent Gene
Regulation, Memory Formation, and Genomic Structure of BDNF and Arc. Cell Reports PMID: 27880914
Scandagila et al. (2017) Loss of Kdm5c Causes Spurious Transcription and Prevents the Fine-
Tuning of Activity-Regulated Enhancers in Neurons. Cell Reports PMID: 28978483 Sexton et al. (2012) Three-dimensional folding and functional organization principles of the
Drosophila genome. Cell PMID: 22265598 Shema et al. (2016) Single-molecule decoding of combinatorially modified nucleosomes.
Science PMID:27151869 Shen et al. (2012) A map of the cis-regulatory sequences in the mouse genome. Nature PMID:
22763441 Short et al. (2018) De novo mutations in regulatory elements in neurodevelopmental disorders.
Nature PMID: 29562236 Spiegel et al. (2014) Npas4 Regulates Excitatory-Inhibitory Balance within Neural Circuits
through Cell-Type-Specific Gene Programs. Cell PMID: 24855953 Stamatoyannopoulous et al. (2012) An encyclopedia of mouse DNA elements (Mouse
ENCODE). Genome Biology PMID: 22889292 Stevens et al. (2017) 3D structures of individual mammalian genomes studied by single-cell Hi-
C. Nature PMID: 28289288 Su et al. (2017) Neuronal activity modifies the chromatin accessibility landscape in the adult
brain. Nature Neuroscience PMID: 28166220
92
Sun & Lin. (2016) Npas4: Linking Neuronal Activity to Memory. Trends in Neuroscience PMID: 26987258
Tang et al. (2015) CTCF-Mediated Human 3D Genome Architecture Reveals Chromatin
Topology for Transcription. Cell PMID: 26686651 Walczak et al. (2013) Novel higher-order epigenetic regulation of the Bdnf gene upon seizures. J
Neurosci. PMID: 23392678 Watson & Tsai. (2017) In the loop: how chromatin topology links genome structure to function
in mechanisms underlying learning and memory. Curr Opinion Neurobiology PMID: 28024185
West et al. (2001) Calcium regulation of neuronal gene expression. PNAS PMID: 11572963 Wilken et al. (2015) DNase I hypersensitivity analysis of the mouse brain and retina identifies
region-specific regulatory elements. Epignentics & Chromatin PMID: 25972927 Yang et al. (2016) Chromatin remodeling inactivates activity dependent genes and regulates
neural coding. Science PMID: 27418512 Yue et al. (2014) A comparative encyclopedia of DNA elements in the mouse genome. Nature
PMID: 25409824 Zhang et al. (2008) Model-based analysis of ChIP-Seq (MACS). Genome Biology PMID:
18798982 Zheng et al. (2017) Massively parallel digital transcriptional profiling of single cells. Nature
Commun. PMID: 28091601 _____________________________________________________________________________