3d facial soft tissue changes due to orthodontic tooth movement
TRANSCRIPT
2
3D Facial Soft Tissue Changes Due to Orthodontic Tooth Movement
R.A. Al-Sanea1, B. Kusnoto2 and C.A. Evans2 1Department of Dentistry-Central Region,
National Guards Health Affairs 2Department of Orthodontics,
University of Illinois at Chicago 1Kingdom of Saudi Arabia
2USA
1. Introduction
Two-dimensional (2D) geometric morphometric analysis is the predominant basis for assessment of changes in facial structures resulting from orthodontic or orthognathic surgical treatment. Linear, angular and proportional 2D measurements of the profile are used to assess changes that take place in the three-dimensional (3D) facial soft tissues. However, these methods give little information about frontal soft tissue changes following treatment. Since patients tend to assess their appearance from frontal and three-quarter profile views, measurement of orthodontic outcomes only in the sagittal view as recorded in 2D lateral cephalograms or profile photographs may not be sufficiently informative. Cone Beam Computerized Tomography (CBCT) as well as 3D surface laser head scans offer better frontal and three-quarter profile data for diagnosis, treatment planning and patient education purposes. However, these 3D methods result in large computer files that require large virtual memory and storage media. Moreover, due to lack of normative 3D databases, the 3D images produced can only provide descriptive rather than geometric data of clinical significance. This chapter outlines the current methods used for morphometric assessment of facial soft tissues and their applications and limitations in the field of orthodontics. A simple and accurate method for the assessment of 3D changes occurring in facial soft tissues due to orthodontic tooth movement is explained. Finally, volumetric changes occurring after orthodontic tooth movement due to soft tissue profile advancement or soft tissue profile retraction are outlined.
2. Two-dimensional morphometrics of facial soft tissues
2.1 Two-dimensional imaging
Frontal and lateral photographs and anthropometric measurements along with lateral and
frontal cephalometrics are considered the standard records for diagnosis and treatment
planning in orthodontic treatment. Two-dimensional geometric morphometrics such as
linear, angular and proportional measurements are used to assess changes that take place in
www.intechopen.com
Orthodontics – Basic Aspects and Clinical Considerations
30
facial soft tissues. Research including frontal and lateral photographs has shown that some
soft tissue measurements tend to be more reliable than others. In general, frontal
measurements are more reliable than lateral ones, and linear measurements are more
reliable than angular measurements. Measurements that include subnasale, pogonion, and
gnathion tend to be less reliable. Despite the fact that much of the reported evidence in the
scientific literature is built around two-dimensional measurements, a substantial amount of
information is lacking because:
a. Three-dimensional structures are represented by a set of two-dimensional coordinates. Subject/film/focus geometric relationship could lead to size magnification, distortion, vertical and horizontal displacement in relation to imaging source.
b. Patients tend to assess their appearance from frontal and three-quarter profile views; measurement of orthodontic outcomes only in the sagittal view as recorded in 2D lateral cephalograms or profile photographs may not be sufficiently informative. An example of that would be surgical orthognathic patients who can relate to malar region changes or mandibular angle and soft tissue chin changes rather than lip profile and incisor position.
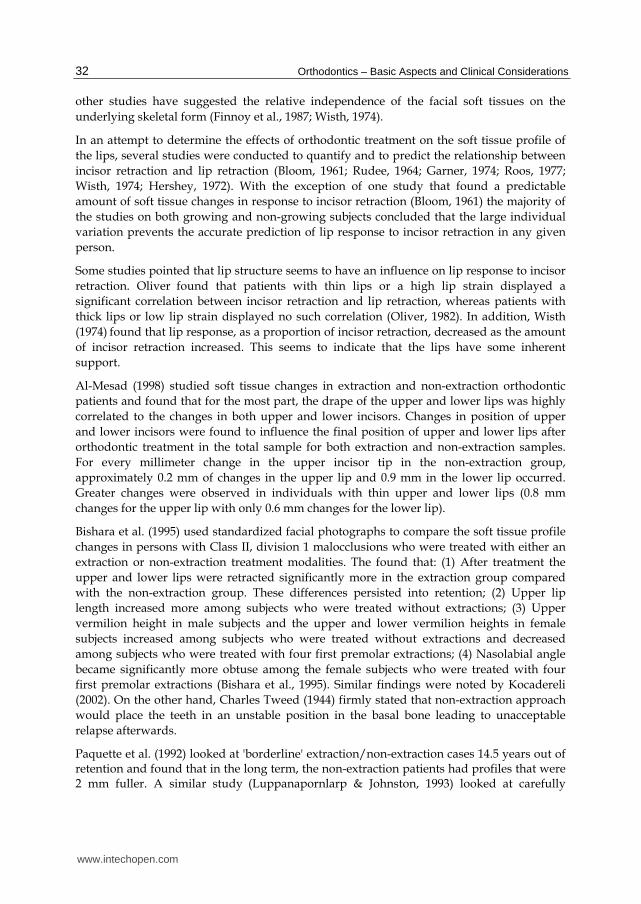
c. For pre-treatment consultation or education sessions, and for discussion purposes, patients tend to describe the soft tissue of the face pointing at vermillion border and philtrum of lips and soft tissue facial folds rather than describing landmarks and linear measurements (Figure 1). The facial folds are skin folds or lines that become accentuated with facial expressions. The most significant factors that contribute to the prominence of the folds are excess skin, skin thinning, excess cheek fat, and ptosis of cheek fat. Many research studies are conducted in the field of plastic and cosmetic surgery on changes that take place in the facial folds with aging and with weight loss or weight gain. Since orthodontic tooth movement contributes to soft tissue profile advancement or retraction, in other words thinning or thickening of soft tissue around the lips as a result of tooth movement, then it would be only practical to borrow these terms for the purpose of patient education and treatment planning in the field of orthodontics.
Fig. 1. Facial folds.
www.intechopen.com

3D Facial Soft Tissue Changes Due to Orthodontic Tooth Movement
31
2.2 Two-dimensional morphometric analysis of facial soft tissues
When superimposing different faces, a limited number of labeled points on each face, e.g.,
the tip of the nose, corner of the eye and less prominent points on the cheek must be located
precisely (Farkas, 1987). Linear and angular measurements between the landmarks provide
useful measurements for comparison. The number of reported manually labeled landmarks
varies, but usually ranges from 50 to 300 as shown in Figure 2 (O’Toole et al., 1999; Clement
& Marks, 2005). Only a correct alignment of all these points allows acceptable comparison
between faces, intermediate morphs, a convincing mapping of motion data from the
reference or initial treatment image into final treatment image.
Fig. 2. Soft tissue landmarks of the face (Source: Computer-Graphic Facial Reconstruction, Clement & Murray, eds., p. 114, Figure 6.3).
2.3 Facial soft tissue changes in studies utilizing two-dimensional images
There is controversy in the orthodontic literature regarding the correlation between
craniofacial skeletal and soft-tissue profile form (Denis & Speidel, 1987; Bloom, 1961; Burke,
1983; Savara, 1965). For instance, although stereophotogrammetric (Savara, 1965; Burke,
1983; Peck & Peck, 1995), computed tomographic (Marsh & Vannier, 1983; Moss et al., 1987)
and cephalometric studies (Riedel, 1950; Tweed, 1944) have indicated soft-tissue profile
form is markedly influenced by orthodontic tooth movement and or orthognathic surgery,
www.intechopen.com
Orthodontics – Basic Aspects and Clinical Considerations
32
other studies have suggested the relative independence of the facial soft tissues on the
underlying skeletal form (Finnoy et al., 1987; Wisth, 1974).
In an attempt to determine the effects of orthodontic treatment on the soft tissue profile of
the lips, several studies were conducted to quantify and to predict the relationship between
incisor retraction and lip retraction (Bloom, 1961; Rudee, 1964; Garner, 1974; Roos, 1977;
Wisth, 1974; Hershey, 1972). With the exception of one study that found a predictable
amount of soft tissue changes in response to incisor retraction (Bloom, 1961) the majority of
the studies on both growing and non-growing subjects concluded that the large individual
variation prevents the accurate prediction of lip response to incisor retraction in any given
person.
Some studies pointed that lip structure seems to have an influence on lip response to incisor
retraction. Oliver found that patients with thin lips or a high lip strain displayed a
significant correlation between incisor retraction and lip retraction, whereas patients with
thick lips or low lip strain displayed no such correlation (Oliver, 1982). In addition, Wisth
(1974) found that lip response, as a proportion of incisor retraction, decreased as the amount
of incisor retraction increased. This seems to indicate that the lips have some inherent
support.
Al-Mesad (1998) studied soft tissue changes in extraction and non-extraction orthodontic
patients and found that for the most part, the drape of the upper and lower lips was highly
correlated to the changes in both upper and lower incisors. Changes in position of upper
and lower incisors were found to influence the final position of upper and lower lips after
orthodontic treatment in the total sample for both extraction and non-extraction samples.
For every millimeter change in the upper incisor tip in the non-extraction group,
approximately 0.2 mm of changes in the upper lip and 0.9 mm in the lower lip occurred.
Greater changes were observed in individuals with thin upper and lower lips (0.8 mm
changes for the upper lip with only 0.6 mm changes for the lower lip).
Bishara et al. (1995) used standardized facial photographs to compare the soft tissue profile
changes in persons with Class II, division 1 malocclusions who were treated with either an
extraction or non-extraction treatment modalities. The found that: (1) After treatment the
upper and lower lips were retracted significantly more in the extraction group compared
with the non-extraction group. These differences persisted into retention; (2) Upper lip
length increased more among subjects who were treated without extractions; (3) Upper
vermilion height in male subjects and the upper and lower vermilion heights in female
subjects increased among subjects who were treated without extractions and decreased
among subjects who were treated with four first premolar extractions; (4) Nasolabial angle
became significantly more obtuse among the female subjects who were treated with four
first premolar extractions (Bishara et al., 1995). Similar findings were noted by Kocadereli
(2002). On the other hand, Charles Tweed (1944) firmly stated that non-extraction approach
would place the teeth in an unstable position in the basal bone leading to unacceptable
relapse afterwards.
Paquette et al. (1992) looked at 'borderline' extraction/non-extraction cases 14.5 years out of retention and found that in the long term, the non-extraction patients had profiles that were 2 mm fuller. A similar study (Luppanapornlarp & Johnston, 1993) looked at carefully
www.intechopen.com
3D Facial Soft Tissue Changes Due to Orthodontic Tooth Movement
33
selected and defined first premolar-extraction cases and non-extraction cases over the same post-retention time frame. The results indicated that the extraction of first premolars tended to flatten the profile by 2-3 mm when compared with non-extraction treatment. Interestingly, the non-extraction patients had the more concave faces post-treatment and this challenges the concept of extractions as part of orthodontic treatment 'dishing the face'. The ability to predict from post-treatment lateral photographs, whether individuals had been treated with or without extractions has been investigated (Boley et al., 1998) The findings indicated a correct response in only 54% of cases - just greater than pure chance.
In a sample of forty adult patients who underwent orthodontic treatment that resulted in
either soft tissue profile retraction or soft tissue profile advancement, Al-Sanea, Kusnoto and
Evans (Al-Sanea, 2007) studied linear changes occuring in cephalometric soft tissue
landmarks: Sn, A, UL, LL, B. Patient selection was based on the following criteria:
availability of pre-treatment and post-treatment lateral cephalometric radiographs;
availability of acceptable clarity pre-treatment and post-treatment frontal and lateral
photographs with lips closed or slightly touching without strain and the patient’s head
properly oriented in the three planes of space; and absence of facial hair, eye glasses or
jewelry. The following criteria were added as part of the study design to minimize
undesirable soft tissue facial changes:
1. Any patient with lip incompetence of more than 2 millimeters was excluded as this interfered later on with the morphing procedure in FaceGen™ Modeller 3.1 (Singular Inversions, Toronto, ON, Canada, 2005).
2. Diminished growth with a minimum pre-treatment age of sixteen years for females and eighteen years for males.
3. Absence of craniofacial anomalies or significant skeletal discrepancy. 4. Treatment modalities included fixed appliance therapy with no orthognathic surgical
treatment involved in any case. 5. No measurable weight gain or weight loss changes instead of treatment related soft
tissue change as determined from interzygomatic width and submental soft tissue
which were compared between the pre-treatment and post-treatment frontal
photographs after image resizing is carried out in Adobe Photoshop™ software (Adobe
System Inc., San Jose, CA, 2005).
In all 2D landmark measurements (Figure 3), a negative soft tissue change was observed in
the soft tissue profile retraction group. The opposite was observed in the group that showed
advancement of the soft tissue profile. In the profile retraction group, change was the
greatest in the upper lip and lower lips (-1.68 and –1.58 mm). Similarly, the most change in
the profile advancement group was observed in upper and lower lip and Sn (0.73, 0.85 and
0.86) (Table 1).
In this sample of patients, the overall soft tissue change in the profile retraction group was
significantly greater in comparison to the change reported in the profile advancement group
in all 2D landmarks (p<0.05). The highest difference in 2D measurements between the two
groups was noted in the upper and lower lip (2.40 and 2.42 mms) followed by change at SfB
(1.95 mm), followed by change at Sn (1.75 mm) and SfA (1.36 mm). Lack of change at SfA in
the soft tissue profile advancement group was the reason why change at SfA was the lowest
in comparison to other 2D measurements (Table 2).
www.intechopen.com

Orthodontics – Basic Aspects and Clinical Considerations
34
Fig. 3. 2D landmarks of soft tissue profile.
Retraction Group Advancement Group
Measurements N Mean ± SD (mm) Measurements N Mean ± SD (mm)
2D-Sn 2D-SfA 2D-UL 2D-LL 2D-SfB
20 20 20 20 20
-0.89 ± 1.58 -0.78 ± 2.14 -1.68 ± 1.80 -1.58 ± 2.44 -1.30 ± 2.09
2D-Sn 2D-SfA 2D-UL 2D-LL 2D-SfB
20 20 20 20 20
0.86 ± 1.65 0.58 ± 1.96 0.73 ± 2.38 0.85 ± 2.63 0.65 ± 2.24
* p ≤0.05
Table 1. Means and standard deviations for linear horizontal changes in the soft tissue profile groups.
Measurements Mean
Difference (mm)
Student t -value
p-value*
2D-Sn 2D-SfA 2D-UL 2D-LL 2D-SfB
-1.75 -1.36 -2.40 -2.42 -1.95
-3.42 -2.09 -3.60 -3.02 -2.84
0.001 0.044 0.001 0.004 0.007
* p ≤0.05
Table 2. Comparison of 2D measurements of soft tissue profile retraction and advancement groups.
Sn A UL LL B
www.intechopen.com

3D Facial Soft Tissue Changes Due to Orthodontic Tooth Movement
35
3. Three-dimensional morphometrics of facial soft tissues
3.1 Three-dimensional facial models
The goal of imaging in medicine and dentistry has been to display a patient’s anatomic truth. Until now, imaging technology has been largely confined to two dimensions. The development of a 3D digital model of a patient’s anatomy would greatly improve our ability to determine different treatment options, to monitor changes over time (the fourth dimension), to predict and display final treatment results, and to measure treatment outcomes more accurately. Lately, computer graphic head modeling has gained wide popularity in the field of plastic and orthognathic surgery for the prediction and simulation of treatment effects. The technique offers great advantages in surgical planning and the prediction of facial deformation. Furthermore, three-dimensional modeling of patient anatomy allows for engineering principles to be applied to such areas as local and general stress analysis of the stomatognathic system, analysis of asymmetry and how it may affect function, TMJ loading and occlusal forces, and reconstruction in oral and maxillofacial surgery. Finally, functional studies on dynamic 3D models will help us to understand the dynamic relationship of the anatomy which orthodontists and maxillofacial surgeons affect everyday in their practices (Quintero et al., 1999; Moss &Linney, 1990; Hatcher & Dial, 1999, Harrell et al., 2002).
3.1.1 Directly acquired three-dimensional facial models
Three-dimensional facial models “3D Facial Model” can be defined as three-dimensional coordinate data of facial soft tissues (Figure 4). Facial models can be acquired directly in 3D format utilizing computed tomograms (CT), including cone-beam tomography, magnetic resonance imaging (MRI), digital radiography, and digital ultrasound. Those techniques involve the use of ionizing radiation with varying degree, and can produce facial models with surface as well as deep data, depending on degree of segmentation.
Fig. 4. Three-dimensional facial model.
www.intechopen.com

Orthodontics – Basic Aspects and Clinical Considerations
36
Other direct techniques for producing 3D facial models, that do not involve the use of
ionizing radiation, include stereophotogrammetry and simultaneous image capture from
more than one camera source. This approach can produce only surface data or a 3D shell of
the face.“ All of the above mentioned allow for the volumetric registration of the hard and
or soft tissue of the craniofacial structures and the face with adequate resolution. The end
result is a 3D facial model that can be easily viewed on a computer monitor. However, all
the techniques generate huge files that require large virtual memory and storage media.
3.1.2 Manually reconstructed three-dimensional facial models
Facial Models can be reconstructed into 3D format utilizing a variety of 2D or 3D images
that are calibrated and merged into a 3D "digital replica" of anatomy. Surface laser scanning
can produce multiple 3D images from different angles with a spatial resolution of 0.5 mm
(Figure 5). Those images can be manually stitched together, utilizing the scanner software,
into a 3D facial model. Similarly, multiple 2D images taken at different views can also be
used to construct 3D facial models. In both cases, texture data can be mapped on to the 3D
surface which produces a photorealistic 3D model. The main draw back in these settings is
that post-processing of the acquired data can significantly alter the dimensions and
appearance, particularly with over smoothing. While there have been numerous reports on
the use of 3D facial images in evaluation of facial soft tissue changes following orthognathic
surgery, these approaches and systems have not been critically validated. The task of
validation of these systems for facial imaging is difficult due to the multitude of variables in
post-processing and the conditions of image acquisition in the clinic.
Fig. 5. Different surface laser scans before stitching into one 3D head model. (Source: Computer-Graphic Facial Reconstruction, Clement & Murray, eds., p. 234, Figure 12.9).
Furthermore, all systems suffer from potential for patient movement and alterations of facial expression between the multiple views needed to construct a 3D model of the face. Laser-
www.intechopen.com
3D Facial Soft Tissue Changes Due to Orthodontic Tooth Movement
37
based systems are a safety concern. While these systems are deemed safe for use with adults, the United State Food and Drug Administration (FDA) has no statement on the safety of laser systems in children, who constitute a majority of the orthodontic and craniofacial treatment group. The light-based imaging systems generally lack the precision of the laser-based systems and suffer from image artifacts due to skin tone, color and reflectance. Additionally, the majority of 3D imaging systems utilize frontal and three-quarter facial views to produce a facial model; however this approach does not provide sufficiently accurate representations of the facial profile. The “profile” view generated from these systems is not a true view of the facial profile, as one would have with a camera positioned from the patient’s profile. The generated “profile” can be distorted by several millimeters and lack detail of specific features, especially in the lower face and lips. This deficiency is a significant setback because much of our knowledge of growth and development and treatment outcomes is based upon the profile view.
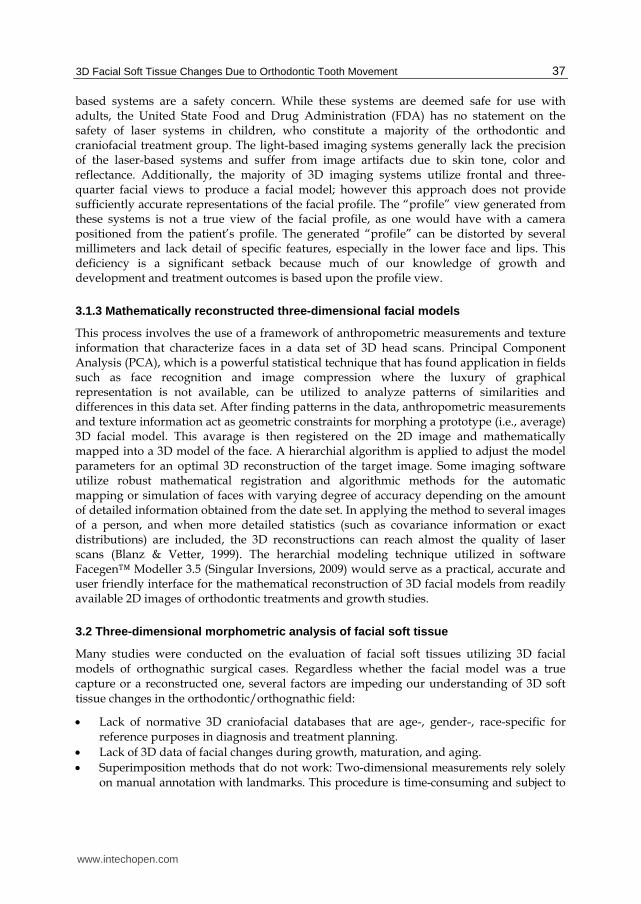
3.1.3 Mathematically reconstructed three-dimensional facial models
This process involves the use of a framework of anthropometric measurements and texture information that characterize faces in a data set of 3D head scans. Principal Component Analysis (PCA), which is a powerful statistical technique that has found application in fields such as face recognition and image compression where the luxury of graphical representation is not available, can be utilized to analyze patterns of similarities and differences in this data set. After finding patterns in the data, anthropometric measurements and texture information act as geometric constraints for morphing a prototype (i.e., average) 3D facial model. This avarage is then registered on the 2D image and mathematically mapped into a 3D model of the face. A hierarchial algorithm is applied to adjust the model parameters for an optimal 3D reconstruction of the target image. Some imaging software utilize robust mathematical registration and algorithmic methods for the automatic mapping or simulation of faces with varying degree of accuracy depending on the amount of detailed information obtained from the date set. In applying the method to several images of a person, and when more detailed statistics (such as covariance information or exact distributions) are included, the 3D reconstructions can reach almost the quality of laser scans (Blanz & Vetter, 1999). The herarchial modeling technique utilized in software Facegen™ Modeller 3.5 (Singular Inversions, 2009) would serve as a practical, accurate and user friendly interface for the mathematical reconstruction of 3D facial models from readily available 2D images of orthodontic treatments and growth studies.
3.2 Three-dimensional morphometric analysis of facial soft tissue
Many studies were conducted on the evaluation of facial soft tissues utilizing 3D facial models of orthognathic surgical cases. Regardless whether the facial model was a true capture or a reconstructed one, several factors are impeding our understanding of 3D soft tissue changes in the orthodontic/orthognathic field:
Lack of normative 3D craniofacial databases that are age-, gender-, race-specific for reference purposes in diagnosis and treatment planning.
Lack of 3D data of facial changes during growth, maturation, and aging.
Superimposition methods that do not work: Two-dimensional measurements rely solely on manual annotation with landmarks. This procedure is time-consuming and subject to
www.intechopen.com
Orthodontics – Basic Aspects and Clinical Considerations
38
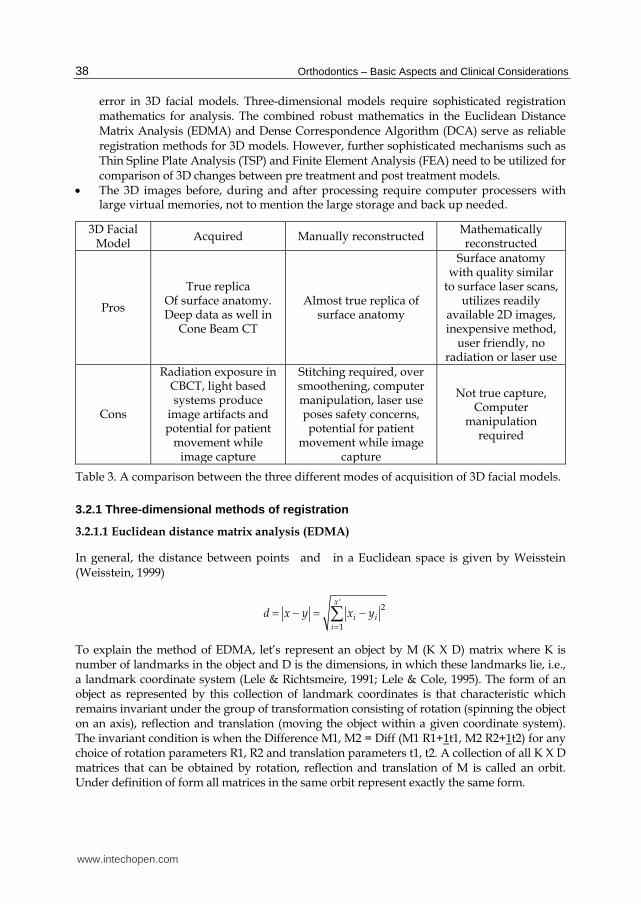
error in 3D facial models. Three-dimensional models require sophisticated registration mathematics for analysis. The combined robust mathematics in the Euclidean Distance Matrix Analysis (EDMA) and Dense Correspondence Algorithm (DCA) serve as reliable registration methods for 3D models. However, further sophisticated mechanisms such as Thin Spline Plate Analysis (TSP) and Finite Element Analysis (FEA) need to be utilized for comparison of 3D changes between pre treatment and post treatment models. The 3D images before, during and after processing require computer processers with large virtual memories, not to mention the large storage and back up needed.
3D Facial Model
Acquired Manually reconstructed Mathematically reconstructed
Pros
True replica Of surface anatomy. Deep data as well in
Cone Beam CT
Almost true replica of surface anatomy
Surface anatomy with quality similar
to surface laser scans, utilizes readily
available 2D images, inexpensive method,
user friendly, no radiation or laser use
Cons
Radiation exposure in CBCT, light based systems produce
image artifacts and potential for patient
movement while image capture
Stitching required, over smoothening, computer manipulation, laser use poses safety concerns, potential for patient
movement while image capture
Not true capture, Computer
manipulation required
Table 3. A comparison between the three different modes of acquisition of 3D facial models.
3.2.1 Three-dimensional methods of registration
3.2.1.1 Euclidean distance matrix analysis (EDMA)
In general, the distance between points and in a Euclidean space is given by Weisstein (Weisstein, 1999)
'2
1
x
i ii
d x y x y
To explain the method of EDMA, let’s represent an object by M (K X D) matrix where K is number of landmarks in the object and D is the dimensions, in which these landmarks lie, i.e., a landmark coordinate system (Lele & Richtsmeire, 1991; Lele & Cole, 1995). The form of an object as represented by this collection of landmark coordinates is that characteristic which remains invariant under the group of transformation consisting of rotation (spinning the object on an axis), reflection and translation (moving the object within a given coordinate system). The invariant condition is when the Difference M1, M2 = Diff (M1 R1+1t1, M2 R2+1t2) for any choice of rotation parameters R1, R2 and translation parameters t1, t2. A collection of all K X D matrices that can be obtained by rotation, reflection and translation of M is called an orbit. Under definition of form all matrices in the same orbit represent exactly the same form.
www.intechopen.com
3D Facial Soft Tissue Changes Due to Orthodontic Tooth Movement
39
Any object with K landmarks in D dimensions can be represented in an invariant fashion using the vector of distances between all possible pairs of landmarks. This is called the form matrix (Lele & Richtsmeier, 1991). In the Euclidean Distance Matrix Analysis (EDMA) for any two objects with K landmarks, we end up with two form matrices i.e., the vectors of all possible pair wise distances for each one of the objects. One particular description that has been used to outline the difference between these two objects is the vector of the ratios of the corresponding differences, i.e., the form difference matrix (Lele and Richtsmeier, 1991; Lele & Cole, 1995). The important property of this description is that it only depends on the orbits to which the two forms belong, not on the exact locations along these orbits. This overcomes the problem of the lack of the coordinate system for location of change.
3.2.1.2 Finite Element Analysis (FEA)
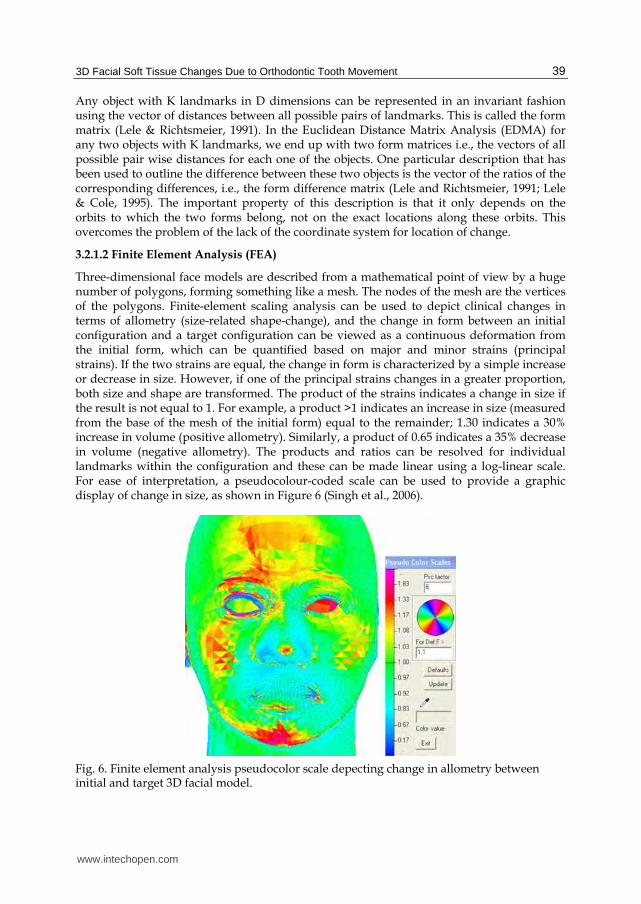
Three-dimensional face models are described from a mathematical point of view by a huge number of polygons, forming something like a mesh. The nodes of the mesh are the vertices of the polygons. Finite-element scaling analysis can be used to depict clinical changes in terms of allometry (size-related shape-change), and the change in form between an initial configuration and a target configuration can be viewed as a continuous deformation from the initial form, which can be quantified based on major and minor strains (principal strains). If the two strains are equal, the change in form is characterized by a simple increase or decrease in size. However, if one of the principal strains changes in a greater proportion, both size and shape are transformed. The product of the strains indicates a change in size if the result is not equal to 1. For example, a product >1 indicates an increase in size (measured from the base of the mesh of the initial form) equal to the remainder; 1.30 indicates a 30% increase in volume (positive allometry). Similarly, a product of 0.65 indicates a 35% decrease in volume (negative allometry). The products and ratios can be resolved for individual landmarks within the configuration and these can be made linear using a log-linear scale. For ease of interpretation, a pseudocolour-coded scale can be used to provide a graphic display of change in size, as shown in Figure 6 (Singh et al., 2006).
Fig. 6. Finite element analysis pseudocolor scale depecting change in allometry between initial and target 3D facial model.
www.intechopen.com

Orthodontics – Basic Aspects and Clinical Considerations
40
3.2.1.3 Thin Plate Spline analysis (TPS)
Suppose that all of the specimen landmarks, in the initial stage, are embedded into a thin, 2D, non-deformed, elastic plate. Due to transformation, landmarks will migrate to other new positions (final stage), so the thin-plate will be distorted, that is, all of the points belonging to the thin-plate will be relocated or dragged by landmark movements. TPS is applied to the comparison of forms as a regression mechanism with the requirement that bending energy or smoothness function is minimized. Applying finite element algorithms, it's possible to define an Area Factor, a Deformation Factor and a Principal Axis Direction for any point in the plate after deformation.
3.2.1.4 Dense Correspondence Algorithm (DCA)
For three-dimensional morphometric comparisons of pre-treatment and post-treatment head models, comparisons cannot be carried out unless the models are homologous (having equal number of nodes). Based on the closest point algorithm, the post-treatment meshes will utilize the landmarks from the pre-treatment head model as the basic mesh for the dense correspondence procedure when comparing the pre- to post-treatment head model of the same patient. In the closest point algorithm principle, the two models are aligned utilizing the digitized surface landmarks. The new position of the target vertices that lie in-between the landmarks of the post-treatment model are determined using the Euclidean Distance Matrix Analysis (EDMA) approach. This way the points in the reassembled post-treatment mesh have a one-to-one correspondence with those of the pre-treatment mesh. Finally Thin-Plate Spline analysis is applied. As a result, all of the forms will have the same quantity of nodes, which enables comparison later on (Hutton et al., 2001).
Care should be taken in specifying the greatest distance between homologous landmarks while alignment of the head models. If the distance between a generic landmark of the basic mesh (pre-treatment model) and the surface of any non-basic mesh (post-treatment model) is greater than the parameter specified, then the landmark is definitively discarded.
3.3 Facial soft tissue changes in studies utilizing three-dimensional images
Ismail and Moss (2002) prospectively compared the 2D and the 3D effects on the face of extraction and non-extraction orthodontic treatment in patients with skeletal Class I patterns. They showed, based on cephalometric values, that the nasolabial angle was larger in the extraction group, while the vermilion boarder of the upper lip was forward in comparison to the extraction group at the end of treatment. Differential geometrics and surface shape analysis showed that for the two treatment modalities in the current study, there was a significant difference in the changes in upper lip thickness. The reduction in upper lip thickness in the extraction group was accompanied by a decrease in exposed vermilion. The converse was true for the non-extraction group, which showed an increase in upper lip thickness in the study. Furthermore, the non-extraction group had more convex cheeks and chins by the end of treatment compared to the extraction group. They also pointed an increased concavity of the labiomental fold region by the end of treatment in the extraction group. Faces in the extraction group became relatively more protrusive with treatment. The surface shape analysis technique showed that the cheeks were flatter in the none-extraction group at the start of treatment, but this reversed with time. In the extraction group, the concavity of the labiomental fold increased, while the non-extraction group showed no change in this area.
www.intechopen.com
3D Facial Soft Tissue Changes Due to Orthodontic Tooth Movement
41
In a geometric morphometric study on changes in the soft tissue facial profile following
orthodontics, Singh et al. (2005) reported a statistically significant difference in the
premaxillary region with the non-extraction group being relatively larger in that region by
25%. For the non-extraction group after treatment, localized increases in relative size in the
naso-maxillary region size of 25% (p < 0.01) were present. For the extraction group after
treatment, a non-significant reduction in relative size of 15% was localized in the putative
bicuspid area.
Studies that used FEA to analyze the effect of extraction and non-extraction orthodontic
treatment mostly used lateral cephalometrics. Finite elements were constructed using
anatomical landmarks in lateral cephalometrics as vertices of the triangular elements and
then analysis was carried out as the deformational change needed to produce the final
cephalometric radiograph (Lavelle & Carvalho, 1989; Singh et al., 2005). The technique is
good as it portrays the change as the amount of strain required to produce the final image.
However, the technique utilizes two-dimensional images to portray three-dimensional
structures. Therefore, those studies inherit the same limitations associated with studies of
two-dimensional data.
Other studies used surface shape analysis to report changes in the face after orthodontic
treatment (Ismail & Moss, 2002). They used 3D surface laser scans and compared faces after
extraction and non-extraction orthodontic treatment. The experimental design involved
description of the shape of the surfaces (i.e., saddle, spherical, dome, ridge, etc). The
comparison was carried out mainly to detect how the surface changed in either shape or
area. The technique might be useful in terms of comparing three-dimensional data on its
own. However, much of our knowledge in growth and development and treatment results
are derived from two dimensional landmark measurements of two-dimensional
radiographs and photographs.
4. Morphometric analysis of three-dimensional facial models generated utilizing two-dimensional photographs
Much of our knowledge of treatment outcomes and growth and development of facial soft
tissues is based on the frontal and profile photographs of patients. It would be greatly
advantagous if these readily available images can be data mined into 3D facial models. A
simple and accurate technique for the generation of 3D facial models from sets of 2D readily
available pre treatment and post treatment photographs is proposed by Al-Sanea, Kusnoto
and Evans (Al-Sanea, 2007).
The pretreatment and post-treatment images for each patient are resized by creating a
duplicate layer of the post-treatment image in a contrasting balance, and then adjusting
the opacity of the created layer to 60-70%. Later on the post-treatment image layer is
overlaid on top of the pretreatment image and its size adjusted until a perfect fit on the
eyes is achieved.
Three-dimensional head models were constructed using FaceGen™ Modeller 3.1 and 3.5
(Singular Inversions Inc., Toronto, ON, Canada, 2005 and 2009) from the resized frontal and
lateral photographs of the same patients where the 2D cephalometric analysis was carried
www.intechopen.com
Orthodontics – Basic Aspects and Clinical Considerations
42
out. Following the recommendations of the software, 11 surface landmarks were digitized
on the frontal photographs and 7 landmarks on the lateral photograph. The surface
landmark locations suggested by the software are in accordance with facial soft tissue
landmarks definitions outlined by Farkas (1987). After landmark digitization the software
computes the average face and the mode of variation in its own dataset based on the age,
gender, race, and symmetry information specified to it by the operator. Based on this
information the software predicts and produces an average head that can be morphed into
the patient’s head. During the morphing procedure, the software calculates the texture and
geometric information in the image and modifies the 3D model accordingly. The three-
dimensional image produced is saved in two formats (Facegen: Fg) and (VRML. 97).
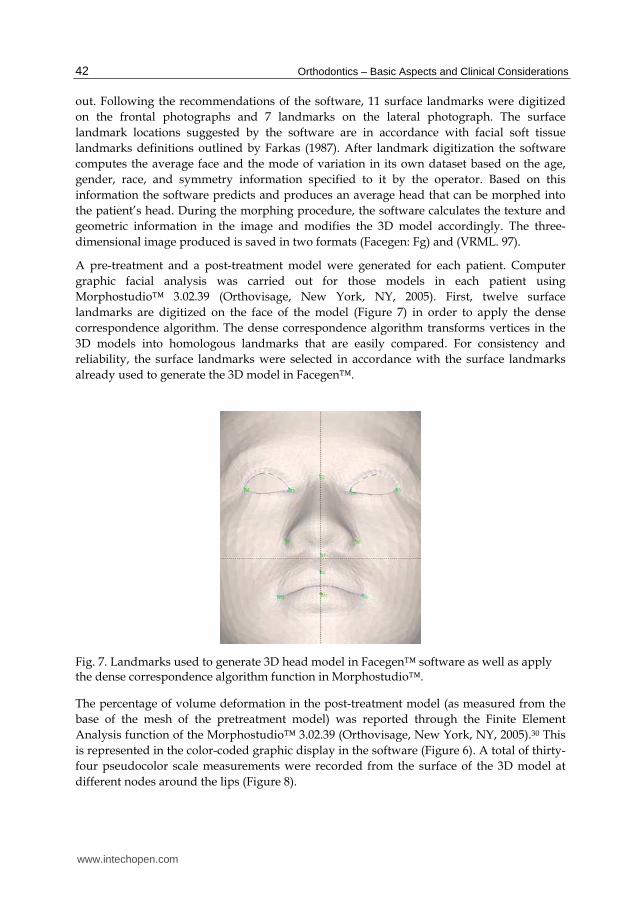
A pre-treatment and a post-treatment model were generated for each patient. Computer
graphic facial analysis was carried out for those models in each patient using
Morphostudio™ 3.02.39 (Orthovisage, New York, NY, 2005). First, twelve surface
landmarks are digitized on the face of the model (Figure 7) in order to apply the dense
correspondence algorithm. The dense correspondence algorithm transforms vertices in the
3D models into homologous landmarks that are easily compared. For consistency and
reliability, the surface landmarks were selected in accordance with the surface landmarks
already used to generate the 3D model in Facegen™.
Fig. 7. Landmarks used to generate 3D head model in Facegen™ software as well as apply the dense correspondence algorithm function in Morphostudio™.
The percentage of volume deformation in the post-treatment model (as measured from the
base of the mesh of the pretreatment model) was reported through the Finite Element
Analysis function of the Morphostudio™ 3.02.39 (Orthovisage, New York, NY, 2005).30 This
is represented in the color-coded graphic display in the software (Figure 6). A total of thirty-
four pseudocolor scale measurements were recorded from the surface of the 3D model at
different nodes around the lips (Figure 8).
www.intechopen.com
3D Facial Soft Tissue Changes Due to Orthodontic Tooth Movement
43
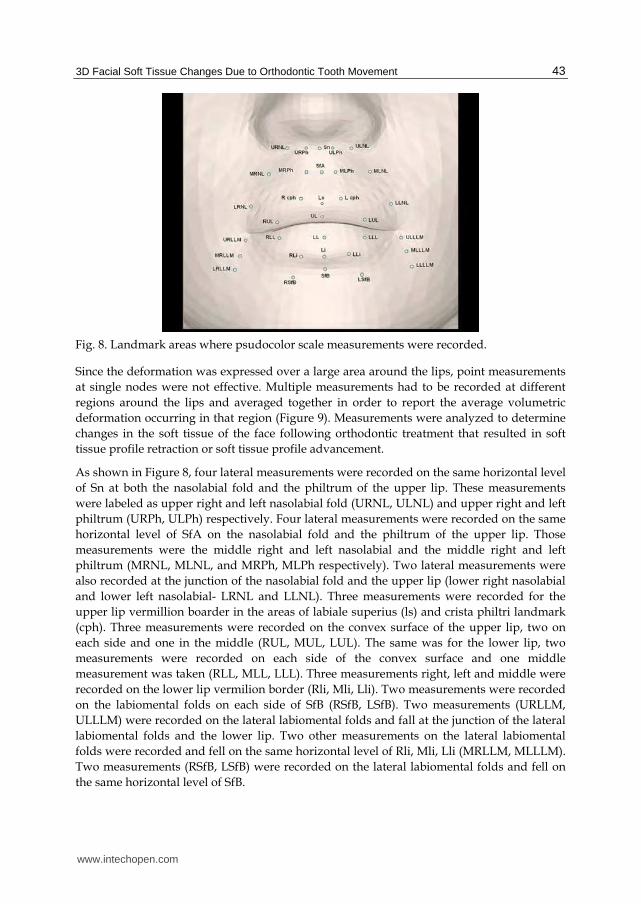
Fig. 8. Landmark areas where psudocolor scale measurements were recorded.
Since the deformation was expressed over a large area around the lips, point measurements
at single nodes were not effective. Multiple measurements had to be recorded at different
regions around the lips and averaged together in order to report the average volumetric
deformation occurring in that region (Figure 9). Measurements were analyzed to determine
changes in the soft tissue of the face following orthodontic treatment that resulted in soft
tissue profile retraction or soft tissue profile advancement.
As shown in Figure 8, four lateral measurements were recorded on the same horizontal level
of Sn at both the nasolabial fold and the philtrum of the upper lip. These measurements
were labeled as upper right and left nasolabial fold (URNL, ULNL) and upper right and left
philtrum (URPh, ULPh) respectively. Four lateral measurements were recorded on the same
horizontal level of SfA on the nasolabial fold and the philtrum of the upper lip. Those
measurements were the middle right and left nasolabial and the middle right and left
philtrum (MRNL, MLNL, and MRPh, MLPh respectively). Two lateral measurements were
also recorded at the junction of the nasolabial fold and the upper lip (lower right nasolabial
and lower left nasolabial- LRNL and LLNL). Three measurements were recorded for the
upper lip vermillion boarder in the areas of labiale superius (ls) and crista philtri landmark
(cph). Three measurements were recorded on the convex surface of the upper lip, two on
each side and one in the middle (RUL, MUL, LUL). The same was for the lower lip, two
measurements were recorded on each side of the convex surface and one middle
measurement was taken (RLL, MLL, LLL). Three measurements right, left and middle were
recorded on the lower lip vermilion border (Rli, Mli, Lli). Two measurements were recorded
on the labiomental folds on each side of SfB (RSfB, LSfB). Two measurements (URLLM,
ULLLM) were recorded on the lateral labiomental folds and fall at the junction of the lateral
labiomental folds and the lower lip. Two other measurements on the lateral labiomental
folds were recorded and fell on the same horizontal level of Rli, Mli, Lli (MRLLM, MLLLM).
Two measurements (RSfB, LSfB) were recorded on the lateral labiomental folds and fell on
the same horizontal level of SfB.
www.intechopen.com
Orthodontics – Basic Aspects and Clinical Considerations
44
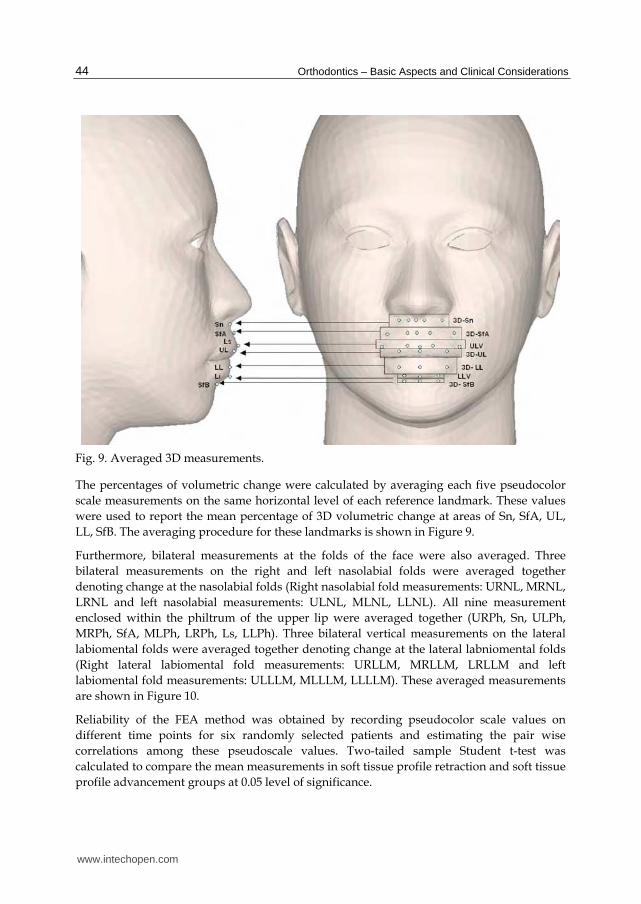
Fig. 9. Averaged 3D measurements.
The percentages of volumetric change were calculated by averaging each five pseudocolor
scale measurements on the same horizontal level of each reference landmark. These values
were used to report the mean percentage of 3D volumetric change at areas of Sn, SfA, UL,
LL, SfB. The averaging procedure for these landmarks is shown in Figure 9.
Furthermore, bilateral measurements at the folds of the face were also averaged. Three
bilateral measurements on the right and left nasolabial folds were averaged together
denoting change at the nasolabial folds (Right nasolabial fold measurements: URNL, MRNL,
LRNL and left nasolabial measurements: ULNL, MLNL, LLNL). All nine measurement
enclosed within the philtrum of the upper lip were averaged together (URPh, Sn, ULPh,
MRPh, SfA, MLPh, LRPh, Ls, LLPh). Three bilateral vertical measurements on the lateral
labiomental folds were averaged together denoting change at the lateral labniomental folds
(Right lateral labiomental fold measurements: URLLM, MRLLM, LRLLM and left
labiomental fold measurements: ULLLM, MLLLM, LLLLM). These averaged measurements
are shown in Figure 10.
Reliability of the FEA method was obtained by recording pseudocolor scale values on
different time points for six randomly selected patients and estimating the pair wise
correlations among these pseudoscale values. Two-tailed sample Student t-test was
calculated to compare the mean measurements in soft tissue profile retraction and soft tissue
profile advancement groups at 0.05 level of significance.
www.intechopen.com
3D Facial Soft Tissue Changes Due to Orthodontic Tooth Movement
45
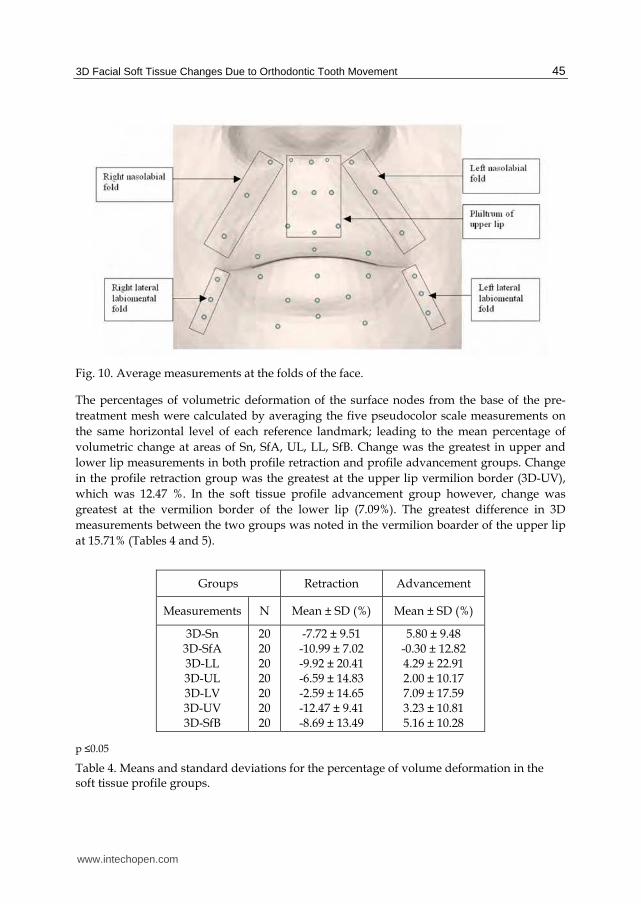
Fig. 10. Average measurements at the folds of the face.
The percentages of volumetric deformation of the surface nodes from the base of the pre-
treatment mesh were calculated by averaging the five pseudocolor scale measurements on
the same horizontal level of each reference landmark; leading to the mean percentage of
volumetric change at areas of Sn, SfA, UL, LL, SfB. Change was the greatest in upper and
lower lip measurements in both profile retraction and profile advancement groups. Change
in the profile retraction group was the greatest at the upper lip vermilion border (3D-UV),
which was 12.47 %. In the soft tissue profile advancement group however, change was
greatest at the vermilion border of the lower lip (7.09%). The greatest difference in 3D
measurements between the two groups was noted in the vermilion boarder of the upper lip
at 15.71% (Tables 4 and 5).
Groups Retraction Advancement
Measurements N Mean ± SD (%) Mean ± SD (%)
3D-Sn 3D-SfA 3D-LL 3D-UL 3D-LV 3D-UV 3D-SfB
20 20 20 20 20 20 20
-7.72 ± 9.51 -10.99 ± 7.02 -9.92 ± 20.41 -6.59 ± 14.83 -2.59 ± 14.65 -12.47 ± 9.41 -8.69 ± 13.49
5.80 ± 9.48 -0.30 ± 12.82 4.29 ± 22.91 2.00 ± 10.17 7.09 ± 17.59 3.23 ± 10.81 5.16 ± 10.28
p ≤0.05
Table 4. Means and standard deviations for the percentage of volume deformation in the soft tissue profile groups.
www.intechopen.com
Orthodontics – Basic Aspects and Clinical Considerations
46
Measurements Mean
Difference
Student
t-value p- value*
3D-Sn
3D-SfA
3D-UL
3D-LL
3D-LV
3D-UV
3D-SfB
-13.51
-10.69
-8.56
-14.21
-9.69
-15.71
-13.86
-4.50
-3.27
-2.13
-2.07
-1.89
-4.90
-3.65
0.000
0.003
0.040
0.045
0.066
0.000
0.001
* p ≤0.05
Table 5. Comparison of 3D measurements of soft tissue profile retraction and advancement groups.
Statistically significant differences were found between soft tissue profile retraction and soft
tissue profile advancement groups in the percentage of volume deformation at the facial
folds regions. The greatest difference between soft tissue profile retraction and soft tissue
profile advancement was noted at the Philtrum (Ph) Where the difference was -12.02 and
2.78 respectively while the Lowest difference was at 3D-LLM (-3.36 and 1.71 respectively)
Results are outlined in Table 6.
Groups Retraction Advancement
Measurements N Mean ± SD Mean ± SD
3D-NL
3D-Ph
3D-LLM
20
20
20
-5.32 ± 8.11
-12.02 ± 0.86
-3.36 ± 1.16
3.82 ± 9.55
2.78 ± 10.82
1.71 ± 11.09
Table 6. Means and standard deviation for the percentage volume deformation at the facial
folds on the soft tissue profile (%).
5. Correlation between two-dimensional and three-dimensional measurements
Current orthodontic research reports linear 2D or volumetric 3D changes in the facial soft
tissues without establishing a relationship between 2D and 3D measurements. Knowing this
relationship could enable clinicians to use 2D measurements as a routine tool to determine
the behavior of the soft tissue of the face in the three planes of space. This can serve as a
useful guide in diagnosis, treatment planning/ prediction and patient communication.
In an attempt to study the relationship between 3D morphologic measurements of soft
tissue change following orthodontic treatment and the corresponding two-dimensional
change, we (Al-Sanea, Kusnoto and Evans) tested the hypothesis that there is significant
correlation between 3D morphologic measurements and 2D morphologic measurements of
facial soft tissue change following orthodontic treatment in the same regions of the face in
the same patient.
www.intechopen.com
3D Facial Soft Tissue Changes Due to Orthodontic Tooth Movement
47
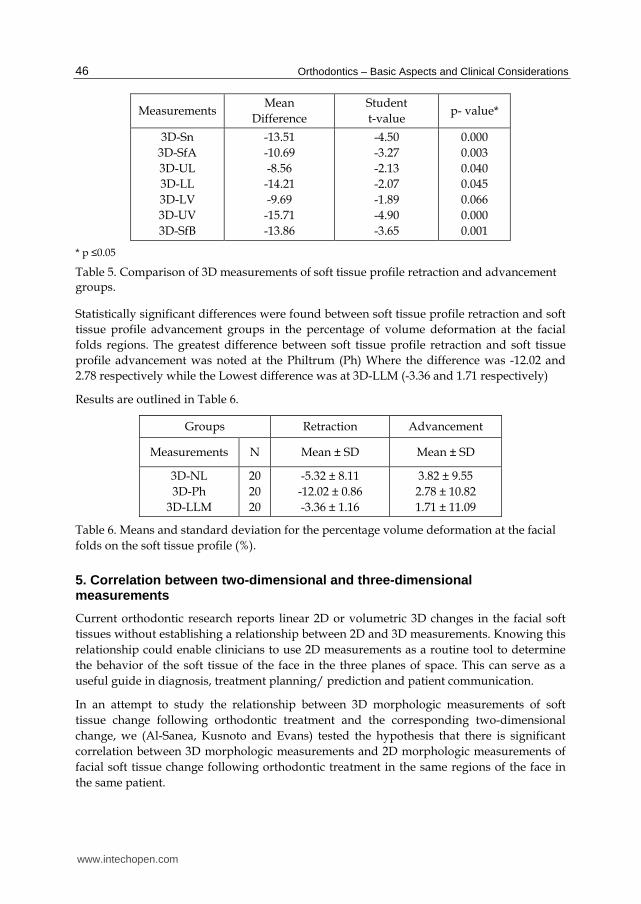
5.1 Correlation measurements between two-dimensional and three-dimensional changes in the soft tissue profile retraction group
Pearson correlation coefficient was calculated to determine the relationship between two-
dimensional and three-dimensional measurements in the soft tissue profile retraction group
at (0.05) level of significance. No statistically significant correlation existed between two-
dimensional and three-dimensional measurements. The p values of the correlation ranged
between (0.084- 0.661). Table 7 shows the Pearson Correlation values while scatter diagrams
are represented in Figure 11-15.
Measurements Number ρ Significance
2D-Sn and 3D- Sn 20 -0.173 NS
2D-SfA and 3D-SfA 20 0.212 NS
2D-UL and 3D-UL 20 -0.136 NS
2D-LL and 3D-LL 20 0.396 NS
2D-SfB and 3D-SfB 20 -0.104 NS
NS: Statistically non significant *P value is statistically significant at 0.05
Table 7. Correlation measurements between two-dimensional and three dimensional changes in the soft tissue profile retraction group.
Fig. 11. Scatter diagram of correlation between 2D-Sn and 3D-Sn values.
www.intechopen.com
Orthodontics – Basic Aspects and Clinical Considerations
48
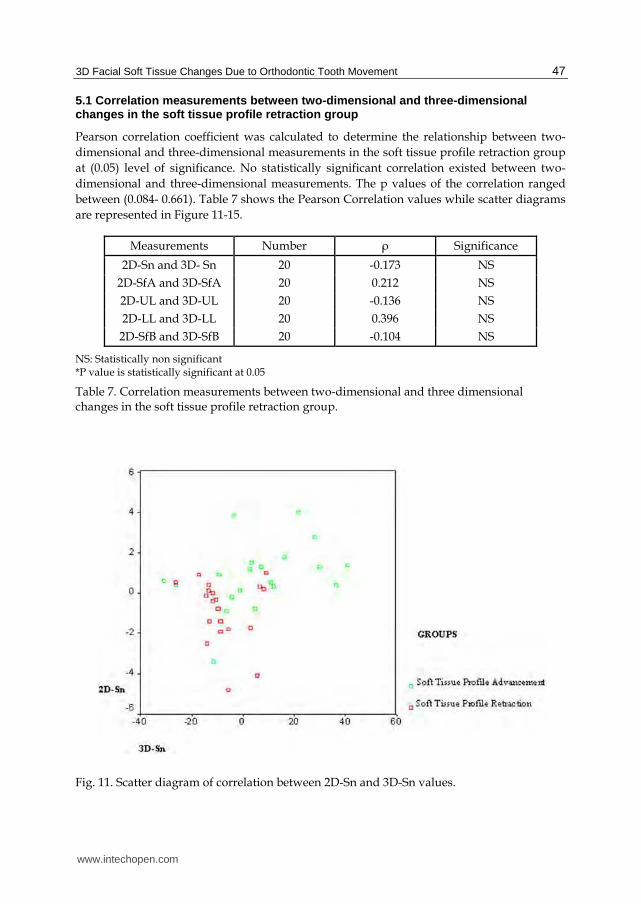
Fig. 12. Scatter diagram of correlation between 2D-SfA and 3D- SfA.
Fig. 13. Scatter diagram of correlation between 2D-UL and 3D- UL.
www.intechopen.com
3D Facial Soft Tissue Changes Due to Orthodontic Tooth Movement
49
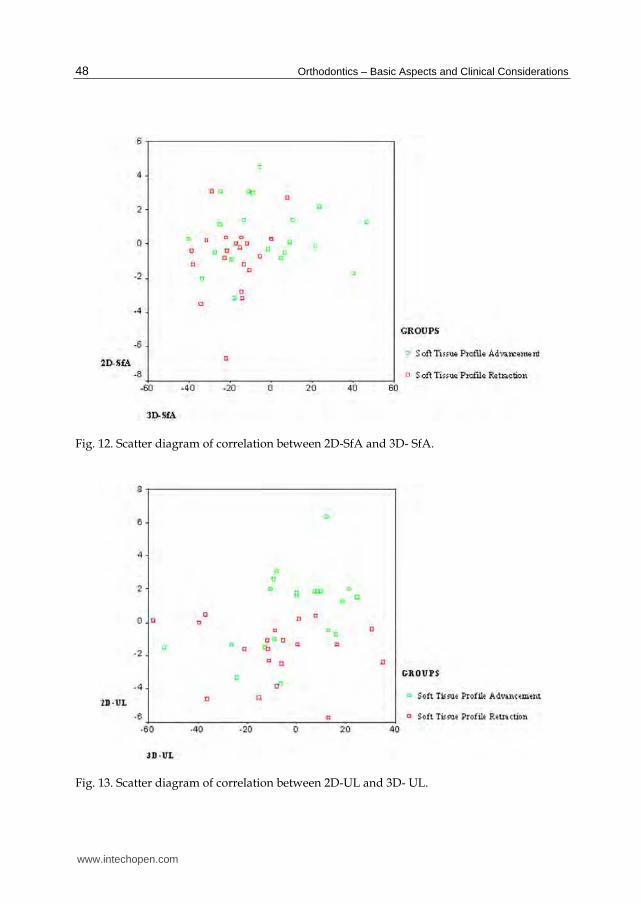
Fig. 14. Scatter diagram of correlation between 2D-LL and 3D-LL.
Fig. 15. Scatter diagram of correlation between 2D-SfB and 3D-SfB.
www.intechopen.com

Orthodontics – Basic Aspects and Clinical Considerations
50
5.2 Correlation measurements between two-dimensional and three dimensional changes in the soft tissue profile advancement group
Pearson correlation coefficient was calculated to determine the relationship between two-dimensional and three-dimensional measurements in the soft tissue profile advancement group at (0.05) level of significance. No statistically significant correlation existed between two-dimensional and three-dimensional measurements except in the upper lip values (2D- UL and 3D-UL) where the p value was 0.033. The p values of the correlation in the rest of the measurements ranged between (0.116-0.917). The Pearson Correlation values and the scatter diagrams are shown in Table 8 and Figures 11-15 respectively.
Measurements Number ρ Significance
2D-Sn and 3D- Sn 20 0.363 NS 2D-SfA and 3D-SfA 20 0.025 NS 2D-UL and 3D-UL 20 0.477* S 2D-LL and 3D-LL 20 0.212 NS 2D-SfB and 3D-SfB 20 -0.207 NS
NS: Statistically non significant *P value is statistically significant at 0.05
Table 8. Correlation measurements between two-dimensional and three dimensional changes in the soft tissue profile advancement group.
6. References
Al-Mesad, S. (1998). Soft Tissue Changes in White and Black Orthodontic Populations. Master's Thesis A447, University of Illinois at Chicago, Chicago, pp. 1-68.
Al-Sanea, R. (2007). Three Dimensional Morphometric Analysis of Facial Soft Tissue Changes Following Orthodontic Treatment. M.S. dissertation, University of Illinois at Chicago, United States – Illinois, Dissertations & Theses @ CIC Institutions, (Publication No. AAT 1449189), pp. 1-91, ISBN 9780549284208
Bishara, S.E.; Cummins, D.M. & Jakobsen, J.R. (1995). A Computer Assisted Photogrammetric Analysis of Soft Tissue Changes After Orthodontic Treatment, Part II: Results. American Journal of Orthodontics and Dentofacial Orthopedics, Vol.108, No.1, (July 1995), pp 38-47, ISSN 0889-5406
Blanz, V. & Vetter, T. (1999). A Morphable Model for the Synthesis of 3D Faces. SIGGRAPH' 99 Conference Proceedings, pp. 187-194, ISSN 0097-8930
Bloom, L.A. (1961). Perioral Profile Changes in Orthodontic Treatment. American Journal of Orthodontics and Dentofacial Orthopedics, 47:371, 1961, ISSN 0889-5406
Boley, J.C.; Pontier, J.P.; Smith, S. & Fulbright, M. (1998). Facial Changes in Extraction and Non-Extraction Patients. Angle Orthodontist, Vol.68, No.6, (December 1998), pp. 539-546, ISSN 0003-3219
Burke, P. (1983). Stereophotogrammetic Measurement of Change in Soft Tissue Following Surgery. British Dental Journal, Vol.155, No.11, (December 1983), pp. 373-379, ISSN 00007-0610
Clement, J.G. & Marks, M.K., eds. (2005) Computer-Graphic Facial Reconstruction . Amsterdam and Boston, Elsevier Academic Press, 2005, pp. 1-390, ISBN 0124730515
www.intechopen.com
3D Facial Soft Tissue Changes Due to Orthodontic Tooth Movement
51
DeCarlo, D.; Metaxas, D. & Stone, M. (1998). An Anthropometric Face Model Using Variational Techniques. SIGGRAPH’ 98 Conference Proceedings, pp. 67-74, ISSN 0097-8930
Denis, K.L. & Speidel, T.M. (1987). Comparison of the Three Methods of Profile Change Prediction in the Adult Orthodontic Patient. American Journal of Orthodontics and Dentofacial Orthopedics, Vol.92, No.5, (November 1987), pp. 376-402, ISSN 0889-5406
Farkas, L.G: (1987). Anthropometric Facial Proportions. Springfield, Charles C. Thomas Publisher, ISBN 0398052611
FaceGen™. (2005, 2009) Singular Inversions © 2005, 2009. Vancouver, British Columbia, Canada.
Finnoy, J.P.; Wisth, P.J. & Boe, O.E. (1987). Changes in Soft Tissue Profile During and After Orthodontic Treatment. European Journal of Orthodontics, Vol.9, No.1, (February 1987), pp. 68- 78, ISSN 0141-5387
Garner, L.D. (1974). Soft Tissue Changes Concurrent With Orthodontic Tooth Movement. American Journal of Orthodontics and Dentofacial Orthopedics, Vol.66, No.4, (October 1974), pp. 357–377, ISSN 0889-5406
Harrell, W.; Hatcher, D. & Bolt, R. (2002). In Search of Anatomic Truth: 3D Digital Patient Modeling and the Future of Orthodontics, American Journal of Orthodontics and Dentofacial Orthopedics, Vol.122, No.3, (September 2002), pp. 125-130, ISSN 0889-5406
Hatcher, D.C. & Dial, C. (1999). Dental Imaging Centers. Journal of the California Dental Association, Vol.27, No.12, (December 1999), pp. 953-9, ISSN 1043-2256
Hershey, H.G. (1972). Incisor Tooth Retraction and Subsequent Profile Change in Postadolescent Female Patients. American Journal of Orthodontics and Dentofacial Orthopedics, Vol.61, No.1, (January 1972), pp. 45–54, ISSN 0889-5406
Hutton, T.J.; Buxton, B.F.; Hammond, P. & Potts, H.W.W. (2003). IEEE Transactions on Medical Imaging. 22, 2003.
Ismail, S.F. & Moss, J.P. (2002). The Three-Dimensional Effects of Orthodontic Treatment on the Facial Soft Tissues - a Preliminary Study. British Dental Journal, Vol.192, No.2, (January 2002), pp. 104-108, ISSN 0007-0610
Kocadereli, I. (2002). Changes in Soft Tissue Profile After Orthodontic Treatment With and Without Extractions. American Journal of Orthodontics and Dentofacial Orthopedics, Vol.122. No.1, (July 2002), pp. 67-72, ISSN 0889-5406.
Lavelle, C.L., Carvalho, R.S.: An Evaluation of the Changes in Soft-Tissue Profile Form Induced by Orthodontic Therapy. American Journal of Orthodontics and Dentofacial Orthopedics, Vol.96, No.6, (December, 1989), pp. 467-476, ISSN 0889-5406
Lele, S. & Richtsmeire, J.T. (1991). Euclidean Distance Matrix Analysis: a Coordinate-Free Approach for Comparing Biological Shapes Using Landmark Data. American Journal of Physical Anthropology, Vol.86, No.3, (November 1991), pp. 415-427, ISSN 0002-9483
Lele, S. & Cole, T.M. (1995). Euclidean Distance Matrix Analysis: a Statistical Review. In: Current Issues in Statistical Shape Analysis, Eds. Mardia, K.K.V. & Gill, C.A., Leeds University Press, pp. 49-53, ISBN 0853161615
Luppanapornlarp, S. & Johnston, L.E. Jr. (1993). The Effects of Premolar-Extraction: a Long-Term Comparison of Outcomes in "Clear-Cut" Extraction and Nonextraction Class II Patients. Angle Orthodontist, Vol.64, No.4, (Winter 1993), pp. 257-272, ISSN 0003-3219
www.intechopen.com
Orthodontics – Basic Aspects and Clinical Considerations
52
Marsh, J.L. & Vannier, M.V. (1983). The “Third Dimension” in Craniofacial Surgery. Plastic and Reconstructive Surgery, Vol.71, No.6, (June 1983), pp. 759-767, ISSN 0032-1052
Moss, J.P.; Linney, A.D.; Grindrod, S.R.; Ridge, S.R. & Clifton, J.S. (1987). Three-Dimensional Visualization of the Face and Skull Using Computerized Tomography and Laser Scaling Techniques. American Journal of Orthodontics and Dentofacial Orthopedics, Vol.94, No.4, (November 1987), pp. 247-253, ISSN 0089-5406
Moss, J.P. & Linney, A.D. (1990). The Prediction of Facial Aesthetics. The New York State Dental Journal, Vol.56, No.6, (June-July 1990), pp. 44-46, ISSN 0028-7571
Oliver, B.M. (1982). The Influence of Lip Thickness and Strain on Upper Lip Response to Incisor Retraction. American Journal of Orthodontics and Dentofacial Orthopedics, Vo.82, No.2, (August 1982), pp. 141–148, ISSN 0889-5406
O’Toole, A.J.; Vetter, T. & Blanz, V. (1999). Three-Dimensional Shape and Two-Dimensional Surface Reflectance Contributions to Face Recognition: An Application of Three-Dimensional Morphing. Vision Research, Vol.39, No.18, (September 1999), pp. 3145-3155, ISSN 0042-6989
Paquette, D.E.; Beattie, J.R. & Johnston, L.E. Jr. (1992). A Long-Term Comparison of Nonextraction and Premolar Extraction Edgewise Therapy in "Borderline" Class II Oatients. American Journal of Orthodontics and Dentofacial Orthopedics, Vol.102, No.1, (July 1992), pp. 1-14, ISSN 0889-5406
Peck, S. & Peck, L. (1995). Selected Aspects of the Art and Science of Facial Esthetics. Seminars in Orthodontics, Vol.1, No.1, (June 1995) pp. 105-126, ISSN 1073-8746
Quintero, J.C.; Trosien, A.; Hatcher D. & Kapila S. (1999). Craniofacial Imaging in Orthodontics: Historical Perspective, Current Status, and Future Developments. Angle Orthodontist, Vol.69, No.6, (December 1999), pp. 491-506, ISSN 0003-3219
Riedel, R.A. (1950). Esthetics and Its Relation to Orthodontic Therapy. Angle Orthodontist, Vol.20, No.3, (July 1950), pp. 168-78, ISSN 0003-3219
Roos, N. (1977). Soft Tissue Changes in Class II Treatment. American Journal of Orthodontics and Dentofacial Orthopedics, Vol.72, No.2, (August 1977), pp. 165-175, ISSN 0889-5406
Rudee, D.A. (1964). Proportional Profile Changes Concurrent With Orthodontic Therapy. American Journal of Orthodontics and Dentofacial Orthopedics, Vol.50, No.6, (June 1964), pp. 421-434, ISSN 0889-5406
Savara, B.S. (1965). Applications of Photogrammetry for Quantitative Study of Tooth and Face Morphology. American Journal of Physical Anthropology, Vol.23, No.4, (December 1965), pp. 427-434, ISSN 0002-9483
Singh, G.D.; Maldonado, L. & Thind, B.S. (2004-2005). Changes in the Soft Tissue Facial Profile Following Orthodontic Extractions: a Geometric Morphometric Study. The Functional Orthodontist, Vol.22, No.1, (Winter 2004-Spring 2005), pp. 34-38, 40, ISSN 8756-3150
Tweed, C. H. (1944). Indications for the Extraction of Teeth in Orthodontic Procedure. American Journal of Orthodontics and Oral Surgery, Vol.30, No.8, (August 1944), pp. 405-428, ISSN 0096-6347
Weisstein, E.W. (1999). Distance. From: MathWorld--A Wolfram Web Resource. http://mathworld.wolfram.com/Distance.html, 1999. Wisth, P.J. (1974). Soft Tissue Response to Upper Incisor Retraction in Boys. British Journal of
Orthodontics, Vol.1, No.5, (October 1974), pp. 199–204, ISSN 0301-228X
www.intechopen.com
Orthodontics - Basic Aspects and Clinical ConsiderationsEdited by Prof. Farid Bourzgui
ISBN 978-953-51-0143-7Hard cover, 446 pagesPublisher InTechPublished online 09, March, 2012Published in print edition March, 2012
InTech EuropeUniversity Campus STeP Ri Slavka Krautzeka 83/A 51000 Rijeka, Croatia Phone: +385 (51) 770 447 Fax: +385 (51) 686 166www.intechopen.com
InTech ChinaUnit 405, Office Block, Hotel Equatorial Shanghai No.65, Yan An Road (West), Shanghai, 200040, China
Phone: +86-21-62489820 Fax: +86-21-62489821
The book reflects the ideas of nineteen academic and research experts from different countries. The differentsections of this book deal with epidemiological and preventive concepts, a demystification of cranio-mandibulardysfunction, clinical considerations and risk assessment of orthodontic treatment. It provides an overview ofthe state-of-the-art, outlines the experts' knowledge and their efforts to provide readers with quality contentexplaining new directions and emerging trends in Orthodontics. The book should be of great value to bothorthodontic practitioners and to students in orthodontics, who will find learning resources in connection withtheir fields of study. This will help them acquire valid knowledge and excellent clinical skills.
How to referenceIn order to correctly reference this scholarly work, feel free to copy and paste the following:
R.A. Al-Sanea, B. Kusnoto and C.A. Evans (2012). 3D Facial Soft Tissue Changes Due to Orthodontic ToothMovement, Orthodontics - Basic Aspects and Clinical Considerations, Prof. Farid Bourzgui (Ed.), ISBN: 978-953-51-0143-7, InTech, Available from: http://www.intechopen.com/books/orthodontics-basic-aspects-and-clinical-considerations/3d-facial-soft-tissue-changes-due-to-orthodontic-tooth-movement

© 2012 The Author(s). Licensee IntechOpen. This is an open access articledistributed under the terms of the Creative Commons Attribution 3.0License, which permits unrestricted use, distribution, and reproduction inany medium, provided the original work is properly cited.