3d basin and petroleum system modelling of the nw german ... · 3d basin and petroleum system...
TRANSCRIPT

3D basin and petroleum system modelling of the NW German North Sea(Entenschnabel)
JASHAR ARFAI* and RUDIGER LUTZ
Federal Institute for Geosciences and Natural Resources (BGR), Stilleweg 2, 30655 Hannover, Germany
*Correspondence: [email protected]
Abstract: 3D basin and petroleum system modelling covering the NW German North Sea (Entenschnabel) was
performed to reconstruct the thermal history, maturity and petroleum generation of three potential source rocks,
namely the Namurian–Visean coals, the Lower Jurassic Posidonia Shale and the Upper Jurassic Hot Shale.
Modelling results indicate that the NW study area did not experience the Late Jurassic heat flow peak of rifting
as in the Central Graben. Therefore, two distinct heat flow histories are needed since the Late Jurassic to achieve a
match between measured and calculated vitrinite reflection data. The Namurian–Visean source rocks entered the
early oil window during the Late Carboniferous, and reached an overmature state in the Central Graben during the
Late Jurassic. The oil-prone Posidonia Shale entered the main oil window in the Central Graben during the Late
Jurassic. The deepest part of the Posidonia Shale reached the gas window in the Early Cretaceous, showing max-
imum transformation ratios of 97% at the present day. The Hot Shale source rock exhibits transformation ratios of
up to 78% within the NW Entenschnabel and up to 20% within the Central Graben area. The existing gas field
(A6-A) and oil shows in Chalk sediments of the Central Graben can be explained by our model.
Gold Open Access: This article is published under the terms of the CC-BY 3.0 license.
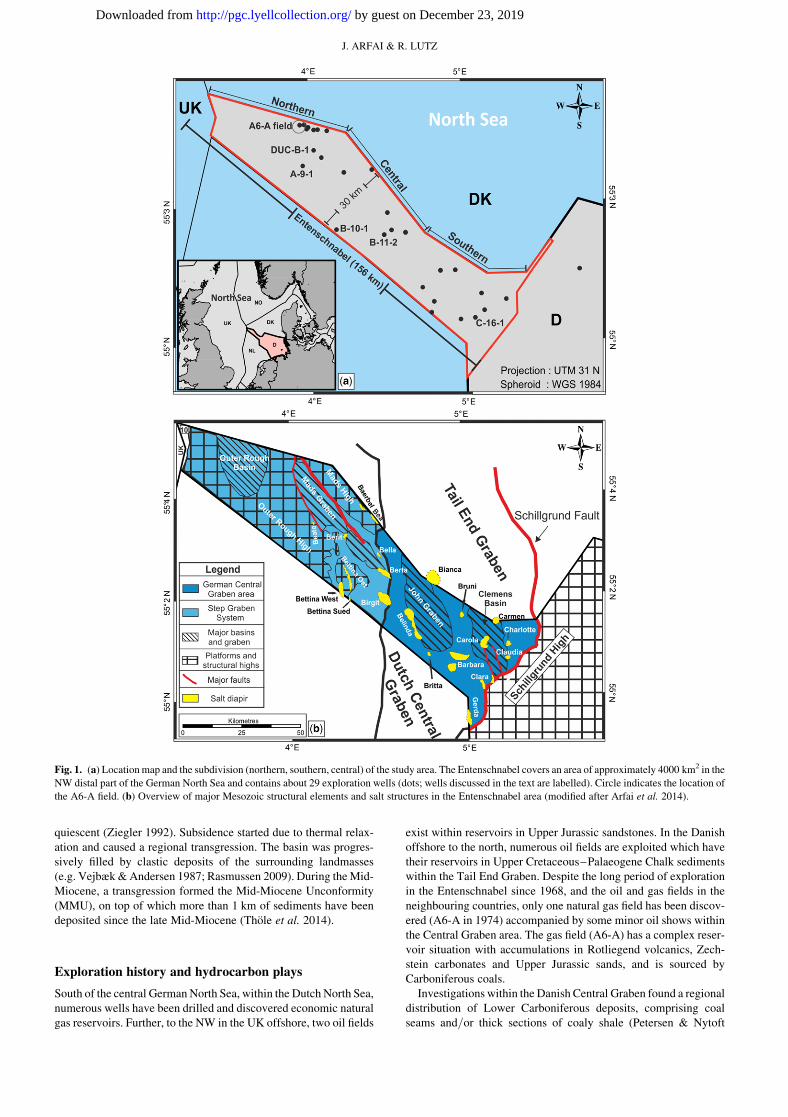
The German North Sea (Fig. 1) covers an area of around
35 000 km2 and about 80 exploration wells have been drilled.
The NW part of offshore Germany referred to as the Entenschnabel
(Ducks’s beak) has a size of approximately 4000 km2 and contains
about 29 exploration wells (Fig. 1a). Despite numerous petroleum
discoveries in the neighbouring offshore areas, only two commer-
cial petroleum fields have been discovered in offshore Germany:
the Mittelplate oil field and the A6-A gas field. The latter is the
only commercial natural gas field discovered in the Entenschnabel
area so far (Fig. 1a), despite the fact that the geological structures
are continuous from the Dutch to the Danish offshore sectors.
Using the results from a recent detailed mapping campaign in the
Entenschnabel area (Arfai et al. 2014) that was based on high-
quality 3D reflection seismic data, we studied the petroleum gener-
ation and migration from three potential source rock formations.
We constructed a 3D basin model that covers the basin’s structural
development from the Devonian until the present day to reconstruct
key elements and processes important for evaluating the petroleum
systems in the study area. These key factors include: (a) the basal
heat flow history; (b) the maturation history of potential source
rocks; and (c) the timing of hydrocarbon generation.
Geological setting
In Figure 2, the main tectonic events of the study area are
summarized in relation to the stratigraphic succession of the
Entenschnabel.
The Entenschnabel area is tectonically subdivided by several
graben and structural highs. The three major structural elements
are the Schillgrund High, the Central Graben and the Step Graben
System. These major structural elements are internally character-
ized by a number of minor structural features such as the John
Graben, Clemens Basin belonging to the Central Graben, and the
Mads Graben, Outer Rough High and the Outer Rough Basin of
the Step Graben System (Fig. 1b) (Arfai et al. 2014). Important
phases of the geodynamic history of the study area include the
Saalian phase of uplift and erosion, Early Triassic extension and
subsidence, Mid- and Late Cimmerian erosion and rifting, and
Sub-Hercynian inversion phases (Ziegler 1990; Evans et al.
2003; Doornenbal & Stevenson 2010). During the Early Carbonif-
erous, NW Europe, including the North Sea region, was located in
the foreland basin of the Variscan Orogen (Ziegler 1990; Doornen-
bal & Stevenson 2010). As a result of the Carboniferous–Early
Permian collapse of the Variscan Orogen, regional thermal uplift
and concomitant erosion dominated parts of the Upper Carbonifer-
ous and Lower Permian deposits (Saalian unconformity; the ages of
these tectonic events are discussed below) (Krull 2005; Ziegler
2005; Kombrink et al. 2012). Regional uplift was followed by
late Early Permian thermal relaxation and subsidence. During this
transtensional phase, voluminous volcanics were emplaced, as well
as continental siliciclastic red-bed series of the Rotliegend strata
which were subsequently buried by carbonates and evaporites of
the Zechstein Group (Ziegler 2005; Kley & Voigt 2008; Stollhofen
et al. 2008; Ten Veen et al. 2012). In the early Mesozoic rifting ini-
tiated, and the Central Graben developed as a half-graben from
the Early Triassic (Sclater & Christie 1980; Frederiksen et al.
2001; Arfai et al. 2014). Salt tectonics have been active since the
Late Triassic. As a result of thermal uplift related to the North
Sea Dome (Mid-Cimmerian erosional phase: Underhill & Parting-
ton 1993; Graversen 2002, 2006), regional erosion affected Lower
Triassic–Middle Jurassic sediments predominantly on structural
highs in the Entenschnabel area (Arfai et al. 2014). During the
Late Jurassic–Early Cretaceous, a major extensional phase (Late
Cimmerian: Ziegler 1990) took place in combination with exten-
sive reactive diapirism of Zechstein salt and deposition of clastic
sediments. A change in the European stress pattern from an exten-
sional to a compressional tectonic regime (Gemmer et al. 2002,
2003) in the Late Cretaceous resulted in inversion, accompanied
by deep erosion of locally uplifted sedimentary deposits. Erosion
affected mainly Cenomanian–Santonian sediments in the central
and NW part of the Entenschnabel. Simultaneously, syn-inversion
deposition of chalk and subsidence continued in the southern Ger-
man Central Graben.
Seafloor spreading has taken place in the North Atlantic from the
Eocene onwards and the North Sea Basin became tectonically
From: Bowman, M. & Levell, B. (eds) Petroleum Geology of NW Europe: 50 Years of Learning – Proceedings of the 8th Petroleum Geology Conference,
https://doi.org/10.1144/PGC8.35
# 2017 The Author(s). Published by the Geological Society, London. Publishing disclaimer: www.geolsoc.org.uk/pub_ethics
by guest on December 23, 2019http://pgc.lyellcollection.org/Downloaded from
quiescent (Ziegler 1992). Subsidence started due to thermal relax-
ation and caused a regional transgression. The basin was progres-
sively filled by clastic deposits of the surrounding landmasses
(e.g. Vejbæk & Andersen 1987; Rasmussen 2009). During the Mid-
Miocene, a transgression formed the Mid-Miocene Unconformity
(MMU), on top of which more than 1 km of sediments have been
deposited since the late Mid-Miocene (Thole et al. 2014).
Exploration history and hydrocarbon plays
South of the central German North Sea, within the Dutch North Sea,
numerous wells have been drilled and discovered economic natural
gas reservoirs. Further, to the NW in the UK offshore, two oil fields
exist within reservoirs in Upper Jurassic sandstones. In the Danish
offshore to the north, numerous oil fields are exploited which have
their reservoirs in Upper Cretaceous–Palaeogene Chalk sediments
within the Tail End Graben. Despite the long period of exploration
in the Entenschnabel since 1968, and the oil and gas fields in the
neighbouring countries, only one natural gas field has been discov-
ered (A6-A in 1974) accompanied by some minor oil shows within
the Central Graben area. The gas field (A6-A) has a complex reser-
voir situation with accumulations in Rotliegend volcanics, Zech-
stein carbonates and Upper Jurassic sands, and is sourced by
Carboniferous coals.
Investigations within the Danish Central Graben found a regional
distribution of Lower Carboniferous deposits, comprising coal
seams and/or thick sections of coaly shale (Petersen & Nytoft
Fig. 1. (a) Location map and the subdivision (northern, southern, central) of the study area. The Entenschnabel covers an area of approximately 4000 km2 in the
NW distal part of the German North Sea and contains about 29 exploration wells (dots; wells discussed in the text are labelled). Circle indicates the location of
the A6-A field. (b) Overview of major Mesozoic structural elements and salt structures in the Entenschnabel area (modified after Arfai et al. 2014).
J. ARFAI & R. LUTZ
by guest on December 23, 2019http://pgc.lyellcollection.org/Downloaded from
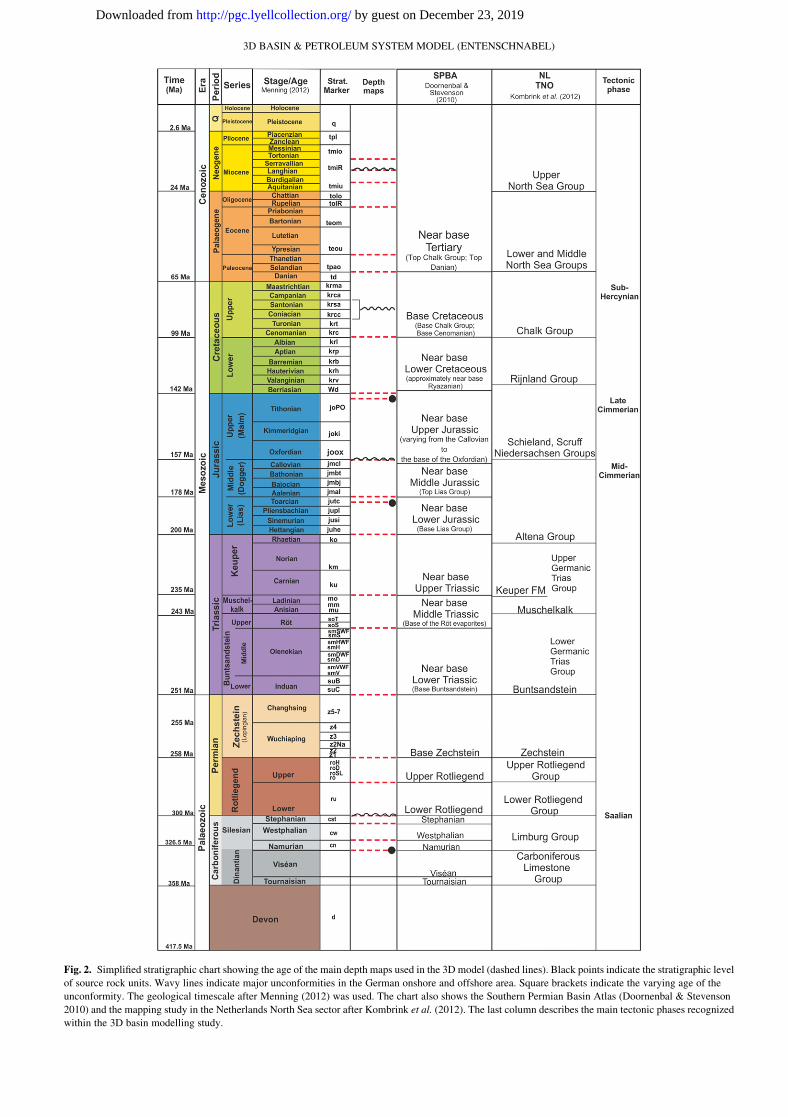
Fig. 2. Simplified stratigraphic chart showing the age of the main depth maps used in the 3D model (dashed lines). Black points indicate the stratigraphic level
of source rock units. Wavy lines indicate major unconformities in the German onshore and offshore area. Square brackets indicate the varying age of the
unconformity. The geological timescale after Menning (2012) was used. The chart also shows the Southern Permian Basin Atlas (Doornenbal & Stevenson
2010) and the mapping study in the Netherlands North Sea sector after Kombrink et al. (2012). The last column describes the main tectonic phases recognized
within the 3D basin modelling study.
3D BASIN & PETROLEUM SYSTEM MODEL (ENTENSCHNABEL)
by guest on December 23, 2019http://pgc.lyellcollection.org/Downloaded from
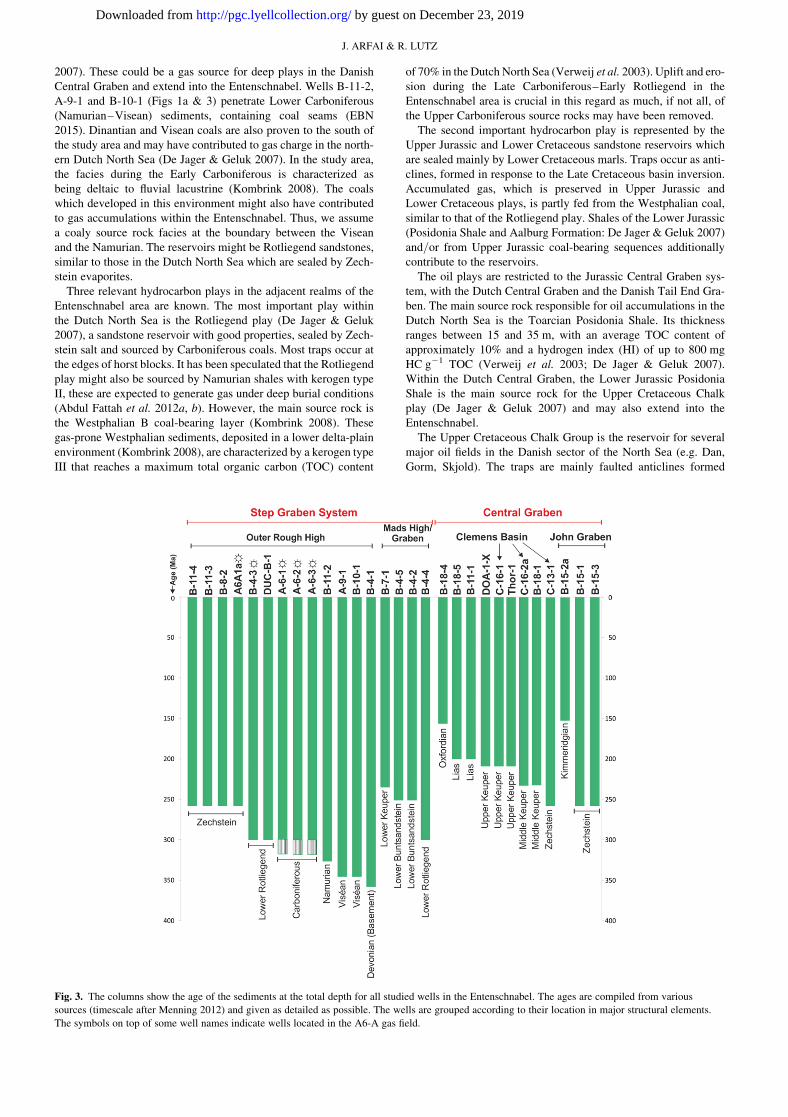
2007). These could be a gas source for deep plays in the Danish
Central Graben and extend into the Entenschnabel. Wells B-11-2,
A-9-1 and B-10-1 (Figs 1a & 3) penetrate Lower Carboniferous
(Namurian–Visean) sediments, containing coal seams (EBN
2015). Dinantian and Visean coals are also proven to the south of
the study area and may have contributed to gas charge in the north-
ern Dutch North Sea (De Jager & Geluk 2007). In the study area,
the facies during the Early Carboniferous is characterized as
being deltaic to fluvial lacustrine (Kombrink 2008). The coals
which developed in this environment might also have contributed
to gas accumulations within the Entenschnabel. Thus, we assume
a coaly source rock facies at the boundary between the Visean
and the Namurian. The reservoirs might be Rotliegend sandstones,
similar to those in the Dutch North Sea which are sealed by Zech-
stein evaporites.
Three relevant hydrocarbon plays in the adjacent realms of the
Entenschnabel area are known. The most important play within
the Dutch North Sea is the Rotliegend play (De Jager & Geluk
2007), a sandstone reservoir with good properties, sealed by Zech-
stein salt and sourced by Carboniferous coals. Most traps occur at
the edges of horst blocks. It has been speculated that the Rotliegend
play might also be sourced by Namurian shales with kerogen type
II, these are expected to generate gas under deep burial conditions
(Abdul Fattah et al. 2012a, b). However, the main source rock is
the Westphalian B coal-bearing layer (Kombrink 2008). These
gas-prone Westphalian sediments, deposited in a lower delta-plain
environment (Kombrink 2008), are characterized by a kerogen type
III that reaches a maximum total organic carbon (TOC) content
of 70% in the Dutch North Sea (Verweij et al. 2003). Uplift and ero-
sion during the Late Carboniferous–Early Rotliegend in the
Entenschnabel area is crucial in this regard as much, if not all, of
the Upper Carboniferous source rocks may have been removed.
The second important hydrocarbon play is represented by the
Upper Jurassic and Lower Cretaceous sandstone reservoirs which
are sealed mainly by Lower Cretaceous marls. Traps occur as anti-
clines, formed in response to the Late Cretaceous basin inversion.
Accumulated gas, which is preserved in Upper Jurassic and
Lower Cretaceous plays, is partly fed from the Westphalian coal,
similar to that of the Rotliegend play. Shales of the Lower Jurassic
(Posidonia Shale and Aalburg Formation: De Jager & Geluk 2007)
and/or from Upper Jurassic coal-bearing sequences additionally
contribute to the reservoirs.
The oil plays are restricted to the Jurassic Central Graben sys-
tem, with the Dutch Central Graben and the Danish Tail End Gra-
ben. The main source rock responsible for oil accumulations in the
Dutch North Sea is the Toarcian Posidonia Shale. Its thickness
ranges between 15 and 35 m, with an average TOC content of
approximately 10% and a hydrogen index (HI) of up to 800 mg
HC g21 TOC (Verweij et al. 2003; De Jager & Geluk 2007).
Within the Dutch Central Graben, the Lower Jurassic Posidonia
Shale is the main source rock for the Upper Cretaceous Chalk
play (De Jager & Geluk 2007) and may also extend into the
Entenschnabel.
The Upper Cretaceous Chalk Group is the reservoir for several
major oil fields in the Danish sector of the North Sea (e.g. Dan,
Gorm, Skjold). The traps are mainly faulted anticlines formed
Fig. 3. The columns show the age of the sediments at the total depth for all studied wells in the Entenschnabel. The ages are compiled from various
sources (timescale after Menning 2012) and given as detailed as possible. The wells are grouped according to their location in major structural elements.
The symbols on top of some well names indicate wells located in the A6-A gas field.
J. ARFAI & R. LUTZ
by guest on December 23, 2019http://pgc.lyellcollection.org/Downloaded from

during Late Cretaceous basin inversion. Within the Danish North
Sea, the Upper Cretaceous play is sourced by excellent Upper
Jurassic shales. The oil source rock is the Bo Member (Hot
Shale) of the Farsund Formation in the Danish offshore, which is
equivalent to the Kimmeridge Clay Formation in the British off-
shore sector and the Clay Deep Member in the Dutch North Sea
(Ineson et al. 2003). A few wells encountered the Hot Shale layer
in the Entenschnabel: for example, well DUC-B-1 (Fig. 1a) located
south of the Outer Rough Basin. The thickness of the Hot Shale in
DUC-B-1 is 85 m. Similar deposits within the Danish Central Gra-
ben are good to very good source rocks. This mudstone-dominated
succession is typically 15–30 m thick, showing high HI values of
between 200 and 600 mg HC g21 TOC, and has a TOC content
of 3–8%, although locally exceeding 15% (Ineson et al. 2003).
As described above, source rocks, as well as reservoirs, are pre-
sent all around the German Entenschnabel (e.g. Lokhorst 1998; Ine-
son et al. 2003; De Jager & Geluk 2007; Kombrink 2008). This
motivated the study of the petroleum potential of the Entenschnabel
area using 3D basin and petroleum system modelling.
Basin model: methods and database, input andboundary conditions
Methods and database
3D petroleum system modelling was performed with the software
PetroMod V. 14. The software calculates the evolution of a sedi-
mentary basin from the oldest to the youngest event (forward mod-
elling), and the processes of petroleum generation and migration
(Hantschel & Kauerauf 2009). For the calculation of vitrinite reflec-
tance from temperature histories, the EASY%Ro algorithm of
Sweeney & Burnham (1990) is used. This calculation method fol-
lows a kinetic reaction scheme, and is valid for calculated reflec-
tance values between 0.3 and 4.5%. To depict the burial, thermal
and maturity history of the study area, we used representative 1D
extractions of the 3D model at well locations in the NW and central
part of the Entenschnabel, as well as within the Central Graben
area. Additionally, maps of calculated maturity and transformation
ratios are presented.
Detailed mapping in the Entenschnabel (Arfai et al. 2014) pro-
vided the present-day stratigraphic and structural framework of
the model from base Zechstein to Present. Fourteen depth grids
(250 × 250 m cell size) and thickness maps of prominent seismic
formations were taken from this study. This was complemented
with pre-Zechstein formations (358–260.5 Ma), including the
Carboniferous–Rotliegend sedimentary successions adopted from
literature (Krull 2005; Geluk 2007; Doornenbal & Stevenson
2010). For modelling purposes, information from 29 confidential
wells covering the study area was used. Results of three wells
with geological information and calibration data (vitrinite reflec-
tance and/or temperature data) are shown in anonymized form,
representing the two structural elements: the Central Graben and
the Step Graben System, respectively. The well-penetration chart
(Fig. 3) illustrates that most of the wells in the study area terminate
either in the Mesozoic or within the Zechstein level. Consequently,
temperature data from deeper stratigraphic units are restricted or
even not available for the Central Graben area. Eight wells were
drilled to the pre-Zechstein level located in the Step Graben
System. Well B-11-2, drilled on a basement high, reached Namur-
ian–Visean sedimentary sequences and is located in the immediate
vicinity of the Central Graben area (Figs 1 & 3).
Geological model
The input model consists of 27 stratigraphic layers covering a time
interval from the Early Carboniferous to the Present.
A sedimentary basement of 2000 m thickness for the Dinantian
and Devonian is added to extend the 3D model below the Upper
Carboniferous. The latter is separated into the Stephanian, West-
phalian and Namurian, whereby present-day and palaeothickness
values are based on Krull (2005). The Namurian succession is
assumed to have a constant thickness of 500 m in large parts of
the study area. Locally, thicknesses of up to 920 m were assigned
for the Namurian based on well data.
Lower Rotliegend distribution within the Entenschnabel area is
taken from Geluk (2007). A present-day thickness of 100 m is
assigned for the Lower Rotliegend layer, as Geluk (2007) assumed
a similar value for the Lower Rotliegend Group within the Dutch
North Sea. Upper Rotliegend depth and thickness maps are based
on Doornenbal & Stevenson (2010). The thickness of the Upper
Rotliegend ranges between 0 and 600 m. An initial depositional
thickness of 700 m is assumed for the Zechstein layer. Salt move-
ment is realized in such a way that parts of the overlying layers are
replaced by salt lithology during subsequent time intervals (facies
piercing), which mimics the evolution of salt bodies. Salt diapirism
started in the Late Triassic.
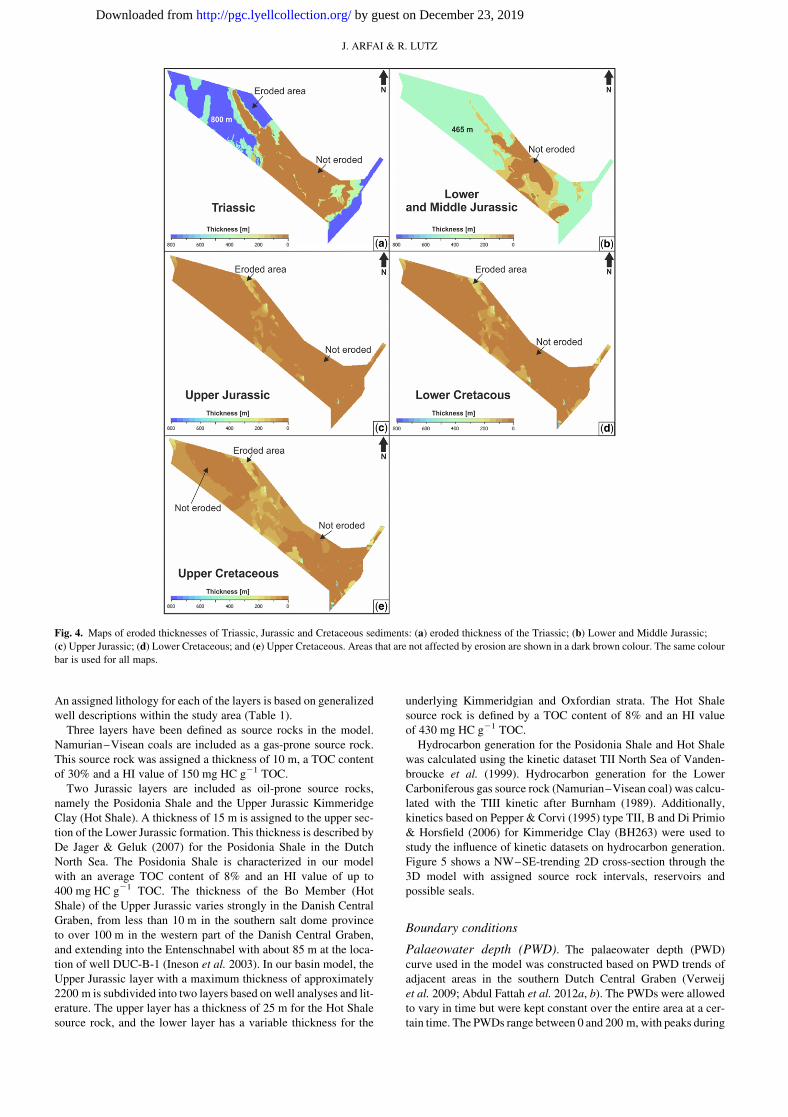
For areas where the Triassic is completely eroded at the present
day, a depositional thickness of 800 m is estimated based on struc-
tural maps and seismic data. The present-day thicknesses of Trias-
sic sediments incorporated into the 3D model are taken from Arfai
et al. (2014). The Lower Jurassic and the Upper Jurassic are divided
into two units, respectively, to consider the source rock layers of
each formation. The estimated total depositional thickness of the
Lower and Middle Jurassic sediments is 465 m. The depositional
thickness of the Upper Jurassic, Lower Cretaceous and Upper Cre-
taceous in eroded areas is interpolated using the thickness map from
Arfai et al. (2014). Erosion maps for the main erosional phases (Tri-
assic, Jurassic and Cretaceous) are illustrated in Figure 4.
Four erosional phases are included in the basin model: the Saa-
lian (Late Carboniferous–Early Permian); the Mid-Cimmerian
(Mid-Jurassic); the Sub-Hercynian inversion (Late Cretaceous);
and a final one during Mid-Miocene time (Fig. 2).
Upper Carboniferous sediments have not been encountered in
wells and their sediment distribution is not indicated in the maps
by Doornenbal & Stevenson (2010): therefore we assume that the
Saalian erosion event removed previously deposited Stephanian
and Westphalian sediments throughout the study area. The palaeo-
thicknesses of the Westphalian and Stephanian sediments are
each 500 m.
The domal uplift during the Mid–Late Cimmmerian phase
resulted in a widespread erosion in large parts of the study area.
The intensity and amount of erosion varied in the area, depending
on the structural elements (basin, high or platform). The erosion
event began during the Bathonian (165 Ma) and ended in the
Callovian (156 Ma). Layers that were affected by this erosional
phase include the Lower and Middle Buntsandstein, Upper Bunt-
sandstein, Muschelkalk, Keuper, Lower Jurassic, and Middle
Jurassic.
A major Late Cretaceous inversion phase in the North Sea Basin
resulted in uplift and erosion of the sedimentary fill in different
pulses. Partly, Upper Jurassic, Lower Cretaceous and Upper Creta-
ceous sediments were eroded in the central and NW part of the
study area. Here, erosion during the Late Cretaceous was active
between 98 and 89 Ma. Therefore, subdivision of the Upper Creta-
ceous succession into three units (Cenomanian–Turonian; Conia-
cian–Santonian; and Campanian–Danian) was done to consider
a local erosional phase in the NW on the Step Graben System dur-
ing the Coniacian–Santonian. During this phase, sedimentation
continued in the Central Graben.
The final erosion during the Mid-Miocene, with a duration of
3 Ma, is included within erosion 30 m in thickness. Periods of sed-
imentation, erosion and non-deposition are summarized in Table 1.
3D BASIN & PETROLEUM SYSTEM MODEL (ENTENSCHNABEL)
by guest on December 23, 2019http://pgc.lyellcollection.org/Downloaded from
An assigned lithology for each of the layers is based on generalized
well descriptions within the study area (Table 1).
Three layers have been defined as source rocks in the model.
Namurian–Visean coals are included as a gas-prone source rock.
This source rock was assigned a thickness of 10 m, a TOC content
of 30% and a HI value of 150 mg HC g21 TOC.
Two Jurassic layers are included as oil-prone source rocks,
namely the Posidonia Shale and the Upper Jurassic Kimmeridge
Clay (Hot Shale). A thickness of 15 m is assigned to the upper sec-
tion of the Lower Jurassic formation. This thickness is described by
De Jager & Geluk (2007) for the Posidonia Shale in the Dutch
North Sea. The Posidonia Shale is characterized in our model
with an average TOC content of 8% and an HI value of up to
400 mg HC g21 TOC. The thickness of the Bo Member (Hot
Shale) of the Upper Jurassic varies strongly in the Danish Central
Graben, from less than 10 m in the southern salt dome province
to over 100 m in the western part of the Danish Central Graben,
and extending into the Entenschnabel with about 85 m at the loca-
tion of well DUC-B-1 (Ineson et al. 2003). In our basin model, the
Upper Jurassic layer with a maximum thickness of approximately
2200 m is subdivided into two layers based on well analyses and lit-
erature. The upper layer has a thickness of 25 m for the Hot Shale
source rock, and the lower layer has a variable thickness for the
underlying Kimmeridgian and Oxfordian strata. The Hot Shale
source rock is defined by a TOC content of 8% and an HI value
of 430 mg HC g21 TOC.
Hydrocarbon generation for the Posidonia Shale and Hot Shale
was calculated using the kinetic dataset TII North Sea of Vanden-
broucke et al. (1999). Hydrocarbon generation for the Lower
Carboniferous gas source rock (Namurian–Visean coal) was calcu-
lated with the TIII kinetic after Burnham (1989). Additionally,
kinetics based on Pepper & Corvi (1995) type TII, B and Di Primio
& Horsfield (2006) for Kimmeridge Clay (BH263) were used to
study the influence of kinetic datasets on hydrocarbon generation.
Figure 5 shows a NW–SE-trending 2D cross-section through the
3D model with assigned source rock intervals, reservoirs and
possible seals.
Boundary conditions
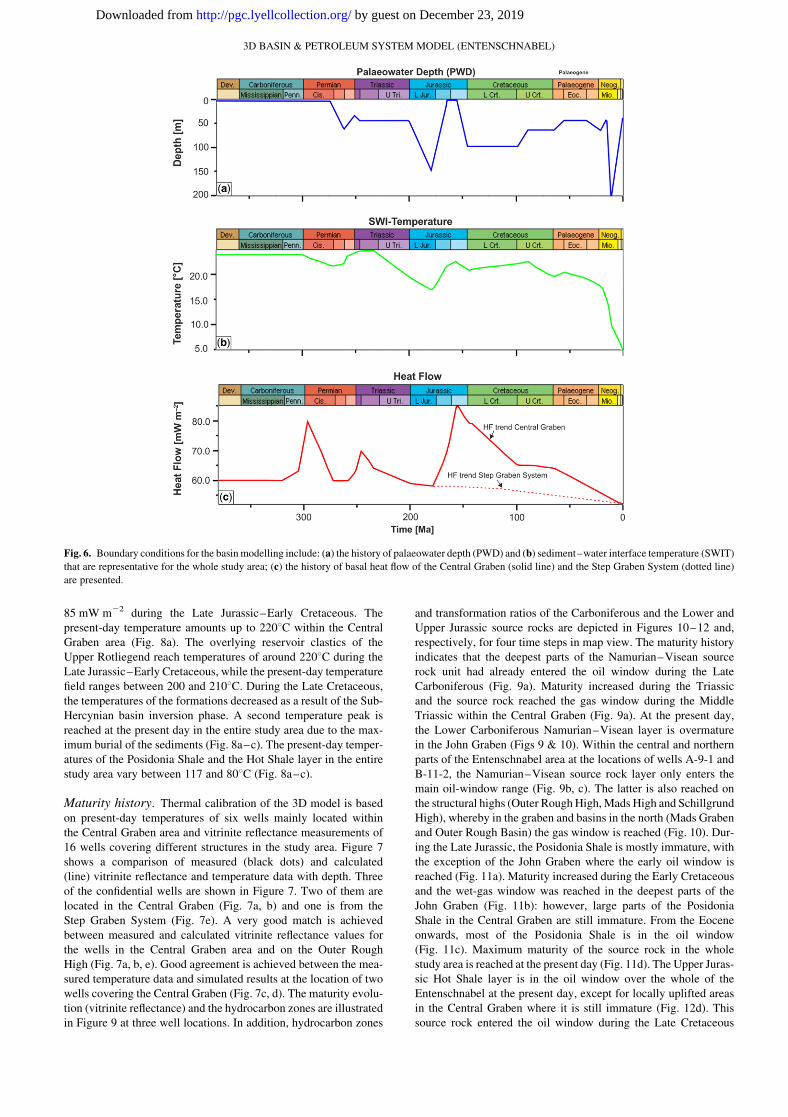
Palaeowater depth (PWD). The palaeowater depth (PWD)
curve used in the model was constructed based on PWD trends of
adjacent areas in the southern Dutch Central Graben (Verweij
et al. 2009; Abdul Fattah et al. 2012a, b). The PWDs were allowed
to vary in time but were kept constant over the entire area at a cer-
tain time. The PWDs range between 0 and 200 m, with peaks during
Fig. 4. Maps of eroded thicknesses of Triassic, Jurassic and Cretaceous sediments: (a) eroded thickness of the Triassic; (b) Lower and Middle Jurassic;
(c) Upper Jurassic; (d) Lower Cretaceous; and (e) Upper Cretaceous. Areas that are not affected by erosion are shown in a dark brown colour. The same colour
bar is used for all maps.
J. ARFAI & R. LUTZ
by guest on December 23, 2019http://pgc.lyellcollection.org/Downloaded from

the Early and Middle Jurassic (150 m), the Early Cretaceous
(100 m), and the Late Neogene (200 m) (Fig. 6a).
Sediment–water interface temperature (SWIT). The palaeo-
surface temperature at the sediment–water interface was cal-
culated with an integrated software tool that takes into account
the PWD and the palaeolatitude of the study area (Wygrala 1989)
(Fig. 6b).
Basal heat flow. One heat flow trend was assigned to the Step
Graben System and a different one to the Central Graben. The ther-
mal and maturity history of the Central Graben area includes a heat
flow peak of 80 mW m22 during the Early Permian attributed to
rifting and also manifested in volcanic activity in the Central Euro-
pean Basin, including the North Sea region (Fig. 6c). The value
used is one according to Kearey et al. (2009) for a wide rift
mode. During the Early–Late Triassic (246 Ma), a second peak
Table 1. Input data for modelling purposes including periods of sedimentation, erosion and non-deposition, and 27 layers and assigned lithological
composition representative for the study area
Model layer horizon Deposited
from (Ma)
Deposited
to (Ma)
Erosion
start (Ma)
Erosion
end (Ma)
Lithology
1 Tortonian and Holocene 11.2 0.00 90% Shale (organic lean, silty), 10% siltstone
(organic lean)
2 MMU and Serravallian 15.97 14.7 14.7 11.2 90% Shale (organic lean, silty), 10% siltstone
(organic lean)
3 Lower Miocene 20.5 15.97 90% Shale (organic lean, silty), 10% siltstone
(organic lean)
4 Oligocene 33.7 20.5 90% Siltstone (organic lean), 10% shale
(organic lean, silty)
5 Eocene 54.8 33.7 70% Shale (organic lean, silty), 30% siltstone
(organic lean)
6 Paleocene 65 54.8 90% Shale (organic lean, typical), 10% tuff (basaltic)
7 Campanian and Danian 83.5 65 Limestone (chalk, typical)
8 Coniacian and Santonian 89 83.5 Limestone (chalk, typical)
9 Cenomanian and Turonian 98.9 89 89 88.2 Limestone (chalk, typical)
10 Lower Cretaceous 142 98.9 88.2 87.6 65% Marl, 20% shale, 15% siltstone
11 Hot Shale (Upper Jurassic) 144 142 87.6 87.3 Shale (organic rich, typical)
12 Upper Jurassic 156.5 144 87.3 83.5 75% Shale (organic lean, typical) 25% sandstone
(typical)
13 Middle Jurassic 178 165 165 163 50% Sandstone (typical), 50% Siltstone (organic lean)
14 Posidonia Shale
(Lower Jurassic)
180 178 163.9 163.8 Shale (organic rich, typical)
15 Lower Jurassic 200 180 163.8 161.8 75% Shale (organic lean, typical) 25% sandstone
(typical)
16 Keuper 234 200 161.8 159.5 45% Shale, 35% marl, 10% sandstone, 10% anhydrite
17 Upper Buntsandstein and
Muschelkalk
246 234 159.5 158.5 60% Shale, 35% siltstone, 5% sandstone
18 Lower and Middle
Buntsandstein
251 246 158.5 156.5 60% Shale, 35% siltstone, 5% sandstone
19 Zechstein salt 258 251 Salt
20 Zechstein carbonate 260 258 20% Anhydrite, 80% carbonate (dolomite)
21 Upper Rotliegend 272.5 260.5 Sandstone (typical)
22 Lower Rotliegend 296 272.5 75% Siltstone (organic lean), 25% shale
(organic lean, silty)
23 Stephanian 305 304 304 301.3 Sandstone (typical)
24 Westphalian 320 305 301.3 298.6 80% Shale (typical), 25% sandstone (typical0
25 Namurian 326.5 320 298.6 296 60% Shale (organic reach, typical), 40% sandstone
(typical)
26 Namurian–Visean 330 326.5 50% Siltstone (organic reach, typical), 25% coal (silty),
15% sandstone (typical)
27 Sedimentary basement 380 330 Siltstone (organic lean)
Source rocks are marked in italic.
3D BASIN & PETROLEUM SYSTEM MODEL (ENTENSCHNABEL)
by guest on December 23, 2019http://pgc.lyellcollection.org/Downloaded from

(70 mW m22) is included in the heat flow trend attributed to first
post-orogenic (Variscan Orogeny) rifting phases. This rifting
stage is characterized by the beginning of graben formation, and
subsequent Triassic–Middle Jurassic tectonic subsidence and
thickening of sediments within the Central Graben area. A third
peak value (85 mW m22) during the Late Jurassic at 156 Ma repre-
sents the main heat flow event in the Central Graben area (Fig. 6c).
This major extensional phase during the Late Jurassic formed the
present-day Central Graben geometry. Subsequent Cretaceous
and Cenozoic subsidence was largely controlled by a phase of post-
rift thermal subsidence. The compressional stress regime resulted
in several phases of basin inversion during the Late Cretaceous.
However, this event had only a minor impact on the heat flow his-
tory and we assigned a heat flow value of 65 mW m22 for this time
period. The present-day heat flow was calibrated based on temper-
ature and vitrinite reflectance data.
The heat flow trend for the Step Graben System is the same as for
the Central Graben until the Middle Jurassic. The Late Jurassic rift-
ing of the Central Graben is omitted in the Step Graben heat flow
trend (Fig. 6c, dotted line). The values decrease constantly from
the Middle Jurassic to the present-day value of 52 mW m22.
Figure 7 shows the fit between measured and modelled vitrinite
reflectance values for three wells with vitrinite reflectance values
measured over a wide depth range.
Results
Burial history
The present-day German Central Graben area is dominated
by major subsidence and sedimentation events during the Late
Carboniferous, Late Permian–Early Triassic and the Late Jurassic.
This is visualized by a 1D extraction of the burial history at the
location of well C-16-1 (Fig. 8a). The presence of Zechstein evap-
orites greatly influenced the post-Permian structural and sedimen-
tary development of the area (Fig. 5). The initial depositional
thickness of the Zechstein Group in the 3D model is 700 m, while
its present-day thickness varies from approximately 3000 m to only
a few metres on structural highs. Significant subsidence occurred
during the Late Jurassic (Figs 5 & 8). An additional, Late Creta-
ceous phase of rapid subsidence and sedimentation is distinct in
the Central Graben area (Fig. 8a). The central and NW part of the
Entenschnabel has under gone less burial than the rest of the area
(Fig. 8b, c). The current burial of the source rock units shows a
decreasing trend from the Central Graben area towards the NW.
Thus, the burial depth of Lower Carboniferous source rocks
(Namurian–Visean) within the Central Graben at the present day
shows a difference of approximately 3000 m to those preserved
within the NW part of the Entenschnabel (Fig. 8c). A phase of uplift
and erosion affected the entire study area during the Late Carbon-
iferous (Fig. 8). Significant uplift occurred during the Late Jurassic
visible in the NW part of the Entenschnabel at the location of well
A-9-1 (Fig. 8c). As a result of significant pulses of inversion tecton-
ics, a second important phase of tectonic uplift occurs during the
Mid–Late Cretaceous (e.g. Fig. 8b).
Thermal and maturity history
Thermal history. The Namurian–Visean unit reached a maxi-
mum temperature of up to 2508C during the Late Jurassic
(Fig. 8). This temperature is related to the burial depth of the forma-
tion, and the assumed heat flow value ranging between 80 and
Fig. 5. NW–SE-trending 2D cross-section through the 3D model. The cross-section shows the three source rocks, and the possible reservoirs and seals:
27 stratigraphic layers covering a time interval from the Devonian to the present are indicated by the coloured scale.
J. ARFAI & R. LUTZ
by guest on December 23, 2019http://pgc.lyellcollection.org/Downloaded from
85 mW m22 during the Late Jurassic–Early Cretaceous. The
present-day temperature amounts up to 2208C within the Central
Graben area (Fig. 8a). The overlying reservoir clastics of the
Upper Rotliegend reach temperatures of around 2208C during the
Late Jurassic–Early Cretaceous, while the present-day temperature
field ranges between 200 and 2108C. During the Late Cretaceous,
the temperatures of the formations decreased as a result of the Sub-
Hercynian basin inversion phase. A second temperature peak is
reached at the present day in the entire study area due to the max-
imum burial of the sediments (Fig. 8a–c). The present-day temper-
atures of the Posidonia Shale and the Hot Shale layer in the entire
study area vary between 117 and 808C (Fig. 8a–c).
Maturity history. Thermal calibration of the 3D model is based
on present-day temperatures of six wells mainly located within
the Central Graben area and vitrinite reflectance measurements of
16 wells covering different structures in the study area. Figure 7
shows a comparison of measured (black dots) and calculated
(line) vitrinite reflectance and temperature data with depth. Three
of the confidential wells are shown in Figure 7. Two of them are
located in the Central Graben (Fig. 7a, b) and one is from the
Step Graben System (Fig. 7e). A very good match is achieved
between measured and calculated vitrinite reflectance values for
the wells in the Central Graben area and on the Outer Rough
High (Fig. 7a, b, e). Good agreement is achieved between the mea-
sured temperature data and simulated results at the location of two
wells covering the Central Graben (Fig. 7c, d). The maturity evolu-
tion (vitrinite reflectance) and the hydrocarbon zones are illustrated
in Figure 9 at three well locations. In addition, hydrocarbon zones
and transformation ratios of the Carboniferous and the Lower and
Upper Jurassic source rocks are depicted in Figures 10–12 and,
respectively, for four time steps in map view. The maturity history
indicates that the deepest parts of the Namurian–Visean source
rock unit had already entered the oil window during the Late
Carboniferous (Fig. 9a). Maturity increased during the Triassic
and the source rock reached the gas window during the Middle
Triassic within the Central Graben (Fig. 9a). At the present day,
the Lower Carboniferous Namurian–Visean layer is overmature
in the John Graben (Figs 9 & 10). Within the central and northern
parts of the Entenschnabel area at the locations of wells A-9-1 and
B-11-2, the Namurian–Visean source rock layer only enters the
main oil-window range (Fig. 9b, c). The latter is also reached on
the structural highs (Outer Rough High, Mads High and Schillgrund
High), whereby in the graben and basins in the north (Mads Graben
and Outer Rough Basin) the gas window is reached (Fig. 10). Dur-
ing the Late Jurassic, the Posidonia Shale is mostly immature, with
the exception of the John Graben where the early oil window is
reached (Fig. 11a). Maturity increased during the Early Cretaceous
and the wet-gas window was reached in the deepest parts of the
John Graben (Fig. 11b): however, large parts of the Posidonia
Shale in the Central Graben are still immature. From the Eocene
onwards, most of the Posidonia Shale is in the oil window
(Fig. 11c). Maximum maturity of the source rock in the whole
study area is reached at the present day (Fig. 11d). The Upper Juras-
sic Hot Shale layer is in the oil window over the whole of the
Entenschnabel at the present day, except for locally uplifted areas
in the Central Graben where it is still immature (Fig. 12d). This
source rock entered the oil window during the Late Cretaceous
Fig. 6. Boundary conditions for the basin modelling include: (a) the history of palaeowater depth (PWD) and (b) sediment–water interface temperature (SWIT)
that are representative for the whole study area; (c) the history of basal heat flow of the Central Graben (solid line) and the Step Graben System (dotted line)
are presented.
3D BASIN & PETROLEUM SYSTEM MODEL (ENTENSCHNABEL)
by guest on December 23, 2019http://pgc.lyellcollection.org/Downloaded from
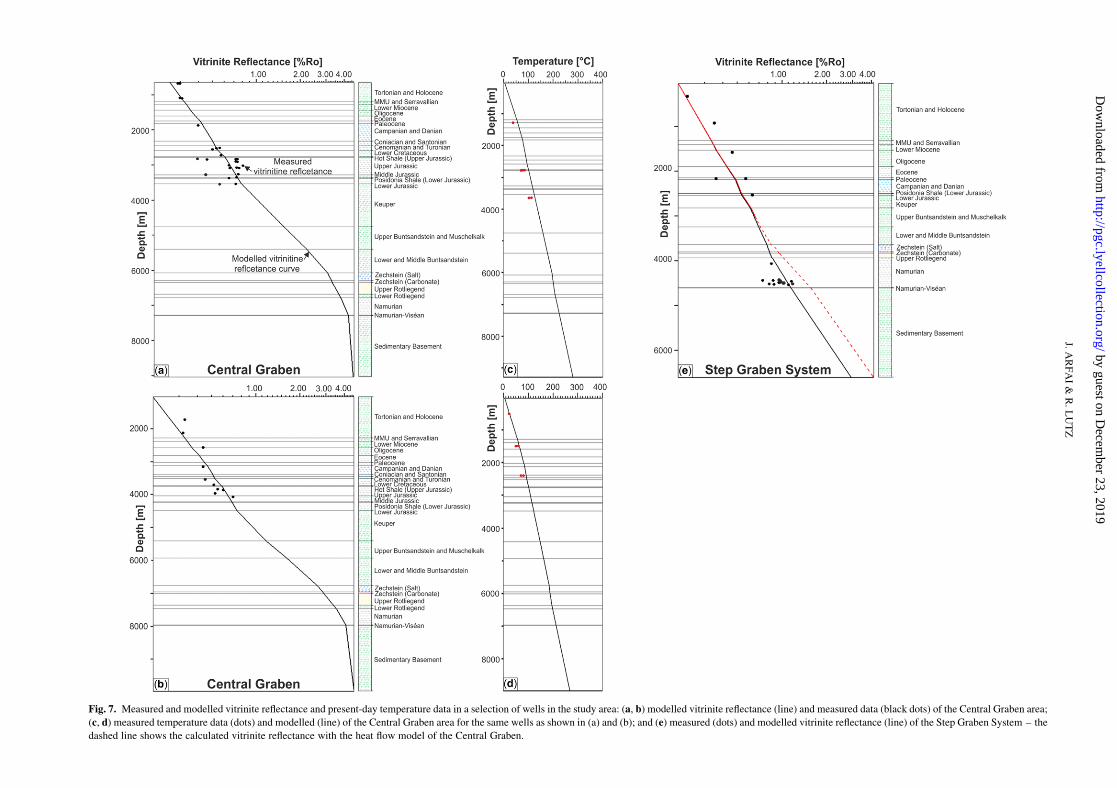
Fig. 7. Measured and modelled vitrinite reflectance and present-day temperature data in a selection of wells in the study area: (a, b) modelled vitrinite reflectance (line) and measured data (black dots) of the Central Graben area;
(c, d) measured temperature data (dots) and modelled (line) of the Central Graben area for the same wells as shown in (a) and (b); and (e) measured (dots) and modelled vitrinite reflectance (line) of the Step Graben System – the
dashed line shows the calculated vitrinite reflectance with the heat flow model of the Central Graben.
J.A
RF
AI
&R
.L
UT
Z
by guest on Decem
ber 23, 2019http://pgc.lyellcollection.org/
Dow
nloaded from
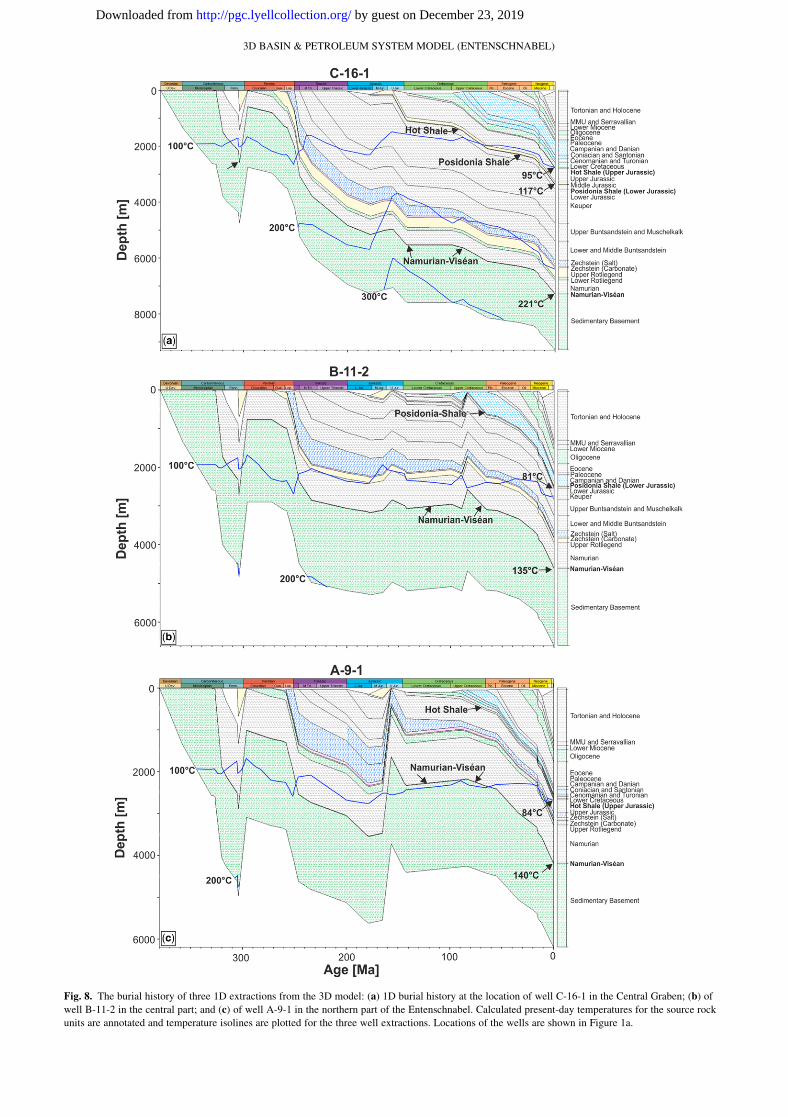
Fig. 8. The burial history of three 1D extractions from the 3D model: (a) 1D burial history at the location of well C-16-1 in the Central Graben; (b) of
well B-11-2 in the central part; and (c) of well A-9-1 in the northern part of the Entenschnabel. Calculated present-day temperatures for the source rock
units are annotated and temperature isolines are plotted for the three well extractions. Locations of the wells are shown in Figure 1a.
3D BASIN & PETROLEUM SYSTEM MODEL (ENTENSCHNABEL)
by guest on December 23, 2019http://pgc.lyellcollection.org/Downloaded from
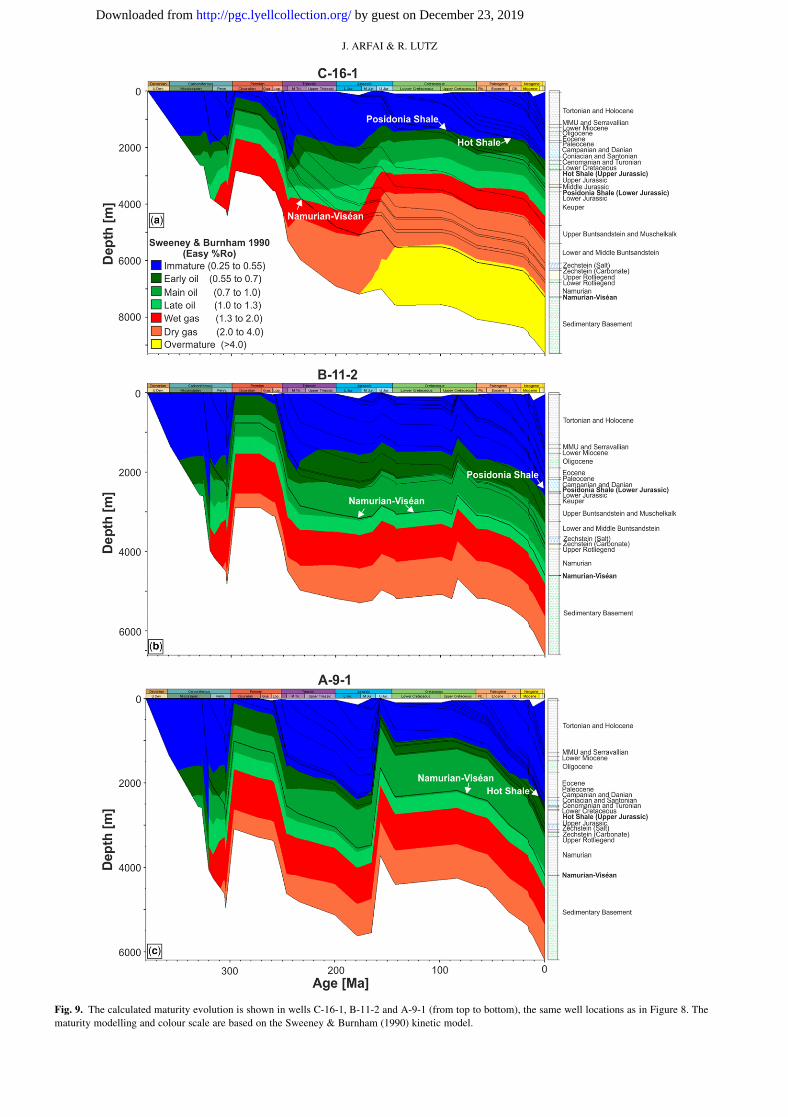
Fig. 9. The calculated maturity evolution is shown in wells C-16-1, B-11-2 and A-9-1 (from top to bottom), the same well locations as in Figure 8. The
maturity modelling and colour scale are based on the Sweeney & Burnham (1990) kinetic model.
J. ARFAI & R. LUTZ
by guest on December 23, 2019http://pgc.lyellcollection.org/Downloaded from

Fig. 10. Calculated maturity (vitrinite reflectance values: Sweeney & Burnham 1990) at the top of the Namurian–Visean unit over four time steps: (a) Late
Carboniferous; (b) Late Triassic; (c) Late Jurassic and (d) the present day. (e)–(h) The calculated transformation ratios for the same time steps as above.
The calculated transformation ratios are based on Burnham (1989) TIII for the Namurian–Visean source rock.
3D BASIN & PETROLEUM SYSTEM MODEL (ENTENSCHNABEL)
by guest on December 23, 2019http://pgc.lyellcollection.org/Downloaded from
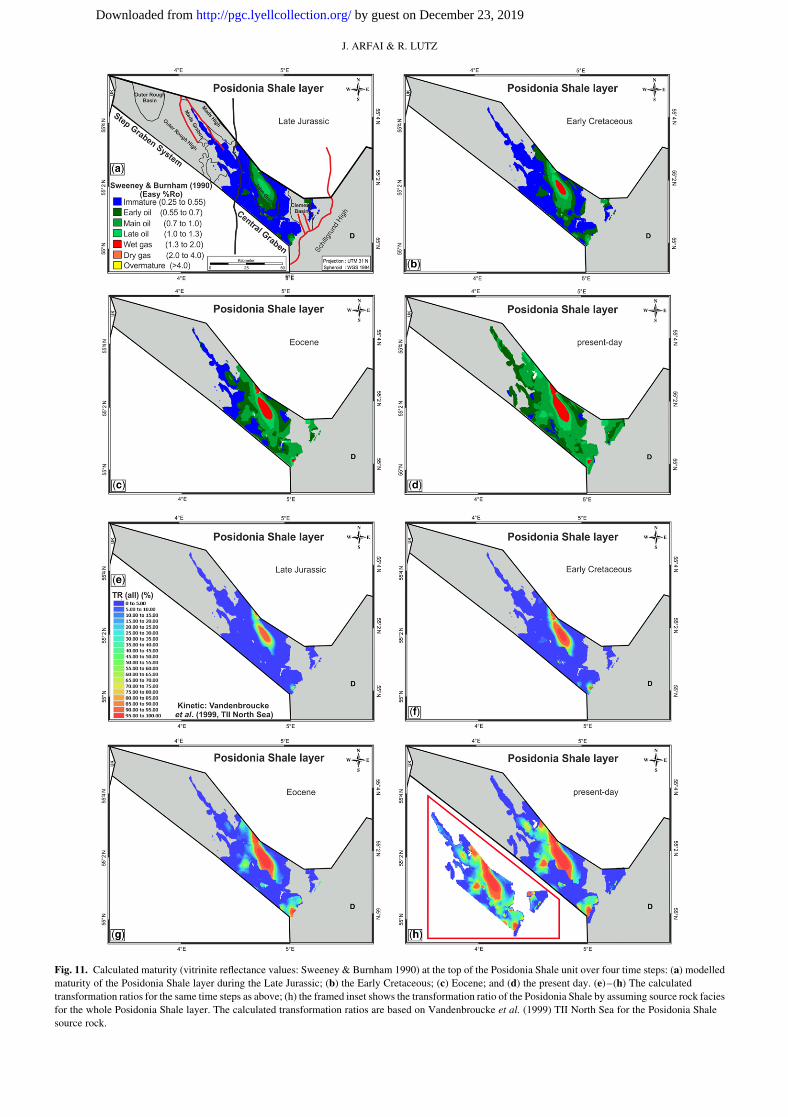
Fig. 11. Calculated maturity (vitrinite reflectance values: Sweeney & Burnham 1990) at the top of the Posidonia Shale unit over four time steps: (a) modelled
maturity of the Posidonia Shale layer during the Late Jurassic; (b) the Early Cretaceous; (c) Eocene; and (d) the present day. (e)–(h) The calculated
transformation ratios for the same time steps as above; (h) the framed inset shows the transformation ratio of the Posidonia Shale by assuming source rock facies
for the whole Posidonia Shale layer. The calculated transformation ratios are based on Vandenbroucke et al. (1999) TII North Sea for the Posidonia Shale
source rock.
J. ARFAI & R. LUTZ
by guest on December 23, 2019http://pgc.lyellcollection.org/Downloaded from

Fig. 12. Calculated maturity (vitrinite reflectance values; Sweeney & Burnham 1990) at the top of the Hot Shale unit over four time steps: (a) modelled
maturity of the Hot Shale layer during the Late Cretaceous; (b) Eocene; (c) Oligocene; and (d) the present day. (e)–(h) The modelled hydrocarbon
generations for the same time steps as above. The calculated transformation ratios are based on Vandenbroucke et al. (1999) TII North Sea for the Hot
Shale source rock.
3D BASIN & PETROLEUM SYSTEM MODEL (ENTENSCHNABEL)
by guest on December 23, 2019http://pgc.lyellcollection.org/Downloaded from

(Fig. 12a) and later during the Oligocene (27 Ma) at the location of
well C-16-1 (Fig. 9a). The maximum maturity (0.9%Ro) is reached
in the Outer Rough Basin at the present-day.
On the Outer Rough High (Fig. 9c, well A-9-1), the Posidonia
Shale was eroded by Mid-Cimmerian erosion and only the Hot
Shale is preserved there, reaching the oil window first during the
Late Miocene.
Hydrocarbon generation history
The transformation ratio is an indicator of hydrocarbon generation
of the source rocks. The transformation ratios are calculated for the
source rock units according to the assigned reaction kinetics (Van-
denbroucke et al. 1999, TII North Sea; Burnham 1989, TIII), and
are therefore more specific for source rocks than the general classi-
fication using oil and gas windows based on vitrinite reflectance
values. Figures 10–12 show the transformation ratios (TR%) of
the top of the three source rock layers for four time steps.
A remarkable difference is observed in the transformation ratio
of the Namurian–Visean layer between the northern part (Outer
Rough High), the Central Graben area and the southern part on
the Schillgrund High (Fig. 10e–h). The model indicates that the
total transformation of organic material into hydrocarbons is
already reached within the Central Graben (John Graben) during
the Late Jurassic (Fig. 10g). Eighty per cent are reached at the pre-
sent day within the Outer Rough Basin at the border with the Danish
North Sea in the NE (Fig. 10h).
Up to 96% of the organic matter of the Posidonia Shale layer was
transformed during the Late Jurassic–Early Cretaceous within the
deepest parts of the John Graben (Fig. 11e, f ). The maximum of
97% is reached at the present day (Fig. 11h).
The Hot Shale source rock shows only low transformation ratios
of less than 20% within the Central Graben area at the present day
(Fig. 12e–h). There is a remarkable difference with the present-day
transformation ratio of the Hot Shale layer in the Outer Rough
Basin. Here, the transformation ratio reaches up to 78% (Fig.
12h). A significant increase in the transformation ratio is observed
between the Oligocene (44%) and present day (Fig. 12f, g).
Discussion
The aim of this study was to reconstruct the maturity evolution and
petroleum generation of three potential source rocks in the NW
German North Sea.
Uncertainties in the model are introduced from various sources
but can be studied with scenario calculations. We addressed the
uncertainty of the source rock distribution of the Posidonia Shale,
the influence of different reaction kinetics on the marginally mature
Hot Shale and the influence of initial salt thicknesses.
In the simulations, we assumed that the Namurian–Visean
source rock is present across the whole study area (Fig. 10). We
also assigned source rock properties for the entire Hot Shale
layer, which is partly eroded in the Step Graben System
(Fig. 12). The distribution of the Posidonia Shale was greatly
reduced by erosion during the Mid-Cimmerian tectonic phase. In
the Step Graben System, only erosional remnants of the Posidonia
Shale occur within the Mads Graben. In the Central Graben, the
Posidonia Shale is present to a large extent but was eroded towards
the Schillgrund High (Fig. 11). In the base model, we only assigned
source rock properties to the Posidonia Shale where the Middle
Jurassic is also present, thus reducing the possible kitchen area.
Burial history
1D burial histories indicate that deepest burial is at the present day,
and is associated with the maximum maturity of the source rocks in
the NW and SE part of the study area (Figs 10–12). In the north, the
current burial depth of the Lower Carboniferous source rocks is
approximately the same as during the Jurassic (Fig. 9b, c).
Ten Veen et al. (2012) calculated an initial thickness of the Zech-
stein Group of about 700 m within the Dutch North Sea, and we
used this value in our base model. From the Dutch North Sea in
the north into the Entenschnabel and approximately along the Ger-
man–Danish border, the salt basin margin is approached which
leads to reduced Zechstein salt thicknesses. Therefore, we calcu-
lated models using different initial thicknesses of 500 and 900 m
and the present-day thicknesses. The influence of different initial
thicknesses on the present-day maturity of the three source rocks
is negligible for all three models. Nevertheless, the salt thickness
has an influence on migration, especially in the case of a thin salt
layer which can be more easily eroded or mobilized.
Thermal and maturity history
The modelled present-day heat flow is calibrated using measured
vitrinite reflectance and temperature data in wells covering the
study area. The matches between the measured and modelled cali-
bration data suggest that the combination of the present-day heat
flow and the thermal conductivity of the major lithologies is accept-
able (Fig. 7a, b, e). The derived present-day heat flow of
52 mW m22 (Fig. 6c) in the main model scenario is similar to
those used in publications of surrounding realms of the German
Central Graben: for example, Beha et al. (2008: 52 mW m22)
from the Danish Horn Graben; Verweij et al. (2011: 55–
58 mW m22) and Abdul Fattah et al. (2012a) from the NW
Dutch offshore sector and the southern Dutch Central Graben;
and Heim et al. (2013: 55–58 mW m22) on the Schillgrund
High. Based on these data, the thermal history of the Central
Graben in the SE portion of the Entenschnabel area is found to
be distinctly different to that in the central and NW parts of the
Entenschnabel area (Fig. 7e). Therefore, for reconstruction of
the heat flow history from the beginning of basin formation until
the present, two different scenarios for the Step Graben System
and the Central Graben have been applied (Fig. 6c). The main dif-
ference is a Late Jurassic heat flow peak of 85 mW m23 for the
Central Graben, whereas the heat flow for the Step Graben System
does not exceed 57 mW m23 (Fig. 6c). Thus, using a decreasing
heat flow during the Late Jurassic (Fig. 6c, dotted line) to a present-
day value of 52 mW m2 within the Step Graben System, the mod-
elled results of the Namurian–Visean source rock interval (Fig. 7e,
dashed line) show a better fit to measured vitrinite reflection data
(Fig. 7e, solid line). This shows that the Central Graben area has
experienced higher heat flow values during rifting in the Late Juras-
sic than the central and NW parts of the Entenschnabel.
Hydrocarbon generation (Central Graben)
The Namurian–Visean source rock in the Central Graben entered
the early oil window in the Late Carboniferous and reached an over-
mature state by the Late Jurassic within the John Graben (Fig. 10).
This implies that, if there are gas accumulations from Namurian–
Visean source rocks, the conditions for preservation of gas gener-
ated 150 myr ago must have been favourable for a very long
time, and that the reservoirs were not destroyed by diapirism and
inversion tectonics in the Late Cretaceous. Maturity and hydrocar-
bon generation models in the southern part of the Dutch Central
Graben for the Carboniferous source rocks (Westphalian) describe
a major phase of hydrocarbon generation during the Late Jurassic
and Early Cretaceous times (Verweij et al. 2009). On the graben
shoulder (Schillgrund High), a transformation ratio of around
60% is calculated at the present day. Similar transformation ratios
were calculated for the Carboniferous source rocks on the
J. ARFAI & R. LUTZ
by guest on December 23, 2019http://pgc.lyellcollection.org/Downloaded from
Schillgrund High, already reaching 50% during the Middle Perm-
ian (Heim et al. 2013). It is possible that gas accumulations exist
below the Zechstein salt layer in Rotliegend sediments and/or vol-
canics at depths of generally more than 5500 m. These accumula-
tions might have been affected by salt diapirism (.10 salt diapirs
in the Central Graben) and Late Cretaceous inversion. This could
lead to leaking and dismigration of gas through salt windows and
faults or restructuration of reservoirs.
The calculated transformation ratios indicate that within the John
Graben the Posidonia Shale starts generating hydrocarbons during
Late Jurassic–Early Cretaceous times (Fig. 11a, b). During this
time interval, almost maximum transformation ratios were reached
just before Late Cretaceous inversion tectonics and associated tec-
tonic uplift. This is also in agreement with the hydrocarbon gener-
ation results by Verweij et al. (2009) for the southern Dutch Central
Graben. Hydrocarbon generation in the study area was resumed
during the Paleocene because of continuous burial and continued
until present.
For the base model, we assigned source rock properties for the
Posidonia Shale only where the Middle Jurassic sediments are pre-
sent, to be on the conservative side regarding the extension of the
kitchen area (Fig. 11h). It is possible that the Posidonia Shale is pre-
sent elsewhere as well, thus having a larger kitchen area. The results
of this optimistic model are shown in Figure 11h (inset).
Locally, within the Central Graben, where Triassic–Jurassic
fault systems were reactivated accompanied by salt tectonics dur-
ing the Late Cretaceous inversion phase, the Hot Shale was not bur-
ied deep enough to reach a mature state for hydrocarbon generation
(Fig. 12d, blue coloured areas). Within the Central Graben area, the
Hot Shale Formation generally shows only low transformation
ratios (,20%: Fig. 12e–h). High transformation ratios of up to
60% are calculated only locally in rim synclines around salt diapirs
in the Central Graben, reflecting the high thermal conductivity of
the Zechstein salt (Fig. 12e–h). Thus, only local expulsion from
the Upper Jurassic Hot Shale source rock can be expected, which
might be enough to explain local oil shows in wells. The transfor-
mation ratio in the base model was calculated according to the
kinetic TII, North Sea by Vandenbroucke et al. (1999). To assess
the influence of the reaction kinetics on the transformation ratio
we calculated two additional models using the TIIB (Pepper &
Corvi 1995) and BH263 (Kimmeridge Clay: Di Primio & Horsfield
2006) kinetics. All three kinetics calculate transformation ratios of
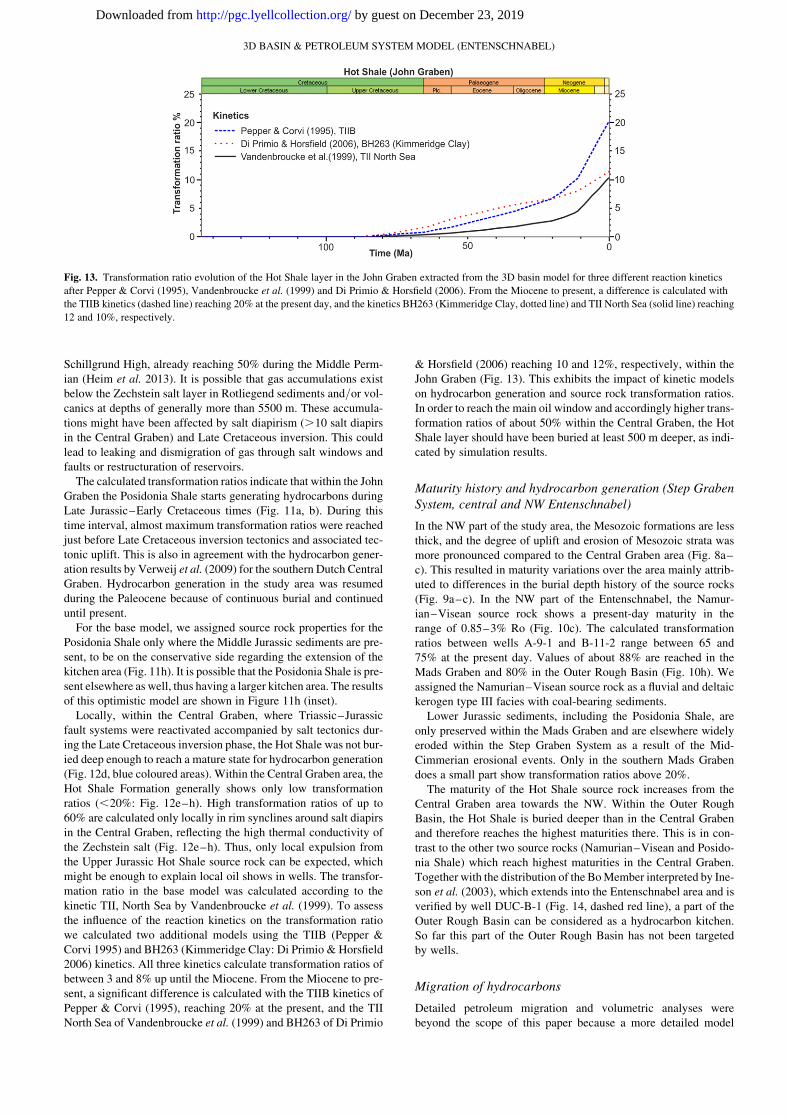
between 3 and 8% up until the Miocene. From the Miocene to pre-
sent, a significant difference is calculated with the TIIB kinetics of
Pepper & Corvi (1995), reaching 20% at the present, and the TII
North Sea of Vandenbroucke et al. (1999) and BH263 of Di Primio
& Horsfield (2006) reaching 10 and 12%, respectively, within the
John Graben (Fig. 13). This exhibits the impact of kinetic models
on hydrocarbon generation and source rock transformation ratios.
In order to reach the main oil window and accordingly higher trans-
formation ratios of about 50% within the Central Graben, the Hot
Shale layer should have been buried at least 500 m deeper, as indi-
cated by simulation results.
Maturity history and hydrocarbon generation (Step Graben
System, central and NW Entenschnabel)
In the NW part of the study area, the Mesozoic formations are less
thick, and the degree of uplift and erosion of Mesozoic strata was
more pronounced compared to the Central Graben area (Fig. 8a–
c). This resulted in maturity variations over the area mainly attrib-
uted to differences in the burial depth history of the source rocks
(Fig. 9a–c). In the NW part of the Entenschnabel, the Namur-
ian–Visean source rock shows a present-day maturity in the
range of 0.85–3% Ro (Fig. 10c). The calculated transformation
ratios between wells A-9-1 and B-11-2 range between 65 and
75% at the present day. Values of about 88% are reached in the
Mads Graben and 80% in the Outer Rough Basin (Fig. 10h). We
assigned the Namurian–Visean source rock as a fluvial and deltaic
kerogen type III facies with coal-bearing sediments.
Lower Jurassic sediments, including the Posidonia Shale, are
only preserved within the Mads Graben and are elsewhere widely
eroded within the Step Graben System as a result of the Mid-
Cimmerian erosional events. Only in the southern Mads Graben
does a small part show transformation ratios above 20%.
The maturity of the Hot Shale source rock increases from the
Central Graben area towards the NW. Within the Outer Rough
Basin, the Hot Shale is buried deeper than in the Central Graben
and therefore reaches the highest maturities there. This is in con-
trast to the other two source rocks (Namurian–Visean and Posido-
nia Shale) which reach highest maturities in the Central Graben.
Together with the distribution of the Bo Member interpreted by Ine-
son et al. (2003), which extends into the Entenschnabel area and is
verified by well DUC-B-1 (Fig. 14, dashed red line), a part of the
Outer Rough Basin can be considered as a hydrocarbon kitchen.
So far this part of the Outer Rough Basin has not been targeted
by wells.
Migration of hydrocarbons
Detailed petroleum migration and volumetric analyses were
beyond the scope of this paper because a more detailed model
Fig. 13. Transformation ratio evolution of the Hot Shale layer in the John Graben extracted from the 3D basin model for three different reaction kinetics
after Pepper & Corvi (1995), Vandenbroucke et al. (1999) and Di Primio & Horsfield (2006). From the Miocene to present, a difference is calculated with
the TIIB kinetics (dashed line) reaching 20% at the present day, and the kinetics BH263 (Kimmeridge Clay, dotted line) and TII North Sea (solid line) reaching
12 and 10%, respectively.
3D BASIN & PETROLEUM SYSTEM MODEL (ENTENSCHNABEL)
by guest on December 23, 2019http://pgc.lyellcollection.org/Downloaded from

would be needed that includes faults and more petrophysical data of
carrier and reservoir layers, which were not available. Neverthe-
less, the results of the migration model give important information
about where to focus more detailed studies. The simulation results
indicate that the expulsion of gas from the potential Visean–
Namurian source rock initiated in the Late Carboniferous. Peak
expulsion of gas occurred before the Late Cretaceous inversion.
The Lower Carboniferous source rock extends over the whole
study area and petroleum generation led to the formation of numer-
ous gas accumulations in the Upper Rotliegend below the sealing
Zechstein salt. The Upper Rotliegend is assigned as a typical sand-
stone lithology, thus forming an excellent reservoir layer. By
increasing the lithology porosity of the Zechstein carbonate layer,
the model produces gas accumulations at the location of the
present-day A6-A gas field. This suggests that the present-day res-
ervoir at the location of the A6-A gas field, which is located on the
Mads High, was probably charged by the Namurian–Visean source
rock. The sealing Zechstein layer prevents any migration of Car-
boniferous gas from the Rotliegend into Triassic sediments in
our model.
The Posidonia Shale expelled about 90% of the generated petro-
leum into the overlying sediments in the Central Graben. Expulsion
initiated during the Late Jurassic and increased until present.
Expulsion of hydrocarbons from the Hot Shale source rock
started during the Late Cretaceous. A more detailed study that
includes faults and their properties, as well as a complete migration
simulation, is required to simulate migration and trapping.
Conclusions
Structural data from the Entenschnabel, which is the NW part of
offshore Germany, are used for a 3D reconstruction of the burial
and temperature history, source rock maturity, and timing of hydro-
carbon generation. The study focused on three potential source rock
intervals: the Lower Carboniferous (Namurian–Visean) coal-
bearing source rocks; the marine Lower Jurassic Posidonia Shale;
and the Upper Jurassic Hot Shale:
† The basin modelling, calibrated with vitrinite reflectance data
from 16 wells and temperature data from six wells, resulted in
a present-day basal heat flow of 52 mW m22 for the whole
model area. The thermal history of the Central Graben in the
SE portion of the Entenschnabel area is distinctly different to
that in the central and NW parts. Therefore, two different heat
flow scenarios for the Step Graben System and the Central Gra-
ben, respectively, have been applied. The main difference is a
Late Jurassic heat flow peak of 85 mW m22 for the Central Gra-
ben, whereas the corresponding value during the Late Jurassic
for the Step Graben System does not exceed 57 mW m22.
† The Namurian–Visean source rock had already entered the
hydrocarbon generation zones during Late Carboniferous
times throughout the area. Within the John Graben of the Cen-
tral Graben, the overmature state was reached in the Late Juras-
sic. The Carboniferous source rock charged the A6-A gas field
in the northern Entenschnabel, and the gas accumulation could
Fig. 14. Merged map showing the Late Jurassic tectonic framework of the Danish Central Graben after Ineson et al. (2003) and locations of released wells
where the Bo Member is present. The thickness (in metres) of the Bo Member at well locations and the lateral distribution of this member (blue) as deduced from
well and seismic data are illustrated. The extent of the Bo Member into the Entenschnabel (dashed red line) is verified by well DUC-B-1 (below). The
present-day transformation ratio of the Hot Shale layer is shown, as also demonstrated in Figure 12h.
J. ARFAI & R. LUTZ
by guest on December 23, 2019http://pgc.lyellcollection.org/Downloaded from
be reproduced by assigning permeable carbonates for the lower
part of the Zechstein Formation.
† The calculated transformation ratios indicate that the Posidonia
Shale source rock starts generating hydrocarbons within the
deepest portions of the Central Graben in Late Jurassic times,
with transformation ratios reaching their maximum values
before Late Cretaceous inversion tectonics. Subsidence since
the beginning of the Cenozoic enlarged the petroleum kitchen
area and led to transformation ratios of more than 50% for
almost the whole John Graben.
† The potential Upper Jurassic Hot Shale source rock shows
transformation ratios in the Central Graben of up to 10–20%
depending on the reaction kinetic model used. Therefore, it is
important to use source rock specific kinetics to determine the
exact transformation ratio and to calculate volumes of gener-
ated petroleum.
† High transformation ratios of the Hot Shale in the Outer Rough
Basin, together with the inferred distribution of this source rock
(Bo Member) and reservoirs in the chalk or Cenozoic, could
constitute a working petroleum system.
† The mature Posidonia Shale or early mature Hot Shale can
explain oil shows in Upper Cretaceous sediments of the Central
Graben.
The authors thank the companies organized in the industrial association
BVEG (Bundesverband Erdgas, Erdol und Geoenergie BV), Uniper and
BP for permission to use their datasets for scientific research. We thank
Christoph Gaedicke, Dieter Franke, Lutz Reinhardt and Fabian Jahne for
their comments and suggestions on an early version of this manuscript.
Special thanks go to the editor Bruce Levell and an anonymous reviewer
for their detailed comments and suggestions, which helped to improve
this manuscript.
References
Abdul Fattah, R., Verweij, J.M., Witmans, N. & Ten Veen, J.H. 2012a.
Reconstruction of burial history, temperature, source rock maturity
and hydrocarbon generation in the northwestern Dutch offshore.
Netherlands Journal of Geosciences, 91, 535–554.
Abdul Fattah, R., Verweij, J.M., Witmans, N. & Ten Veen, J.H. 2012b. 4D
Basin Modelling of the Broad Fourteens Basin and Offshore West
Netherlands Basin; Erosion and Heat Flow Reconstruction and its
Influence on Temperature, Maturity and Hydrocarbon Generation.
TNO Report 2012 R10670. Netherlands Institute of Applied Geo-
sciences (TNO), Utrecht, The Netherlands.
Arfai, J., Jahne, F., Lutz, R., Franke, D., Gaedicke, C. & Kley, J. 2014. Late
Palaeozoic to Early Cenozoic geological evolution of the northwestern
German North Sea (Entenschnabel): new results and insights. Nether-
lands Journal of Geosciences, 93, 147–174, https://doi.org/10.
1017/njg.2014.22
Beha, A., Thomsen, O.R. & Littke, R. 2008. Thermal history, hydrocarbon
generation and migration in the Horn Graben in the Danish North
Sea: a 2D basin modelling study. International Journal of Earth Sci-
ences (Geologische Rundschau), 97, 1087–1100, https://doi.org/10.
1007/s00531-007-0247-2
Burnham, A.K. 1989. A Simple Kinetic Model of Petroleum Formation and
Cracking. Internal report of Lawrence Livermore National Labora-
tory. Report UCID 21665. Lawrence Livermore National Laboratory,
Livermore, CA, USA.
De Jager, J. & Geluk, M.C. 2007. Petroleum geology. In: Wong, T.E., Batjes,
D.A.J. & De Jager, J. (eds) Geology of the Netherlands. Royal Nether-
lands Academy of Arts and Sciences (KNAW), Amsterdam, 241–264.
Di Primio, R. & Horsfield, B. 2006. From petroleum-type organofacies to
hydrocarbon phase prediction. American Association of Petroleum
Geologists Bulletin, 90, 1031–1058.
Doornenbal, J.C. & Stevenson, A.G. (eds). 2010. Petroleum Geological
Atlas of the Southern Permian Basin Area. EAGE Publications,
Houten, The Netherlands.
EBN 2015. Source Rock Potential of the Dutch Northern Offshore.
EBN, Utrecht, The Netherlands, https://www.ebn.nl/wp-content/
uploads/2014/11/Poster4_EBN_Prospex2015.pdf [last accessed
December 2015].
Evans, D., Graham, C., Armour, A. & Bathurst, P. (eds). 2003. The Millen-
nium Atlas: Petroleum Geology of the Central and Northern North
Sea. Geological Society, London.
Frederiksen, S., Nielsen, S.B. & Balling, N. 2001. Post-Permian evolution
of the Central North Sea: a numerical model. Tectonophysics, 343,
185–203.
Geluk, M.C. 2007. Triassic. In: Wong, T.E., Batjes, D.A.J. & De Jager, J.
(eds) Geology of the Netherlands. Royal Netherlands Academy of
Arts and Sciences (KNAW), Amsterdam, 85–106.
Gemmer, L., Nielsen, S.B., Huuse, M. & Lykke-Andersen, H. 2002.
Post-mid Cretaceous eastern North Sea evolution inferred from 3-D
thermo-mechanical modelling. Tectonophysics, 350, 315–342.
Gemmer, L., Nielsen, S.B. & Bayer, U. 2003. Late Cretaceous–Cenozoic
evolution of the North German Basin – results from 3-D geodynamic
modelling. Tectonophysics, 373, 39–54.
Graversen, O. 2002. A structural transect between the central North Sea
Dome and the South Swedish Dome: Middle Jurassic–Quaternary
uplift–subsidence reversal and exhumation across the eastern North
Sea Basin. In: Dore, A.G., Cartwright, J.A., Stoker, M.S., Turner,
J.P. & White, N. (eds) Exhumation of the North Atlantic Margin:
Timing, Mechanisms and Implications for Petroleum Exploration.
Geological Society, London, Special Publications, 196, 67–83,
https://doi.org/10.1144/GSL.SP.2002.196.01.05
Graversen, O. 2006. The Jurassic–Cretaceous North Sea rift dome and asso-
ciated basin evolution. Paper presented at the American Association of
Petroleum Geologists Annual Convention, 19–22 June 2005, Calgary,
Alberta.
Hantschel, T. & Kauerauf, A.I. (eds). 2009. Fundamentals of Basin and
Petroleum Systems Modelling. Springer, Berlin.
Heim, S., Lutz, R., Nelskamp, S., Verweij, H., Kaufmann, D. & Reinhardt, L.
2013. Geological evolution of the North Sea: cross-border basin model-
ling study on the Schillground High. Energy Procedia, 40, 222–231.
Ineson, J.R., Bojesen-Koefoed, J.A., Dybkjaer, K. & Nielsen, L.H. 2003.
Volgian-Ryazanian ‘hot shales’ of the Bo Member (Farsund Forma-
tion) in the Danish Central Graben, North Sea; stratigraphy, facies
and geochemistry. In: Ineson, J.R. & Surlyk, F. (eds) The Jurassic
of Denmark and Greenland. Geological Survey of Denmark and
Greenland Bulletin, 1, 403–436.
Kearey, P., Klepeis, K.A. & Vine, F.J. 2009. Global Tectonics. 3rd edn.
Wiley-Blackwell, Oxford.
Kley, J. & Voigt, T. 2008. Late Cretaceous intraplate thrusting in central
Europe: effect of Africa–Iberia–Europe convergence, not Alpine
collision. Geology, 36, 839–842.
Kombrink, H. 2008. The Carboniferous of the Netherlands and surrounding
areas; a basin analysis. PhD thesis, Utrecht University, Utrecht, The
Netherlands.
Kombrink, H., Doornenbal, J.C., Duin, E.J.T., Den Dulk, M., Van Gessel,
S.F., Ten Veen, J.H. & Witmans, N. 2012. New insights into the
geological structure of the Netherlands; results of a detailed mapping
project. Netherlands Journal of Geosciences, 9, 419–446.
Krull, P. 2005. Palaogeographischer Rahmen. In: Wrede, V. (ed.) Strati-
graphie von Deutschland V – Das Oberkarbon (Pennsylvanium) in
Deutschland. Courier Forschungsinstitut Senckenberg, 254, 3–12.
Lokhorst, A. (ed.) 1998. Northwest European Gas Atlas – Composition and
Isotope Ratios of Natural Gases. Netherlands Institute of Applied
Geosciences (TNO), Haarlem, The Netherlands.
Menning, M. 2012. Explanatory notes to the Stratigraphic Table of Ger-
many Compact 2012 [Erlauterung zur Stratigraphischen Tabelle von
Deutschland Kompakt 2012]. Zeitschrift der Deutschen Gesellschaft
fur Geowissenschaften, 163, 385–409.
Pepper, A.S. & Corvi, P.J. 1995. Simple kinetic models of petroleum forma-
tion. Part I: oil and gas from kerogen. Marine Petroleum Geology, 12,
291–319.
Petersen, H.I. & Nytoft, H.P. 2007. Are Carboniferous coals from the Dan-
ish North Sea oil-prone? Geological Survey of Denmark and Green-
land Bulletin, 13, 13–16.
Rasmussen, E.S. 2009. Neogene inversion of the Central Graben and
Ringkøbing-Fyn High, Denmark. Tectonophysics, 465, 84–97.
3D BASIN & PETROLEUM SYSTEM MODEL (ENTENSCHNABEL)
by guest on December 23, 2019http://pgc.lyellcollection.org/Downloaded from

Sclater, J.G. & Christie, P.A.F. 1980. Continental stretching: an explana-
tion of the post-mid-Cretaceous subsidence of the Central North Sea
Basin. Journal of Geophysical Research, 85, 3711–3739.
Stollhofen, H., Bachmann, N.G.H. et al. 2008. Upper Rotliegend to Early
Cretaceous basin development. In: Littke, R., Bayer, U., Gajewski, D.
& Nelskamp, S. (eds) Dynamics of Complex Intracontinental Basins;
the Central European Basin System. Springer, Berlin, 181–210.
Sweeney, J.J. & Burnham, A.K. 1990. Evaluation of a simple model of
vitrinite reflectance based on chemical kinetics. American Association
of Petroleum Geologists Bulletin, 74, 1559–1570.
Ten Veen, J.H., Van Gessel, S. & Den Dulk, M. 2012. Thin-and thick-
skinned salt tectonics – Examples from the Dutch North Sea. Nether-
lands Journal of Geosciences, 91, 447–464.
Thole, H., Gaedicke, C., Kuhlmann, G. & Reinhardt, L. 2014. Late Ceno-
zoic sedimentary evolution of the German North Sea – A seismic
stratigraphic approach. Newsletters on Stratigraphy, 47, 299–329.
Underhill, J.R. & Partington, M.A. 1993. Jurassic thermal doming and
deflation in the North Sea: implications of the sequence stratigraphic
evidence. In: Parker, J.R. (ed.) Petroleum Geology of North-West
Europe: Proceedings of the 4th Conference. Geological Society,
London, 337–345, https://doi.org/10.1144/0040337
Vandenbroucke, M., Behar, F. & Rudkiewicz, J.L. 1999. Kinetic modelling
of petroleum formation and cracking: implications from the high pres-
sure/high temperature Elgin Field (UK, North Sea). Organic Geo-
chemistry, 30, 1105–1125.
Vejbæk, O.V. & Andersen, C. 1987. Cretaceous–early Tertiary inversion
tectonism in the Danish Central Trough. In: Ziegler, P.A. (ed.)
Compressional Intra-Plate Deformations in the Alpine Foreland. Tec-
tonophysics, 137, 221–238.
Verweij, J.M., Simmelink, H.J., Van Balen, R.T. & David, P. 2003. History
of petroleum systems in the southern part of the Broad Fourteens
Basin. Netherlands Journal of Geosciences, 82, 71–90.
Verweij, J.M., Souto Carneiro Echternach, M. & Witmans, N. 2009.
Terschelling Basin and Southern Dutch Central Graben. Burial
History, Temperature, Source Rock Maturity and Hydrocarbon
Generation – Area 2A. TNO Report 034-UT-2009-02065. Nether-
lands Institute of Applied Geosciences (TNO), Utrecht, The
Netherlands.
Verweij, J.M., Souto Carneiro Echternach, M., Witmans, N. & Abdul Fat-
tah, R. 2011. Reconstruction of basal heat flow, surface temperature,
source rock maturity, and hydrocarbon generation in salt-dominated
Dutch Basins. In: Peters, K., Curry, D. & Kacewicz, M. (eds) Basin
and Petroleum System Modelling. American Association of Petroleum
Geologists, Hedberg Series, 4, 175–195.
Wygrala, B.P. 1989. Integrated study of an oil field in the southern Po basin,
northern Italy. PhD thesis, Koln University, Julich Research Centre,
Julich, Germany.
Ziegler, P.A. (ed.). 1990. Geological Atlas of Western and Central
Europe. 2nd edn. Shell Internationale Petroleum, The Hague, The
Netherlands.
Ziegler, P.A. 1992. North Sea rift system. Tectonophysics, 208, 55–75.
Ziegler, P.A. 2005. Europe: Permian to recent evolution. In: Selley, R.C.,
Cocks, L.R.M. & Plimer, I.R. (eds) Encyclopedia of Geology.
Elsevier, Amsterdam, 102–125.
J. ARFAI & R. LUTZ
by guest on December 23, 2019http://pgc.lyellcollection.org/Downloaded from