3.8 tundra and polar regions - unep grid sioux falls · vast arctic tundra and high-altitude alpine...
TRANSCRIPT

258

259
Credit: Andrew Magor/UNEP/Topfoto

260
Of all the terrestrial biomes, tun-dra is the coldest. Tundra comes from the Finnish word tunturia,
which means treeless plain (Pullen 1996). There are two distinct types of tundra: the vast Arctic tundra and high-altitude alpine tundra on mountains.
Arctic tundra is located in the Northern Hemisphere on lands encircling the North Pole and extending south to the conifer-ous boreal forests of the taiga and covering approximately 5.6 million km2 (2 million square miles) Wookey 2002). Arctic tundra is characterized by cold, desert-like condi-tions. Although somewhat variable from place to place, precipitation on the Arctic tundra, including melted snow, is roughly 15 to 25 cm (6 to 10 inches) annually. The average winter temperature is -34° C (-30° F); the average summer temperature is 3 to 12° C (37 to 54° F). Winters are long and summers brief, with the growing season only 50 to 60 days long. During summer, only the top few centimeters of the soil thaw. Beneath the surface is a layer of
permanently frozen subsoil called per-mafrost. Because the topsoil is so shallow and underlaid by permafrost, it becomes quickly saturated with water. Lakes, ponds, and bogs dot the surface of the Arctic tun-dra throughout the brief summer months, providing moisture for plants and nesting and feeding habitats for huge numbers of waterfowl and other animals (Pullen 1996).
Alpine tundra is found on mountains throughout the world, at high altitudes—above the tree line—where conditions are too cold and too dry for trees to grow. The growing season in alpine tundra is approxi-mately 180 days. Nighttime temperatures are usually below freezing. Unlike soils in the Arctic tundra, soils in alpine tundra are usually well-drained (Pullen 1996). Alpine tundra is also characterized by relatively high biodiversity.
The Earth’s polar regions are high-lati-tude zones above the Arctic Circle in the Northern Hemisphere and the Antarctic
Circle in the Southern Hemisphere (EEA n.d.). Although similar in many ways, the two polar regions differ in that the Arctic is a frozen ocean surrounded by land, whereas the Antarctic is a frozen continent surrounded by ocean.
Most of the world’s fresh water is locked up in polar ice caps. Large glaciers and ice sheets cover Arctic islands and Greenland in the north and the conti-nent of Antarctica in the south. Where ice sheets and glaciers meet the ocean, huge chunks of ice continually break off, in a process known as calving, to give birth to icebergs. Icebergs are found in both Arctic and Antarctic polar oceans. In the north, most icebergs are calved from ice sheets along the western coast of Greenland. In the south, the vast ice sheets and glaciers that cover Antarctica give rise to icebergs in polar seas.
The Earth’s tundra and polar regions are unique and vital parts of the global environment. They are the world’s least
3.8 Tundra and Polar Regions
Credit: Brendan C. Fri/UNEP/Topfoto

261
populated regions. Antarctica has no permanent residents. The Arctic has ap-proximately 3.7 million inhabitants from eight countries. Sparsely populated and relatively undisturbed, tundra and polar regions therefore contain the world’s larg-est remaining wilderness areas. They also possess a surprising range of natural re-sources, from marine life to oil and gas. Yet despite their rugged appearance, tundra and polar regions are fragile ecosystems that are extremely sensitive to the effects of resource exploitation. Managing these regions and their resources effectively places huge demands on both technical and political capacities (SPRI n.d.).
Tundra and polar regions also ex-ert a profound effect on global climate. Variations in the extent of sea ice, for example, affect the Earth’s surface radia-
tion balance by changing average surface albedo(albedo is the fraction of sunlight refl ected). During the peak of the last Ice Age, one-third of the Earth’s land surface was covered by thick sheets of ice that extended from polar regions toward the equator. The high albedo of these ice sheets refl ected a great deal of sunlight out into space, which cooled the Earth and allowed the ice sheets to grow. Large changes in sea ice extent are also thought to infl uence deep-ocean convection and global ocean currents (Jezek 1995).
Many climate and biogeochemical studies indicate that carbon cycling in the Arctic tundra and boreal forests strongly infl uences global climate as well. Cold tun-dra soils contain huge amounts of stored organic carbon. They are known sinks for atmospheric CO2 through the accumula-
tion of peat, and are signifi cant sources of CH4 as a result of anaerobic decomposi-tion (Christensen n.d.).
While tundra and polar regions play a major role in shaping the Earth’s climate, they also are highly sensitive ecosystems that have the potential to be profoundly affected by changes in the Earth’s climate (NRDC 2004). Nearly all climate mod-els indicate that environmental changes brought about by global warming are expected to be greater in tundra and polar regions than for most other places on Earth. In that respect, tundra and polar regions form a sort of early warning system for climate change and its effects on the planet and its inhabitants. The monitoring of high-latitude and high-altitude eco-systems, then, represents a way to detect early signs of regional and global climate change. The advance or retreat of glaciers, ice sheets, and sea ice has been given particular attention by climate change researchers.
A rapid warming trend in the Arctic polar region over the last 25 years has dramatically reduced the region’s sea ice. Scientists have been monitoring ongoing changes in Arctic sea ice for decades, both fi rsthand through fi eldwork and remotely through the use of satellite imagery. In 2002, the extent of multi-year Arctic sea ice was the lowest on record since satel-lite observations began in 1973. There
Ger
Den
.
Iceland
U.K.
10ºC (50ºF) isotherm, July
Map of the Arctic Source: Modifi ed from http://www.lib.utexas.edu/maps/islands_oceans_poles/arctic_region_pol02.jpg
Credit: Budd Christman/UNEP/NOAA
Arctic Region

262
was only slightly more sea ice present in 2003. According to one study, perennial sea ice—sea ice that survives the summer and remains year round—is melting at the alarming rate of 9 per cent per decade (NASA 2003d). If this trend continues, Arctic sea ice may be gone by the year 2100.
Researchers also documented tem-perature increases in different regions within and near the Arctic Circle, north of 66º. Average temperatures increased by 0.3ºC (0.5ºF) per decade over sea ice and by 0.5ºC (0.9ºF) per decade over the northernmost land areas of Europe and Asia. Temperatures over northern North
America experienced the highest regional warming, increasing by 1.06ºC (1.9ºF) per decade. Greenland cooled by less than one-tenth of a degree C per decade. The cooling found over Greenland was mainly at high elevations, while warming trends were observed around its periphery. These results are consistent with a National Snow
Pancake ice in the Ross Sea, Antarctica Source: Michael Van Woert/UNEP/NOAA
Case Study: Arctic SeasThe extent of Arctic sea ice in September–the end of the summer melt period–is the most valuable indicator of the state of the ice cover. On average, sea ice in September covers an area of about seven million km2, an area roughtly equal in size to the conti-nent of Australia.
In the images above, the Sea Ice Con-centration Anomaly scale indicates the per cent by which the local sea ice extent
differs above or below the average for the period 1979-2000. The median ice edge for 1979-2000 is indicated by the black outer line. In 2002, total September ice extent was 15 per cent below this average. This represents a reduction equivalent to an area roughly twice the size of Texas or Iraq. From caparisons with records prior to the satellite era, this was probably the least amount of sea ice that had covered the Arctic over the past 50 years.
Quite often, a “low” ice year is followed by recovery the next year. However, Sep-tember of 2003 was also extreme, with 12 per cent less ice extent than average. Cacu-lations performed for 30 September 2004 show a sea ice extent loss of 13.4 per cent, especially pronounced north of Alaska and eastern Siberia. Source: NSIDC

263
and Ice Data Center study that found record loss of sea ice around Greenland’s periphery in 2002 (NSIDC n.d.).
As sea ice melts, Arctic waters warm. Less ice means more heat gain by polar wa-ters, which creates a positive feedback lead-ing to further ice melting and increased warming. The loss of Arctic sea ice, and the warming of Arctic polar waters, have enormous implications for both regional and global climate patterns. One major concern is that the disappearance of Arctic sea ice may cause changes in ocean circula-tion leading to unexpected and rapid shifts in climate worldwide (SPRI n.d.).
Over the past 30 years, Antarctic ice has also undergone changes. Ice sheets and glacier tongues are among the most dy-namic and changeable features along the coastal regions of Antarctica. Seaward of a line where these masses of ice are ground-ed, the fl oating ice margins are subject to frequent and large calving events. These events lead to annual and decadal changes in the position of ice edge varying from several to many kilometres.
Yet ice events are also occurring in Antarctica that appear to be out of the or-
dinary. Along the Antarctic Peninsula, for instance, the Wordie Ice Shelf has practi-cally disappeared. In 2002, a section of the Larsen B Ice Shelf collapsed—the largest such event in the last 30 years.
In other parts of Antarctica, however, ice cover has actually increased (UPI 2003). What is happening with the vast West Antarctic ice sheet is not yet clear. Some studies seem to indicate that it is get-ting thicker (NCPPR n.d.). Other studies indicate that this mammoth ice sheet is shrinking in size. If the West Antarctic ice sheet melts, global sea levels would rise by many metres. Such a change would severe-ly impact densely populated coastal regions around the world, forcing people to move to higher elevations.
Although the details may be still un-clear, there is no doubt that the Earth’s tundra and polar regions are undergoing many changes. Some are related to climate change and long-distance pollution. Some are the result of on-site human activities. On a positive note, many of the human-in-duced environmental threats in the Arctic have not yet occurred in the largely un-populated Antarctic (Harrison and Pearce
2001). Activities in Antarctica are carried out under the Antarctic Treaty, a model of international cooperation. In the Arctic, the common needs of indigenous peoples living in remote areas are addressed through the Arctic Council and other circumpolar institutions. Thus, the polar regions offer hope that nations can cooper-ate in addressing the changes taking places in these and other parts of the world (SPRI n.d).
Case Study: Ninnis Glacier, Antarctica 2000To better understand the Antarctic Ice Sheet’s potential response to global climate change and its effect on global sea level, it is important to detect and monitor the calving of large ice-bergs. The series of images shown here depect the 2000 disintegration of the Ninnis Glacier tongue into two sections. Each image is a sub-section of a SCANSAR scene of the Ninnis Glacier Tongue region.
22 January 2000. This image captures the Nin-nis Glacier Tongue region soon after the initial calving. The resultant iceberg (sections A and B) had an area of approximately 900 km2 (347 square miles). NOTE: Purple dots indicate the area where the iceberg broke away from the glacier.
5 February 2000. Roughly two week after calving, the iceberg split into two sections (A and B). When this image was taken Berg A had drifted 20 km (about 12.5 miles) to the west, Berg B had drifted to the northeast, and a smaller section (C) remained grounded in front of the Ninnis Glacier.
20 February 2000. At this point Bergs A and B had almost totally separated, rotated coun-terclockwise, and drifted to the north. Note that both sections are now well away from the Ninnis Glacier. Source: USGS 1999; Schmidt 2000
Between 2000 and 2002, scientists observed the formation of a crack in the Ward Hunt Ice Shelf on the northern shore of Canada’s Ellesmere Island. The crack allowed the waters of a rare freshwater Arctic lake to empty into the Arctic Ocean. Rising temperatures also brought about the thinning of this 3,000-year-old shelf, which is the Arctic’s largest. Credit: V. Sahanatien/UNEP/ParksCanada
263
Images courtesy of Dr. Rob Massom, Antarctic CRC © 2000 Canadian Space Agency

264
Mountain peak in the Himalayas Credit: Unknown/UNEP/Freefoto.com
Gangotri Glacier is situated in the Uttar Kashi District of Garhwal Himalaya, northern In-dia. With its tributary glaciers, it is one of the largest glaciers in the Himalayas. It has been receding since 1780, although studies show its retreat quickened after 1971. It is currently 30.2 km (18.8 miles) long and between 0.5 and 2.5 km (0.3 and 1.6 miles) wide. The blue contour lines drawn in the image show the recession of the glacier’s terminus over time. They are approximate, especially for the earlier years. Over the last 25 years, Gangotri Glacier has retreated more than 850 m (2 788 ft) with an accelerated recession of 76 m (249 ft) from 1996 to 1999 alone. The retreat is an alarming sign of global warming, which will impact local communities. Glaciers play an important role in storing winter rainfall, regulating water sup-ply through the year, reducing fl oods, shaping landforms, and redistributing sediments.Source: NASA 2004j
Case Study: Recession of Gangotri Glacier 1780-2001
Credit: NASA 2004

265
Case Study: Drygalski Ice TongueFebruary 2005The Drygalski ice tongue is located on the Scott Coast, in the northern McMurdo Sound of Antarctica’s Ross Dependency, 240 km (149 miles) north of Ross Island. It stretches 70 km (43 miles) out to sea from the David Glacier, reaching the sea from a valley in the Prince Albert Mountains of Victoria Land.
The ice tongue was discovered in 1902 by Robert Falcon Scott, and is thought to be at least 4 000 years old.
This image, collected by the Advanced Synthetic Aperture Radar on the European Space Agency’s ENVISAT satellite, shows the David Glacier on the 1 831-metre-high (6 007-feet-high) Mt. Joyce. As ice piles on the glacier, it slides under its own weight to the ocean. The ice doesn’t break up when it reaches the ocean; rather, it fl oats, forming a long tongue of ice. The fl oating end of the David Glacier is the Drygalski Ice Tongue.
This fl oating spit of ice was recently men-aced by the B-15A iceberg, a 120-km-long (74-mile-long) giant that had been drifting on a collision course with the ice tongue before becoming grounded. On 21 February 2005, Drygalski calved an iceberg. The fi ve-by-ten-km (three-by-six mile) iceberg was fl oating off the left side of the ice tongue on 22 February when this image was acquired. The event is a normal
part of the evolution of the ice tongue—pieces regularly break from the tongue as the glacier pushes more ice out over the sea. This image shows cracks, formed by time and ocean
currents, which become more numerous to-wards the end of the tongue. Source: NASA 2005, WIKIPEDIA
Huge icebergs are found in Antractica’s regions. These icebergs infl uence the weather and climatic conditions. It is believed that if these icebergs melt,
the sea levels will rise signifi cantly. The study of the state of icebergs and their behaviors are very impor-tant aspects of climae change research. Today, multi-
sensored remote sensing data are used in monitoring the state of icebergs. Credit: Michael Van
Woert/UNEP/NOAA
265
Credit: European Space Agency—ESA
22 Feb 2005

266
Case Study: Collapse of the Kolka Glacier20 September 2002
Rebecca Lindsey, Olga Tutubalina, Dmitry Petrakov, Sergey Chernomorets
Running east to west across the narrow isthmus of land between the Caspian Sea to the east and the Black Sea to the west, the Caucasus Mountains make a physical barricade between southern Russia to the north and the countries of Georgia and Azerbaijan to the south. In their center, a series of 5 000-metre-plus (16 000-feet-plus) summits stretch between two extinct volcanic giants: Mt. Elbrus at the western limit and Mt. Kazbek at the eastern. On the lower slopes, snow disappears in July and returns again in October. On the summit, winter is permanent. Glaciers cover peaks and steep-walled basins called cirques. The remote, sparsely populated area is popular with tourists and backpackers.
Elevations reach 5 642 metres (18 511 feet), and glaciers accumulate from heavy snowfall in the steep mountain valleys. Around Mount Kazbek, a dormant volcano, glaciers intermittently collapse, burying the landscape below under rock and ice. The latest of such collapses happened in 2002. Rebecca Lindsey, science writer with NASA’s Earth Observatory, in close collabo-ration with Russian scientists Olga Tutubali-na, Dmitry Petrakov (Moscow State Univer-sity), and Sergey Chernomorets (University Centre for Engineering Geodynamics and Monitoring) compiled the details ofthis event.
On the evening of 20 September 2002, in a cirque just west of Mt. Kazbek, chunks
of rock and hanging glacier on the north face of Mt. Dzhimarai-Khokh tumbled onto the Kolka glacier below. Kolka shattered, setting off a massive avalanche of ice, snow, and rocks that poured into the Genaldon River valley. Hurtling downriver nearly 13 km (8 miles), the avalanche exploded into the Karmadon Depression, a small bowl of land between two mountain ridges, and swallowed the village of Nizhniy Karmadon and several other settlements.
At the northern end of the depression, the churning mass of debris reached a choke point: the Gates of Karmadon, the narrow entrance to a steep-walled gorge. Gigantic blocks of ice and rock jammed into the narrow slot, and water and mud sluiced through. Trapped by the blockage, avalanche debris crashed like waves against the mountains and then fi nally cemented into a towering dam of dirty ice and rock, creating lakes upstream. At least 125 people were lost beneath the ice.
The Kolka Glacier collapse partially fi lled the Karmadon Depression with ice, mud, and rocks, destroying much of the village of Karmadon. The debris swept in through the Genaldon River Valley and backed up at the entrance to a narrow gorge. The debris acted as a dam, creating
lakes upstream. Boulders, pebbles, and mud covered the surface of the debris fl ow, resulting in treacherous footing. The path-less maze of debris was only one of many hazards that slowed exploration of the disaster area.
Scratches on the surface of rocks of the Maili Glacier’s moraine show the violence of the event. The avalanche, moving up to 180 kilometres per hour (112 mph), scoured the rocks below, leaving parallel grooves called “striations.” Striations are typically observed in the bedrock underly-ing glaciers, created by the slow, scouring action of rocks caught beneath the ice.
Large-scale avalanches and glacial col-lapses are not uncommon on the slopes of Mount Kazbek and nearby peaks. The Kolka Glacier collapsed in 1902, surged in 1969, and collapsed again in 2002. Evidence, including historical accounts, indicates similar events have happened in neighboring valleys as well.
After the collapse, people speculated that something called a glacial surge had triggered the Kolka collapse. In 1902, a more signifi cant collapse at Kolka Glacier killed 32 people. Despite a history of disas-ters there, routine monitoring of the Kolka Glacier cirque ended in the late 1980s.
NASA Image by Jesse Allen and Robert Simmon based on MODIS data
266
This sequence of images from the Indian Remote Sensing (IRS) satellites showed that the lakes (except Lake Saniba) were draining gradually through crevasses in the ice mass, and were not likely to cause subsequent catastrophic fl oods. Credit: IRS
19 October 2002 22 May 2003 11 July 2003 30 August 2003
Mount Dzhimarai-Khokh, elevation 4 780 metres (15 682 feet), towers above the Kolka Cirque. Rock and ice falling from the steep walls of the cirque since the end of July 2002, eventually triggered the collapse of the Kolka Glacier.
13 June 2001
Credit: Olga Tutubalina/UNEP

267
The rapidly rising water was a continuing danger, threatening a sudden outburst that would cause fl ooding downstream.
Russian researchers evaluated the risk of future danger at the disaster site using a time-series of satellite images collected in the year following the disaster. Satellite im-agery was crucial throughout the late fall and winter of 2002 and 2003, when dan-gerous weather prevented on-site observa-tions of the ice-dammed lakes.
Russian scientists combined satellite data with ground observations to create maps of the Kolka Glacier Cirque. The IRS Satellite image (acquired 11 July 2003) shows details of the cirque, includ-ing scars caused by post-collapse rockfall,
a large remnant of the Kolka Glacier, ice cliffs high above the fl oor of the cirque, displaced porous ice, the Maili Glacier, a temporary lake, and deposits of rubble left along the path of the collapsing glacier.
There is uncertainty also about what triggered the collapse of rocks and hang-ing glaciers on Mount Dzhimarai-Khokh. Two small earthquakes jarred the region in the months before the collapse, probably destabilized the hanging glaciers. In the fi rst days after the collapse, an Emercom (Russian Emergencies Ministry) crew fl ew to the site via helicopter, but was forced to evacuate immediately when the crew de-tected an overpowering smell of sulfur-con-taining gas. It seems there may be some
fumaroles—volcanic vents—on the face of Mount Dzhimarai-Khokh in the area where the hanging glacier collapsed.
Based on the available data and obser-vations, the scientists say they don’t expect any additional catastrophic processes with-in the next 10 to 20 years. The remaining lakes will likely continue to drain through crevasses and channels being cut through the ice mass, and as they drain, the risk of fl ooding decreases.
Published 9 September 2004Source: http://earthobservatory.nasa.gov/Study/Kolka/kolka.html
The area covered by ice and debris dwarfed the hamlet of Karmadon, and the Genaldon River disappeared completely. (The outline corre-sponds to the detailed image above.)
Credit: Digital Globe
Credit: Sergey Chernomorets/UNEP
Credit: Olga Tutubalina, Dmitry Petrakov, Sergey Chernomorets/UNEP
267
25 Sept 2002

268
Case Study: Arctic Sea IceIn September 2003, scientists from the United States and Canada announced that the larg-est ice shelf in the Arctic had broken up. The Ward Hunt ice shelf to the north of Canada’s Ellesmere Island split into two main parts, with other large blocks of ice also pulling away from the main sections.
Evidence continues to emerge that average temperatures in the Arctic are rising even more rapidly than the global average. Satellite data indicate that the rate of surface temperature increase over the last 20 years was eight times the global average over the last 100 years (Comiso 2003).
The edge of the pack ice Source: NOAASource: Michael Van Woert/UNEP/NOAA
268

269
These images reveal dramatic changes in Arctic sea ice since 1979. The loss of Arctic sea ice may be caused by rising Arctic temperatures that result from greenhouse gas build-up in the atmosphere and resulting global warning.
Studies report that the extent of Arctic sea ice has shrunk by 7.4 per cent over the past 25 years, with record-low coverage in September 2002 (Johannessen et al. 2003). An analysis of 30 years of satellite data suggests that the loss of Arctic sea ice is also accelerating (Cavalieri et al. 2003). There are projections that much of
the sea ice, until now thought to be permanent, will melt during the summer by the end of this century if the current trend in global warming continues. This will have major direct impacts on indigenous people and Arctic wildlife such as polar bears and seals, and will also open the region to increased development pressure
as access by sea to valuable natural resources becomes easier. The global impacts may also be signifi cant as absorption of solar radiation in-creases, and could lead to changes in the world ocean circulation (UCL 2003; NASA 2003; Laxon et al. 2003).
Source: GEO Year Book 2003
269
Credit: Gyde Lund/UNEP

270
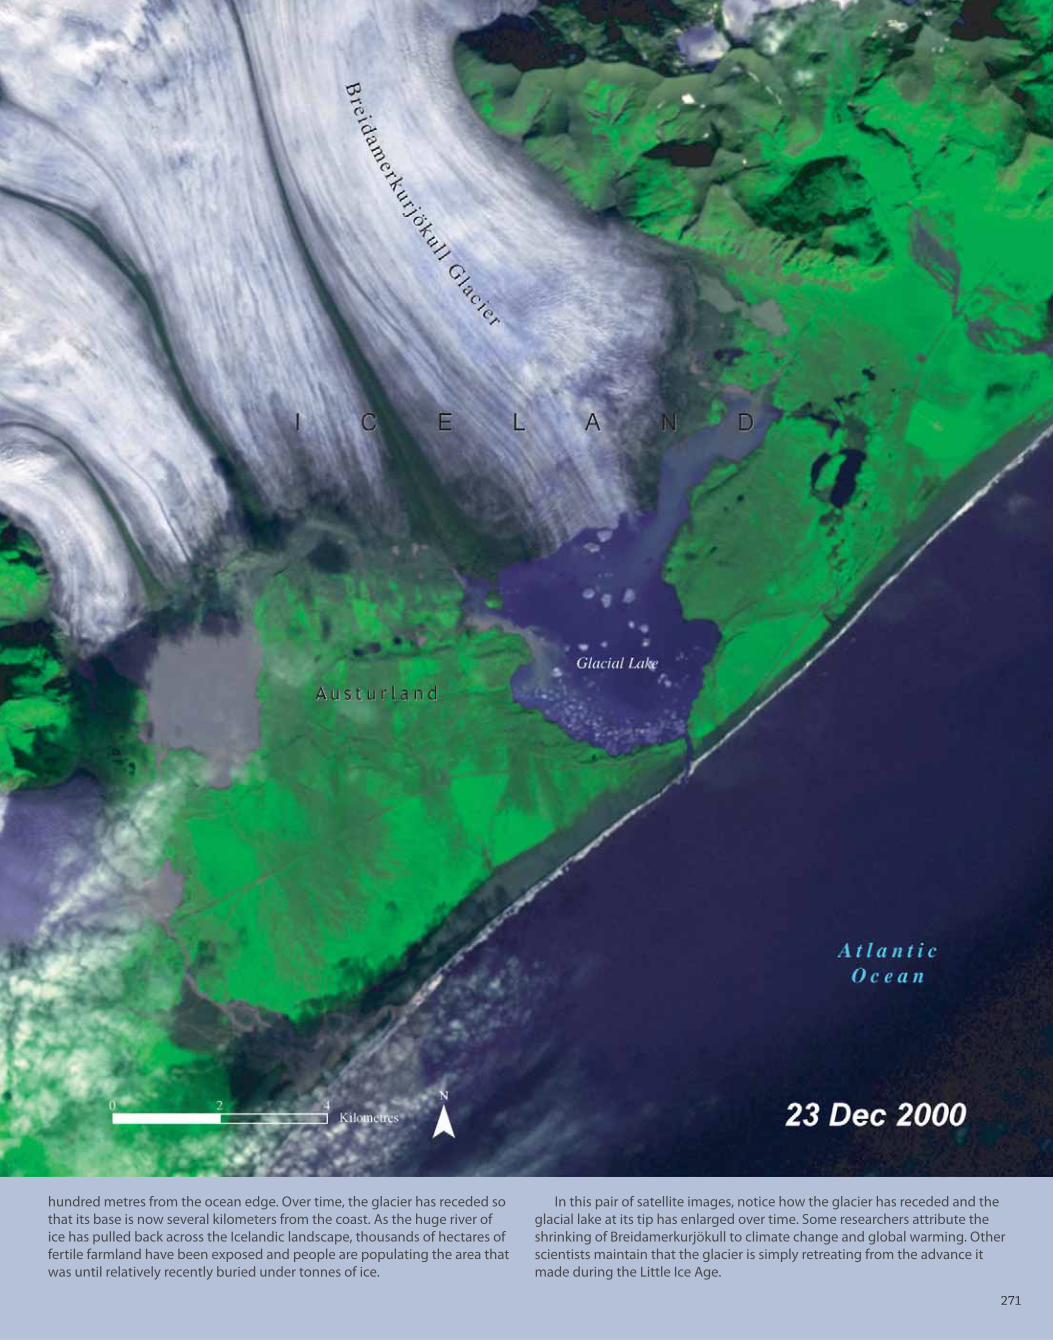
During much of the 20th century, Iceland’s Breidam-erkurjökull Glacier has been shrinking. It has been studied extensively since 1903, when researchers drew up detailed maps that showed its base just a few
270
271
hundred metres from the ocean edge. Over time, the glacier has receded so that its base is now several kilometers from the coast. As the huge river of ice has pulled back across the Icelandic landscape, thousands of hectares of fertile farmland have been exposed and people are populating the area that was until relatively recently buried under tonnes of ice.
In this pair of satellite images, notice how the glacier has receded and the glacial lake at its tip has enlarged over time. Some researchers attribute the shrinking of Breidamerkurjökull to climate change and global warming. Other scientists maintain that the glacier is simply retreating from the advance it made during the Little Ice Age.
271

272272
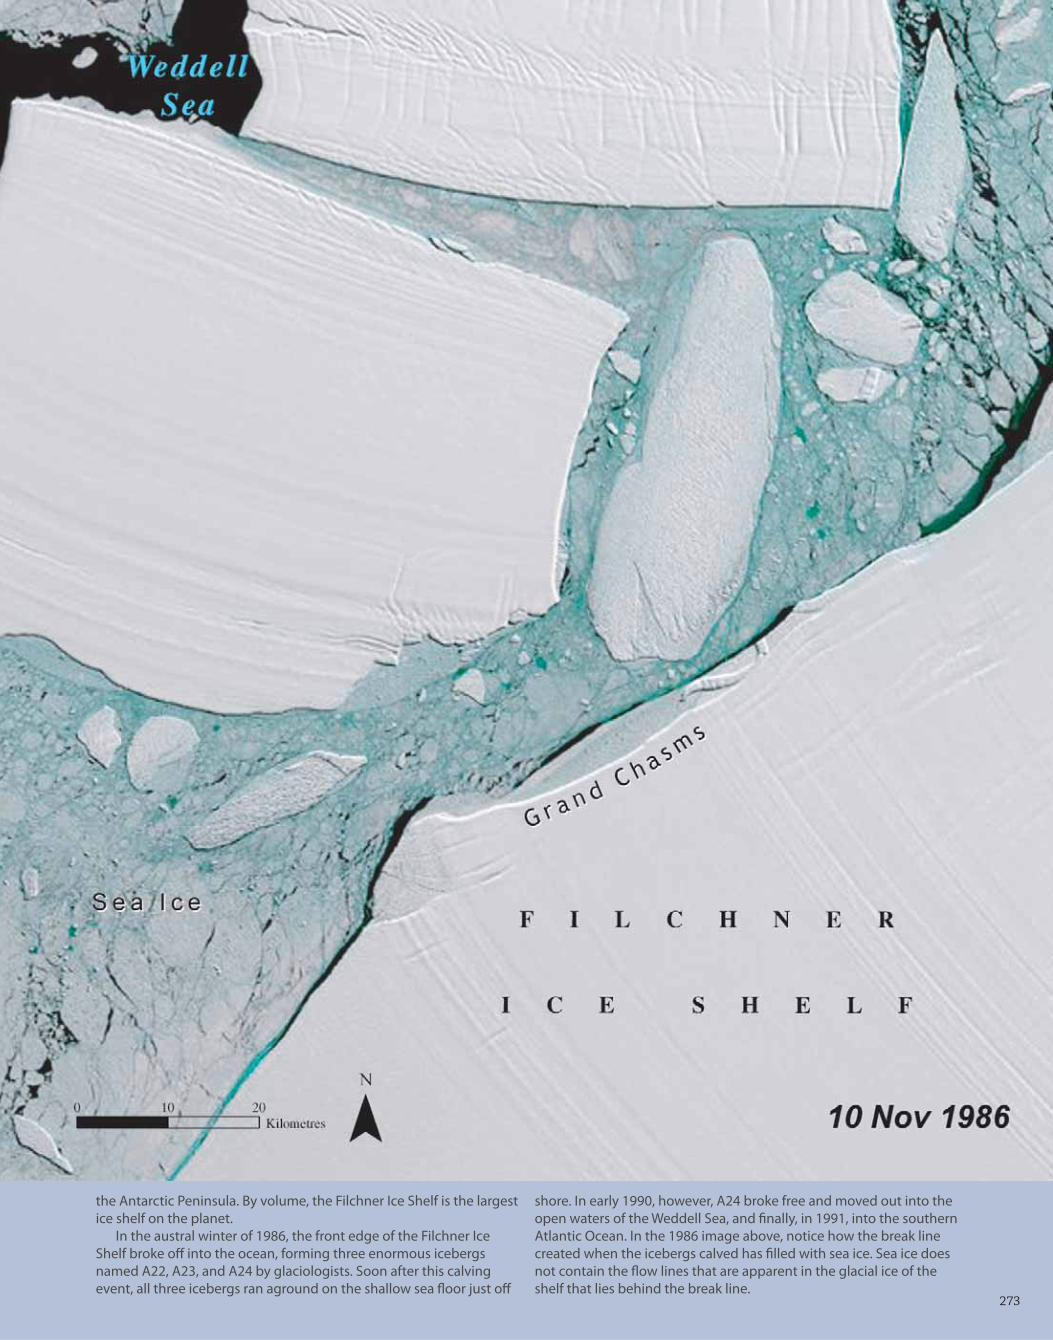
An ice shelf is a huge sheet of ice that is grounded on land but has an extension that reaches out into the ocean. Antarctica has two great ice shelves: the Ross Ice Shelf near the Ross Sea and the Filchner Ronne Ice Shelf near
273273
the Antarctic Peninsula. By volume, the Filchner Ice Shelf is the largest ice shelf on the planet.
In the austral winter of 1986, the front edge of the Filchner Ice Shelf broke off into the ocean, forming three enormous icebergs named A22, A23, and A24 by glaciologists. Soon after this calving event, all three icebergs ran aground on the shallow sea fl oor just off
shore. In early 1990, however, A24 broke free and moved out into the open waters of the Weddell Sea, and fi nally, in 1991, into the southern Atlantic Ocean. In the 1986 image above, notice how the break line created when the icebergs calved has fi lled with sea ice. Sea ice does not contain the fl ow lines that are apparent in the glacial ice of the shelf that lies behind the break line.

274274
Hubbard Glacier, located at St. Elian National Park near Yakutat, Alaska, is the largest calving glacier in North America. It is currently increas-ing in total mass and advancing across the entrance of 56-km-long (35-mile-long) Russell Fjord.

275275
These images show the potential environmental disruption that a fast glacial fl ow is capable of producing. In 1986, the Hubbard Gla-cier blocked the Russell Fjord, endangering seals and porpoises by producing freshwater runoff that reduced the salinity of that body of water. Rising water levels also became a concern. By the time the
ice dam eventually broke later that year, the water level of Russell Fjord had risen by 25 m (82 ft). The images show the Hubbard Glacier and surrounding area at various stages before, during, and after the formation of the ice dam.
These photographs show an enlarged eastward-looking view of a small section of the Hubbard Glacier terminus and the evolution of the “squeeze-push” moraine in front of Gilbert Point that blocked the tidal exchange between Disenchantment Bay (bottom of photos) and Russell Fiord (top of photos), creating Rus-sell Lake which rose to 18.6 metres (61 feet) above sea level over 21⁄2 months before it fi nally outburst on 14 August 2002, creating the second largest glacial lake outburst worldwide in historical times.
Credit: Unknown/UNEP/USGS, USFS, Yakutat Range District and National Park Service, Yakutat Ranger Station

276276
Mt. Kilimanjaro, Africa’s highest mountain, is located 300 km (186 miles) south of the equator in Tanzania. A forest belt that spans between 1 600 m (5 249 ft) and 3 100 m (10 171 ft) sur-rounds it. The forest has a rich diversity of eco-
Credit: Christian Lambrechts/UNEP/UNEP-GRID Nairobi

277277
systems, particularly of vegetation types that result mainly from the large range in altitude and rainfall of about 700 to 3 000 mm/yr (28 to 118 in/yr). It hosts a very large diversity of species, with about 140 mammal species and over 900 plant species. But of greater concern are the glaciers atop the mountain. In 1976, glaciers covered most of the summit of Mt. Kilimanjaro. By 2000, the glaciers had receded
alarmingly. An estimated 82 per cent of the icecap that crowned the mountain when it was fi rst thoroughly surveyed in 1912 is now gone, and the remaining ice is thinning as well—by as much as a metre per year in one area. According to some projections, if recession con-tinues at the present rate, the majority of the remaining glaciers on Kilimanjaro could vanish in the next 15 years.
Credit: Christian Lambrechts/UNEP/UNEP-GRID Nairobi

278278
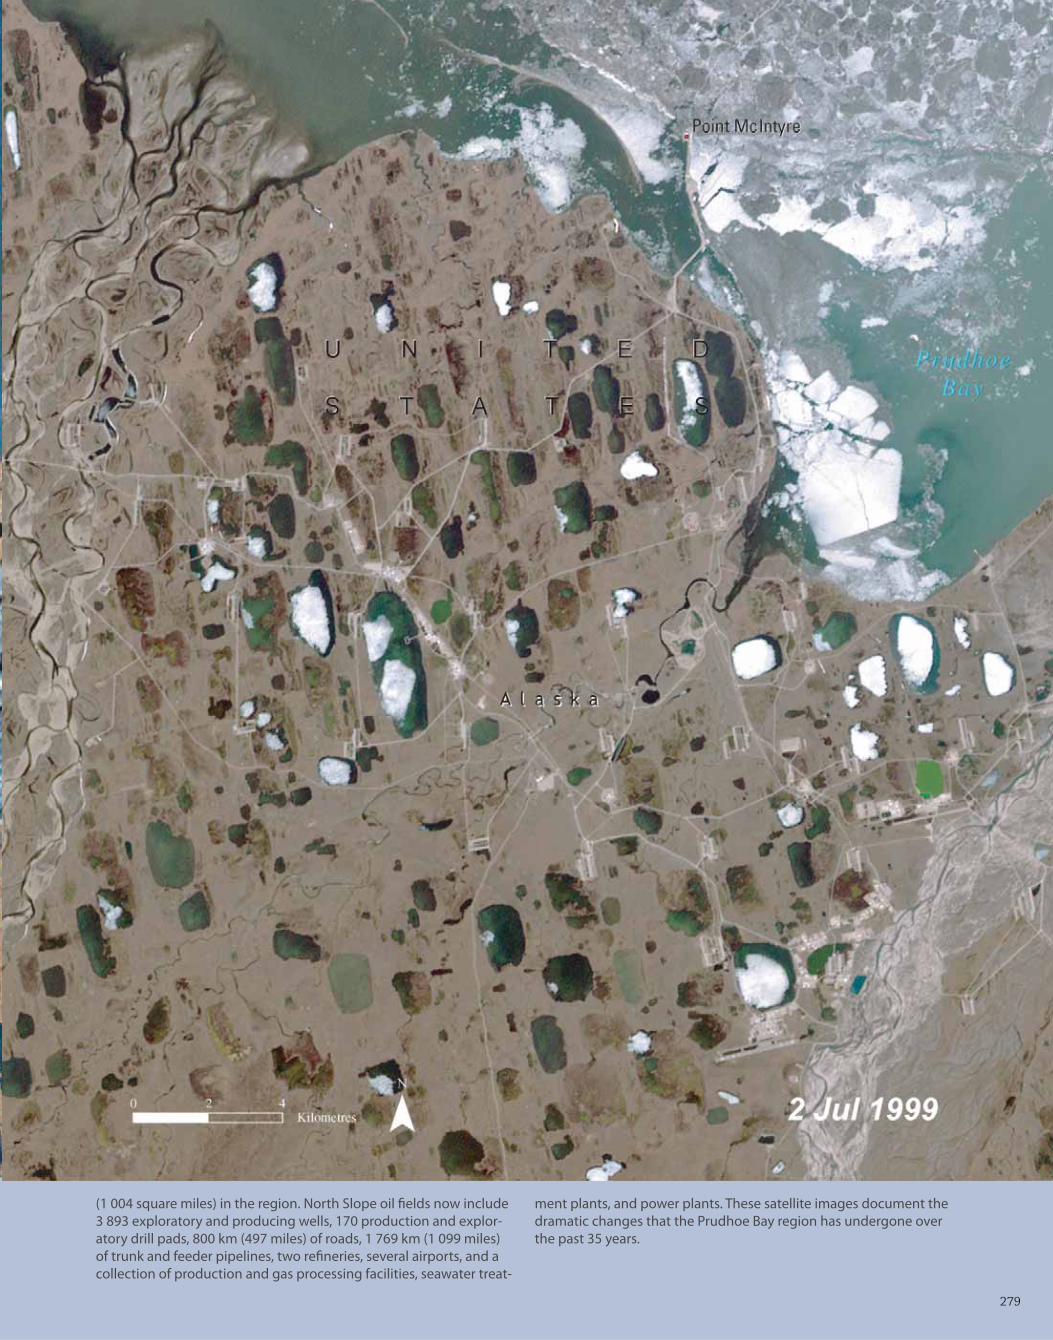
Since the discovery of oil in Prudhoe Bay, Alaska, in 1968, the oil industry has dramatically transformed the former North American Arctic wilderness. Prudhoe Bay and 18 other oil fi elds currently sprawl over more than 2 600 km2
279279
(1 004 square miles) in the region. North Slope oil fi elds now include 3 893 exploratory and producing wells, 170 production and explor-atory drill pads, 800 km (497 miles) of roads, 1 769 km (1 099 miles) of trunk and feeder pipelines, two refi neries, several airports, and a collection of production and gas processing facilities, seawater treat-
ment plants, and power plants. These satellite images document the dramatic changes that the Prudhoe Bay region has undergone over the past 35 years.