3/7/13 mitch schaefer - marathon county, wisconsin · 2013-03-21 · economic analysis, 2010-2012...
TRANSCRIPT
3/7/13
Mitch Schaefer
Graduate Research Assistant Department of Animal Science
UW-Madison

Land values at historic high
Necessity to increase pasture productivity
Potential new forages?
Tall fescue (Bariane)
Meadow fescue (Pradel)
White clover (Alice)
Introduction

Materials and Methods
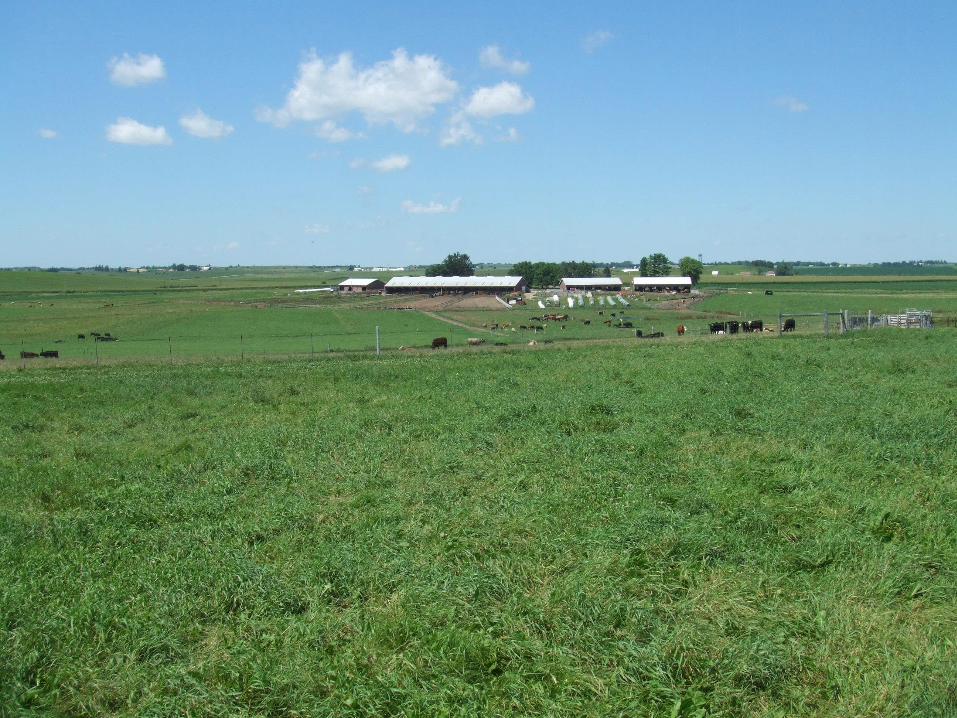
Study Location
Results
Summary
Economic Model Including Data Collected
Implications
Outline

Treatments (2 X 2 factorial)
Materials and Methods
Urea White Clover
Tall Fescue TF TFC
Meadow Fescue
MF MFC
Nitrogen source
Grass Type

550 lb crossbred beef steers
Weights taken at start, ~42 d intervals, and end
Given free choice mineral supplement and water
Provided salt and trace minerals (Cu, Se, Zn)
Contained methoprene (Altosid IGR)
Bloatguard added to clover swards
Followed animals through feedlot post grazing
Materials and Methods

12 pastures (3 reps per treatment)
5.6 acres, 8 paddocks
Rotation schedule- 2, 3, and 4 d (7, 5, and 5 passes per yr)
Starting and ending dates, 2010-2012
April 23- Oct 28 (188)
May 6- Sept 21 (137)
April 18- June 29, and Aug 9-Oct 9 (132)
3 Applications of Urea
50, 70, and 50 lbs N/ acre
Prior to turnout, after heading, and ~45-60 d post 2nd application
Utilized a variable stocking density
Materials and Methods


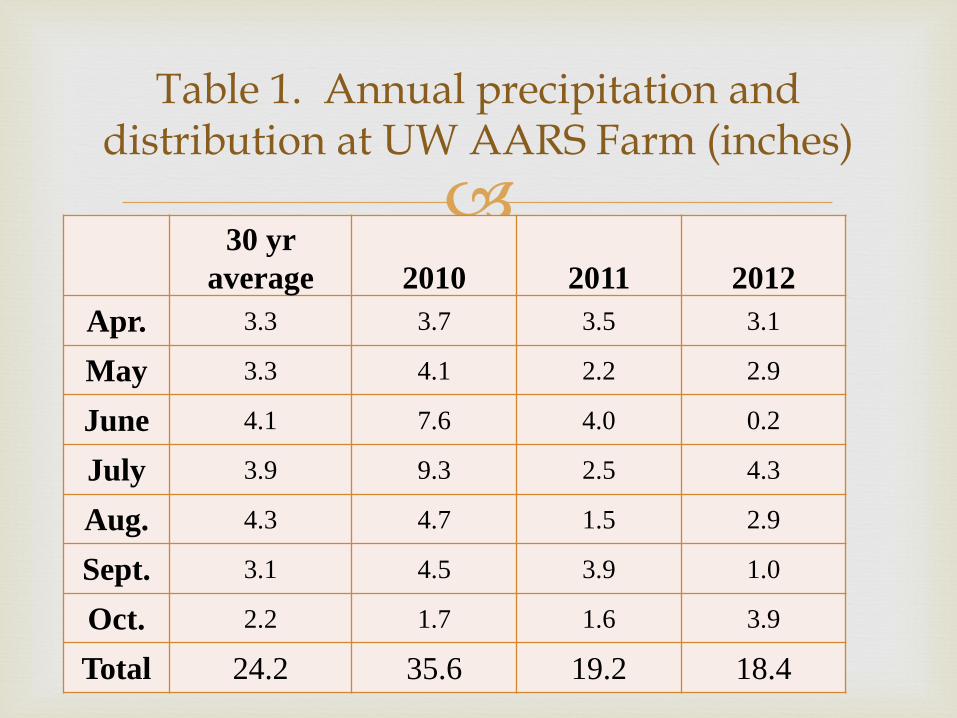
30 yr
average 2010 2011 2012
Apr. 3.3 3.7 3.5 3.1
May 3.3 4.1 2.2 2.9
June 4.1 7.6 4.0 0.2
July 3.9 9.3 2.5 4.3
Aug. 4.3 4.7 1.5 2.9
Sept. 3.1 4.5 3.9 1.0
Oct. 2.2 1.7 1.6 3.9
Total 24.2 35.6 19.2 18.4
Table 1. Annual precipitation and distribution at UW AARS Farm (inches)
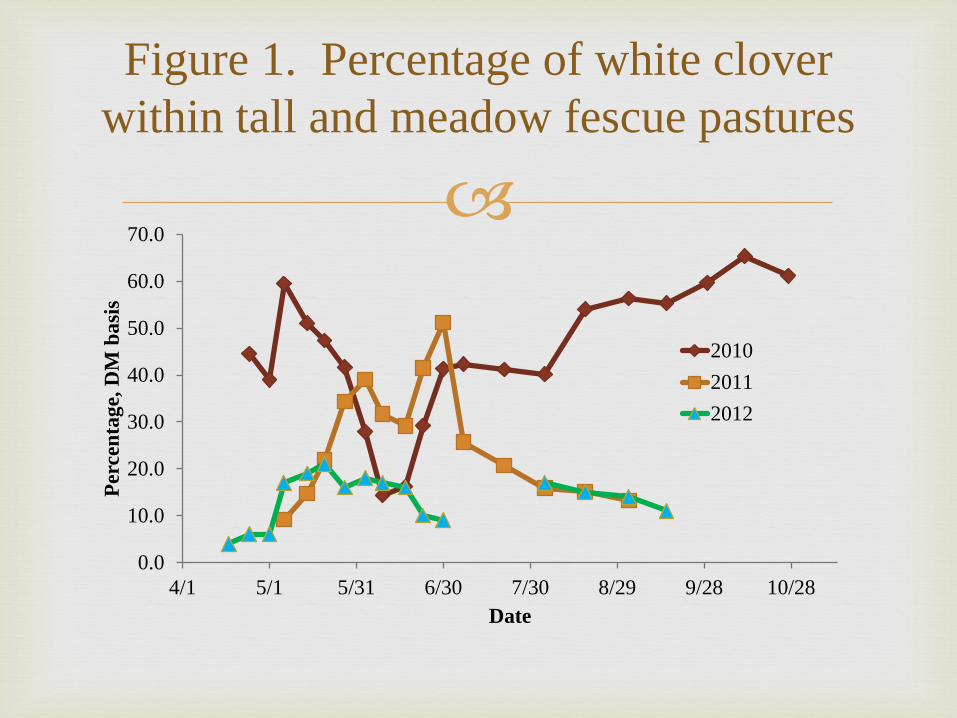
Figure 1. Percentage of white clover
within tall and meadow fescue pastures
0.0
10.0
20.0
30.0
40.0
50.0
60.0
70.0
4/1 5/1 5/31 6/30 7/30 8/29 9/28 10/28
Per
cen
tag
e, D
M b
asi
s
Date
2010
2011
2012

5.0
7.5
10.0
12.5
15.0
17.5
20.0
22.5
1-Apr 1-May 31-May 30-Jun 30-Jul 29-Aug 28-Sep 28-Oct
Pe
rce
nta
ge
, D
M b
asi
s
Date, 2010
Grass
Clover
Figure 2. Crude protein percent in available forage for grass monocultures and grass white clover mixtures,
2010 grazing season
MF vs. TF P >0.10
65
70
75
80
85
90
95
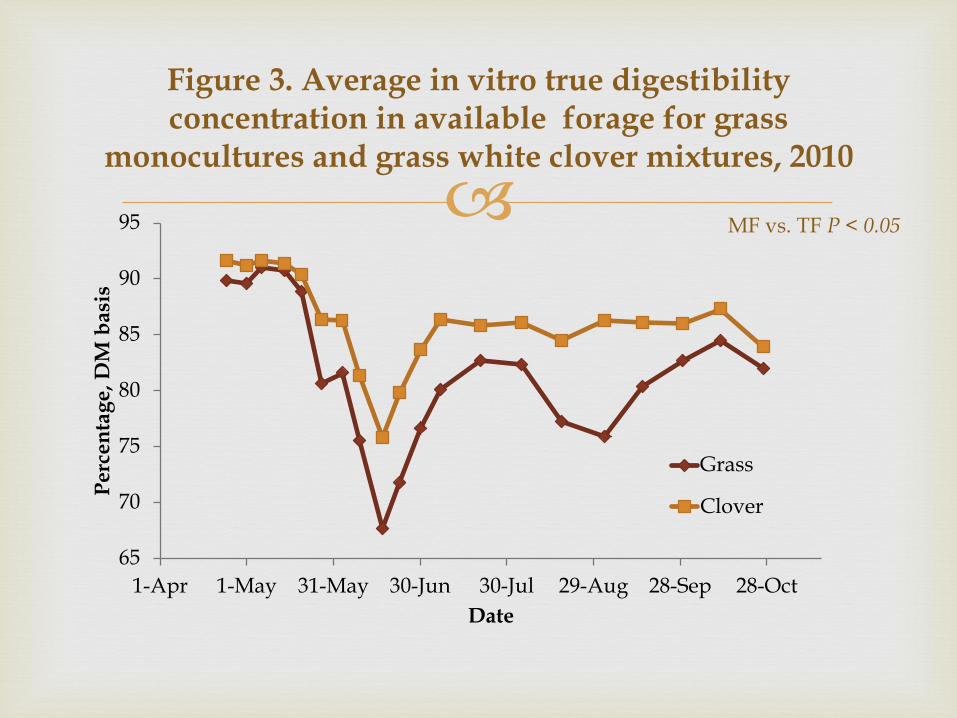
1-Apr 1-May 31-May 30-Jun 30-Jul 29-Aug 28-Sep 28-Oct
Perc
en
tag
e,
DM
ba
sis
Date
Grass
Clover
Figure 3. Average in vitro true digestibility concentration in available forage for grass
monocultures and grass white clover mixtures, 2010
MF vs. TF P < 0.05

0.50
0.75
1.00
1.25
1.50
1.75
2.00
2.25
2.50
2.75
3.00
3.25
AD
G,
lbs
P-1 P-2 P-3 P-4 P-5
Figure 4. Steer growth rates when grazing grass monocultures or grass white clover
mixtures within periods in 2010
C NC
0.50
0.75
1.00
1.25
1.50
1.75
2.00
2.25
2.50
2.75
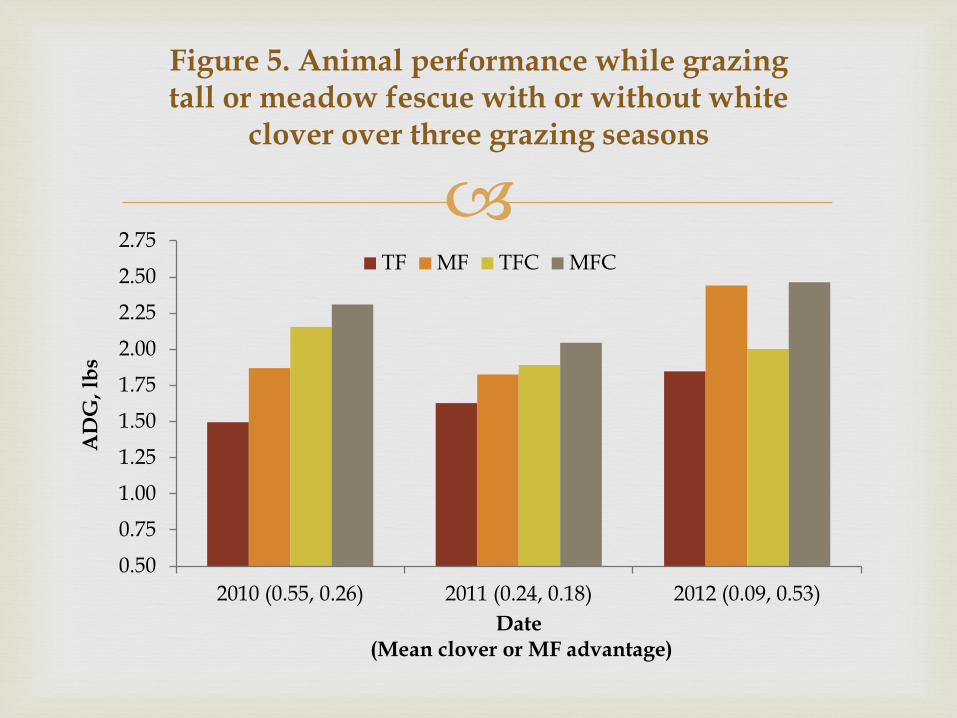
2010 (0.55, 0.26) 2011 (0.24, 0.18) 2012 (0.09, 0.53)
AD
G,
lbs
Date (Mean clover or MF advantage)
Figure 5. Animal performance while grazing tall or meadow fescue with or without white
clover over three grazing seasons
TF MF TFC MFC

Item
Treatment NDF CP IVTD NDFD ADG, lbs
TF 54.7a 16.0b 80.9c 65.8b 1.67c
MF 53.8a 16.6ab 83.5b 69.9a 2.02b
TFC 49.0b 17.1a 83.6b 67.2b 2.02b
MFC 48.8b 17.2a 85.8a 71.4a 2.29a
SEM 0.54 0.32 0.42 0.54 0.04
P - value
Fescue type 0.31 0.29 0.001 0.001 0.001
Clover inclusion 0.001 0.01 0.001 0.01 0.001
Fescue*clover 0.50 0.36 0.61 0.95 0.36
Fescue*year 0.33 0.01 0.33 0.35 0.001
Clover*year 0.001 0.001 0.001 0.03 0.48
Table 2. Tabular results of forage characteristics and animal performance over three grazing seasons
1000
1500
2000
2500
3000
3500
4000
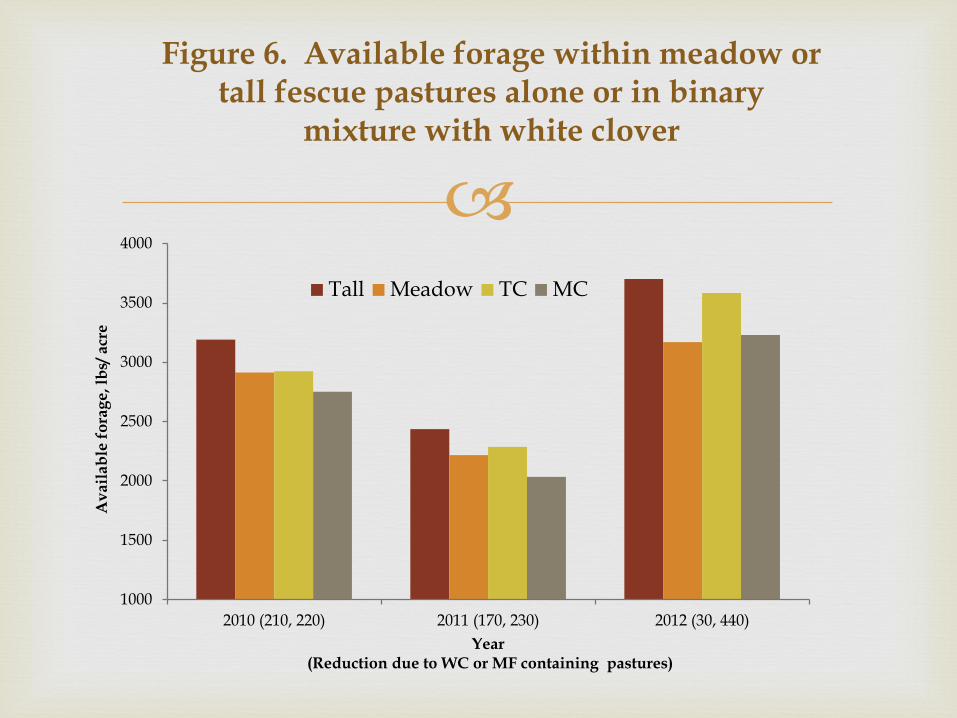
2010 (210, 220) 2011 (170, 230) 2012 (30, 440)
Av
ail
ab
le f
ora
ge, l
bs/
acr
e
Year (Reduction due to WC or MF containing pastures)
Figure 6. Available forage within meadow or tall fescue pastures alone or in binary
mixture with white clover
Tall Meadow TC MC
300
400
500
600
700
800
900
1000
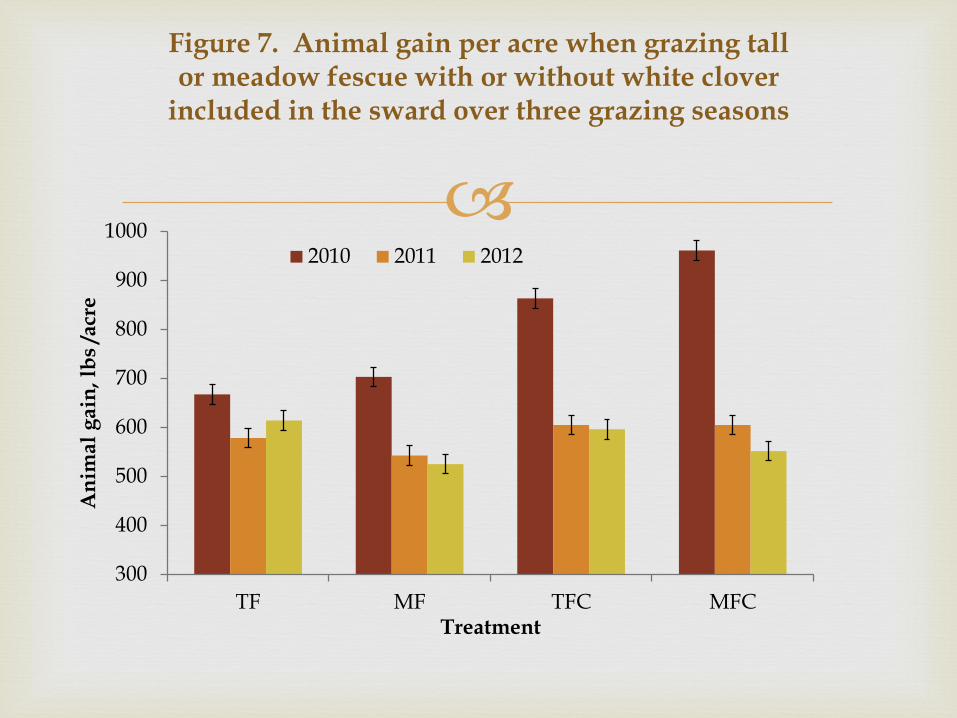
TF MF TFC MFC
An
imal
ga
in,
lbs
/acr
e
Treatment
Figure 7. Animal gain per acre when grazing tall or meadow fescue with or without white clover
included in the sward over three grazing seasons
2010 2011 2012

19
0%
10%
20%
30%
40%
50%
60%
70%
2010 (21) 2011 (0) 2012 (12)
Perc
en
tag
e o
f T
rea
tme
nts
Year (treatments per yr)
Figure 9. Pinkeye treatments within tester steers (108 per yr) over three grazing seasons
T TC M MC

White clover inclusion
Tended to lower available forage
Increased pasture quality (IVTD, CP, NDF)
Increased ADG and gain per acre
Grass type
MF had greater IVTD and ADG
TF increased available forage
Both grasses had similar gain per acre
Summary

Values are Per Acre, 2010 Item $ Value/ hd T M TC MC
Assumptions
Stocking Rate 2.69 2.21 2.29 2.21
Costs
Purchase Price (550*1.85) $ 1,017.50 $ 2,737 $ 2,249 $ 2,330 $ 2,249
Land Rent ($100/acre) $ 100 $ 100 $ 100 $ 100
Labor ($/hd) $ 10.00 $ 26.9 $ 22.1 $ 22.9 $ 22.1
Vet Costs $ 8.00 $ 21.52 $ 17.68 $ 18.32 $ 17.68
Death Loss $ 11.00 $ 29.59 $ 24.31 $ 25.19 $ 24.31
Salt (no poloxalene) 160 DOF $ 4.00 $ 10.76 $ 8.84 . .
Salt + Polo. $ 20.00 . . $ 45.80 $ 44.20
Fly/Deworming $ 7.00 $ 18.83 $ 15.47 $ 16.03 $ 15.47
Durables $ 45.00 $ 121.05 $ 99.45 $ 103.05 $ 99.45
Interest 6 % at 6 mo $ 30.53 $ 82.11 $ 67.46 $ 69.90 $ 67.46
Marketing $ 10.00 $ 26.90 $ 22.10 $ 22.90 $ 22.10
Miscellaneous $ 0.50 $ 1.35 $ 1.11 $ 1.15 $ 1.11
Management $ 8.00 $ 21.52 $ 17.68 $ 18.32 $ 17.68
Non N Fertilizer $ 25.00 $ 25.00 $ 25.00 $ 25.00
N Fertilizer $380/ton, 260 lbs $ 50.00 $ 50.00 . .
Clover . . $ 25.00 $ 25.00
Total Costs $ 3,259 $ 2,709 $ 2,812 $ 2,719
Total Costs- Animal price $ 522 $ 460 $ 482 $ 471
Income
ADG 1.40 1.78 2.03 2.34
End wt 774 834.8 874.8 924.4
Pay Price 750 lbs $ 148.00
Slide $0.05/lb $ 0.05
Final pay price $ 146.80 $ 143.76 $ 141.76 $ 139.28
Total Income $ 3,056.46 $ 2,652.24 $ 2,839.87 $ 2,845.38
Profit/loss $ (202.69) $ (56.58) $ 27.68 $ 126.20
Extension # A3718, Schuster, Undersander, Schaefer, Klemme, Siemens, Smith

Economic analysis, 2010-2012 grazing seasons
Tall fescue Meadow fescue Tall and clover Meadow and clover
Year Item
2010 ADG 1.40 1.78 2.03 2.34
SR 2.69 2.21 2.29 2.21
Gain/Acre 678 708 837 931
NIBT $ (202.69) $ (56.58) $ 27.68 $ 126.20
2011 ADG 1.70 1.98 2.00 2.20
SR 2.55 1.94 2.20 2.02
Gain/Acre 594 526 603 609
NIBT $ (71.87) $ (8.71) $ 10.33 $ 59.84
2012 ADG 1.85 2.44 2 2.46
SR 2.23 1.67 2.1 1.77
Gain/Acre 544 537 554 574
NIBT $ (30.17) $ 85.09 $ 3.04 $ 102.51
3 yr Avg. NIBT ($101.58) $6.60 $13.68 $96.18
• Gain per acre is not profitability • MF and white clover pastures were more profitable
(GIVEN SIMILAR MANAGEMENT)
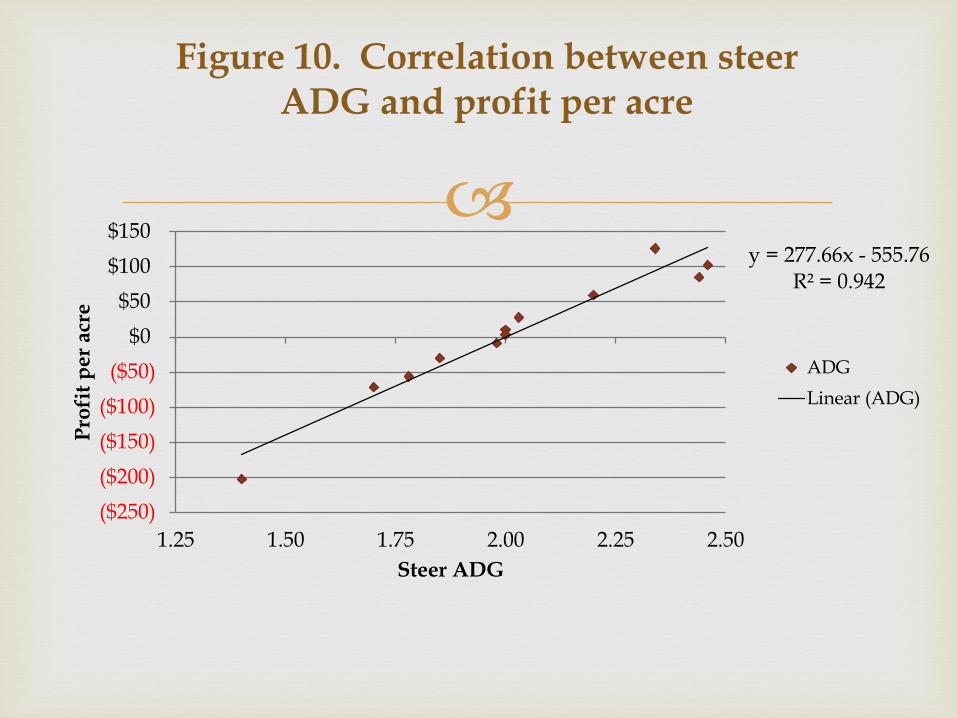
y = 277.66x - 555.76
R² = 0.942
($250)
($200)
($150)
($100)
($50)
$0
$50
$100
$150
1.25 1.50 1.75 2.00 2.25 2.50
Pro
fit
pe
r a
cre
Steer ADG
Figure 10. Correlation between steer ADG and profit per acre
ADG
Linear (ADG)
MF and TF are suitable for WI pastures
Increased stocker ADG increases profit per acre
Both pasture management and forage species play a vital role in profitability
Implications
