36755 national treasury ene budget/2008/ene/15 labour.pdf · labour budget summary 2008 ... through...
TRANSCRIPT
283
Vote 15 Labour
Budget summary 2008/09 2009/10 2010/11
Total to be Current Transfers and Payments for
R thousand appropriated payments subsidies capital assets Total Total
MTEF allocation
Administration 387 207 385 223 – 1 984 409 328 434 389
Service Delivery 690 361 659 114 849 30 398 767 488 807 593
Employment and Skills Development Services/ Human Resources Development
203 700 111 333 80 167 12 200 216 689 223 622
Labour Policy and Labour Market Programmes 441 142 82 096 358 914 132 471 262 506 405
Social Insurance 10 501 – 10 501 – 11 040 11 040
Total
1 732 911 1 237 766 450 431 44 714 1 875 807 1 983 049
Direct charges against the National Revenue Fund 7 529 600 – 7 529 600 – 8 244 912 9 044 668
Total expenditure estimates 9 262 511 1 237 766 7 980 031 44 714 10 120 719 11 027 717
Executive authority Minister of Labour
Accounting officer Director-General of Labour
Website address www.labour.gov.za
Aim
The aim of the Department of Labour is to reduce unemployment, poverty and inequality through policies and
programmes, developed in consultation with social partners, which are aimed at: improved economic efficiency
and productivity; skills development and employment creation; sound labour relations; eliminating inequality
and discrimination in the workplace; alleviating poverty in employment; enhancing occupational health and
safety awareness and compliance in the workplace; as well as nurturing the culture of acceptance that worker
rights are human rights.
Programme purposes, objectives and measures
Programme 1: Administration
Purpose: Provide for the overall management of the department and for strategic support and advisory services.
Programme 2: Service Delivery
Purpose: Ensure implementation of and compliance with Department of Labour policies and programmes
through monitoring, evaluation and inspections.
Objectives and measures:
• Increase the percentage of registered work seekers placed in registered employment opportunities through
employment counselling to job seekers and liaising with providers of employment opportunities.
• Assess and refer work seekers to identified critical and scarce skills development programmes by 2010/11.
• Facilitate the planned implementation of training of unemployed people and placement in employment
through co-operation with government departments and municipalities.
• Reduce workplace related injuries, illnesses and deaths through increased workplace inspections.
• Improve compliance with labour legislation by ensuring that inspected workplaces increasingly comply.
2008 Estimates of National Expenditure
284
Programme 3: Employment and Skills Development Services/Human Resources Development
Purpose: Contribute to employment creation and skills development by promoting and monitoring the
achievement of the objectives of the national skills development strategy (NSDS) and the national human
resource development strategy.
Objectives and measures:
• Develop the skills of work-seekers by training 90 000 unemployed persons and placing 70 per cent in
employment.
• Provide skills development support through National Skills Fund (NSF) and Sector Education and Training
Authority (SETA) funding to SMMEs, NGOs and co-operatives.
• Provide top-up funding to SETAs, the National Student Financial Aid Scheme (NSFAS) and the National
Research Foundation to assist 26 000 unemployed learners to enter scarce and critical skills programmes in
learnerships, apprenticeships, internships, bursaries and skills programmes.
• Provide funding through partnerships with Umsobomvu Youth Fund and the Small Enterprise Development
Agency (SEDA) to support 3 000 youth in new venture creation projects and ensure that 70 per cent of new
ventures are sustainable after completion of the programme through training and mentorship.
Programme 4: Labour Policy and Labour Market Programmes
Purpose: Establish an equitable and sound labour relations environment and promote South Africa’s interests
in international labour matters through research, analysing and evaluating labour policy, and providing
statistical data on the labour market, including providing support to the institutions that promote social
dialogue.
Objectives and measures:
• Fund 15 projects that target vulnerable workers in rural and remote areas over the next 3 years to access
their rights in terms of labour legislation.
• Improve employment equity by inspecting additional Johannesburg Stock Exchange listed companies each
year for substantive compliance with legislation.
• Improve the status of vulnerable workers by reviewing working conditions in the domestic worker, forestry,
taxi, contract cleaning, farm worker, and private security sectors by March 2009.
• Improve labour market policy by commissioning at least four critical research projects by March 2009.
Programme 5: Social Insurance
Purpose: Provide for administrative and other support services to the Unemployment Insurance Fund (UIF)
and the Compensation Fund, and manage government’s contribution to the activities of these funds.
Strategic overview and key policy developments: 2004/05 – 2010/11
The Department of Labour aims to support key government policies for the second decade of democracy by
activities that will: contribute to the growth and development in the economy; increase the ability of the
economy to create employment; address the needs of vulnerable and poor people in the second economy;
promote social security to contribute to poverty alleviation; and address racial and gender inequality.
Key policy developments
The department has prioritised the following areas over the MTEF period:
The department is tasked with developing and implementing the employment services system to improve
employment services for job seekers and employers. The system will register work seekers and job
opportunities and provide: job matching services, career guidance and counselling services, information
services, skills development referrals, and special services for designated groups. Phase 1 is being implemented
at all labour centres. This involves the rollout of the registration of job seekers, employers and placement

Vote15: Labour
285
opportunities, the matching of job seekers with job opportunities, and the training of trainers and users of the
system. A career guidance and counselling system will be developed and implemented by 2010/11. Public
comments on the draft employment services regulations (which compel public and private employers to register
vacancies) were published in August 2007 and are being incorporated into the draft bill for promulgation in
2009/10.
New regulations for learnerships and SETA grants were published in 2006/07. A joint policy statement on the
review of the national qualifications framework was tabled in August 2007 and released for implementation at
the national skills conference in October 2007. The new bill facilitates the formal establishment under the
Ministry of Labour of the Quality Council for Trades and Occupations (QCTO) to co-exist on an equal footing
with the Council for Higher Education and the Council for General and Further Education (known as Umalusi).
During 2008/09, the Skills Development Act (1998) will be amended to provide for: the functioning of the
National Skills Authority in relation to the National Skills Fund; amendments of SETA functions relating to
quality assurance; establishment of the QCTO; legislating artisan development; and listing the NSF as a public
entity.
The Decent Work Country Programme (DWCP) will be developed by April 2009 in collaboration with the
International Labour Organisation (ILO) and in consultation with social partners, focusing mainly on
employment creation. The four pillars of the Decent Work agenda (fundamental principles and rights at work
and international labour standards; employment and income opportunities; social dialogue and tripartism; and
social protection and social security) will be dealt with in the context of related government reform processes
and the department’s constitutional obligations.
Recent achievements
Service delivery
From April to September 2007, 53 848 job seekers were registered on the employment services system.
5 387 job seekers were matched against registered job opportunities of which 68 per cent were placed. The
target was exceeded by 13 per cent. 3 359 youth were assessed and placed in National Youth Service
programmes in the infrastructure sector compared to a target of 5 000. Through collaboration with the
Umsobomvu Youth Fund, 20 461 youth were trained against a target of 30 000 and 13 845 were placed in
employment.
From April to September 2007, 96 509 workplaces were inspected against a target of 150 000, of which
75 per cent (72 164) complied with labour legislation requirements within 90 days.
Skills development
48 268 unemployed people were trained in social development skills programmes between April and
September 2007, meeting the annual target, of which 30 212 (63 per cent) were placed in employment. R887
million was allocated to the provinces for strategic skills development interventions to benefit 26 000 learners
over three years. During the six-month period to the end of September 2007, 38 956 workers and 19 182
unemployed learners were trained in learnerships, apprenticeships and other scarce and critical skills
programmes.
Labour market policy
67 per cent of the 108 322 labour related complaints reported were investigated and the cases concluded within
90 days. Private security sector minimum wages and contract cleaning and civil engineering sectoral
determinations were reviewed and published. The hospitality sectoral determination was promulgated in May
2007 and published.
In 2006/07, awareness raising activities for the child labour programme of action were conducted in all
provinces. Pilot programmes were implemented to address the worst forms of child labour, including the
2008 Estimates of National Expenditure
286
commercial sexual exploitation of children, child trafficking, scavenging, children used by adults to commit
crimes, and a planning tool for the delivery of water that aims to bring water points closer to users.
Research has been concluded on the reduction of working hours, bargaining councils, the Commission for
Conciliation, Mediation and Arbitration (CCMA) and the labour market by the Human Sciences Research
Council (HSRC), together with the development policy research unit of the University of Cape Town and the
sociology of work programme of the University of Witwatersrand.
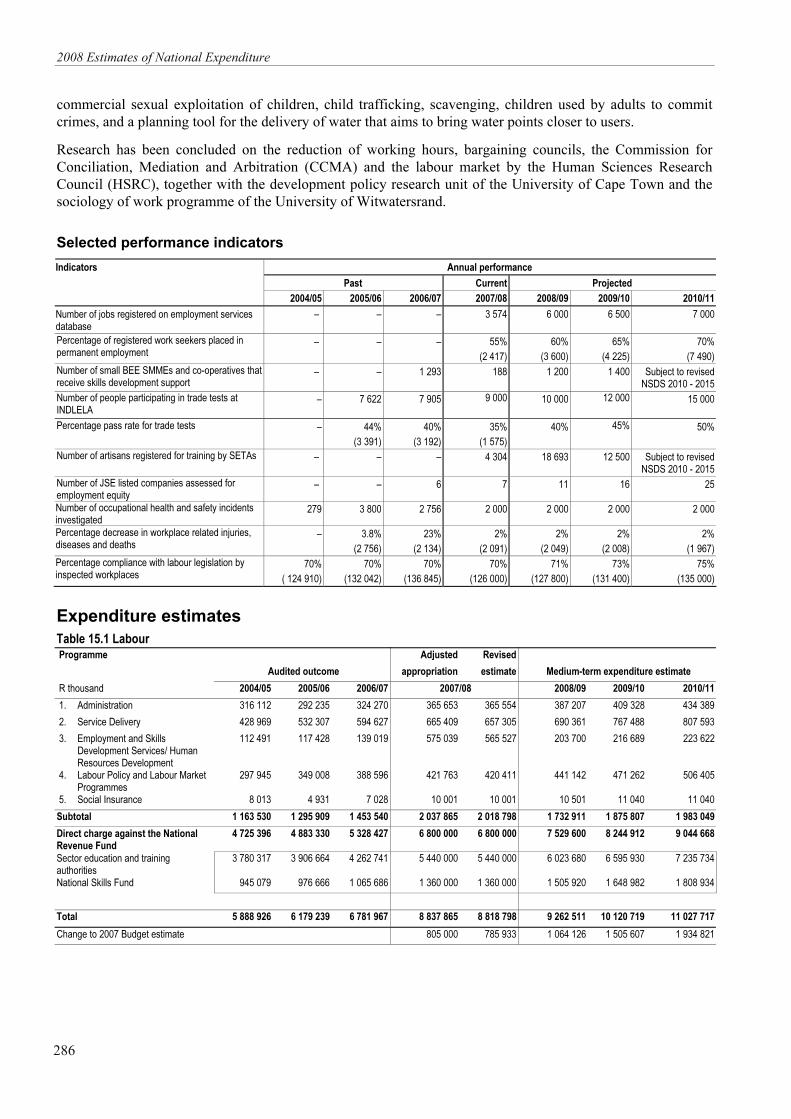
Selected performance indicators
Annual performance
Past Current Projected
Indicators
2004/05 2005/06 2006/07 2007/08 2008/09 2009/10 2010/11
Number of jobs registered on employment services database
– – – 3 574 6 000 6 500 7 000
Percentage of registered work seekers placed in permanent employment
– – – 55%
(2 417)
60%
(3 600)
65%
(4 225)
70%
(7 490)
Number of small BEE SMMEs and co-operatives that receive skills development support
– – 1 293 188 1 200 1 400 Subject to revised NSDS 2010 - 2015
Number of people participating in trade tests at INDLELA
– 7 622 7 905 9 000 10 000 12 000 15 000
Percentage pass rate for trade tests – 44%
(3 391)
40%
(3 192)
35%
(1 575)
40% 45% 50%
Number of artisans registered for training by SETAs – – – 4 304 18 693 12 500 Subject to revised NSDS 2010 - 2015
Number of JSE listed companies assessed for employment equity
– – 6 7 11 16 25
Number of occupational health and safety incidents investigated
279 3 800 2 756 2 000 2 000 2 000 2 000
Percentage decrease in workplace related injuries, diseases and deaths
– 3.8%
(2 756)
23%
(2 134)
2%
(2 091)
2%
(2 049)
2%
(2 008)
2%
(1 967)
Percentage compliance with labour legislation by inspected workplaces
70%
( 124 910)
70%
(132 042)
70%
(136 845)
70%
(126 000)
71%
(127 800)
73%
(131 400)
75%
(135 000)
Expenditure estimates
Table 15.1 Labour Programme Adjusted Revised
Audited outcome appropriation estimate Medium-term expenditure estimate
R thousand 2004/05 2005/06 2006/07 2007/08 2008/09 2009/10 2010/11
1. Administration 316 112 292 235 324 270 365 653 365 554 387 207 409 328 434 389
2. Service Delivery 428 969 532 307 594 627 665 409 657 305 690 361 767 488 807 593
3. Employment and Skills Development Services/ Human Resources Development
112 491 117 428 139 019 575 039 565 527 203 700 216 689 223 622
4. Labour Policy and Labour Market Programmes
297 945 349 008 388 596 421 763 420 411 441 142 471 262 506 405
5. Social Insurance 8 013 4 931 7 028 10 001 10 001 10 501 11 040 11 040
Subtotal 1 163 530 1 295 909 1 453 540 2 037 865 2 018 798 1 732 911 1 875 807 1 983 049
Direct charge against the National Revenue Fund
4 725 396 4 883 330 5 328 427 6 800 000 6 800 000 7 529 600 8 244 912 9 044 668
Sector education and training authorities
3 780 317 3 906 664 4 262 741 5 440 000 5 440 000 6 023 680 6 595 930 7 235 734
National Skills Fund 945 079 976 666 1 065 686 1 360 000 1 360 000 1 505 920 1 648 982 1 808 934
Total 5 888 926 6 179 239 6 781 967 8 837 865 8 818 798 9 262 511 10 120 719 11 027 717
Change to 2007 Budget estimate 805 000 785 933 1 064 126 1 505 607 1 934 821

Vote15: Labour
287
Table 15.1 Labour (continued)
Adjusted Revised
Audited outcome appropriation estimate Medium-term expenditure estimate
R thousand 2004/05 2005/06 2006/07 2007/08 2008/09 2009/10 2010/11
Economic classification
Current payments 800 146 924 651 1 016 025 1 181 464 1 170 775 1 237 766 1 351 532 1 451 879
Compensation of employees 371 495 425 317 477 064 580 694 578 194 643 627 722 311 792 935
Goods and services 428 129 499 323 538 087 600 770 592 581 594 139 629 221 658 944
of which:
Communication 54 503 44 045 46 475 59 421 59 421 31 329 35 523 42 318
Computer services 90 089 98 767 120 674 107 338 107 338 109 210 127 700 131 698
Consultants, contractors and special services
21 262 22 049 21 420 47 694 45 366 33 115 34 384 36 148
Inventory 40 994 20 711 28 558 22 796 22 231 33 973 36 218 37 518
Maintenance, repairs and running costs 4 985 38 828 48 117 41 360 41 463 14 882 10 276 7 266
Operating leases 55 853 60 891 67 614 72 021 71 329 79 903 90 587 101 245
Travel and subsistence 95 064 81 282 87 378 87 821 88 126 97 584 104 046 109 067
Municipal services 12 329 13 307 10 185 16 919 16 919 28 904 30 840 32 928
Venues and facilities 7 438 27 829 22 225 17 263 17 263 24 064 25 389 24 403
Advertising 15 962 21 737 15 368 12 213 12 213 17 679 16 156 17 820
Training and staff development 2 916 4 714 10 172 9 515 9 515 10 529 11 047 10 344
Financial transactions in assets and liabilities
522 11 874 – – – – –
Transfers and subsidies 5 049 835 5 241 972 5 738 793 7 624 660 7 625 250 7 980 031 8 722 661 9 554 423
Provinces and municipalities 1 095 1 278 284 – – – – –
Departmental agencies and accounts 4 989 795 5 181 486 5 677 022 7 169 705 7 169 705 7 901 230 8 653 493 9 484 418
Public corporations and private enterprises
– – – 400 000 400 000 5 080 5 156 5 813
Foreign governments and international organisations
5 737 5 783 6 882 7 620 7 457 7 736 8 507 9 017
Non-profit institutions 51 783 52 478 52 658 46 433 46 329 65 795 55 335 55 010
Households 1 425 947 1 947 902 1 759 190 170 165
Payments for capital assets 38 945 12 616 27 149 31 741 22 773 44 714 46 526 21 415
Buildings and other fixed structures 36 847 5 493 15 362 14 389 6 389 29 276 30 600 6 756
Machinery and equipment 2 020 7 123 11 787 17 269 16 241 15 438 15 926 14 659
Software and other intangible assets 78 – – 83 143 – – –
Total 5 888 926 6 179 239 6 781 967 8 837 865 8 818 798 9 262 511 10 120 719 11 027 717
Expenditure trends
Excluding direct charges against the National Revenue Fund, expenditure grew at an average annual rate of
20.5 per cent, from R1.2 billion in 2004/05 to R2 billion in 2007/08. The significant growth in 2007/08 of
40.2 per cent is mainly due to a once-off allocation of R400 million to the Umsobomvu Youth Fund, evident in
the Employment and Skills Development Services/Human Resources Development programme. Over the same
period, compensation of employees increased from R371.5 million to R580.7 million, at an average annual rate
of 16.1 per cent. This increase caters for capacity building as the number of posts increase from 7 176 in
2004/05 to 8 501 in 2007/08, mainly in the areas of clerks, assistant directors and deputy directors.
Direct charges against the National Revenue Fund include skills development levies to the sectoral education
and training authorities (SETAs) and the National Skills Fund, growing at an average annual rate of 10 per cent
over the MTEF period. The charges are included under transfers and subsidies, which comprise on average
86.3 per cent of total departmental allocations. In the 2008 Budget, transfers and subsidies receive additional
allocations of R1 billion in 2008/09, R1.4 billion in 2009/10 and R1.8 billion in 2010/11. Of this, R4.3 billion
was allocated to skills development levies; R75 million to capacitate the inspectorate and the employment
services system, and R48.6 million to the Commission for Conciliation, Mediation and Arbitration (CCMA).
2008 Estimates of National Expenditure
288
Other additional allocations in the 2008 Budget include: R5 million for the business case to restructure the
sheltered employment factories; R21 million for the decentralisation of functions to provinces; R53 million for
increased capacity for the employment services system; R50.3 million for compensation of employees for
implementing the 2007 resolution of the Public Service Co-ordinating Bargaining Council; R8.2 million for
accommodation charges; and R45.6 million for personnel and non-personnel inflation adjustments.
Efficiency savings of R14 million in 2008/09, R21.1 million in 2009/10 and R26.8 million in 2010/11 have
been identified in the Administration, Service Delivery, Employment and Skills Development Services/Human
Resources Development, and Labour Policy and Labour Market Programmes programmes. They will be made
under goods and services from travel and subsistence, and consultants and catering.
For spending on infrastructure, the initial repair and maintenance programme (RAMP) contracts ran from
2002/03 to 2005/06 and follow-on RAMP contracts were initiated in 2005/06. No spending on RAMP projects
at the Institution for the National Development of Learnerships, Employment-skills and Labour Assessments
(INDLELA) was incurred for both 2006/07 and 2007/08, due to budgetary constraints. Only maintenance,
repairs and running costs received the necessary funding. The 2007/08 appropriation for RAMP is
R800 000 and over the MTEF period it is projected to increase to R850 000 (2008/09), R1 million (2009/10)
and R33.3 million (2010/11). The sharp increase in 2010/11 caters for maintenance work on sheltered
employment factories and labour centres and follow-on RAMP contracts at Laboria House, INDLELA and the
Concillium building.
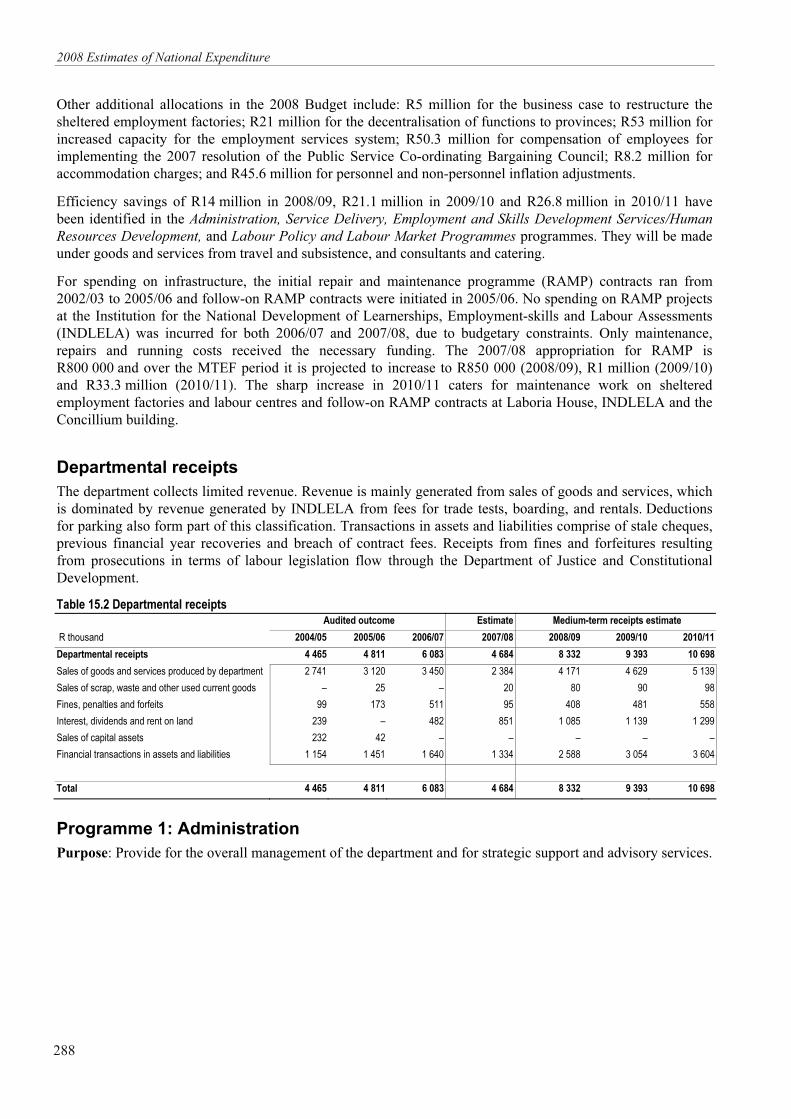
Departmental receipts
The department collects limited revenue. Revenue is mainly generated from sales of goods and services, which
is dominated by revenue generated by INDLELA from fees for trade tests, boarding, and rentals. Deductions
for parking also form part of this classification. Transactions in assets and liabilities comprise of stale cheques,
previous financial year recoveries and breach of contract fees. Receipts from fines and forfeitures resulting
from prosecutions in terms of labour legislation flow through the Department of Justice and Constitutional
Development.
Table 15.2 Departmental receipts Audited outcome Estimate Medium-term receipts estimate
R thousand 2004/05 2005/06 2006/07 2007/08 2008/09 2009/10 2010/11
Departmental receipts 4 465 4 811 6 083 4 684 8 332 9 393 10 698
Sales of goods and services produced by department 2 741 3 120 3 450 2 384 4 171 4 629 5 139
Sales of scrap, waste and other used current goods – 25 – 20 80 90 98
Fines, penalties and forfeits 99 173 511 95 408 481 558
Interest, dividends and rent on land 239 – 482 851 1 085 1 139 1 299
Sales of capital assets 232 42 – – – – –
Financial transactions in assets and liabilities 1 154 1 451 1 640 1 334 2 588 3 054 3 604
Total 4 465 4 811 6 083 4 684 8 332 9 393 10 698
Programme 1: Administration
Purpose: Provide for the overall management of the department and for strategic support and advisory services.
Vote15: Labour
289
Expenditure estimates
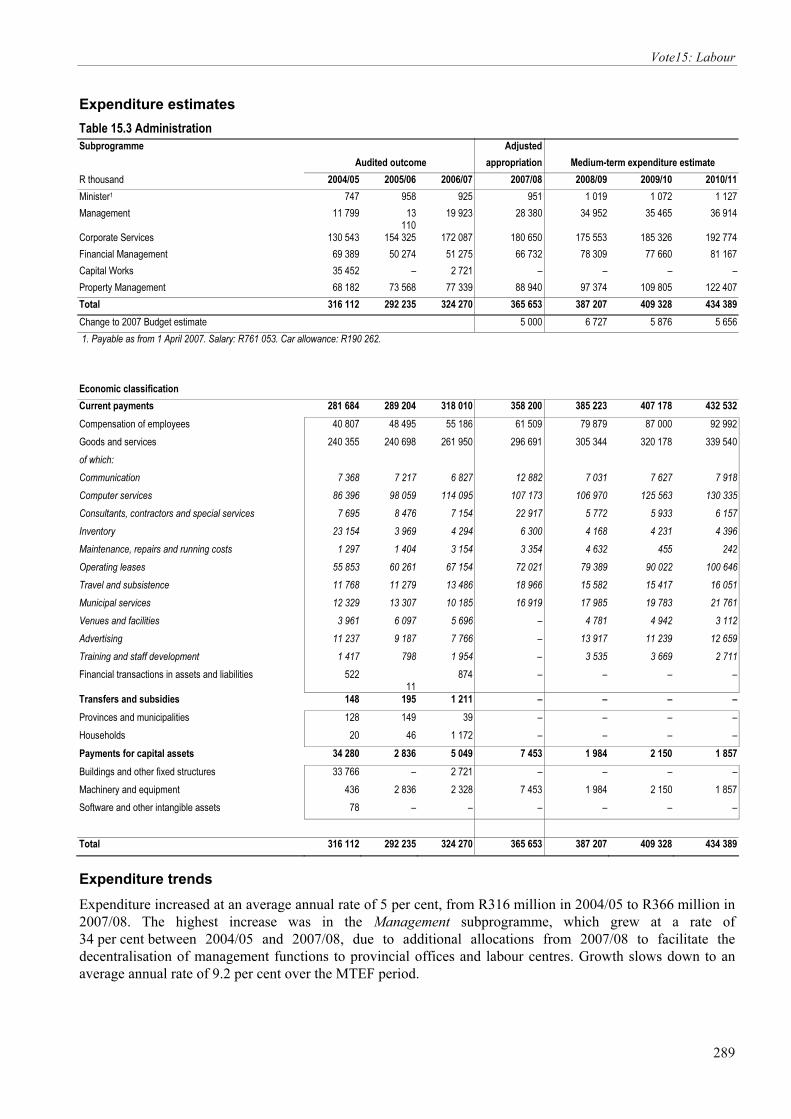
Table 15.3 Administration
Subprogramme Adjusted
Audited outcome appropriation Medium-term expenditure estimate
R thousand 2004/05 2005/06 2006/07 2007/08 2008/09 2009/10 2010/11
Minister1 747 958 925 951 1 019 1 072 1 127
Management 11 799 13 110
19 923 28 380 34 952 35 465 36 914
Corporate Services 130 543 154 325 172 087 180 650 175 553 185 326 192 774
Financial Management 69 389 50 274 51 275 66 732 78 309 77 660 81 167
Capital Works 35 452 – 2 721 – – – –
Property Management 68 182 73 568 77 339 88 940 97 374 109 805 122 407
Total 316 112 292 235 324 270 365 653 387 207 409 328 434 389
Change to 2007 Budget estimate 5 000 6 727 5 876 5 656
1. Payable as from 1 April 2007. Salary: R761 053. Car allowance: R190 262.
Economic classification
Current payments 281 684 289 204 318 010 358 200 385 223 407 178 432 532
Compensation of employees 40 807 48 495 55 186 61 509 79 879 87 000 92 992
Goods and services 240 355 240 698 261 950 296 691 305 344 320 178 339 540
of which:
Communication 7 368 7 217 6 827 12 882 7 031 7 627 7 918
Computer services 86 396 98 059 114 095 107 173 106 970 125 563 130 335
Consultants, contractors and special services 7 695 8 476 7 154 22 917 5 772 5 933 6 157
Inventory 23 154 3 969 4 294 6 300 4 168 4 231 4 396
Maintenance, repairs and running costs 1 297 1 404 3 154 3 354 4 632 455 242
Operating leases 55 853 60 261 67 154 72 021 79 389 90 022 100 646
Travel and subsistence 11 768 11 279 13 486 18 966 15 582 15 417 16 051
Municipal services 12 329 13 307 10 185 16 919 17 985 19 783 21 761
Venues and facilities 3 961 6 097 5 696 – 4 781 4 942 3 112
Advertising 11 237 9 187 7 766 – 13 917 11 239 12 659
Training and staff development 1 417 798 1 954 – 3 535 3 669 2 711
Financial transactions in assets and liabilities 52211
874 – – – –
Transfers and subsidies 148 195 1 211 – – – –
Provinces and municipalities 128 149 39 – – – –
Households 20 46 1 172 – – – –
Payments for capital assets 34 280 2 836 5 049 7 453 1 984 2 150 1 857
Buildings and other fixed structures 33 766 – 2 721 – – – –
Machinery and equipment 436 2 836 2 328 7 453 1 984 2 150 1 857
Software and other intangible assets 78 – – – – – –
Total 316 112 292 235 324 270 365 653 387 207 409 328 434 389
Expenditure trends
Expenditure increased at an average annual rate of 5 per cent, from R316 million in 2004/05 to R366 million in
2007/08. The highest increase was in the Management subprogramme, which grew at a rate of
34 per cent between 2004/05 and 2007/08, due to additional allocations from 2007/08 to facilitate the
decentralisation of management functions to provincial offices and labour centres. Growth slows down to an
average annual rate of 9.2 per cent over the MTEF period.
2008 Estimates of National Expenditure
290
The increase over the MTEF period is at an average annual rate of 5.9 per cent, reaching R434.4 million in
2010/11. Over the MTEF period the highest growth is in the Property Management subprogramme, which
grows at an average annual rate of 11.2 per cent, from R88.9 million in 2007/08 to R122.4 million in 2010/11
for accommodation, municipal services and leases.
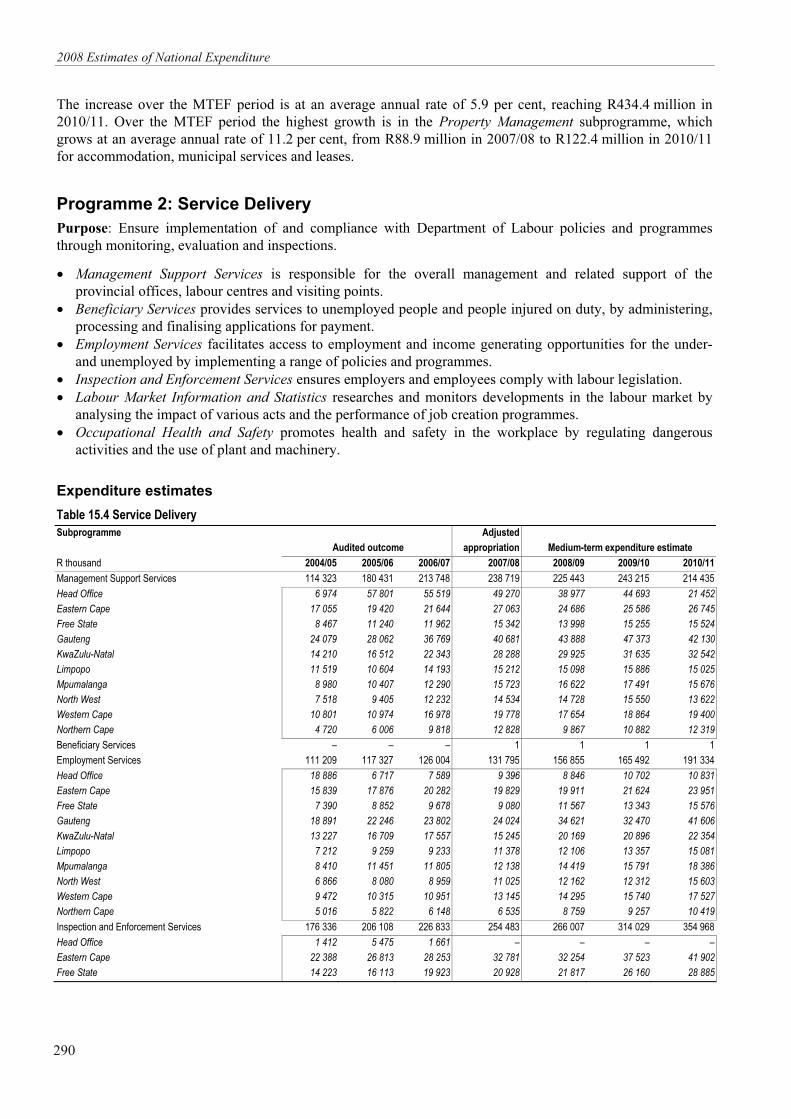
Programme 2: Service Delivery
Purpose: Ensure implementation of and compliance with Department of Labour policies and programmes
through monitoring, evaluation and inspections.
• Management Support Services is responsible for the overall management and related support of the
provincial offices, labour centres and visiting points.
• Beneficiary Services provides services to unemployed people and people injured on duty, by administering,
processing and finalising applications for payment.
• Employment Services facilitates access to employment and income generating opportunities for the under-
and unemployed by implementing a range of policies and programmes.
• Inspection and Enforcement Services ensures employers and employees comply with labour legislation.
• Labour Market Information and Statistics researches and monitors developments in the labour market by
analysing the impact of various acts and the performance of job creation programmes.
• Occupational Health and Safety promotes health and safety in the workplace by regulating dangerous
activities and the use of plant and machinery.
Expenditure estimates
Table 15.4 Service Delivery
Subprogramme Adjusted
Audited outcome appropriation Medium-term expenditure estimate
R thousand 2004/05 2005/06 2006/07 2007/08 2008/09 2009/10 2010/11
Management Support Services 114 323 180 431 213 748 238 719 225 443 243 215 214 435
Head Office 6 974 57 801 55 519 49 270 38 977 44 693 21 452
Eastern Cape 17 055 19 420 21 644 27 063 24 686 25 586 26 745
Free State 8 467 11 240 11 962 15 342 13 998 15 255 15 524
Gauteng 24 079 28 062 36 769 40 681 43 888 47 373 42 130
KwaZulu-Natal 14 210 16 512 22 343 28 288 29 925 31 635 32 542
Limpopo 11 519 10 604 14 193 15 212 15 098 15 886 15 025
Mpumalanga 8 980 10 407 12 290 15 723 16 622 17 491 15 676
North West 7 518 9 405 12 232 14 534 14 728 15 550 13 622
Western Cape 10 801 10 974 16 978 19 778 17 654 18 864 19 400
Northern Cape 4 720 6 006 9 818 12 828 9 867 10 882 12 319
Beneficiary Services – – – 1 1 1 1
Employment Services 111 209 117 327 126 004 131 795 156 855 165 492 191 334
Head Office 18 886 6 717 7 589 9 396 8 846 10 702 10 831
Eastern Cape 15 839 17 876 20 282 19 829 19 911 21 624 23 951
Free State 7 390 8 852 9 678 9 080 11 567 13 343 15 576
Gauteng 18 891 22 246 23 802 24 024 34 621 32 470 41 606
KwaZulu-Natal 13 227 16 709 17 557 15 245 20 169 20 896 22 354
Limpopo 7 212 9 259 9 233 11 378 12 106 13 357 15 081
Mpumalanga 8 410 11 451 11 805 12 138 14 419 15 791 18 386
North West 6 866 8 080 8 959 11 025 12 162 12 312 15 603
Western Cape 9 472 10 315 10 951 13 145 14 295 15 740 17 527
Northern Cape 5 016 5 822 6 148 6 535 8 759 9 257 10 419
Inspection and Enforcement Services 176 336 206 108 226 833 254 483 266 007 314 029 354 968
Head Office 1 412 5 475 1 661 – – – –
Eastern Cape 22 388 26 813 28 253 32 781 32 254 37 523 41 902
Free State 14 223 16 113 19 923 20 928 21 817 26 160 28 885
Vote15: Labour
291
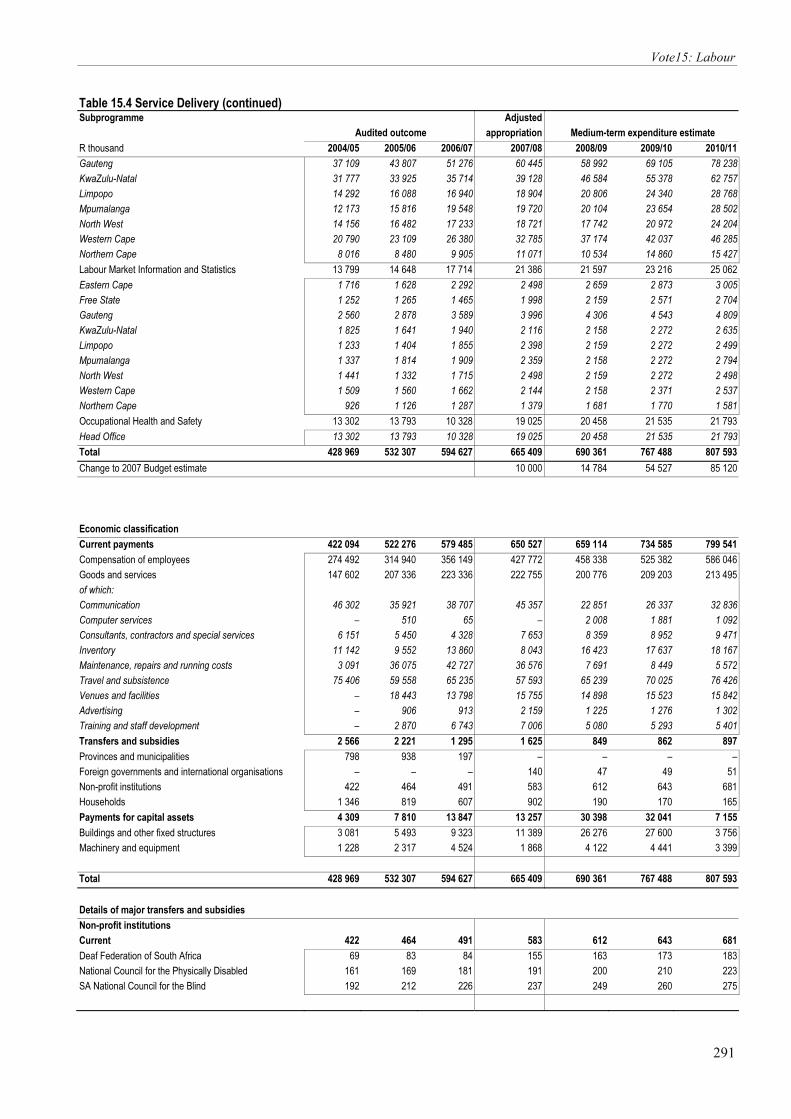
Table 15.4 Service Delivery (continued)
Subprogramme Adjusted
Audited outcome appropriation Medium-term expenditure estimate
R thousand 2004/05 2005/06 2006/07 2007/08 2008/09 2009/10 2010/11
Gauteng 37 109 43 807 51 276 60 445 58 992 69 105 78 238
KwaZulu-Natal 31 777 33 925 35 714 39 128 46 584 55 378 62 757
Limpopo 14 292 16 088 16 940 18 904 20 806 24 340 28 768
Mpumalanga 12 173 15 816 19 548 19 720 20 104 23 654 28 502
North West 14 156 16 482 17 233 18 721 17 742 20 972 24 204
Western Cape 20 790 23 109 26 380 32 785 37 174 42 037 46 285
Northern Cape 8 016 8 480 9 905 11 071 10 534 14 860 15 427
Labour Market Information and Statistics 13 799 14 648 17 714 21 386 21 597 23 216 25 062
Eastern Cape 1 716 1 628 2 292 2 498 2 659 2 873 3 005
Free State 1 252 1 265 1 465 1 998 2 159 2 571 2 704
Gauteng 2 560 2 878 3 589 3 996 4 306 4 543 4 809
KwaZulu-Natal 1 825 1 641 1 940 2 116 2 158 2 272 2 635
Limpopo 1 233 1 404 1 855 2 398 2 159 2 272 2 499
Mpumalanga 1 337 1 814 1 909 2 359 2 158 2 272 2 794
North West 1 441 1 332 1 715 2 498 2 159 2 272 2 498
Western Cape 1 509 1 560 1 662 2 144 2 158 2 371 2 537
Northern Cape 926 1 126 1 287 1 379 1 681 1 770 1 581
Occupational Health and Safety 13 302 13 793 10 328 19 025 20 458 21 535 21 793
Head Office 13 302 13 793 10 328 19 025 20 458 21 535 21 793
Total 428 969 532 307 594 627 665 409 690 361 767 488 807 593
Change to 2007 Budget estimate 10 000 14 784 54 527 85 120
Economic classification
Current payments 422 094 522 276 579 485 650 527 659 114 734 585 799 541
Compensation of employees 274 492 314 940 356 149 427 772 458 338 525 382 586 046
Goods and services 147 602 207 336 223 336 222 755 200 776 209 203 213 495
of which:
Communication 46 302 35 921 38 707 45 357 22 851 26 337 32 836
Computer services – 510 65 – 2 008 1 881 1 092
Consultants, contractors and special services 6 151 5 450 4 328 7 653 8 359 8 952 9 471
Inventory 11 142 9 552 13 860 8 043 16 423 17 637 18 167
Maintenance, repairs and running costs 3 091 36 075 42 727 36 576 7 691 8 449 5 572
Travel and subsistence 75 406 59 558 65 235 57 593 65 239 70 025 76 426
Venues and facilities – 18 443 13 798 15 755 14 898 15 523 15 842
Advertising – 906 913 2 159 1 225 1 276 1 302
Training and staff development – 2 870 6 743 7 006 5 080 5 293 5 401
Transfers and subsidies 2 566 2 221 1 295 1 625 849 862 897
Provinces and municipalities 798 938 197 – – – –
Foreign governments and international organisations – – – 140 47 49 51
Non-profit institutions 422 464 491 583 612 643 681
Households 1 346 819 607 902 190 170 165
Payments for capital assets 4 309 7 810 13 847 13 257 30 398 32 041 7 155
Buildings and other fixed structures 3 081 5 493 9 323 11 389 26 276 27 600 3 756
Machinery and equipment 1 228 2 317 4 524 1 868 4 122 4 441 3 399
Total 428 969 532 307 594 627 665 409 690 361 767 488 807 593
Details of major transfers and subsidies
Non-profit institutions
Current 422 464 491 583 612 643 681
Deaf Federation of South Africa 69 83 84 155 163 173 183
National Council for the Physically Disabled 161 169 181 191 200 210 223
SA National Council for the Blind 192 212 226 237 249 260 275

2008 Estimates of National Expenditure
292
Expenditure trends
Expenditure increased from R429 million in 2004/05 to R665.4 million in 2007/08, at an average annual rate of
15.8 per cent. The highest average annual increase of 27.8 per cent over this period is seen in the Management
Support Services subprogramme and is due to the decentralisation of functions to provincial offices and labour
centres from 2007/08. Although the budget increases to R807.6 million in 2010/11, the growth over the MTEF
period slows down to an average annual rate of 6.7 per cent.
Spending increased from R147.6 million in 2004/05 to R207.3 million in 2005/06 (24.1 per cent), mainly in
goods and services due to the reclassification of RAMPS expenditure from the Administration programme. The
increase in payments for capital assets: machinery and equipment was for the purchase of mobile units to
improve service delivery in rural areas, and in buildings and other fixed structures for revamping labour centres
to accommodate corporate imaging. Payments for capital assets: buildings and other fixed structures decrease
from R30 million in 2008/09 to R7 million in 2010/11 due to projects being finalised and no new projects being
registered.
Additional allocations in the 2008 Budget of R8 million, R15 million and R30 million over the MTEF period
will provide for career/vocational counsellors, placements and client service officer posts. Provision has also
been made for the upgrading of inspectors’ salaries in the second and third year of the MTEF period in an
attempt to stem the outflow of trained inspectors. Additional allocations in the 2008 Budget of R30 million in
2009/10 and R45 million in 2010/11 boost the growth of the Inspection and Enforcement subprogramme to an
average annual rate of 11.7 per cent over the MTEF period.
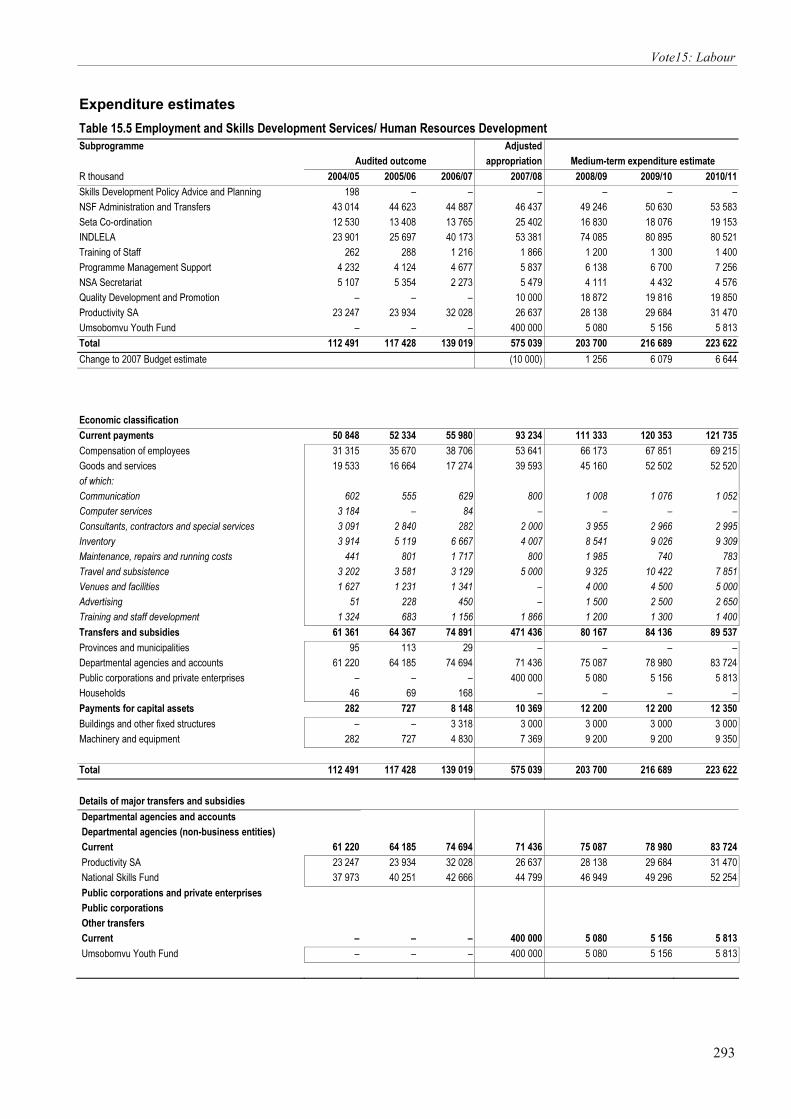
Programme 3: Employment and Skills Development Services / Human Resources Development
Purpose: Contribute to employment creation and skills development by promoting and monitoring the
achievement of the objectives of the national skills development strategy (NSDS) and the national human
resource development strategy.
The Skills Development Policy Advice and Planning was incorporated into the Programme Management
Support subprogramme.
• National Skills Fund Administration and Transfers funds and manages projects identified in the NSDS as
national priorities and other projects related to achieving the purposes of the Skills Development Act (1998),
as determined by the director-general of the Department of Labour.
• SETA Co-ordination resources, monitors and reports on the implementation of the NSDS at sectoral level
through establishing and managing the performance of service level agreements with SETAs.
• INDLELA manages and co-ordinates national artisan development, including monitoring the improvement
of artisan trade assessment and moderation and specialised technical training.
• Training of Staff funds staff training programmes and ensures the relevant skills are available for
implementing legislation.
• Programme Management Support provides management support to the employment and skills development
programme manager and co-ordinates NSDS reporting and monitoring.
• NSA Secretariat provides secretariat support to the National Skills Authority (NSA).
• Quality Development and Promotion co-ordinates the work of the Quality Council for Trades and
Occupations to develop, register and quality assure the implementation of qualifications and standards for
occupationally based learning across all sectors of the economy.
• Productivity SA supports government led strategic initiatives that affect job creation, productivity and
competitiveness.
• Umsobomvu Youth Fund (UYF) implements youth development support programmes for young people to
have sustainable livelihoods.
Vote15: Labour
293
Expenditure estimates
Table 15.5 Employment and Skills Development Services/ Human Resources Development
Subprogramme Adjusted
Audited outcome appropriation Medium-term expenditure estimate
R thousand 2004/05 2005/06 2006/07 2007/08 2008/09 2009/10 2010/11
Skills Development Policy Advice and Planning 198 – – – – – –
NSF Administration and Transfers 43 014 44 623 44 887 46 437 49 246 50 630 53 583
Seta Co-ordination 12 530 13 408 13 765 25 402 16 830 18 076 19 153
INDLELA 23 901 25 697 40 173 53 381 74 085 80 895 80 521
Training of Staff 262 288 1 216 1 866 1 200 1 300 1 400
Programme Management Support 4 232 4 124 4 677 5 837 6 138 6 700 7 256
NSA Secretariat 5 107 5 354 2 273 5 479 4 111 4 432 4 576
Quality Development and Promotion – – – 10 000 18 872 19 816 19 850
Productivity SA 23 247 23 934 32 028 26 637 28 138 29 684 31 470
Umsobomvu Youth Fund – – – 400 000 5 080 5 156 5 813
Total 112 491 117 428 139 019 575 039 203 700 216 689 223 622
Change to 2007 Budget estimate (10 000) 1 256 6 079 6 644
Economic classification
Current payments 50 848 52 334 55 980 93 234 111 333 120 353 121 735
Compensation of employees 31 315 35 670 38 706 53 641 66 173 67 851 69 215
Goods and services 19 533 16 664 17 274 39 593 45 160 52 502 52 520
of which:
Communication 602 555 629 800 1 008 1 076 1 052
Computer services 3 184 – 84 – – – –
Consultants, contractors and special services 3 091 2 840 282 2 000 3 955 2 966 2 995
Inventory 3 914 5 119 6 667 4 007 8 541 9 026 9 309
Maintenance, repairs and running costs 441 801 1 717 800 1 985 740 783
Travel and subsistence 3 202 3 581 3 129 5 000 9 325 10 422 7 851
Venues and facilities 1 627 1 231 1 341 – 4 000 4 500 5 000
Advertising 51 228 450 – 1 500 2 500 2 650
Training and staff development 1 324 683 1 156 1 866 1 200 1 300 1 400
Transfers and subsidies 61 361 64 367 74 891 471 436 80 167 84 136 89 537
Provinces and municipalities 95 113 29 – – – –
Departmental agencies and accounts 61 220 64 185 74 694 71 436 75 087 78 980 83 724
Public corporations and private enterprises – – – 400 000 5 080 5 156 5 813
Households 46 69 168 – – – –
Payments for capital assets 282 727 8 148 10 369 12 200 12 200 12 350
Buildings and other fixed structures – – 3 318 3 000 3 000 3 000 3 000
Machinery and equipment 282 727 4 830 7 369 9 200 9 200 9 350
Total 112 491 117 428 139 019 575 039 203 700 216 689 223 622
Details of major transfers and subsidies
Departmental agencies and accounts
Departmental agencies (non-business entities)
Current 61 220 64 185 74 694 71 436 75 087 78 980 83 724
Productivity SA 23 247 23 934 32 028 26 637 28 138 29 684 31 470
National Skills Fund 37 973 40 251 42 666 44 799 46 949 49 296 52 254
Public corporations and private enterprises
Public corporations
Other transfers
Current – – – 400 000 5 080 5 156 5 813
Umsobomvu Youth Fund – – – 400 000 5 080 5 156 5 813

2008 Estimates of National Expenditure
294
Expenditure trends
Between 2004/05 and 2007/08, spending increased at an average annual rate of 72.3 per cent from
R112.5 million to R575 million. This was mainly due to the reallocation of capital works expenditure in
2005/06 from the Administration programme, and a once-off allocation of R400 million in 2007/08 to the
Umsobomvu Youth Fund (UYF).
Growth over the MTEF period is a negative 27 per cent, but this percentage amounts to 8.5 per cent if the
2007/08 allocation to the UYF is excluded from the analysis. Most of the increase can be attributed to the
restructuring of the Institution for the National Development of Learnerships, Employment-skills and Labour
Assessments (INDLELA), which explains why the INDLELA subprogramme grows by an average annual rate
of 14.7 per cent to R80.5 million in 2010/11. Increasing from R282 000 in 2004/05 to R10.4 million in
2007/08, payments for capital assets for the restructuring of INDLELA continue to grow at 6 per cent over the
MTEF period.
During the 2007 Adjustment of Estimates the budget for this programme was reduced by R10 million as funds
were surrendered to the National Revenue Fund. Also, R18 million that had been allocated to the national
qualifications framework as transfers and subsidies was reclassified to current payments, as funds were
required for research processes aimed at developing the framework for the Quality Council for Trades and
Occupations.
Programme 4: Labour Policy and Labour Market Programmes
Purpose: Establish an equitable and sound labour relations environment and promote South Africa’s interests
in international labour matters through research, analysing and evaluating labour policy, and providing
statistical data on the labour market, including providing support to the institutions that promote social
dialogue.
• Programme Management Unit.
• Strengthen Civil Society improves working conditions of vulnerable workers by contributing to a stable and
well functioning labour market.
• Collective Bargaining manages the implementation of the Labour Relations Act (1995) through policies and
practices that promote sound labour relations.
• Employment Equity and Standards improves equity and protects vulnerable workers in the labour market.
• Commission for Conciliation, Mediation and Arbitration manages disputes in the labour market through
conciliation, mediation and arbitration.
• Research, Policy and Planning researches and monitors working conditions and policies affecting the labour
market in South African and elsewhere.
• Labour Market Information and Statistics collects, collates and analyses labour market statistics, and
informs all stakeholders about labour market trends that impact on legislation.
• International Labour Matters represents the South African government at the International Labour
Organisation (ILO), the African Union Labour and Social Affairs Commission, the Southern African
Development Community (SADC) Employment and Labour Sector and the African Regional Labour
Administration Centre (ARLAC).
• National Economic Development and Labour Council (NEDLAC) promotes economic growth and
participates in economic decision making and social equity by seeking consensus and agreements on social
and economic policy at NEDLAC.
• Sheltered Employment Factories improves the administration, production and financial control of
employment centres for the disabled.

Vote15: Labour
295
Expenditure estimates
Table 15.6 Labour Policy and Labour Market Programmes
Subprogramme Adjusted
Audited outcome appropriation Medium-term expenditure estimate
R thousand 2004/05 2005/06 2006/07 2007/08 2008/09 2009/10 2010/11
Programme Management Unit 7 358 7 668 7 251 9 408 9 467 9 933 10 717
Strengthen Civil Society 11 408 8 912 9 447 9 919 10 373 10 892 11 524
Collective Bargaining 7 465 7 315 7 817 9 079 8 227 8 816 9 344
Employment Equity and Standards 18 612 29 166 23 939 25 915 29 216 32 455 37 419
Commission for Conciliation, Mediation and Arbitration 174 612 208 577 244 714 265 001 261 710 293 012 317 955
Research, Policy and Planning 1 572 3 452 10 311 17 517 17 714 19 386 20 548
Labour Market Information and Statistics 3 199 2 979 3 068 4 780 4 435 4 764 5 050
International Labour Matters 12 175 17 036 15 142 18 425 17 650 19 216 20 368
National Economic Development and Labour Council 9 146 11 551 12 712 13 348 14 416 15 147 16 026
Sheltered Employment Factories 52 398 52 352 54 195 48 371 67 934 57 641 57 454
Total 297 945 349 008 388 596 421 763 441 142 471 262 506 405
Change to 2007 Budget estimate – 11 759 19 213 27 233
Economic classification
Current payments 45 520 60 837 62 550 79 503 82 096 89 416 98 071
Compensation of employees 24 881 26 212 27 023 37 772 39 237 42 078 44 682
Goods and services 20 639 34 625 35 527 41 731 42 859 47 338 53 389
of which:
Communication 231 352 312 382 439 483 512
Computer services 509 198 6 430 165 232 256 271
Consultants, contractors and special services 4 325 5 283 9 656 15 124 15 029 16 533 17 525
Inventory 2 784 2 071 3 737 4 446 4 841 5 324 5 646
Maintenance, repairs and running costs 156 548 519 630 574 632 669
Operating leases – 630 460 – 514 565 599
Travel and subsistence 4 688 6 864 5 528 6 262 7 438 8 182 8 739
Municipal Services – – – – 10 919 11 057 11 167
Venues and facilities 1 850 2 058 1 390 1 508 385 424 449
Advertising 4 674 11 416 6 239 10 054 1 037 1 141 1 209
Training and staff development 175 363 319 643 714 785 832
Transfers and subsidies 252 351 286 928 325 941 341 598 358 914 381 711 408 281
Provinces and municipalities 74 78 19 – – – –
Departmental agencies and accounts 195 166 229 040 266 873 288 268 286 042 318 561 344 986
Foreign governments and international organisations 5 737 5 783 6 882 7 480 7 689 8 458 8 966
Non-profit institutions 51 361 52 014 52 167 45 850 65 183 54 692 54 329
Households 13 13 – – – – –
Payments for capital assets 74 1 243 105 662 132 135 53
Machinery and equipment 74 1 243 105 579 132 135 53
Software and other intangible assets – – – 83 – – –
Total 297 945 349 008 388 596 421 763 441 142 471 262 506 405
Details of major transfers and subsidies
Departmental agencies and accounts
Departmental agencies (non-business entities)
Current 195 166 229 040 266 873 288 268 286 042 318 561 344 986
Commission for Conciliation, Mediation and Arbitration 174 612 208 577 244 714 265 001 261 710 293 012 317 955
National Economic Development and Labour Council 9 146 11 551 12 712 13 348 13 959 14 657 15 507
Foreign governments and international organisations
Current 5 737 5 783 6 882 7 480 7 689 8 458 8 966
International Labour Organisation 5 365 5 360 6 409 7 000 7 150 7 865 8 337
African Regional Labour Administration Centre 372 423 473 480 539 593 629
Non-profit institutions
Current 51 361 52 014 52 167 45 850 65 183 54 692 54 329
South African Youth Council – 1 000 – – – – –
Subsidised workshops for the blind 5 970 6 328 6 707 7 042 7 365 7 733 8 196
Subsidised work centres for the disabled 45 391 44 686 45 460 38 808 57 818 46 959 46 133

2008 Estimates of National Expenditure
296
Expenditure trends
Expenditure increased from R297.9 million in 2004/05 to R421.8 million in 2007/08, at an average annual rate
of 12.3 per cent. This was mainly driven by the Employment Equity and Standards subprogramme, which grew
by 56.7 per cent between 2004/05 and 2005/06 due to employment equity reporting and awareness campaigns,
and awareness raising campaigns for the child labour programme of action.
Expenditure in the Commission for Conciliation Mediation and Arbitration subprogramme increased at an
average annual rate of 14.9 per cent, from R174.6 million in 2004/05 to R265 million in 2007/08, due to the
increased CCMA caseload. In the 2008 Budget, additional allocations of R48.6 million over the MTEF period
have been added to the CCMA baseline for the recruitment of high performing part-time commissioners and the
provision of a dispute prevention management and institution building service.
Expenditure in the Research, Policy and Planning subprogramme increases at an average annual rate of
123.4 per cent, from R1.6 million in 2004/05 to R17.5 million in 2007/08 due to the research, monitoring and
evaluation agenda, which seeks to evaluate the impact of the department’s labour market interventions in the
last decade. Spending in the Sheltered Employment Factories subprogramme increases by 40.4 per cent from
2007/08 to 2008/09, due to an allocation of R5 million earmarked for a feasibility study, developing a business
case for its restructuring and R2.2 million for compensation of employees.
Programme 5: Social Insurance
Purpose: Provide for administrative and other support services to the Unemployment Insurance Fund (UIF)
and the Compensation Fund, and manage government’s contribution to the activities of these funds.
Expenditure estimates
Table 15.7 Social Insurance
Subprogramme Adjusted
Audited outcome appropriation Medium-term expenditure estimate
R thousand 2004/05 2005/06 2006/07 2007/08 2008/09 2009/10 2010/11
Unemployment Insurance Fund – – – 1 1 1 1
Compensation Fund 8 013 4 931 7 028 10 000 10 500 11 039 11 039
Total 8 013 4 931 7 028 10 001 10 501 11 040 11 040
Economic classification
Transfers and subsidies 8 013 4 931 7 028 10 001 10 501 11 040 11 040
Departmental agencies and accounts 8 013 4 931 7 028 10 001 10 501 11 040 11 040
Total 8 013 4 931 7 028 10 001 10 501 11 040 11 040
Details of major transfers and subsidies
Departmental agencies and accounts
Social security funds
Current 8 013 4 931 7 028 10 001 10 501 11 040 11 040
Compensation Fund 8 013 4 931 7 028 10 000 10 500 11 039 11 039
Expenditure trends
The allocation to the Unemployment Insurance Fund (UIF) was reduced to a nominal R1 000 a year, starting
from 2005/06, due to the fund being solvent with a strong asset base. (The department is obliged to include
provision for future requests for funding from the UIF from the fiscus in its budgetary submission.)
Transfer payments to the Compensation Fund decreased in 2005/06, by 38.5 per cent in 2005/06 due to the
under-utilisation of previous budgetary allocations for claims by civil servants for injuries sustained on duty.

Vote15: Labour
297
The budget growth slows down to an average annual rate of 3.3 per cent over the medium term due to a
forecasted decrease in claims by civil servants for injuries sustained on duty.
Public entities and other agencies
National Skills Fund
The National Skills Fund (NSF) was established in 1999 in terms of the Skills Development Act (1998). The
NSF is funded through 20 per cent of the skills development levies collected by the South African Revenue
Services (SARS) as legislated in the Skills Development Levies Act (1999), of which a maximum of
2 per cent is allocated for administration.
In April 2005, the Minister of Labour launched the national skills development strategy (NSDS) 2005-2010
resulting in the NSF reviewing its funding windows and processes to ensure that the NSDS targets are met.
Key priorities for 2008/09 include accelerating the rate of disbursement related to the NSDS annual targets, and
support to the Accelerated and Shared Growth Initiative for South Africa (ASGISA) and Joint Initiative on
Priority Skills Acquisition (JIPSA) skills development targets. The legal status of the NSF is currently being
addressed and proposed amendments have been incorporated into the Skills Development Amendment
Bill (2008) to be tabled in Parliament.
By the end of September 2007, the NSF had disbursed R114 million from a total of R390 million to six
provinces. Due to a slow start, only three provinces have reported achievements against provincial growth and
development strategy (PGDS) strategic projects. 48 268 unemployed people have undergone training valued at
R127 million related to social development initiative projects including the expanded public works programme
(EPWP). Of those trained, 26 per cent were in accredited training programmes, and 30 212 have been placed in
employment. In the adult basic education and training programme, 16 463 unemployed learners were trained
from a target of 20 000 while 5 590 unemployed learners were provided with bursaries to enter areas of scarce
and critical skills learning, such as accounting and engineering.
Selected performance indicators
Annual performance
Past Current Projected
Indicators
2004/05 2005/06 2006/07 2007/08 2008/09 2009/10 2010/111
Number of unemployed persons assisted to enter learning programmes
– 46 676 41 011 3 126 16 000 18 000 Subject to the targets of the NSDS 2010
Number completed learning programmes
– 4 256 12 251 1 513 8 000 9 000 Subject to the targets of the NSDS 2010
Number of undergraduate bursaries awarded
6 195 6 941 1 148 1 270 4 500 7 000 Subject to the targets of the NSDS 2010
Number of postgraduate bursaries awarded
693 621 1 042 1 194 1 500 1 700 Subject to the targets of the NSDS 2010
Number of ABET learners registered by the NSF
– 41 097 46 095 18 744 40 000 40 000 Subject to the targets of the NSDS 2010
Number of registered ABET learners completed programme
– – 12 748 9 372 20 000 20 000 Subject to the targets of the NSDS 2010
Number of unemployed persons trained
– 103 168 118 153 90 000 90 000 90 000 Subject to the targets of the NSDS 2010
Number of trained unemployed persons placed in employment
– 55 376 90 691 63 000
63 000 63 000 Subject to the targets of the NSDS 2010
1. The revised NSDS strategy will be developed in 2010
2008 Estimates of National Expenditure
298
Expenditure estimates
Table 15.8 National Skills Fund Estimated
Audited outcome outcome Medium-term estimate
R thousand 2004/05 2005/06 2006/07 2007/08 2008/09 2009/10 2010/11
Revenue
Skills development levy 945 079 976 666 1 065 686 1 360 000 1 505 920 1 648 982 1 808 934
Non-tax revenue 98 491 102 793 177 798 204 300 206 705 216 213 225 942
Other non-tax revenue 98 491 102 793 177 798 204 300 206 705 216 213 225 942
Transfers received 41 705 40 251 42 666 44 799 46 949 49 296 52 254
Total revenue 1 085 275 1 119 710 1 286 150 1 609 099 1 759 574 1 914 491 2 087 130
Expenses
Current expense 75 614 64 448 72 448 70 846 73 791 74 834 75 651
Compensation of employees 7 362 9 232 11 782 12 371 15 000 15 750 16 537
Goods and services 68 252 55 216 60 666 58 475 58 791 59 084 59 114
Transfers and subsidies 1 114 270 579 915 644 415 810 243 1 067 339 1 298 827 1 399 080
Total expenses 1 189 884 644 363 716 863 881 089 1 141 130 1 373 661 1 474 731
Surplus / (Deficit) (104 609) 475 347 569 287 728 010 618 444 540 830 612 399
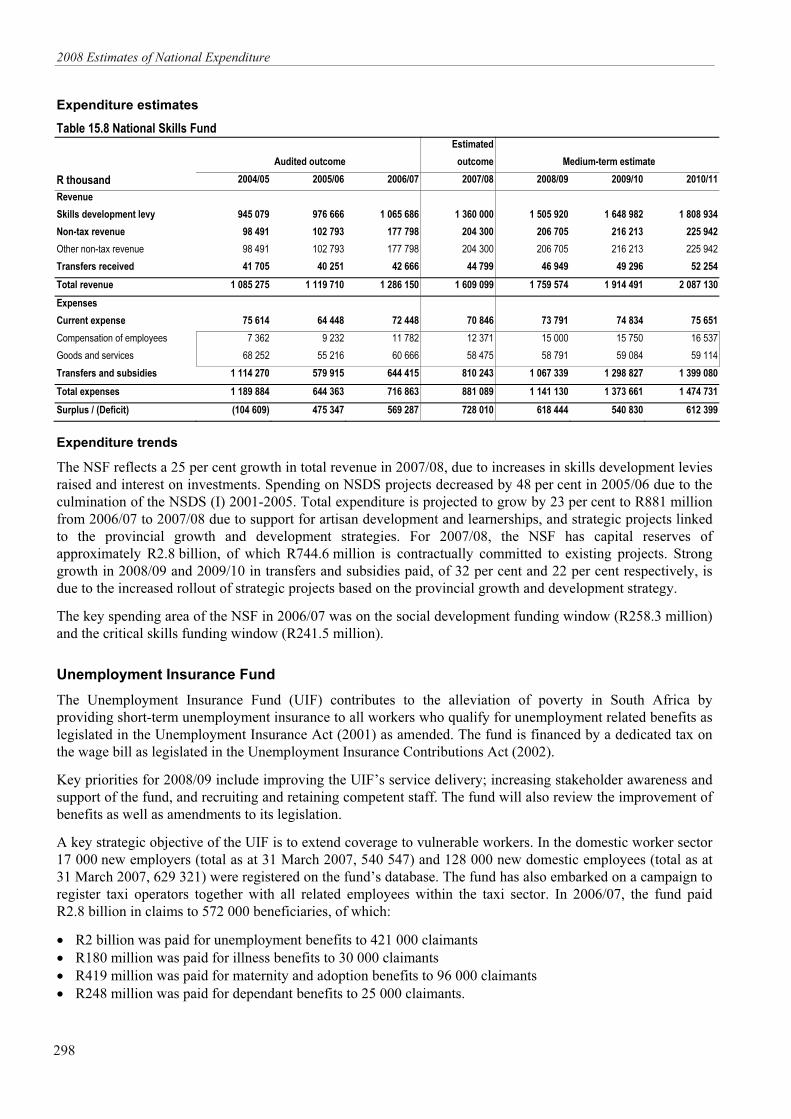
Expenditure trends
The NSF reflects a 25 per cent growth in total revenue in 2007/08, due to increases in skills development levies
raised and interest on investments. Spending on NSDS projects decreased by 48 per cent in 2005/06 due to the
culmination of the NSDS (I) 2001-2005. Total expenditure is projected to grow by 23 per cent to R881 million
from 2006/07 to 2007/08 due to support for artisan development and learnerships, and strategic projects linked
to the provincial growth and development strategies. For 2007/08, the NSF has capital reserves of
approximately R2.8 billion, of which R744.6 million is contractually committed to existing projects. Strong
growth in 2008/09 and 2009/10 in transfers and subsidies paid, of 32 per cent and 22 per cent respectively, is
due to the increased rollout of strategic projects based on the provincial growth and development strategy.
The key spending area of the NSF in 2006/07 was on the social development funding window (R258.3 million)
and the critical skills funding window (R241.5 million).
Unemployment Insurance Fund
The Unemployment Insurance Fund (UIF) contributes to the alleviation of poverty in South Africa by
providing short-term unemployment insurance to all workers who qualify for unemployment related benefits as
legislated in the Unemployment Insurance Act (2001) as amended. The fund is financed by a dedicated tax on
the wage bill as legislated in the Unemployment Insurance Contributions Act (2002).
Key priorities for 2008/09 include improving the UIF’s service delivery; increasing stakeholder awareness and
support of the fund, and recruiting and retaining competent staff. The fund will also review the improvement of
benefits as well as amendments to its legislation.
A key strategic objective of the UIF is to extend coverage to vulnerable workers. In the domestic worker sector
17 000 new employers (total as at 31 March 2007, 540 547) and 128 000 new domestic employees (total as at
31 March 2007, 629 321) were registered on the fund’s database. The fund has also embarked on a campaign to
register taxi operators together with all related employees within the taxi sector. In 2006/07, the fund paid
R2.8 billion in claims to 572 000 beneficiaries, of which:
• R2 billion was paid for unemployment benefits to 421 000 claimants
• R180 million was paid for illness benefits to 30 000 claimants
• R419 million was paid for maternity and adoption benefits to 96 000 claimants
• R248 million was paid for dependant benefits to 25 000 claimants.

Vote15: Labour
299
Selected performance indicators
Annual performance
Past Current Projected
Indicators
2004/05 2005/06 2006/07 2007/08 2008/09 2009/10 2010/11
Percentage improvement in compliance by employers compared to previous year
– – – 6 6 7 8
Percentage increase in revenue collection compared to previous year
7.70% R6.1bn
12.51 % R6.9bn
16.39% R8.1bn
CPIX CPIX CPIX CPIX
Number of weeks to process claims 6 8 6 6 5 4 4
Percentage of benefit claims finalised within allocated period 90% 81% 81% 90% 90% 95% 95%
Expenditure estimates
Table 15.9 Unemployment Insurance Fund Estimated
Audited outcome outcome Medium-term estimate
R thousand 2004/05 2005/06 2006/07 2007/08 2008/09 2009/10 2010/11
Revenue
Unemployment contributions 6 059 992 6 861 174 7 985 365 8 660 945 9 266 721 9 914 902 10 559 859
Non-tax revenue 769 959 959 422 1 478 615 1 426 494 1 698 635 1 998 886 3 103 379
Sale of goods and services other than capital assets
2 916 1 936 1 512 1 366 1 419 1 514 1 647
of which:
Sales by market establishments 2 916 1 936 1 512 1 366 1 419 1 514 1 647
Other non-tax revenue 767 043 957 486 1 477 103 1 425 128 1 697 216 1 997 372 3 101 732
Total revenue 6 829 951 7 820 596 9 463 980 10 087 439 10 965 356 11 913 788 13 663 238
Expenses
Current expense 558 427 288 369 883 391 874 529 942 282 998 581 1 311 339
Compensation of employees 220 436 258 302 287 845 402 985 449 454 476 421 587 091
Goods and services 321 349 27 837 596 041 466 024 486 977 515 957 710 298
Depreciation 9 935 2 229 (626) 5 520 5 851 6 203 13 950
Interest, dividends and rent on land
6 707 1 131 – – – –
Transfers and subsidies 4 228 772 2 933 425 2 576 058 5 317 966 6 329 330 7 105 750 6 715 725
Total expenses 4 787 199 3 221 794 3 459 449 6 192 495 7 271 612 8 104 331 8 027 064
Surplus / (Deficit) 2 042 752 4 598 802 6 004 531 3 894 944 3 693 744 3 809 457 5 636 174
Acquisition of assets 846 2 433 3 655 70 624 68 246 43 273 3 345
Expenditure trends
The increases to the maximum earnings threshold in 2005 and 2006 and the percentage growth in wage
inflation has resulted in a 12.6 per cent growth in unemployment contributions collected from 2004/05 to
2007/08, with slower growth of 7 per cent over the MTEF period. In 2007/08, spending on compensation of
employees grows at 40 per cent based on the agencification and ring fencing of UIF staff members. The
2008 Estimates of National Expenditure
300
agencification process has, however, been cancelled, resulting in a lower growth rate for compensation of
employees over the MTEF period. Transfers and subsidies paid decreased by 31 per cent and 12 per cent in
2005/06 and 2006/07 respectively, as a result of a growing economy resulting in a slight decrease in
unemployment rates. However, actuarial evaluations estimate significant growth in unemployment benefits
paid in 2007/08 due to the inclusion of transfers to technical reserves. As at 31 March 2007, the fund’s
investments totalled R20 billion and cash and cash equivalents R503 million, providing the fund with total
assets valued in excess of R20.6 billion. The fund has set aside reserves for outstanding and future claims
totalling R10.7 billion as recommended by the fund’s actuaries, thus ensuring an adequate safety net for the
unemployed.
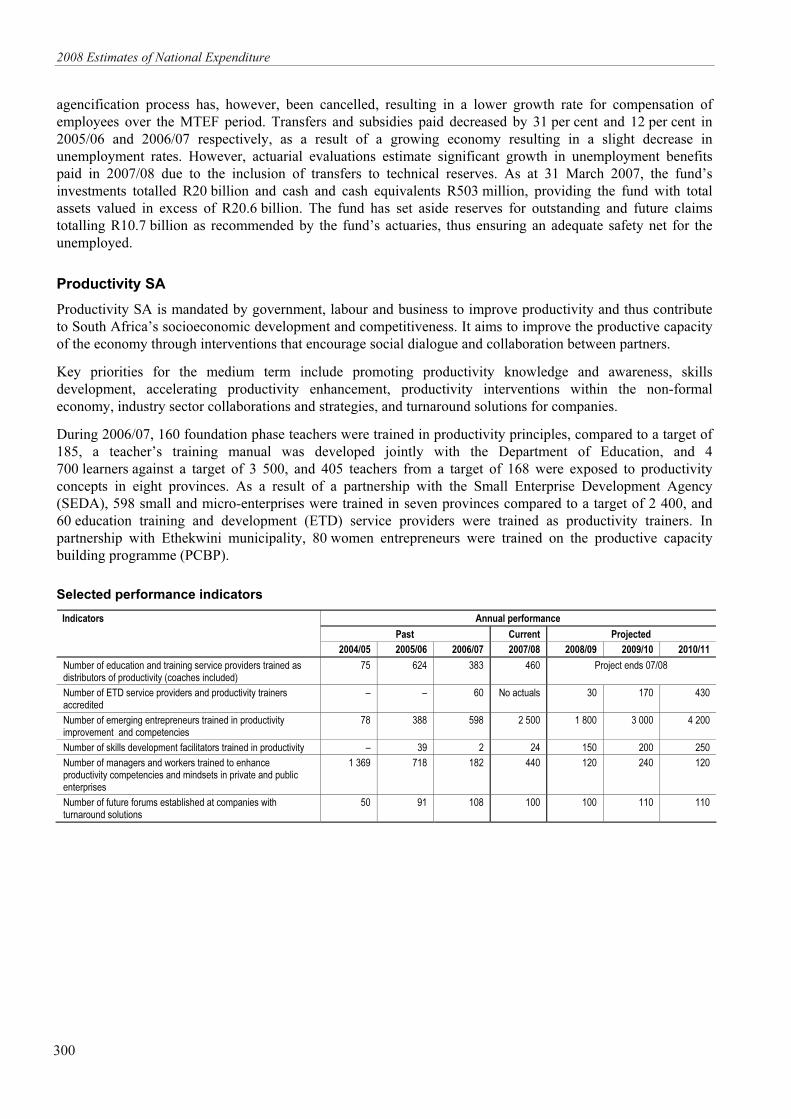
Productivity SA
Productivity SA is mandated by government, labour and business to improve productivity and thus contribute
to South Africa’s socioeconomic development and competitiveness. It aims to improve the productive capacity
of the economy through interventions that encourage social dialogue and collaboration between partners.
Key priorities for the medium term include promoting productivity knowledge and awareness, skills
development, accelerating productivity enhancement, productivity interventions within the non-formal
economy, industry sector collaborations and strategies, and turnaround solutions for companies.
During 2006/07, 160 foundation phase teachers were trained in productivity principles, compared to a target of
185, a teacher’s training manual was developed jointly with the Department of Education, and 4
700 learners against a target of 3 500, and 405 teachers from a target of 168 were exposed to productivity
concepts in eight provinces. As a result of a partnership with the Small Enterprise Development Agency
(SEDA), 598 small and micro-enterprises were trained in seven provinces compared to a target of 2 400, and
60 education training and development (ETD) service providers were trained as productivity trainers. In
partnership with Ethekwini municipality, 80 women entrepreneurs were trained on the productive capacity
building programme (PCBP).
Selected performance indicators
Annual performance
Past Current Projected
Indicators
2004/05 2005/06 2006/07 2007/08 2008/09 2009/10 2010/11
Number of education and training service providers trained as distributors of productivity (coaches included)
75 624 383 460 Project ends 07/08
Number of ETD service providers and productivity trainers accredited
– – 60 No actuals 30 170 430
Number of emerging entrepreneurs trained in productivity improvement and competencies
78 388 598 2 500 1 800 3 000 4 200
Number of skills development facilitators trained in productivity – 39 2 24 150 200 250
Number of managers and workers trained to enhance productivity competencies and mindsets in private and public enterprises
1 369 718 182 440 120 240 120
Number of future forums established at companies with turnaround solutions
50 91 108 100 100 110 110

Vote15: Labour
301
Expenditure estimates
Table 15.10 Productivity South Africa Estimated
Audited outcome outcome Medium-term estimate
R thousand 2004/05 2005/06 2006/07 2007/08 2008/09 2009/10 2010/11
Revenue
Non-tax revenue 8 898 4 450 10 229 21 113 10 229 9 615 9 038
Sale of goods and services other than capital assets
7 490 3 828 9 834 21 113 10 229 9 615 9 038
of which:
Sales by market establishments 7 490 3 828 9 834 21 113 10 229 9 615 9 038
Other non-tax revenue 1 408 622 395 – – – –
Transfers received 41 690 41 091 57 236 34 895 36 798 38 771 44 828
Total revenue 50 588 45 541 67 465 56 008 47 027 48 386 53 866
Expenses
Current expense 51 623 55 864 72 854 78 270 79 929 85 757 92 001
Compensation of employees 23 650 24 190 27 032 29 443 31 504 33 710 36 069
Goods and services 27 564 31 064 45 013 47 967 47 932 51 527 55 391
Depreciation 409 610 800 860 493 520 541
Interest, dividends and rent on land – – 9 – – – –
Transfers and subsidies 80 276 471 – – – –
Total expenses 51 703 56 140 73 325 78 270 79 929 85 757 92 001
Surplus / (Deficit) (1 115) (10 599) (5 860) (22 262) (32 902) (37 371) (38 135)
Acquisition of assets 591 942 1 234 828 665 704 747
Expenditure trends
Productivity SA received an additional allocation of R1.1 million over the three years, for compensation of
employees. In 2006/07 and 2007/08, non-tax revenue grows significantly due to the significant growth in sales
by the market establishment of 157 per cent and 115 per cent respectively, as a result of the expansion of the
scope of work for the social plan; workplace challenge programme and SEDA intervention projects. Project
expansion has also resulted in a 45 per cent increase in spending on goods and services in 2006/07.
Compensation Fund
The Compensation Fund administers the Compensation for Occupational Injuries and Diseases Act (1993)
(COIDA) as amended. The main objective of the act is to provide compensation for disablement, illness and
death resulting from occupational injuries and diseases.
Priority improvements for the fund include: payment of benefits through electronic transfer (rather than
cheques); improving collections; improving turnaround time for claims settlement, and the development of the
fund’s information system. A turnaround strategy for the fund was implemented in July 2007. This business re-
engineering project is expected to improve and align the business processes in accordance with all related
regulations and the fund’s strategic objectives. Upgrading of the Compensation Fund’s financial system began
in January 2008. Expenditure on benefit payments increases from R1.7 billion in 2004/05 to R2.3 billion in
2007/08 due to the processing of 73 per cent of backlog claims from 2000 to 2004. Cheque payments were
discontinued and an electronic payment method was implemented from September 2007.
Major achievements for 2006/07 include finalising 84 per cent of the balance of backlog claims and the
processing of 58 per cent of current claims. In total, 868 076 claims were paid. A successful pilot project was
conducted to decentralise claims registration and adjudication to labour centres. As a result COIDA benefit
payments were increased; all new claims received are now registered within 24 hours of receipt; and a new
document management system was piloted and implemented, improving the quality of electronic files.
2008 Estimates of National Expenditure
302
Selected performance indicators
Annual performance Indicators
2004/5 2005/6 2006/7 Current 2008/9 2009/10 2010/11
Number of registered employers 285 668 295 651 323 368 335 887 369 76 424 897 509 876
Percentage change in revenue collected (R billion) (3.7)
14% (4.3)
(2%) (4.2)
2% (4.3)
7% (4.6)
6% (4.9)
4% (5.1)
Number of claims registered 222 923 238 030 213 246 224 000 224 000 224 000 224 000
Turnaround time in days from receipt of final claim documentation
– – – 90 85 80 75
Expenditure estimates
Table 15.11 Compensation Fund, including Reserve Fund Estimated
Audited outcome outcome Medium-term estimate
R thousand 2004/05 2005/06 2006/07 2007/08 2008/09 2009/10 2010/11
Revenue
Social Contributions 2 376 851 2 740 841 3 077 284 3 030 474 3 240 809 3 435 257 3 641 372
Non-tax revenue 1 376 923 1 283 671 1 413 459 1 287 146 1 353 962 1 433 736 1 519 761
Sale of goods and services other than capital assets
– 9 292 14 772 – – – –
of which:
Admin fees – 9 292 14 772 – – – –
Other non-tax revenue 1 376 923 1 274 379 1 398 687 1 287 146 1 353 962 1 433 736 1 519 761
Total revenue 3 753 774 4 024 512 4 490 743 4 317 620 4 594 772 4 868 993 5 161 133
Expenses
Current expense 350 140 506 720 794 869 433 249 501 120 502 825 527 261
Compensation of employees 95 772 113 996 122 123 166 656 201 577 213 673 226 494
Goods and services 248 159 389 566 671 362 265 079 297 863 287 372 298 880
Depreciation 6 209 3 158 1 384 1 514 1 680 1 781 1 887
Transfers and subsidies 2 961 043 3 102 976 2 887 622 2 338 775 2 671 113 2 831 381 3 001 263
Total expenses 3 311 183 3 609 696 3 682 491 2 772 024 3 172 233 3 334 206 3 528 524
Surplus / (Deficit) 442 591 414 816 808 252 1 545 596 1 422 538 1 534 788 1 632 609
Acquisition of assets 5 507 26 252 919 – – – –
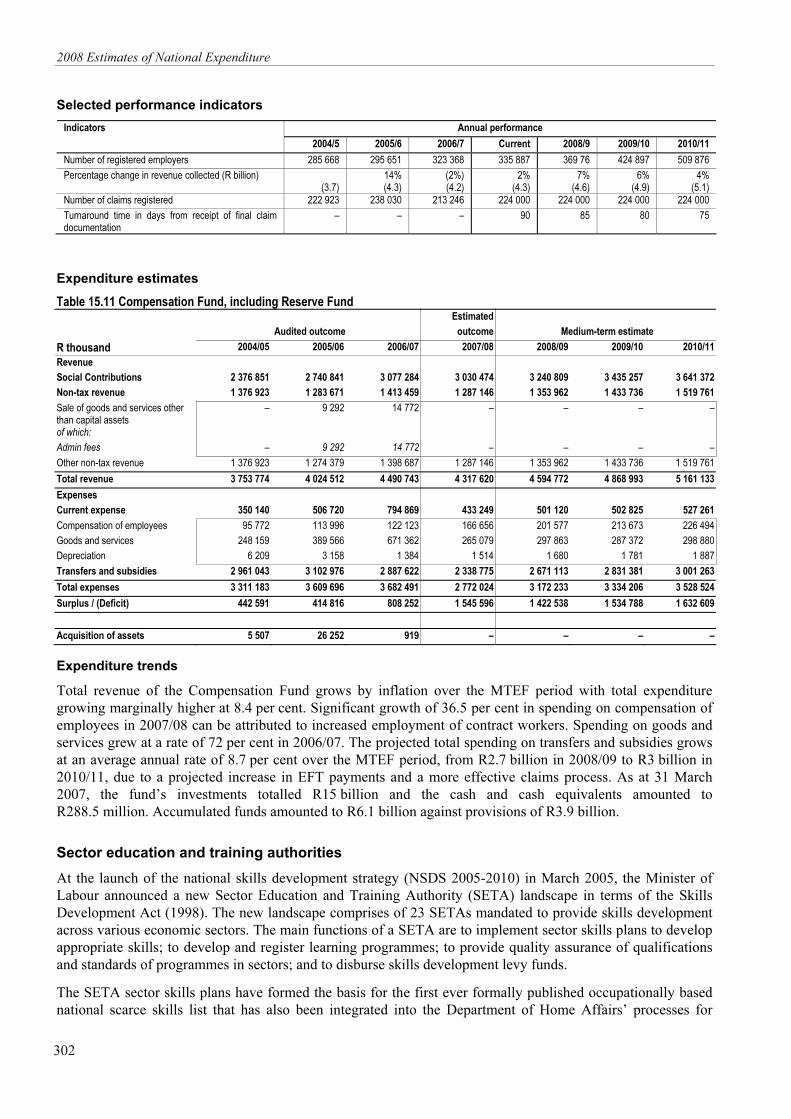
Expenditure trends
Total revenue of the Compensation Fund grows by inflation over the MTEF period with total expenditure
growing marginally higher at 8.4 per cent. Significant growth of 36.5 per cent in spending on compensation of
employees in 2007/08 can be attributed to increased employment of contract workers. Spending on goods and
services grew at a rate of 72 per cent in 2006/07. The projected total spending on transfers and subsidies grows
at an average annual rate of 8.7 per cent over the MTEF period, from R2.7 billion in 2008/09 to R3 billion in
2010/11, due to a projected increase in EFT payments and a more effective claims process. As at 31 March
2007, the fund’s investments totalled R15 billion and the cash and cash equivalents amounted to
R288.5 million. Accumulated funds amounted to R6.1 billion against provisions of R3.9 billion.
Sector education and training authorities
At the launch of the national skills development strategy (NSDS 2005-2010) in March 2005, the Minister of
Labour announced a new Sector Education and Training Authority (SETA) landscape in terms of the Skills
Development Act (1998). The new landscape comprises of 23 SETAs mandated to provide skills development
across various economic sectors. The main functions of a SETA are to implement sector skills plans to develop
appropriate skills; to develop and register learning programmes; to provide quality assurance of qualifications
and standards of programmes in sectors; and to disburse skills development levy funds.
The SETA sector skills plans have formed the basis for the first ever formally published occupationally based
national scarce skills list that has also been integrated into the Department of Home Affairs’ processes for
Vote15: Labour
303
scarce skills immigration work permits. SETA sector skills plans have been automatically uploaded through an
integrated data collection process into the employment services system to allow for a more efficient and
accurate development of the annual national scarce skills list.
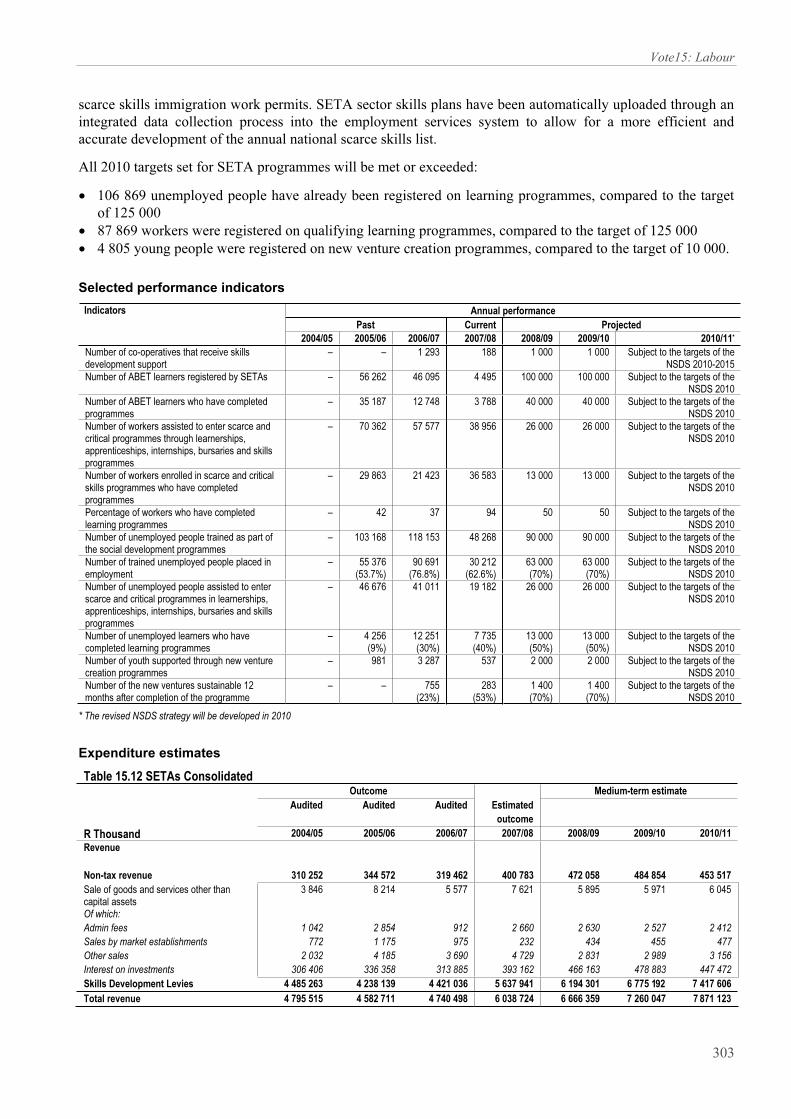
All 2010 targets set for SETA programmes will be met or exceeded:
• 106 869 unemployed people have already been registered on learning programmes, compared to the target
of 125 000
• 87 869 workers were registered on qualifying learning programmes, compared to the target of 125 000
• 4 805 young people were registered on new venture creation programmes, compared to the target of 10 000.
Selected performance indicators
Annual performance
Past Current Projected
Indicators
2004/05 2005/06 2006/07 2007/08 2008/09 2009/10 2010/11*
Number of co-operatives that receive skills
development support
– – 1 293 188
1 000 1 000 Subject to the targets of the
NSDS 2010-2015
Number of ABET learners registered by SETAs – 56 262 46 095 4 495 100 000 100 000 Subject to the targets of the
NSDS 2010
Number of ABET learners who have completed
programmes
– 35 187 12 748 3 788 40 000 40 000 Subject to the targets of the
NSDS 2010
Number of workers assisted to enter scarce and
critical programmes through learnerships,
apprenticeships, internships, bursaries and skills
programmes
– 70 362 57 577 38 956
26 000 26 000 Subject to the targets of the
NSDS 2010
Number of workers enrolled in scarce and critical
skills programmes who have completed
programmes
– 29 863 21 423 36 583 13 000 13 000 Subject to the targets of the
NSDS 2010
Percentage of workers who have completed
learning programmes
– 42
37
94
50
50
Subject to the targets of the
NSDS 2010
Number of unemployed people trained as part of
the social development programmes
– 103 168 118 153 48 268 90 000 90 000 Subject to the targets of the
NSDS 2010
Number of trained unemployed people placed in
employment
– 55 376
(53.7%)
90 691
(76.8%)
30 212
(62.6%)
63 000
(70%)
63 000
(70%)
Subject to the targets of the
NSDS 2010
Number of unemployed people assisted to enter
scarce and critical programmes in learnerships,
apprenticeships, internships, bursaries and skills
programmes
– 46 676
41 011
19 182
26 000 26 000 Subject to the targets of the
NSDS 2010
Number of unemployed learners who have
completed learning programmes
– 4 256
(9%)
12 251
(30%)
7 735
(40%)
13 000
(50%)
13 000
(50%)
Subject to the targets of the
NSDS 2010
Number of youth supported through new venture
creation programmes
– 981 3 287
537 2 000 2 000 Subject to the targets of the
NSDS 2010
Number of the new ventures sustainable 12
months after completion of the programme
– – 755
(23%)
283
(53%)
1 400
(70%)
1 400
(70%)
Subject to the targets of the
NSDS 2010
* The revised NSDS strategy will be developed in 2010
Expenditure estimates
Table 15.12 SETAs Consolidated
Outcome Medium-term estimate
Audited Audited Audited Estimated
outcome
R Thousand 2004/05 2005/06 2006/07 2007/08 2008/09 2009/10 2010/11
Revenue
Non-tax revenue 310 252 344 572 319 462 400 783 472 058 484 854 453 517
Sale of goods and services other than
capital assets
3 846 8 214 5 577 7 621 5 895 5 971 6 045
Of which:
Admin fees 1 042 2 854 912 2 660 2 630 2 527 2 412
Sales by market establishments 772 1 175 975 232 434 455 477
Other sales 2 032 4 185 3 690 4 729 2 831 2 989 3 156
Interest on investments 306 406 336 358 313 885 393 162 466 163 478 883 447 472
Skills Development Levies 4 485 263 4 238 139 4 421 036 5 637 941 6 194 301 6 775 192 7 417 606
Total revenue 4 795 515 4 582 711 4 740 498 6 038 724 6 666 359 7 260 047 7 871 123
2008 Estimates of National Expenditure
304
Table 15.12 SETAs Consolidated (continued)
Outcome Medium-term estimate
Audited Audited Audited Estimated
outcome
R thousand 2004/05 2005/06 2006/07 2007/08 2008/09 2009/10 2010/11
Expenses
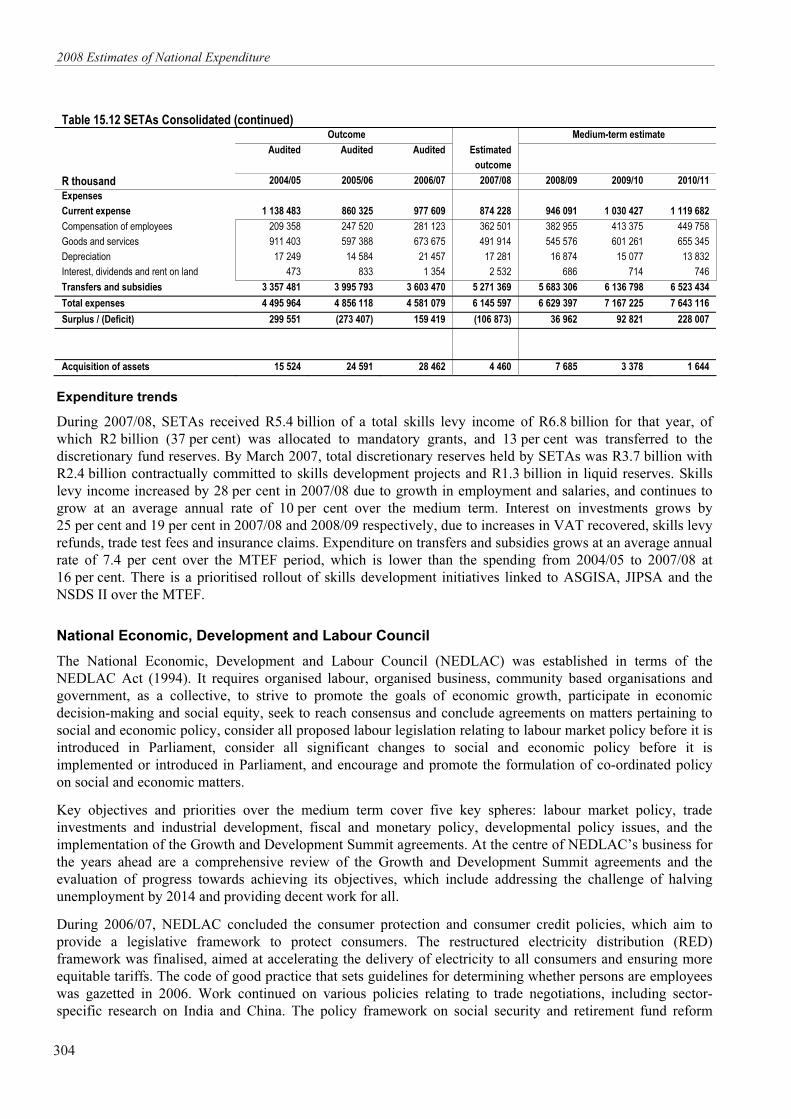
Current expense 1 138 483 860 325 977 609 874 228 946 091 1 030 427 1 119 682
Compensation of employees 209 358 247 520 281 123 362 501 382 955 413 375 449 758
Goods and services 911 403 597 388 673 675 491 914 545 576 601 261 655 345
Depreciation 17 249 14 584 21 457 17 281 16 874 15 077 13 832
Interest, dividends and rent on land 473 833 1 354 2 532 686 714 746
Transfers and subsidies 3 357 481 3 995 793 3 603 470 5 271 369 5 683 306 6 136 798 6 523 434
Total expenses 4 495 964 4 856 118 4 581 079 6 145 597 6 629 397 7 167 225 7 643 116
Surplus / (Deficit) 299 551 (273 407) 159 419 (106 873) 36 962 92 821 228 007
Acquisition of assets 15 524 24 591 28 462 4 460 7 685 3 378 1 644
Expenditure trends
During 2007/08, SETAs received R5.4 billion of a total skills levy income of R6.8 billion for that year, of
which R2 billion (37 per cent) was allocated to mandatory grants, and 13 per cent was transferred to the
discretionary fund reserves. By March 2007, total discretionary reserves held by SETAs was R3.7 billion with
R2.4 billion contractually committed to skills development projects and R1.3 billion in liquid reserves. Skills
levy income increased by 28 per cent in 2007/08 due to growth in employment and salaries, and continues to
grow at an average annual rate of 10 per cent over the medium term. Interest on investments grows by
25 per cent and 19 per cent in 2007/08 and 2008/09 respectively, due to increases in VAT recovered, skills levy
refunds, trade test fees and insurance claims. Expenditure on transfers and subsidies grows at an average annual
rate of 7.4 per cent over the MTEF period, which is lower than the spending from 2004/05 to 2007/08 at
16 per cent. There is a prioritised rollout of skills development initiatives linked to ASGISA, JIPSA and the
NSDS II over the MTEF.
National Economic, Development and Labour Council
The National Economic, Development and Labour Council (NEDLAC) was established in terms of the
NEDLAC Act (1994). It requires organised labour, organised business, community based organisations and
government, as a collective, to strive to promote the goals of economic growth, participate in economic
decision-making and social equity, seek to reach consensus and conclude agreements on matters pertaining to
social and economic policy, consider all proposed labour legislation relating to labour market policy before it is
introduced in Parliament, consider all significant changes to social and economic policy before it is
implemented or introduced in Parliament, and encourage and promote the formulation of co-ordinated policy
on social and economic matters.
Key objectives and priorities over the medium term cover five key spheres: labour market policy, trade
investments and industrial development, fiscal and monetary policy, developmental policy issues, and the
implementation of the Growth and Development Summit agreements. At the centre of NEDLAC’s business for
the years ahead are a comprehensive review of the Growth and Development Summit agreements and the
evaluation of progress towards achieving its objectives, which include addressing the challenge of halving
unemployment by 2014 and providing decent work for all.
During 2006/07, NEDLAC concluded the consumer protection and consumer credit policies, which aim to
provide a legislative framework to protect consumers. The restructured electricity distribution (RED)
framework was finalised, aimed at accelerating the delivery of electricity to all consumers and ensuring more
equitable tariffs. The code of good practice that sets guidelines for determining whether persons are employees
was gazetted in 2006. Work continued on various policies relating to trade negotiations, including sector-
specific research on India and China. The policy framework on social security and retirement fund reform
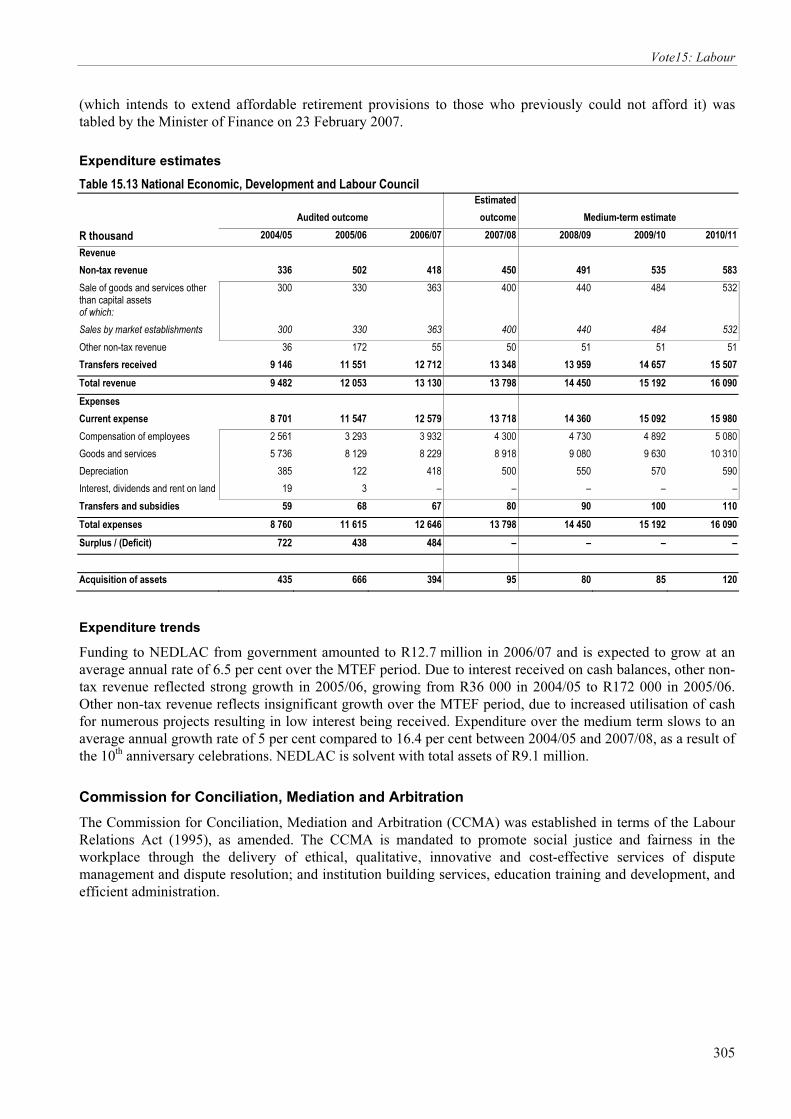
Vote15: Labour
305
(which intends to extend affordable retirement provisions to those who previously could not afford it) was
tabled by the Minister of Finance on 23 February 2007.
Expenditure estimates
Table 15.13 National Economic, Development and Labour Council Estimated
Audited outcome outcome Medium-term estimate
R thousand 2004/05 2005/06 2006/07 2007/08 2008/09 2009/10 2010/11
Revenue
Non-tax revenue 336 502 418 450 491 535 583
Sale of goods and services other than capital assets
300 330 363 400 440 484 532
of which:
Sales by market establishments 300 330 363 400 440 484 532
Other non-tax revenue 36 172 55 50 51 51 51
Transfers received 9 146 11 551 12 712 13 348 13 959 14 657 15 507
Total revenue 9 482 12 053 13 130 13 798 14 450 15 192 16 090
Expenses
Current expense 8 701 11 547 12 579 13 718 14 360 15 092 15 980
Compensation of employees 2 561 3 293 3 932 4 300 4 730 4 892 5 080
Goods and services 5 736 8 129 8 229 8 918 9 080 9 630 10 310
Depreciation 385 122 418 500 550 570 590
Interest, dividends and rent on land 19 3 – – – – –
Transfers and subsidies 59 68 67 80 90 100 110
Total expenses 8 760 11 615 12 646 13 798 14 450 15 192 16 090
Surplus / (Deficit) 722 438 484 – – – –
Acquisition of assets 435 666 394 95 80 85 120
Expenditure trends
Funding to NEDLAC from government amounted to R12.7 million in 2006/07 and is expected to grow at an
average annual rate of 6.5 per cent over the MTEF period. Due to interest received on cash balances, other non-
tax revenue reflected strong growth in 2005/06, growing from R36 000 in 2004/05 to R172 000 in 2005/06.
Other non-tax revenue reflects insignificant growth over the MTEF period, due to increased utilisation of cash
for numerous projects resulting in low interest being received. Expenditure over the medium term slows to an
average annual growth rate of 5 per cent compared to 16.4 per cent between 2004/05 and 2007/08, as a result of
the 10th anniversary celebrations. NEDLAC is solvent with total assets of R9.1 million.
Commission for Conciliation, Mediation and Arbitration
The Commission for Conciliation, Mediation and Arbitration (CCMA) was established in terms of the Labour
Relations Act (1995), as amended. The CCMA is mandated to promote social justice and fairness in the
workplace through the delivery of ethical, qualitative, innovative and cost-effective services of dispute
management and dispute resolution; and institution building services, education training and development, and
efficient administration.
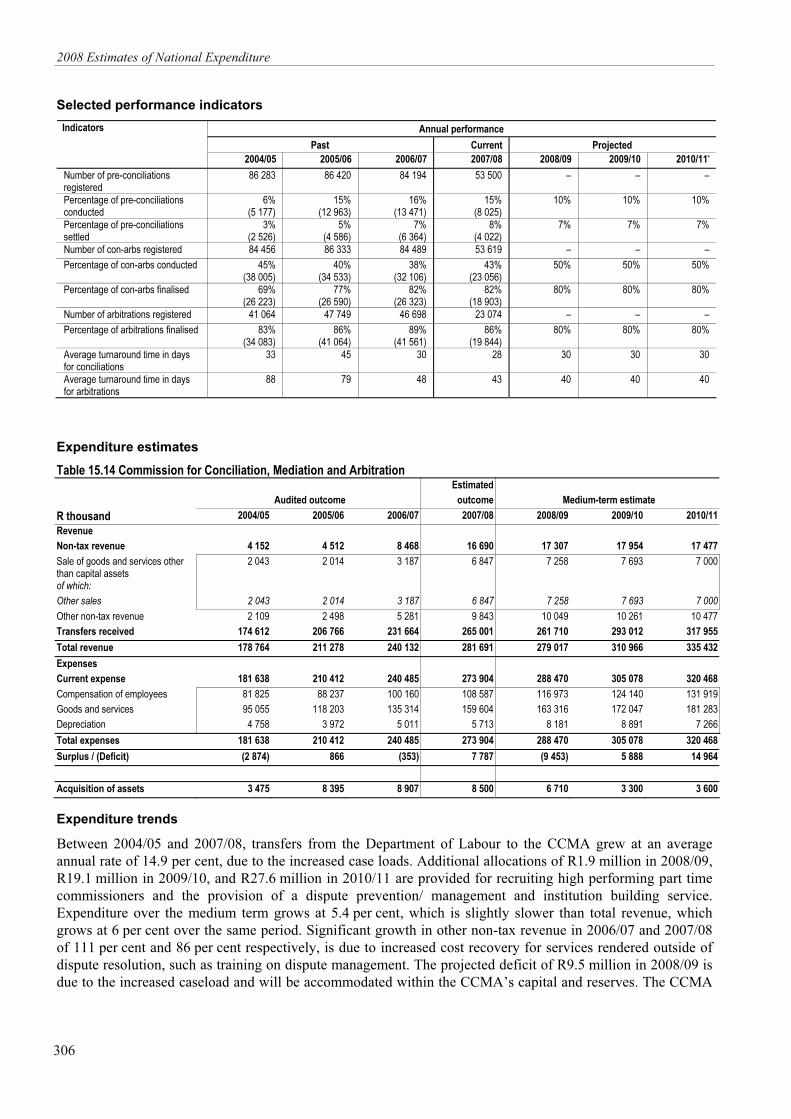
2008 Estimates of National Expenditure
306
Selected performance indicators
Annual performance
Past Current Projected
Indicators
2004/05 2005/06 2006/07 2007/08 2008/09 2009/10 2010/11*
Number of pre-conciliations registered
86 283 86 420 84 194 53 500 – – –
Percentage of pre-conciliations conducted
6% (5 177)
15% (12 963)
16% (13 471)
15% (8 025)
10%
10%
10%
Percentage of pre-conciliations settled
3% (2 526)
5% (4 586)
7% (6 364)
8% (4 022)
7%
7%
7%
Number of con-arbs registered 84 456 86 333 84 489 53 619 – – –
Percentage of con-arbs conducted 45% (38 005)
40% (34 533)
38% (32 106)
43% (23 056)
50%
50%
50%
Percentage of con-arbs finalised 69% (26 223)
77% (26 590)
82% (26 323)
82% (18 903)
80%
80%
80%
Number of arbitrations registered 41 064 47 749 46 698 23 074 – – –
Percentage of arbitrations finalised 83% (34 083)
86% (41 064)
89% (41 561)
86% (19 844)
80%
80%
80%
Average turnaround time in days for conciliations
33 45 30 28 30 30 30
Average turnaround time in days for arbitrations
88 79 48 43 40 40 40
Expenditure estimates
Table 15.14 Commission for Conciliation, Mediation and Arbitration Estimated
Audited outcome outcome Medium-term estimate
R thousand 2004/05 2005/06 2006/07 2007/08 2008/09 2009/10 2010/11
Revenue
Non-tax revenue 4 152 4 512 8 468 16 690 17 307 17 954 17 477
Sale of goods and services other than capital assets
2 043 2 014 3 187 6 847 7 258 7 693 7 000
of which:
Other sales 2 043 2 014 3 187 6 847 7 258 7 693 7 000
Other non-tax revenue 2 109 2 498 5 281 9 843 10 049 10 261 10 477
Transfers received 174 612 206 766 231 664 265 001 261 710 293 012 317 955
Total revenue 178 764 211 278 240 132 281 691 279 017 310 966 335 432
Expenses
Current expense 181 638 210 412 240 485 273 904 288 470 305 078 320 468
Compensation of employees 81 825 88 237 100 160 108 587 116 973 124 140 131 919
Goods and services 95 055 118 203 135 314 159 604 163 316 172 047 181 283
Depreciation 4 758 3 972 5 011 5 713 8 181 8 891 7 266
Total expenses 181 638 210 412 240 485 273 904 288 470 305 078 320 468
Surplus / (Deficit) (2 874) 866 (353) 7 787 (9 453) 5 888 14 964
Acquisition of assets 3 475 8 395 8 907 8 500 6 710 3 300 3 600
Expenditure trends
Between 2004/05 and 2007/08, transfers from the Department of Labour to the CCMA grew at an average
annual rate of 14.9 per cent, due to the increased case loads. Additional allocations of R1.9 million in 2008/09,
R19.1 million in 2009/10, and R27.6 million in 2010/11 are provided for recruiting high performing part time
commissioners and the provision of a dispute prevention/ management and institution building service.
Expenditure over the medium term grows at 5.4 per cent, which is slightly slower than total revenue, which
grows at 6 per cent over the same period. Significant growth in other non-tax revenue in 2006/07 and 2007/08
of 111 per cent and 86 per cent respectively, is due to increased cost recovery for services rendered outside of
dispute resolution, such as training on dispute management. The projected deficit of R9.5 million in 2008/09 is
due to the increased caseload and will be accommodated within the CCMA’s capital and reserves. The CCMA
Vote15: Labour
307
has taken a policy position to have cash on hand at all times to meet two months’ worth of obligations, which
translates to R45 million.
Umsobomvu Youth Fund
Umsobomvu Youth Fund (UYF) was established in 2001 and mandated to facilitate and promote the creation of
jobs and skills development and transfer among young South Africans between the age of 18 and 35. The UYF
was funded through proceeds from the Demutualisation Levy Act (1998). The UYF fulfils its mandate by
making strategic investments that facilitate opportunities for young people to acquire skills, to access job
opportunities or pursue meaningful self-employment opportunities through various initiatives. The fund
received seed money of R855 million in 2001 and a further allocation of R400 million in 2007/08. The UYF
was part of a review of development financing institutions and will be undergoing a mandate alignment based
on the findings.
The organisation’s priorities are informed by the Accelerated and Shared Growth Initiative for South Africa
(ASGISA), the national skills development strategy (NSDS) and the anticipated national youth policy. The
UYF has contributed to achieving these national policy objectives by:
• Improving access to employment opportunities through the provision of career development information
and counselling, job preparation and development, and linking young people to employment opportunities
facilitated through a range of delivery channels that include youth advisory centres (including mobile
centres), the South African youth card and magazine, Youthconnect (a UYF operated call centre), and the
internet portal.
Since its inception, over 1.1 million young people have accessed UYF services through the YAC
programme. 121 youth advisory centres (YACs) established to date, including two UYF- full service
operated YACs (in Tshwane and Nelspruit). Five YAC mobiles services communities where UYF has no
current presence.
UYF’s youth portal has recorded over 10 million hits since inception. The UYF call centre (Youthconnect)
recorded 27 000 calls in 2007/08, bringing the total number of calls since inception to 233 948. The South
African youth card increased its membership by 58 425 during 2007/08, bringing the total number of
members to 131 937 since the start of the programme.
• Expanding support for entrepreneurial activity and self-employment through the delivery of
entrepreneurship information and training, business development consultancy and advisory services, access
to market opportunities/employment and enterprise finance.
5 480 business development vouchers were issued in 2007/08 to the value of R36 million, resulting in the
creation of 2 256 new businesses and 5 795 jobs. 119 voucher clients accessed loans to the value of
R57.1 million and 23 clients accessed tenders worth over R15 million. Since the inception of the voucher
programme, over 29 000 vouchers have been issued to youth and women, who have in turn accessed loans
exceeding R200 million and tenders worth over R100 million.
Since the inception of the business opportunity support services (BOSS) programme, over
1 500 entrepreneurs have been linked to business opportunities worth over R250 million. The job
opportunity seeker (JOBS) programme, aimed at linking unemployed graduates to jobs, has registered over
8 000 CVs, sourced 2 949 employment opportunities and dispatched 2 819 CVs to employers in 2007/08,
and 531 young people registered on the JOBS database have also accessed skills training and job
preparedness workshops.
The SME programme has exceeded its target for 2007/08, approving loans in excess of R98 million. The
micro-finance programme has issued over 8 000 loans valued at over R19 million, resulting in the creation
and or sustainability of over 7 000 jobs.
• Facilitating targeted skills development programmes focusing on graduate development and providing
young people with access to training in scarce skills required by the priority sectors identified in ASGISA.
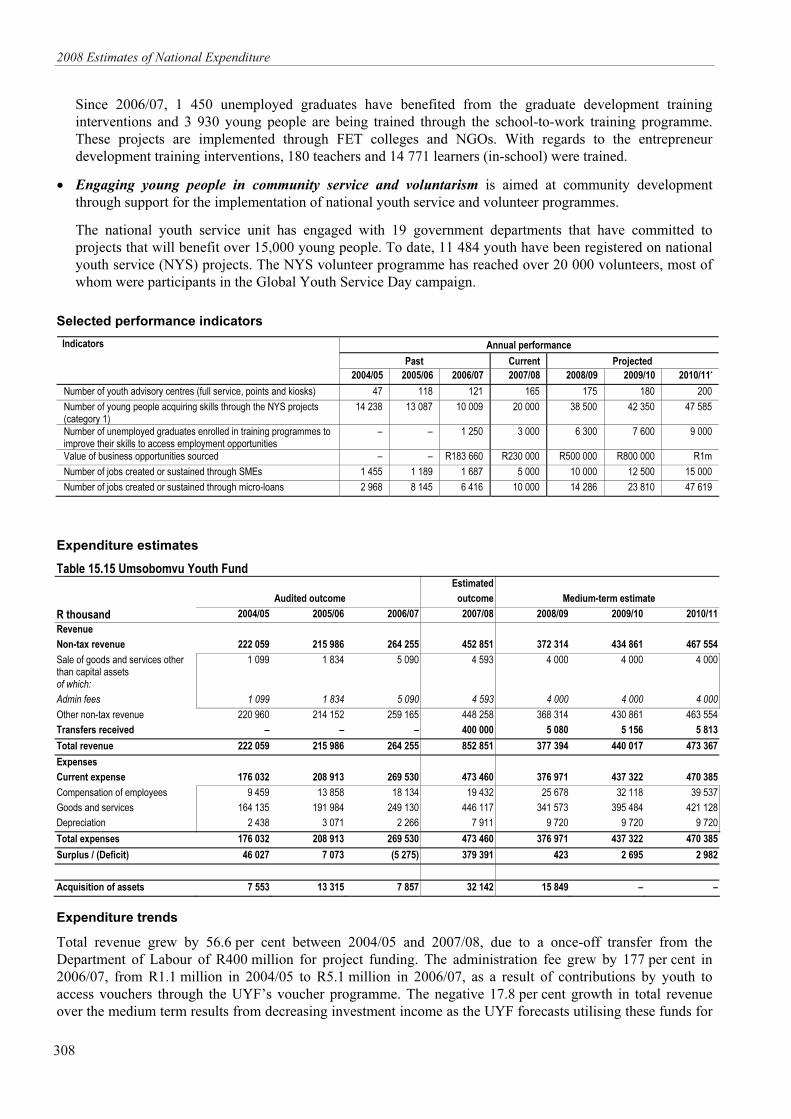
2008 Estimates of National Expenditure
308
Since 2006/07, 1 450 unemployed graduates have benefited from the graduate development training
interventions and 3 930 young people are being trained through the school-to-work training programme.
These projects are implemented through FET colleges and NGOs. With regards to the entrepreneur
development training interventions, 180 teachers and 14 771 learners (in-school) were trained.
• Engaging young people in community service and voluntarism is aimed at community development
through support for the implementation of national youth service and volunteer programmes.
The national youth service unit has engaged with 19 government departments that have committed to
projects that will benefit over 15,000 young people. To date, 11 484 youth have been registered on national
youth service (NYS) projects. The NYS volunteer programme has reached over 20 000 volunteers, most of
whom were participants in the Global Youth Service Day campaign.
Selected performance indicators
Annual performance
Past Current Projected
Indicators
2004/05 2005/06 2006/07 2007/08 2008/09 2009/10 2010/11*
Number of youth advisory centres (full service, points and kiosks) 47 118 121 165 175 180 200
Number of young people acquiring skills through the NYS projects (category 1)
14 238 13 087 10 009 20 000 38 500 42 350 47 585
Number of unemployed graduates enrolled in training programmes to improve their skills to access employment opportunities
– – 1 250 3 000 6 300 7 600 9 000
Value of business opportunities sourced – – R183 660 R230 000 R500 000 R800 000 R1m
Number of jobs created or sustained through SMEs 1 455 1 189 1 687 5 000 10 000 12 500 15 000
Number of jobs created or sustained through micro-loans 2 968 8 145 6 416 10 000 14 286 23 810 47 619
Expenditure estimates
Table 15.15 Umsobomvu Youth Fund Estimated
Audited outcome outcome Medium-term estimate
R thousand 2004/05 2005/06 2006/07 2007/08 2008/09 2009/10 2010/11
Revenue
Non-tax revenue 222 059 215 986 264 255 452 851 372 314 434 861 467 554
Sale of goods and services other than capital assets
1 099 1 834 5 090 4 593 4 000 4 000 4 000
of which:
Admin fees 1 099 1 834 5 090 4 593 4 000 4 000 4 000
Other non-tax revenue 220 960 214 152 259 165 448 258 368 314 430 861 463 554
Transfers received – – – 400 000 5 080 5 156 5 813
Total revenue 222 059 215 986 264 255 852 851 377 394 440 017 473 367
Expenses
Current expense 176 032 208 913 269 530 473 460 376 971 437 322 470 385
Compensation of employees 9 459 13 858 18 134 19 432 25 678 32 118 39 537
Goods and services 164 135 191 984 249 130 446 117 341 573 395 484 421 128
Depreciation 2 438 3 071 2 266 7 911 9 720 9 720 9 720
Total expenses 176 032 208 913 269 530 473 460 376 971 437 322 470 385
Surplus / (Deficit) 46 027 7 073 (5 275) 379 391 423 2 695 2 982
Acquisition of assets 7 553 13 315 7 857 32 142 15 849 – –
Expenditure trends
Total revenue grew by 56.6 per cent between 2004/05 and 2007/08, due to a once-off transfer from the
Department of Labour of R400 million for project funding. The administration fee grew by 177 per cent in
2006/07, from R1.1 million in 2004/05 to R5.1 million in 2006/07, as a result of contributions by youth to
access vouchers through the UYF’s voucher programme. The negative 17.8 per cent growth in total revenue
over the medium term results from decreasing investment income as the UYF forecasts utilising these funds for
Vote15: Labour
309
projects. Spending on compensation of employees grows strongly over the seven year period, due to increased
capacity at access points in all provinces in an effort to make loans and other products and services more
accessible to the youth. Additional funding totalling R16.1 million over the MTEF period has been allocated
towards compensation of employees. The 79 per cent growth in goods and services in 2007/08 relates to the
once-off costs incurred in establishing youth advisory centres.
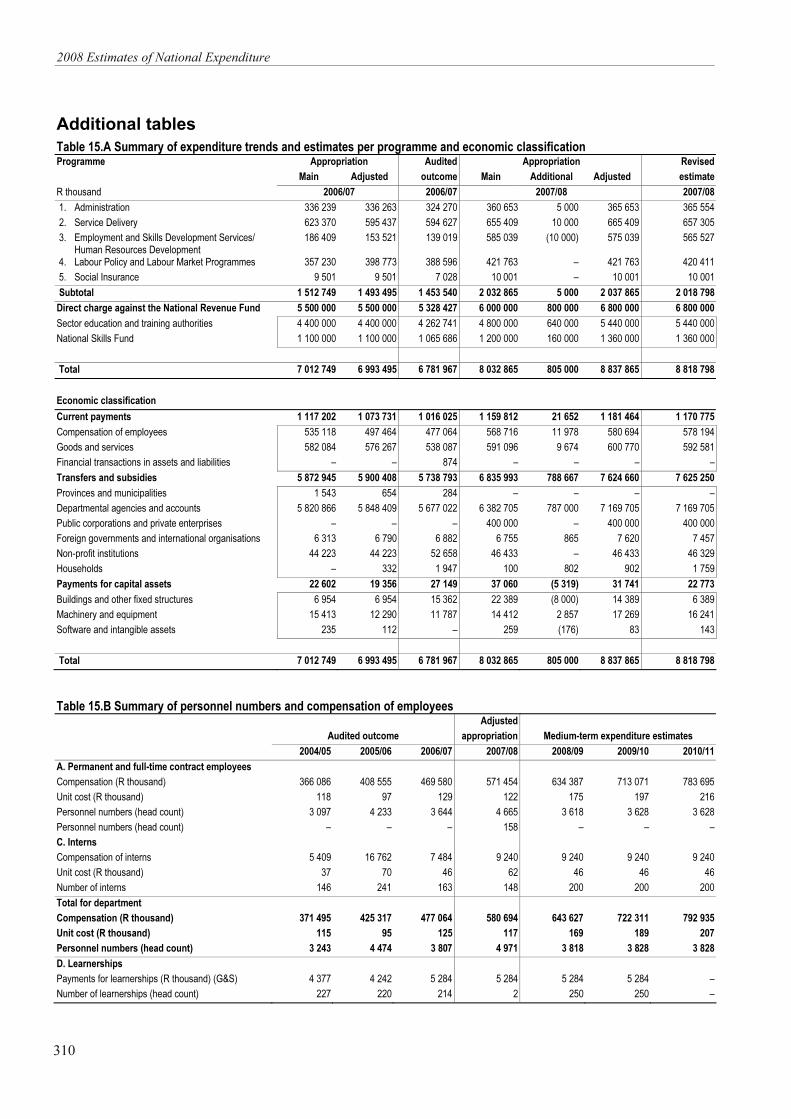
2008 Estimates of National Expenditure
310
Additional tables
Table 15.A Summary of expenditure trends and estimates per programme and economic classification Programme Appropriation Audited Appropriation Revised
Main Adjusted outcome Main Additional Adjusted estimate
R thousand 2006/07 2006/07 2007/08 2007/08
1. Administration 336 239 336 263 324 270 360 653 5 000 365 653 365 554
2. Service Delivery 623 370 595 437 594 627 655 409 10 000 665 409 657 305
3. Employment and Skills Development Services/ Human Resources Development
186 409 153 521 139 019 585 039 (10 000) 575 039 565 527
4. Labour Policy and Labour Market Programmes 357 230 398 773 388 596 421 763 – 421 763 420 411
5. Social Insurance 9 501 9 501 7 028 10 001 – 10 001 10 001
Subtotal 1 512 749 1 493 495 1 453 540 2 032 865 5 000 2 037 865 2 018 798
Direct charge against the National Revenue Fund 5 500 000 5 500 000 5 328 427 6 000 000 800 000 6 800 000 6 800 000
Sector education and training authorities 4 400 000 4 400 000 4 262 741 4 800 000 640 000 5 440 000 5 440 000
National Skills Fund 1 100 000 1 100 000 1 065 686 1 200 000 160 000 1 360 000 1 360 000
Total 7 012 749 6 993 495 6 781 967 8 032 865 805 000 8 837 865 8 818 798
Economic classification
Current payments 1 117 202 1 073 731 1 016 025 1 159 812 21 652 1 181 464 1 170 775
Compensation of employees 535 118 497 464 477 064 568 716 11 978 580 694 578 194
Goods and services 582 084 576 267 538 087 591 096 9 674 600 770 592 581
Financial transactions in assets and liabilities – – 874 – – – –
Transfers and subsidies 5 872 945 5 900 408 5 738 793 6 835 993 788 667 7 624 660 7 625 250
Provinces and municipalities 1 543 654 284 – – – –
Departmental agencies and accounts 5 820 866 5 848 409 5 677 022 6 382 705 787 000 7 169 705 7 169 705
Public corporations and private enterprises – – – 400 000 – 400 000 400 000
Foreign governments and international organisations 6 313 6 790 6 882 6 755 865 7 620 7 457
Non-profit institutions 44 223 44 223 52 658 46 433 – 46 433 46 329
Households – 332 1 947 100 802 902 1 759
Payments for capital assets 22 602 19 356 27 149 37 060 (5 319) 31 741 22 773
Buildings and other fixed structures 6 954 6 954 15 362 22 389 (8 000) 14 389 6 389
Machinery and equipment 15 413 12 290 11 787 14 412 2 857 17 269 16 241
Software and intangible assets 235 112 – 259 (176) 83 143
Total 7 012 749 6 993 495 6 781 967 8 032 865 805 000 8 837 865 8 818 798
Table 15.B Summary of personnel numbers and compensation of employees
Adjusted
Audited outcome appropriation Medium-term expenditure estimates
2004/05 2005/06 2006/07 2007/08 2008/09 2009/10 2010/11
A. Permanent and full-time contract employees
Compensation (R thousand) 366 086 408 555 469 580 571 454 634 387 713 071 783 695
Unit cost (R thousand) 118 97 129 122 175 197 216
Personnel numbers (head count) 3 097 4 233 3 644 4 665 3 618 3 628 3 628
Personnel numbers (head count) – – – 158 – – –
C. Interns
Compensation of interns 5 409 16 762 7 484 9 240 9 240 9 240 9 240
Unit cost (R thousand) 37 70 46 62 46 46 46
Number of interns 146 241 163 148 200 200 200
Total for department
Compensation (R thousand) 371 495 425 317 477 064 580 694 643 627 722 311 792 935
Unit cost (R thousand) 115 95 125 117 169 189 207
Personnel numbers (head count) 3 243 4 474 3 807 4 971 3 818 3 828 3 828
D. Learnerships
Payments for learnerships (R thousand) (G&S) 4 377 4 242 5 284 5 284 5 284 5 284 –
Number of learnerships (head count) 227 220 214 2 250 250 –

Vote15: Labour
311
Table 15.C Summary of expenditure on training
Adjusted
Audited outcome appropriation Medium-term expenditure estimates
2004/05 2005/06 2006/07 2007/08 2008/09 2009/10 2010/11
Compensation of employees (R thousand) 371 495 425 317 477 064 580 694 643 627 722 311 792 935
Training expenditure (R thousand) 8 379 6 273 10 171 8 473 8 895 9 339 10 272
Training as percentage of compensation 2% 1% 2% 1% 1% 1% 1%
Total number trained in department (head count) 3 097 4 235 3 260 3 260
of which:
Employees receiving bursaries (head count) 29 31 56 146
Learnerships trained (head count) 227 220 214 250
Internships trained (head count) 146 241 162 313
Table 15.D Summary of expenditure on infrastructure Description Service delivery outputs Adjusted
Audited outcome appropriation Medium-term expenditure estimate
R thousand 2004/05 2005/06 2006/07 2007/08 2008/09 2009/10 2010/11
Groups of small projects or programmes (cost less than R50 million)
Various centres - new construction
– – 323 509 16 764 11 885 –
Capital works Durban – – 9 690 6 632 – – –
Maintenance on infrastructure
Repair and maintenance 29 157 37 173 59 246 53 155 41 225 31 476 305
Total 29 157 37 173 69 259 60 296 57 989 43 361 305
Table 15.E Summary of departmental public-private partnership projects Project description: Siemens business services - IT agreement Project unitary Budgeted
Fee at time of expenditure Medium-term expenditure estimate
R thousand contract 2007/08 2008/09 2009/10 2010/11
Projects signed in terms of Treasury Regulation 16 40 833 68 176 69 868 76 507 83 623
PPP unitary charge 40 833 68 176 69 868 76 507 83 623
Total 40 833 68 176 69 868 76 507 83 623
Disclosure notes for projects signed in terms of Treasury Regulation 16
Project name Public private partnership agreement between the Department of Labour and Siemens Business Services for the provision of IT services
Brief description The IT PPP agreement is regarded by the department as a way of achieving its objectives against the background of the requirements of the specialised knowledge and expertise needed to develop and manage a modern IT service.
Date PPP agreement was signed 30 November 2002
Duration of PPP agreement 10 years
Escalation index for unitary fee Annual increases by CPIX as well as increases based on the number of computer users
Net Present Value of all payment obligations discounted at appropriate duration government bond yield
Net present value calculated at R117 987 322 utilising the government bond yield of 8.55%
Variations/amendments to PPP agreement The PPP agreement makes provision for a change management process that deals with changes to the agreement and the unitary fee. If required, material variations will be dealt with in terms of the relevant treasury regulations.
Cost implications of variations/amendments The change management notes that have an impact on the unitary fee are listed under item 2 of remarks by the office of the CIO.
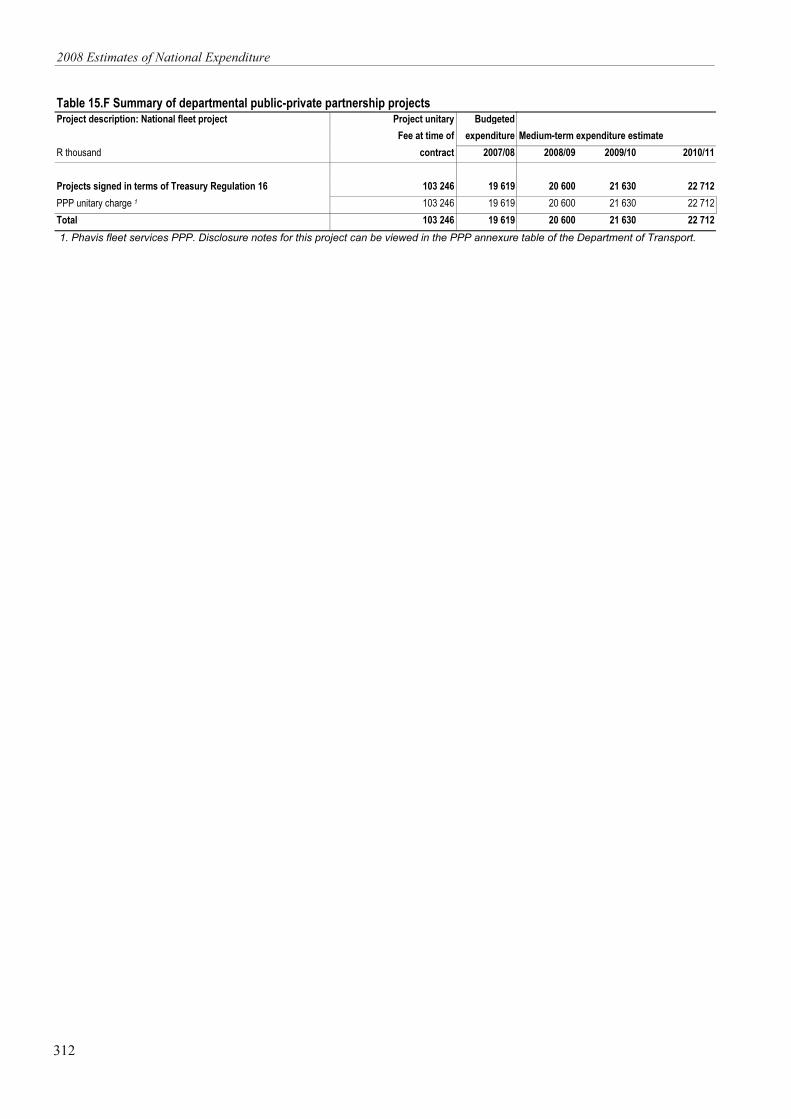
2008 Estimates of National Expenditure
312
Table 15.F Summary of departmental public-private partnership projects Project description: National fleet project Project unitary Budgeted
Fee at time of expenditure Medium-term expenditure estimate
R thousand contract 2007/08 2008/09 2009/10 2010/11
Projects signed in terms of Treasury Regulation 16 103 246 19 619 20 600 21 630 22 712
PPP unitary charge 1 103 246 19 619 20 600 21 630 22 712
Total 103 246 19 619 20 600 21 630 22 712
1. Phavis fleet services PPP. Disclosure notes for this project can be viewed in the PPP annexure table of the Department of Transport.