3.5 star, 90-125 sites, mhc -...
TRANSCRIPT

3.5 Star, 90-125 Sites, MHC
Orlando - Lakeland, FL RegionOffering #156116613
Presented by
James CookDirect: 386-623-4623 Email: [email protected]
485 Brickell Ave. • Suite 2308 • Miami, FL 33131
Very High Demand 55+ Water Front MHC
Long Term Family Owned and Operated Community
Strong Resale Values and No Park Owned Homes
20% of Sites Feature Newer Double Wide Units, Most Accommodate DW’s
Very Well Maintained with a lot of Goodwill

Transaction Overview
Purchase Overview
Purchase Price $4,350,000
Total Acquisition Cost $4,350,000
Mortgage $3,045,000
Down Payment / Investment $1,305,000
% Of Asking Price % of Cost Interest Rate Term Amort. (yrs.)
Payment
(Monthly – Yr. 1.)
Down Payment: $1,305,000 30% 30% 4.15% 10 30
Total Loan Balance: $3,045,000 70% 70% 4.15% 10 30 $10,531
Property Type Mobile Home Community
No. Of Units (97) - 94 MH & 1 Cottage & 2 Apt.
Price Per Unit $44,845
Income Per Unit $4,668
Expenses Per Unit (1,899)
Acreage 11.75
Single/Double Wide Ratio (%) 40% DW
Age of Units 60’s – 90’s
Utilities: Amenities
Water : Well Clubhouse/Rec. Facility
Sewer : WWTPBoat Slips & Launch
Trash : Curbside
-By Owner Shuffleboard Courts
Discussion / Notes
Subject is a waterfront senior MHC in Central FL, with easy access to fishing, shopping, and the theme parks, residents are kept very busy.
It features wide roads, beautiful landscaping, boat launches, docks, shuffleboard, a clubhouse, and two seasonal rental cottages.
Utilities are provided by well and WWTP which is on a 10 year renewal and is the model system for the region.
Home values range from $5k for the oldest to $45k for the newest, and they average only one abandon home from an estate or resident every couple years.
This is one of the most stable, clean, senior parks we have seen above a 5.5% cap in 2o16 and will make a great passive investment for the right new owner. It has been operated for over 30 years by the same family and with a recent passing they are getting more interested in displacement.
Financial Measurements
Property Overview
Loan Information – Quoted By: Chris San Jose – Head of Lending
Package Assumptions
This information has been secured from sources we believe to be reliable, but we make no representations or warranties, expressed or implied, as to the accuracy of the information. References to square footage or age are approximate. Buyer must verify the information and bears all risk for any inaccuracies. The information, calculations and data presented in this report are believed to be accurate but are not guaranteed. The information contained in this report shall not be considered as a substitution for legal, accounting or other professional advice. Please seek proper legal and tax advice as appropriate before making investments.
Income Growth Rate 5% - Year 2 | 4% Years 3 & 4 | 3% Year 5
*Year 2 Rent Increase is established and takes place in March, 2017
Expense Growth Rate 2% Per Year
Capitalization Rate (Resale) 6.14%
Acquisition Financing 1 Year Interest Only
Year 1 Year 3 Year 5
Effective Gross Income $448,308 $488,149 $522,034
Less: Operating Expenses -$184,167 -$198,890 -$206,925
N.O.I. $264,142 $289,259 $315,108
Annual Debt Service -$126,368 -$175,827 -$175,827
Cash Flow Before Taxes $137,774 $113,432 $139,281
Debt Coverage Ratio 2.09 1.65 1.79
Loan-to-Value Ratio 69.97% 60.94% 53.72%
Cap. Rate (Cost) 6.07% 6.65% 7.24%
Cap. Rate (Resale) 6.07% 6.07% 6.07%
Operating Expense Ratio 41.08% 40.74% 39.64%
Cash on Cash (B / Taxes) 10.56% 8.47% 10.39%
I.R.R. (B/ Taxes) 4.01% 18.06% 19.19%
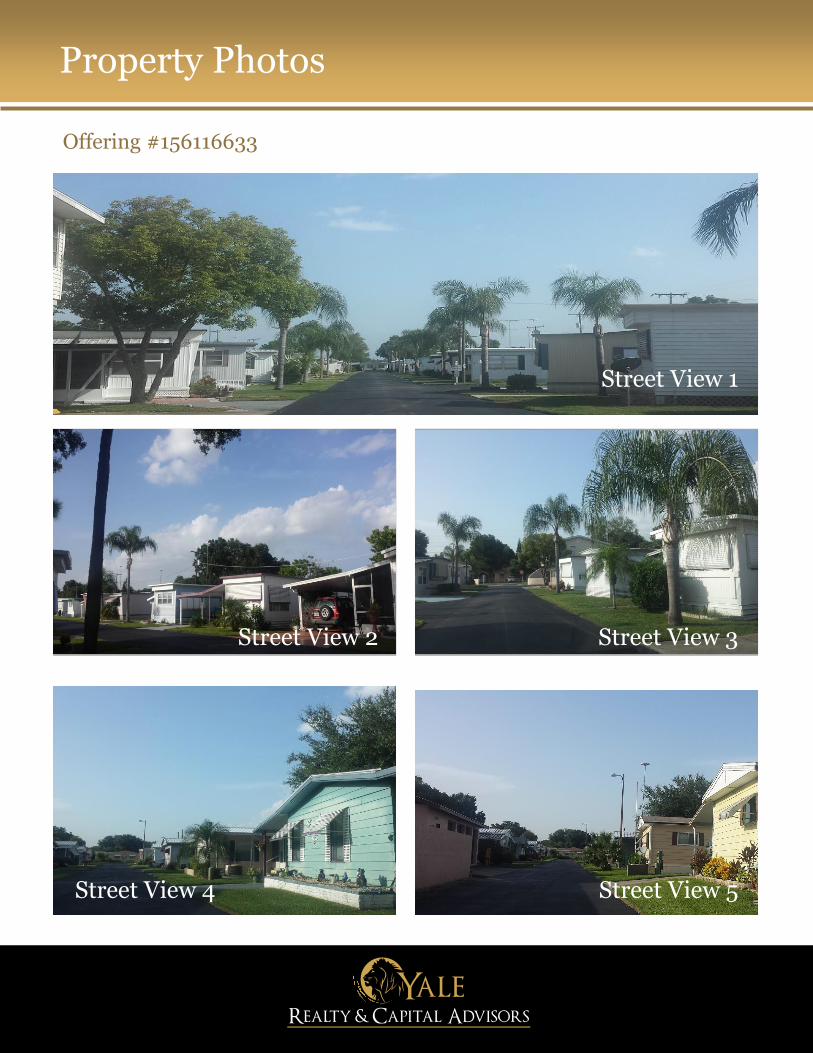
Property Photos
Offering #156116633
Street View 1
Street View 5Street View 4
Street View 2
Street View 1
Street View 3
Street View 4 Street View 5

Cash Flow Analysis
Rental Activity Analysis Year 1 Year 2 Year 3 Year 4 Year 5
Potential Rental Income $438,500 $460,035 $478,171 $497,028 $511,800
Other Income 14,337 14,623 14,916 15,214 15,519
Less: Vacancy & Credit Losses - - - - -
Less: Rent Concessions & Bad Debts (4,528) (4,751) (4,938) (5,133) (5,285)
Effective Gross Income$448,308 $469,908 $488,149 $507,109 $522,034
Less: Operating Expenses (184,167) (194,990) (198,890) (202,868) (206,925)
Net Operating Income (NOI) $264,142 $274,918 $289,259 $304,241 $315,108
Less: Annual Debt Service (126,368) (175,827) (175,827) (175,827) (175,827)
CASH FLOW Before Taxes $ 137,774 $ 99,090 $ 113,432 $ 128,414 $ 139,281
Property Resale Analysis
Projected Sales Price $4,351,590 $4,529,119 $4,765,389 $5,012,212 $5,191,244
Less: Selling Expenses (87,032) (90,582) (95,308) (100,244) (103,825)
Adjusted Projected Sales Price $4,264,559 $4,438,537 $4,670,081 $4,911,967 $5,087,419
Less: Mortgage(s) Balance Payoff (3,045,000) (2,958,108) (2,904,022) (2,847,647) (2,788,888)
SALE PROCEEDS Before Taxes $1,219,559 $1,480,429 $1,766,060 $2,064,320 $2,298,531
Cash Position
Cash Generated in Current Year $137,774 $99,090 $113,432 $128,414 $139,281
Cash Generated in Previous Years n/a 137,774 236,864 350,296 478,710
Cash Generated from Property Sale 1,219,559 1,480,429 1,766,060 2,064,320 2,298,531
Cash Inflow (Outflow) from Refinancing - (35,000) (35,000) (35,000) (35,000)
Original Initial Investment (1,305,000) (1,305,000) (1,305,000) (1,305,000) (1,305,000)
Total Potential CASH Generated $52,333 $377,293 $776,356 $1,203,031 $1,576,523
Financial Measurements
Debt Coverage Ratio (DCR) 2.09 1.56 1.65 1.73 1.79
Loan-to-Value Ratio (LVR) 70.0% 65.3% 60.9% 56.8% 53.7%
Capitalization Rate Based on Cost 6.07% 6.32% 6.65% 6.99% 7.24%
Capitalization Rate Based on Resale Price 6.07% 6.07% 6.07% 6.07% 6.07%
Break-Even Ratio 69.58% 79.12% 77.00% 74.93% 73.59%
Operating Expense Ratio 41.08% 41.50% 40.74% 40.00% 39.64%
Net Present Value (NPV) - Before Taxes 10.00% (71,061) 96,711 285,306 456,107 559,838
Cash-on-Cash Return with Equity 4.01% 26.65% 26.96% 24.16% 18.09%
Cash-on-Cash Return - Before Taxes 10.56% 7.39% 8.47% 9.58% 10.39%
Internal Rate-of-Return (IRR) - Before Taxes 4.01% 14.20% 18.06% 19.42% 19.19%
Modified Internal Rate-of-Return (MIRR) - Before Taxes 4.01% 13.54% 16.84% 17.74% 17.17%

Annual Property Operating Data
Year 1 Per Unit % Year 2 Per Unit % Year 3 Per Unit % Year 4 Per Unit % Year 5 Per Unit %
Potential Rental Income $438,500 4,520.62 97.81% $460,035 4,742.63 97.90% $478,171 4,929.60 97.96% $497,028 5,124.00 98.01% $511,800 5,276.29 98.04%
Less: Rent Concessions & Bad Debts (4,528) -46.68 -1.01% (4,751) -48.98 -1.01% (4,938) -50.91 -1.01% (5,133) -52.91 -1.01% (5,285) -54.49 -1.01%
Other Income 14,337 147.80 3.20% 14,623 150.76 3.11% 14,916 153.77 3.06% 15,214 156.85 3.00% 15,519 159.99 2.97%
Effective Gross Income $448,308 4,621.74 100.00% $469,908 4,844.41 100.00% $488,149 5,032.47 100.00% $507,109 5,227.93 100.00% $522,034 5,381.79 100.00%
Operating Expenses
Park Relations 1,500 15.46 0.33% 1,530 15.77 0.33% 1,561 16.09 0.32% 1,592 16.41 0.31% 1,624 16.74 0.31%
Cleaning Services 128 1.32 0.03% 131 1.35 0.03% 133 1.37 0.03% 136 1.40 0.03% 139 1.43 0.03%
Equipment Rental 1,313 13.54 0.29% 1,340 13.81 0.29% 1,366 14.09 0.28% 1,394 14.37 0.27% 1,422 14.66 0.27%
Gas & Oil 1,000 10.31 0.22% 1,020 10.52 0.22% 1,040 10.73 0.21% 1,061 10.94 0.21% 1,082 11.16 0.21%
Garbage Disposal 2,274 23.44 0.51% 2,319 23.91 0.49% 2,366 24.39 0.48% 2,413 24.88 0.48% 2,461 25.38 0.47%
Insurance 8,500 87.63 1.90% 8,670 89.38 1.85% 8,843 91.17 1.81% 9,020 92.99 1.78% 9,201 94.85 1.76%
Gross Wages 30,000 309.28 6.69% 30,600 315.46 6.51% 31,212 321.77 6.39% 31,836 328.21 6.28% 32,473 334.77 6.22%
Licenses & Taxes & Permits 43,737 450.90 9.76% 44,612 459.91 9.49% 45,504 469.11 9.32% 46,414 478.50 9.15% 47,342 488.07 9.07%
Legal 1,500 15.46 0.33% 1,530 15.77 0.33% 1,561 16.09 0.32% 1,592 16.41 0.31% 1,624 16.74 0.31%
Miscellaneous 26 0.26 0.01% 26 0.27 0.01% 27 0.27 0.01% 27 0.28 0.01% 28 0.29 0.01%
Accounting Fees 1,500 15.46 0.33% 1,530 15.77 0.33% 1,561 16.09 0.32% 1,592 16.41 0.31% 1,624 16.74 0.31%
Advertising 2,065 21.29 0.46% 2,106 21.71 0.45% 2,148 22.15 0.44% 2,191 22.59 0.43% 2,235 23.04 0.43%
Bank Charges 632 6.52 0.14% 645 6.65 0.14% 658 6.78 0.13% 671 6.92 0.13% 684 7.05 0.13%
Dues & Subscriptions 1,000 10.31 0.22% 1,020 10.52 0.22% 1,040 10.73 0.21% 1,061 10.94 0.21% 1,082 11.16 0.21%
Postage 395 4.07 0.09% 403 4.15 0.09% 411 4.23 0.08% 419 4.32 0.08% 427 4.41 0.08%
Office Supplies 5,142 53.01 1.15% 5,245 54.07 1.12% 5,350 55.16 1.10% 5,457 56.26 1.08% 5,566 57.38 1.07%
Telephone / Fax 2,500 25.77 0.56% 2,550 26.29 0.54% 2,601 26.81 0.53% 2,653 27.35 0.52% 2,706 27.90 0.52%
Travel 1,000 10.31 0.22% 1,020 10.52 0.22% 1,040 10.73 0.21% 1,061 10.94 0.21% 1,082 11.16 0.21%
Office Expenses 1,396 14.39 0.31% 1,424 14.68 0.30% 1,453 14.98 0.30% 1,482 15.28 0.29% 1,511 15.58 0.29%
R&M - Truck 2,500 25.77 0.56% 2,550 26.29 0.54% 2,601 26.81 0.53% 2,653 27.35 0.52% 2,706 27.90 0.52%
R&M - Park 2,549 26.28 0.57% 2,600 26.80 0.55% 2,652 27.34 0.54% 2,705 27.89 0.53% 2,759 28.44 0.53%
R&M - Other 6,435 66.34 1.44% 6,563 67.66 1.40% 6,694 69.01 1.37% 6,828 70.40 1.35% 6,965 71.80 1.33%
R&M - Wastewater 1,999 20.61 0.45% 2,039 21.02 0.43% 2,080 21.45 0.43% 2,122 21.87 0.42% 2,164 22.31 0.41%
R&M - Water 13,917 143.47 3.10% 14,195 146.34 3.02% 14,479 149.27 2.97% 14,768 152.25 2.91% 15,064 155.30 2.89%
Shop Supplies 4,759 49.06 1.06% 4,854 50.04 1.03% 4,951 51.04 1.01% 5,050 52.06 1.00% 5,151 53.10 0.99%
Utilities - Elec. & Other 11,232 115.80 2.51% 11,457 118.11 2.44% 11,686 120.47 2.39% 11,920 122.88 2.35% 12,158 125.34 2.33%
Yard Maint. & B. Check 7,168 73.90 1.60% 7,312 75.38 1.56% 7,458 76.88 1.53% 7,607 78.42 1.50% 7,759 79.99 1.49%
Management Fees (Off-Site) 19,000 195.88 4.24% 19,380 199.79 4.12% 19,768 203.79 4.05% 20,163 207.87 3.98% 20,566 212.02 3.94%
Reserves For Replacement 9,000 92.78 2.01% 9,180 94.64 1.95% 9,364 96.53 1.92% 9,551 98.46 1.88% 9,742 100.43 1.87%
R.E. Tax Liability 7,000 72.16 1.56% 7,140 73.61 1.52% 7,283 75.08 1.49% 7,428 76.58 1.46% 7,577 78.11 1.45%
One-Time Expenses (7,000) -72.16 -1.56% - 0.00 0.00% - 0.00 0.00% - 0.00 0.00% - 0.00 0.00%
Total Operating Expenses $184,167 1,898.63 41.08% $194,990 2,010.21 41.50% $198,890 2,050.41 40.74% $202,868 2,091.42 40.00% $206,925 2,133.25 39.64%
Net Operating Income (NOI) $264,142 2,723.11 58.92% $274,918 2,834.20 58.50% $289,259 2,982.05 59.26% $304,241 3,136.51 60.00% $315,108 3,248.54 60.36%
Less: Annual Debt Service (126,368) -1,302.76 -28.19% (175,827) -1,812.65 -37.42% (175,827) -1,812.65 -36.02% (175,827) -1,812.65 -34.67% (175,827) -1,812.65 -33.68%
Cash Flow Before Taxes $137,774 1,420.35 30.73% $99,090 1,021.55 21.09% $113,432 1,169.40 23.24% $128,414 1,323.86 25.32% $139,281 1,435.89 26.68%
