3.2 socioeconomic characteristics and neighborhoods
TRANSCRIPT
Preliminary Engineering / Environmental Impact StatementNorthwest Corridor LRT Line to Irving and DFW Airport
Draft Environmental Impact Statement 3 - 16Chapter 3 Affected Environment
3.2 SOCIOECONOMIC CHARACTERISTICS AND NEIGHBORHOODSIn this section of the report, the Irving/DFW Corridor (also referred to as the Project Corridor) isdefined as a geographic area one-half mile wide on either side of the proposed light rail linealignment. For the light rail stations, a one-half mile radius around each station footprint wasdefined as part of the Project Corridor.
The socio-economic profile was developed from several data sources: United States CensusBureau (1990 and 2000), North Central Texas Council of Governments, City of Irving, City ofDallas, and other local sources of information. This section describes characteristics of thepopulation and economy that are important to transportation planning. This includes characteristicsof employment in the region and the Project Corridor, development and growth trends, populationdistribution patterns, demographic profile of existing population, and population projections for thefuture. Neighborhoods within the Project Corridor are also identified.
3.2.1 Population Dynamics and Demographic ProfilesThis section describes the population distribution patterns and trends within the region, DallasCounty, the City of Irving, the City of Dallas, and the Project Corridor. It also provides ademographic profile of the populations residing in these areas.
Region, County and Corridor Cities Population DynamicsAccording to the 2000 U.S. Census, the Dallas/Fort Worth Metroplex is one of the ten mostpopulated metropolitan areas in the United States and is the most populated metropolitan region inTexas. It ranked number nine in total population in the United States in 2000 and had experiencedthe highest population growth rate among the top ten urban areas during the previous decade. Thegrowth rate was 29.3 percent between 1990 and 2000. This growth rate is more than twice thenational rate of 13 percent for the same time period. In 1990, the Dallas/Fort Worth area had over4 million residents. By 2000, that number had grown to over 5.2 million. This growth accounted fornearly one third of the total population growth in the State of Texas for that time period.
Within the Metroplex, Dallas County experienced the highest population increase. It grew duringthe 1990’s by 366,089 residents from 1,852,810 to 2,218,899. It had the second largest populationincrease in the State. Among Metroplex cities, the City of Dallas led in total absolute growth duringthat same period. Dallas experienced an 18 percent growth rate adding 181,703 residents bringingthe 2000 population total to 1,188,580. Dallas was the 8th largest city in the United States in theYear 2000. Irving also experienced high growth during this time period. The City was among thetop five cities in the region for population growth from 1990 to 2000. Irving grew by 23.6 percentadding 36,578 to a total 2000 population of 191,615 residents.
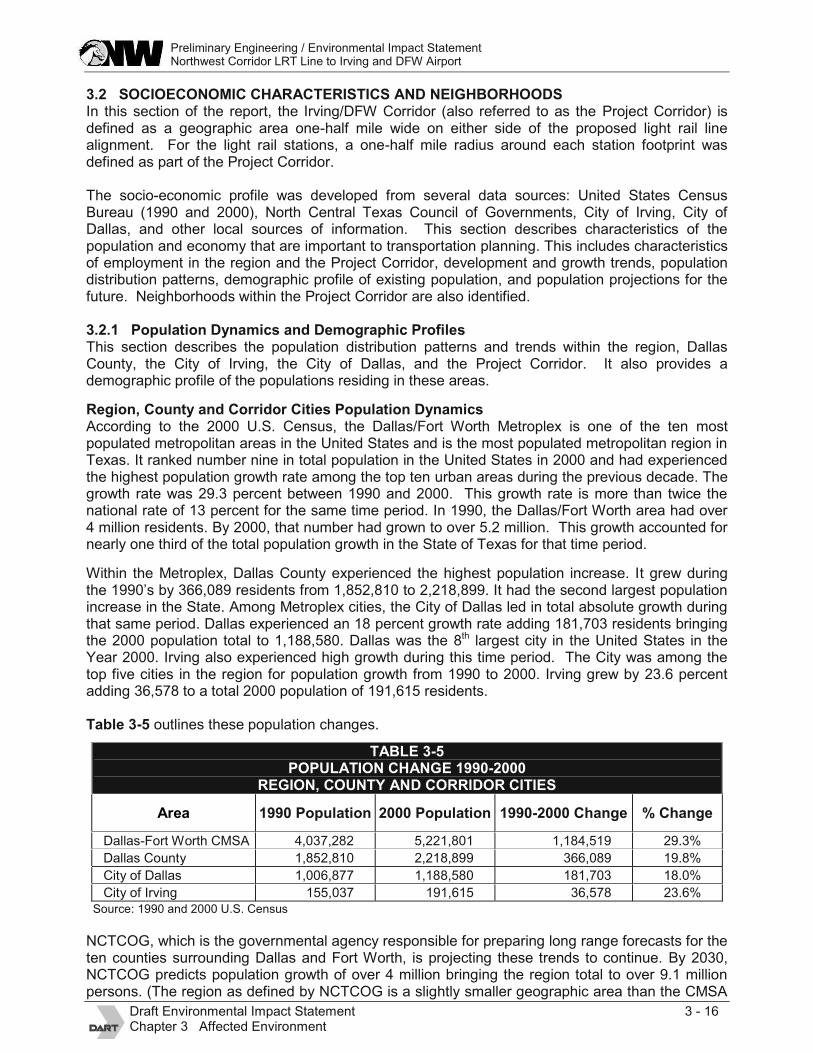
Table 3-5 outlines these population changes.
Source: 1990 and 2000 U.S. Census
NCTCOG, which is the governmental agency responsible for preparing long range forecasts for theten counties surrounding Dallas and Fort Worth, is projecting these trends to continue. By 2030,NCTCOG predicts population growth of over 4 million bringing the region total to over 9.1 millionpersons. (The region as defined by NCTCOG is a slightly smaller geographic area than the CMSA
TABLE 3-5POPULATION CHANGE 1990-2000
REGION, COUNTY AND CORRIDOR CITIES
Area 1990 Population 2000 Population 1990-2000 Change % Change
Dallas-Fort Worth CMSA 4,037,282 5,221,801 1,184,519 29.3%
Dallas County 1,852,810 2,218,899 366,089 19.8%
City of Dallas 1,006,877 1,188,580 181,703 18.0%
City of Irving 155,037 191,615 36,578 23.6%

Preliminary Engineering / Environmental Impact StatementNorthwest Corridor LRT Line to Irving and DFW Airport
Draft Environmental Impact Statement 3 - 17Chapter 3 Affected Environment
as defined by the U. S. Census Bureau.) Dallas County is predicted to grow by over 26 percentduring this timeframe, from just over 2.2 million residents to over 2.8 million. The corridor cities,Dallas and Irving, are also projecting double digit increases – 16.8 percent and 14.8 percentrespectively. Dallas’ 2030 population is estimated to be 1,404,847; Irving’s is projected to be 225,714. Table 3-6 below outlines the Census Bureau’s 2000 population and NCTCOG’s 2030population projections for these areas.
TABLE 3-6DEMOGRAPHIC FORECAST
REGION, COUNTY AND CORRIDOR CITIESArea 2000 Population 2030 Population Projected Growth % Growth
Region1
5,067,400 9,107,900 4,040,500 79.7%
Dallas County 2,232,476 2,817,191 584,715 26.2%
City of Dallas 1,202,592 1,404,847 202,255 16.8%
City of Irving 196,632 225,714 29,082 14.8%1
Ten County Region forecast by NCTCOG - a slightly smaller geographic area than the U.S. Census Bureau’sDallas-Fort Worth CMSA.
Source: 2000 U.S. Census; NCTCOG, 2005
Irving/DFW Corridor Population DynamicsTable 3-7 below provides NCTCOG population projections for the Las Colinas community and theProject Corridor. In 2000, 25,066 persons resided in Las Colinas and 66 percent of thoseresidents lived in the Project Corridor (16,473 persons). The Las Colinas area is projected to growby 52.4 percent between 2000 and 2030 to total of 38,203. The Project Corridor is also projected togrow, although the rate increase is projected to be less than Las Colinas as a whole. Thepopulation of the corridor in 2030 is predicated to be 21,850.
TABLE 3-7DEMOGRAPHIC FORECAST
LAS COLINAS AND IRVING/DFW CORRIDORArea 2000 Population 2030 Population Projected Growth % Growth
Las Colinas 25,066 38,203 13,137 52.4%
Irving/DFW Corridor 16,473 21,850 5,377 32.6%
Source: 2000 U.S. Census, NCTCOG, Lopez Garcia Group
For transportation planning purposes, it is important to identify where population growth isoccurring within the Project Corridor. To analyze demographic trends and patterns in theIrving/DFW Corridor, a Geographic Information Systems analysis was conducted to determine thecensus tracts located in the corridor and the percentage of their land area located in the corridor.Table 3-8 below lists the census tracts located in the Irving/DFW Corridor and the land areapercentages.
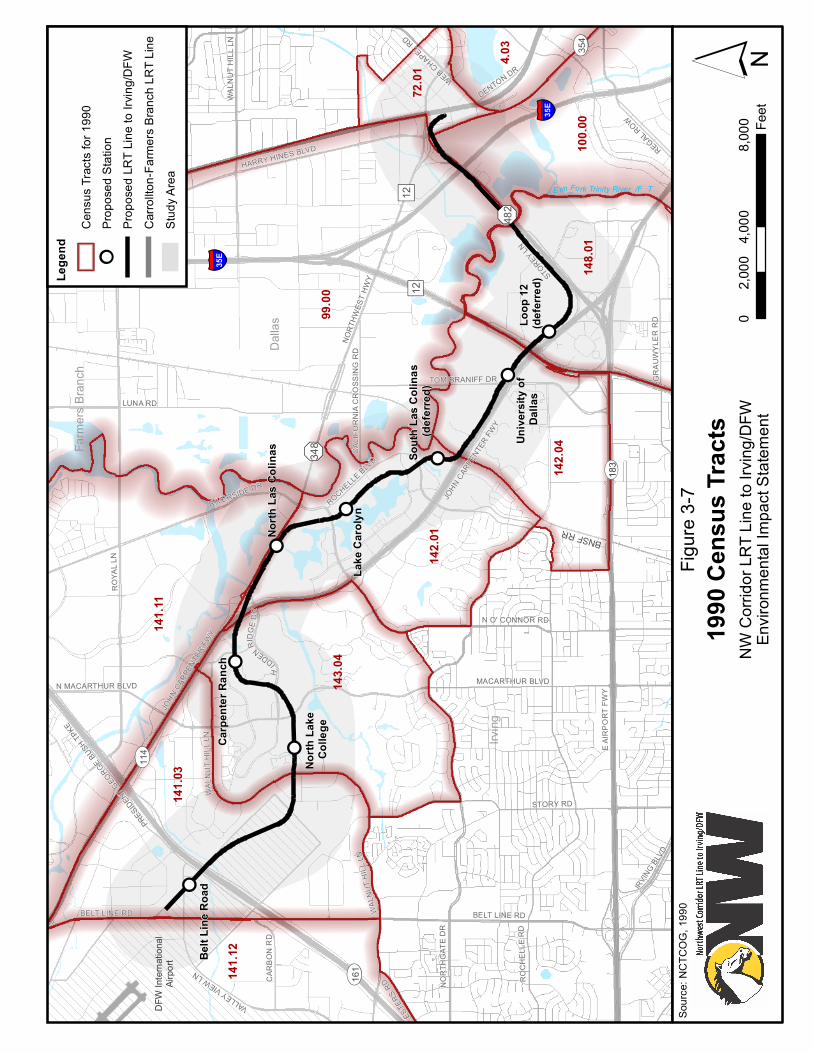
It should be noted that Census Tract boundaries and numbers have changed for some areas of thecorridor between 1990 and 2000. Figures 3-7 and 3-8 show Census Tract boundaries for 1990and 2000. Specific changes are noted in the footnotes in the tables. There are eleven tracts in thecorridor using 2000 census tract boundaries. Table 3-9 below examines the population changefrom 1990 to 2000 by census tract providing an overview of demographic trends and patternswithin the Irving/DFW Corridor.
There is a wide range of population changes among Census Tracts within the corridor - three tractslost residents from 1990 to 2000 while three tracts experienced growth rates in the triple digits.
Preliminary Engineering / Environmental Impact StatementNorthwest Corridor LRT Line to Irving and DFW Airport
Draft Environmental Impact Statement 3 - 18Chapter 3 Affected Environment
Eight of the eleven census tracts within the corridor gained population from 1990 to 2000. Overall,the corridor tracts experienced a 65 percent population increase during the 1990’s.
Two of the areas that lost population are Census Tracts 99 and 141.12. Approximately 20 percentof Tract 99 lies within the corridor and the land use in this area is primarily industrial andwarehouse uses. Tract 141.12 is the most western portion of the Project Corridor that lies on DFWAirport property. There was a reduction in residential uses in this area when the airport expandedits eastside runway. The third tract that lost residents (142.02) is located in an older residentialsection of Irving. The population change was less than 1 percent.
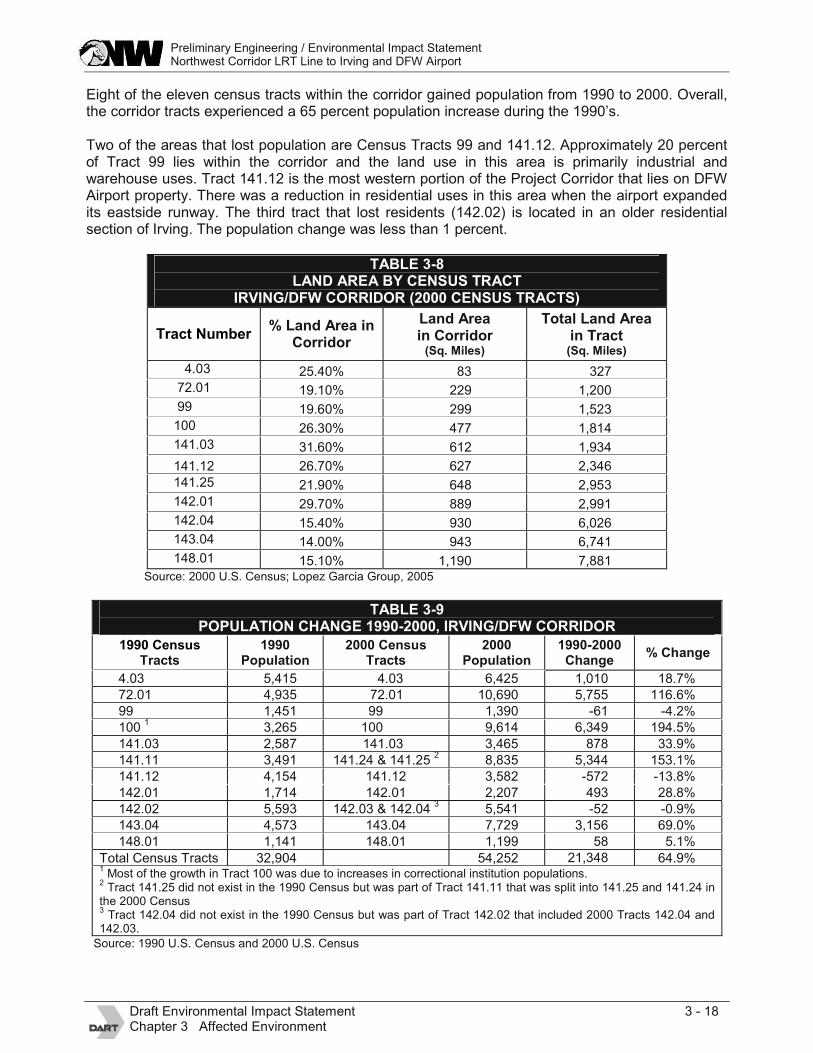
TABLE 3-8LAND AREA BY CENSUS TRACT
IRVING/DFW CORRIDOR (2000 CENSUS TRACTS)
Tract Number % Land Area inCorridor
Land Areain Corridor
(Sq. Miles)
Total Land Areain Tract
(Sq. Miles)4.03 25.40% 83 327
72.01 19.10% 229 1,20099 19.60% 299 1,523100 26.30% 477 1,814141.03 31.60% 612 1,934
141.12 26.70% 627 2,346141.25 21.90% 648 2,953142.01 29.70% 889 2,991142.04 15.40% 930 6,026143.04 14.00% 943 6,741148.01 15.10% 1,190 7,881
Source: 2000 U.S. Census; Lopez Garcia Group, 2005
TABLE 3-9POPULATION CHANGE 1990-2000, IRVING/DFW CORRIDOR
1990 CensusTracts
1990Population
2000 CensusTracts
2000Population
1990-2000Change % Change
4.03 5,415 4.03 6,425 1,010 18.7%72.01 4,935 72.01 10,690 5,755 116.6%99 1,451 99 1,390 -61 -4.2%100
13,265 100 9,614 6,349 194.5%
141.03 2,587 141.03 3,465 878 33.9%141.11 3,491 141.24 & 141.25
28,835 5,344 153.1%
141.12 4,154 141.12 3,582 -572 -13.8%142.01 1,714 142.01 2,207 493 28.8%142.02 5,593 142.03 & 142.04
35,541 -52 -0.9%
143.04 4,573 143.04 7,729 3,156 69.0%148.01 1,141 148.01 1,199 58 5.1%
Total Census Tracts 32,904 54,252 21,348 64.9%1
Most of the growth in Tract 100 was due to increases in correctional institution populations.2
Tract 141.25 did not exist in the 1990 Census but was part of Tract 141.11 that was split into 141.25 and 141.24 inthe 2000 Census3
Tract 142.04 did not exist in the 1990 Census but was part of Tract 142.02 that included 2000 Tracts 142.04 and142.03.
Source: 1990 U.S. Census and 2000 U.S. Census
ROYA
L LN
BELT LINE RD
JOHN C
ARPE
NTER
FWY
LUNA RD
ROCH
ELLE
RD
WALN
UT H
ILL LN
ESTE
RS RD
STORY RD
HARRY HINES BLVD
NORT
HWES
T HWY
GRAU
WYLE
R RD
RIVERSIDE DR
HIDDEN RI
DGE
DR
Farm
ers B
ranch
UV114
U V161
U V183
U V354
&-482
&-348
VALLEY VIEW LN
ROCHELLE BLVD
PRESIDEN
T GEO
RGE BUSH TP
KE
REGAL ROW
IRVING BL
VD
N MACARTHUR BLVD
TOM BRANIFF DR
WEB CHAPEL RD
STOREY LN
E AIR
PORT
FWY
WALN
UT H
ILL LN
NORT
HGAT
E DR
CALIF
ORNI
A CRO
SSIN
G RD
BELT LINE RD
" )12
§̈ ¦35E
" )12
§̈ ¦35E
Irving
Dalla
s
N O' CONNOR RD
CARB
ON R
D
WALN
UT H
ILL LN
JOHN CAR
PENTE
R FWY
DENTON DR
MACARTHUR BLVD
DFW
Inter
natio
nal
Airpo
rt
E lm Fork Trinity River</FNT>
BNSF RR
!!
!!
!!
!!
!!
!!
!!
!!
UV114
UV161
UV354
Belt L
ine R
oad
Loop
12
(defer
red)
Sout
h Las
Coli
nas
(defer
red)
Cabe
ll Dr
Lake
Car
olyn
Carp
enter
Ran
ch
North
Las C
olina
s
North
Lake
Co
llege
Unive
rsity
of
Dalla
s
99.00
141.1
114
1.03
143.0
4
141.1
2
148.0
1
142.0
1
100.0
014
2.04
4.03
72.01
Figure
3-7
NW C
orrido
r LRT
Line
to Irv
ing/D
FWEn
viron
menta
l Impa
ct Sta
temen
t´
1990
Cen
sus T
racts
04,0
008,0
002,0
00Fe
et
Lege
nd
Prop
osed
LRT L
ine to
Irving
/DFW
Study
Area
Sourc
e: NC
TCOG
, 199
0
Prop
osed
Stat
ion!!
Cens
us Tr
acts
for 19
90
Carro
llton-F
armers
Bran
ch LR
T Line

ROYA
L LN
BELT LINE RD
JOHN C
ARPE
NTER
FWY
LUNA RD
ROCH
ELLE
RD
WALN
UT H
ILL LN
ESTE
RS RD
STORY RD
HARRY HINES BLVD
NORT
HWES
T HWY
GRAU
WYLE
R RD
RIVERSIDE DR
HIDDEN RI
DGE
DR
Farm
ers B
ranch
UV114
U V161
U V183
U V354
&-482
&-348
VALLEY VIEW LN
ROCHELLE BLVD
PRESIDEN
T GEO
RGE BUSH TP
KE
REGAL ROW
IRVING BL
VD
N MACARTHUR BLVD
TOM BRANIFF DR
WEB CHAPEL RD
STOREY LN
E AIR
PORT
FWY
WALN
UT H
ILL LN
NORT
HGAT
E DR
CALIF
ORNI
A CRO
SSIN
G RD
BELT LINE RD
" )12
§̈ ¦35E
" )12
§̈ ¦35E
Irving
Dalla
s
N O' CONNOR RD
CARB
ON R
D
WALN
UT H
ILL LN
JOHN CAR
PENTE
R FWY
DENTON DR
MACARTHUR BLVD
DFW
Inter
natio
nal
Airpo
rt
E lm Fork Trinity River</FNT>
BNSF RR
!!
!!
!!
!!
!!
!!
!!
!!
UV114
UV161
UV354
Belt L
ine R
oad
Loop
12
(defer
red)
Sout
h Las
Coli
nas
(defer
red)
142.0
3
141.2
4Ca
bell D
r
Lake
Car
olyn
Carp
enter
Ran
ch
North
Las C
olina
s
North
Lake
Co
llege
Unive
rsity
of
Dalla
s
99.00
141.2
514
1.03
143.0
4
141.1
2
148.0
1
142.0
1
100.0
014
2.04
4.03
72.01
Figure
3-8
NW C
orrido
r LRT
Line
to Irv
ing/D
FWEn
viron
menta
l Impa
ct Sta
temen
t´
2000
Cen
sus T
racts
04,0
008,0
002,0
00Fe
et
Lege
nd
Prop
osed
LRT L
ine to
Irving
/DFW
Study
Area
Sourc
e: NC
TCOG
, 200
0
Prop
osed
Stat
ion!!
Cens
us Tr
acts
for 20
00
Carro
llton-F
armers
Bran
ch LR
T Line

Preliminary Engineering / Environmental Impact StatementNorthwest Corridor LRT Line to Irving and DFW Airport
Draft Environmental Impact Statement 3 - 21Chapter 3 Affected Environment
The sections of the Project Corridor experiencing the highest rates of population growth are in theeastern portions of the corridor in Dallas and in the Hackberry Creek Neighborhood of Las Colinas.In Dallas, Tract 72.10 is the most populated tract within the corridor and also experienced one onthe highest rates of growth in the 1990’s. The tract grew by almost 117 percent to 10,690 personsin 2000. This tract is also the second smallest in the corridor in terms of land area and thereforehas one of the highest residential densities in the Project Corridor.
Tract 100 in Dallas had the highest rate of growth in the corridor – almost 195 percent. Detailedexamination of the census tables showed that the majority of this growth was due to increases inthe population of the correctional institutions in the southern portion of the tract (which lie outside ofthe Project Corridor).
The third tract experiencing a high growth rate is the Hackberry Creek Neighborhood in LasColinas (Tract 141.11). It is located just north of SH 114 near SH 161. This area contains the thirdmost populated tract in the corridor and grew by 153 percent to a 2000 population of 8,835.Another portion of the corridor also had significant population gains – Tract 143.04 just south of SH114 and centered along MacArthur Boulevard. This area had a 69 percent gain, bringing the totalto 7,729, making it the fourth most populated tract in the corridor.
Demographic ProfilesA profile of the demographic characteristics of the corridor should take into consideration thedemographics of the larger community. In this way, the corridor can be compared to the cities andregion in which it is based. Table 3-10 below provides a demographic profile of the DART ServiceArea, Dallas County and the Cities of Dallas and Irving.
TABLE 3-10DEMOGRAPHIC PROFILE
DART SERVICE AREA, COUNTY AND CORRIDOR CITIES
Demographic Characteristics DARTService Area
DallasCounty
City ofDallas
City ofIrving
Total Population 2000 2,149,381 2,218,899 1,188,580 191,615
Median Household Income1
$47,799 $43,324 $37,628 $44,956
% Persons Low Income2
12.8% 13.2% 17.8% 10.6%
% Racial Minority3
39.8% 41.6% 49.2% 35.8%
% Hispanic Origin 28.6% 29.9% 35.6% 31.2%
Median Age of Residents 32.4 31.1 30.5 30.3
% Population Under 18 27.1% 27.9% 26.6% 25.2%
% Population Over 64 7.7% 8.1% 8.6% 6.1%% Occupied Housing Units with novehicle available
7.8% 8.1% 10.9% 5.7%
1For the DART Service Area, this number is a Weighted Average Median Household Income for the 13 DART Member
Cities.2
Individuals with incomes below the poverty level in 1999 as reported in the 2000 Census.3
Racial Minority is defined as the population identifying themselves as non-white in the 2000 Census.Source: 2000 U.S. Census
To assess the demographics of the Project Corridor population, a socio-economic profile wasdeveloped for each census tract in the corridor. It was assumed that the population residing in theportion of the tract that lies within the Project Corridor had a similar socio-economic profile to thatof the tract as a whole. Table 3-11 below contains socio-economic data for the individual censustracts within the Irving/DFW Corridor (see Figures 3-7 and 3-8 for the 1990 and 2000 CensusTract boundaries).

Preliminary Engineering / Environmental Impact StatementNorthwest Corridor LRT Line to Irving and DFW Airport
Draft Environmental Impact Statement 3 - 22Chapter 3 Affected Environment
TABLE 3-11DEMOGRAPHIC PROFILE IRVING/DFW CORRIDOR CENSUS TRACTS
Demographic Characteristics
CensusTracts
MedianHousehold
Income
PercentPersons
LowIncome
1
PercentRacial
Minority2
PercentHispanic
Origin
MedianAge of
Residents
PercentPopulationUnder 18
PercentPopulation
Over 64
%OccupiedHousing
Units withno vehicleavailable
4.03 $31,961 16.1% 40.2% 89.1% 27.4 34.1% 7.0% 10.5%72.01 $26,525 27.4% 54.1% 90.9% 24.5 31.6% 1.0% 15.8%99.00 $22,950 28.8% 55.1% 45.8% 29.5 29.6% 8.3% 19.0%100.00 $29,063 43.0% 50.8% 17.7% 34.5 4.7% 4.0% 6.7%414.03 $30,550 16.6% 64.5% 34.1% 25.6 28.9% 0.7% 6.3%141.12 $36,399 7.8% 51.1% 14.1% 28.9 20.4% 1.4% 7.6%141.25 $51,130 5.4% 38.4% 9.1% 29.2 12.0% 0.9% 4.1%142.01 $74,531 2.7% 13.0% 6.3% 38.4 10.8% 10.1% 2.2%142.04 $34,667 18.8% 48.1% 17.5% 23.3 18.1% 4.6% 7.7%143.04 $54,792 6.3% 37.2% 9.4% 30.1 14.9% 2.2% 2.5%148.01 $34,348 14.4% 27.6% 48.1% 31.0 26.4% 6.8% 5.1%1
Individuals with incomes below the poverty level in 1999 as reported in the 2000 Census.2
Racial Minority is defined as the population identifying themselves as non-white in the 2000 Census.Source: 2000 U.S. Census
The weighted average median household Income for all census tracts in 2000 was $42,817. Thisis lower than the median household income for the DART Service Area, Dallas County and the Cityof Irving. However, there is a very wide range among the tracts within the corridor. Tract 99 had thelowest income level with a median household income of $22,950. Tract 142.01 had the highestincome level at $74,531. The corridor tracts in the City of Dallas (4.03, 72.01, 99 and 100) all hadmedian household income levels below the Citywide median income of $37,628. They also had thelowest income levels in the Project Corridor. The tracts with the highest income levels were alllocated in the City of Irving with the greatest concentration found in the Las Colinas area.
The percentage of the corridor population with income in 1999 below poverty level was just above13 percent. This is comparable to the DART Service Area as a whole. However within the corridor,there is a wide variation among Census Tracts in the number of low income persons. Tract 100had 43 percent below the poverty level in 1999 and Tract 142.01 had less than 3 percent. Theresidents in the eastern portions of the corridor in Dallas had the highest percentage of low incomeresidents. The population in the central portions of the corridor in the Las Colinas area had thelowest percentage of low income populations.
The number of persons identified as belonging to a racial minority was approximately 40 percentfor the DART Service Area and 42 percent for the County. The City of Dallas has a higherpercentage (49 percent) and Irving a lower percentage (36 percent). The tracts within the ProjectCorridor vary considerably, ranging from 65 percent to only 13 percent. The tract with the highestpercentage is located in Irving in the western portion of the corridor next to SH 161 (Tract 141.03).An adjacent tract at the end of the line is also high with 51 percent. The other tracts with highpercentages are in the far eastern portions of the corridor in the City of Dallas.
The DART Service Area, Dallas County and the Corridor Cities have similar percentages ofpersons of Hispanic Origin – ranging from 29 percent to 36 percent. Five of the eleven corridortracts fall within this range. The tracts within Las Colinas are much lower. The eastern portion ofthe Project Corridor has tracts with much higher concentrations – Tracts 4.03 and 72.01 are botharound 90 percent and Tract 99 is 46 percent. In the western portion of the Project Corridor a highconcentration is found in Tract 148.01 – 48 percent.

Preliminary Engineering / Environmental Impact StatementNorthwest Corridor LRT Line to Irving and DFW Airport
Draft Environmental Impact Statement 3 - 23Chapter 3 Affected Environment
The median age of the Service Area, County and Corridor Cities are also similar – 30 to 32 yearsin age. Tracts within the Project Corridor tend to be much younger – seven of the eleven tractshave a median age below 30 with Tract 142.04 in eastern Irving having a median age of 23.3years. Only two tracts have a median age higher than the Service Area – Tract 142.01 in LasColinas is 38.4 and Tract 100 in Dallas is 34.5. When examining the percentage of the populationunder the age of 18, only two tracts stand out when compared to the larger community – Tracts4.03 and 72.01 located in the eastern portion of the corridor in Dallas. When examining thepercentage of the population over the age of 64, the corridor tracts in general have less of theirpopulation elderly than the Service Area. Three of the tracts fall within the 6 to 8 percent range (therange for the larger geographic areas), one tract is higher at 10.8 percent and the remaining seventracts are all lower.
The Service Area, County and Corridor Cities vary in the percentage of occupied housing unitswith no vehicle available. The City of Dallas has the highest percentage with almost 11 percent.The City of Irving is the lowest at just under 6 percent. The Service Area and the County arearound 8 percent. The tracts within the Project Corridor vary significantly. Tracts 72.10 and 99 inDallas have 16 percent and 19 percent of their household with no vehicle. The households in theLas Colinas area have the lowest percentages – around 2 percent for Tracts 142.01 and 143.04.
Overall, the demographic analysis highlights that the populations within the Project Corridor arevery diverse. There are very low income areas and very wealthy areas within the corridor. Thereare areas with very high concentrations of Hispanic and racial minority individuals and those withvery low percentages. The transportation needs of the corridor also vary – certain portions of thecorridor are very transit dependent while more affluent areas within the corridor offer opportunitiesfor capturing choice riders.
3.2.2 Labor Force and Employment CentersThis section outlines employment trends and projections for the region, Dallas County, the CorridorCities and the Project Corridor.
Employment TrendsEmployment in the North Central Texas region was impacted by the 2001 recession. The areasuffered employment losses due to its high concentration of high technology, telecommunicationand aviation industries. However, all indicators monitored by the Federal Reserve indicate that thearea is rebounding. The Federal Reserve is reporting job growth, declining office vacancies and astrong construction market for the area (Federal Reserve Bank Dallas, June 2005).
Prior to the recession, the region experiences phenomenal employment growth. From 1990 to2000, the region added 935,107 jobs, increasing total employment by 46 percent. Dallas Countyhad a 39 percent increase in total employment, bringing total jobs to 1.75 million in 2000. The Cityof Dallas led the region by capturing 228,664 jobs, bringing its total employment base to 1,038,314.The City of Irving was third in the region for total employment growth – bringing its totalemployment to 165,435 in 2000. According to NCTCOG, the City of Dallas has the greatestconcentration of major employers within the region with 260 major employers located in the City.The City of Irving has the third highest concentration of major employers in the DFW region with103. Table 3-12 outlines employment growth for these areas from 1990 to 2000.
The Irving/DFW Corridor has also been impacted by the recession. In the Las Colinas officemarket, overall vacancy reached 31 percent in 2003. In addition, DFW Airport suffered from theeconomic problems of the major airlines. However recent studies of the market indicate that thecorridor is headed for a rebound. Office vacancies are predicted to drop to 10 percent in LasColinas by the end of 2010. (“Study Shows New Life in Las Colinas”, Dallas Business Journal,July 4, 2005.) In addition, the corridor is experiencing new corporate investment activity – Fluor

Preliminary Engineering / Environmental Impact StatementNorthwest Corridor LRT Line to Irving and DFW Airport
Draft Environmental Impact Statement 3 - 24Chapter 3 Affected Environment
Corporation recently announced their plans to relocate their headquarters to the area in 2006. Realestate brokers in the area have seen a steady increase in office leasing activity in the market.
TABLE 3-12EMPLOYMENT CHANGE 1990-2000 COUNTY AND CORRIDOR CITIES
Area 1990Employment
2000Employment
1990-2000Change % Change
Dallas County 1,254,974 1,745,109 490,135 39.1%
City of Dallas 809,650 1,038,314 228,664 28.2%
City of Irving 106,600 165,435 58,835 55.2%Source: NCTCOG, 2005
While DFW Airport has suffered from the loss of most Delta Airlines’ flights and the cuts atAmerican Airlines, it still remains the third busiest airport in the world (measured in number of flightoperations). It also serves more than 55 million passengers annually. The airport is a majoremployment center within the DFW region and within the Project Corridor with 268,000 full-timejobs. The airport is the “regional central business district" (CBD) of the North Central Texas regionaccording to NCTCOG. Approximately 83 percent of the region’s total employment is located withina 20-mile radius of the airport.
Table 3-13 below examines employment trends by census tract within the Irving/DFW Corridor. Alltracts experienced double digit job growth from 1990 to 1998. Tract 141.11 had an 88 percent jobgrowth rate during that time period. Total employment within tracts in the Project Corridor was255,845 in 1990 and 307,699 in 1998 – reflecting an employment growth rate of 20 percent (seeFigures 3-7 and 3-8 for the 1990 and 2000 Census Tract boundaries.) (Note these figuresrepresent employment for the entire Census Tract, not just the portion of the tract within the ProjectCorridor.)
TABLE 3-13EMPLOYMENT 1990 -1998
IRVING/DFW CORRIDOR CENSUS TRACTCensus
Tract No.% Land AreaIn Corridor
1990Employment
1998Employment
1990-1998Growth % Growth
4.03 25.40% 27,121 31,432 4,311 16%
72.01 19.10% 2,093 2,365 272 13%
99 19.60% 35,202 40,056 4,854 14%
100 26.30% 112,062 127,299 15,237 14%
141.03 31.60% 19,535 24,773 5,238 27%
141.111
26.70% 11,930 22,435 10,505 88%
141.12 21.90% 2,771 3,695 924 33%
142.01 29.70% 23,403 28,750 5,347 23%
142.022
15.40% 3,566 4,341 775 22%
143.04 14.00% 9,835 12,494 2,659 27%
148.01 15.10% 8,327 10,059 1,732 21%
Total 255,845 307,699 51,854 20%1
Tract 141.25 did not exist in the 1990 Census but was part of Tract 141.11 that was split into 141.25 and 141.24 inthe 2000 Census.2
Tract 142.04 did not exist in the 1990 Census but was part of Tract 142.02 that included 2000 Tracts 142.04 and142.03.
Source: NCTCOG, 2005

Preliminary Engineering / Environmental Impact StatementNorthwest Corridor LRT Line to Irving and DFW Airport
Draft Environmental Impact Statement 3 - 25Chapter 3 Affected Environment
Distribution PatternsThe Irving/DFW Line is located in one of the strongest employment corridors in the region. At theheart of the line is the Las Colinas community – a regional employment destination. At the westernend of the line is DFW Airport – a major employer for the region as well as the “CBD” foremployment within the North Central Texas region. At the eastern end of the Project Corridor, theIrving/DFW line would connect to DART’s Carrollton/Farmers Branch LRT line. That line providestransit access to the Stemmons Corridor, the Dallas Medical District and the Dallas CentralBusiness District – all major employment destinations in the North Central Texas region.
A review of the previous table provides insight into the geographic distribution of employmentwithin the Irving/DFW Corridor. The tracts with the highest total employment in 1998 were locatedin Dallas – Tracts 99 and 100. These areas both experienced growth from 1990 to 1998 of 14percent. The tracts fall within the Stemmons Corridor – an area with one of the highestemployment concentrations in the region. Several of the City of Dallas’ top employers are locatedwithin this corridor including Parkland Memorial Hospital, Children’s Medical Center and theUniversity of Texas Southwestern Medical Center. Tract 4.03 in Dallas had the third highestconcentration of employment in the corridor. This tract contains Love Field Airport and is home toanother major Dallas employer – Southwest Airlines.
The next highest concentration of employment in the corridor is found in the Urban Center of LasColinas. One tract included in this area experienced an 88 percent increase in total employmentbetween 1990 and 1998. The remaining tracts in this area all experienced significant job growth inthe 1990’s – with gains in the 20 to 30 percent range. Overall, job growth was distributed along theSH 114 Corridor, with significant gains in the SH 161 (George Bush Turnpike) area. This tractexperienced 33 percent job growth.
Employment ProjectionsA number of sources predict that the North Central Texas region will continue to rebound from therecession of the early 2000’s and will return to strong employment growth. NCTCOG projects totalregional employment to increase from 3,158,200 in 2000 to 5,416,700 in 2030. This represents a72 percent increase in total employment. Dallas County is projected to receive the greatest shareof this growth, experiencing a 45 percent employment growth (784,262 jobs).
The City of Dallas’ employment is predicted to grow 34 percent during this time period. Dallas isprojected to have the highest total absolute job growth in the region among all cities – employmentis projected to increase by 351,905 jobs bringing total employment in 2030 to 1.39 million. The Cityof Irving is projected increase employment by 67 percent – to 276,941 jobs.
The Las Colinas area is projected to grow by 83 percent between 2000 and 2030 – from 77,992 to142,985. During this same time period, population is anticipated to increase by 52 percent - from25,066 to 38,203. The current trend of jobs increasing at a faster rate than population growth ispredicted to continue increasing the transportation needs of the corridor. Las Colinas jobs will befilled not only by Irving residents but increasingly more by people residing outside of the area. LasColinas’ position as a major employment destination is projected to continue well into the future.
Within the Project Corridor, employment is projected to increase by almost 88 percent. Total jobswill grow to 109,106 by 2030 almost doubling 2000 employment levels. Table 3-14 below outlinesthe employment projections for these geographic areas.

Preliminary Engineering / Environmental Impact StatementNorthwest Corridor LRT Line to Irving and DFW Airport
Draft Environmental Impact Statement 3 - 26Chapter 3 Affected Environment
TABLE 3-14EMPLOYMENT PROJECTIONS
REGION, COUNTY, CORRIDOR CITIES AND IRVING/DFW CORRIDOR
Area 2000Employment
2030 ProjectedEmployment
ProjectedGrowth % Growth
Region (10 county area) 3,158,200 5,416,700 2,258,500 71.5%
Dallas County 1,745,109 2,529,371 784,262 44.9%
Dallas 1,038,314 1,390,219 351,905 33.9%
Irving 165,435 276,941 111,506 67.4%
Las Colinas 77,992 142,985 64,993 83.3%
Irving/DFW Corridor1
58,081 109,106 51,025 87.9%1
Based on NCTCOG Traffic Survey Zone dataSource: NCTCOG, 2005
3.2.3 NeighborhoodsThere are several residential areas throughout the Project Corridor. One is located in Dallas andthe other six are located in the Las Colinas community. Figure 3-9 depicts the general location ofthese neighborhoods. A brief description of each area is outlined below:
� Bachman Neighborhood (Also known as Love Field North Neighborhood) (Dallas)An area bound on the North by Walnut Hill Lane, on the south by Shorecrest Drive, on theeast by Midway Road and on the West by Harry Hines Boulevard. This is a mixed use areawith residential, commercial, institutional and industrial land uses. A significant amount ofhousing in this area is multi-family, primarily renter occupied units. The neighborhoodincludes Bachman Lake and Recreation Center and lies just north of Love Field Airport.This area has been the subject of several studies by the City including the Love FieldNorth Land Use Study (1988) and the Northwest Highway AreaRevitalization/Neighborhood Improvement Study (1992).
� Las Colinas Urban CenterThe core of the Las Colinas community is known as the Urban Center. The area isdominated by several high-rise office buildings and home to more than 400 multi-nationalcompanies. The Urban Center has a number of multi-family units, with several new onesunder construction as of August 2005.
� Cottonwood ValleyThis single family residential neighborhood is located in the Las Colinas community. It liesjust west of McArthur Boulevard, just east of Story Road, north of Northgate Drive andsouth of the North Lake College campus. The area is predominantly custom homes.Adjacent to this neighborhood is the Four Seasons Resort and Club.
� University Hill NeighborhoodThis single family neighborhood was the first residential area to be developed in LasColinas. It is bound on the south and east by Rochelle Boulevard and on the north and westby the Las Colinas Country Club Golf Course.
� Windsor RidgeThis single family residential neighborhood is located in the Las Colinas community. It lieseast of McArthur Boulevard, south of the Cottonwood Branch Creek and north of the FourSeasons Resort.

ROYA
L LN
BELT LINE RD
JOHN C
ARPE
NTER
FWY
LUNA RD
ROCH
ELLE
RD
WALN
UT H
ILL LN
ESTE
RS RD
STORY RD
HARRY HINES BLVD
NORT
HWES
T HWY
GRAU
WYLE
R RD
RIVERSIDE DR
HIDDEN RI
DGE
DR
Farm
ers B
ranch
UV114
U V161
U V183
U V354
&-482
&-348
VALLEY VIEW LN
ROCHELLE BLVD
PRESIDEN
T GEO
RGE BUSH TP
KE
REGAL ROW
IRVING BL
VD
N MACARTHUR BLVD
TOM BRANIFF DR
WEB CHAPEL RD
STOREY LN
E AIR
PORT
FWY
WALN
UT H
ILL LN
NORT
HGAT
E DR
CALIF
ORNI
A CRO
SSIN
G RD
BELT LINE RD
" )12
§̈ ¦35E
" )12
§̈ ¦35E
Irving
Dalla
s
N O' CONNOR RD
CARB
ON R
D
WALN
UT H
ILL LN
JOHN CAR
PENTE
R FWY
DENTON DR
MACARTHUR BLVD
DFW
Inter
natio
nal
Airpo
rt
E lm Fork Trinity River</FNT>
BNSF RR
!!
!!
!!
!!
!!
!!
!!
!!
!!
!!
!!
!!
UV114
UV161
UV354
Cabe
ll Dr
Bach
man
Las C
olina
s Ur
ban C
enter
Cotto
nwoo
d Va
lley
Unive
rsity
Hills
Wind
sor
Ridg
e
Las C
olina
sMa
ndala
y Pla
ce
Figure
3-9
NW C
orrido
r LRT
Line
to Irv
ing/D
FWEn
viron
menta
l Impa
ct Sta
temen
t´
Neigh
borh
oods
04,0
008,0
002,0
00Fe
et
Lege
nd
Prop
osed
LRT L
ine to
Irving
/DFW
Sourc
e: Re
nee J
ayne
s, 20
05
Prop
osed
Stat
ion!!
Neigh
borho
od
Carro
llton-F
armers
Bran
ch LR
T Line

Preliminary Engineering / Environmental Impact StatementNorthwest Corridor LRT Line to Irving and DFW Airport
Draft Environmental Impact Statement 3 - 28Chapter 3 Affected Environment
� Mandalay PlaceThis single family neighborhood, which was constructed in the mid-1980’s, is locateddirectly north of North Lake College between Brangus Drive and Walnut Hill Lane.
� Las ColinasThis neighborhood encompasses several apartment complexes north of North LakeCollege, surrounding a creek, ponds and greenbelts. The neighborhood includes theHidden Ridge, Jefferson Park, Jefferson Ridge, Knightsbridge, Rancho Mirage, Archstoneat MacArthur (previously Rosemont Apartments), and Villas at Beaver Creek apartments.
3.3 TRANSPORTATIONThe proposed extension of light rail to Irving within the Northwest Corridor will have to interfacewith the existing transportation system of roadways, highways, railroads, pedestrian/bicyclefacilities, bus routes, and transit centers. This section documents the existing conditions of thattransportation system and lays the groundwork for determining what changes will have to be madeto accommodate light rail and what impacts that will have. As such, this section focuses on theproposed alignment of the light rail extension and the transportation facilities that parallel or crossit. This study area extends from northwest Dallas westward through Irving towards Dallas/FortWorth International Airport.
The existing conditions of the transportation system within the Irving/DFW LRT corridor weredocumented by collecting existing data from various transportation agencies and taking inventoryof conditions within the corridor itself. This documentation includes a summary of regional trafficpatterns and traffic volumes, intersection conditions, parking usage, bus service, and freightrailroad operations.
Existing daily and peak hour traffic volumes at most locations were collected from TxDOT,NCTCOG, and the municipal agencies within the corridor. Traffic volumes at certain locations werecollected manually in the field. Year 2030 traffic volume projections were obtained from theNCTCOG Mobility 2025 Plan (Amended April 2005) as modeled by DART. The existingconfiguration of transportation facilities was inventoried in the field. Roadway, rail, and transitfacilities projected to exist in the year 2030 were estimated based upon committed and proposedchanges to the transportation system as specified by and agreed to by the agencies involved.
Transit operation and ridership data were collected from DART. Data concerning bicycle andpedestrian facilities were collected from the cities in the corridor. Finally, any policies governing theuse of or interaction between transportation facilities in the corridor were collected from the variousgovernment agencies within the corridor.
3.3.1 Transportation InfrastructureThis section describes the existing conditions of the transportation infrastructure within theIrving/DFW LRT corridor. This includes transit infrastructure, roads and highways, and railroads.
Transit InfrastructureThe Project Corridor is served by a network of 14 DART bus routes. Bus transit services operatein mixed traffic on city streets, SH 114, and IH 35E south of IH 635 (Figure 3-10). Just outside theProject Corridor, buses utilize high occupancy vehicle (HOV) lanes on IH 35E north of IH 635, andon IH 635 east of IH 35E. There are two express, eight circulator, one rail-feeder, and three cross-town routes in the corridor. The “circulator” routes operate between transit centers in outer Dallasand in the suburbs. Typically, express routes provide service to downtown Dallas, but one of theexpress routes is a cross-town route that provides east-west service on IH 635. The corridor busnetwork generally is oriented in a pattern radiating from downtown Dallas, which is located beyondthe southeast edge of the Study Area. In addition, there are several circulator routes within Irving.