32 · pdf filehis chapter provides a snapshot of measures related to community assets. ......
TRANSCRIPT

32 | Health of Massachusetts
Community Assets | 33
C H A P T E R 2
C o m m u n i t yA s s e t s
Community assets are resources that provide a healthier environment for Massachusetts residents and can have a great impact on the health
and quality of community life1
Community assets can range from physicians per capita to access to public recreation programs Several studies suggest that individualsrsquo health can be influenced by where they live work or send their children to school2 Comshymunities vary by the health-related assets that are available to their residentsCommunities also vary widely when it comes to the disproportionate burden of disease including diabetes heart disease asthma and other illnesses
Taking stock of the assets in local communities can help residents mobishylize around key issues enhance these resources improve the health of their residents and reduce health inequities across the Commonwealth3
This chapter provides a snapshot of measures related to community assetsThe two main sections within this chapter are Health Care Infrastructurewith an emphasis on the distribution of services and Community Infrashystructure with an emphasis on assets that encourage healthy eating and active living The data are presented by the six geographical regions within the Executive Office of Health and Human Services (EOHHS) Measures include health care capacity distribution ratio of health care providersfarmersrsquo markets comprehensive master planning public recreation proshygrams and availability of healthy foods options
Community assets are
resources that can have
a great impact on the
health and quality of
community life and provide
a healthier environment for
Massachusetts residents
34 | Health of Massachusetts
One approach for creating
sustainable and healthy
environments is to implement
policies systems and
environmental changes at the
local or regional level
What Does Community Mean
Community may be defined as a grouping of people with diverse characshyteristics who are linked by physical or social environments share common perspectives and engage in joint action in geographical locations or settings4
Physical environments in a community may include parks open spaceslibraries health centers and businesses Social environments in a comshymunity may include civic social neighborhood church and other groupswhere people participate and interact5
A healthy community is one that is constantly creating and improving its physical and social environments This enables its residents to encourage and support one another in living healthy and active lifestyles5
Identifying and increasing access to community assets can transform comshymunities and aid in improving the overall health of their residents678
Building a Supportive Environment
Community assets provide people with opportunities to lead healthy lives by allowing them to make healthy choices more easily
One approach for creating sustainable and healthy environments is to impleshyment policies systems and environmental changes at the local or regional level
Policies are laws regulations rules protocols and procedures designed to guide or influence behaviorSystems change occurs when one or several elements in a system subshystantially change altering both their relationship to one another and the overall structure of the system itselfEnvironmental changes are changes to the economic social or physical environments
These changes provide opportunities support and cues to guide people in making healthier behavior choices9
Examples of policies systems and environmental changes include laws and regulations that restrict smoking in public buildings implementation of the Chronic Care Model in health care settings worksites that provide time off during work hours for physical activity school wellness policies that include healthy food options and opportunities for physical activityincorporating walking paths and recreation areas into new community development designs and making healthy low-fat food choices available in municipal and school cafeterias10
The economic benefits to the community are also a driving force behind strengthening community assets Evidence shows that people want to live
Community Assets | 35
in places where they are able to be active and healthy A 1999 study by the Urban Land Institute of four new pedestrian-friendly communities detershymined that homebuyers were willing to pay a $20000 premium for homes in these areas compared to similar houses in surrounding areas that lacked pedestrian-friendly amenities11 Another study found that utilization of safety precautions in developing roads and thruways reduced vehicular traffic on residential streets by several hundred cars per day and increased home values by an average of 1812
Healthier communities can have a positive effect on physical activity nutrishytion and various chronic conditions13 Community assets can not only directly add value and appeal to current and prospective residents but they can also indirectly lower costs associated with the economic burden of disease
The way we design our communities can have a direct impact on our overshyall wellbeing14 In order to better understand community assets one must look at the design of the community itself from ensuring access to health care resources to implementing land use policies
Health Care Infrastructure Distribution of Resources
A vital community asset and a large component of the design of a comshymunity is access to high-quality health care services Many individuals in Massachusetts do not have timely and equitable access to health care services Among other factors this may be due to the geographic location
Figure 21 Acute Care Hospitals and Community Health Centers
Acute Care Hospitals
Main Community Health Centers
Satellite Community Health Centers
Source MDPH Office of Emergency Services July 2009 Massachusetts League of Community Health Centers MassGIS April 2006
Massachusetts was recently awarded a federal Healthy Communities Grant which supports eliminating socioshyeconomic and racialethnic health disparities as an integral part of its chronic disease prevention and health promotion efforts (For more informashytion on chronic diseases please refer to Chapter 7)
36 | Health of Massachusetts
and distribution of health care facilities (Figure 21) and their capacity to serve their surrounding populations (Figure 22)
The availability of and physical access to hospitals and community health centers are integral community assets However delivering high quality health care services also depends on having enough primary care providers and other qualified health care professionals to serve the population
Good primary care is associated not only with improved self-rated overall health and mental health of the population but also with reductions in disparities between more and less disadvantaged communities in overshyall health15 Primary care helps to reduce the adverse impact of income inequality on population health as measured by life expectancy age-adjusted mortality and leading causes of death16
From a regional perspective health care as a community asset is disproshyportionately represented in Massachusetts While the Boston region has the highest number of acute care hospitals community health centers
Figure 22 Acute Care Hospital Beds
750 572 00 P
op
50000
244 loz 234 loz loz loz196 173 178 175 250
ds p
er 1
0
0
Be Western Central North East Metro South East Boston MA West Region
Sources MDPH Division of Health Care Quality 2008 US Census 2007 population estimates for MA Statistically higher than state rate (ple 005) lozStatistically lower than state rate (ple 005)
Figure 23 Physicians
North East 204
Western Boston RegionCentral297 1334Metro West 292
396
South East 199
Massachusetts Physicians per 10000 Pop 405 Statistically higher than state rate
Statistically not different from state rate Statistically lower than state rate
Source Massachusetts Board of Registration in Medicine July 2009
Community Assets | 37
and overall physicians (including primary and specialty care) per capita it actually has a lower number of nurses per capita (including registered and licensed practical nurses) compared to the state as a whole
The North and South East regions have the lowest number of acute hosshypital beds and number of physicians per capita The South East region hasno trauma center and ranks lower than the state average for the number of community health centers and dentists per capita (Figures 23 24 and 25)
Figure 24 Primary Care Physicians
po 481
P 500
0 0 400000 3001r e lozloz 156 165 200p 140134 loz loz s 101 86n 100aicis 0yh Western Central North East Metro South East Boston MA P
West Region
Source Massachusetts Board of Registration in Medicine July 2009 Statistically higher than state rate (ple 005) lozStatistically lower than state rate (ple 005)
Figure 25 Health Care Infrastructure by Region
Western Central North East Metro West South East Boston Region MA
Acute Care Hospitals and Community Health Centers (CHC) (Number per 100000 population)
Acute Hospitals 17 12 12 10 10 20 13
with ER 15 11 11 10 10 14 11
Trauma Centers 02 01 04 01 loz00 07 02
CHC 23 29 30 loz17 loz16 73 28
Medical Providers Licensed in Massachusetts (Number per 100000 population)
Dentists loz601 loz528 792 1249 loz624 1201 855
Nurses 16846 18889 17398 17607 19918 loz10034 17187
RN loz13354 15363 14166 15735 15986 loz8736 14291
LNP 3492 3526 3232 loz1872 3932 loz1298 2895
Physicians loz2967 loz2924 loz2040 3955 loz1993 13344 4053
Primary Care loz1340 loz1399 loz1007 1560 loz855 4811 1652
General Practice 26 loz08 17 24 26 34 22
Family Medicine 194 313 240 loz144 loz173 229 207
Pediatrics loz273 loz243 loz200 339 loz158 1093 345
Internal Medicine loz733 loz732 loz454 906 loz420 3119 941
OBGYN 115 loz104 loz95 147 loz78 336 136
Other Specialties loz1627 loz1524 loz1034 2394 loz1138 8533 2401
Sources MDPH Office of Emergency Services July 2009 Massachusetts League of Community Health Centers MassGIS April 2006 MA Division of Health Professions Licensure July 2009 Massachusetts Board of Registration in Medicine July 2009 Statistically higher than state rate (ple 005) lozStatistically lower than state rate (ple005)
38 | Health of Massachusetts
Implementation of Health Care Reform has identified and potentially exacerbated a clear imbalance of primary care access across the state with long wait times and closed practices17
Regional disparities in health care access and infrastructure are further highlighted by the federal designation of Health Professional Shortage Areas (HPSAs)
To develop a HPSA applicationdesignation the MDPH Primary Care Office evaluates cities towns and census tracts in accordance with Health Resources and Services Administration (HRSA) guidelines to assess the availability of primary dental and mental health care professionals
HPSAs are utilized by Massachusetts communities and health care facilities to establish a need for additional health care professionals This evaluation is based on criteria such as the number of primary care providshyers poverty infant mortalitylow birth weight fluoridation youth and elderly population percentages substance and alcohol abuse prevalenceand distancetravel time to nearest source of care Each HPSA is given a score indicating the degree of health professional shortage The higher the score the greater the shortage HPSA designations are updated every three to four years
There is now a heightened significance to a HPSA designation since a community or health care facility can potentially benefit from federal proshygrams designed to support access to primary care in underserved areas
Figure 26 Primary Care Health Professional Shortage Areas (HPSA)
Primary Care HPSAs
Primary Care HPSAs in Development Stages
Correctional Facility Primary Care HPSAs
Source MDPH Division of Primary Care and Health Access September 2009
A primary care designation considers the availability of physicians specializing
in geriatrics family medicine general practice general internal medicine
obstetrics-gynecology and pediatrics
Community Assets | 39
(See Figure 26 for current and emerging primary care shortage areas in Massachusetts)
To help place health care professionals in areas where shortages exist the Primary Care Office coordinates three programs National Health Service Corps (NHSC) Massachusetts State Loan Repayment Program (MSLRP)and the J-1 Visa Waiver Program
The J-1 Visa Waiver program helps place physicians with a variety of specialties in HPSAsThe MSLRP and National Health Service Corps supports a wide range of primary care providers in HPSAsThese programs are important recruitment and retention tools for communities and healthfacilities located in shortage areas
Strengthening health care resources improves the health of local residentsand since health care is one of the nationrsquos largest industries and is often one of the largest employers health care settings can also support the local economy by employing community residents Health care facilities can also advocate for healthier communities18 by supporting locally grown foodenhancing access to healthier food choices and physical activity establishshying farmersrsquo markets and supporting employee wellness
Community Infrastructures Supporting Healthy Eating and Active Living
In addition to equitable healthcare1 community infrastructure offers accessible resources that contribute to a healthy environment that betshyter enables individuals to lead healthy and active lives Health enhancing community infrastructure is achieved through advocacy policies systems change and civic and environmental approaches
The physical environment of a community greatly impacts the way we livework and play and thus also influences health Comprehensive master plans are guidelines that communities can use to provide a clear vision of the communityrsquos developing physical environment
A comprehensive master plan allows communities to address health and safety concerns recommend zoning strategies and develop land use polishycies that benefit the health of its residents Such measures might include building sidewalks and crosswalks and reducing the speed of traffic to enhance walking and pedestrian safety
In addition to master planning communities can look to mixed-use design to encourage active living and healthy eating Mixed-use refers to the deliberate mixing of housing civic uses and commercial uses includshying retail establishments restaurants and offices19 Some of the benefits of mixed-use development can include revitalization of the communitymore housing opportunities promotion of pedestrian and bicycle traffic
In 2008 Massachusetts instituted an additional loan forgiveness program for primary care physicians and nurse pracshytitioners practicing primary care in an underserved area for at least two years
Mass in Motion launched in January 2009 is a multifaceted wellness campaign It recently awarded 10 Municipal Wellness and Leadership Grants totaling more than $1 million to help communities across Massachushysetts promote healthy eating and active living at the local level (For more information on Mass in Motion see Chapter 7)
40 | Health of Massachusetts
increased opportunity for socialization added sense of community and encouragement of economic investment19
Open space including parks playgrounds courts skating rinks and swimshyming pools provide places for people to engage in exercise and active play Strong evidence has shown that supporting the creation andor the enhancement of these places is an effective intervention for increasing overall activity levels20 Recreation programming can also serve as a vehicle for community cohesion
Unfortunately places for people to be physically active are not evenly distributed among all communities In most cases low-income individuals and people of color are less likely to live in communities with parks and public recreation programs21 Enhancing or creating equitable access to public recreation programs can help decrease these disparities
Overall 85 of communities
who responded to the 2007
Survey of Policies and
Programs Related to Health
for Cities and Towns in
Massachusetts provide some
form of public recreation
programs to their residents
Figure 27 Area of State and Urban Parks and Dept of Conservation amp Recreation Pools
North East 2
Western Boston Region Central 35 1 Metro West 7
3
South East 4 Massachusetts Park Area (sq miles per 100000 pop)
7 Statistically higher than state rate Statistically not different from state rate Statistically lower than state rate
Pool in State Parks Pool in Urban Parks
Source MassGIS open-space and infrastructure layers July 2009
The western region of the state has a larger area of parks per capita Yet among those who responded to the 2007 Survey of Policies and Programs Related to Health for Cities and Towns in Massachusetts a lower percentage of cities and towns in the western region said they have master plans address walkability and sidewalks permit mixed-used development or have public recreation programs (Figure 28)
To further promote active living environments communities can estabshylish agreements that allow the use of public schools and other facilities for public recreational use during non-school hours and work together with schools to promote Safe Routes to School programs that ensure children can safely walk or ride their bicycles to school22 Understanding the safety
Community Assets | 41
of the community is essential to the process of enhancing or creating access to places like parks and recreation facilities Both perceived and real safety issues hinder peoplersquos ability to be active People are more reluctant to jogwalk or play if they perceive their neighborhood or their recreation area as unsafe which in turn can lead to physical inactivity and sedentary behavior
In addition to providing safe outdoor physical space for active living comshymunities can institute policies in schools and worksites where children and adults spend much of their time Schools can promote healthy physical activities and incorporate them throughout the day including before and after school These activities can ensure that children get the 30-60 minshyutes of physical activity that they need daily They also help to limit their use of television video games and computers for non-educational purposshyes which are activities that contribute to a sedentary lifestyle23
Across Massachusetts 957 of secondary schools required physical education in any of grades six through 12 and 833 offered intramural activities or physical activity clubs in 200824
Workplaces and employers can support active living by supporting physical activities (eg walking paths safe bicycle storage showers and gyms) or subsidizing memberships to offsite fitness clubs either directly or through
Occupational Health Though employers are required to provide protection from on-the-job hazards for employees wellness programs offer an opportunity to focus on preservshying the health and wellbeing of workers as well A comprehenshysive worksite wellness program not only protects employees from on-the-job injuries but may increase employee attenshydance productivity overall health and company profitability (See Chapter 9 for more information on Occupational Health)
Figure 28 Healthy Eating and Active Living Community Assets
Western Central North East Metro West South East Boston Region MA
Municipal Infrastructure
Communities
With Master Plans 62 79 90 94 86 25 79
Address Walkability 27 42 54 76 38 25 43
Address Sidewalks 27 45 54 76 38 25 44
Permit Mixed-Use Development 68 78 80 88 84 100 79
Lighting on sidewalks 28 33 20 39 43 100 34
Communities That Have a Policy On
Recreation Program 73 76 91 100 88 100 85
Menu Labeling 5 4 6 4 4 0 4
Healthy Food Choices 71 80 83 67 No data 0 72
Worksite Infrastructure
Worksites That Have
Subsidized Exercise Facilities Cost 49 52 53 47 39 52 48
On-site Exercise Facilities 10 5 7 15 9 10 10
Policies on Healthy Food Choices 19 25 25 19 19 20 21
Access to Healthy Food Choices 35 35 42 38 44 49 41
Nutrition Information Available 14 8 12 9 10 9 10
Sources MDPH Survey of Policies and Programs Related to Health for Cities and Towns in Massachusetts 2007 MDPH Worksite Health Improvement Survey 2008
42 | Health of Massachusetts
a health plan23 While only 10 of Massachusetts worksites reported havshying an on-site exercise facility for employees almost half (48) subsidize memberships to offsite physical activity facilities (Figure 28)
New state-wide menu labelshying regulations requiring fast food restaurants to post caloric content requiring state agencies to follow nutritional guidelines for procuring and preparing foods and local bans on the use of cooking with trans fats are some of the ways Massachusetts is promoting healthy eating
Figure 29 MA Businesses by Number of Employees
25
12
9 10
44
ge250 100-249 50-99 25-49 11-24
Source MDPH Worksite Health Improveshyment Survey 2008
Community assets that support healthy eating begin with easy access to freshand affordable food across all community venues At the municipal levelhaving a healthy food choice policy for municipally-owned buildings is a comshymon strategy implemented by Massachusetts cities and towns (Figure 28)
Appropriate strategies for worksites include providing access to healthier foods at on-site cafeterias in vending machines and at workplace meetings or events and providing point of purchase nutritional information for all foods sold
Twenty-one percent of Massachusetts businesses reported having written policies on healthy food choices However more than 40 of worksites reported actually offering employees access to fresh fruit and vegetables100 fruit juice low-salt foods fresh salads with low-fat dressings 1 or skim milk or fat-free or low-fat yogurt (Figure 28)
The percentage of businesses reporting access to healthy foods and policies to ensure healthy food choices was similar across regions However it varied by business size Businesses with fewer than 25 employees had the highest percentage reporting that they offer point of purchase nutrition information in cafeterias This group represents 44 of all MA businesses (Figure 29)In addition most businesses provide employees with access to a refrigeratormicrowave or both allowing for employees to prepare healthy foods on site
School systems are educating students about healthy eating behaviorsand creating policies to reduce access to junk food and unhealthy snacks24
Sixty-one percent of secondary schools in Massachusetts collect suggestions from students families and school staff on nutritious food preferences and approaches to encourage healthy eating More than half (535) of Masshysachusetts secondary schools provide information to students or families on the nutrition and caloric content of food available and 122 price nutrishytious food and beverages at a lower cost while increasing the price of less nutritious items24
Unfortunately disparities in access to affordable healthy foods exist21
Some communities address this by implementing policies that support healthy food choices in city- or town-owned facilities establishing proshygrams and incentives for grocery stores to locate in underserved areasencouraging smaller stores to carry affordable nutritious options and establishing local farmersrsquo markets Farmersrsquo markets are a great resource for purchasing healthy affordable and locally-grown foods
Though large areas of the western region are rural surprisingly this region of the state has a lower percentage of cities and towns that offer farmersrsquo
Community Assets | 43
Figure 210 Percent of Communities with Farmersrsquo Markets
North East 52
Western Boston Region Central 34 80 Metro West 43
45
South East 43
Massachusetts 38
Source Massachusetts Department of Agricultural Resources August 2009
markets compared to the state as a whole (34 of cities in the western region vs 38 of cities in the state) (Figure 210)
Conclusion
Community assets can play a significant role in the health and well-being of Massachusetts residents Access varies from region to region
Historically health care prevention and community planning have been thought of as separate domains operating independently In actuality they are synergistic18 Both the infrastructure of the health care system and the assets of a community play important roles in ensuring health Access to health care resources access to healthy foods and active living environshyments all contribute to the health of residents
By implementing policies systems and environmental changes at the state and local level we can strengthen the communities where people live work and play enhance opportunities for underserved communities and strengthen the infrastructure of the health care system all of which can lead to healthier communities and healthier individuals
44 | Health of Massachusetts
Policy Perspective Community Assets
Mary Bassett MD MPH Mailman School of Public Health Columbia University Former Deputy Commissioner for Health Promotion and Disease Prevention New York City Health Department
Resources necessary for a healthy life include families communities a range of services ndash including health services ndash and all levels of
our government ndash federal state and local We have come to take some of these resources for granted ndash clean water flows from our taps our food is free of microbes and other contaminants buildings are ventishylated and meet safety standards These are universal assets We expect them and become alarmed if deprived of them holding our government accountable for such failures But many assets are neither universal nor equally distributed among communities such as the opportunity for physical exercise at home work and school or ready access to healthy foods like fruits and vegetables that are nutrient dense as opposed to sugar-sweetened drinks that are energy-dense Access to appropriate timely and respectful medical care is key to health ndash and not yet univershysal To be truly available healthy choices must be affordable as well
This chapter offers a welcome practical approach to what may seem the difficult task of defining a healthy community and how to achieve it A first step is cataloging assets and their distribution ndash and asking ldquowhyrdquo Why shouldnrsquot all farmers markets accept WIC coupons What helps promote workplace support for bicycle storage etc How can we address shortages of primary care doctors in our communities
The question is how to make these changes A century ago governshyment used prerogatives such as regulation taxation legislation and policy intervention to help achieve better housing safe water and uncontaminated food Perhaps these will be useful tools again to help us solve the problems we face in the 21st century
Community Assets | 45
Policy Perspective Community Assets
Peter R Lee MPH Director Mass Partnership for Healthy Communities Health Resources in Action Inc
We get or lose our health in the community we live work or play in but we as a society tend to spend all our time and
resources talking about the medicalhealth care system as our source of health We treat people in hospitals and clinics then send them back into the community that often ldquocausedrdquo their problem in the first place It is no wonder that the US continues to have one of the poorest health status rates of industrialized nations
Access to medical care is important but for people to be healthy they need access to healthy environments healthy neighborhoods healthy homes etc We are a society that fixes things We train professionals especially in medical and human services to identify (diagnose) what is wrong and fix it Letrsquos make sure we widen our focus from treating individuals to treating the whole community that determines our health Both medicine and the community must be health-promoting in order for us to be as healthy as possible
This chapter highlights the concept of community assets ndash the things that help people be healthy Healthy people come from healthy communities with plentiful assets (safe environments healthy food housing jobs opportunities for recreation safety etc) Many unhealthy people come from communities that do not have access to these same assets
If we want a healthier population we need to focus more on those assets in a community that help make it easier for people to be healthy help people to make the healthy choices and make those choices easier for them to practice The authors lay out some imporshytant areas for moving forward for a truly population-based approach for healthy people in healthy communities
46 | Health of Massachusetts
Community Assets | 47
F I G U R E N O T E S Throughout this chapter the health care and physical resources per capita were based on 2007 US Census population estimates for Masshysachusetts cities and towns aggregated by regions and presented per 100000 population
Confidence intervals (CI) were calculated for all statistics presented To determine whether a regional statistic was higher or lower than the overshyall state level 95 confidence intervals were calculated and compared with that of the state unless noted otherwise If the regional lower 95 CI limit was higher than the upper 95 CI limit of the state rate then the regional rate was statistically higher than the state rate If the regional upper 95 CI limit was lower than the lower 95 CI limit of the state rate then the regional rate was statistically lower than the state rate If the confidence intervals overlapped the regional estimates were reported as similar to the state level and no further comparison was made
Figure 21 An acute care hospital is any hospital licensed under Section 51 of Chapter 111 and which contains a majority of medical-surgical pedishyatric obstetric and maternity beds as defined by the Massachusetts Department of Public Health
Figures 23 Physicians includes all full and licensed physicians with a Massachusetts 24 25 business address It should be noted that a certain percentage of full
and active licensed physicians with a Massachusetts business address do not practice clinical patient care or do not practice full time Many Massachusetts physicians also teach andor participate in research rather than provide clinical patient care Primary care physicians include general practice family medicine pediatrics internal medicine and OBGYN
Figure 26 Some HPSAs are designated by census tract only Primary Care and Dental HPSAs are determined based on federal guidelines set forth by the Health Resources and Services Administration (HRSA) HPSAs in develshyopmental stages are areas currently being evaluated by the Primary Care Office andor HRSA for shortages Applications are reviewed and submitshyted by the MDPH-Primary Care Office to the HRSA Bureau of Health Professions Shortage Designation Branch For specific guidelines http bhprhrsagovshortage Primary Care Office contact httpwwwmass govdphprimarycare
Figure 28 Overall response rate for community survey varied by region ranging from 48 to 80
48 | Health of Massachusetts
E N D N O T E S 1 Health of Boston 2009 Boston Public Health Commission Research and Evaluashy
tion Office Boston Massachusetts 2009 2 Cohen DA Mason K Bedimo A Scribner R Basolo V Farley TA Neighborhood
physical conditions and health AJPH 2003Mar90(3)467-471 3 Brennan Ramirez LK Baker EA Metzler M Promoting health equity A resource to
help communities address social determinants of health Atlanta GA US Department of Health and Human Services Centers for Disease Control and Prevention 2008
4 MacQueen KM McLellan E Metzger DS et al What is community An evidence-based definition for participatory public health AJPH 2001911929 ndash1938
5 Healthy Places Terminology Accessed August 20th 2009 Available at httpwww cdcgovhealthyplacesterminologyhtm
6 Kretzmann JP McKnight JL Building Communities from the Inside Out A Path Toward Finding and Mobilizing a Communityrsquos Assets Evanston IL ACTA Publications 1993
7 Goodman R Speers M McLeroy K et al Identifying and defining the dimensions of community capacity to provide a basis for measurement Health Education and Behavior 199825(3)258ndash278
8 Cottrell L The competent community In Kaplan B Wilson R Leighton A editors Further Explorations in Social Psychiatry New York NY Basic Books 1976
9 Promising practices in chronic disease prevention and control a public health framework for action Centers for Disease Control and Prevention Atlanta (GA) US Department of Health and Human Services 2003
10 Policy and environmental change New directions for public health Centers for Disshyease Control and Prevention Directors of Health Promotion and Education 2001 Available at httpwwwdhpeorghealthpolicyfinalreportpdf
11 Eppli MJ Tu CC Valuing the New Urbanism The Impact of the New Urbanism on Prices of Single-Family Homes Urban Land Institute 1999
12 Litman T Traffic Calming Benefits Costs and Equity Impacts Victoria Transport Policy Institute 1999
13 Srinivasan S OrsquoFallon LR Dearry A Creating healthy communities healthy homes healthy people Initiating a research agenda on the built environment and public health AJPH 2003931446ndash1450
14 Foundations for a Healthier Built Environment Provincial Health Services Authority 2009 Available at httpwwwphsacaNRrdonlyres76D687CF-6596-46FEshyAA9A-A536D61FB03832052PHSAreportHBEfoundationspdf
15 Shi L Starfield B Politzer R Regan J Primary care self-rated health and reductions in social disparities in health Health Services Research 200237(3)529ndash550
16 Shi L Macinko J Starfield B et al Primary care social inequalities and all-cause heart disease and cancer mortality in US counties 1990 AJPH 2005 95 4
17 Ku L Jones E Finnegan B Shin P Rosenbaum S How is the primary care safety net faring in Massachusetts Community health centers in the midst of health reform Washington DC Kaiser Commission on Medicaid and the Uninsured 2009
18 Cohen L Iton A Davis RA Rodriquez S A Time of Opportunity Local Solutions to Reduce Inequities in Health and Safety 2009 Available at httpwww preventioninstituteorgdocumentsIOMRoundTable_TimeofOpportunity_051409_ FINAL_000pdf
19 Metropolitan Area Planning Council Mixed Use Zoning A Citizenrsquos Guide Available at httpwwwtownbedfordmausindexphpplanning-publications
20 Community Guide Task Force on Community Preventive Services Promoting Physishycal Activity Centers for Disease Control and Prevention Available at httpwww thecommunityguideorgpaPhysical-Activitypdf
21 Strategies for Enhancing the Built Environment to Support Healthy Eating and Active Living Healthy Eating Active Living Convergence Partnership Prevention Institute 2008 Available athttpwwwpreventioninstituteorgdocumentsbuiltenvironmentpdf
22 Safe Routes National Center for Safe Routes to School Available at httpwww saferoutesinfoorgcontactsMAcfm
23 Promising Strategies for Creating Healthy Eating and Active Living Environments Healthy Eating Active Living Convergence Partnership Prevention Institute 2008 Available at httpwwwcommunity-wealthorg_pdfsarticles-publicationsanchors paper-lee-et-alpdf
24 Brener ND McManus T Foti K et al School Health Profiles 2008 Characteristics of Health Programs Among Secondary Schools Atlanta GA Centers for Disease Control and Prevention 2009
Community Assets | 49
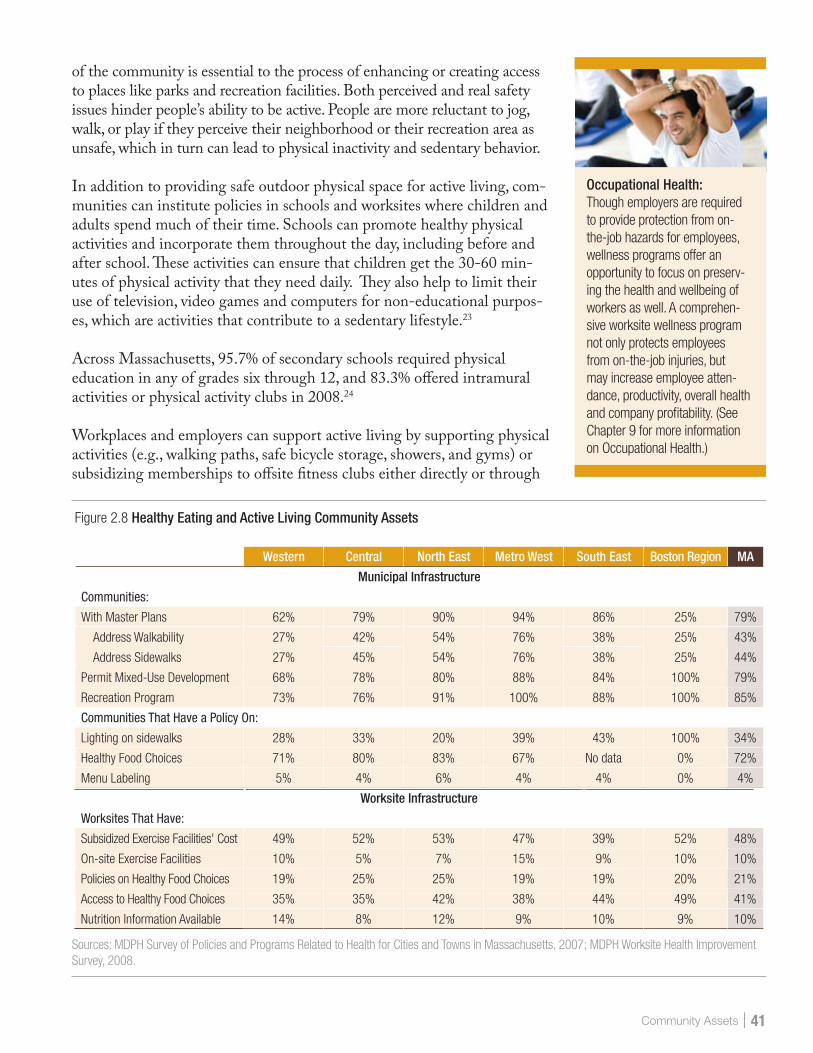
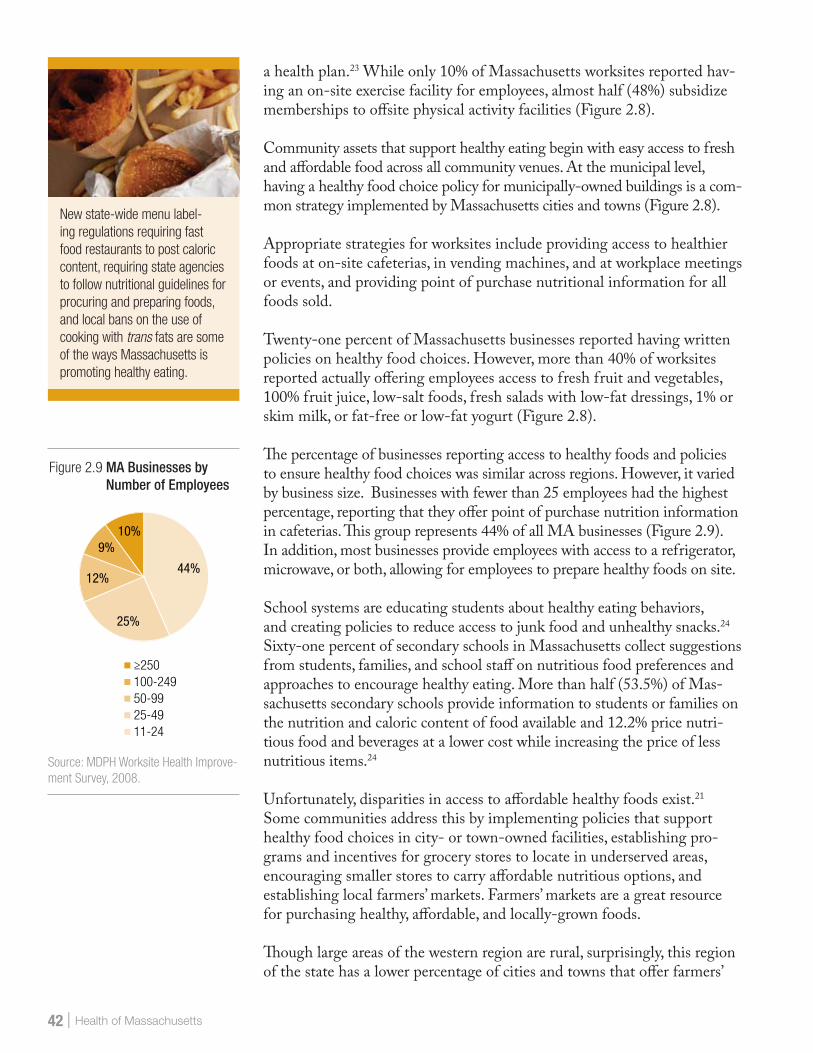