31st bse limited 25, p. j. towers, dalal street, ref
TRANSCRIPT
31st May, 2021
To,
BSE Limited,
25, P. J. Towers,
Dalal Street,
Mumbai – 400 001
Ref: Company Scrip Code: 532834
To,
The Manager,
Listing Department,
National Stock Exchange of India Ltd.,
Exchange Plaza, Bandra Kurla Complex,
Bandra (East), Mumbai‐ 400051
Ref: Symbol: CAMLINFINE || Series: EQ
Sub: Intimation pursuant to Regulation 30 of SEBI (Listing Obligations and Disclosure
Requirements) Regulations, 2015 ‐ (“SEBI LODR”) This is in continuation to our intimation dated May 30, 2021 in relation to the conference call with various domestic and international investors and analysts to discuss the financial results of the Company for the quarter and financial year ended March 31, 2021 (Q4) on May 31, 2021, please find enclosed herewith the revised earnings presentation made for the aforesaid call.
It is clarified that the presentation and the information contained therein does not constitute or form
part of an invitation or solicitation to offer to purchase or subscribe to any securities of the Company
in any jurisdiction. This presentation has been prepared for information purposes only. The
information contained in the earnings presentation is not to be taken as any recommendation made
by the Company or any other person to enter into any agreement with regard to any investment.
We request you to take the above on record and the same be treated as compliance under the
applicable Regulations of SEBI LODR.
Thanking You, Encl.: a/a. For Camlin Fine Sciences Limited
Mandar Godbole Company Secretary & Compliance Officer

EARNINGS PRESENTATION
FY21 / Q4-FY21
2
Snapshot
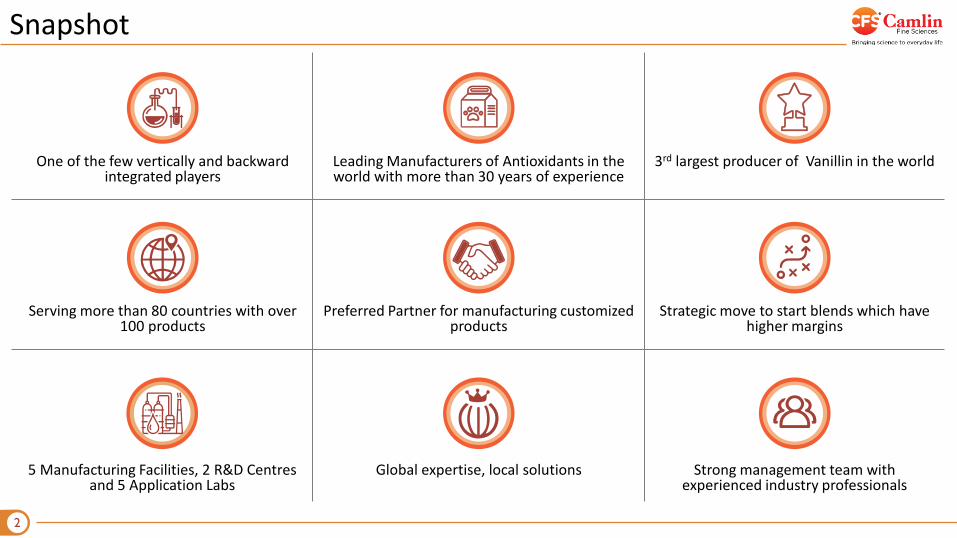
One of the few vertically and backward integrated players
Leading Manufacturers of Antioxidants in the world with more than 30 years of experience
3rd largest producer of Vanillin in the world
Serving more than 80 countries with over 100 products
Preferred Partner for manufacturing customized products
Strategic move to start blends which have higher margins
5 Manufacturing Facilities, 2 R&D Centres and 5 Application Labs
Global expertise, local solutions Strong management team with experienced industry professionals
3
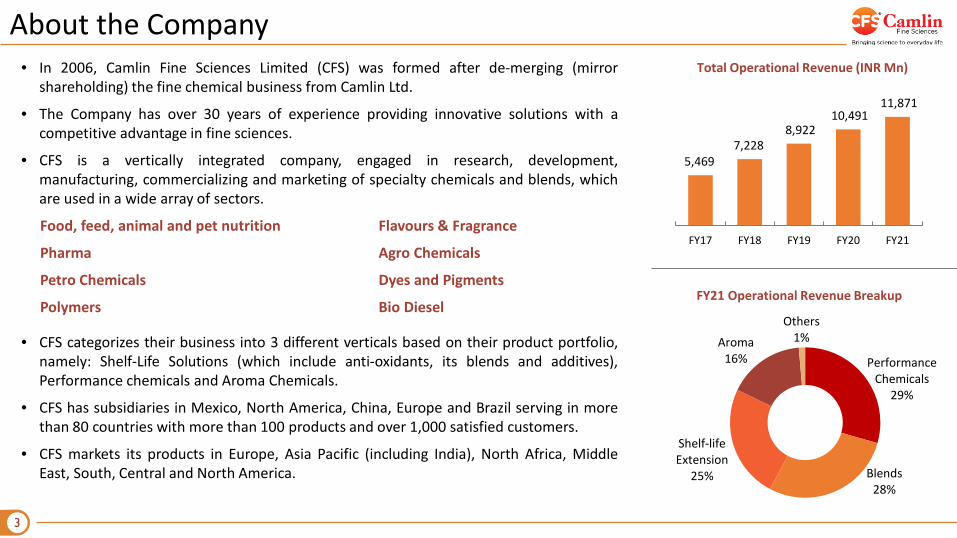
About the Company• In 2006, Camlin Fine Sciences Limited (CFS) was formed after de-merging (mirror
shareholding) the fine chemical business from Camlin Ltd.
• The Company has over 30 years of experience providing innovative solutions with acompetitive advantage in fine sciences.
• CFS is a vertically integrated company, engaged in research, development,manufacturing, commercializing and marketing of specialty chemicals and blends, whichare used in a wide array of sectors.
Food, feed, animal and pet nutrition Flavours & Fragrance
Pharma Agro Chemicals
Petro Chemicals Dyes and Pigments
Polymers Bio Diesel
• CFS categorizes their business into 3 different verticals based on their product portfolio,namely: Shelf-Life Solutions (which include anti-oxidants, its blends and additives),Performance chemicals and Aroma Chemicals.
• CFS has subsidiaries in Mexico, North America, China, Europe and Brazil serving in morethan 80 countries with more than 100 products and over 1,000 satisfied customers.
• CFS markets its products in Europe, Asia Pacific (including India), North Africa, MiddleEast, South, Central and North America.
5,469 7,228
8,922 10,491
11,871
FY17 FY18 FY19 FY20 FY21
Performance Chemicals
29%
Blends28%
Shelf-life Extension
25%
Aroma16%
Others1%
FY21 Operational Revenue Breakup
Total Operational Revenue (INR Mn)

FY21 / Q4-FY21 FINANCIAL OVERVIEW
5
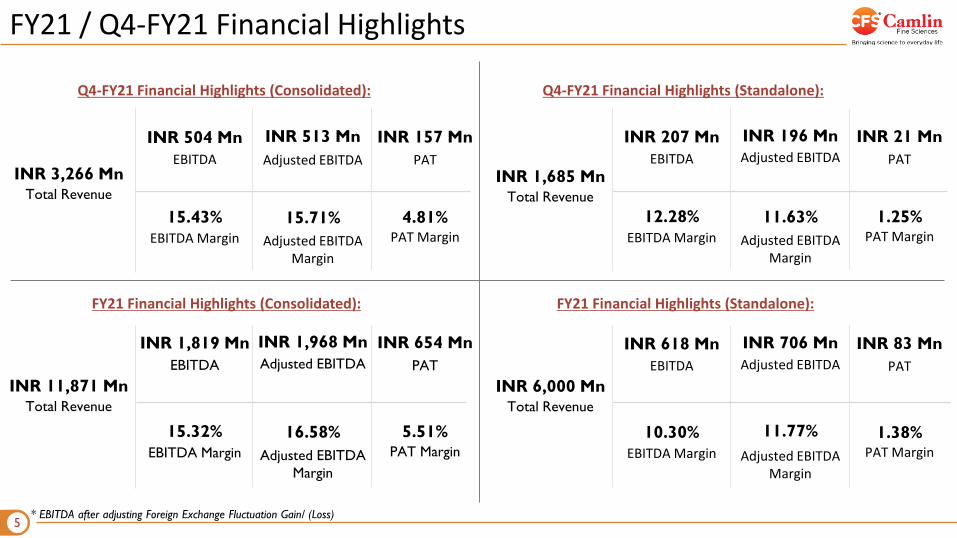
FY21 / Q4-FY21 Financial Highlights
* EBITDA after adjusting Foreign Exchange Fluctuation Gain/ (Loss)
Q4-FY21 Financial Highlights (Consolidated):
FY21 Financial Highlights (Consolidated):
Q4-FY21 Financial Highlights (Standalone):
FY21 Financial Highlights (Standalone):
INR 3,266 MnTotal Revenue
INR 504 MnEBITDA
INR 513 Mn
Adjusted EBITDA Margin
15.43%
INR 157 Mn
4.81%EBITDA Margin
PAT
PAT Margin15.71%
Adjusted EBITDA
INR 11,871 MnTotal Revenue
INR 1,819 MnEBITDA
INR 1,968 Mn
Adjusted EBITDA Margin
15.32%
INR 654 Mn
5.51%EBITDA Margin
PAT
PAT Margin
INR 1,685 MnTotal Revenue
INR 207 MnEBITDA
INR 196 Mn
Adjusted EBITDA Margin
12.28%
INR 21 Mn
1.25%EBITDA Margin
PAT
PAT Margin
INR 6,000 MnTotal Revenue
INR 618 MnEBITDA
INR 706 Mn
Adjusted EBITDA Margin
10.30%
INR 83 Mn
1.38%EBITDA Margin
PAT
PAT Margin16.58%
11.63%
11.77%
Adjusted EBITDA
Adjusted EBITDA
Adjusted EBITDA

6
Operational Highlights (Consolidated)Quarter:• Operating revenue grew buoyed by the sustained growth and in spite of restriction of manufacture ofVanillin in Chinese facility• Dahej Diphenol Plant achieved 65% capacity utilisation in the quarter
• Output being balanced to suit business needs with the goal of maximisation of yields• Scaling up to optimum capacity in Q2-FY22
• Gross margins Q-o-Q impacted by 450 Bps due to increase in raw material and supply chain costs – lag of one quarter for passing costto the customers
• Other Expenses : One off savings on Selling costs INR 15 Mn, savings of expenses on repair INR 27 Mn in CFS Europe & EffluentTreatment INR 20 Mn in China, and reduction in foreign exchange loss of INR 10 Mn
• Other comprehensive income includes INR 1002.2 Mn on account of revaluation of assets in CFS Europe - Tax advantage on additionaldepreciation in future years
Annual:• Robust growth in Operating Revenues in spite of COVID pandemic• Increase in gross margins to 50.85% from 49.12%• Year onYear improvement in
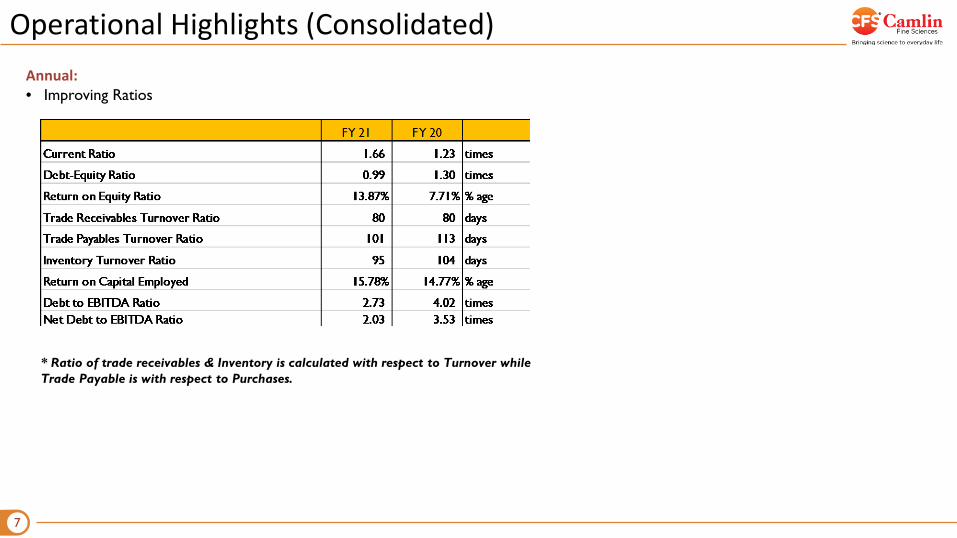
• Debt to EBITDA Ratio to 2.73 from 4.02• Net Debt to EBITDA Ratio to 2.03 from 3.53
• Capital Investment program in EthylVanillin plant at Dahej on track, moderate delays expected due to current COVID and cyclone• Owners’ Profit increases to INR 509.6 Mn from INR 303.2 MnFinancial Results for the financial year ended March 31, 2021 are audited by Kalyaniwalla & Mistry LLP (Network firm of Mazars)
7
Operational Highlights (Consolidated)Annual:• Improving Ratios
* Ratio of trade receivables & Inventory is calculated with respect to Turnover while Trade Payable is with respect to Purchases.

8
Q4-FY21 Consolidated Income Statement (Ind-AS)
* EBITDA after adjusting Foreign Exchange Fluctuation Gain/ (Loss)
Income Statement (INR Mn) Q4-FY21 Q3-FY21 Q-o-Q Q4-FY20 Y-o-YOperational Revenue 3,266 2,979 9.6% 2,929 11.5%
Total Expenses 2,762 2,511 10.0% 2,586 6.8%
Operational EBITDA 504 468 7.7% 343 46.9%
Operational EBITDA Margins (%) 15.43% 15.71% (28) Bps 11.71% 372 Bps
Adjusted EBITDA* 513 487 5.3% 343 49.6%
Adjusted EBITDA Margins (%) 15.71% 16.35% (64) Bps 11.71% 400 Bps
Other Income 21 11 90.9% 28 (25)%
Depreciation 118 134 (11.9)% 92 28.3%
Finance Cost 121 67 80.6% 152 (20.4)%
Share of profit/ loss of associate - - - - -
PBT 286 278 2.9% 127 NA
Tax 129 84 53.6% 106 21.7%
Profit After Tax 157 194 (19.1)% 21 NA
PAT Margins (%) 4.81% 6.51% (170) Bps 0.72% 409 Bps
Other Comprehensive Income 930 116 NA 45 NA
Total Comprehensive Income 1,087 310 NA 66 NA
Diluted EPS (INR) 1.03 1.15 (10.4)% 0.22 NA

9
FY21 Consolidated Income Statement (Ind-AS)
* EBITDA after adjusting Foreign Exchange Fluctuation Gain/ (Loss)
Income Statement (Mn) FY21 FY20 Y-o-YOperational Revenue 11,871 10,491 13.2%
Total Expenses 10,052 9,184 9.5%
Operational EBITDA 1,819 1,307 39.2%
Operational EBITDA Margins (%) 15.32% 12.46% 286 Bps
Adjusted EBITDA* 1,968 1,307 50.6%
Adjusted EBITDA Margins (%) 16.58% 12.46% 412 Bps
Other Income 50 34 47.1%
Depreciation 443 328 35.1%
Finance Cost 375 431 (13.0)%
Share of Profit/loss of associates - - -
PBT 1,051 582 80.6%
Tax 397 284 39.8%
Profit After tax 654 298 NA
PAT Margins (%) 5.51% 2.84% 267 Bps
Other Comprehensive Income 1,135 13 NA
Total Comprehensive Income 1,789 311 NA
Diluted EPS (INR) 3.68 2.50 47.2%

10
Consolidated Balance Sheet PARTICULARS (INR Mn) FY20 FY21
EQUITY 4,601 7,131
a) Equity Share Capital 121 127
b) Other Equity 3,910 6,307
c) Non-Controlling Interest 570 697LIABILITIES
Non-Current Liabilities 2,261 2,907Financial Liabilities
a) Borrowings 2,115 2,732
b) Lease Liabilities 97 84
c) Provisions 28 28
d) Deferred Tax Liabilities (Net) 21 63
Current Liabilities 5,478 4,778a) Financial Liabilities
(i) Borrowings 2,781 2,169
(ii) Trade Payables 1,737 1,584
(iii) Lease liabilities 33 37
(iii) Other Financial Liabilities 672 687
b)Other Current Liabilities 110 202
c) Provisions 79 96
d)Current Tax Liabilities (Net) 66 3
GRAND TOTAL - EQUITIES & LIABILITES 12,340 14,816
PARTICULARS (INR Mn) FY20 FY21Non-Current Assets 5,591 6,869a) Property, Plant and Equipment 2,034 4,818b) Capital Work In Progress 1,761 237c) Right-Of-Use Assets 338 313d) Investment Property 21 21e) Goodwill 444 444f) Intangible Assets 221 240g) Intangible Assets under Development 27 1h) Investment in Associate 1 1i) Financial Assets
(i) Investments 72 72(ii) Loans 123 133(iii) Other Financial Assets 0 1
j) Deferred tax assets (Net) 407 330k) Income Tax Assets 66 87l) Other Non-Current assets 76 171
Current Assets 6,749 7,947a) Inventories 2,981 3,200b) Financial Assets
(i) Investments - -(ii) Trade Receivables 2,528 2,707(iii) Cash and Cash Equivalents 524 755(iv) Other Bank balances 124 628(v) Loans 11 10(vi) Other financial assets 117 101
c) Other Current Assets 464 546GRAND TOTAL – ASSETS 12,340 14,816

11
Q4-FY21 Standalone Income Statement (Ind-AS)
* EBITDA after adjusting Foreign Exchange Fluctuation Gain/ (Loss)
Income Statement (Mn) Q4-FY21 Q3-FY21 Q-o-Q Q4-FY20 Y-o-Y
Operational Revenue 1,685 1,636 3.0% 1,395 20.8%
Total Expenses 1,488 1,457 1.4% 1,256 17.7%
Operational EBITDA 197 179 15.6% 139 48.9%
Operational EBITDA Margins (%) 11.63% 10.94% 134 Bps 9.96% 232 Bps
Adjusted EBITDA* 197 203 (3.5)% 139 41.0%
Adjusted EBITDA Margins (%) 11.63% 12.41% (78) Bps 9.96% 167 Bps
Other Income 27 14 21.4% 157 (89.2)%
Depreciation 66 63 4.8% 30 120.0%
Finance Cost 99 81 22.2% 68 45.6%
Exceptional Items - - - - -
PBT 59 49 20.4% 198 (70.2)%
Tax 38 15 NA 33 15.2%
Profit After tax 21 34 (38.2)% 165 (87.3)%
PAT Margins (%) 1.25% 2.08% (83) Bps 11.83% NA
Other Comprehensive Income (3) (1) NA 4 NA
Total Comprehensive Income 18 33 (45.5)% 169 (89.3)%
Diluted EPS (INR) 0.15 0.25 (40)% 1.36 (89)%
12
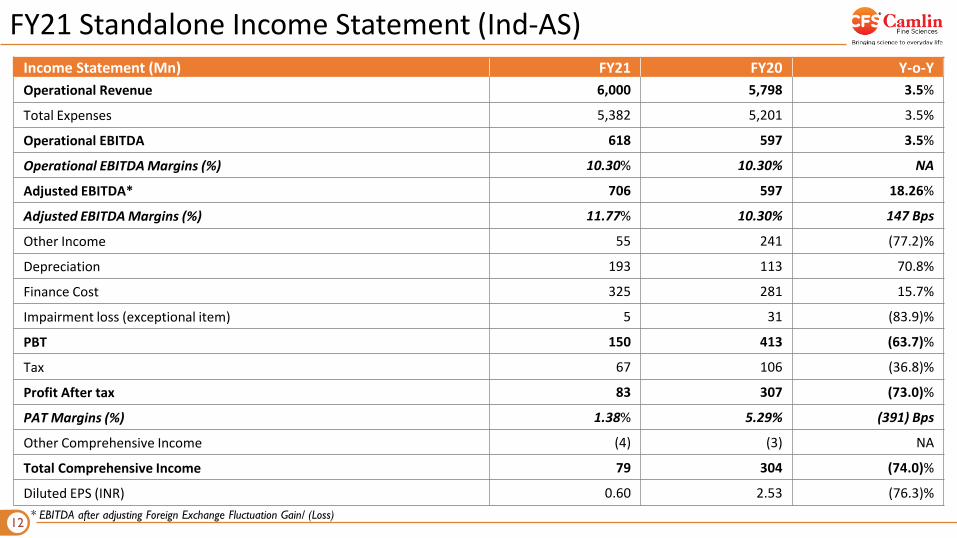
FY21 Standalone Income Statement (Ind-AS)
* EBITDA after adjusting Foreign Exchange Fluctuation Gain/ (Loss)
Income Statement (Mn) FY21 FY20 Y-o-YOperational Revenue 6,000 5,798 3.5%
Total Expenses 5,382 5,201 3.5%
Operational EBITDA 618 597 3.5%
Operational EBITDA Margins (%) 10.30% 10.30% NA
Adjusted EBITDA* 706 597 18.26%
Adjusted EBITDA Margins (%) 11.77% 10.30% 147 Bps
Other Income 55 241 (77.2)%
Depreciation 193 113 70.8%
Finance Cost 325 281 15.7%
Impairment loss (exceptional item) 5 31 (83.9)%
PBT 150 413 (63.7)%
Tax 67 106 (36.8)%
Profit After tax 83 307 (73.0)%
PAT Margins (%) 1.38% 5.29% (391) Bps
Other Comprehensive Income (4) (3) NA
Total Comprehensive Income 79 304 (74.0)%
Diluted EPS (INR) 0.60 2.53 (76.3)%

13
Standalone Balance SheetParticulars (INR Mn) FY20 FY21EQUITY 3,768 4,646a) Equity Share Capital 121 127b) Other Equity 3,647 4,519c) Non-Controlling Interest - -
LIABILITIES 1,240 1,763Non-Current LiabilitiesFinancial Liabilitiesa) Borrowings 1,130 1,627b) Lease Liabilities 50 41c) Provisions 28 28d) Deferred Tax Liabilities (Net) 21 63e) Other Non-Current Liabilities 11 4Current Liabilities 3,905 4,258a) Financial Liabilities
(i) Borrowings 2,184 2,007(ii) Trade Payables 1,330 1,929(iii) Other Financial Liabilities 250 216(iv) Lease Liabilities 10 12
b) Other Current Liabilities 61 83c) Provisions 4 10d) Current Tax Liabilities (Net) 66 1GRAND TOTAL - EQUITIES & LIABILITES 8,913 10,667
Particulars (INR Mn) FY20 FY21Non-Current Assets 3,802 4,087a) Property, Plant and Equipment 686 2,457b) Capital Work In Progress 1,742 184c) Right-Of-Use Assets 246 227d) Investment Property 21 21e) Other Intangible Assets 4 232f) Intangible Assets under Development 240 -g) Financial Assets
(i) Investments 740 736(ii) Loans 36 31(iii) Other Financial Assets - 1
h) Deferred tax assets (Net) - -i) Income Tax Assets 33 44j) Other Non-Current assets 54 154
Current Assets 5,112 6,580a) Inventories 972 1,314b) Financial Assets
(i) Investments - -(ii) Trade Receivables 3,235 3,682(iii) Cash and Cash Equivalents 7 188(iv) Other Bank balances 124 628(v) Loans 301 299(vi) Other financial assets 235 207
c) Other Current Assets 237 262GRAND TOTAL – ASSETS 8,913 10,667

COUNTRY OVERVIEW

15
Country Wise Quarterly PerformanceCFS India CFS Mexico CFS Europe
Qua
rter
ly O
pera
tiona
l R
even
ue (I
NR
Mn)
Qua
rter
ly O
pera
tiona
l R
even
ue (I
NR
Mn)
CFS Brazil CFS Wanglong CFS North America
748 710 695
Q4-FY20 Q3-FY21 Q4-FY21
1,395 1,636 1,685
Q4-FY20 Q3-FY21 Q4-FY21
739 697
996
Q4-FY20 Q3-FY21 Q4-FY21
176 183
218
Q4-FY20 Q3-FY21 Q4-FY21
291
570
347
Q4-FY20 Q3-FY21 Q4-FY21
76 79 70
Q4-FY20 Q3-FY21 Q4-FY21

16
Country Wise Yearly Performance
3,376 4,050
5,481 5,798 6,000
FY17 FY18 FY19 FY20 FY21
CFS India
1,210 1,642
2,172 2,571 2,735
FY17 FY18 FY19 FY20 FY21
CFS Mexico
2,216 2,771
3,296 3,091
3,762
FY17 FY18 FY19 FY20 FY21
CFS Europe
Ope
ratio
nal R
even
ue(IN
R M
n)O
pera
tiona
l Rev
enue
(INR
Mn)
172 252
411
618 717
FY17 FY18 FY19 FY20 FY21
CFS Brazil
1,345
1,765 1,817
FY19 FY20 FY21
CFS Wanglong CFS North America
109 178
236
386 334
-
100
200
300
400
500
FY17 FY18 FY19 FY20 FY21

HISTORICAL FINANCIAL OVERVIEW
18
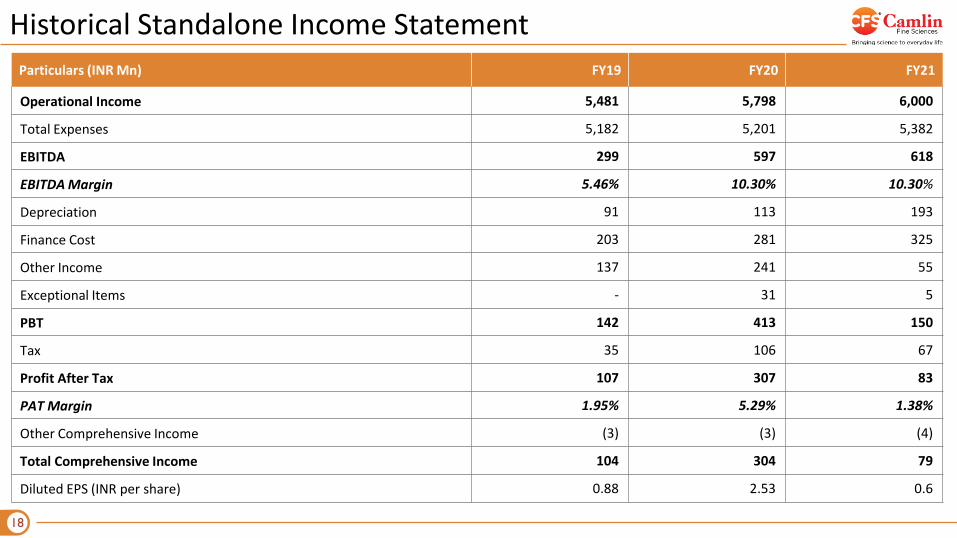
Historical Standalone Income StatementParticulars (INR Mn) FY19 FY20 FY21
Operational Income 5,481 5,798 6,000
Total Expenses 5,182 5,201 5,382
EBITDA 299 597 618
EBITDA Margin 5.46% 10.30% 10.30%
Depreciation 91 113 193
Finance Cost 203 281 325
Other Income 137 241 55
Exceptional Items - 31 5
PBT 142 413 150
Tax 35 106 67
Profit After Tax 107 307 83
PAT Margin 1.95% 5.29% 1.38%
Other Comprehensive Income (3) (3) (4)
Total Comprehensive Income 104 304 79
Diluted EPS (INR per share) 0.88 2.53 0.6
19
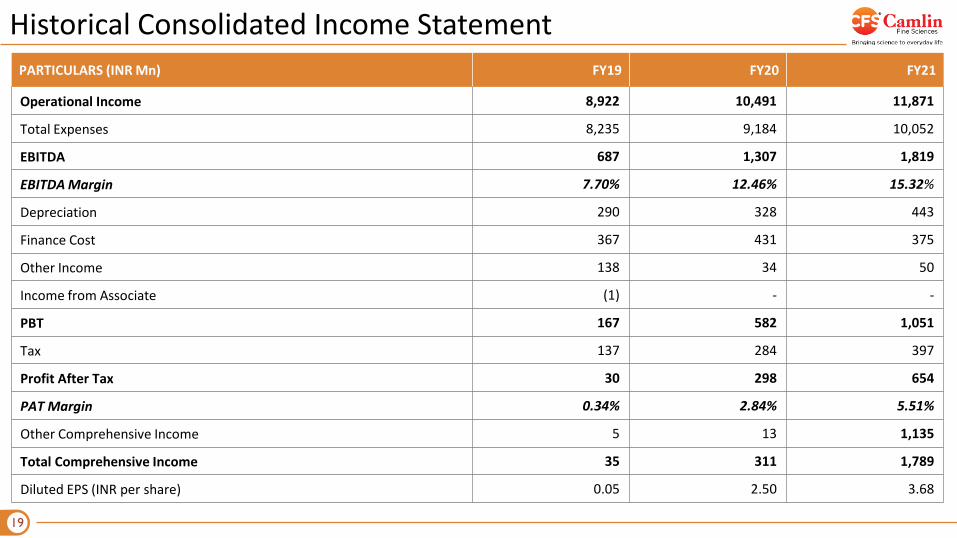
Historical Consolidated Income StatementPARTICULARS (INR Mn) FY19 FY20 FY21
Operational Income 8,922 10,491 11,871
Total Expenses 8,235 9,184 10,052
EBITDA 687 1,307 1,819
EBITDA Margin 7.70% 12.46% 15.32%
Depreciation 290 328 443
Finance Cost 367 431 375
Other Income 138 34 50
Income from Associate (1) - -
PBT 167 582 1,051
Tax 137 284 397
Profit After Tax 30 298 654
PAT Margin 0.34% 2.84% 5.51%
Other Comprehensive Income 5 13 1,135
Total Comprehensive Income 35 311 1,789
Diluted EPS (INR per share) 0.05 2.50 3.68

20
Consolidated Financial Highlights
5,4697,228
8,92210,491
11,871
- 2,000 4,000 6,000 8,000
10,000 12,000 14,000
FY17 FY18 FY19 FY20 FY21
Operational Revenue (INR Mn)
282126
687
1,307
1,819
5.16%
1.74%
7.70%
12.46%
15.32%
0.00%2.00%4.00%6.00%8.00%10.00%12.00%14.00%16.00%18.00%
- 300 600 900
1,200 1,500 1,800 2,100
FY17 FY18 FY19 FY20 FY21
EBITDA (INR Mn) & EBITDA Margin (%)
Net Debt to Equity
1.19
0.770.95 1.03
0.56
-0.10.10.30.50.70.91.11.31.5
FY17 FY18 FY19 FY20 FY21
2,126
3,7124,303 4,601
7,131
- 1,000 2,000 3,000 4,000 5,000 6,000 7,000 8,000
FY17 FY18 FY19 FY20 FY21
Net Worth (INR Mn)

21
Capital Markets
Promoters21.62%
FPI4.71%
DII20.21%
Public53.46%
Price Data (31st March, 2021) INR
Face Value 1.0
Market Price 139.8
52 Week H/L 160.7/35.5
Market Cap (Mn) 17,824.3
Equity Shares Outstanding (Mn) 127.5
1 Year Avg Trading Volume (‘000) 694.3
Shareholding Pattern as on 31st March, 2021
-50%
0%
50%
100%
150%
200%
250%
300%
Apr-20 May-20 Jun-20 Jul-20 Aug-20 Sep-20 Oct-20 Nov-20 Dec-20 Jan-21 Feb-21 Mar-21
Sensex Camlin

22
DisclaimerCamlin Fine Sciences LimitedNo representation or warranty, express or implied, is made as to, and no reliance should be placed on, the fairness, accuracy, completeness or correctness of the information or opinions contained in thispresentation. Such information and opinions are in all events not current after the date of this presentation. Certain statements made in this presentation may not be based on historical information or facts and maybe "forward looking statements" based on the currently held beliefs and assumptions of the management of Camlin Fine Science Limited, which are expressed in good faith and in their opinion reasonable, includingthose relating to the Company’s general business plans and strategy, its future financial condition and growth prospects and future developments in its industry and its competitive and regulatory environment.
Forward-looking statements involve known and unknown risks, uncertainties and other factors, which may cause the actual results, financial condition, performance or achievements of the Company or industryresults to differ materially from the results, financial condition, performance or achievements expressed or implied by such forward-looking statements, including future changes or developments in the Company’sbusiness, its competitive environment and political, economic, legal and social conditions. Further, past performance is not necessarily indicative of future results. Given these risks, uncertainties and other factors,viewers of this presentation are cautioned not to place undue reliance on these forward-looking statements. The Company disclaims any obligation to update these forward-looking statements to reflect futureevents or developments.
This presentation is for general information purposes only, without regard to any specific objectives, financial situations or informational needs of any particular person. This presentation does not constitute an offeror invitation to purchase or subscribe for any securities in any jurisdiction, including the United States. No part of it should form the basis of or be relied upon in connection with any investment decision or anycontract or commitment to purchase or subscribe for any securities. None of our securities may be offered or sold in the United States, without registration under the U.S. Securities Act of 1933, as amended, orpursuant to an exemption from registration there from.
This presentation is confidential and may not be copied or disseminated, in whole or in part, and in any manner.
Valorem Advisors Disclaimer:Valorem Advisors is an Independent Investor Relations Management Service company. This Presentation has been prepared by Valorem Advisors based on information and data which the Company considersreliable, but Valorem Advisors and the Company makes no representation or warranty, express or implied, whatsoever, and no reliance shall be placed on, the truth, accuracy, completeness, fairness andreasonableness of the contents of this Presentation. This Presentation may not be all inclusive and may not contain all of the information that you may consider material. Any liability in respect of the contents of, orany omission from, this Presentation is expressly excluded.
Valorem Advisors also hereby certifies that the directors or employees of Valorem Advisors do not own any stock in personal or company capacity of the Company under review.
For further details, please feel free to contact our Investor Relations Representatives:
Mr. Anuj SonpalValorem AdvisorsTel: +91-22-4903 9500Email: [email protected]