313 buhler - kansas state department of education finance/budget/budget_at_a_glance/1… · 313...
TRANSCRIPT

313 - Buhler

i
Budget General Information (characteristics of district)
Supplemental Information for Tables in Summary of Expenditures
KSDE Website Information Available
Summary of Expenditures (Sumexpen.xls)

1
2011-2012 Budget General Information
USD #: 313
Introduction There are six attendance centers in operation in Buhler USD 313. Elementary schools include
Union Valley Elementary School (early education through third grade); Prosperity Elementary
School (fourth through sixth grade); Obee Elementary School (early education through sixth
grade); and Buhler Grade (early education through sixth grade). All students in grades seven and
eight attend Prairie Hills Middle School, with Buhler High School housing grades nine through
twelve.
The Burkholder Administration Center is located in Buhler. The school district employs 333
persons; 161 licensed teachers and administrators and 172 classified employees, including
clerical, food service, transportation, custodial and maintenance.
Board Members Vernon Goerl, President (620) 665-5620 [email protected] 4200 N. Vicksburg Hutchinson, KS 67502 Laura Meyer Dick, Vice-President (620) 474-6770 [email protected] 4805 East 28th Hutchinson, KS 67502 Bolton, Marilyn (Larry) (620) 921-0150 [email protected] 2805 N. Meadowlake Hutchinson, KS 67502 Lackey, Greg (Kelly) (620) 960-2027 [email protected] 4901 North Halstead Hutchinson, KS 67502 McCabe, Matt (Trissa) (785) 532-8970 [email protected] P.O. Box 90 Buhler, KS 67522 Suiter, Dale (Jackie) (316) 708-4654 [email protected] 6617 East 69th Buhler, KS 67522 Wray, Cliff (Jan) (620) 200-3740 [email protected] 6521 North Plum Hutchinson, KS 67502
Key Staff Superintendent: Dr. Dan Stiffler
Associate or Assistant Superintendents:
Business Manager: Todd Stephenson

2
The District’s Accomplishments and Challenges
Accomplishments: 2011 KTOY Finalist
37 Standards of Excellence district-wide
2011 National Blue Ribbon School
Challenges: Declines in state funding
Larger class sizes
Administrators supervising more than one school

3
Supplemental Information for the Following Tables
1. Summary of Total Expenditures by Function (All Funds)
2. Summary of General Fund Expenditures by Function
3. Summary of Supplemental General Fund Expenditures by Function
4. Summary of General and Supplemental General Fund Expenditures by Function
5. Summary of Special Education Fund by Function
6. Instruction Expenditures (1000)
7. Student and Instructional Support Expenditures (2100 & 2200)
8. General Administration Expenditures (2300)
9. School Administration Expenditures (2400)
10. Operations and Maintenance Expenditures (2600)
11. Other Costs (2500 & 2900: Other Supplemental Services) (3000: Non-Instruction Services)
12. Capital Improvements (4000)
13. Debt Services (5000)
14. Miscellaneous Information - Transfers
15. Miscellaneous Information Unencumbered Cash Balance by Fund
16. Reserve Funds Unencumbered Cash Balance
17. Other Information - FTE
18. Miscellaneous Information Mill Rates by Fund
19. Other Information – Assessed Valuation and Bonded Indebtedness
Note: The FTE (full time equivalency) used in this report to calculate the “Amount Per
Pupil” is defined as following: Enrollment (FTE) includes the enrollment of the district
used for state aid and budget authority, and all other preschool enrollment and kindergarten
students attending full time.

4
KSDE Website Information Available
K-12 Statistics (Building, District or State Totals)
http://svapp15586.ksde.org/k12/k12.aspx
Attendance / Enrollment Reports
Staff Reports
Graduates / Dropouts Reports
Crime / Violence Reports
School Finance Reports and Publications
http://www.ksde.org/Default.aspx?tabid=1870
Certified Personnel
Enrollment
Dropouts
Graduates
Salary Reports
Kansas Building Report Card
http://svapp15586.ksde.org/rcard/
Attendance Rate
Graduation Rate
Dropout Rate
School Violence
Assessments
o Reading
o Mathematics
o Writing
Graduates Passing Adv. Science Courses
Graduates Passing Adv. Math Courses
USD# 313
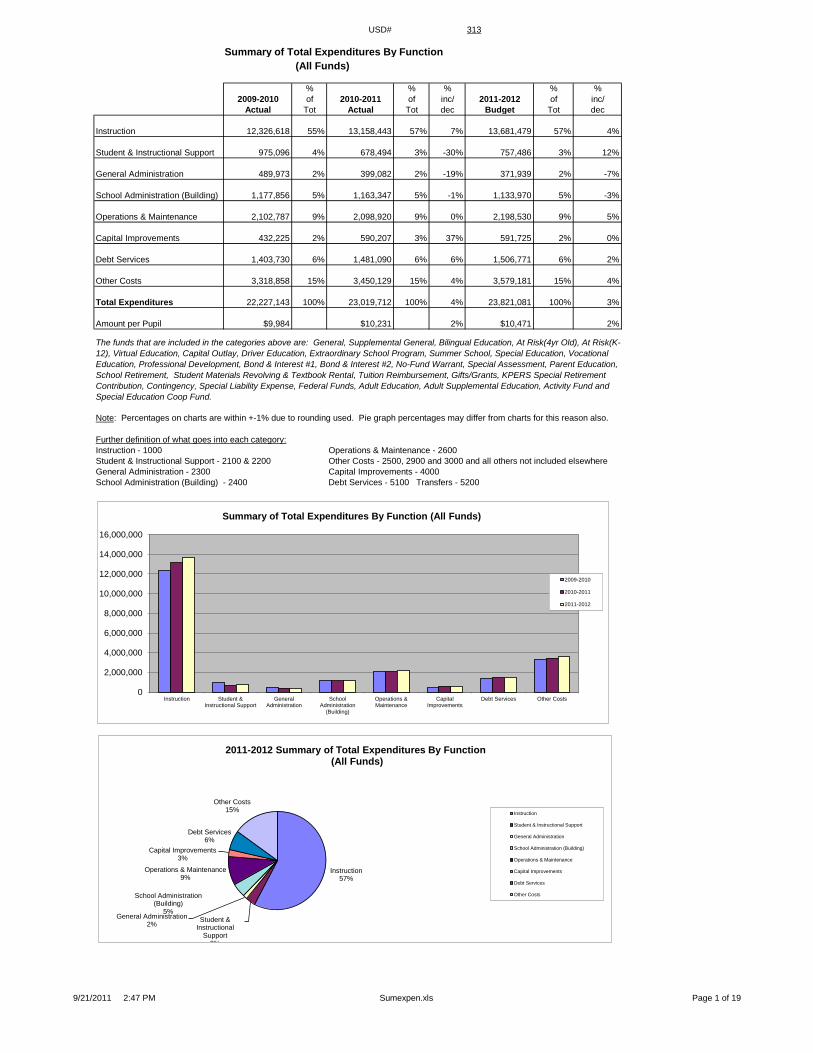
Summary of Total Expenditures By Function
(All Funds)
% % % % %
2009-2010 of 2010-2011 of inc/ 2011-2012 of inc/
Actual Tot Actual Tot dec Budget Tot dec
Instruction 12,326,618 55% 13,158,443 57% 7% 13,681,479 57% 4%
Student & Instructional Support 975,096 4% 678,494 3% -30% 757,486 3% 12%
General Administration 489,973 2% 399,082 2% -19% 371,939 2% -7%
School Administration (Building) 1,177,856 5% 1,163,347 5% -1% 1,133,970 5% -3%
Operations & Maintenance 2,102,787 9% 2,098,920 9% 0% 2,198,530 9% 5%
Capital Improvements 432,225 2% 590,207 3% 37% 591,725 2% 0%
Debt Services 1,403,730 6% 1,481,090 6% 6% 1,506,771 6% 2%
Other Costs 3,318,858 15% 3,450,129 15% 4% 3,579,181 15% 4%
Total Expenditures 22,227,143 100% 23,019,712 100% 4% 23,821,081 100% 3%
Amount per Pupil $9,984 $10,231 2% $10,471 2%
Note: Percentages on charts are within +-1% due to rounding used. Pie graph percentages may differ from charts for this reason also.
Further definition of what goes into each category:
Instruction - 1000 Operations & Maintenance - 2600
Student & Instructional Support - 2100 & 2200 Other Costs - 2500, 2900 and 3000 and all others not included elsewhere
General Administration - 2300 Capital Improvements - 4000
School Administration (Building) - 2400 Debt Services - 5100 Transfers - 5200
The funds that are included in the categories above are: General, Supplemental General, Bilingual Education, At Risk(4yr Old), At Risk(K-
12), Virtual Education, Capital Outlay, Driver Education, Extraordinary School Program, Summer School, Special Education, Vocational
Education, Professional Development, Bond & Interest #1, Bond & Interest #2, No-Fund Warrant, Special Assessment, Parent Education,
School Retirement, Student Materials Revolving & Textbook Rental, Tuition Reimbursement, Gifts/Grants, KPERS Special Retirement
Contribution, Contingency, Special Liability Expense, Federal Funds, Adult Education, Adult Supplemental Education, Activity Fund and
Special Education Coop Fund.
0
2,000,000
4,000,000
6,000,000
8,000,000
10,000,000
12,000,000
14,000,000
16,000,000
Instruction Student &Instructional Support
GeneralAdministration
SchoolAdministration
(Building)
Operations &Maintenance
CapitalImprovements
Debt Services Other Costs
Summary of Total Expenditures By Function (All Funds)
2009-2010
2010-2011
2011-2012
Instruction 57%
Student & Instructional
Support 3%
General Administration 2%
School Administration (Building)
5%
Operations & Maintenance 9%
Capital Improvements 3%
Debt Services 6%
Other Costs 15%
2011-2012 Summary of Total Expenditures By Function (All Funds)
Instruction
Student & Instructional Support
General Administration
School Administration (Building)
Operations & Maintenance
Capital Improvements
Debt Services
Other Costs
9/21/2011 2:47 PM Sumexpen.xls Page 1 of 19
USD# 313
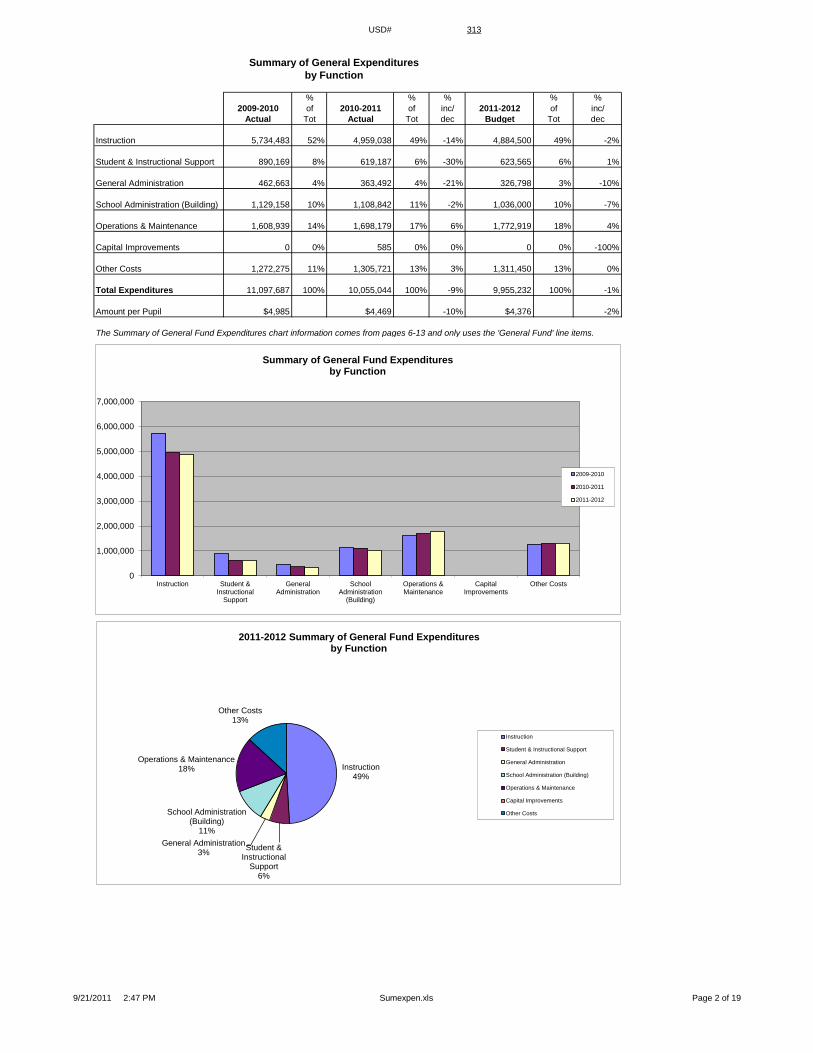
Summary of General Expenditures
by Function
% % % % %
2009-2010 of 2010-2011 of inc/ 2011-2012 of inc/
Actual Tot Actual Tot dec Budget Tot dec
Instruction 5,734,483 52% 4,959,038 49% -14% 4,884,500 49% -2%
Student & Instructional Support 890,169 8% 619,187 6% -30% 623,565 6% 1%
General Administration 462,663 4% 363,492 4% -21% 326,798 3% -10%
School Administration (Building) 1,129,158 10% 1,108,842 11% -2% 1,036,000 10% -7%
Operations & Maintenance 1,608,939 14% 1,698,179 17% 6% 1,772,919 18% 4%
Capital Improvements 0 0% 585 0% 0% 0 0% -100%
Other Costs 1,272,275 11% 1,305,721 13% 3% 1,311,450 13% 0%
Total Expenditures 11,097,687 100% 10,055,044 100% -9% 9,955,232 100% -1%
Amount per Pupil $4,985 $4,469 -10% $4,376 -2%
The Summary of General Fund Expenditures chart information comes from pages 6-13 and only uses the 'General Fund' line items.
0
1,000,000
2,000,000
3,000,000
4,000,000
5,000,000
6,000,000
7,000,000
Instruction Student &Instructional
Support
GeneralAdministration
SchoolAdministration
(Building)
Operations &Maintenance
CapitalImprovements
Other Costs
Summary of General Fund Expenditures by Function
2009-2010
2010-2011
2011-2012
Instruction 49%
Student & Instructional
Support 6%
General Administration 3%
School Administration (Building)
11%
Operations & Maintenance 18%
Other Costs 13%
2011-2012 Summary of General Fund Expenditures by Function
Instruction
Student & Instructional Support
General Administration
School Administration (Building)
Operations & Maintenance
Capital Improvements
Other Costs
9/21/2011 2:47 PM Sumexpen.xls Page 2 of 19

USD# 313
Summary of Supplemental General Fund Expenditures
by Function
% % % % %
2009-2010 of 2010-2011 of inc/ 2011-2012 of inc/
Actual Tot Actual Tot dec Budget Tot dec
Instruction 1,513,769 79% 2,265,194 85% 50% 2,209,500 88% -2%
Student & Instructional Support 21,552 1% 0 0% -100% 0 0% 0%
General Administration 9,048 0% 15,151 1% 67% 16,000 1% 6%
School Administration (Building) 0 0% 0 0% 0% 0 0% 0%
Operations & Maintenance 280,949 15% 267,058 10% -5% 252,000 10% -6%
Capital Improvements 0 0% 0 0% 0% 0 0% 0%
Other Costs 82,072 4% 106,455 4% 30% 24,712 1% -77%
Total Expenditures 1,907,390 100% 2,653,858 100% 39% 2,502,212 100% -6%
Amount per Pupil $857 $1,179 38% $1,100 -7%
The Summary of Supplemental General Fund Expenditures chart information comes from pages 6-13 and only uses the 'Supplemental
General Fund' line items.
Instruction 88%
General Administration 1%
Operations & Maintenance
10%
Other Costs 1%
2011-2012 Summary of Supplemental General Fund Expenditures by Function
Instruction
Student & Instructional Support
General Administration
School Administration (Building)
Operations & Maintenance
Capital Improvements
Other Costs
0
500,000
1,000,000
1,500,000
2,000,000
2,500,000
Instruction Student &Instructional
Support
GeneralAdministration
SchoolAdministration
(Building)
Operations &Maintenance
CapitalImprovements
Other Costs
Summary of Supplemental General Fund Expenditures by Function
2009-2010
2010-2011
2011-2012
9/21/2011 2:47 PM Sumexpen.xls Page 3 of 19

USD# 313
Summary of General and Supplemental General Fund
Expenditures by Function
% % % % %
2009-2010 of 2010-2011 of inc/ 2011-2012 of inc/
Actual Tot Actual Tot dec Budget Tot dec
Instruction 7,248,252 56% 7,224,232 57% 0% 7,094,000 57% -2%
Student & Instructional Support 911,721 7% 619,187 5% -32% 623,565 5% 1%
General Administration 471,711 4% 378,643 3% -20% 342,798 3% -9%
School Administration (Building) 1,129,158 9% 1,108,842 9% -2% 1,036,000 8% -7%
Operations & Maintenance 1,889,888 15% 1,965,237 15% 4% 2,024,919 16% 3%
Capital Improvements 0 0% 585 0% 0% 0 0% -100%
Other Costs 1,354,347 10% 1,412,176 11% 4% 1,336,162 11% -5%
Total Expenditures 13,005,077 100% 12,708,902 100% -2% 12,457,444 100% -2%
Amount per Pupil $5,842 $5,648 -3% $5,476 -3%
The Summary of General and Supplemental General Fund Expenditures chart information comes from pages 6-13 and adds together
the 'General Fund' and 'Supplemental General Fund' line items.
0
1,000,000
2,000,000
3,000,000
4,000,000
5,000,000
6,000,000
7,000,000
8,000,000
Instruction Student &Instructional
Support
GeneralAdministration
SchoolAdministration
(Building)
Operations &Maintenance
CapitalImprovements
Other Costs
Summary of General and Supplemental General Fund Expenditures by Function
2009-2010
2010-2011
2011-2012
Instruction 57%
Student & Instructional Support
5%
General Administration 3%
School Administration (Building)
8%
Operations & Maintenance 16%
Other Costs 11%
2011-2012 Summary of General and Supplemental General Fund Expenditures by Function
Instruction
Student & Instructional Support
General Administration
School Administration (Building)
Operations & Maintenance
Capital Improvements
Other Costs
9/21/2011 2:47 PM Sumexpen.xls Page 4 of 19

USD# 313
Summary of Special Education Fund
by Function
% % % % %
2009-2010 of 2010-2011 of inc/ 2011-2012 of inc/
Actual Tot Actual Tot dec Budget Tot dec
Instruction 2,428,029 83% 2,413,662 81% -1% 2,738,294 82% 13%
Student & Instructional Support 0 0% 0 0% 0% 0 0% 0%
General Administration 0 0% 0 0% 0% 0 0% 0%
School Administration (Building) 0 0% 0 0% 0% 0 0% 0%
Operations & Maintenance 0 0% 0 0% 0% 0 0% 0%
Capital Improvements 0 0% 0 0% 0% 0 0% 0%
Other Costs 490,816 17% 568,841 19% 16% 605,000 18% 6%
Total Expenditures 2,918,845 100% 2,982,503 100% 2% 3,343,294 100% 12%
Amount per Pupil $1,311 $1,326 1% $1,470 11%
The Summary of Special Education Fund Expenditures chart information comes from pages 6-13 and only uses the 'Special Education Fund'
line items. (Total expenditures excludes Special Ed Coop Fund because it would include expenditures for all schools participating in the Coop.)
0
500,000
1,000,000
1,500,000
2,000,000
2,500,000
3,000,000
Instruction Student &Instructional
Support
GeneralAdministration
SchoolAdministration
(Building)
Operations &Maintenance
CapitalImprovements
Other Costs
Summary of Special Education Fund Expenditures by Function
2009-2010
2010-2011
2011-2012
Instruction 82%
Other Costs 18%
2011-2012 Summary of Special Education Fund by Function
Instruction
Student & Instructional Support
General Administration
School Administration (Building)
Operations & Maintenance
Capital Improvements
Other Costs
9/21/2011 2:47 PM Sumexpen.xls Page 5 of 19

USD# 313
Instruction Expenditures (1000)
% %
2009-2010 2010-2011 inc/ 2011-2012 inc/
Actual Actual dec Budget dec
General 5,734,483 4,959,038 -14% 4,884,500 -2%
Federal Funds 260,898 575,552 121% 414,931 -28%
Supplemental General 1,513,769 2,265,194 50% 2,209,500 -2%
At Risk (4yr Old) 92,325 150,099 63% 205,050 37%
At Risk (K-12) 561,852 792,236 41% 1,086,218 37%
Bilingual Education 61,304 51,599 -16% 62,500 21%
Virtual Education 0 0 0% 0 0%
Capital Outlay 429,272 485,142 13% 485,000 0%
Driver Education 86,201 83,784 -3% 95,000 13%
Declining Enrollment 0 0 0% 0 0%
Extraordinary School Program 0 0 0% 0 0%
Food Service 0 0 0% 0 0%
Professional Development 0 0 0% 0 0%
Parent Education Program 0 0 0% 0 0%
Summer School 0 0 0% 0 0%
Special Education 2,428,029 2,413,662 -1% 2,738,294 13%
Cost of Living 0 0 0% 0 0%
Vocational Education 617,332 566,687 -8% 605,500 7%
Gifts/Grants 37,745 21,021 -44% 67,220 220%
Special Liability 0 0 0% 0 0%
School Retirement 0 0 0% 0 0%
Extraordinary Growth Facilities 0 0 0% 0 0%
Special Reserve 0 0 0%
KPERS Spec. Ret. Contribution 371,326 415,602 12% 827,766 99%
Contingency Reserve 0 0 0%
Text Book & Student Material 132,082 62,355 -53%
Activity Fund 0 316,472 0% 0 -100%
Bond and Interest #1 0 0 0% 0 0%
Bond and Interest #2 0 0 0% 0 0%
No-Fund Warrant 0 0 0% 0 0%
Special Assessment 0 0 0% 0 0%
Temporary Note 0 0 0% 0 0%
SUBTOTAL 12,326,618 13,158,443 7% 13,681,479 4%
Enrollment (FTE)* 2,226.3 2,250.0 1% 2,275.0 1%
Amount per Pupil 5,537 5,848 6% 6,014 3%
Adult Education 0 0 0% 0 0%
Adult Supplemental Education 0 0 0% 0 0%
Tuition Reimbursement 0 0 0% 0 0%
Special Education Coop 0 0 0% 0 0%
TOTAL 12,326,618 13,158,443 7% 13,681,479 4%
NOTE: Gifts/Grants includes private grants and grants from nonfederal sources.
Amount per pupil excludes the following funds: Adult Education, Adult Supplemental Education, Special Education Coop
and Tuition Reimbursement.
*Enrollment (FTE) includes the enrollment of the district used for state aid and budget authority, and all other preschool enrollment
and kindergarten students attending full time.
0
2,000,000
4,000,000
6,000,000
8,000,000
10,000,000
12,000,000
14,000,000
16,000,000
2009-2010 2010-2011 2011-2012
Instruction Expenditures
0
1,000,000
2,000,000
3,000,000
4,000,000
5,000,000
6,000,000
7,000,000
2009-2010 2010-2011 2011-2012
Instruction Expenditures
General
Supplemental General
Special Education
9/21/2011 2:47 PM Sumexpen.xls Page 6 of 19
USD# 313
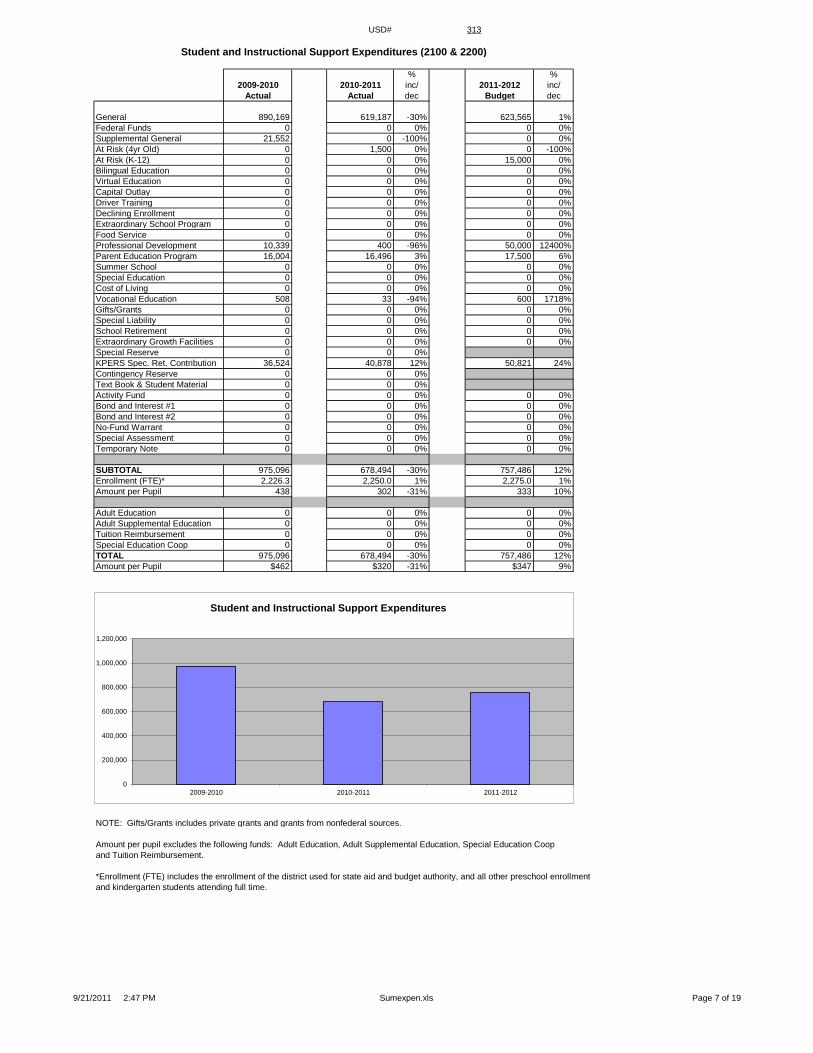
Student and Instructional Support Expenditures (2100 & 2200)
% %
2009-2010 2010-2011 inc/ 2011-2012 inc/
Actual Actual dec Budget dec
General 890,169 619,187 -30% 623,565 1%
Federal Funds 0 0 0% 0 0%
Supplemental General 21,552 0 -100% 0 0%
At Risk (4yr Old) 0 1,500 0% 0 -100%
At Risk (K-12) 0 0 0% 15,000 0%
Bilingual Education 0 0 0% 0 0%
Virtual Education 0 0 0% 0 0%
Capital Outlay 0 0 0% 0 0%
Driver Training 0 0 0% 0 0%
Declining Enrollment 0 0 0% 0 0%
Extraordinary School Program 0 0 0% 0 0%
Food Service 0 0 0% 0 0%
Professional Development 10,339 400 -96% 50,000 12400%
Parent Education Program 16,004 16,496 3% 17,500 6%
Summer School 0 0 0% 0 0%
Special Education 0 0 0% 0 0%
Cost of Living 0 0 0% 0 0%
Vocational Education 508 33 -94% 600 1718%
Gifts/Grants 0 0 0% 0 0%
Special Liability 0 0 0% 0 0%
School Retirement 0 0 0% 0 0%
Extraordinary Growth Facilities 0 0 0% 0 0%
Special Reserve 0 0 0%
KPERS Spec. Ret. Contribution 36,524 40,878 12% 50,821 24%
Contingency Reserve 0 0 0%
Text Book & Student Material 0 0 0%
Activity Fund 0 0 0% 0 0%
Bond and Interest #1 0 0 0% 0 0%
Bond and Interest #2 0 0 0% 0 0%
No-Fund Warrant 0 0 0% 0 0%
Special Assessment 0 0 0% 0 0%
Temporary Note 0 0 0% 0 0%
SUBTOTAL 975,096 678,494 -30% 757,486 12%
Enrollment (FTE)* 2,226.3 2,250.0 1% 2,275.0 1%
Amount per Pupil 438 302 -31% 333 10%
Adult Education 0 0 0% 0 0%
Adult Supplemental Education 0 0 0% 0 0%
Tuition Reimbursement 0 0 0% 0 0%
Special Education Coop 0 0 0% 0 0%
TOTAL 975,096 678,494 -30% 757,486 12%
Amount per Pupil $462 $320 -31% $347 9%
NOTE: Gifts/Grants includes private grants and grants from nonfederal sources.
Amount per pupil excludes the following funds: Adult Education, Adult Supplemental Education, Special Education Coop
and Tuition Reimbursement.
*Enrollment (FTE) includes the enrollment of the district used for state aid and budget authority, and all other preschool enrollment
and kindergarten students attending full time.
0
200,000
400,000
600,000
800,000
1,000,000
1,200,000
2009-2010 2010-2011 2011-2012
Student and Instructional Support Expenditures
9/21/2011 2:47 PM Sumexpen.xls Page 7 of 19

USD# 313
General Administration Expenditures (2300)
% %
2009-2010 2010-2011 inc/ 2011-2012 inc/
Actual Actual dec Budget dec
General 462,663 363,492 -21% 326,798 -10%
Federal Funds 0 0 0% 0 0%
Supplemental General 9,048 15,151 67% 16,000 6%
At Risk (4yr Old) 0 0 0% 0 0%
At Risk (K-12) 0 0 0% 0 0%
Bilingual Education 0 0 0% 0 0%
Virtual Education 0 0 0% 0 0%
Capital Outlay 0 0 0% 0 0%
Driver Training 0 0 0% 0 0%
Declining Enrollment 0 0 0% 0 0%
Extraordinary School Program 0 0 0% 0 0%
Food Service 0 0 0% 0 0%
Professional Development 0 0 0% 0 0%
Parent Education Program 0 0 0% 0 0%
Summer School 0 0 0% 0 0%
Special Education 0 0 0% 0 0%
Cost of Living 0 0 0% 0 0%
Vocational Education 0 0 0% 0 0%
Gifts/Grants 0 0 0% 0 0%
Special Liability Expense 0 0 0% 0 0%
School Retirement 0 0 0% 0 0%
Extraordinary Growth Facilities 0 0 0% 0 0%
Special Reserve 0 0 0%
KPERS Spec. Ret. Contribution 18,262 20,439 12% 29,141 43%
Contingency Reserve 0 0 0%
Text Book & Student Material 0 0 0%
Activity Fund 0 0 0% 0 0%
Bond and Interest #1 0 0 0% 0 0%
Bond and Interest #2 0 0 0% 0 0%
No-Fund Warrant 0 0 0% 0 0%
Special Assessment 0 0 0% 0 0%
Temporary Note 0 0 0% 0 0%
SUBTOTAL 489,973 399,082 -19% 371,939 -7%
Enrollment (FTE)* 2,226.3 2,250.0 1% 2,275.0 1%
Amount per Pupil 220 177 -19% 163 -8%
Adult Education 0 0 0% 0 0%
Adult Supplemental Education 0 0 0% 0 0%
Tuition Reimbursement 0 0 0% 0 0%
Special Education Coop 0 0 0% 0 0%
TOTAL 489,973 399,082 -19% 371,939 -7%
NOTE: Gifts/Grants includes private grants and grants from nonfederal sources.
Amount per pupil excludes the following funds: Adult Education, Adult Supplemental Education, Special Education Coop
and Tuition Reimbursement.
*Enrollment (FTE) includes the enrollment of the district used for state aid and budget authority, and all other preschool enrollment
and kindergarten students attending full time.
0
100,000
200,000
300,000
400,000
500,000
600,000
2009-2010 2010-2011 2011-2012
General Administration Expenditures
9/21/2011 2:47 PM Sumexpen.xls Page 8 of 19

USD# 313
School Administration Expenditures (2400)
% %
2009-2010 2010-2011 inc/ 2011-2012 inc/
Actual Actual dec Budget dec
General 1,129,158 1,108,842 -2% 1,036,000 -7%
Federal Funds 0 0 0% 0 0%
Supplemental General 0 0 0% 0 0%
At Risk (4yr Old) 0 0 0% 0 0%
At Risk (K-12) 0 0 0% 0 0%
Bilingual Education 0 0 0% 0 0%
Virtual Education 0 0 0% 0 0%
Capital Outlay 0 0 0% 0 0%
Driver Training 0 0 0% 0 0%
Declining Enrollment 0 0 0% 0 0%
Extraordinary School Program 0 0 0% 0 0%
Food Service 0 0 0% 0 0%
Professional Development 0 0 0% 0 0%
Parent Education Program 0 0 0% 0 0%
Summer School 0 0 0% 0 0%
Special Education 0 0 0% 0 0%
Cost of Living 0 0 0% 0 0%
Vocational Education 0 0 0% 0 0%
Gifts/Grants 0 0 0% 0 0%
Special Liability Expense 0 0 0% 0 0%
School Retirement 0 0 0% 0 0%
Extraordinary Growth Facilities 0 0 0% 0 0%
Special Reserve 0 0 0%
KPERS Spec. Ret. Contribution 48,698 54,505 12% 97,970 80%
Contingency Reserve 0 0 0%
Text Book & Student Material 0 0 0%
Activity Fund 0 0 0% 0 0%
Bond and Interest #1 0 0 0% 0 0%
Bond and Interest #2 0 0 0% 0 0%
No-Fund Warrant 0 0 0% 0 0%
Special Assessment 0 0 0% 0 0%
Temporary Note 0 0 0% 0 0%
SUBTOTAL 1,177,856 1,163,347 -1% 1,133,970 -3%
Enrollment (FTE)* 2,226.3 2,250.0 1% 2,275.0 1%
Amount per Pupil 529 517 -2% 498 -4%
Adult Education 0 0 0% 0 0%
Adult Supplemental Education 0 0 0% 0 0%
Tuition Reimbursement 0 0 0% 0 0%
Special Education Coop 0 0 0% 0 0%
TOTAL 1,177,856 1,163,347 -1% 1,133,970 -3%
NOTE: Gifts/Grants includes private grants and grants from nonfederal sources.
Amount per pupil excludes the following funds: Adult Education, Adult Supplemental Education, Special Education Coop
and Tuition Reimbursement.
*Enrollment (FTE) includes the enrollment of the district used for state aid and budget authority, and all other preschool enrollment
and kindergarten students attending full time.
0
200,000
400,000
600,000
800,000
1,000,000
1,200,000
1,400,000
2009-2010 2010-2011 2011-2012
School Administration Expenditures
9/21/2011 2:47 PM Sumexpen.xls Page 9 of 19

USD# 313
Operations and Maintenance Expenditures (2600)
% %
2009-2010 2010-2011 inc/ 2011-2012 inc/
Actual Actual dec Budget dec
General 1,608,939 1,698,179 6% 1,772,919 4%
Federal Funds 0 0 0% 0 0%
Supplemental General 280,949 267,058 -5% 252,000 -6%
At Risk (4yr Old) 0 0 0% 0 0%
At Risk (K-12) 0 0 0% 0 0%
Bilingual Education 0 0 0% 0 0%
Virtual Education 0 0 0% 0 0%
Capital Outlay 150,222 46,850 -69% 53,945 15%
Driver Training 3,929 16,390 317% 16,950 3%
Declining Enrollment 0 0 0% 0 0%
Extraordinary School Program 0 0 0% 0 0%
Food Service 9,230 9,884 7% 10,000 1%
Professional Development 0 0 0% 0 0%
Parent Education Program 0 0 0% 0 0%
Summer School 0 0 0% 0 0%
Special Education 0 0 0% 0 0%
Cost of Living 0 0 0% 0 0%
Vocational Education 820 6,054 638% 7,500 24%
Gifts/Grants 0 0 0% 0 0%
Special Liability 0 0 0% 0 0%
School Retirement 0 0 0% 0 0%
Extraordinary Growth Facilities 0 0 0% 0 0%
Special Reserve 0 0 0%
KPERS Spec. Ret. Contribution 48,698 54,505 12% 85,216 56%
Contingency Reserve 0 0 0%
Text Book & Student Material 0 0 0%
Activity Fund 0 0 0% 0 0%
Bond and Interest #1 0 0 0% 0 0%
Bond and Interest #2 0 0 0% 0 0%
No-Fund Warrant 0 0 0% 0 0%
Special Assessment 0 0 0% 0 0%
Temporary Note 0 0 0% 0 0%
SUBTOTAL 2,102,787 2,098,920 0% 2,198,530 5%
Enrollment (FTE)* 2,226.3 2,250.0 1% 2,275.0 1%
Amount per Pupil 945 933 -1% 966 4%
Adult Education 0 0 0% 0 0%
Adult Supplemental Education 0 0 0% 0 0%
Tuition Reimbursement 0 0 0% 0 0%
Special Education Coop 0 0 0% 0 0%
TOTAL 2,102,787 2,098,920 0% 2,198,530 5%
NOTE: Gifts/Grants includes private grants and grants from nonfederal sources.
Amount per pupil excludes the following funds: Adult Education, Adult Supplemental Education, Special Education Coop
and Tuition Reimbursement.
*Enrollment (FTE) includes the enrollment of the district used for state aid and budget authority, and all other preschool enrollment
and kindergarten students attending full time.
0
500,000
1,000,000
1,500,000
2,000,000
2,500,000
2009-2010 2010-2011 2011-2012
Operations and Maintenance Expenditures
9/21/2011 2:47 PM Sumexpen.xls Page 10 of 19

USD# 313
Other Costs
(2500 & 2900: Other Supplemental Services)
(2700: Transportation)
(3000: Non-Instruction Services)
% %
2009-2010 2010-2011 inc/ 2011-2012 inc/
Actual Actual dec Budget dec
General 1,272,275 1,305,721 3% 1,311,450 0%
Federal Funds 0 0 0% 0 0%
Supplemental General 82,072 106,455 30% 24,712 -77%
At Risk (4yr Old) 0 0 0% 0 0%
At Risk (K-12) 0 0 0% 0 0%
Bilingual Education 0 0 0% 0 0%
Virtual Education 0 0 0% 0 0%
Capital Outlay 213,244 186,686 -12% 185,000 -1%
Driver Training 0 0 0% 0 0%
Declining Enrollment 0 0 0% 0 0%
Extraordinary School Program 0 0 0% 0 0%
Food Service 1,175,228 1,187,041 1% 1,283,500 8%
Professional Development 0 0 0% 0 0%
Parent Education Program 0 0 0% 0 0%
Summer School 0 0 0% 0 0%
Special Education 490,816 568,841 16% 605,000 6%
Cost of Living 0 0 0% 0 0%
Vocational Education 0 0 0% 0 0%
Gifts/Grants 0 0 0% 0 0%
Special Liability 0 0 0% 0 0%
School Retirement 0 0 0% 0 0%
Extraordinary Growth Facilities 0 0 0% 0 0%
Special Reserve 0 0 0%
KPERS Spec. Ret. Contribution 85,223 95,385 12% 169,519 78%
Contingency Reserve 0 0 0%
Text Book & Student Material 0 0 0%
Activity Fund 0 0 0% 0 0%
Bond and Interest #1 0 0 0% 0 0%
Bond and Interest #2 0 0 0% 0 0%
No-Fund Warrant 0 0 0% 0 0%
Special Assessment 0 0 0% 0 0%
Temporary Note 0 0 0% 0 0%
SUBTOTAL 3,318,858 3,450,129 4% 3,579,181 4%
Enrollment (FTE)* 2,226.3 2,250.0 1% 2,275.0 1%
Amount per Pupil 1,491 1,533 3% 1,573 3%
Adult Education 0 0 0% 0 0%
Adult Supplemental Education 0 0 0% 0 0%
Tuition Reimbursement 0 0 0% 0 0%
Special Education Coop 0 0 0% 0 0%
TOTAL 3,318,858 3,450,129 4% 3,579,181 4%
NOTE: Gifts/Grants includes private grants and grants from nonfederal sources.
Amount per pupil excludes the following funds: Adult Education, Adult Supplemental Education, Special Education Coop
and Tuition Reimbursement.
*Enrollment (FTE) includes the enrollment of the district used for state aid and budget authority, and all other preschool enrollment
and kindergarten students attending full time.
0
500,000
1,000,000
1,500,000
2,000,000
2,500,000
3,000,000
3,500,000
4,000,000
2009-2010 2010-2011 2011-2012
Other Costs
9/21/2011 2:47 PM Sumexpen.xls Page 11 of 19

USD# 313
Capital Improvements Expenditures (4000)
% %
2009-2010 2010-2011 inc/ 2011-2012 inc/
Actual Actual dec Budget dec
General 0 585 0% 0 -100%
Federal Funds 0 0 0% 0 0%
Supplemental General 0 0 0% 0 0%
At Risk (4yr Old) 0 0 0% 0 0%
At Risk (K-12) 0 0 0% 0 0%
Bilingual Education 0 0 0% 0 0%
Virtual Education 0 0 0% 0 0%
Capital Outlay 432,225 491,162 14% 591,725 20%
Driver Training 0 0 0% 0 0%
Declining Enrollment 0 0 0% 0 0%
Extraordinary School Program 0 0 0% 0 0%
Food Service 0 0 0% 0 0%
Professional Development 0 0 0% 0 0%
Parent Education Program 0 0 0% 0 0%
Summer School 0 0 0% 0 0%
Special Education 0 0 0% 0 0%
Cost of Living 0 0 0% 0 0%
Vocational Education 0 0 0% 0 0%
Gifts/Grants 0 98,460 0% 0 -100%
Special Liability 0 0 0% 0 0%
School Retirement 0 0 0% 0 0%
Extraordinary Growth Facilities 0 0 0% 0 0%
Special Reserve 0 0 0%
KPERS Spec. Ret. Contribution 0 0 0% 0 0%
Contingency Reserve 0 0 0%
Text Book & Student Material 0 0 0%
Activity Fund 0 0 0% 0 0%
Bond and Interest #1 0 0 0% 0 0%
Bond and Interest #2 0 0 0% 0 0%
No-Fund Warrant 0 0 0% 0 0%
Special Assessment 0 0 0% 0 0%
Temporary Note 0 0 0% 0 0%
SUBTOTAL 432,225 590,207 37% 591,725 0%
Enrollment (FTE)* 2,226.3 2,250.0 1% 2,275.0 1%
Amount per Pupil 194 262 35% 260 -1%
Adult Education 0 0 0% 0 0%
Adult Supplemental Education 0 0 0% 0 0%
Tuition Reimbursement 0 0 0% 0 0%
Special Education Coop 0 0 0% 0 0%
TOTAL 432,225 590,207 37% 591,725 0%
NOTE: Gifts/Grants includes private grants and grants from nonfederal sources.
Amount per pupil excludes the following funds: Adult Education, Adult Supplemental Education, Special Education Coop
and Tuition Reimbursement.
*Enrollment (FTE) includes the enrollment of the district used for state aid and budget authority, and all other preschool enrollment
and kindergarten students attending full time.
0
100,000
200,000
300,000
400,000
500,000
600,000
700,000
2009-2010 2010-2011 2011-2012
Capital Improvements (4000)
9/21/2011 2:47 PM Sumexpen.xls Page 12 of 19

USD# 313
Debt Services Expenditures (5100)
% %
2009-2010 2010-2011 inc/ 2011-2012 inc/
Actual Actual dec Budget dec
General 0 0 0% 0 0%
Federal Funds 0 0 0% 0 0%
Supplemental General 0 0 0% 0 0%
At Risk (4yr Old) 0 0 0% 0 0%
At Risk (K-12) 0 0 0% 0 0%
Bilingual Education 0 0 0% 0 0%
Virtual Education 0 0 0% 0 0%
Capital Outlay 0 67,500 0% 67,500 0%
Driver Training 0 0 0% 0 0%
Declining Enrollment 0 0 0% 0 0%
Extraordinary School Program 0 0 0% 0 0%
Food Service 0 0 0% 0 0%
Professional Development 0 0 0% 0 0%
Parent Education Program 0 0 0% 0 0%
Summer School 0 0 0% 0 0%
Special Education 0 0 0% 0 0%
Cost of Living 0 0 0% 0 0%
Vocational Education 0 0 0% 0 0%
Gifts/Grants 0 0 0% 0 0%
Special Liability 0 0 0% 0 0%
School Retirement 0 0 0% 0 0%
Extraordinary Growth Facilities 0 0 0% 0 0%
Special Reserve 0 0 0%
KPERS Spec. Ret. Contribution 0 0 0% 0 0%
Contingency Reserve 0 0 0%
Text Book & Student Material 0 0 0%
Activity Fund 0 0 0% 0 0%
Bond and Interest #1 1,403,730 1,413,590 1% 1,439,271 2%
Bond and Interest #2 0 0 0% 0 0%
No-Fund Warrant 0 0 0% 0 0%
Special Assessment 0 0 0% 0 0%
Temporary Note 0 0 0% 0 0%
SUBTOTAL 1,403,730 1,481,090 6% 1,506,771 2%
Enrollment (FTE)* 2,226.3 2,250.0 1% 2,275.0 1%
Amount per Pupil 631 658 4% 662 1%
Adult Education 0 0 0% 0 0%
Adult Supplemental Education 0 0 0% 0 0%
Tuition Reimbursement 0 0 0% 0 0%
Special Education Coop 0 0 0% 0 0%
TOTAL 1,403,730 1,481,090 6% 1,506,771 2%
NOTE: Gifts/Grants includes private grants and grants from nonfederal sources.
Amount per pupil excludes the following funds: Adult Education, Adult Supplemental Education, Special Education Coop
and Tuition Reimbursement.
*Enrollment (FTE) includes the enrollment of the district used for state aid and budget authority, and all other preschool enrollment
and kindergarten students attending full time.
0
200,000
400,000
600,000
800,000
1,000,000
1,200,000
1,400,000
1,600,000
2009-2010 2010-2011 2011-2012
Debt Services (5100)
9/21/2011 2:47 PM Sumexpen.xls Page 13 of 19
USD# 313
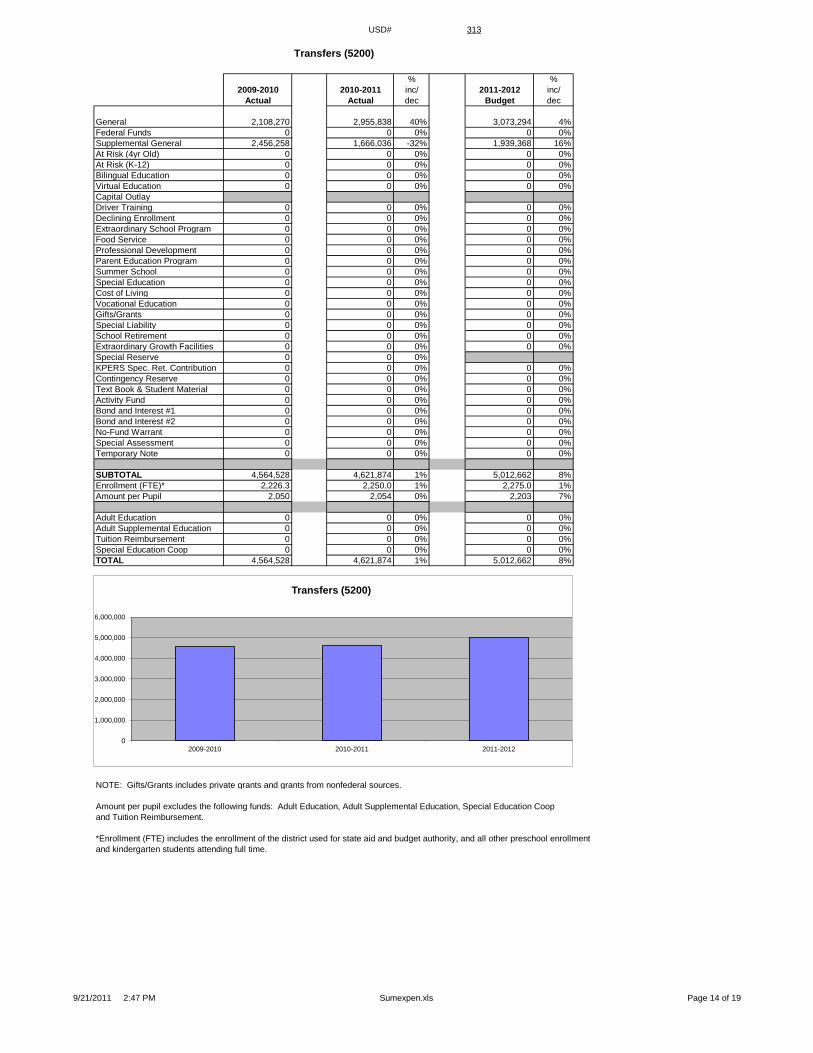
Transfers (5200)
% %
2009-2010 2010-2011 inc/ 2011-2012 inc/
Actual Actual dec Budget dec
General 2,108,270 2,955,838 40% 3,073,294 4%
Federal Funds 0 0 0% 0 0%
Supplemental General 2,456,258 1,666,036 -32% 1,939,368 16%
At Risk (4yr Old) 0 0 0% 0 0%
At Risk (K-12) 0 0 0% 0 0%
Bilingual Education 0 0 0% 0 0%
Virtual Education 0 0 0% 0 0%
Capital Outlay
Driver Training 0 0 0% 0 0%
Declining Enrollment 0 0 0% 0 0%
Extraordinary School Program 0 0 0% 0 0%
Food Service 0 0 0% 0 0%
Professional Development 0 0 0% 0 0%
Parent Education Program 0 0 0% 0 0%
Summer School 0 0 0% 0 0%
Special Education 0 0 0% 0 0%
Cost of Living 0 0 0% 0 0%
Vocational Education 0 0 0% 0 0%
Gifts/Grants 0 0 0% 0 0%
Special Liability 0 0 0% 0 0%
School Retirement 0 0 0% 0 0%
Extraordinary Growth Facilities 0 0 0% 0 0%
Special Reserve 0 0 0%
KPERS Spec. Ret. Contribution 0 0 0% 0 0%
Contingency Reserve 0 0 0% 0 0%
Text Book & Student Material 0 0 0% 0 0%
Activity Fund 0 0 0% 0 0%
Bond and Interest #1 0 0 0% 0 0%
Bond and Interest #2 0 0 0% 0 0%
No-Fund Warrant 0 0 0% 0 0%
Special Assessment 0 0 0% 0 0%
Temporary Note 0 0 0% 0 0%
SUBTOTAL 4,564,528 4,621,874 1% 5,012,662 8%
Enrollment (FTE)* 2,226.3 2,250.0 1% 2,275.0 1%
Amount per Pupil 2,050 2,054 0% 2,203 7%
Adult Education 0 0 0% 0 0%
Adult Supplemental Education 0 0 0% 0 0%
Tuition Reimbursement 0 0 0% 0 0%
Special Education Coop 0 0 0% 0 0%
TOTAL 4,564,528 4,621,874 1% 5,012,662 8%
NOTE: Gifts/Grants includes private grants and grants from nonfederal sources.
Amount per pupil excludes the following funds: Adult Education, Adult Supplemental Education, Special Education Coop
and Tuition Reimbursement.
*Enrollment (FTE) includes the enrollment of the district used for state aid and budget authority, and all other preschool enrollment
and kindergarten students attending full time.
0
1,000,000
2,000,000
3,000,000
4,000,000
5,000,000
6,000,000
2009-2010 2010-2011 2011-2012
Transfers (5200)
9/21/2011 2:47 PM Sumexpen.xls Page 14 of 19

USD# 313
Miscellaneous Information
Unencumbered Cash Balance by Fund
July 1, 2009 July 1, 2010 July 1, 2011
General 0 405 0
Federal Funds 44,731 130,766 0
Supplemental General 222,867 146,501 180,701
At Risk (4yr Old) 1,974 51,974 50,000
At Risk (K-12) 72 50,072 50,000
Bilingual Education 51,984 1,984 10,000
Virtual Education 0 0 0
Capital Outlay 261,928 166,794 158,506
Driver Training 84,913 74,567 67,733
Declining Enrollment 0 0 0
Extraordinary School Program 0 0 0
Food Service 202,823 215,611 230,000
Professional Development 8,895 10,000 50,000
Parent Education Program 17,864 18,860 18,864
Summer School 0 0 0
Special Education 527,244 721,174 694,345
Cost of Living 0 0 0
Vocational Education 2,002 2,002 50,000
Gifts/Grants 22,477 94,233 12,220
Special Liability 0 0 0
School Retirement 0 0 0
Extraordinary Growth Facilities 0 0 0
Special Reserve 0 0 0
KPERS Spec. Ret. Contribution 0 0 0
Contingency Reserve 428,415 428,415 428,415
Text Book & Student Material 5,587 16,593 53,890
Activity Fund 0 90,079 142,827
Bond and Interest #1 1,434,928 1,449,128 1,424,010
Bond and Interest #2 0 0 0
No Fund Warrant 0 0 0
Special Assessment 0 0 0
Temporary Note 0 0 0
SUBTOTAL 3,318,704 3,669,158 3,621,511
Enrollment (FTE)* 2,226.3 2,250.0 2,275.0
Amount per Pupil 1,491 1,631 1,592
Adult Education 0 0 0
Adult Supplemental Education 0 0 0
Tuition Reimbursement 0 0 0
Special Education Coop 0 0 0
TOTAL 3,318,704 3,669,158 3,621,511
NOTE: Gifts/Grants includes private grants and grants from nonfederal sources.
Amount per pupil excludes the following funds: Adult Education, Adult Supplemental Education, Special Education Coop
and Tuition Reimbursement.
*Enrollment (FTE) includes the enrollment of the district used for state aid and budget authority, and all other preschool enrollment
and kindergarten students attending full time.
0
500,000
1,000,000
1,500,000
2,000,000
2,500,000
3,000,000
3,500,000
4,000,000
July 1, 2009 July 1, 2010 July 1, 2011
Unencumbered Cash Balances by Fund
9/21/2011 2:47 PM Sumexpen.xls Page 15 of 19

USD# 313
Reserve Funds
Unencumbered Cash Balance
July 1, 2009 July 1, 2010 July 1, 2011
Special Reserve 0 0 0
TOTAL OTHER 0 0 0
Amount per Pupil $0 $0 $0
*School districts are authorized by law to self insure rather than purchase insurance for the following categories: Worker's Comp,
Health Insurance, Life Insurance, Property and Casualty (Risk Management) and Disability Income Insurance. Monies are placed
in the Self Insured Fund to pay for claims which may arise from the categories listed above.
0
0
0
0
0
1
1
1
1
1
1
July 1, 2009 July 1, 2010 July 1, 2011
Unencumbered Cash Balances by Fund (Reserve Funds Only)
9/21/2011 2:47 PM Sumexpen.xls Page 16 of 19

USD# 313
Other Information
2007-2008 2008-2009 % 2009-2010 % 2010-2011 % 2011-2012 %
Actual Actual inc/ Actual inc/ Actual inc/ Budget inc/
dec dec dec dec
Enrollment (FTE)* 2,180.0 2,115.5 -3% 2,111.3 0% 2,120.9 0% 2,180.0 3%
Enrollment (FTE)** 2,250.0 2,200.0 -2% 2,226.3 1% 2,250.0 1% 2,275.0 1%
Number of Students -
Free Meals 470 508 8% 561 10% 568 1% 600 6%
Number of Students -
Reduced Meals 257 239 -7% 289 21% 270 -7% 250 -7%
4 years worth
*FTE for state aid and budget authority purposes for general fund (excludes 4 yr old at-risk).
** FTE includes 9/20 enrollment used for state aid purposes and adding the additional FTE for preschool programs, headstart, and all-day
kindergarten. For example, preschool students attending half days on September 20th would be counted as .5 FTE. Kindergarten
students attending full time every day would be counted as 1.0 FTE.
0.0
500.0
1000.0
1500.0
2000.0
2500.0
2007-2008 2008-2009 2009-2010 2010-2011 2011-2012
Enrollment (FTE)* for Budget Authority
0
100
200
300
400
500
600
700
2007-2008 2008-2009 2009-2010 2010-2011 2011-2012
Low Income Students
Free Meals
Reduced Meals
2160.0
2180.0
2200.0
2220.0
2240.0
2260.0
2280.0
2300.0
2007-2008 2008-2009 2009-2010 2010-2011 2011-2012
Enrollment (FTE)** Used for Calculating "Amount Per Pupil"
9/21/2011 2:47 PM Sumexpen.xls Page 17 of 19

USD# 313
Miscellaneous Information
Mill Rates by Fund
2009-2010 2010-2011 2011-2012
Actual Actual Budget
General 20.000 20.000 20.000
Supplemental General 17.660 18.680 18.903
Adult Education 0.000 0.000 0.000
Capital Outlay 8.000 8.000 8.000
Declining Enrollment 0.000 0.000 0.000
Cost of Living 0.000 0.000 0.000
Special Liability 0.000 0.000 0.000
School Retirement 0.000 0.000 0.000
Extraordinary Growth Facilities 0.000 0.000 0.000
Bond and Interest #1 7.810 7.330 7.169
Bond and Interest #2 0.000 0.000 0.000
No Fund Warrant 0.000 0.000 0.000
Special Assessment 0.000 0.000 0.000
Temporary Note 0.000 0.000 0.000
TOTAL USD 53.470 54.010 54.072
Historical Museum 0.000 0.000 0.000
Public Library Board 0.000 0.000 0.000
Public Library Brd & Emp Benf 0.000 0.000 0.000
Recreation Commission 0.000 0.000 0.000
Rec Comm Employee Bnfts 0.000 0.000 0.000
TOTAL OTHER 0.000 0.000 0.000
General 37%
Supplemental General 35%
Capital Outlay 15%
Bond and Interest #1 13%
2011-2012 Miscellaneous Information Mill Rates by Fund (Total USD)
General
Supplemental General
Adult Education
Capital Outlay
Special Liability
School Retirement
Declining Enrollment
Cost of Living
Bond and Interest #1
Bond and Interest #2
Extraordinary Growth Facilities
No Fund Warrant
Special Assessment
Temporary Note
0.000
10.000
20.000
30.000
40.000
50.000
60.000
2009-2010 2010-2011 2011-2012
Total USD Mill Rates
9/21/2011 2:47 PM Sumexpen.xls Page 18 of 19

USD# 313
Other Information
2009-2010 2010-2011 2011-2012
Actual Actual Budget
Assessed Valuation $120,707,497 $126,124,525 $131,593,437
Bonded Indebtedness $9,810,000 $8,745,000 $7,610,000
$0
$20,000,000
$40,000,000
$60,000,000
$80,000,000
$100,000,000
$120,000,000
$140,000,000
2009-2010 2010-2011 2011-2012
Assessed Valuation
$0
$2,000,000
$4,000,000
$6,000,000
$8,000,000
$10,000,000
$12,000,000
2009-2010 2010-2011 2011-2012
Bonded Indebtedness
9/21/2011 2:47 PM Sumexpen.xls Page 19 of 19