3.1 determination of phenylurea herbicides by spe...
TRANSCRIPT
81
3.1 Determination of Phenylurea Herbicides by SPE-HPLC-UV
and its application to soft drink and tap water samples
3.1.1 Introduction
The phenylurea herbicides are widely used in a broad range of herbicide formulations and
also for non-agricultural use; consequently their residues are frequently detected as major
water contaminants in the areas where these are used extensively [1]. Diuron and Linuron
are both substituted urea compounds which are soluble in water and can migrate in soil
and enter the food chain [2]. These herbicides are of significant toxicological risk to
humans and wild life. Diuron is used in cotton growing areas, fruit crops, etc. and is rated
as the 3rd
most hazardous pesticide for ground water resources. These herbicides are also
applied on railway tracks to maintain quality and provide a safer working environment
[3] but this may lead to groundwater contamination as their leaching potential is
significant. Phenylureas enter the environment through different pathways like spray
drift, runoff from treated fields and leaching into groundwater. Most of the excess
material penetrates into the soil, where it is subjected to the action of microorganisms [4]
and degradation as studied by Canonica et al [5]. Phenylureas are photo chemically
unstable as discussed by Khodja et al [6], but these can persist in water for several days
or weeks depending on the temperature and pH. Cases of incidental pesticide pollution of
water reservoirs [2-4 7-13] have become more numerous in recent years. Phenyl urea
residues can be found in water sources, processed products and on the crops where these
are applied. In India, most of the soft drink bottling plants use surface water i.e. from
canals and rivers which have high chances of pesticides contamination. The water
treatment measures used are insufficient for complete removal of these pesticide residues
82
which have been found to be above permissible limits. The evidence for the above stated
facts was provided in Centre for Science and Environment (CSE), New Delhi report of
2003 that found several pesticide residues in many soft drink samples of leading
international brands procured from all over India. The CSE, New Delhi, findings were
further affirmed by a Joint Parliamentary Committee (JPC) setup to verify the facts. In
2006 again CSE conducted another round of tests and yet again found pesticides in soft
drink samples. Keeping this in mind, the present work has a lot of importance as it
involves the determination of phenyl urea herbicides in soft drink samples and tap water.
Therefore, it is imperative that sensitive, selective and efficient methods for herbicide
analysis should be designed. The common analytical methods used are HPLC-UV [2 – 4,
7-9], SPME-HPLC [10], diode array [11], immunosorbent trace enrichment and HPLC
[12, 14], LC-MS [15, 16], GC-MS [13], capillary electrophoresis [17, 18, 19], photo
chemically induced fluorescence [20, 21] and derivative spectrophotometry [22]. A
useful review is presented by Sherma [23] on the use of TLC and its modified versions
for the analysis of these herbicides. SPE of phenylurea herbicides has been reported in
literature by several workers [24-29]. The SPE of soft drinks has been extensively
reported [30-36]. As the use of polar and degradable pesticides is becoming rampant, it is
an urgent requirement that more sensitive analytical methods must be developed for their
residual analysis in various matrices. HPLC technique has several advantages over GC
technique as it can be used for simultaneous analysis of thermally unstable, non-volatile,
polar and neutral species without a derivative step. Due to thermally unstable nature of
phenyl urea herbicides the direct application of GC to these compounds is not possible
and derivatization prior to the detection is needed. For this reason, high performance
liquid chromatography (HPLC) with UV absorption or fluorescence detection [7-10] is

83
preferred over GC. Hence HPLC is gaining high popularity and preference as pesticide
analyzing technique.
The present work gives a simple and sensitive HPLC-UV method for the analysis of
phenyl urea herbicides namely monuron, diuron, linuron, metazachlor and metoxuron and
it involves a single step pre-concentration by Solid Phase Extraction (SPE).
Diuron
Linuron
Metazachlor
Monuron
Metoxuron
Figure 3.1.1 Molecular structure of Phenylurea herbicides
3.1.2 Experimental
3.1.2.1 Equipment and Reagents
The HPLC system used included a Dionex P680 HPLC pump, a Dionex 4.6 X 250 mm
C18 5µm RP analytical column (Acclaim) and a Dionex UVD 170U detector operated at a
84
wavelength of 210 nm coupled to a Chromeleon computer program for the acquisition of
data. Monuron, diuron, linuron, metoxuron and metazachlor (figures 1-5) pesticide
standards were obtained from Reidel-de-Haen (Germany). HPLC grade acetonitrile and
methanol were obtained from J.T. Baker (USA). All the solvents were filtered through
Nylon 6.6 membrane filters (Rankem) using filtration assembly (Perfit, India) and
sonicated before use. Triply distilled water was used for all purposes.
3.1.2.2 Standard preparation
Stock solutions were prepared in a mixture of 50:50 MeOH: water. All the solutions
were stored below 4 oC stored under refrigeration.
3.1.2.3 Sample preparation
The solid phase extraction of the tap water and soft drink samples were performed using
SPE system VISIPREPTM
SPE Vacuum Manifolds, (Supelco, Bellefonte, PA, USA) and
C18 cartridges from J. T. Baker were used. The SPE cartridges were attached to the
solvent recovery assembly and connected to a vacuum pump. The conditioning was done
by using 1ml each of Acetonitrile, Methanol and triply distilled water.
3.1.2.3.1 Cold drink samples
The presence of phenylurea herbicides was studied in three different types of locally
purchased soft drinks (viz. coke, mirinda and limca). These were filtered with nylon 6.6
membrane filters, degassed by sonicating for 30 minutes. The samples were then spiked
with the metoxuron, monuron, diuron, metazachlor and linuron at a concentration of 5 ng
mL-1
. 20 mL of these samples were passed through the C18 SPE cartridges under vacuum
85
and eluted with 1.5 mL of acetonitrile. The eluants were further used for the HPLC-UV
analysis. The sample blanks were also prepared similarly.
3.1.2.3.2 Tap water sample
The tap water sample was taken from lab. It was filtered and then degassed with an
ultrasonic bath. The sample was spiked with metoxuron, monuron, diuron, metazachlor
and linuron at a concentration of 5 ng ml-1
each. 50 mL sample of the tap water
containing mixture of herbicides was pre-concentrated using C18 SPE cartridges. 1.5 mL
acetonitrile was used for the elution and the eluant was subjected to HPLC-UV analysis.
The sample blanks were prepared by the same method.
3.1.3 HPLC determination of phenylurea herbicides
3.1.3.1 Procedure
Aliquots of mixture of five herbicides were taken having concentrations of 5 ppb to 500
ppb. These mixtures were analysed at an optimum wavelength of 210 nm. Mobile phase
is an important factor in HPLC analysis as it interacts with solute species of the sample.
Hence, the composition of the mobile phase was carefully selected as ACN : Water in the
ratio 60:40 and the flow rate was set at 1ml/min. All measurements were carried at
ambient temperature. The calibration curves for all five herbicides were prepared and the
curves were linear in the range studied.
3.1.4 Results and discussion
3.1.4.1 HPLC-UV studies
The separation of these herbicides was studied using direct injection of samples and

86
various parameters like effect of flow rate, selection of suitable wavelength and
composition of mobile phase were optimized. The composition of mobile phase was
ACN: Water (60:40). At higher flow rates than 1.0 mL/min, the separations were not up
to the baseline and with lower flow rates peak tailing was observed, so the flow rate was
optimized to 1.0 mL/min. The wavelength for detection was selected from the UV
absorption spectra of the five herbicides and it was selected as 210 nm.
3.1.4.2 Preparation of calibration curve
The calibration curves were constructed for the detection of monuron, linuron, diuron,
metoxuron and metazachlor in the range of 5–500 ppb under the optimized conditions
using the HPLC with UV detection. The calibration curves were linear over this range.
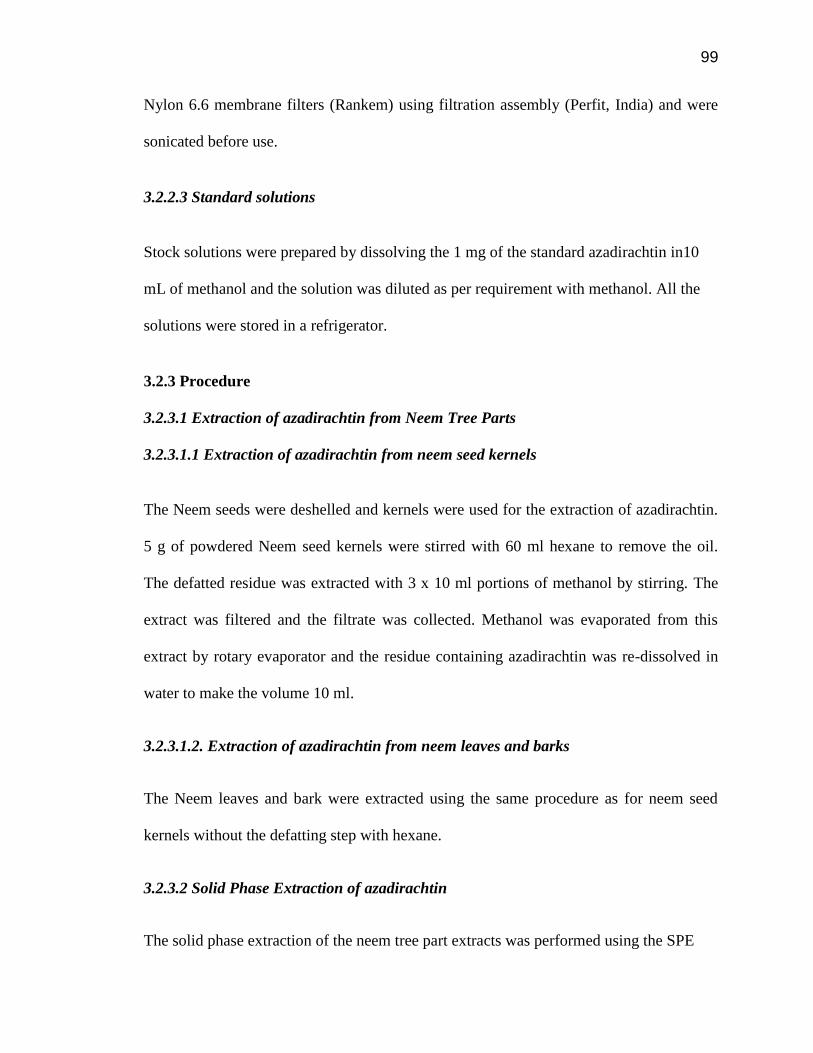
Various characteristics of HPLC-UV like: regression equation, working range, RSD, etc.
are summarized in Table 1.The LODs of the phenylurea herbicides were calculated using
3.3 X S/m (S = Standard Deviation, m = slope of calibration curve), which are in the
range 0.82 to1.29 ng/mL. Characteristic chromatogram with HPLC-UV detection at 210
nm are shown in figures 3.1.2 for the separation of these herbicides.
3.1.4.3 Recoveries, repeatability and LODs
The method Detection Limits were calculated for these herbicides as per the ICH
Harmonised Tripartite Guidelines (www.ich.org/LOB/media/MEDIA417.pdf). The
method LOQs can be calculated by using 10 x S/m. The accuracy (% recovery) and
precision (% RSD) of HPLC-UV method was evaluated for each analyte by analyzing a
standard of known concentration (5ng/ml) five times and quantifying it using the
calibration curves. Method optimization and validation parameters are presented in tables

87
3.1.1 and 3.1.2. Good linearity and repeatability were observed for all the compounds
studied (with correlation coefficient > 0.99). The method gives satisfactory results when
used to quantify these herbicides in soft drink samples and tap water sample (Table 3.1.2)
with %age recoveries varying in the range 75 % to 90.1 %.
3.1.4.4 Applications
The phenylurea herbicides were studied in various soft drink and tap water samples and
no interfering peaks appeared at the retention times of these herbicides in the spiked
samples. The tap water, Coke, Mirinda and Limca (figures 3.1.3, 3.1.4) samples were
spiked with metoxuron, monuron, diuron, metazachlor and linuron at a concentration of 5
ng mL-1
. The analytical validation for the simultaneous quantification of metoxuron,
monuron, diuron, metazachlor and linuron has been performed with good recovery. The
recoveries obtained are very good in all the cases. Hence, this method can be used to
detect the presence of these harmful herbicides in the soft drinks and water samples.
3.1.5 Conclusion
The objective of the current study is to develop a simple, isocratic, reproducible, specific
and highly sensitive method for quantitative and qualitative determination of phenylurea
herbicides. The present method is rapid as compared to several reported methods [37, 38,
39]. The proposed method can determine phenylurea herbicides up to very low
concentrations. The present paper describes the application of HPLC to the separation
and quantitative determination of five phenylurea herbicides and feasibility of the method
developed was tested by simultaneous determination of these herbicides in different
brands of soft drinks and tap water samples. Good linearity and repeatability were

88
observed for all the compounds studied (with correlation coefficient > 0.99). It is hoped
that the results of the present study contribute to the increase of scientific knowledge in
the field of pesticide residue analysis in various food and environmental samples.

89
Figure 3.1.2: HPLC-UV chromatogram of mixture containing 5 ppb each of the phenyl urea
herbicides a: metoxuron, b: monuron, c: diuron, d: metazachlor, e: linuron
0
0.2
0.4
0.6
0.8
1
1.2
0 2 4 6 8 10 12 14
Peak H
eig
ht
(mA
U)
Retention Time (min)
A B
C D
E
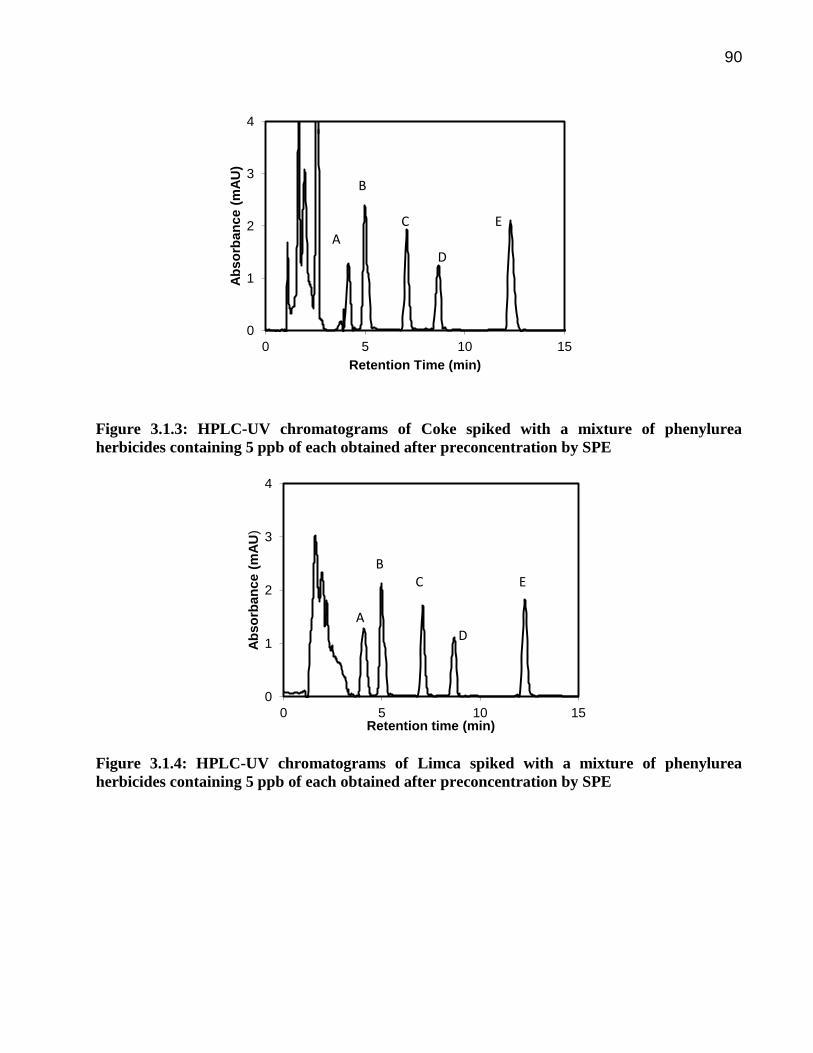
90
Figure 3.1.3: HPLC-UV chromatograms of Coke spiked with a mixture of phenylurea
herbicides containing 5 ppb of each obtained after preconcentration by SPE
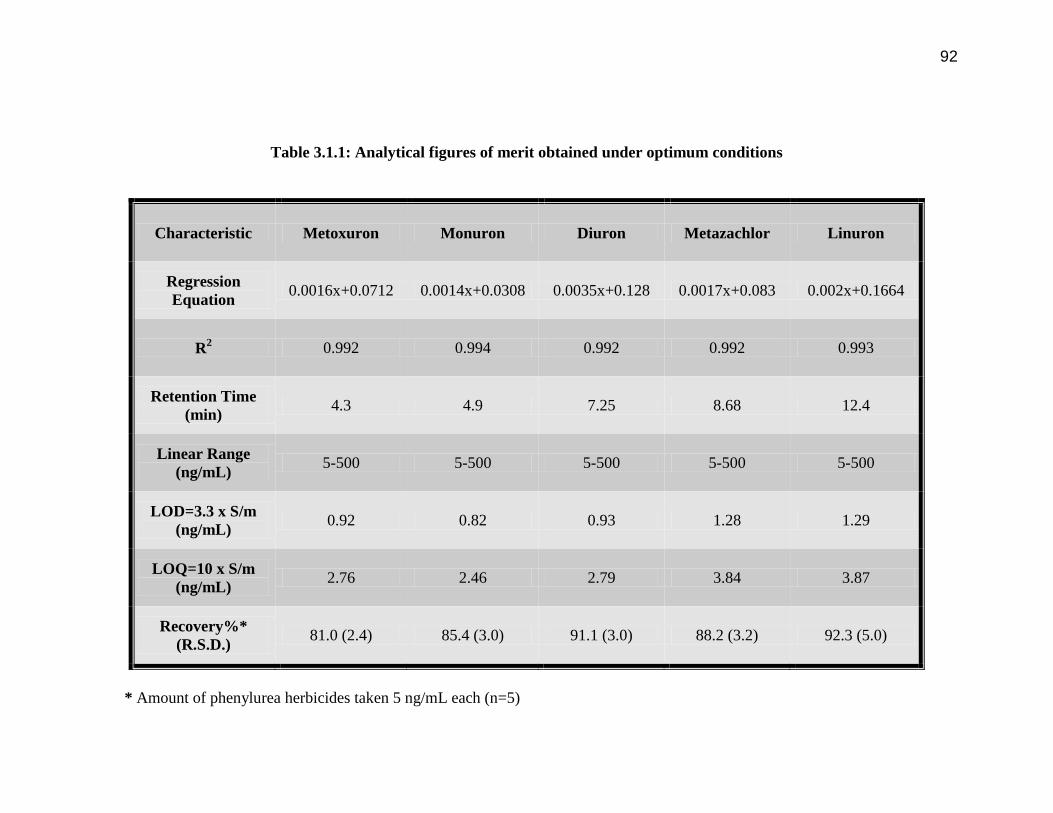
Figure 3.1.4: HPLC-UV chromatograms of Limca spiked with a mixture of phenylurea
herbicides containing 5 ppb of each obtained after preconcentration by SPE
0
1
2
3
4
0 5 10 15
Ab
so
rba
nc
e (
mA
U)
Retention Time (min)
B C E A D
0
1
2
3
4
0 5 10 15
Ab
so
rban
ce (
mA
U)
Retention time (min)
B C E A D

91
Figure 3.1.5: HPLC-UV chromatograms of Tap water spiked with a mixture of phenylurea
herbicides containing 5 ppb of each obtained after preconcentration by SPE.
Figure 3.1.6: HPLC-UV chromatograms of Mirinda spiked with a mixture of phenylurea
herbicides containing 5 ppb of each obtained after preconcentration by SPE.
0
1
2
3
4
0 5 10 15
Ab
so
rban
ce (
mA
U)
Retention Time (min)
`
A
B E C D
0
1
2
3
4
0 5 10 15
Ab
so
rban
ce (
mA
U)
Retention time (min)
B C E A D
92
Table 3.1.1: Analytical figures of merit obtained under optimum conditions
Characteristic Metoxuron Monuron Diuron Metazachlor Linuron
Regression
Equation 0.0016x+0.0712 0.0014x+0.0308 0.0035x+0.128 0.0017x+0.083 0.002x+0.1664
R2 0.992 0.994 0.992 0.992 0.993
Retention Time
(min) 4.3 4.9 7.25 8.68 12.4
Linear Range
(ng/mL) 5-500 5-500 5-500 5-500 5-500
LOD=3.3 x S/m
(ng/mL) 0.92 0.82 0.93 1.28 1.29
LOQ=10 x S/m
(ng/mL) 2.76 2.46 2.79 3.84 3.87
Recovery%*
(R.S.D.) 81.0 (2.4) 85.4 (3.0) 91.1 (3.0) 88.2 (3.2) 92.3 (5.0)
* Amount of phenylurea herbicides taken 5 ng/mL each (n=5)

93
Table 3.1.2: Analytical figures of merit obtained using various samples
Phenylurea
herbicides Metoxuron Monuron Diuron Metazachlor Linuron
Samples tested
Tap Water
Linear Range
(ng/mL) 5-500 5-500 5-500 5-500 5-500
LOD (ng/mL)
0.92 0.84 0.91 1.30 1.35
LOQ (ng/mL)
2.76 2.52 2.73 3.90 4.05
Recovery* %
(R.S.D.) 80.6 (4) 84.2 (3.1) 90.1 (4) 87.1 (4) 76.3 (5)
Limca
Linear Range
(ng/mL) 5-500 5-500 5-500 5-500 5-500
LOD (ng/mL)
0.95 0.89 0.99 1.39 1.41
LOQ (ng/mL) 2.85 2.67 2.97 4.17 4.23
Recovery*%
(R.S.D.) 79.4 (4) 83.1 (4) 87.8 (4.2) 87.8 (4.5) 75.4 (5.1)
Coke
Linear Range
(ng/mL) 5-500 5-500 5-500 5-500 5-500
LOD (ng/mL) 0.95 0.90 1.0 1.37 1.40
LOQ (ng/mL) 2.85 2.70 3.0 4.11 4.20

94
Recovery*%
(R.S.D.) 77.5 (4.6) 80.2 (4.7) 88.6 (5) 85.3 (5) 77.3 (4.8)
Mirinda
Linear Range
(ng/mL) 5-500 5-500 5-500 5-500 5-500
LOD (ng/mL) 0.96 0.89 0.99 1.37 1.42
LOQ (ng/mL) 2.88 2.67 2.97 4.11 4.26
Recovery*%
(R.S.D.) 81.1 (3.4) 83.4 (3.2) 87.6 (4) 85.1 (4.3) 77.3 (5.3)
* Samples spiked at 5 ng / mL, n=5
95
3.2 Extraction of a Natural Pesticide Azadirachtin from Neem
tree parts and its determination in fruit, vegetable and tea
samples using SPE-HPLC
3.2.1. Introduction
Synthetic chemical insecticides are being used extensively as they offer ready solutions to
manage food production and human health but they also pose serious health hazard.
Thus, the need of the hour is to develop such feasible alternatives which offer effective
pest control but with fewer health risks [40]. One such option is azadirachtin, a natural
pesticide derived from the Neem tree (azadirachta indica). The Neem tree which is
widely distributed across India has been observed to contain variable amounts of Az due
to variation in genetic and environmental factors [41-45]. Venkateswarlu et al [46]
observed that mycorrhizal inoculation in Neem enhances the Az content in Neem seed
kernels. Az is credited with low toxicity towards the non-target and beneficial organisms,
low damage to environment and with short lifetime in water and soil, thus, it is a suitable
case for inclusion in integrated control programmes. Azadirachtin is present in not only
the seeds of oval ripe fruits, but also in the twigs, leaves and barks of Neem tree [47-50].
Sujanya et al [51] have studied the in vitro production of Az from cell suspension
cultures. Az production from hairy root cultures was studied by Satdive et al [52]. Neem
tree is the rich source of not only the Az but over 300 other compounds can also be
isolated from it, one-third of which are tetranorterpenoids [48] including Az, nimbin,
salanin, azadirachtor etc. and 30-50 % oil [53]. The most important and potent of these,
Az is reported to have antifeedant, insect repellent and ovicidal properties [45,53].

96
Martinez has given a useful account of the pests that can be controlled by Neem
Figure 3.2.1 Molecular Structure of Azadirachtin
formulations [54]. The potency of Az against several pathogens has been studied [55, 56,
57, 58] by several researchers. Jenkins et al [59] analysed the effect of storage conditions
on the efficacy of Az. azadirachtin has been found to mimic the insect hormones and
block the larval development [45] of insects thus inhibiting their growth. Vervek and
Wright [60] observed that many active components that are present along with Az deliver
a synergistic effect on the biological activity of Az as compared to when the equivalent
amount of pure Az is used. HPLC technique is very commonly applied to determine the
amount of Az in Neem kernels whereby. Ruch [61] has given a preview of the HPLC
method for Az determination. Menezes et al [62] determined Az in fish and pond water
samples. Kaushik employed HPLC and gas-liquid chromatography (GLC) [53]
techniques for determination of azadirachtin and fatty acid methyl esters in Neem seeds.
Barrek et al [63] analysed Neem oils by LC-MS and studied degradation kinetics of Az
A. Schaaf et al [64] developed a new method for Az by HPLC and atmospheric pressure
chemical ionization mass spectrometry. Thoeming et al [65] have studied the persistence

97
of Az and related compounds in soil and bean plants. Dai et al [66] optimized a
microwave assisted process (MAP) for Az extraction which could greatly reduce the time
required to extract Az and other limonoids from Neem. Caboni et al determined the Az
residues on strawberries and olives [67,68]. The stability of Az in aqueous and organic
solvents has been studied by Jarvis et al [69]. Sarais et al [70] developed a simple and
selective method for Az content in fruits and vegetables using LC- Electrospray
ionization tandem mass spectrometry. Sannino [71] has described an HPLC/tandem mass
spectrometric method for Az determination in fruits and vegetables. HPLC-MS/MS
detection (Selected Reaction Monitoring; SRM) [72] was also applied to determine Az
content. Dai et al used spectromphotometry [73] and multivariate calibration [74] to
determine total azadirachtin related limonoids. Ambosino et al [47] used a new
supercritical extraction methodology to extract Az A from kernels, followed by
evaluation using HPLC and LC/MS. Thompson et al employed HPLC/DAD technique
for analyzing Az in water sediments [75]. Agrawal et al [76] have presented an HPTLC
and packed column supercritical fluid Chromatographic separation of azadirachtin
components from Neem seed extracts. Sanguanpong has developed a method for the
Neem based extract processing [77]. Govindachari et al [78] were successful in isolating
new azadirachtin components; H & I by HPLC.
Ramesh et al [79] have mentioned the use of graphitized carbon black SPE methods for
concentration of active Neem components like azadirachtin A and B. Jarvis and Morgan
[80] display the use of SPE technique for the purification of triterpenoids and rapid
extraction of azadirachtin from tissue culture extracts. Ruch [81] has recommended the
use of SPE for determination of azadirachtin in water samples, soil and plant materials.
SPE was performed on Neem seed kernel, bark and leaf extracts and the amount of

98
azadirachtin was determined using HPLC-UV. In a similar manner the azadirachtin
content in tomato, carrot, brinjal, grapes and tea samples is described. The analytical
procedure involves extraction with methanol followed by the SPE. In the present work
C18 cartridges have been used for performing SPE (solid phase extraction) of Neem and
food samples. The extracts were analysed by HPLC-UV on a C18 column using
ACN/water as mobile phase in an isocratic flow. Studies were carried out at fortification
levels of 0.05-1 mg/kg and the mean recoveries were obtained in the range 70-102%. The
method was also used to determine the azadirachtin content from the Neem seed kernel,
leaves and bark extracts.
3.2.2 Experimental
3.2.2.1 Instruments
Solid phase extraction system VISIPREPTM
SPE Vacuum Manifolds,
(Supelco,
Bellefonte, PA, USA) with C18 cartridges (J.T. Bakers, U.S.A) was used for the
extraction of the analytes. HPLC system consisted of Dionex P680 HPLC pump, a
Dionex (Acclaim 120) C18 reversed-phase analytical column (4.6 x 250 mm, 5 μm) and a
Dionex UVD170U detector operated at a wavelength of 217 nm. Chromatographic data
was collected and recorded by Chromeleon software.
3.2.2.2 Materials and Reagents
Pesticide standard azadirachtin was obtained from Supelco (Bullefonte, PA, USA),
gradient grade ACN and Methanol were obtained from J.T. Baker Chemicals, USA.
Triply distilled water was used for all purposes. All the solvents were filtered through
99
Nylon 6.6 membrane filters (Rankem) using filtration assembly (Perfit, India) and were
sonicated before use.
3.2.2.3 Standard solutions
Stock solutions were prepared by dissolving the 1 mg of the standard azadirachtin in10
mL of methanol and the solution was diluted as per requirement with methanol. All the
solutions were stored in a refrigerator.
3.2.3 Procedure
3.2.3.1 Extraction of azadirachtin from Neem Tree Parts
3.2.3.1.1 Extraction of azadirachtin from neem seed kernels
The Neem seeds were deshelled and kernels were used for the extraction of azadirachtin.
5 g of powdered Neem seed kernels were stirred with 60 ml hexane to remove the oil.
The defatted residue was extracted with 3 x 10 ml portions of methanol by stirring. The
extract was filtered and the filtrate was collected. Methanol was evaporated from this
extract by rotary evaporator and the residue containing azadirachtin was re-dissolved in
water to make the volume 10 ml.
3.2.3.1.2. Extraction of azadirachtin from neem leaves and barks
The Neem leaves and bark were extracted using the same procedure as for neem seed
kernels without the defatting step with hexane.
3.2.3.2 Solid Phase Extraction of azadirachtin
The solid phase extraction of the neem tree part extracts was performed using the SPE
100
system VISIPREPTM
SPE Vacuum Manifolds, (Supelco, Bellefonte, PA, USA) and C18
cartridges from J. T. Baker were used. The C18 cartridges were attached to the solvent
recovery assembly and connected to a vacuum pump. The conditioning was done with
1mL each of Acetonitrile, Methanol and triply distilled water. The aqueous extracts from
Neem tree parts were pre-concentrated using Solid Phase Extraction (SPE). The analytes
were eluted with 3 mL of methanol.
3.2.3.3 Preparation of food samples
3.2.3.3.1. Preparation of tomato, grapes, brinjal and carrot samples
The azadirachtin content was determined in tomatoes, grapes, brinjal and carrot samples.
Tomatoes, grapes, brinjal and carrot were homogenized with a food blender. The Az
standard solutions were added to 20 g of tomatoes, grapes, brinjal and carrot samples.
These samples were mixed and allowed to stand for 15 minutes, 5 g of NaCl was added
to 20 g of homogenate and stirred at a high speed. The samples were extracted with 15 ml
of methanol and extracts were collected in beaker. The extracts were concentrated by
room temperature evaporation of methanol to 10ml. The extracts were pre-concentrated
using the SPE and the residue was finally eluted with Methanol. This sample was injected
into the HPLC system for analysis. Triple replicates at each fortification level were
prepared. Limit of quantification (LOQ) was defined as amount equal to ten times the
method noise, which included the instrument noise and the background signal contributed
by the matrix blank. Calibration curves were used to quantify the amount obtained in
these samples.
101
3.2.3.3.2 Preparation of Tea samples
Tea samples were prepared by mixing standard Az solution with 5 g of tea leaves and
stirring it with 15 ml Methanol. The process was repeated with 2 x 15 ml portions of
methanol and the extracts were combined. The rest of the procedure followed was same
as that followed for the other food samples.
3.2.3.4. Procedure for solid phase extraction
The solid phase extraction was optimized by passing 10 ml of the spiked food extracts
through the C18 cartridges. The SPE cartridges (octadecyl) were first conditioned with 1
mL each of ACN, Methanol and then with triply distilled water. The water extracts of the
food samples were passed through the cartridges under pressure. The analytes were then
eluted with 3 mL of methanol.
3.2.4 Results and Discussion
3.2.4.1 Optimization of SPE
SPE columns were used for the pre-concentration of neem tree extracts as well as for
food sample extracts. The elution took place efficiently after the conditioning of the
cartridges with 1 mL each of acetonitrile, methanol and triply distilled water in this order.
The aqueous extracts from various samples were then passed through the cartridges under
pressure and the elution was done with 3 mL of methanol.
3.2.4.2 HPLC determination of azadirachtin A and B
The ACN/Water, isocratic elution allowed the chromatographic separation of
azadirachtin components. The run time was 15 minutes and the retention times of Az A
102
and Az B were 10.6 and 11.2 minutes respectively. It was observed that after the clean up
with SPE, no interfering peaks were observed near the retention times of the Az A and
Az B. Characteristic chromatogram showing separation of Az A and Az B is given in
figure 3.2.2.
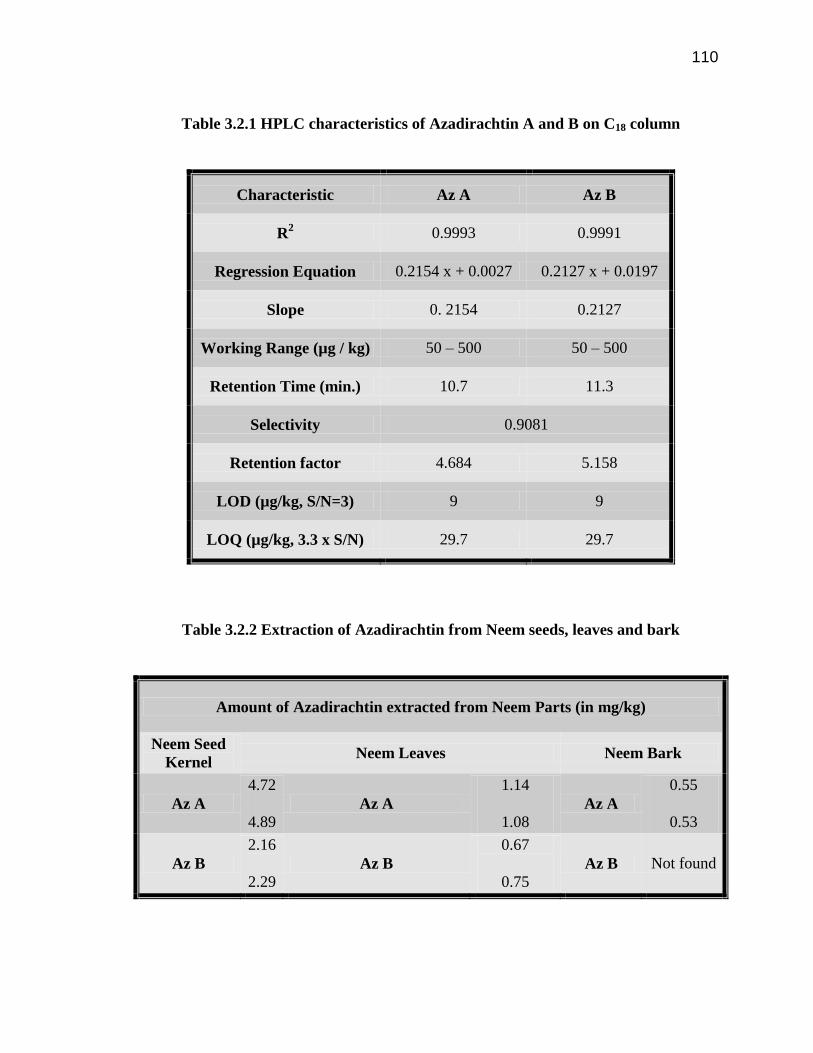
3.2.4.3 Linearity
Standard calibration curves of azadirachtin were found to be linear in the range 0.05 to 5
mg/kg with a correlation coefficient of 0.999. Characteristics of the calibration curve are
summarized in Table 3.2.1.
3.2.4.4 Method Validation
3.2.4.4.1 Extraction of Az from Neem seeds, leaves and bark
The Neem seed kernels, leaves and bark were stirred with methanol and SPE was
performed to obtain the extracts. These extracts were analysed through HPLC to
determine the amount of Az A and Az B present in the Neem tree parts. The Neem tree
parts had an average amount of Az A and Az B as: seed kernels (Figure 3.2.3) 4.81
mg/kg and 2.25 mg/kg, leaves (Figure 3.2.4) had 1.11 mg/kg and 0.71 mg/kg respectively
and the bark (Figure 3.2.5) contained an average amount of 0.540 mg/kg of Az A (Table
3.2.2).
3.2.4.5. Application of method to azadirachtin determination in food samples
The HPLC method was successfully used to determine the amount of azadirachtin A and
B in the spiked samples of brinjal (Figure 3.2.6 a and 3.2.6 b), tomatoes (Figure 3.2.7 a
and 3.2.7 b), tea leaves (Figure 3.2.8 a and 3.2.8 b), grapes (Figure 3.2.9 a and 3.2.9 b)
103
and carrot (Figure 3.2.10 a and 3.2.10 b) after performing their solid phase extraction.
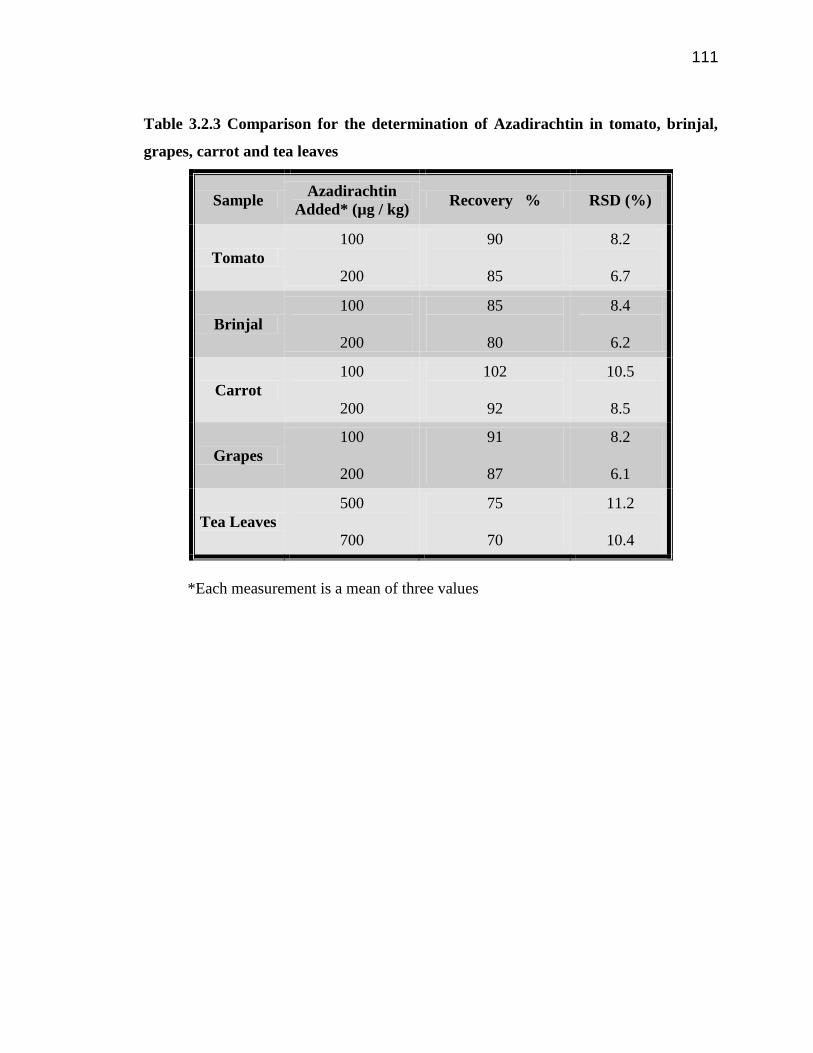
3.2.4.6. Recoveries
The recovery of Az from the spiked samples shows good recoveries (Table 3.2.3) in case
of fruits and vegetable samples (>80 %) and more than 70 % for tea samples and the R.
S. D. values ranging between 5 and 10 %. The LOD was determined as the sample
concentration which produces that produces a peak with height three times the level of
baseline noise.
3.2.5 Conclusions
In the present work SPE technique has been used to extract azadirachtin A and B from
Neem tree parts like seed kernels, leaves and barks followed by their Liquid
Chromatographic determination. Further the method has been successfully validated by
the determination of azadirachtin A and B from tomato, grapes, brinjal, carrot and tea.
The LOQs for azadirachtin A and B are 29.7 µg / kg.

104
Figure 3.2.2: HPLC chromatogram of AZ standard at 217 nm, with mobile phase
ACN/Water (40/60) at a concentration of 50 µg / kg.
0
0.5
1
1.5
2
2.5
3
3.5
4
0 2 4 6 8 10 12 14
Peak H
eig
ht
(mA
U)
Retention Time (min)
Az A Az B

105
Figure 3.2.3: HPLC chromatogram of neem seed kernel extract. Rest of the
conditions same as in figure 3.2.1
Figure 3.2.4: HPLC chromatogram of neem leaves extract. Rest of the conditions
same as in figure 3.2.1
0
50
100
150
200
0 5 10 15
Pe
ak H
eig
ht
(mA
U)
Retention Time (min)
Az B
Az A
0
10
20
30
40
50
0 2 4 6 8 10 12 14 16
Retention Time (min)
Peak H
eig
ht
(mA
U)
AZ AAZ B

106
Figure 3.2.5: HPLC chromatogram of neem bark extract. Rest of the conditions
same as in figure 3.2.1
0
10
20
30
40
50
0 2 4 6 8 10 12 14
Peak H
eig
ht
(mA
U)
Retention Time (min)
Aza A
107
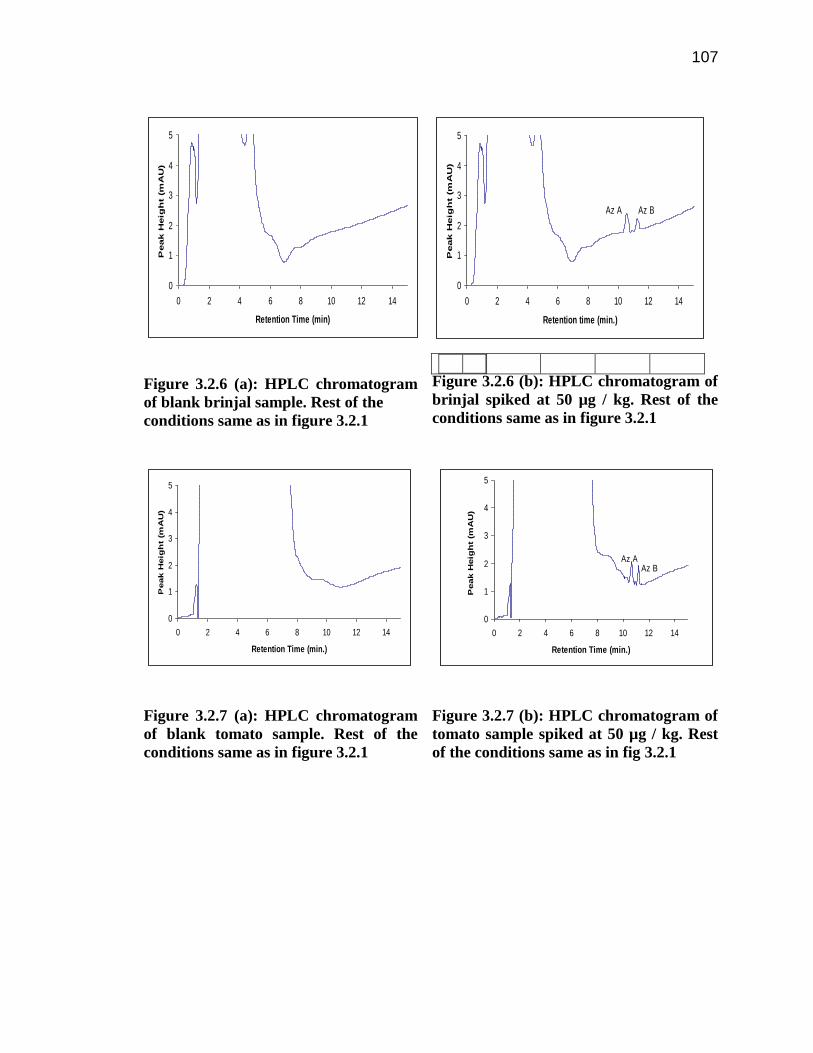
Figure 3.2.6 (a): HPLC chromatogram
of blank brinjal sample. Rest of the
conditions same as in figure 3.2.1
Figure 3.2.6 (b): HPLC chromatogram of
brinjal spiked at 50 µg / kg. Rest of the
conditions same as in figure 3.2.1
Figure 3.2.7 (a): HPLC chromatogram
of blank tomato sample. Rest of the
conditions same as in figure 3.2.1
Figure 3.2.7 (b): HPLC chromatogram of
tomato sample spiked at 50 µg / kg. Rest
of the conditions same as in fig 3.2.1
0
1
2
3
4
5
0 2 4 6 8 10 12 14
Retention Time (min)
Peak H
eig
ht
(mA
U)
0
1
2
3
4
5
0 2 4 6 8 10 12 14
Retention time (min.)
Peak H
eig
ht
(mA
U)
Az A Az B
0
1
2
3
4
5
0 2 4 6 8 10 12 14
Retention Time (min.)
Peak H
eig
ht
(mA
U)
0
1
2
3
4
5
0 2 4 6 8 10 12 14
Retention Time (min.)
Peak H
eig
ht
(mA
U)
Az AAz B

108
Figure 3.2.8 (a): HPLC chromatogram
of blank tea sample. Rest of the
conditions same as in figure 3.2.1
Figure 3.2.8 (b): HPLC chromatogram of
tea sample spiked at 50 µg / kg. Rest of
the conditions same as in figure 3.2.1
Figure 3.2.9 (a): HPLC chromatogram
of blank grapes sample. Rest of the
conditions same as in figure 3.2.1
Figure 3.2.9 (b): HPLC chromatogram of
grapes spiked at 50 µg / kg. Rest of the
conditions same as in figure 3.2.1
-1
0
1
2
3
4
5
6
7
8
0 2 4 6 8 10 12 14
Retention Time (min)
Peak H
eig
ht (m
AU
)
0
1
2
3
4
5
0 2 4 6 8 10 12 14
Retention Time (min.)
Peak H
eig
ht
(mA
U) Az A Az B
0
1
2
3
4
5
0 2 4 6 8 10 12 14
Retention Time (min.)
Peak H
eig
ht
(mA
U)
0
1
2
3
4
5
0 2 4 6 8 10 12 14
Retention Time (min.)
Peak H
eig
ht
(mA
U)
Az A Az B

109
Figure 3.2.10 (a): HPLC chromatogram of blank carrot sample. Rest of the
conditions same as in figure 3.2.1
Figure 3.2.10 (b): HPLC chromatogram of carrot sample spiked at 50 µg / kg. Rest
of the conditions same as in figure 3.2.1
0
1
2
3
4
5
0 1 2 3 4 5 6 7 8 9 10 11 12 13 14 15
Retention Time (min)
Peak h
eig
ht
(mA
U)
0
1
2
3
4
5
0 2 4 6 8 10 12 14
Retention time (min.)
Peak H
eig
ht
(mA
U)
Az AAz B
110
Table 3.2.1 HPLC characteristics of Azadirachtin A and B on C18 column
Characteristic Az A Az B
R2 0.9993 0.9991
Regression Equation 0.2154 x + 0.0027 0.2127 x + 0.0197
Slope 0. 2154 0.2127
Working Range (µg / kg) 50 – 500 50 – 500
Retention Time (min.) 10.7 11.3
Selectivity 0.9081
Retention factor 4.684 5.158
LOD (µg/kg, S/N=3) 9 9
LOQ (µg/kg, 3.3 x S/N) 29.7 29.7
Table 3.2.2 Extraction of Azadirachtin from Neem seeds, leaves and bark
Amount of Azadirachtin extracted from Neem Parts (in mg/kg)
Neem Seed
Kernel Neem Leaves Neem Bark
Az A
4.72
4.89
Az A
1.14
1.08
Az A
0.55
0.53
Az B
2.16
2.29
Az B
0.67
0.75
Az B Not found
111
Table 3.2.3 Comparison for the determination of Azadirachtin in tomato, brinjal,
grapes, carrot and tea leaves
Sample Azadirachtin
Added* (µg / kg) Recovery % RSD (%)
Tomato
100
200
90
85
8.2
6.7
Brinjal
100
200
85
80
8.4
6.2
Carrot
100
200
102
92
10.5
8.5
Grapes
100
200
91
87
8.2
6.1
Tea Leaves
500
700
75
70
11.2
10.4
*Each measurement is a mean of three values

112
References
1. S. R. Sorensen, C. N. Albers and J. Aamand, Appl. Environ. Microbiol. 74 (2008)
2332.
2. G.M.F Pinto and I.C.S.F. Jardim, J. Liq. Chrom. Rel. Technol. 23 (2000) 1353.
3. H. Cederlund, E. Börjesson, K. Önneby and J. Stenström, Soil Biol. Biochem. 39
(2007) 473.
4. E. Van-der-Heeft, E. Dijkman, R. A. Baumann and E.A. Hogendorn, J.
Chromatogr. A 879 (2000) 39.
5. S. Canonica and H. U. Laubscher, Photochem. Photobiol. Sci. 7 (2008)547.
6. A.A. Khodja, B. Laverdine, C. Richard and T. Sehili, Int. J. Photoenergy 4 (2002)
147.
7. L.E. Sojo, D.S. Gamble and D.W. Gutzman, J. Agric. Food Chem. 45 (1997)
3634.
8. J. F. Lawerence, C. Menard, M.C. Hennion, V. Pichon, F. LeGoffic and N
Durand, J. Chromatogr. A 732 (1996)147.
9. Organonitrogen pesticides Method: 5601, NIOSH manual of analytical methods,
(1998) pp 1-21.
10. H. Berrada, G. Font and J. C. Molto, J. Chromatogr. A 1042 (2004) 9.
11. R. Jeannot, H. Sabik, E. and E. Genin, J. Chromatogr. A 879 (2000) 55.
12. S. Herrera, A. Martin Esteban, P. Fernandez, D. Stevenson and C. Camara
Fresinius J. Anal. Chem. 362 (1998) 547.
13. Fast multi-residue pesticide analysis in soil and vegetable samples, application
note, mass spectrometry, www.appliedbiosystems.com.
113
14. A. Martin-Esteban, P. Fernandez, D. Stevenson, and C. Camara, Analyst 122
(1997) 1113.
15. I. Ferrer and D. Barcelo, Analusis 26 (1998) 118.
16. T. Yarita, K. Sugino, T. Ihara and A. Nomura, Anal. Commun. 35 (1998) 91.
17. M. S. Barroso, L.N. Konda and G. Morovjan, J. High Resol. Chromatogr. 22
(1999) 171.
18. S. Batista, E. Silva, S. Galhardo, P. Viana and M.J. Cerejeira, Int. J. Environ.
Anal. Chem. 82 (2002) 601.
19. M. Chicharro, E. Bermejo, A. Sanchez, A. Zapardiel, A. Fernandez-Gutierrez and
D. Arraez, Anal. Bioanal. Chem. 382(2005) 519.
20. A. Bautista, J. J. Aaron, M.C. Mahedero and A. Munoz de La Pena, Analusis 27
(1999) 857.
21. M. D. Gil-García, M. Martinez-Galera, P. Parrilla-Vázquez, A. R. Mughari and I.
M. Ortiz-Rodríguez, J. Fluoresc.18 (2008) 365.
22. I. Baranowiska, C. Pieszko, Anal. Lett. 35 (2002) 413.
23. J. Sherma, Acta Chromatographia 15 (2005) 5.
24. Mahedero M.C. de la Peña and A. Bautista-Sánchez, Talanta 13 (2003) 279.
25. I. Ferrer, V. Pichon, M. C. Hennion and D. Barceló, J. Chromatogr. A 1 (1997)
91.
26. F. Li, D. Martens and A. Kettrup, Se Pu 19 (2001) 534.
27. T. Cserhati, E. Forgács, Z. Deyl, I. Miksik and A. Eckhardt, Biomed. Chromatogr.
18 (2004) 350.
28. M. J. I. Mattina, J. Chromatogr. A 549 (1991) 237.

114
29. M. Hamada and R. Wintersteiger, J. Planar Chromatogr. Modern TLC 15 (2002)
11.
30. J. F. Garc ´a-Reyes, B. Gilbert-Lo´pez and A. Molina-D ´az, Anal. Chem. 30
(2002) 8966.
31. M. A. Mumin, K. F. Akhter and M.Z Abedin, M. J. Chem. 8 (2008) 45.
32. X. L. Cao, J. Corriveau and S. Popovic, J. Agric. Food Chem. 57 (2009) 1307.
33. Z. Pan, L. Wang, W. Mo, C. Wang, W. Hu, and J. Zhang, Anal. Chim. Acta 545
(2005) 218.
34. R. Lucena, S. Cardenas, M. Gallego and M. Valcarcel, Anal. Chim. Acta 530
(2005) 283.
35. E. Papadopoulou-Mourkidou, J. Patsias, E. Papadakis and A. Koukourikou,
Fresenius J. Anal. Chem. 371 (2001) 491.
36. N. Yoshioka and K. Ichihashi, Talanta 74 (2008) 1408.
37. J. Patsias and E. Papadopoulou-Mourkidou, J. AOAC Int. 82 (1999) 968.
38. A. C. Gerecke, C. Tixier, T. Bartels, R.P. Schwarzenbach and S. R. Müller, J.
Chromatogr. A 930 (2001) 9.
39. A. R. Mughari, P. Parrilla Vázquez and M. M. Galera, Anal. Chim. Acta 593
(2007) 157.
40. J. T. MacGregor, Report to Organisation for Economic cooperation and
development, Paris, France, 3 (2005).
41. S. Rengasamy, N. Kaushik, J. Kumar, O. Koul, B. S. Parmar, In: R. P. Singh (ed)
World Neem Conf. Oxford and IBHCO, New Delhi, (1993) 207.
42. M. G. Kumar, R. J. Kumar, A. Regupathy, B. Rajasekharan, Neem Update 1
(1995) 4.

115
43. N. Kaushik, B. G. Singh, In B. Sener, (Ed) Proc 3rd
IUPAC Int Conf on
Biodiversity(ICOB-3), Antalya, Turkey, November 3-8 2001. Kluwer Academic,
283-286.
44. O.P. Sidhu, H.M. Behl, Curr. Sci. 70 (1996) 1084.
45. S. J. Pattnaik, N. D. R. Rao, P. Chary, Curr. Sci. 91 (2006) 628.
46. B. Venkateswarlu, M. Pirat, N. Kishore, A. Rasul, World J. Microbiol.
Biotechnol. 24 (2008) 1243.
47. P. Ambrosino, R. Fresa, V. Fogliano, S. M. Monti, A. J. Ritieni, J.
Agric. Food Chem. 47 (1999) 5252.
48. C.H. S. S. R. Kumar, M. Srinivas, S. Yakkundi, Phytochem. 43 (1996) 451.
49. Y. C. Ragasa, Z. D. Nacpil, G. M. Natividad, M. Tada, J. C. Coll and J. Rideout,
Photochem. 46 (1997) 555.
50. I. Ara, B.S. Siddiqui, S. Faizi and S. Siddiqui, Photochem. 27 (1988) 1801.
51. S. Sujanya, B.P. Devi and I. Sai, J. Biosci. 33 (2008) 113.
52. R. K. Satdive, D. P. Fulzele and S. Eapen, BARC Newsletter 273 (2006) 195.
53. N. Kaushik, Anal. Bioanal. Chem. 374 (2002) 1199.
54. S. S. Martinez, Practice oriented results on use and production of plant extracts
and pheromones in integrated and biological pest control, 1 Workshop, Uberaba,
Brazil, March 29-30, (2001) 23.
55. V. Sharma, S. Walia, S. Dhingra, J.Kumar and B. S. Parmar, Pest Manag. Sci. 62
(2006) 965.
56. N. M. Hassanein, M. A. A. Zeid, K. A. Youssef and D. A. Mahmoud, Aust. J.
Basic Appl. Sci. 2 (2008) 763.
57. J. C. T. Silva, D. L. Oliviera, G.N. Jham and N. D. C. Aguiar, Trop. Plant Pathol.

116
33 (2008) 171.
58. M. Serit, M. Ishida, K. Nakata, M. Kim and S. Takahashi, J. Pestic. Sci. 17 (1992)
267.
59. D. A. Jenkins and F. V. Dunkel, Storage of Neem Kernel Extract : Differential
Effects of Temperature on Oviposition Deterrency and Larval Toxicity, IPM
CRSP working paper, Office of International Research and Development,
Blacksburg, Virginia, June 1997,1-23.
60. R. H. Verkek and D. J. Wright, Pest. Sci. 37 (1993) 83.
61. B.Ruch, Practice oriented results on use and production of plant extracts and
pheromones in integrated and biological pest control, 1 Workshop, Uberaba,
Brazil, March 29-30, 2001, Pages 28-30.
62. M. L. Menezes, A.C. Dalbeto, C. Cruz and J. M. G. Neto, Saluvista Bauru 23
(2003) 401.
63. S. Barrek, O. Paisse, M. F. Grenier-Loustalot, Anal. Bioanal. Chem. 378 (2004)
753.
64. O. Schaaf, A. P. Jarvis, S. A. van der Esch, G.Giagnacovo and N. J. Oldham, J.
Chromatogr. A 21 (2000) 89.
65. G. Thoeming, G. Draeger and H. M. Poehling, Pest Manag. Sci. 62 (2006) 759.
66. J. Dai, V. A. Yaylayan, G. S. V. Raghavan, J. R. J. Paré, Z. Liu and J. M. R.
Bélanger, J. Agric. Food Chem.49 (2001) 4584.
67. P. Caboni, G. Sarais, A. Angioni, A. J. Garcia, F. Lai, F. Dedola and P. Cabras, J.
Agric. Food Chem. 54 (2006) 10026.
68. P. Caboni, M. Cabras, A. Angioni, M. Russo and P. Cabras, J. Agric. Food Chem.
50 (2002) 3491.
117
69. A. P. Jarvis, S. Jhonson and E. D. Morgan, Pest Management 53 (1999) 217.
70. G. Sarais, P. Caboni, E. Sarritzu, M. Russo and P. Cabras, J. Agric. Food Chem.
56 (2008) 2939.
71. A. Sannino, Rapid Commun. Mass Spectrom. 21 (2007) 2079.
72. M. R. Forim, V. E. Cornélio, M. F. da Silva, E. Rodrigues-Filho, J. B. Fernandes,
P. C.Vieira, S. S. Matinez, M. P.Napolitano and R. A. Yost, Phytochem. Anal. 21
(2010) 363.
73. J. Dai, V.A. Yaylayan, G. S. V. Raghavan, J.R. Paré and Z. Liu, J. Agric. Food
Chem. 49 (2001) 1169.
74. J. Dai, , V.A. Yaylayan, G. S. V. Raghavan and J.R. Paré, J. Agric. Food Chem.
47 (1999) 3738.
75. D. G. Thompson, D. T. Chartrand and D. P. Kreutzweiser, Ecotoxicol. Environ.
Saf. 59 (2004) 186.
76. H. Agrawal, N. Kaul, A. R. Paradkar and K. R. Mahadik, Chromatographia 62
(2005) 183.
77. U. Sanguanpong, Journal of Agiculture and rural development in the tropics and
sub tropics, Suppl. 80, Proc 4th
Int. Symp. cum workshop in South East Asia,
October 2003, Pages 168-179.
78. T.R. Govindachari, G. Sandhya and S.P. Ganeshraj, Chromatographia 31 (1991)
303.
79. A. Ramesh and M. Balasubramanian, Analyst 124 (1998) 19.
80. A. P. Jarvis and E. D. Morgan, Phytochem. Anal. 11 (2000) 184.
81. B. Ruch, Proc. Of 2nd
Workshop, “Neem and Pheromones” University of
Uberaba, Brazil, May 15-21 (2001) 50.