301 - universität kasseljournal of cellular plastics 2012 48: 301 andrzej kornelius bledzki,...
TRANSCRIPT

http://cel.sagepub.com/Journal of Cellular Plastics
http://cel.sagepub.com/content/48/4/301The online version of this article can be found at:
DOI: 10.1177/0021955X12441193
2012 48: 301Journal of Cellular PlasticsAndrzej Kornelius Bledzki, Hendrik Kirschling, Martin Rohleder and Andris Chate
mechanical properties of microcellular polycarbonateCorrelation between injection moulding processing parameters and
Published by:
http://www.sagepublications.com
can be found at:Journal of Cellular PlasticsAdditional services and information for
http://cel.sagepub.com/cgi/alertsEmail Alerts:
http://cel.sagepub.com/subscriptionsSubscriptions:
http://www.sagepub.com/journalsReprints.navReprints:
http://www.sagepub.com/journalsPermissions.navPermissions:
http://cel.sagepub.com/content/48/4/301.refs.htmlCitations:
What is This?
- Jul 26, 2012Version of Record >>
at UNIVERSITAETSBIBLIOTHEK KASSEL on November 4, 2014cel.sagepub.comDownloaded from at UNIVERSITAETSBIBLIOTHEK KASSEL on November 4, 2014cel.sagepub.comDownloaded from
Article
Correlation betweeninjection moulding pro-cessing parameters andmechanical properties ofmicrocellularpolycarbonate
Andrzej Kornelius Bledzki1,2, Hendrik Kirschling1,
Martin Rohleder1 and Andris Chate3
Abstract
Since many decades, microcellular foamed materials have been produced basically to
reduce the density of the materials in order to get lightweight parts. Meanwhile, it is
well known that microcellular foaming by injection moulding offers many more advan-
tages compared to compact injection moulding. Those are, e.g. lower shrinkage and
warpage, shorter cycle times, lower clamp forces, reduced viscosity but improved
properties of the foamed material in contrast to the compact material. These argu-
ments are all known, but to improve the properties of the material, it is necessary to
understand the interrelationship between the morphology and the mechanical proper-
ties. Furthermore, it is important to know how the processing parameters influence the
morphology and the properties of the produced part. By understanding the relation
between processing parameters and the consequential properties, it has become pos-
sible to create microcellular foamed parts with exactly defined properties. Through the
variation of different processing parameters such as blowing agent concentration, injec-
tion velocity, mass temperature, mould temperature, weight reduction and different
moulding processes like gas counter pressure injection moulded test, samples were
produced to characterise the morphology and the mechanical properties. The experi-
ments were performed with a polycarbonate type from Bayer MaterialScience. The cell
size, thickness of the skin layer and distance between the cells were correlated to the
processing parameters by means of nonlinear regression equations. Based on these
1Institute for Materials Engineering, University Kassel, Kassel, Germany2Institute of Materials Science and Engineering, West Pomeranian University of Technology, Szczecin, Poland3Institute of Materials and Structures, Riga Technical University, Riga, Latvia
Corresponding author:
Martin Rohleder, Institute for Materials Engineering, University Kassel, Kassel, Germany
Email: [email protected]
Journal of Cellular Plastics
48(4) 301–340
� The Author(s) 2012
Reprints and permissions:
sagepub.co.uk/journalsPermissions.nav
DOI: 10.1177/0021955X12441193
cel.sagepub.com
at UNIVERSITAETSBIBLIOTHEK KASSEL on November 4, 2014cel.sagepub.comDownloaded from
equation, 3D graphs were created by variation of two parameters by fixing the remain-
ing parameters to illustrate the relationships. Furthermore, the relation between the
morphology and the mechanical properties was correlated, which makes it possible
to produce parts through injection moulding with a well-defined Young’s modulus or
flexural strength.
Keywords
Counter gas pressure, foam density, injection foam moulding, physical foaming/blowing
agent, precision mould opening, structural foams, surface quality, thermoplastic foams,
unfoams skin layer
Introduction
Foaming of thermoplastic polymers by injection moulding has been performedsince many decades. The microcellular foaming is well known since many yearsand there are many publications in this research area and many patents wereapplied for products and proceedings. Microcellular foams have advantages suchas reduced material consumption, lower processing temperatures, lower viscosity ofthe polymer melt, avoid shrinkage, reduced density by approximately equal mech-anical properties and many more. Especially, the low shrinkage is a very interestingpoint for industrial manufacturers. However, industrial applications of microcel-lular foams, which were produced by injection moulding, are very rare. With regardto the well-known advantages of microcellular foamed polymers and the possibilityto reduce investments for injection moulding machines,1,2 it is astonishing thatmicrocellular foam processing has not established in industrial application.
Although positive research results and publications on microcellular foams havebeen released,3–5 most of the companies hesitate to apply this technology, becausethe processing parameters are so extensive and most of the research was not doneon industrial scale. Most of the investigations in the past did dealt with industrialprocesses, but with foam produced with a batch process or other laboratory tech-nologies. On the one hand, microcellular foaming leads to a lower density and tosaving material which is a great advantage with regard to the automotive industrytrying to reduce the weight of each part in the vehicle. It also allows high technicalpolymer to compete with mass polymers both in price and density. On the otherhand, microcellular processing leads inevitably to a reduction of the mechanicalproperties. In the first instance, this is not problematic, but at present it is not yetpossible to forecast the mechanical properties of an injection moulded foam. Theproperties of these materials were extensively investigated, but the literature saysthat the properties of the foamed parts depend on the foaming technology and inparticular on the processing parameters during the production.6,7
To characterise the properties of microcellular foamed polymers, it is necessaryto understand the interrelations between processing parameters, foam morphologyand mechanical properties. A correlation of these parameters will allow producing
302 Journal of Cellular Plastics 48(4)
at UNIVERSITAETSBIBLIOTHEK KASSEL on November 4, 2014cel.sagepub.comDownloaded from
microcellular foamed materials with exactly defined parameters. This upgradesmicrocellular foaming and enables the industry to estimate the required processingparameters in order to get optimised foam structures with well-defined mechanicalproperties.
MucellTM technology
In the early 1980s, the MucellTM principles were developed at the MassachusettsInstitute of Technology, USA, to reach higher weight reductions. This technologyuses a physical blowing agent to foam the polymer. Usually, blowing agents such assupercritical nitrogen (N2) and carbon dioxide gases (CO2) are injected duringmoulding process by small, precise amounts into the molten polymer. The patentswere bought by Trexel Inc., which launched the technology on the market.8
Gas counter pressure
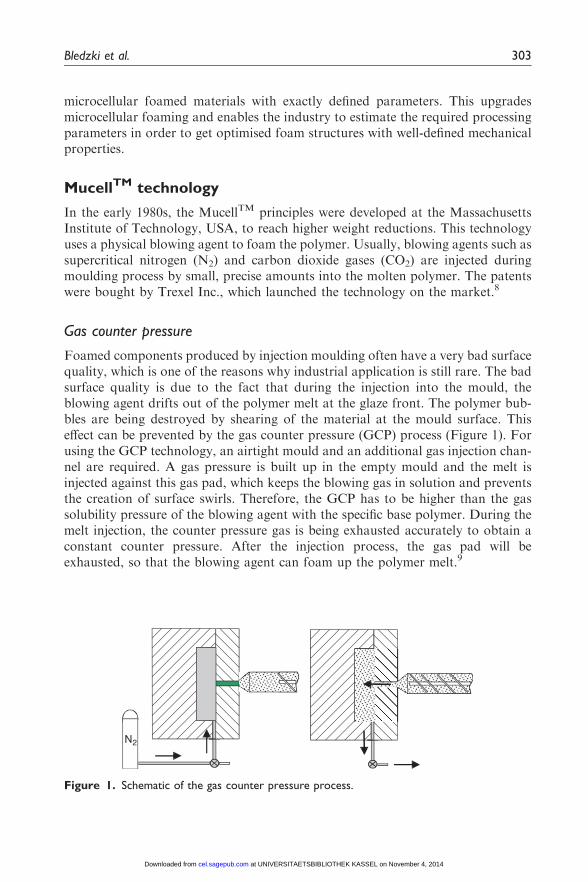
Foamed components produced by injection moulding often have a very bad surfacequality, which is one of the reasons why industrial application is still rare. The badsurface quality is due to the fact that during the injection into the mould, theblowing agent drifts out of the polymer melt at the glaze front. The polymer bub-bles are being destroyed by shearing of the material at the mould surface. Thiseffect can be prevented by the gas counter pressure (GCP) process (Figure 1). Forusing the GCP technology, an airtight mould and an additional gas injection chan-nel are required. A gas pressure is built up in the empty mould and the melt isinjected against this gas pad, which keeps the blowing gas in solution and preventsthe creation of surface swirls. Therefore, the GCP has to be higher than the gassolubility pressure of the blowing agent with the specific base polymer. During themelt injection, the counter pressure gas is being exhausted accurately to obtain aconstant counter pressure. After the injection process, the gas pad will beexhausted, so that the blowing agent can foam up the polymer melt.9
N2
Figure 1. Schematic of the gas counter pressure process.
Bledzki et al. 303
at UNIVERSITAETSBIBLIOTHEK KASSEL on November 4, 2014cel.sagepub.comDownloaded from
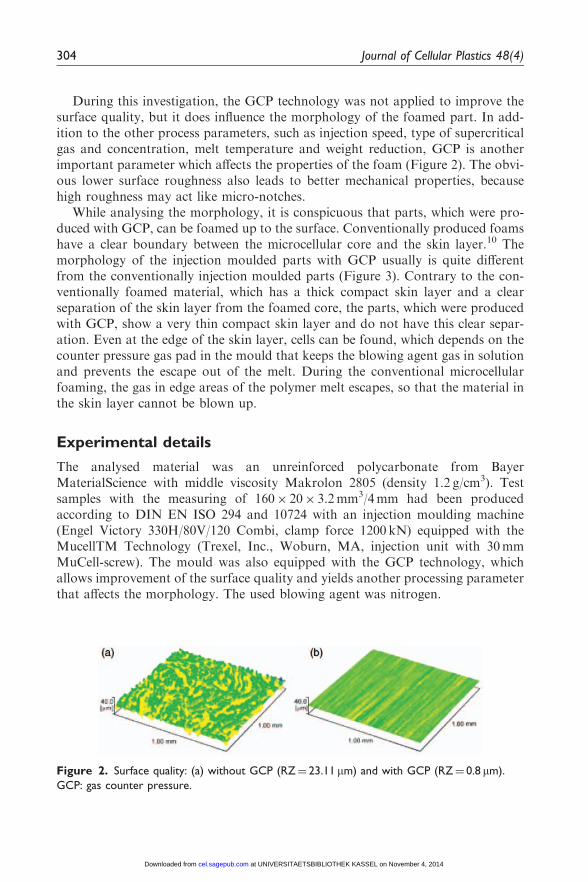
During this investigation, the GCP technology was not applied to improve thesurface quality, but it does influence the morphology of the foamed part. In add-ition to the other process parameters, such as injection speed, type of supercriticalgas and concentration, melt temperature and weight reduction, GCP is anotherimportant parameter which affects the properties of the foam (Figure 2). The obvi-ous lower surface roughness also leads to better mechanical properties, becausehigh roughness may act like micro-notches.
While analysing the morphology, it is conspicuous that parts, which were pro-duced with GCP, can be foamed up to the surface. Conventionally produced foamshave a clear boundary between the microcellular core and the skin layer.10 Themorphology of the injection moulded parts with GCP usually is quite differentfrom the conventionally injection moulded parts (Figure 3). Contrary to the con-ventionally foamed material, which has a thick compact skin layer and a clearseparation of the skin layer from the foamed core, the parts, which were producedwith GCP, show a very thin compact skin layer and do not have this clear separ-ation. Even at the edge of the skin layer, cells can be found, which depends on thecounter pressure gas pad in the mould that keeps the blowing agent gas in solutionand prevents the escape out of the melt. During the conventional microcellularfoaming, the gas in edge areas of the polymer melt escapes, so that the material inthe skin layer cannot be blown up.
Experimental details
The analysed material was an unreinforced polycarbonate from BayerMaterialScience with middle viscosity Makrolon 2805 (density 1.2 g/cm3). Testsamples with the measuring of 160� 20� 3.2mm3/4mm had been producedaccording to DIN EN ISO 294 and 10724 with an injection moulding machine(Engel Victory 330H/80V/120 Combi, clamp force 1200 kN) equipped with theMucellTM Technology (Trexel, Inc., Woburn, MA, injection unit with 30mmMuCell-screw). The mould was also equipped with the GCP technology, whichallows improvement of the surface quality and yields another processing parameterthat affects the morphology. The used blowing agent was nitrogen.
Figure 2. Surface quality: (a) without GCP (RZ¼ 23.11 mm) and with GCP (RZ¼ 0.8 mm).
GCP: gas counter pressure.
304 Journal of Cellular Plastics 48(4)
at UNIVERSITAETSBIBLIOTHEK KASSEL on November 4, 2014cel.sagepub.comDownloaded from

Analysis details
The test bars were concentrically milled out of the produced samples, so that thefoamed material could be tested. All test bars were milled out of test sampleshaving the same geometry, so that the influence of the mould geometry on themorphology would be equal for all tests. Equal geometry guarantees reproducibleconstant testing conditions for all different testing methods (Figure 4).
The following tests were performed.
. Tensile test according to DIN EN ISO 527
. Bending test according to DIN EN ISO 178
The tensile modulus, strength at yield and elongation at yield for the tensile test,and flexural modulus, flexural strength and elongation at flexural strength for thebending test, were analysed to correlate the mechanical properties with the foammorphology.
In order to characterise the morphology of the microcellular foamed materials,they were analysed by microscopy with regard to average cell diameters and dis-tances between the cells in the centre of the foam core, average cell diameters anddistances between the cells at the edge of the foam core and thickness of the skin
sample
milling millingsawing
sample
Figure 4. Sampling method of specimen for tensile and bending tests.
Figure 3. Comparison of (a) conventional foaming and (b) foaming with gas counter
pressure.11
Bledzki et al. 305
at UNIVERSITAETSBIBLIOTHEK KASSEL on November 4, 2014cel.sagepub.comDownloaded from
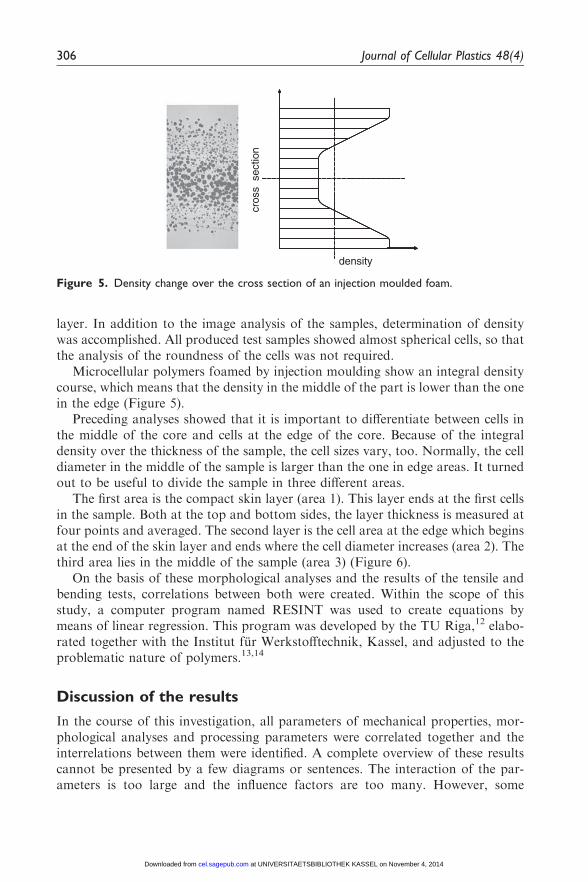
layer. In addition to the image analysis of the samples, determination of densitywas accomplished. All produced test samples showed almost spherical cells, so thatthe analysis of the roundness of the cells was not required.
Microcellular polymers foamed by injection moulding show an integral densitycourse, which means that the density in the middle of the part is lower than the onein the edge (Figure 5).
Preceding analyses showed that it is important to differentiate between cells inthe middle of the core and cells at the edge of the core. Because of the integraldensity over the thickness of the sample, the cell sizes vary, too. Normally, the celldiameter in the middle of the sample is larger than the one in edge areas. It turnedout to be useful to divide the sample in three different areas.
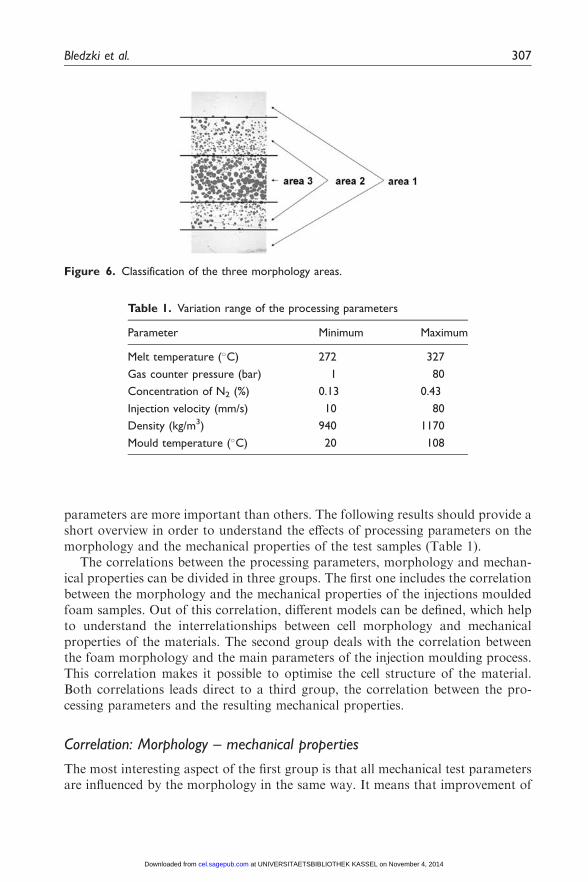
The first area is the compact skin layer (area 1). This layer ends at the first cellsin the sample. Both at the top and bottom sides, the layer thickness is measured atfour points and averaged. The second layer is the cell area at the edge which beginsat the end of the skin layer and ends where the cell diameter increases (area 2). Thethird area lies in the middle of the sample (area 3) (Figure 6).
On the basis of these morphological analyses and the results of the tensile andbending tests, correlations between both were created. Within the scope of thisstudy, a computer program named RESINT was used to create equations bymeans of linear regression. This program was developed by the TU Riga,12 elabo-rated together with the Institut fur Werkstofftechnik, Kassel, and adjusted to theproblematic nature of polymers.13,14
Discussion of the results
In the course of this investigation, all parameters of mechanical properties, mor-phological analyses and processing parameters were correlated together and theinterrelations between them were identified. A complete overview of these resultscannot be presented by a few diagrams or sentences. The interaction of the par-ameters is too large and the influence factors are too many. However, some
cros
s s
ectio
n density
Figure 5. Density change over the cross section of an injection moulded foam.
306 Journal of Cellular Plastics 48(4)
at UNIVERSITAETSBIBLIOTHEK KASSEL on November 4, 2014cel.sagepub.comDownloaded from
parameters are more important than others. The following results should provide ashort overview in order to understand the effects of processing parameters on themorphology and the mechanical properties of the test samples (Table 1).
The correlations between the processing parameters, morphology and mechan-ical properties can be divided in three groups. The first one includes the correlationbetween the morphology and the mechanical properties of the injections mouldedfoam samples. Out of this correlation, different models can be defined, which helpto understand the interrelationships between cell morphology and mechanicalproperties of the materials. The second group deals with the correlation betweenthe foam morphology and the main parameters of the injection moulding process.This correlation makes it possible to optimise the cell structure of the material.Both correlations leads direct to a third group, the correlation between the pro-cessing parameters and the resulting mechanical properties.
Correlation: Morphology – mechanical properties
The most interesting aspect of the first group is that all mechanical test parametersare influenced by the morphology in the same way. It means that improvement of
Figure 6. Classification of the three morphology areas.
Table 1. Variation range of the processing parameters
Parameter Minimum Maximum
Melt temperature (�C) 272 327
Gas counter pressure (bar) 1 80
Concentration of N2 (%) 0.13 0.43
Injection velocity (mm/s) 10 80
Density (kg/m3) 940 1170
Mould temperature (�C) 20 108
Bledzki et al. 307
at UNIVERSITAETSBIBLIOTHEK KASSEL on November 4, 2014cel.sagepub.comDownloaded from
the tensile modulus leads to improvement of strength at yield and flexural modulusas well. Therefore, manufacturers can improve the one property without worseningthe other.
Furthermore, the results showed that there is no ideal morphological modelwhich is best, but there are two models for bending and three models for tensileload, which are equivalent. Thus, the injection moulded microcellular foams showthe same structures as sandwich-models, the correlated models also have sandwichstructures.
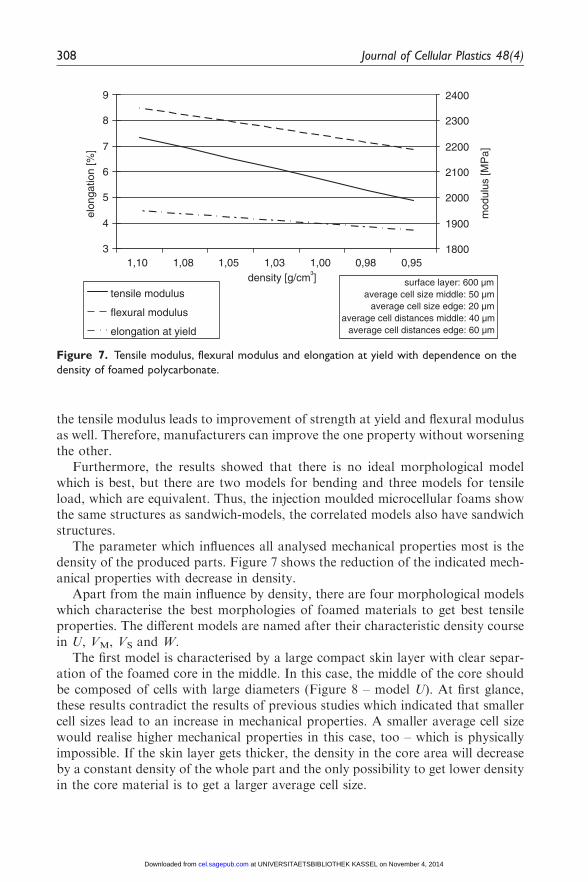
The parameter which influences all analysed mechanical properties most is thedensity of the produced parts. Figure 7 shows the reduction of the indicated mech-anical properties with decrease in density.
Apart from the main influence by density, there are four morphological modelswhich characterise the best morphologies of foamed materials to get best tensileproperties. The different models are named after their characteristic density coursein U, VM, VS and W.
The first model is characterised by a large compact skin layer with clear separ-ation of the foamed core in the middle. In this case, the middle of the core shouldbe composed of cells with large diameters (Figure 8 – model U). At first glance,these results contradict the results of previous studies which indicated that smallercell sizes lead to an increase in mechanical properties. A smaller average cell sizewould realise higher mechanical properties in this case, too – which is physicallyimpossible. If the skin layer gets thicker, the density in the core area will decreaseby a constant density of the whole part and the only possibility to get lower densityin the core material is to get a larger average cell size.
1800
1900
2000
2100
2200
2300
2400
0,950,981,001,031,051,081,10density [g/cm³]
mod
ulus
[MP
a]
3
4
5
6
7
8
9el
onga
tion
[%]
tensile modulus
flexural modulus
elongation at yield
surface layer: 600 µmaverage cell size middle: 50 µm
average cell size edge: 20 µmaverage cell distances middle: 40 µm
average cell distances edge: 60 µm
Figure 7. Tensile modulus, flexural modulus and elongation at yield with dependence on the
density of foamed polycarbonate.
308 Journal of Cellular Plastics 48(4)
at UNIVERSITAETSBIBLIOTHEK KASSEL on November 4, 2014cel.sagepub.comDownloaded from
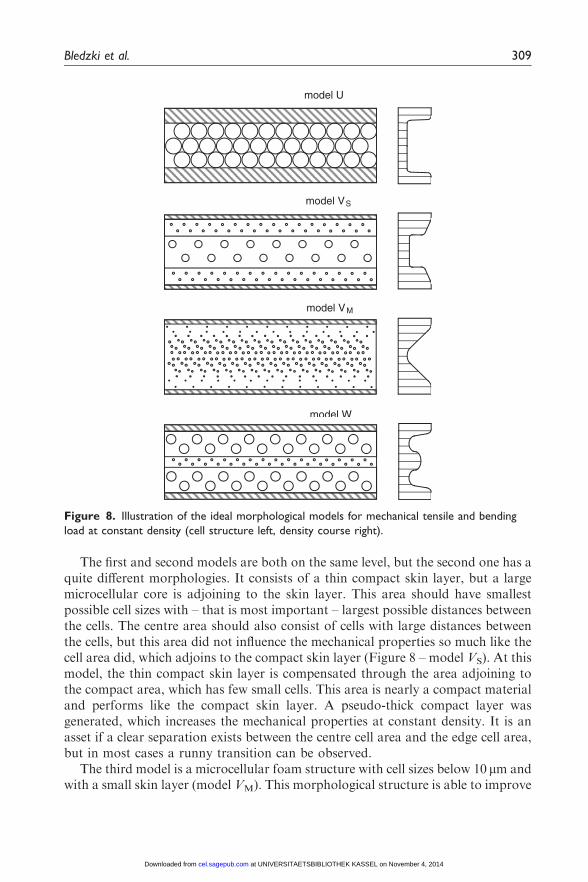
The first and second models are both on the same level, but the second one has aquite different morphologies. It consists of a thin compact skin layer, but a largemicrocellular core is adjoining to the skin layer. This area should have smallestpossible cell sizes with – that is most important – largest possible distances betweenthe cells. The centre area should also consist of cells with large distances betweenthe cells, but this area did not influence the mechanical properties so much like thecell area did, which adjoins to the compact skin layer (Figure 8 – model VS). At thismodel, the thin compact skin layer is compensated through the area adjoining tothe compact area, which has few small cells. This area is nearly a compact materialand performs like the compact skin layer. A pseudo-thick compact layer wasgenerated, which increases the mechanical properties at constant density. It is anasset if a clear separation exists between the centre cell area and the edge cell area,but in most cases a runny transition can be observed.
The third model is a microcellular foam structure with cell sizes below 10 mm andwith a small skin layer (model VM). This morphological structure is able to improve
model W
model VS
model VM
model U
Figure 8. Illustration of the ideal morphological models for mechanical tensile and bending
load at constant density (cell structure left, density course right).
Bledzki et al. 309
at UNIVERSITAETSBIBLIOTHEK KASSEL on November 4, 2014cel.sagepub.comDownloaded from

the impact strength of polycarbonate if the resin material breaks tough under thesame test conditions,15 but in cases of bending and tensile load, these foam struc-ture are not able to reach excellent stiffness and strength.
The morphology, which is shown in the fourth model (Figure 8 – model W), isvery rare, but under special processing parameters, it can be created. The mainpoint of this model is the centre area of the foamed material, which has very smallcell sizes with large cell distances between each other. This area acts, analogically tothe edge areas in model two, like compact material and it increases the mechanicalstrength of the moulded part. Together with the compact skin layers, there arethree compact areas that have a high strength and between them there is a highblown up foam core. To increase the volume of the three compact areas, it isnecessary that the areas between them have a low density in order to keep thedensity level of the whole part constant. It requires a large average cell size and ashort distance between the cells.
The sandwich models U and VS can be transferred to bending properties as well.With regard to the ideal structure of these models for bending load, those are thebest morphological structures. Model W is not suitable for bending load which isshown in Figure 9.
The top skin layer is loaded by compressive stress and the bottom by tensilestress. At the almost compact centre layer of this structure, the stress is very low, asthe stress changes from compressive into tensile stress. The centre layer does notreinforce the bending stiffness, which disqualifies model W for bendingapplications.
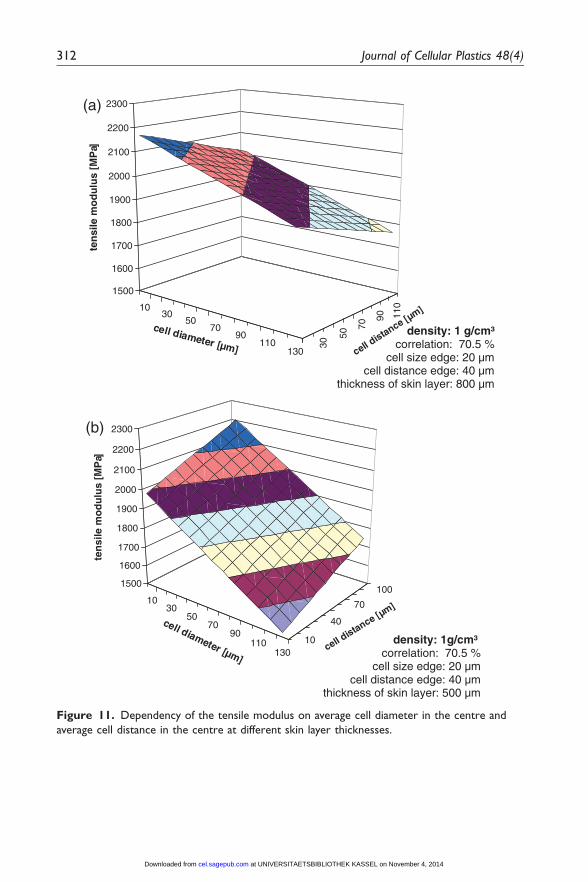
Figure 10 exemplarily shows the connection between different parameters. Toillustrate the relationships between parameters and the material properties, 3Dgraphs were created out of the correlation equations by fixing the not figuredparameters in the diagram on mean values. If the skin layer is thick, the cell diam-eter has to be large as well (sandwich model U). If the compact skin layer is small,the adjoining foam area has to be composed of cells with small diameters with largedistances between them (sandwich model V).
A good example for the sandwich model U is the examination of the tensilemodulus (Figure 11). When the skin layer has a thickness of 800mm (Figure 11(a)),the Young’s modulus decreases when the average distance between the cellsincreases, too. This can be explained by sandwich model U. Because of the thickskin layer, it is necessary to get a centre area with low density, so that the density of
Figure 9. Strain dispersion across the sample thickness at bending load at model W.
310 Journal of Cellular Plastics 48(4)
at UNIVERSITAETSBIBLIOTHEK KASSEL on November 4, 2014cel.sagepub.comDownloaded from

the whole part remains constant. This can only be reached by small distancesbetween the cells if the average cell size is constant. If the compact skin layerbecomes thinner, it is important to create a pseudocompact area in the foamedmaterial, which is shown in sandwich model VS and W. With a skin layer thicknessof 500 mm, the average cell sizes in the centre area has to get small and above all thedistance between them has to get large (Figure 11(b)), shown at sandwich modelW.A look at the cell sizes and distances in the edge area (Figure 11) shows that thesematerials are nearly microcellular.
Correlation: Processing parameter – morphology
In industrial application, it is very important to understand the connectionsbetween morphology and mechanical properties, but it is more important toknow how to adjust the injection moulding process in order to produce optimisedfoam structures. For each of the three sandwich models, it is possible to define themost important morphology properties. To transfer these requested properties, fivedifferent processing parameters were analysed such as melt temperature, mouldtemperature, GCP, level of physical blowing agent (N2¼ SCF (supercritical fluid)level) and injection velocity. The density was also analysed as a processing param-eter, because it is possible to influence the morphology through the amount of
30
50
70
9011013
0
200 40
0 600 80
0
1000 12
00
10
20
30
40
50
60
70
80
stre
ngth
at
yiel
d [M
Pa]
cell distances [µm]thickn. skin layer [µm] correlation: 72 %
densitiy: 1 g/cm³
average cell size edge: 20 µm
density: 1 g/cm³correlation: 72.0 %
cell size centre: 50 µmcell size edge: 20 µm
cell distance centre: 40 µm
Figure 10. Strength at yield depended on the thickness of the skin layer and the cell
distances in the edge area of the foamed core.
Bledzki et al. 311
at UNIVERSITAETSBIBLIOTHEK KASSEL on November 4, 2014cel.sagepub.comDownloaded from
1030
5070
90110
130
30
50
70
90 110
1500
1600
1700
1800
1900
2000
2100
2200
2300te
nsi
le m
od
ulu
s [M
Pa]
cell diameter [µm] cell distance [µm]
1030
5070
90110
13010
40
70
1001500
1600
1700
1800
1900
2000
2100
2200
2300
ten
sile
mo
du
lus
[MP
a]
cell diameter [µm]cell distance [µm]
(a)
(b)
density: 1 g/cm³correlation: 70.5 %
cell size edge: 20 µmcell distance edge: 40 µm
thickness of skin layer: 800 µm
density: 1g/cm³correlation: 70.5 %
cell size edge: 20 µmcell distance edge: 40 µm
thickness of skin layer: 500 µm
Figure 11. Dependency of the tensile modulus on average cell diameter in the centre and
average cell distance in the centre at different skin layer thicknesses.
312 Journal of Cellular Plastics 48(4)
at UNIVERSITAETSBIBLIOTHEK KASSEL on November 4, 2014cel.sagepub.comDownloaded from

injected polymer mass. On the one hand, the density of the produced part is definedbefore processing and it is not a process parameter which can be varied; on theother hand, this examination should show how the density influences each morph-ology parameter. Basically, a higher density leads to better mechanical properties(modulus, strength and maximum elongation). The problem of finding the bestprocessing parameter is that improvement of one morphological parameter oftenleads to deterioration of another important parameter.
The influence of some processing parameters are showed. It can be seenthat there are not one ideal value, but it depends on the other processing param-eters, too. These graphs give a short review about the different changes whenone parameter is varied. Figure 12 to 17 points out the influence of the dens-ity on the morphological parameters. It can be seen that the density is themain influence factor as well on the morphology as also on the mechanicalproperties.
Figure 12 shows that the influence of the gas concentration and the GCP on theskin layer thickness increases by decreasing density. It is noticeable that the thick-ness at a low SCF level first decreases, when the density is reduced, but at furtherreduction of the density, the thickness of the skin layer rises.
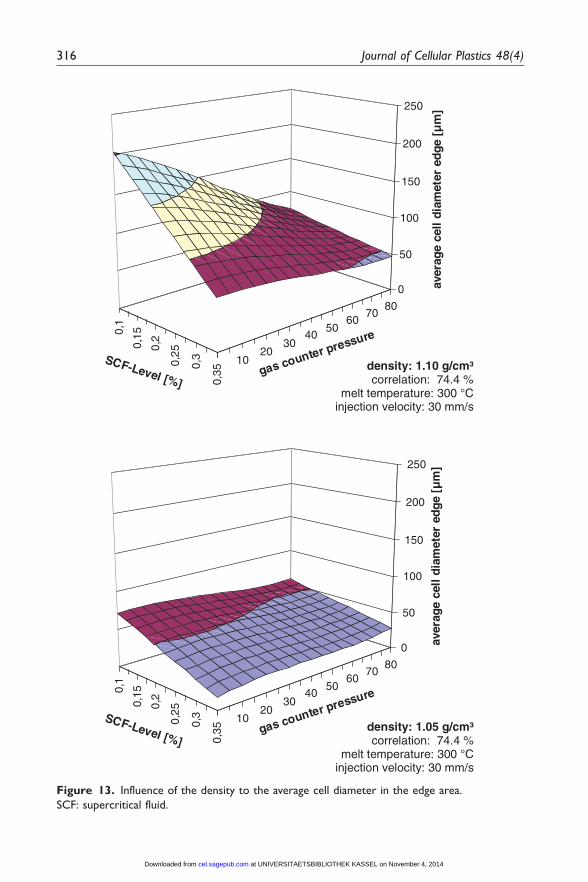
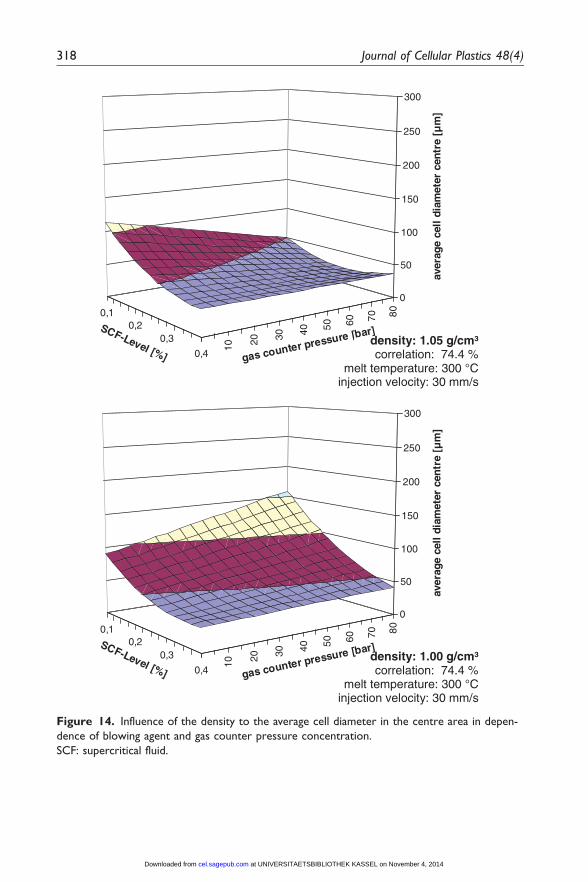
The influence of the density on the average cell diameter can be seen in Figures13 (edge area) and 14 (centre area). Interesting is that the biggest cell sizes in thecentre area were reached by a low density reduction and a low concentration ofblowing agent. Usually, it is assumed that the biggest cell diameters exist at a highdensity reduction. This interesting effect can be explained by viewing Figure 15.The average cell diameter in dependence on the density shows a bathtub function(Figure 15), which means that the average cell diameter first becomes smaller byreduction of the density, but at the density of 1.04 g/cm3, this changes and the celldiameters increase at further density reduction. This can be seen at every GCP andSCF level. Based on the fact that the cell size in the edge area rises but the diameterin the centre is almost constant, this is a possibility to create a model Wmorphology.
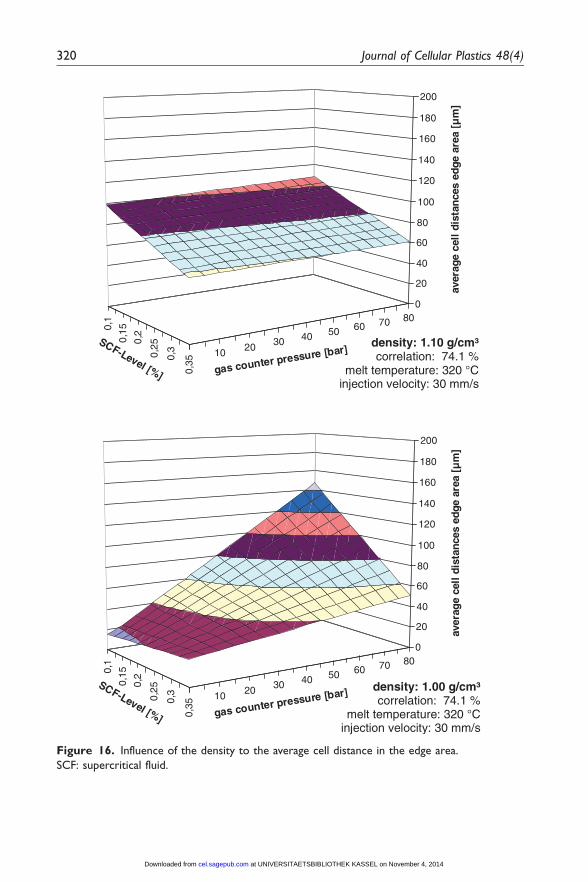
The average cell distances in the edge area (Figure 16) and the centre area(Figure 17) show different effects by variation of the density. The average celldistance in the edge area shows a high dependence of the SCF level and theGCP. At low GCPs, a reduction of the density leads to a decreasing of the celldistances, whereas at high GCPs, the cell distances increase by decrease in density.A higher concentration of blowing agent leads in most cases to smaller cell diam-eters. Only without GCP and at low densities a higher SCF level leads to anincreasing of the cell distances in the edge area (Figure 16).
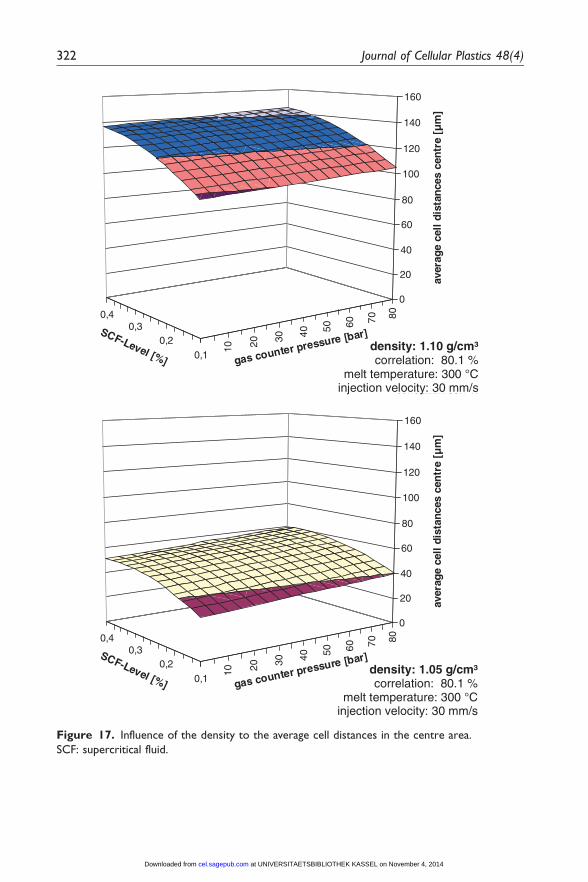
A density reduction leads to smaller cell distances in the centre area such as alower blowing agent concentration. At a density of 1 g/cm3, a change takes place.Whereas the cell distances at high SCF levels becomes smaller, the cell distances atlow SCF levels raise. However, this is only a small growth and is only theoretical,because it is not possible to reach these high density reduction with such smallblowing agent concentrations.
Bledzki et al. 313
at UNIVERSITAETSBIBLIOTHEK KASSEL on November 4, 2014cel.sagepub.comDownloaded from

1 10 20 30 40 50 60 70 80
0,1
0,15
0,2
0,25
0,3
0,35
0
200
400
600
800
1000
1200
1400
thic
knes
s of
ski
n la
yer
[µm
]
gas counter pressure [bar]SCF-Level [%]
melt temperature: 300 °Cinjection velocity: 30 mm/s
density: 1.10 g/cm³correlation: 74.1 %
1 10 20 30 40 50 60 70 80
0,1
0,15
0,2
0,25
0,3
0,35
0
200
400
600
800
1000
1200
thic
knes
s o
f sk
in la
yer
[µm
]
gas counter pressure [bar]SCF-Level [%]
melt temperature: 300 °Cinjection velocity: 30 mm/s
density: 1.00 g/cm³correlation: 74.1 %
density: 1.00 g/cm³correlation: 74.1 %
melt temperature: 300 °Cinjection velocity: 30 mm/s
density: 1.10 g/cm³correlation: 74.1 %
melt temperature: 300 °Cinjection velocity: 30 mm/s
Figure 12. Influence of the density to the thickness of the skin layer.
SCF: supercritical fluid.
314 Journal of Cellular Plastics 48(4)
at UNIVERSITAETSBIBLIOTHEK KASSEL on November 4, 2014cel.sagepub.comDownloaded from
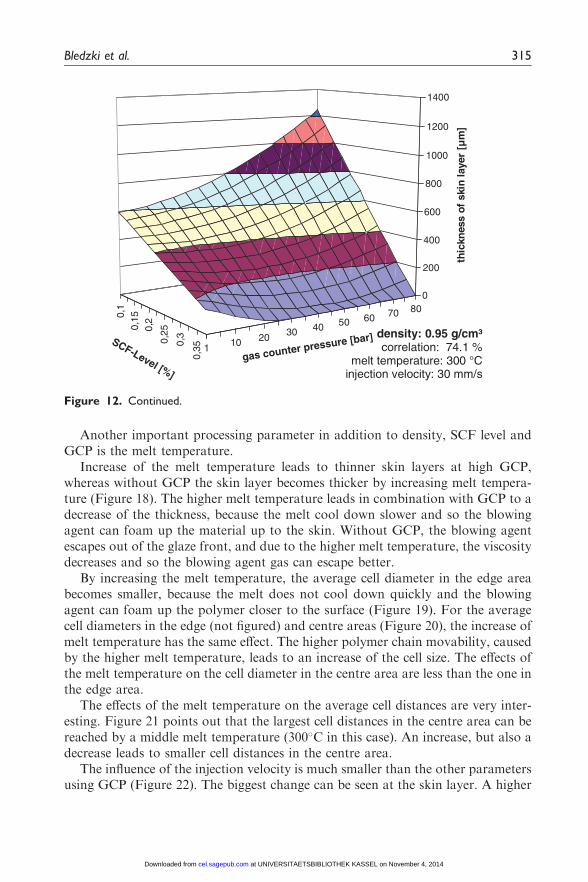
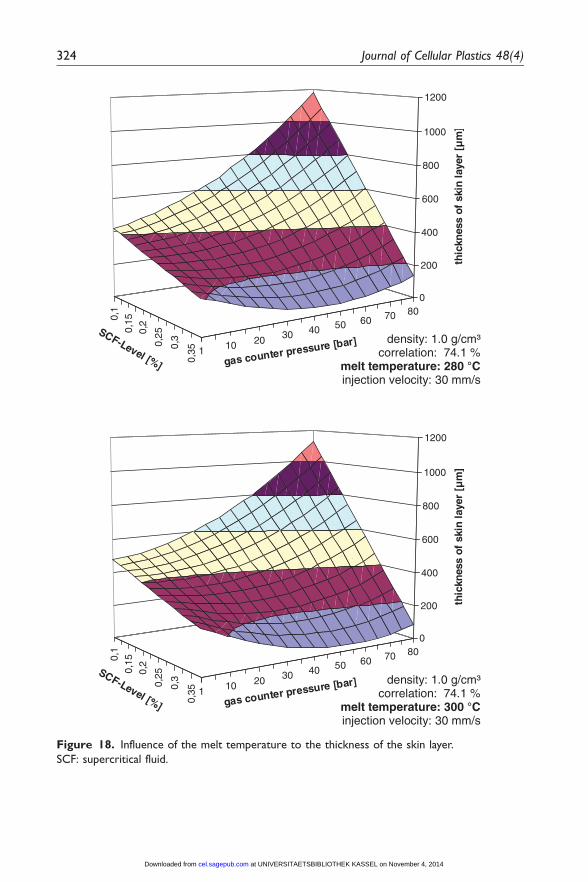
Another important processing parameter in addition to density, SCF level andGCP is the melt temperature.
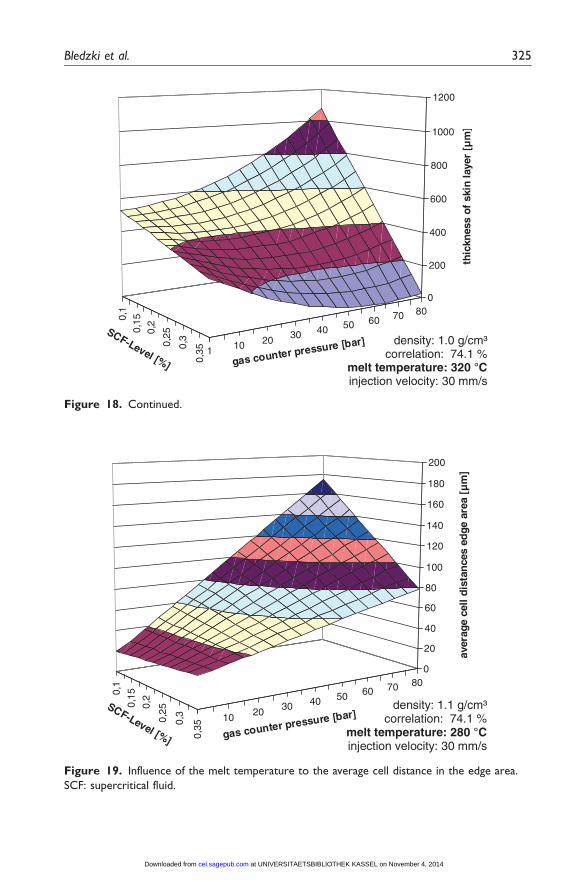
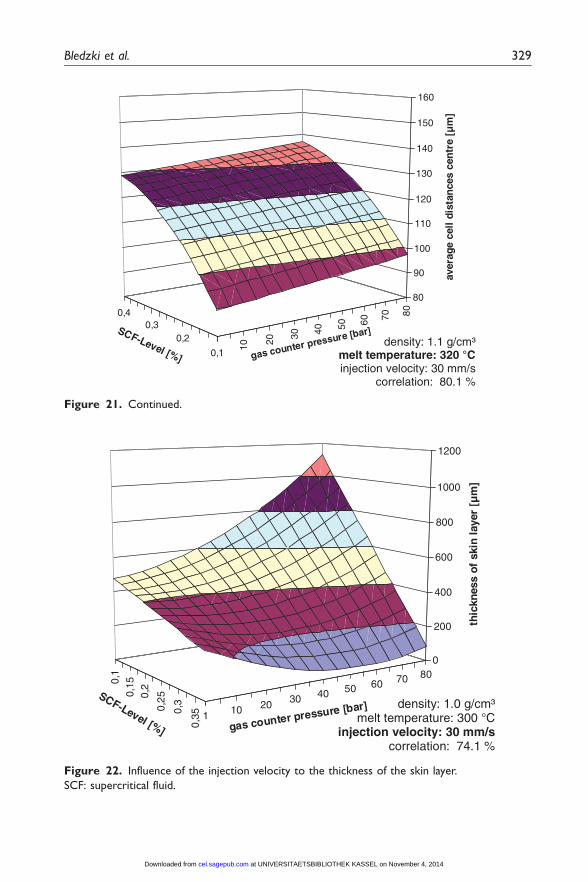
Increase of the melt temperature leads to thinner skin layers at high GCP,whereas without GCP the skin layer becomes thicker by increasing melt tempera-ture (Figure 18). The higher melt temperature leads in combination with GCP to adecrease of the thickness, because the melt cool down slower and so the blowingagent can foam up the material up to the skin. Without GCP, the blowing agentescapes out of the glaze front, and due to the higher melt temperature, the viscositydecreases and so the blowing agent gas can escape better.
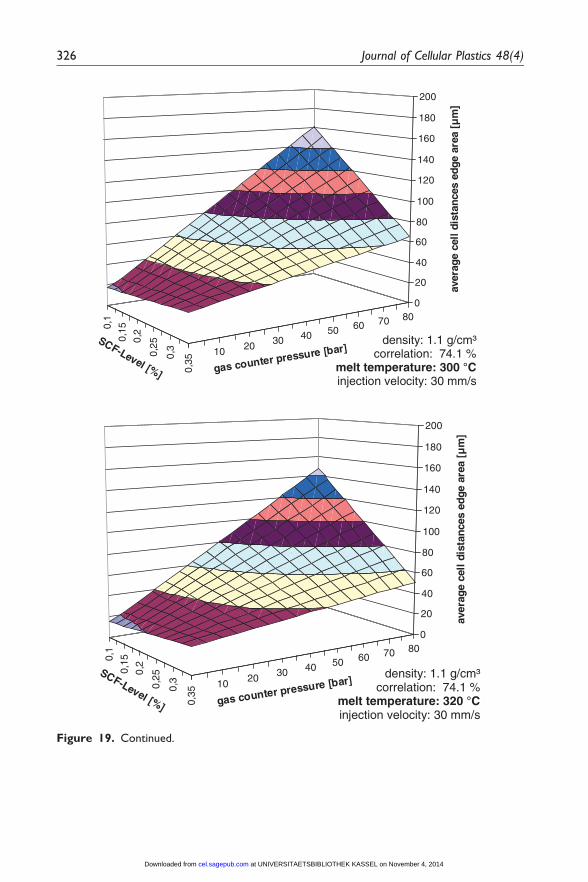
By increasing the melt temperature, the average cell diameter in the edge areabecomes smaller, because the melt does not cool down quickly and the blowingagent can foam up the polymer closer to the surface (Figure 19). For the averagecell diameters in the edge (not figured) and centre areas (Figure 20), the increase ofmelt temperature has the same effect. The higher polymer chain movability, causedby the higher melt temperature, leads to an increase of the cell size. The effects ofthe melt temperature on the cell diameter in the centre area are less than the one inthe edge area.
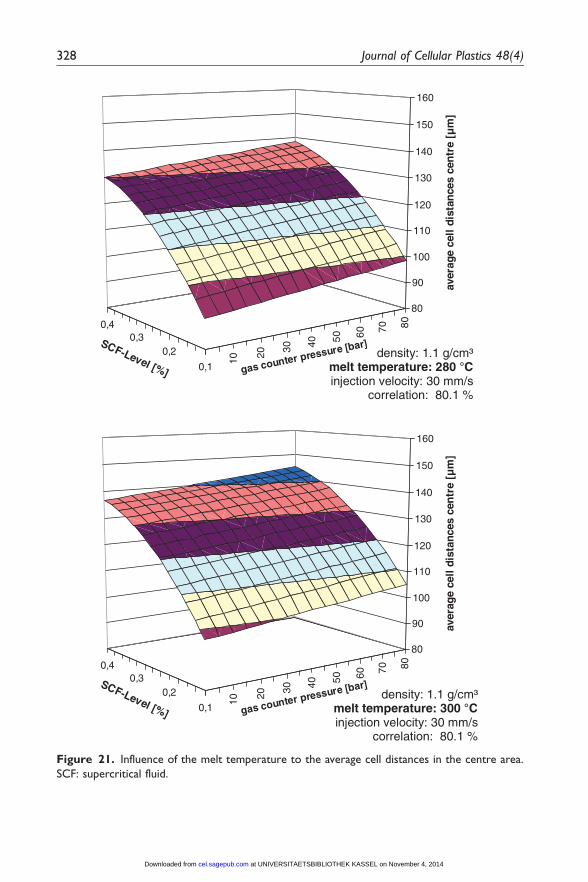
The effects of the melt temperature on the average cell distances are very inter-esting. Figure 21 points out that the largest cell distances in the centre area can bereached by a middle melt temperature (300�C in this case). An increase, but also adecrease leads to smaller cell distances in the centre area.
The influence of the injection velocity is much smaller than the other parametersusing GCP (Figure 22). The biggest change can be seen at the skin layer. A higher
SCF-Level [%]
1 10 20 30 40 50 60 70 80
0,1
0,15
0,2
0,25
0,3
0,35
0
200
400
600
800
1000
1200
1400
thic
knes
s of
ski
n la
yer
[µm
]
melt temperature: 300 °Cinjection velocity: 30 mm/s
density: 0.96 g/cm³correlation: 74.1 %
density: 0.95 g/cm³correlation: 74.1 %
melt temperature: 300 °Cinjection velocity: 30 mm/s
gas counter pressure [bar]
Figure 12. Continued.
Bledzki et al. 315
at UNIVERSITAETSBIBLIOTHEK KASSEL on November 4, 2014cel.sagepub.comDownloaded from
1020
3040
5060
7080
0,1
0,15
0,2
0,25
0,3
0,35
0
50
100
150
200
250
aver
age
cell
diam
eter
edg
e [µ
m]
gas counter pressure
SCF-Level [%]
melt temperature: 300 °Cinjection velocity: 30 mm/s
density: 1.10 g/cm³correlation: 74.4 %
1020
3040
5060
7080
0,1
0,15
0,2
0,25
0,3
0,35
0
50
100
150
200
250
aver
age
cell
diam
eter
edg
e [µ
m]
gas counter pressure
SCF-Level [%]
melt temperature: 300 °Cinjection velocity: 30 mm/s
density: 1.06 g/cm³correlation: 74.4 %
density: 1.05 g/cm³correlation: 74.4 %
melt temperature: 300 °Cinjection velocity: 30 mm/s
density: 1.10 g/cm³correlation: 74.4 %
melt temperature: 300 °Cinjection velocity: 30 mm/s
Figure 13. Influence of the density to the average cell diameter in the edge area.
SCF: supercritical fluid.
316 Journal of Cellular Plastics 48(4)
at UNIVERSITAETSBIBLIOTHEK KASSEL on November 4, 2014cel.sagepub.comDownloaded from

injection velocity leads to a thinner skin layer at low blowing agent concentrationsand a thicker skin layer at high SCF levels. At a small gas concentration, the highervelocity reduces the time where the gas is able to escape out of the polymer, but ahigh concentration of the blowing agent in combination with a high injection vel-ocity leads to an oversaturation of gas in the melt and the gas leak from thepolymer melt.
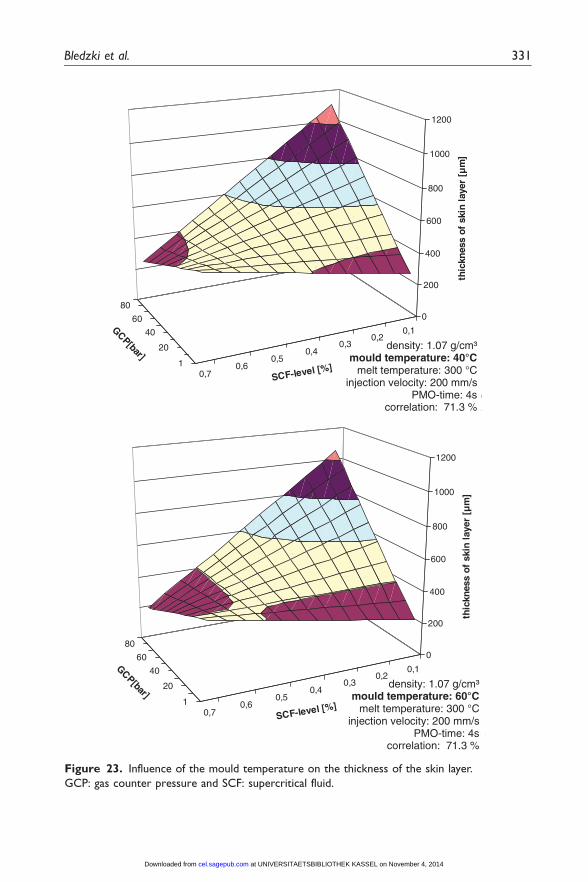
The graphs in Figures 23 and 24 are only suitable for the density area from 1.06to 1.09 g/cm3, because the mould temperature was only varied at this area. Duringall other experiments, the mould temperature was kept constant at 25�C.
The mould temperature has a great effect on the thickness of the skin layer. Atlower mould temperatures, the melt cool down quickly and so the melt in thesurface area becomes solid before the blowing agent is able to foam up the material.
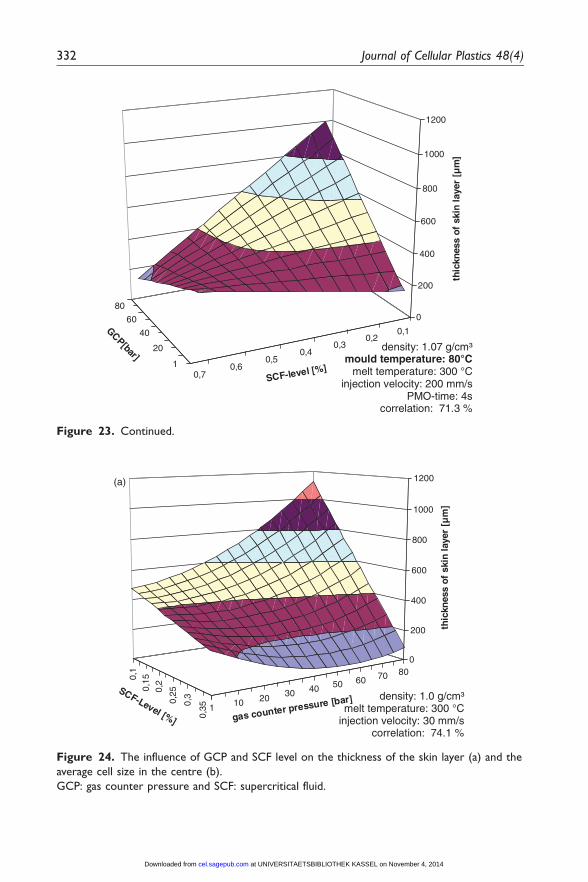
Out of these correlations, it is possible to choose the best processing parametersto create as abovementioned morphological structures for improved mechanicalproperties (Figure 8). The vital parameters for the model U are a thick compactskin layer and a large average cell diameter in the centre area. In this area, theparameters GCP as well as the SCF level decisively influence the process. To get athick compact skin layer, it is advantageous to maintain high GCP, so that theblowing agent cannot escape out of the surface area.11 It correlates with the average
1020
3040
5060
7080
0,1
0,15
0,2
0,25
0,3
0,35
0
50
100
150
200
250
aver
age
cell
diam
eter
edg
e [µ
m]
gas counter pressure
SCF-Level [%]
melt temperature: 300 °Cinjection velocity: 30 mm/s
density: 1.00 g/cm³correlation: 74.4 %
density: 1.00 g/cm³correlation: 74.4 %
melt temperature: 300 °Cinjection velocity: 30 mm/s
Figure 13. Continued.
Bledzki et al. 317
at UNIVERSITAETSBIBLIOTHEK KASSEL on November 4, 2014cel.sagepub.comDownloaded from
10 20 30 40 50 60 70 800,10,2
0,3
0,4
0
50
100
150
200
250
300
aver
age
cell
diam
eter
cen
tre
[µm
]
gas counter pressure [bar]SCF-Level [%]melt temperature: 300 °C
injection velocity: 30 mm/sdensity: 1.06 g/cm³
correlation: 74.4 %
10 20 30 40 50 60 70 800,10,2
0,3
0,4
0
50
100
150
200
250
300
aver
age
cell
diam
eter
cen
tre
[µm
]
gas counter pressure [bar]SCF-Level [%]melt temperature: 300 °C
injection velocity: 30 mm/sdensity: 1.00 g/cm³
correlation: 74.4 %
density: 1.05 g/cm³correlation: 74.4 %
melt temperature: 300 °Cinjection velocity: 30 mm/s
density: 1.00 g/cm³correlation: 74.4 %
melt temperature: 300 °Cinjection velocity: 30 mm/s
Figure 14. Influence of the density to the average cell diameter in the centre area in depen-
dence of blowing agent and gas counter pressure concentration.
SCF: supercritical fluid.
318 Journal of Cellular Plastics 48(4)
at UNIVERSITAETSBIBLIOTHEK KASSEL on November 4, 2014cel.sagepub.comDownloaded from

cell diameter, which increases by higher GCP (Figure 24(b)). Furthermore, the SCFlevel should be small. The smaller quantity of the blowing agent leads to larger celldiameters and thicker skin layers (Figure 24(a) and (b)).
Model V characterises a small average cell size in the edge area with large dis-tances between them. This is problematic, because the main influencing parameters
10 20 30 40 50 60 70 800,10,2
0,3
0,4
0
50
100
150
200
250
300
aver
age
cell
diam
eter
cen
tre
[µm
]
gas counter pressure [bar]SCF-Level [%]melt temperature: 300 °C
injection velocity: 30 mm/sdensity: 0.96 g/cm³
correlation: 74.4 %
density: 0.95 g/cm³correlation: 74.4 %
melt temperature: 300 °Cinjection velocity: 30 mm/s
Figure 14. Continued.
0
50
100
150
200
250
300
350
400
450
0,90,940,981,021,061,11,141,18
density [g/cm³]
0.2 % SCF0.3 % SCF0.4 % SCF
melt temperature: 300 \Cinjection velocity: 30 mm/s
gas counter pressure: 60 bar
cell
dia
met
er c
entr
e ar
ea [
µm
]
Figure 15. Influence of the density to the average cell diameter in the centre area.
SCF: supercritical fluid.
Bledzki et al. 319
at UNIVERSITAETSBIBLIOTHEK KASSEL on November 4, 2014cel.sagepub.comDownloaded from
10 20 30 40 50 60 70 80
0,1
0,15
0,2
0,25
0,3
0,35
0
20
40
60
80
100
120
140
160
180
200
aver
age
cell
dist
ance
s ed
ge a
rea
[µm
]
gas counter pressure [bar]SCF-Level [%]
melt temperature: 320 °Cinjection velocity: 30 mm/s
density: 1.10 g/cm³correlation: 74.1 %
10 20 30 40 50 60 70 80
0,1
0,15
0,2
0,25
0,3
0,35
0
20
40
60
80
100
120
140
160
180
200av
erag
e ce
ll di
stan
ces
edge
are
a [µ
m]
gas counter pressure [bar]SCF-Level [%]
melt temperature: 320 °Cinjection velocity: 30 mm/s
density: 1.00 g/cm³correlation: 74.1 %
density: 1.10 g/cm³correlation: 74.1 %
melt temperature: 320 °Cinjection velocity: 30 mm/s
density: 1.00 g/cm³correlation: 74.1 %
melt temperature: 320 °Cinjection velocity: 30 mm/s
Figure 16. Influence of the density to the average cell distance in the edge area.
SCF: supercritical fluid.
320 Journal of Cellular Plastics 48(4)
at UNIVERSITAETSBIBLIOTHEK KASSEL on November 4, 2014cel.sagepub.comDownloaded from

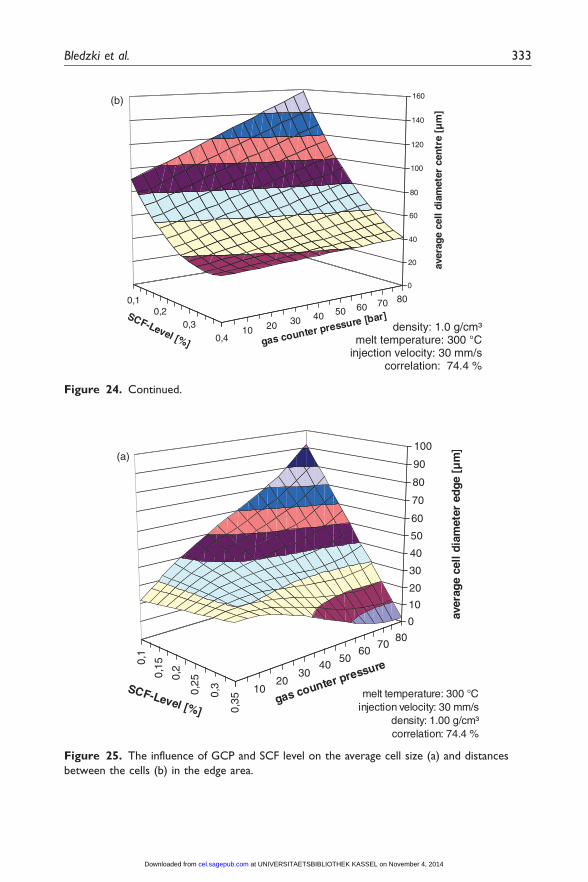
are GCP and SCF level as well. To increase the distances between the cells in theedge area, a high GCP is useful and also a low SCF level. A low SCF level, how-ever, leads to an increase in average cell diameter (Figure 25). Therefore, there hasto be a balance between minimum cell sizes and maximum cell distances, which canbe controlled by the SCF level. A further increase in the average cell distance can bereached by lower melt temperatures. This ensures a fast cool down of the polymermelt in the surface area and prevents foaming up of the blowing agent.
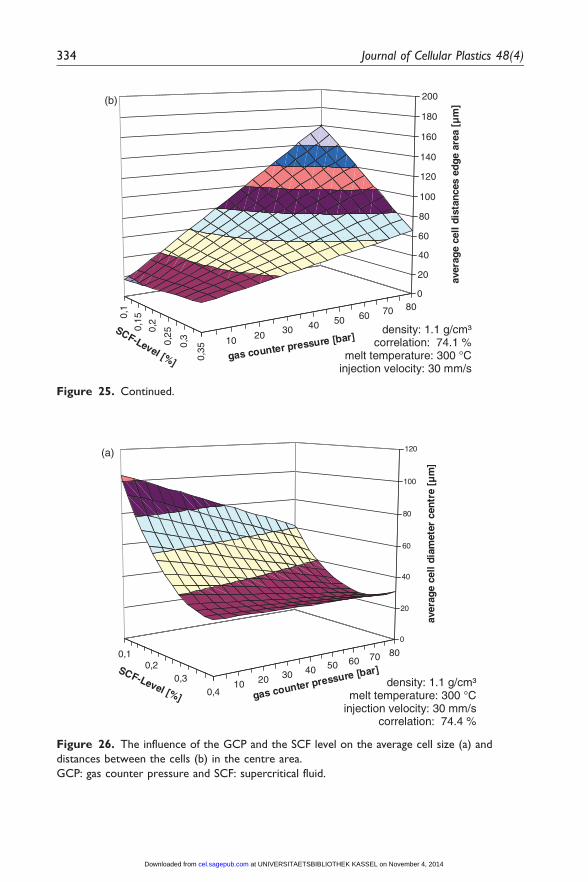
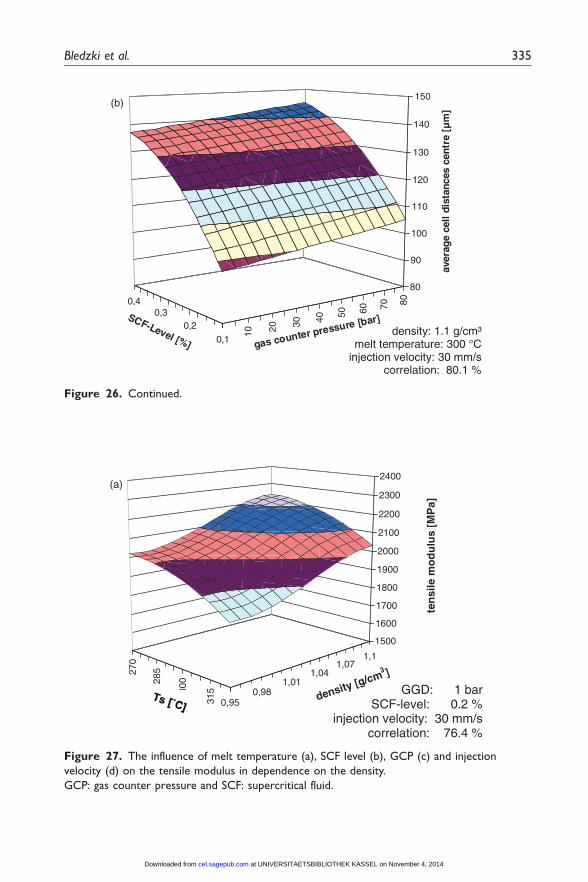
The structure of sandwich model W is complicated and very hard to produce.An absolute necessity is the high density of the foamed material. This morphologycan only be produced with weight reduction of less than 10%. Figure 26 shows twocorrelations for the average cell diameter and the distances between the cells in thecentre area with weight reduction of &8.5%. Both diagrams show that high SCFlevel and GCP are necessary for small cell diameters and for large distancesbetween them. The disadvantage of these process parameters is reduction of thecompact skin layer (Figure 26).
Correlation: Processing parameter – mechanical properties
Out of the results above, a direct correlation between the processing parametersand the mechanical properties can be done. To understand this relationship, theinteraction between morphology and mechanical properties is absolutely necessary.
10 20 30 40 50 60 70 80
0,1
0,15
0,2
0,25
0,3
0,35
0
20
40
60
80
100
120
140
160
180
200
aver
age
cell
dist
ance
s ed
ge a
rea
[µm
]
gas counter pressure [bar]SCF-Level [%]
melt temperature: 320 °Cinjection velocity: 30 mm/s
density: 0.96 g/cm³correlation: 74.1 %
density: 0.95 g/cm³correlation: 74.1 %
melt temperature: 320 °Cinjection velocity: 30 mm/s
Figure 16. Continued.
Bledzki et al. 321
at UNIVERSITAETSBIBLIOTHEK KASSEL on November 4, 2014cel.sagepub.comDownloaded from
10 20 30 40 50 60 70 80
0,10,2
0,30,4
0
20
40
60
80
100
120
140
160
aver
age
cell
dis
tan
ces
cen
tre
[µm
]
gas counter pressure [bar]SCF-Level [%]melt temperature: 300 °C
injection velocity: 30 mm/sdensity: 1.10 g/cm³
correlation: 80.1 %
10 20 30 40 50 60 70 80
0,10,2
0,30,4
0
20
40
60
80
100
120
140
160
aver
age
cell
dist
ance
s ce
ntr
e [µ
m]
gas counter pressure [bar]SCF-Level [%]melt temperature: 300 °C
injection velocity: 30 mm/sdensity: 1.06 g/cm³
correlation: 80.1 %
density: 1.05 g/cm³correlation: 80.1 %
melt temperature: 300 °Cinjection velocity: 30 mm/s
density: 1.10 g/cm³correlation: 80.1 %
melt temperature: 300 °Cinjection velocity: 30 mm/s
Figure 17. Influence of the density to the average cell distances in the centre area.
SCF: supercritical fluid.
322 Journal of Cellular Plastics 48(4)
at UNIVERSITAETSBIBLIOTHEK KASSEL on November 4, 2014cel.sagepub.comDownloaded from
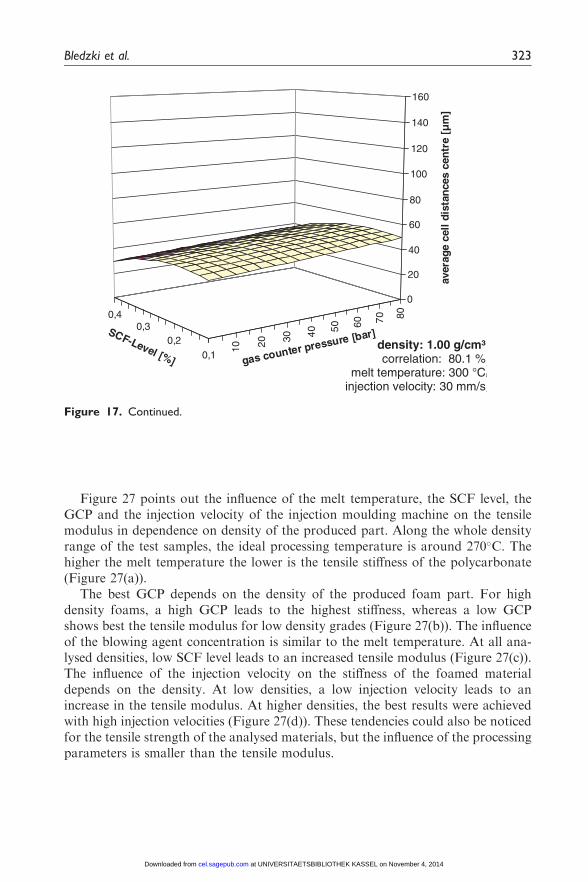
Figure 27 points out the influence of the melt temperature, the SCF level, theGCP and the injection velocity of the injection moulding machine on the tensilemodulus in dependence on density of the produced part. Along the whole densityrange of the test samples, the ideal processing temperature is around 270�C. Thehigher the melt temperature the lower is the tensile stiffness of the polycarbonate(Figure 27(a)).
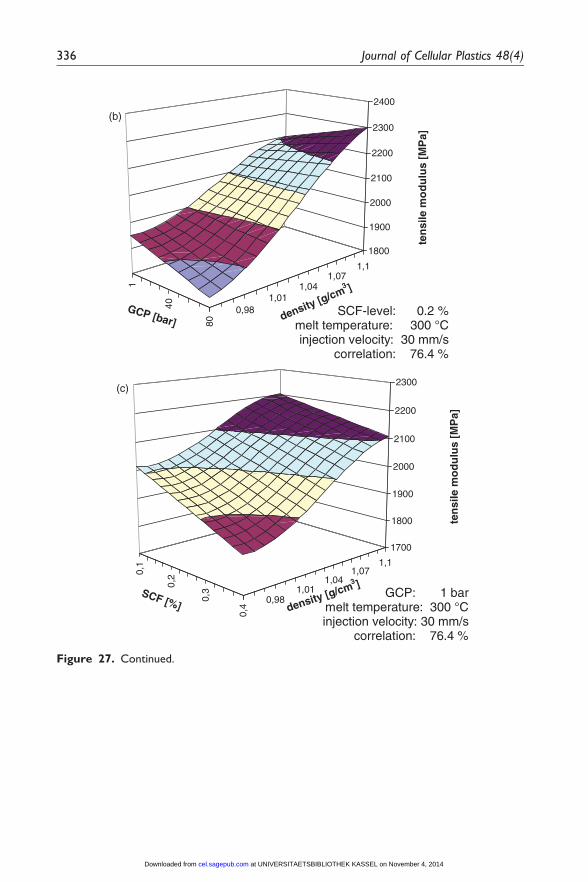
The best GCP depends on the density of the produced foam part. For highdensity foams, a high GCP leads to the highest stiffness, whereas a low GCPshows best the tensile modulus for low density grades (Figure 27(b)). The influenceof the blowing agent concentration is similar to the melt temperature. At all ana-lysed densities, low SCF level leads to an increased tensile modulus (Figure 27(c)).The influence of the injection velocity on the stiffness of the foamed materialdepends on the density. At low densities, a low injection velocity leads to anincrease in the tensile modulus. At higher densities, the best results were achievedwith high injection velocities (Figure 27(d)). These tendencies could also be noticedfor the tensile strength of the analysed materials, but the influence of the processingparameters is smaller than the tensile modulus.
10 20 30 40 50 60 70 80
0,10,2
0,30,4
0
20
40
60
80
100
120
140
160
aver
age
cell
dis
tan
ces
cen
tre
[µm
]
gas counter pressure [bar]SCF-Level [%]melt temperature: 300 °C
injection velocity: 30 mm/sdensity: 1.00 g/cm³
correlation: 80.1 %
density: 1.00 g/cm³correlation: 80.1 %
melt temperature: 300 °Cinjection velocity: 30 mm/s
Figure 17. Continued.
Bledzki et al. 323
at UNIVERSITAETSBIBLIOTHEK KASSEL on November 4, 2014cel.sagepub.comDownloaded from
1 10 20 30 40 50 60 70 80
0,1
0,15
0,2
0,25
0,3
0,35
0
200
400
600
800
1000
1200
thic
knes
s of
ski
n la
yer
[µm
]
gas counter pressure [bar]SCF-Level [%]
melt temperature: 280 °Cinjection velocity: 30 mm/s
density: 1.00 g/cm³correlation: 74.1 %
1 10 20 30 40 50 60 70 80
0,1
0,15
0,2
0,25
0,3
0,35
0
200
400
600
800
1000
1200
thic
knes
s of
ski
n la
yer
[µm
]
gas counter pressure [bar]SCF-Level [%]
melt temperature: 300 °Cinjection velocity: 30 mm/s
density: 1.00 g/cm³correlation: 74.1 %
density: 1.0 g/cm³correlation: 74.1 %
melt temperature: 280 °Cinjection velocity: 30 mm/s
density: 1.0 g/cm³correlation: 74.1 %
melt temperature: 300 °Cinjection velocity: 30 mm/s
Figure 18. Influence of the melt temperature to the thickness of the skin layer.
SCF: supercritical fluid.
324 Journal of Cellular Plastics 48(4)
at UNIVERSITAETSBIBLIOTHEK KASSEL on November 4, 2014cel.sagepub.comDownloaded from
10 20 30 40 50 60 70 80
0,1
0,15
0,2
0,25
0,3
0,35
0
20
40
60
80
100
120
140
160
180
200av
erag
e ce
ll d
ista
nce
s ed
ge a
rea
[µm
]
gas counter pressure [bar]SCF-Level [%]
melt temperature: 280 °Cinjection velocity: 30 mm/s
density: 1.10 g/cm³correlation: 74.1 %
density: 1.1 g/cm³correlation: 74.1 %
melt temperature: 280 °Cinjection velocity: 30 mm/s
Figure 19. Influence of the melt temperature to the average cell distance in the edge area.
SCF: supercritical fluid.
1 10 20 30 40 50 60 70 80
0,1
0,15
0,2
0,25
0,3
0,35
0
200
400
600
800
1000
1200
thic
knes
s of
ski
n la
yer
[µm
]
gas counter pressure [bar]SCF-Level [%]
melt temperature: 320 °Cinjection velocity: 30 mm/s
density: 1.00 g/cm³correlation: 74.1 %
density: 1.0 g/cm³correlation: 74.1 %
melt temperature: 320 °Cinjection velocity: 30 mm/s
Figure 18. Continued.
Bledzki et al. 325
at UNIVERSITAETSBIBLIOTHEK KASSEL on November 4, 2014cel.sagepub.comDownloaded from
10 20 30 40 50 60 70 80
0,1
0,15
0,2
0,25
0,3
0,35
0
20
40
60
80
100
120
140
160
180
200
aver
age
cell
dist
ance
s ed
ge a
rea
[µm
]
gas counter pressure [bar]SCF-Level [%]
melt temperature: 320 °Cinjection velocity: 30 mm/s
density: 1.10 g/cm³correlation: 74.1 %
density: 1.1 g/cm³correlation: 74.1 %
melt temperature: 320 °Cinjection velocity: 30 mm/s
10 20 30 40 50 60 70 80
0,1
0,15
0,2
0,25
0,3
0,35
0
20
40
60
80
100
120
140
160
180
200
aver
age
cell
dist
ance
s ed
ge a
rea
[µm
]
gas counter pressure [bar]SCF-Level [%]
melt temperature: 300 °Cinjection velocity: 30 mm/s
density: 1.10 g/cm³correlation: 74.1 %
density: 1.1 g/cm³correlation: 74.1 %
melt temperature: 300 °Cinjection velocity: 30 mm/s
Figure 19. Continued.
326 Journal of Cellular Plastics 48(4)
at UNIVERSITAETSBIBLIOTHEK KASSEL on November 4, 2014cel.sagepub.comDownloaded from

10 20 30 40 50 60 70 800,10,2
0,30,4
0
20
40
60
80
100
120
140
160
aver
age
cell
diam
eter
cen
tre
[µm
]
gas counter pressure [bar]SCF-Level [%]melt temperature: 300 °Cinjection velocity: 30 mm/s
density: 1.00 g/cm³correlation: 74.4 %
density: 1.1 g/cm³correlation: 74.4 %
melt temperature: 300 °Cinjection velocity: 30 mm/s
10 20 30 40 50 60 70 800,10,2
0,30,4
0
20
40
60
80
100
120
140
160
aver
age
cell
diam
eter
cen
tre
[µm
]
gas counter pressure [bar]SCF-Level [%]melt temperature: 320 °Cinjection velocity: 30 mm/s
density: 1.00 g/cm³correlation: 74.4 %
density: 1.1 g/cm³correlation: 74.4 %
melt temperature: 320 °Cinjection velocity: 30 mm/s
Figure 20. Influence of the melt temperature to the average cell diameter in the centre area.
SCF: supercritical fluid.
Bledzki et al. 327
at UNIVERSITAETSBIBLIOTHEK KASSEL on November 4, 2014cel.sagepub.comDownloaded from
10 20 30 40 50 60 70 80
0,1
0,20,3
0,4
80
90
100
110
120
130
140
150
160
aver
age
cell
dis
tan
ces
cen
tre
[µm
]
gas counter pressure [bar]SCF-Level [%]
10 20 30 40 50 60 70 80
0,1
0,20,3
0,4
80
90
100
110
120
130
140
150
160av
erag
e ce
ll di
stan
ces
cen
tre
[µm
]
gas counter pressure [bar]SCF-Level [%]
density: 1.1 g/cm³melt temperature: 300 °Cinjection velocity: 30 mm/s
correlation: 80.1 %
density: 1.1 g/cm³melt temperature: 280 °Cinjection velocity: 30 mm/s
correlation: 80.1 %
Figure 21. Influence of the melt temperature to the average cell distances in the centre area.
SCF: supercritical fluid.
328 Journal of Cellular Plastics 48(4)
at UNIVERSITAETSBIBLIOTHEK KASSEL on November 4, 2014cel.sagepub.comDownloaded from
1 10 20 30 40 50 60 70 80
0,1
0,15
0,2
0,25
0,3
0,35
0
200
400
600
800
1000
1200
thic
knes
s of
ski
n la
yer
[µm
]
gas counter pressure [bar]SCF-Level [%]
melt temperature: 300 °Cinjection velocity: 30 mm/s
density: 1.00 g/cm³correlation: 74.1 %
density: 1.0 g/cm³melt temperature: 300 °C
injection velocity: 30 mm/scorrelation: 74.1 %
Figure 22. Influence of the injection velocity to the thickness of the skin layer.
SCF: supercritical fluid.
10 20 30 40 50 60 70 80
0,1
0,20,3
0,4
80
90
100
110
120
130
140
150
160
aver
age
cell
dis
tan
ces
cen
tre
[µm
]
gas counter pressure [bar]SCF-Level [%]
density: 1.1 g/cm³melt temperature: 320 °Cinjection velocity: 30 mm/s
correlation: 80.1 %
Figure 21. Continued.
Bledzki et al. 329
at UNIVERSITAETSBIBLIOTHEK KASSEL on November 4, 2014cel.sagepub.comDownloaded from

1 10 20 30 40 50 60 70 80
0,1
0,15
0,2
0,25
0,3
0,35
0
100
200
300
400
500
600
700
800
900
1000
thic
knes
s of
ski
n la
yer
[µm
]
gas counter pressure [bar]SCF-Level [%]
melt temperature: 300 °Cinjection velocity: 80 mm/s
density: 1.00 g/cm³correlation: 74.1 %
density: 1.0 g/cm³melt temperature: 300 °C
injection velocity: 80 mm/scorrelation: 74.1 %
1 10 20 30 40 50 60 70 80
0,1
0,15
0,2
0,25
0,3
0,35
0
200
400
600
800
1000
1200
thic
knes
s o
f sk
in la
yer
[µm
]
gas counter pressure [bar]SCF-Level [%]
melt temperature: 300 °Cinjection velocity: 50 mm/s
density: 1.00 g/cm³correlation: 74.1 %
density: 1.0 g/cm³melt temperature: 300 °C
injection velocity: 50 mm/scorrelation: 74.1 %
Figure 22. Continued.
330 Journal of Cellular Plastics 48(4)
at UNIVERSITAETSBIBLIOTHEK KASSEL on November 4, 2014cel.sagepub.comDownloaded from
0,10,2
0,30,4
0,50,6
0,71
20
40
60
800
200
400
600
800
1000
1200
thic
knes
s of
ski
n la
yer
[µm
]
SCF-level [%]
GCP[bar] mould temperature: 40 °Cmelt temperature: 300 °C
injection velocity: 200 mm/sPMO delay: 4 s
density: 1.07 g/cm³correlation: 71.3 %
density: 1.07 g/cm³mould temperature: 40°C
melt temperature: 300 °Cinjection velocity: 200 mm/s
PMO-time: 4scorrelation: 71.3 %
0,10,2
0,30,4
0,50,6
0,71
20
40
60
800
200
400
600
800
1000
1200th
ickn
ess
of s
kin
laye
r [µ
m]
SCF-level [%]
GCP[bar] mould temperature: 60 °Cmelt temperature: 300 °C
injection velocity: 200 mm/sPMO delay: 4 s
density: 1.07 g/cm³correlation: 71.3 %
density: 1.07 g/cm³mould temperature: 60°C
melt temperature: 300 °Cinjection velocity: 200 mm/s
PMO-time: 4scorrelation: 71.3 %
Figure 23. Influence of the mould temperature on the thickness of the skin layer.
GCP: gas counter pressure and SCF: supercritical fluid.
Bledzki et al. 331
at UNIVERSITAETSBIBLIOTHEK KASSEL on November 4, 2014cel.sagepub.comDownloaded from
0,10,2
0,30,4
0,50,6
0,71
20
40
60
800
200
400
600
800
1000
1200
thic
knes
s of
ski
n la
yer
[µm
]
SCF-level [%]
GCP[bar] mould temperature: 80 °Cmelt temperature: 300 °C
injection velocity: 200 mm/sPMO delay: 4 s
density: 1.07 g/cm³correlation: 71.3 %
density: 1.07 g/cm³mould temperature: 80°C
melt temperature: 300 °Cinjection velocity: 200 mm/s
PMO-time: 4scorrelation: 71.3 %
Figure 23. Continued.
1 10 20 30 40 50 60 70 80
0,1
0,15
0,2
0,25
0,3
0,35
0
200
400
600
800
1000
1200
thic
knes
s of
ski
n la
yer
[µm
]
gas counter pressure [bar]SCF-Level [%]
melt temperature: 300 °Cinjection velocity: 30 mm/s
density: 1.00 g/cm³correlation: 74.1 %
(a)
density: 1.0 g/cm³melt temperature: 300 °C
injection velocity: 30 mm/scorrelation: 74.1 %
Figure 24. The influence of GCP and SCF level on the thickness of the skin layer (a) and the
average cell size in the centre (b).
GCP: gas counter pressure and SCF: supercritical fluid.
332 Journal of Cellular Plastics 48(4)
at UNIVERSITAETSBIBLIOTHEK KASSEL on November 4, 2014cel.sagepub.comDownloaded from
1020
3040
5060
7080
0,1
0,15
0,2
0,25
0,3
0,35
0
10
20
30
40
50
60
70
80
90
100av
erag
e ce
ll di
amet
er e
dge
[µm
]
gas counter pressure
SCF-Level [%]
melt temperature: 300 °Cinjection velocity: 30 mm/s
density: 1.00 g/cm³correlation: 74.4 %
(a)
Figure 25. The influence of GCP and SCF level on the average cell size (a) and distances
between the cells (b) in the edge area.
10 20 30 40 50 60 70 800,10,2
0,30,4
0
20
40
60
80
100
120
140
160
aver
age
cell
diam
eter
cen
tre
[µm
]
gas counter pressure [bar]SCF-Level [%]melt temperature: 300 °C
injection velocity: 30 mm/sdensity: 1.00 g/cm³correlation: 74.4 %
(b)
density: 1.0 g/cm³melt temperature: 300 °C
injection velocity: 30 mm/scorrelation: 74.4 %
Figure 24. Continued.
Bledzki et al. 333
at UNIVERSITAETSBIBLIOTHEK KASSEL on November 4, 2014cel.sagepub.comDownloaded from
10 20 30 40 50 60 70 800,10,2
0,30,4
0
20
40
60
80
100
120
aver
age
cell
diam
eter
cen
tre
[µm
]
gas counter pressure [bar]SCF-Level [%]melt temperature: 300 °C
injection velocity: 30 mm/sdensity: 1.10 g/cm³correlation: 74.4 %
(a)
density: 1.1 g/cm³melt temperature: 300 °C
injection velocity: 30 mm/scorrelation: 74.4 %
Figure 26. The influence of the GCP and the SCF level on the average cell size (a) and
distances between the cells (b) in the centre area.
GCP: gas counter pressure and SCF: supercritical fluid.
10 20 30 40 50 60 70 80
0,1
0,15
0,2
0,25
0,3
0,35
0
20
40
60
80
100
120
140
160
180
200
aver
age
cell
dist
ance
s ed
ge a
rea
[µm
]
gas counter pressure [bar]SCF-Level [%]
melt temperature: 300 °Cinjection velocity: 30 mm/s
density: 1.10 g/cm³correlation: 74.1 %
(b)
density: 1.1 g/cm³correlation: 74.1 %
melt temperature: 300 °Cinjection velocity: 30 mm/s
Figure 25. Continued.
334 Journal of Cellular Plastics 48(4)
at UNIVERSITAETSBIBLIOTHEK KASSEL on November 4, 2014cel.sagepub.comDownloaded from
0,950,98
1,011,04
1,071,1
270
285
300
315
1500
1600
1700
1800
1900
2000
2100
2200
2300
2400
ten
sile
mo
du
lus
[MP
a]
density [g/cm3 ]
GGD: 1 barSCF-level: 0.2 %
injection velocity: 30 mm/scorrelation: 76.4 %
(a)
Figure 27. The influence of melt temperature (a), SCF level (b), GCP (c) and injection
velocity (d) on the tensile modulus in dependence on the density.
GCP: gas counter pressure and SCF: supercritical fluid.
10 20 30 40 50 60 70 80
0,10,2
0,30,4
80
90
100
110
120
130
140
150
aver
age
cell
dist
ance
s ce
ntre
[µ
m]
gas counter pressure [bar]SCF-Level [%]melt temperature: 300 °C
injection velocity: 30 mm/sdensity: 1.10 g/cm³correlation: 80.1 %
(b)
density: 1.1 g/cm³melt temperature: 300 °C
injection velocity: 30 mm/scorrelation: 80.1 %
Figure 26. Continued.
Bledzki et al. 335
at UNIVERSITAETSBIBLIOTHEK KASSEL on November 4, 2014cel.sagepub.comDownloaded from
0,981,01
1,041,07
1,1
0,1
0,2
0,3
0,4
1700
1800
1900
2000
2100
2200
2300
ten
sile
mo
du
lus
[MP
a]
density [g/cm3 ]
SCF [%]GCP: 1 bar
melt temperature: 300 °Cinjection velocity: 30 mm/s
correlation: 76.4 %
(c)
0,981,01
1,041,07
1,1
1
40
80
1800
1900
2000
2100
2200
2300
2400
ten
sile
mo
du
lus
[MP
a]
density [g/cm3 ]
GCP [bar]SCF-level: 0.2 %
melt temperature: 300 °Cinjection velocity: 30 mm/s
correlation: 76.4 %
(b)
Figure 27. Continued.
336 Journal of Cellular Plastics 48(4)
at UNIVERSITAETSBIBLIOTHEK KASSEL on November 4, 2014cel.sagepub.comDownloaded from
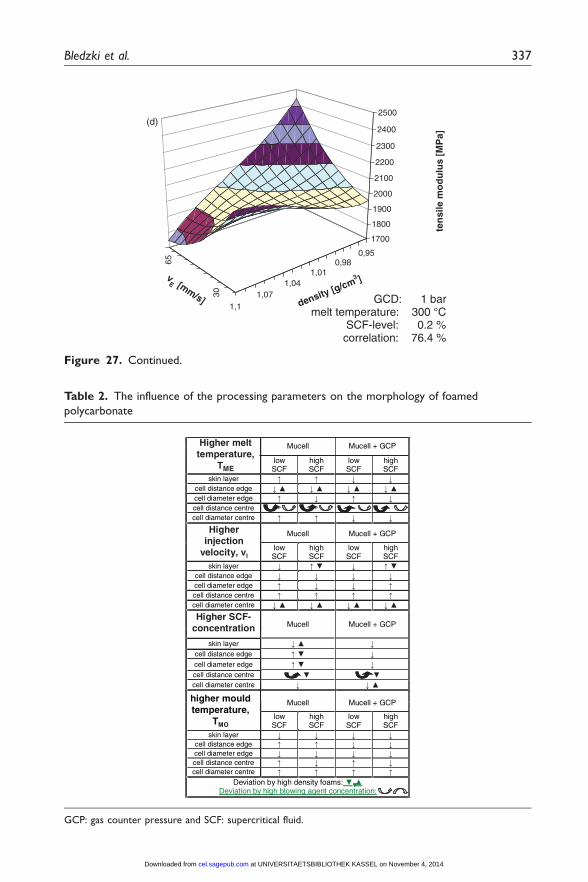
Table 2. The influence of the processing parameters on the morphology of foamed
polycarbonate
Higher melttemperature,
TME
Mucell Mucell + GCP
low SCF
high SCF
low SCF
high SCF
skin layer cell distance edge cell diameter edge cell distance centre cell diameter centre
Higherinjection
velocity, vI
Mucell Mucell + GCP
low SCF
high SCF
low SCF
high SCF
skin layer cell distance edge cell diameter edge cell distance centre cell diameter centre
Higher SCF-concentration Mucell Mucell + GCP
skin layer cell distance edge
cell diameter edge cell distance centre cell diameter centre
higher mouldtemperature,
TMO
Mucell Mucell + GCP
low SCF
high SCF
low SCF
high SCF
skin layer cell distance edge cell diameter edge cell distance centre cell diameter centre
Deviation by high density foams:Deviation by high blowing agent concentration:
GCP: gas counter pressure and SCF: supercritical fluid.
0,950,98
1,011,04
1,071,1
30
65
1700
1800
1900
2000
2100
2200
2300
2400
2500
ten
sile
mo
du
lus
[MP
a]
density [g/cm3 ]v
E [mm/s] GCD: 1 barmelt temperature: 300 °C
SCF-level: 0.2 %correlation: 76.4 %
(d)
Figure 27. Continued.
Bledzki et al. 337
at UNIVERSITAETSBIBLIOTHEK KASSEL on November 4, 2014cel.sagepub.comDownloaded from
Conclusions
It was pointed out that correlation between morphological structure and mechan-ical properties as well as correlation between processing parameters and foammorphology was observed and could be specified. The experiments and subsequentanalysis show that it is possible to produce foamed materials with a well-definedmorphology structure and therefore, specifically optimised mechanical properties.By evaluating the results of correlation, the authors of this article come to theconclusion that all bending and tensile properties were influenced by the morpho-logical structure in the same way. While improving one tensile property by theinjection moulding process, all other tensile properties as well as bending propertiesare being improved at the same time. Furthermore, as a result, it is clearly obviousthat three different sandwich models, which are optimal for tensile and bending(not model W) load, can be created. These three models are equated and each ofthem leads to good mechanical properties. The GCP technology does not only leadto massively better surface qualities, but also a suitable procedure for influencingthe foaming process.
Table 2 points out an overview of the relation between processing parametersand morphology. The arrows show in which direction each morphological param-eter is influenced by the processing. The curved arrows point out that these valueshave a non-linear behaviour and show a maximal or minimal turning point. Underspecial circumstance, the influence changes. In this case, the deviation by changingother parameters are marked with triangles (high density), thick arrows (high injec-tion velocity) or thick open arrows (high SCF level). Some changes depend on the
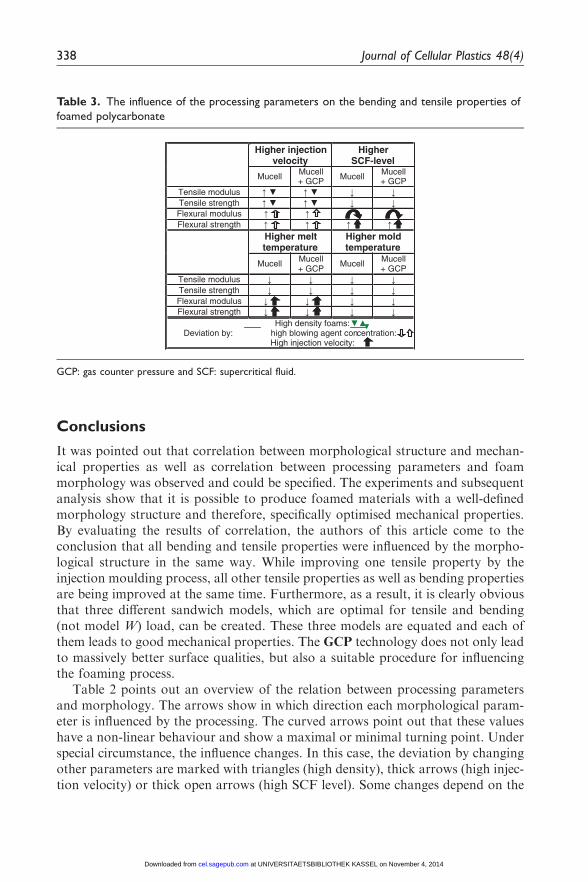
Table 3. The influence of the processing parameters on the bending and tensile properties of
foamed polycarbonate
Higher injection velocity
Higher SCF-level
Mucell Mucell + GCP Mucell Mucell
+ GCP Tensile modulus Tensile strength Flexural modulus . . Flexural strength . . . .
Higher melt temperature
Higher mold temperature
Mucell Mucell + GCP
Mucell Mucell + GCP
Tensile modulus Tensile strength Flexural modulus . . Flexural strength . .
High density foams: Deviation by: high blowing agent concentration:
High injection velocity:
GCP: gas counter pressure and SCF: supercritical fluid.
338 Journal of Cellular Plastics 48(4)
at UNIVERSITAETSBIBLIOTHEK KASSEL on November 4, 2014cel.sagepub.comDownloaded from
density of the foamed material. A higher injection velocity leads at lower densitiesto thicker skin layers, whereas it leads at higher densities to a reduction of the skinlayer thickness for example. This knowledge enables custom-made polymer foamswith optimised properties for each application.
In addition to the connection between morphology and processing parameters,Table 3 points out the influence of the processing parameters to the bending andtensile properties of the microcellular polycarbonate foams. In case of differenttendencies for different densities, the tendency for higher density foams is labelledby a triangle.
Funding
This research received no specific grant from any funding agency in the public, commercial,
or not-for-profit sectors.
References
1. Egger P, Fischer M, Kirschling H, et al. Versatility for mass production in MuCellinjection moulding - a status report (1). Kunststoffe Int 2005; 95(12): 66–70.
2. Egger P, Fischer M, Kirschling H, et al. Versatility for mass production in MuCellinjection moulding - a status report (2). Kunststoffe Int 2006; 96(1): 72–76.
3. Kumar V, Weller JE and Hoffer HY. Synthesis of microcellular polycarbonate: a phe-nomenological study of bubble nucleation and growth. In: Proceedings of the symposium
on processing of polymers and polymeric composites, ASME winter annual meeting,Dallas, TX, 25–31 November 1990, vol. 19, pp.197–212. New York, NY: AmericanSociety of Mechanical Engineers.
4. Holl MR, Garbini JL, Murray WR, et al. A steady-state mass balance model of thepolycarbonate-CO2 system reveals a self-regulating cell growth mechanism in the solid-state microcellular process. J Polym Sci Part B Polym Phys 2001; 39(8): 868–880.
5. Lee JWS, Wang K and Park CB. Challenge to extrusion of low-density microcellularpolycarbonate foams using supercritical carbon dioxide. Ind Eng Chem Res 2005; 44(1):92–99.
6. Kumar V and Weller JE. Tensile properties of high relative density microcellular PC
foams. In: Proceedings of the cellular polymers IV conference, Shrewsbury, England, 5–6June 1997, p.12.
7. Bureau MN and Kumar V. Fracture toughness of high density polycarbonate foams.
J Cell Plast 2006; 42(3): 229–240; In: Proceedings of the 63th annual technical conference,ANTEC 2005, Boston, MA, 1–5 May 2005, pp.1832–1836.
8. Okamoto K. Microcellular processing. Munchen, Wien: Hanser Verlag, 2003.
9. Bledzki AK, Kirschling H, Steinbichler G, et al. Microcellular moulding with gas coun-ter pressure. In: Proceedings of the 21st annual meeting of the polymer processing society,Leipzig, Germany, 19–23 June 2005.
10. Bledzki AK, Kirschling H, Pitscheneder W, et al. Polycarbonate microfoams producedby gas counter pressure and precision mould opening. In: Proceedings of the blowingagent and foaming processes 2007, Frankfurt, Germany, 22–23 May 2007.
11. Bledzki AK, Kirschling, H, Steinbichler G, et al. Microcellular moulding with gas coun-
ter pressure using physical blowing agent. In: Proceedings of the cellular metals andpolymers, Furth, Germany, 12–14 October 2004.
Bledzki et al. 339
at UNIVERSITAETSBIBLIOTHEK KASSEL on November 4, 2014cel.sagepub.comDownloaded from

12. Rikards R and Pedersen P. Elaboration of optimal design models for objects from data
of experiments. In: Pedersen P (ed.) Optimal design with advanced materials. London/New York: Elsevier Publishers, 1993, pp.149–162.
13. Rikards R, Bledzki AK, Eglajs V, et al. Elaboration of optimal design models for
composite materials from data of experiments. Mech Compos Mater 1992; 28(4):435–445.
14. Goracy K. Duroplaste mit hoheren Gehalten an Partikelrecyklat. PhD Thesis, Institute ofMaterial Technology, University of Kassel, 1997.
15. Bledzki AK, Rohleder M, Kirschling H, et al. Microcellular polycarbonate withimproved notched impact strength produced by injection moulding with physical blow-ing agent. Cell Polym 2008; 27(6): 327–345.
340 Journal of Cellular Plastics 48(4)
at UNIVERSITAETSBIBLIOTHEK KASSEL on November 4, 2014cel.sagepub.comDownloaded from