3 raster & vector formats
DESCRIPTION
3 Raster & Vector FormatsTRANSCRIPT

Electronic Charts: Raster and Vector Formats

DIGITAL SPATIAL DATA
• RASTER
• VECTOR
• Real World

The Basic Difference
• Raster charts are simply bitmap images created by scanning a paper chart
• Vector charts portray charted features as points, lines, or areas with amplifying information (attributes) found in an associated database
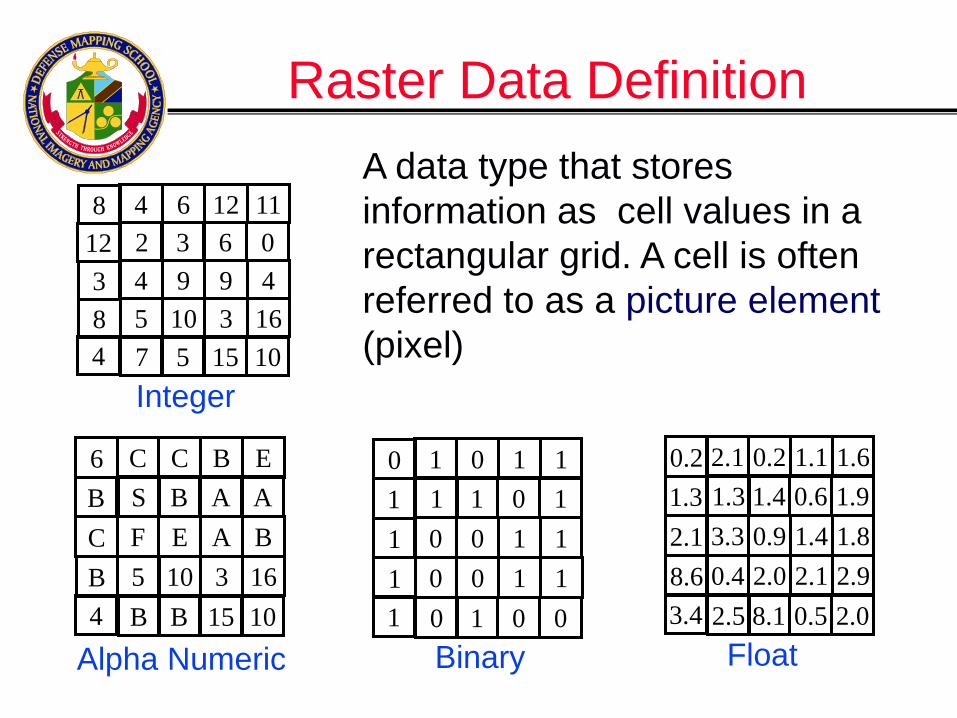
Raster Data Definition
8 4 6 12 11
12 2 3 6 0
3 4 9 9 4
8 5 10 3 16
4 7 5 15 10
A data type that stores
information as cell values in a
rectangular grid. A cell is often
referred to as a picture element
(pixel)
6 C C B E
B S B A A
C F E A B
B 5 10 3 16
4 B B 15 10
Integer
Alpha Numeric
0 1 0 1 1
1 1 1 0 1
1 0 0 1 1
1 0 0 1 1
1 0 1 0 0
Binary
0.2 2.1 0.2 1.1 1.6
1.3 1.3 1.4 0.6 1.9
2.1 3.3 0.9 1.4 1.8
8.6 0.4 2.0 2.1 2.9
3.4 2.5 8.1 0.5 2.0
Float

Raster Charts
• A set of colored pixels representing chart information as a picture on computer screen
• Simply an array of pixels arranged in rows and columns
• Pixels are color coded, but do not represent features explicitly


The Appeal of Raster
• Looks like a paper chart
• Cheap and easy to produce (scan existing paper chart)
• Runs easily on PC
• World-wide availability
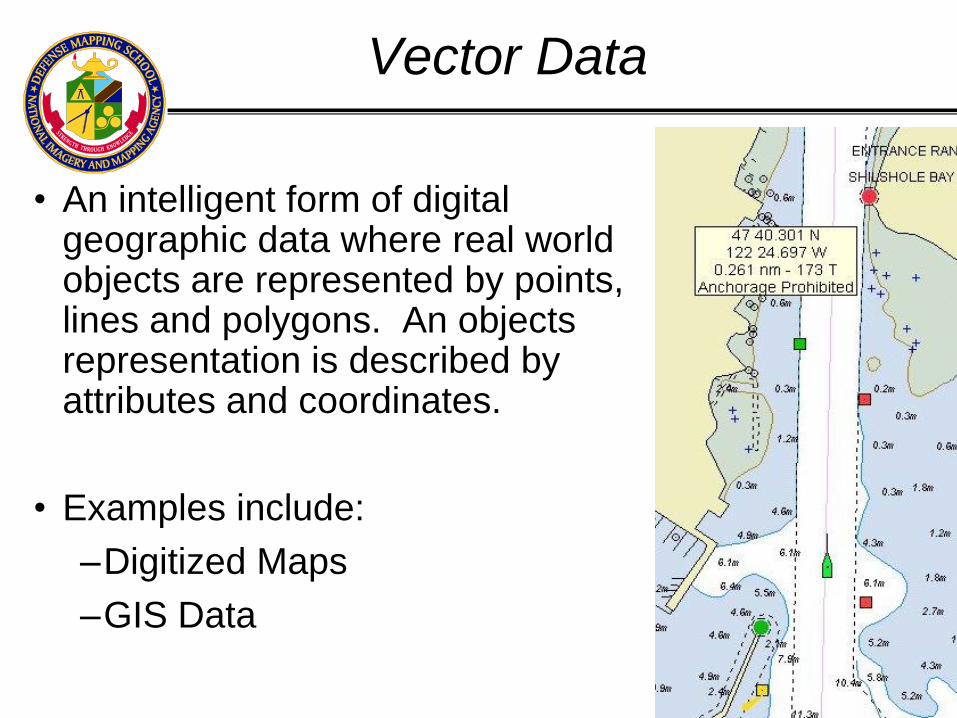
• An intelligent form of digital geographic data where real world objects are represented by points, lines and polygons. An objects representation is described by attributes and coordinates.
• Examples include:
–Digitized Maps
–GIS Data
Vector Data

Feature Entities
• simple point
• simple line
• simple polygon
• complex
River Spatial Data
Attribute Data
LENGTH WIDTH
2035.00 25.00
ID
1
2 525.00 18.00
#1 #2
• A Feature logically consists of both the spatial data linked
with its attributes in a feature table.
FEATURE ENTITIES

Vector Data
Spatial Data Analysis
•
• •
•
• •
• •
• •
•
2 5
1
4
7 6
Lake
Features:
Line Points:
Connected Detached
Area Text
• Lake
Geographic data are separated
into themes, tiled for speed of
access and placed on CD-ROM Network Analysis
30 30’ N
040 40’ E 30 30’ N
040 50’ E
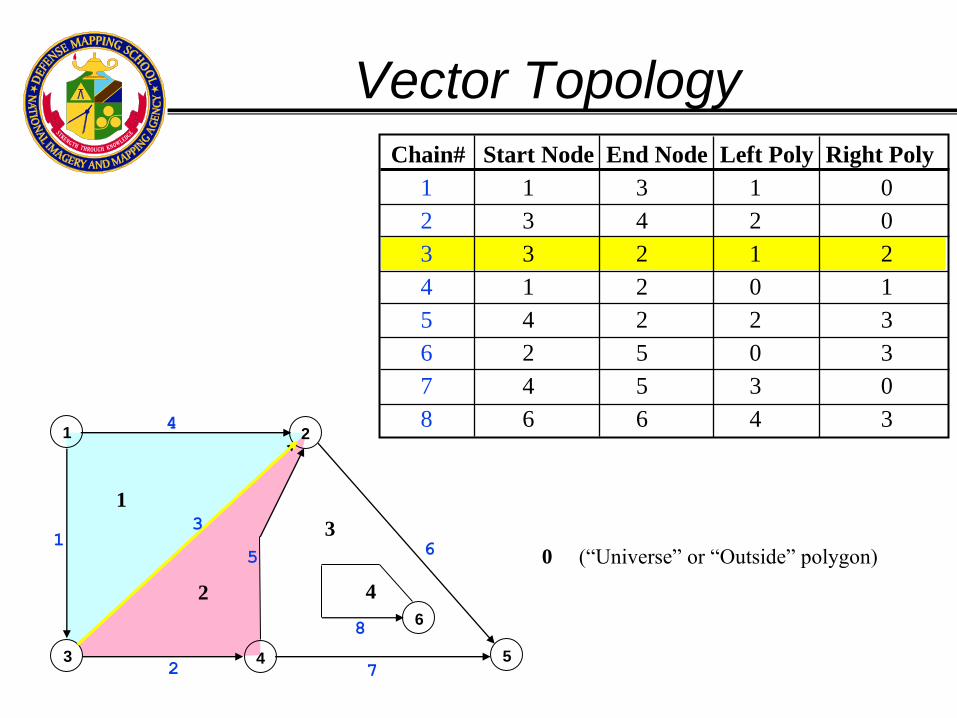
Vector Topology
Chain# Start Node End Node Left Poly Right Poly
1 1 3 1 0
2 3 4 2 0
3 3 2 1 2
4 1 2 0 1
5 4 2 2 3
6 2 5 0 3
7 4 5 3 0
8 6 6 4 3
2 7 3
1
4
3
5 6
1
2
3
4
8
1 2
4 5
6
0 (“Universe” or “Outside” polygon)

Paradigm Shift
• Looks “different” from a paper chart
• Underlying database allows queries and layer selection
• Zooming reveals detail • Complex, expensive, and
time-consuming to produce • Needs more powerful
computer and expensive display to meet IHO/DoD requirements

Raster and Vector Data Models
Vector Representation
X-AXIS
500
400
300
200
100
600 500 400 300 200 100
Y-AXIS
River
House
600
Trees
Trees
B
B
B B
B
B
B
B G
G
BK
B
B
B
G
G
G G
G
Raster Representation
1 2 3 4 5 6 7 8 9 10
1
2
3
4
5
6
7
8
9
10
Real World
G
G

Raster Model
Land
Shoreline
Water
Vector Shoreline
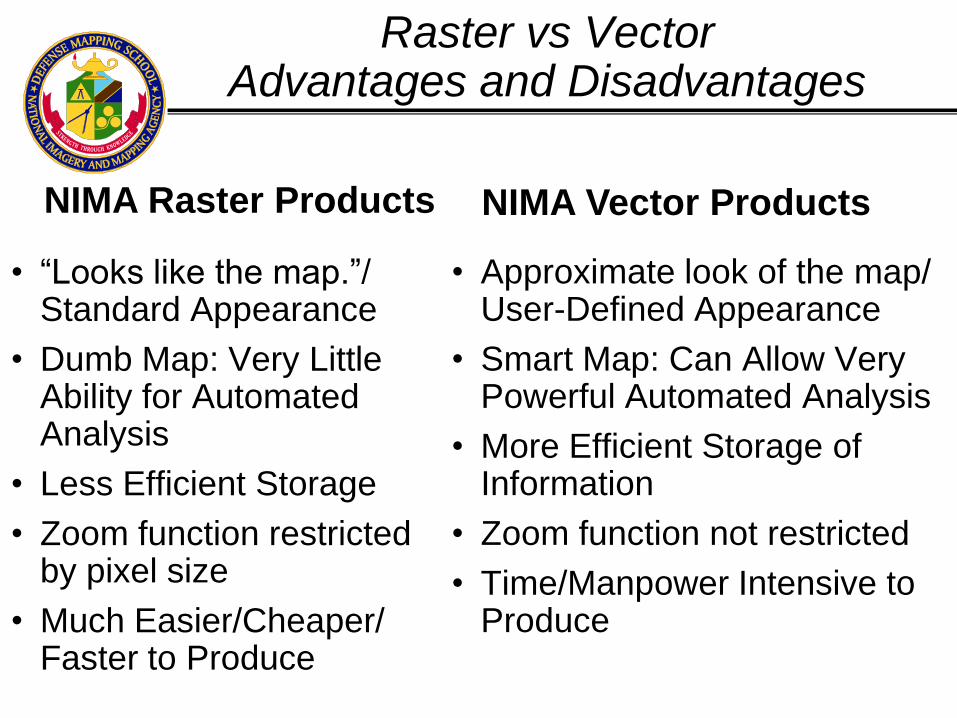
Raster vs Vector Advantages and Disadvantages
• “Looks like the map.”/ Standard Appearance
• Dumb Map: Very Little Ability for Automated Analysis
• Less Efficient Storage
• Zoom function restricted by pixel size
• Much Easier/Cheaper/ Faster to Produce
• Approximate look of the map/ User-Defined Appearance
• Smart Map: Can Allow Very Powerful Automated Analysis
• More Efficient Storage of Information
• Zoom function not restricted
• Time/Manpower Intensive to Produce
NIMA Raster Products NIMA Vector Products

Summary
• Raster Chart:
–Scanned chart, represented as row and column of pixels
–Cheap and easy to produce and manipulate
• Vector Data:
–Information in the form of points, lines, and polygons w/supporting attribute database
–More difficult to produce and use, but contains more information and capability
–The future of Geospatial Information

ENC, DNC®, or RNC????

Not all charts are equal….
• Many different formats exist for both raster and vector charts
• Most vector charts are digitized paper charts, thereby inheriting any errors (and possibly introducing some!)
• Countries are producing unique digital charts based on their interpretation of IHO standards

ENC
DNC® BSB
ARCS
C-MAP
Navionics
Transas

RNC, ENC, or DNC????
• RNC - Raster Nautical Chart
– “a facsimile of a paper chart originated by, or distributed on the authority of, a government-authorized hydrographic office.” (IHO S-61)
• ENC - Electronic Navigational Chart – means the database, standardized as to content,
structure and format, issued for use with ECDIS on the authority of government-authorized hydrographic offices…” (Sec. 2.2, IMO PS)
– IHO S-57 format
• DNC® - Digital Nautical Chart
– Produced by NIMA in DoD standard Vector Product Format (VPF)

Which is better?
• Depends on your point of view….
• Raster is easier and cheaper to produce, but vector provides much more information and capability to the navigator. Vector is the future.
• NOAA BSB & British ARCs worldwide
• DoD standard is Vector Product Format --DNC®. 5000 charts, but carto source
• ENC produced from original source data

Cartographic Source

Original Source Vector
Data - Image Source