3. operator sales - southcommmedia.cygnus.com/files/base/vmw/document/2011/06/2002...operator’s...
TRANSCRIPT

National employ-ment trends cameacross loud andclear on vendingoperator’s revenue
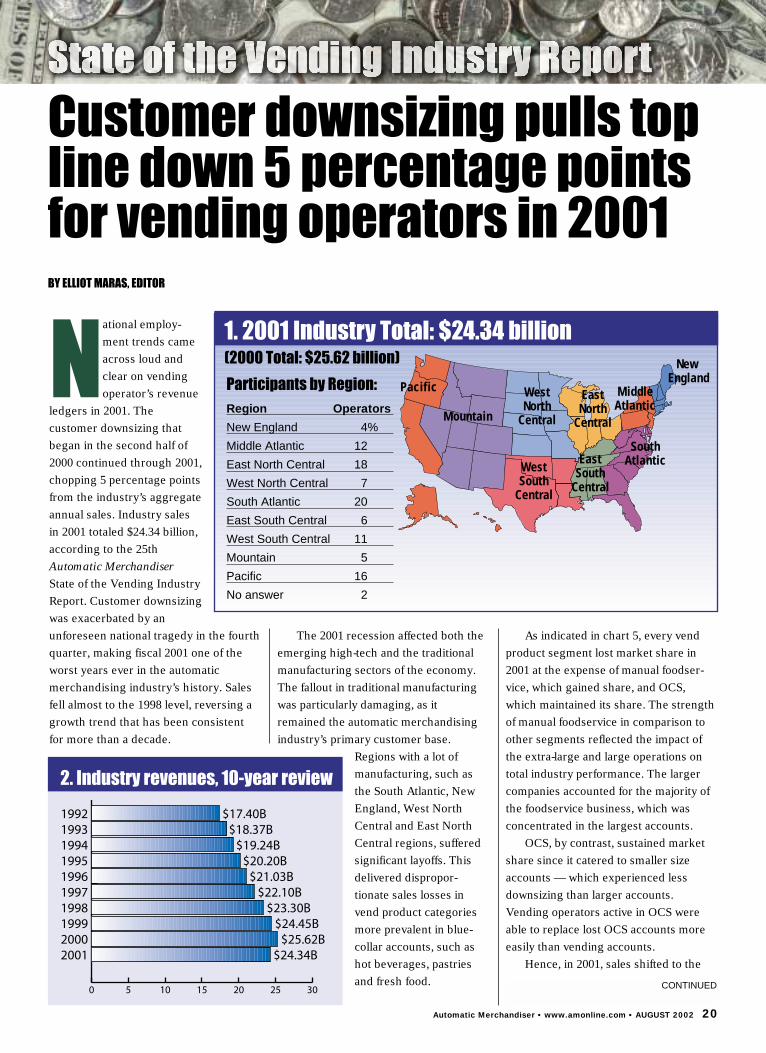
ledgers in 2001. Thecustomer downsizing thatbegan in the second half of2000 continued through 2001,chopping 5 percentage pointsfrom the industry’s aggregateannual sales. Industry salesin 2001 totaled $24.34 billion,according to the 25thAutomatic MerchandiserState of the Vending IndustryReport. Customer downsizingwas exacerbated by anunforeseen national tragedy in the fourthquarter, making fiscal 2001 one of theworst years ever in the automaticmerchandising industry’s history. Salesfell almost to the 1998 level, reversing agrowth trend that has been consistentfor more than a decade.
The 2001 recession affected both theemerging high-tech and the traditionalmanufacturing sectors of the economy.The fallout in traditional manufacturingwas particularly damaging, as itremained the automatic merchandisingindustry’s primary customer base.
Regions with a lot ofmanufacturing, such asthe South Atlantic, NewEngland, West NorthCentral and East NorthCentral regions, sufferedsignificant layoffs. Thisdelivered dispropor-tionate sales losses invend product categoriesmore prevalent in blue-collar accounts, such ashot beverages, pastriesand fresh food.
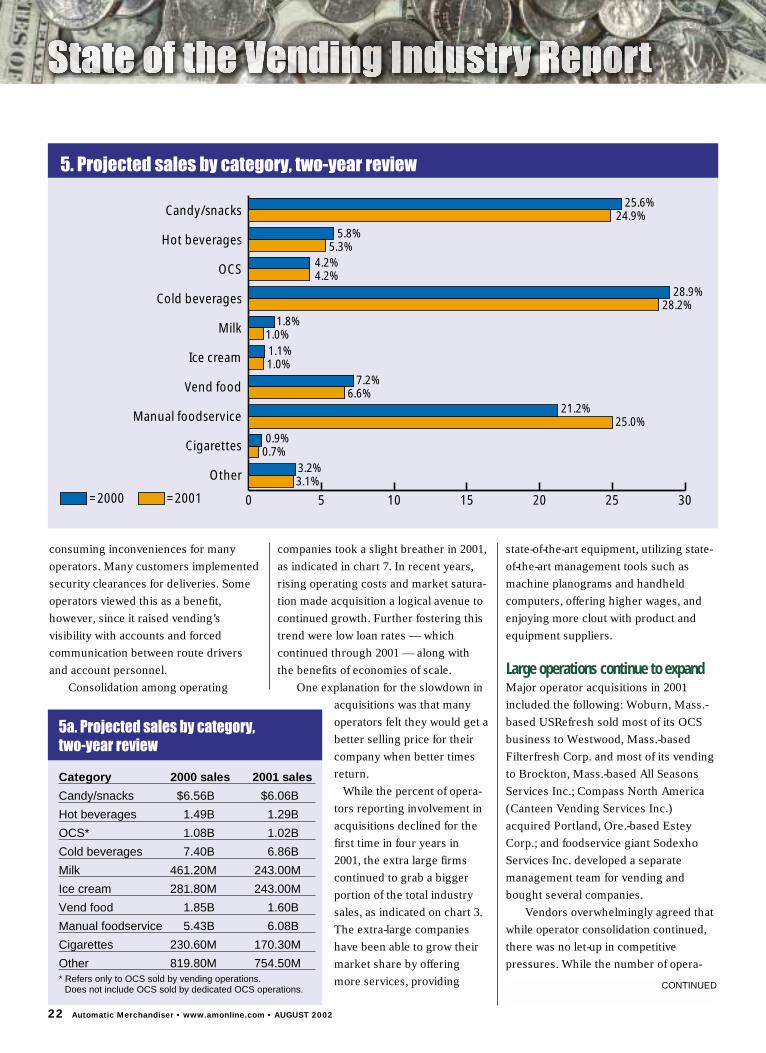
As indicated in chart 5, every vendproduct segment lost market share in2001 at the expense of manual foodser-vice, which gained share, and OCS,which maintained its share. The strengthof manual foodservice in comparison toother segments reflected the impact ofthe extra-large and large operations ontotal industry performance. The largercompanies accounted for the majority ofthe foodservice business, which wasconcentrated in the largest accounts.
OCS, by contrast, sustained marketshare since it catered to smaller sizeaccounts — which experienced lessdownsizing than larger accounts.Vending operators active in OCS wereable to replace lost OCS accounts moreeasily than vending accounts.
Hence, in 2001, sales shifted to the
Customer downsizing pulls topline down 5 percentage pointsfor vending operators in 2001 BY ELLIOT MARAS, EDITOR
1. 2001 Industry Total: $24.34 billion(2000 Total: $25.62 billion)
Participants by Region:Region Operators
New England 4%
Middle Atlantic 12
East North Central 18
West North Central 7
South Atlantic 20
East South Central 6
West South Central 11
Mountain 5
Pacific 16
No answer 2
2. Industry revenues, 10-year review
CONTINUED
Automatic Merchandiser • www.amonline.com • AUGUST 2002 20
Pacific
Mountain
WestNorth
Central
EastNorth
Central
WestSouth
Central
EastSouth
Central
SouthAtlantic
MiddleAtlantic
New England
two ends of the industry’s customer base— the extra large accounts, dominatedby foodservice, and the smallestaccounts, dominated by OCS.
Automatic merchandising typicallyoutperforms the foodservice industry inprosperous times, as it did in 1997 and1998, and underperforms it in a reces-sion. Foodservice industry sales grew by
3.7 percentage points in 2001, accordingto the National Restaurant Association’s2002 Restaurant Industry Forecast,compared to a 5.4-point growth rate theprevious year.
Employers in the financial and“dotcom” industries, concentrated in themid-Atlantic and Pacific regions, laid offthe most employees, according to the
ConferenceBoard, aWashington,D.C.-basedorganizationthat studieseconomictrends. Theimpact of thisloss was lesssevere than thatof traditionalmanufacturing,since itaccounted for asmaller part ofthe market.
The Sept. 11thtragedy exacer-bated therecession,adding thetravel andleisure indus-tries to thoseseverelyaffected, andinflicting even
more damage onthe Mid Atlanticregion’s economy.Operators servingaccounts inManhattan lostsome largecustomers and, insome cases, theirequipment as well.The ConferenceBoard reported
that the fourth quarter of 2001 witnessedthe largest downsizing in the UnitedStates in more than 12 years, with morethan 1.4 million jobs lost.
Interviews with operators confirmedthat those serving the industries mostaffected by the 2001 recession — automo-tive, textiles, internet, telecommunications,aerospace, finance and hospitality —witnessed the biggest fallout in same-location sales.
Labor supply expandsThe only positive trend for operators wasa more favorable labor market.Throughout the prosperous 1990s,operators complained of not being ableto find qualified help. When layoffsbegan in April of 2001, most operatorsfound they no longer had trouble findingqualified help. The situation also allevi-ated some of the pressure to raiseemployee compensation, delivering asmall dose of relief to operators’suffering balance sheets.
Also on the positive side were stableproduct costs and fuel prices. The onlyproduct area where costs increased wasin food. More than offsetting thesepositive factors, however, were skyrock-eting costs for medical, workercompensation and business liabilityinsurance.
Fiscal 2001 brought other challengesas well. The security concerns caused bythe Sept. 11th tragedy created time-
3. Operator sales
Size Revenue range % of 2001 Projected % of Projected % ofoperators 2001 sales 2001 sales 2000 sales 2000 sales
Small under $1 million 75% $1.179 billion 5.1% $1.415 billion 5.8%
Medium $1 M - $4.9 M 18 3.491 15.1 3.780 15.5
Large $5 M - $9.9 M 4 2.058 8.9 2.800 11.5
Extra large $10 M + 3 16.394 70.9 16.400 67.2
Total $23.12 billion* $23.280 billion*
* Does not include 5 percent of total revenue for in-house and self-operated machines.
4a. Purchasing sources four-year review
Source % expenditures from this source1998 1999 2000 2001
Vend/OCS distributors 34.9% 42.7% 37.9% 44.2%
Foodservice distributors 15.6 20.7 17.7 8.9
Warehouse clubs 3.2 2.1 2.3 3.4
Manufacturer direct 14.9 9.7 8.7 9.5
Beverage bottlers 29.5 23.6 30.6 32.4
Outside commissaries 1.1 0.7 2.6 1.3
Other 0.8 0.3 0.2 0.4Editor’s Note: Different sample bases for each year.
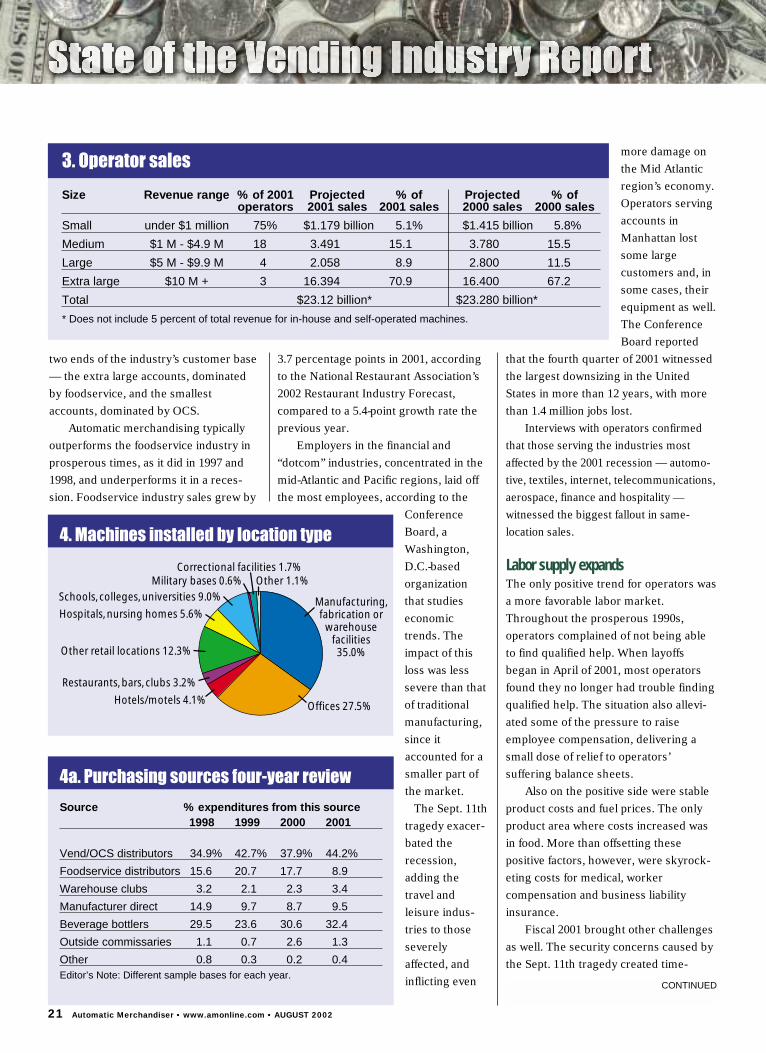
4. Machines installed by location type
Manufacturing,fabrication or
warehousefacilities
35.0%
Offices 27.5%Hotels/motels 4.1%
Restaurants, bars, clubs 3.2%
Other retail locations 12.3%
Hospitals, nursing homes 5.6%
Schools, colleges, universities 9.0%
Military bases 0.6%Correctional facilities 1.7%
Other 1.1%
CONTINUED
21 Automatic Merchandiser • www.amonline.com • AUGUST 2002
consuming inconveniences for manyoperators. Many customers implementedsecurity clearances for deliveries. Someoperators viewed this as a benefit,however, since it raised vending’svisibility with accounts and forcedcommunication between route driversand account personnel.
Consolidation among operating
companies took a slight breather in 2001,as indicated in chart 7. In recent years,rising operating costs and market satura-tion made acquisition a logical avenue tocontinued growth. Further fostering thistrend were low loan rates — whichcontinued through 2001 — along withthe benefits of economies of scale.
One explanation for the slowdown inacquisitions was that manyoperators felt they would get abetter selling price for theircompany when better timesreturn.
While the percent of opera-tors reporting involvement inacquisitions declined for thefirst time in four years in2001, the extra large firmscontinued to grab a biggerportion of the total industrysales, as indicated on chart 3.The extra-large companieshave been able to grow theirmarket share by offeringmore services, providing
state-of-the-art equipment, utilizing state-of-the-art management tools such asmachine planograms and handheldcomputers, offering higher wages, andenjoying more clout with product andequipment suppliers.
Large operations continue to expandMajor operator acquisitions in 2001included the following: Woburn, Mass.-based USRefresh sold most of its OCSbusiness to Westwood, Mass.-basedFilterfresh Corp. and most of its vendingto Brockton, Mass.-based All SeasonsServices Inc.; Compass North America(Canteen Vending Services Inc.)acquired Portland, Ore.-based EsteyCorp.; and foodservice giant SodexhoServices Inc. developed a separatemanagement team for vending andbought several companies.
Vendors overwhelmingly agreed thatwhile operator consolidation continued,there was no let-up in competitivepressures. While the number of opera-
22 Automatic Merchandiser • www.amonline.com • AUGUST 2002
5. Projected sales by category, two-year review
0 5 10 15 20 25 30
Candy/snacks
=2000 =2001
Hot beverages
OCS
Cold beverages
Milk
Ice cream 1.0%1.1%
1.0%1.8%
6.6%7.2%
0.7%0.9%
3.1%3.2%
25.0%21.2%
4.2%4.2%
5.3%5.8%
24.9%25.6%
28.2%28.9%
Vend food
Manual foodservice
Cigarettes
Other
5a. Projected sales by category,two-year review
Category 2000 sales 2001 sales
Candy/snacks $6.56B $6.06B
Hot beverages 1.49B 1.29B
OCS* 1.08B 1.02B
Cold beverages 7.40B 6.86B
Milk 461.20M 243.00M
Ice cream 281.80M 243.00M
Vend food 1.85B 1.60B
Manual foodservice 5.43B 6.08B
Cigarettes 230.60M 170.30M
Other 819.80M 754.50M* Refers only to OCS sold by vending operations.
Does not include OCS sold by dedicated OCS operations. CONTINUED

tors in some markets decreased, theremaining players became stronger.
Operators responded to customerdownsizing in 2001 by reallocating capitalresources, reorganizing routes,postponing capital investments, andreassigning employee tasks. Many opera-tors interviewed reported reducing staffby not filling positions vacated by attri-tion. Operators, like other businessowners, have always preferred todownsize by postponing replacementsrather than laying off employees. Insome cases, however, layoffs were necessary.
Operators address morale issuesAs in other recessions, the downturnhurt employee morale. Operators inter-viewed noted that open communicationwith employees was the best remedy forthis challenge. Many met withemployees to discuss their financialchallenges, explain changes in employeeroles and company practices, and ask fortheir support. In some cases, operatorsreorganized their routes so that driverscould share the more lucrative stops.
While sales declines undercut expan-sion plans, most operators recognizedthe need to improve their sales efforts inorder to replace lost business. Thesurvey did not measure the number ofemployees assigned to particularpositions, but many operators whoreported reducing their staffs maintainedsales positions. Many also reportedspending more of their own time sellingto replace lost business.
Vendors also reduced operating costsby putting their own purchases, such asutilities and insurance, out for bids.
Expansion into glassfront cold drinkmachines, which holds potential toimprove cold beverage sales, did notmaterialize in 2001. Expansion intofrozen food machines continued in 2001,although at a slower pace than in theprevious eight years.
One exception to this trend to “laylow” was the percent using the Internetfor business purposes, which grew fasterthan in prior years, as indicated on chart17. The Internet is a technology that ischanging business and personal life in
many ways.Many large operators active in
foodservice ordered product online usingproprietary exchanges with foodserviceproviders. Operators of all sizes wereable to save time ordering aftermarket
VEND WEST SERVICES CASHES IN ON 20-OUNCE BOTTLE VARIETY WITH GLASSFRONTCOLD DRINK MERCHANDISERS
Vend West Services Inc. of Coos Bay, Ore. has a knack for keeping clear ofrecessions. In the late 1980s and early 1990s, the Pacific Northwest as a wholeevaded the industrial woes of that downsizing era.
The region wasn’t so lucky in the more recent recession. As the home baseof Microsoft, much of the Pacific Northwest blossomed with the high-tech boomof the middle and late 1990s, only to suffer the consequences when thatindustry imploded.
West Vend Services, fortunately, wasn’t much affected, noted Lou Leberti,president. His market, which is located about 220 miles south of Portland, neverhosted a lot of high-tech companies. As a result, he’s been able to invest intechnology and provide services that keep him competitive with the ever-aggressive cold beverage bottlers.
Leberti is grateful for recent cold beverage innovations. As the 20-ouncePET bottles have become more popular, he’s been able capitalize on theseproducts, thanks to glassfront cold drink machines. He operates about 35 of themachines, and finds they increase his sales and profitability.
In locations where he replaces a can machine with a glassfront filled withbottles, Leberti has witnessed a 12 to 15 percent sales lift. The increase doesnot taper off, he added.
Leberti does not rely on bottlers for his glassfront machines. While Coca-Cola has an exclusive on the newest bottle drop glassfront merchandiser,Leberti owns 35 earlier models.
Operators have mixed experiences with the glassfront machines. Theearliest versions had some technical issues. As reliability improved, operatorsfound the service more demanding. The machines have less capacity perfacing, so the machines need to be serviced more frequently.
“Our maintenance department has done a great job of maintaining them,”Leberti said.
He also recognized that theservicing takes longer. “It’s just asituation where it just takes more time.”
Leberti also acknowledged that theglassfront machines require a trainingprocess. But he’s found the increasedsales justifies the extra time andexpense. The 20-ounce PET bottlesgrab a higher price point, and arepreferred by consumers over cans.
Leberti has installed four-tube coinmechs in his glassfront drink machines,and equipped them with dollar coinpayout. This facilitates the purchaseprocess.
Leberti has found the glassfrontmachines particularly successful inschools, pulp mills and hospitals.
Lou Leberti has noticed a sustained12 to 15 percent boost in coldbeverage sales in his glassfrontmachines.
23 Automatic Merchandiser • www.amonline.com • AUGUST 2002
equipment parts online. A handful ofoperators active in OCS began to takeOCS orders online.
Another exception to the tendency topostone capital outlays was a continuedupdating of currency handling equip-ment in 2001, which increased over 2000.Operators needed to upgrade billchangers and validators to accept new $5and $10 currency designs. Upgrades ofbill changers and validators continued atthe same rate — more than 6 percent —as the prior year.
The number of bill changersremained relatively stable in 2001,despite a slight gain in the percentage ofmachines equipped with bill validators,which would theoretically replace theneed for bill validators. This likelyreflected a desire to maximize transac-tions using all available tools.
$5 bill acceptance growsThe growth in $5 bill acceptancesupported a similar increase in dollarcoin payout in 2001. This was becausemachines that accepted high denomina-tion bills but didn’t pay out dollar coinsquickly emptied out of coins. Hence,operators found it made sense to offerdollar coin payout in conjunction with $5bill acceptance.
The percent of machines paying outthe dollar coin increased in 2001,although it remained very small at about6 percent. Operators reported less diffi-culty procuring supplies of the dollarcoin and more success getting customersto use it. Typically, operators noted ittook a few weeks after the machinesstarted paying out dollar coins forcustomers to stop hoarding them anduse them in the machines.
Operators generally believed thatpaying out dollar coins and accepting $5 bills encouraged consumer spending.However, it also required additionalcapital investment, which many chose to postpone in 2001 because of the
poor economy.Dollar coin payout also
often required an upgrade tofour-tube coin changers.This not only required a newchanger, but more cashremained in the machine. Inaddition, the acceptance of$5 bills also raised the needfor new bill sorting equip-ment since sorting $5- and$1 bills manually is verylabor intensive.
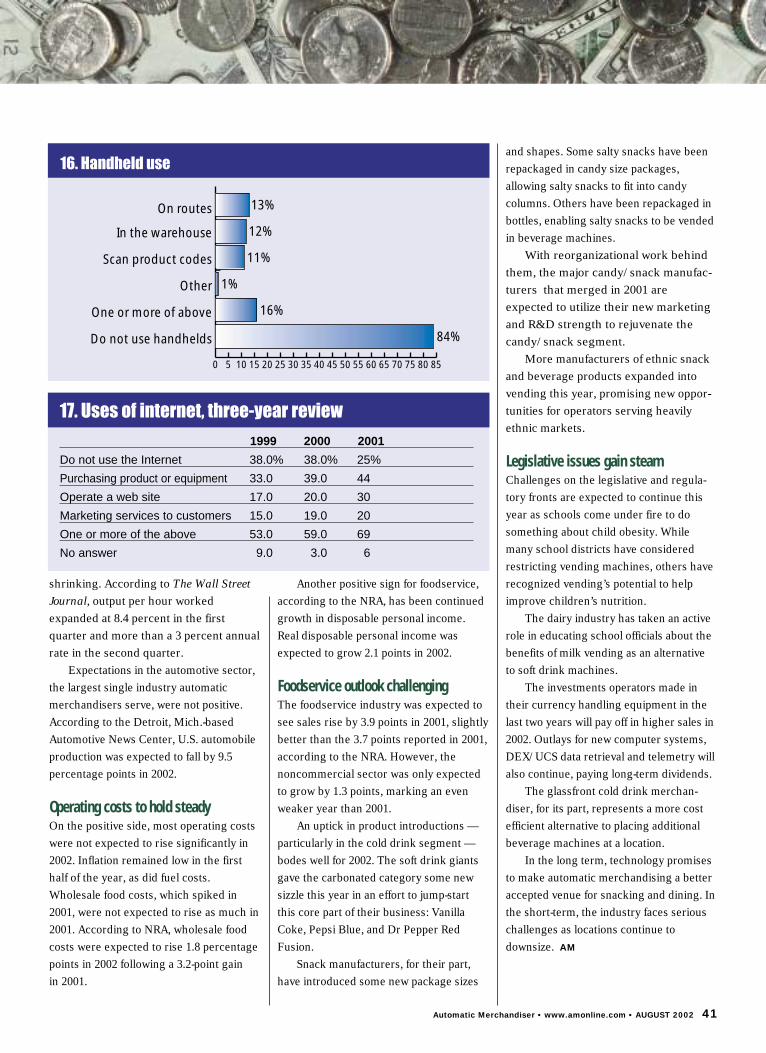
The percent of operators usinghandhelds remained flat in 2001, as mostdid not wish to invest in new computersystems. The percent utilizing DEX(Digital exchange), telemetry technolo-gies, cashless solutions, satellite vehicletracking and electronic security systems,advances that promised significant opera-tional savings, also remained miniscule.
The recession was not the onlyreason these new technologies did notgrow significantly in 2001, however, asvendors have always been slow to adoptnew technologies.
With the economy in tatters, productsuppliers, several of whom consolidatedin 2001, held off on product introduc-tions. Operators cited this as anotherfactor undercutting their efforts to stimu-late sales.
Fears of across-the-board productcost increases did not materialize asmore manufacturers merged in 2001.However, neither did any of the benefitssome operators hoped manufacturerconsolidation would bring. Some opera-tors hoped larger suppliers, with largerresearch and development resources,would introduce more products andprovide more marketing support.
More suppliers consolidateSupplier consolidations announced in2001 included:• Philip Morris, owner of Kraft Foods
Inc., finalized its purchase of Nabisco
Holdings Corp. Kraft Vending & OCSannounced a marketing organizationincluding Kraft and Nabisco brandsfor vending and OCS.
• Kellogg Co. finalized its acquisition ofKeebler Co.
• PepsiCo Inc. finalized its acquisition ofQuaker Oats Co., which ownsGatorade and South Beach BeverageCo. PepsiCo announced a newmarketing organization combiningFrito Lay Inc., Gatorade, Tropicanaand Quaker.
Lack of new products also made itdifficult for operators to raise prices. Asthe pricing information in this reportindicates, prices barely rose in 2001.Prices rose the most in the foodcategory, where many of the largeroperators were able to introduce newmenu items in their commissaries.
Recessions typically raise customers’tendency to seek higher commissionsand lower selling prices. Operators inter-viewed agreed that while this pressurereared its head in 2001, it was not as biga factor as it was in the last recession in1990/1991. One reason was thatcustomers recognized that vendingoperators faced the same cost increases— such as fuel, wages and benefits —that they themselves faced. Anotherreason operators cited was the success oftheir own efforts to communicateautomatic merchandising’s value as an
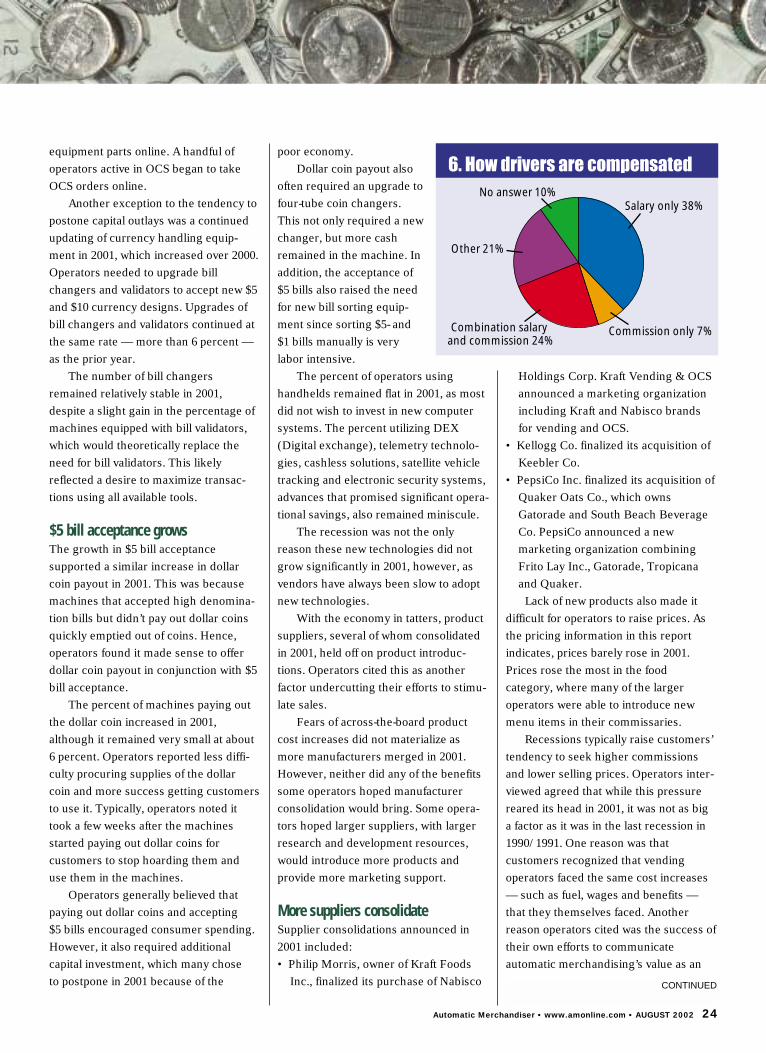
6. How drivers are compensated
Salary only 38%
Commission only 7%Combination salary and commission 24%
Other 21%
No answer 10%
CONTINUED
Automatic Merchandiser • www.amonline.com • AUGUST 2002 24
important employee benefit.Fiscal 2001 saw the beginning of a
renewed public interest in child nutritionthat gave momentum to new regulatoryinitiatives. The U.S. Department ofAgriculture called for stricter guidelinesfor school food, including new restric-tions on vending machines in schools. At the end of 2001, Surgeon General Dr. David Satcher called for a series ofinitiatives to restrict vending machines in schools.
Concern over child nutritionsupported an earlier movement to opposeexclusive beverage vending contracts inschools. Prior to 2001, consumer groupswere pressuring school districts to stopawarding large, exclusive cold drinkvending contracts in exchange for finan-cial support. This movement initiallyoffered opportunity to vending operatorswho historically lost these accounts tolarge cold drink bottlers.
Growing concern about child nutri-tion also gave rise to milk vendinginitiatives in schools. In 2000, the dairyindustry launched a program to market
dedicated milk machines in schools.These efforts emphasized the nutritionalbenefits of milk and included testsnationwide, which continued through2001. The tests indicated a ready marketfor milk vending in secondary schools.
The concern about children’s nutri-tion extended beyond the cold drinkarena, however. Public officials begancalling for new restrictions on vendingmachines in schools.
About the studyThe Automatic Merchandiser State of theIndustry Report was based on question-naires completed by a random samplingof 1,834 readers. The survey generated a24 percent response.
Survey participants were limited tofull-line, candy/snack and self-operatedvending businesses that sold candy,snacks, confections, cigarettes, hotbeverages, cold beverages, refrigeratedfood, frozen food, ice cream andmanually served food. The sampling didnot include music and game operatorswhose main business was not consum-
able merchandise vending, soft drinkbottlers whose main business was notvending, or ice cream distributors whosemain business was not vending.
Aggregate revenue and equipmentfigures for the report were based on atotal operator universe of 9,000 vendingoperations in the U.S., along with datafrom the government, product suppliersand equipment suppliers. The mailingand tabulating were done by Readex Inc.,a Stillwater, Minn.-based industrialresearch company.
The report’s revenue and equipmentfigures include machines operated bybusiness locations for their own use,known as in-house and self-operatedmachines. This portion is estimated to beabout 5 percent of the total industry.
1990s prosperity fadesThe 1990s prosperity began to erode inthe second half of 2000 with the“dotcom” crash, as reported in last year’sState of the Vending Industry Report.Operators serving a lot of these compa-nies were the first to report a fall-off insales. Employment in the financialservices sector held up in 2000 despitefalling stock values, according to theConference Board, until 2001, wheneven that sector suffered layoffs.
The decline in Internet-related andfinancial sector employment was particu-larly devastating to the mid-Atlantic andNew England regions, which alsosuffered layoffs in manufacturing.
The “dotcom” crash hurt the Pacificregion as much as any region. ThePacific region also suffered a fallout inaerospace manufacturing.
Both the East North Central and EastSouth Central regions were hurt bydwindling heavy industrial manufac-turing activity.
The automotive sector, the largestsingle automatic merchandisingcustomer, experienced a weak year in2001. Automotive production grew by
25 Automatic Merchandiser • www.amonline.com • AUGUST 2002
CONTINUED
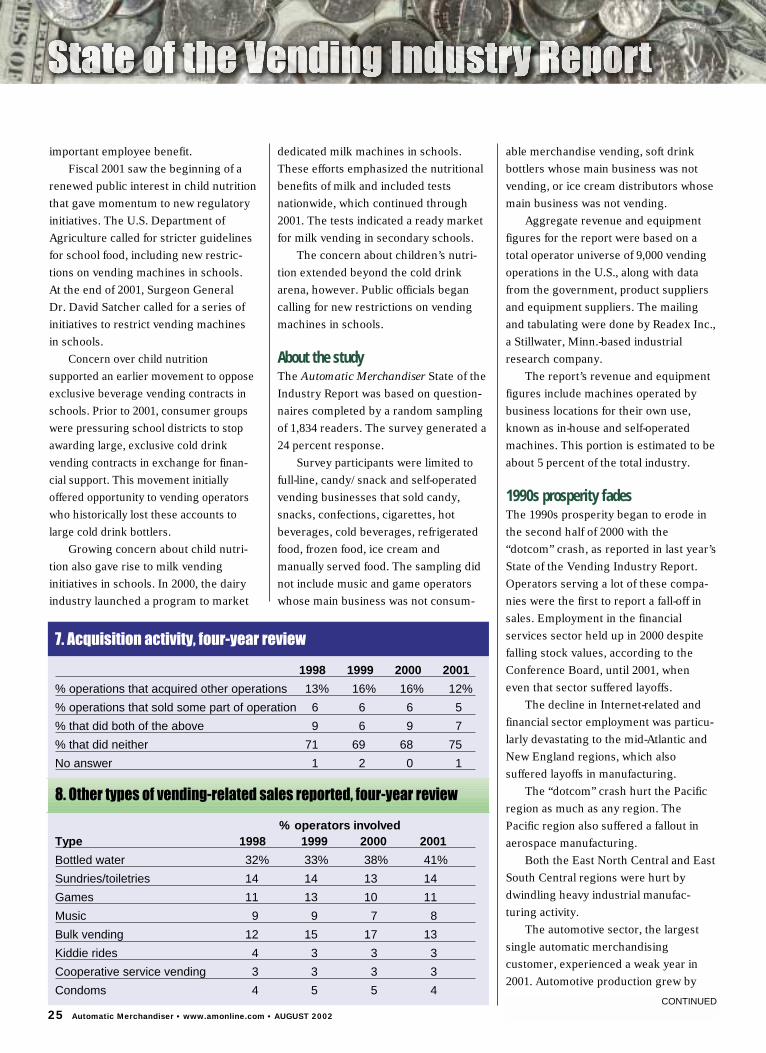
7. Acquisition activity, four-year review
1998 1999 2000 2001
% operations that acquired other operations 13% 16% 16% 12%
% operations that sold some part of operation 6 6 6 5
% that did both of the above 9 6 9 7
% that did neither 71 69 68 75
No answer 1 2 0 1
8. Other types of vending-related sales reported, four-year review
% operators involvedType 1998 1999 2000 2001
Bottled water 32% 33% 38% 41%
Sundries/toiletries 14 14 13 14
Games 11 13 10 11
Music 9 9 7 8
Bulk vending 12 15 17 13
Kiddie rides 4 3 3 3
Cooperative service vending 3 3 3 3
Condoms 4 5 5 4

1.29 percentage points in the U.S. in2001, according to the Detroit, Mich.-based Automotive News Center. Thiswas less than half the prior year’sincrease, and well below those of the mid
and late 1990s. The slowdown not onlyaffected automobile plants, but factoriesthat supplied these plants. Theseslowdowns hurt the East South Centraland East North Central regions the most.
The South Atlantic region was not asaffected by Internet-related woes as someother regions, but it was hurt by the dropin tourist trade that resulted from theSept. 11th tragedy.
The West South Central regionsfared better than most, thanks to areasonably healthy energy industry andan expanding export industry. Onenegative factor in the West South Centralregion however, was a decline intelecommunications employment, whichalso hurt the Mountain region.
Following is a more detailed analysisof the major product segments.
Cold drinks: bottles replace cansBottles continued to replace cans for thesixth consecutive year. Bottles grabbed35.8 percent of all cold drink sales in2001, growing at the same rate as theprevious year. Once again, the increasewas driven largely by the rise in bottle-capable machines. Dedicated bottle andcombination bottle/can machinesaccounted for 39.3 percent of allmachines on location, a marked gainover the 22.4 percent in 2000, which wasonly slightly higher than the 21.9percent in 1999.
26 Automatic Merchandiser • www.amonline.com • AUGUST 2002
CONTINUED
9. Cold beverage machines,four-year review
Year Projected total
1998 1,487,840
1999 1,613,800
2000 1,650,300
2001 1,554,583(Editor‘s note: These totals do notinclude all bottler-owned machinesloaned to vending operations, ormachines placed by bottlers that don’thave separate vending organizations.)
Cold beverage machines by type , four-year review
% of total Projected totalMachine type 1998 1999 2000 2001 1998 1999 2000 2001
Can 78.1% 68.8% 69.7% 52.5% 1,162,003 1,111,894 1,155,200 816,156
Bottle 7.2 18.5 12.8 21.4 107,124 298,553 213,400 332,681
Cup 4.1 2.6 2.7 2.9 61,001 41,958 44,600 45,083Dedicatedcan juice 5.2 5.7 4.6 4.5 77,368 91,986 77,000 69,956Combinationbottle/can 5.0 3.4 9.6 17.9 74,392 54,869 158,400 278,270
Other 0.4 0.9 0.6 0.8 5,952 14,524 1,700 12,437
Cold beverage sales, four-year review
% of sales Projected totalBeverage type 1998 1999 2000 2001 1998 1999 2000 2001
Can drinks 75.5% 67.7% 62.8% 59.0% $4.80B $4.82B $4.65B $4.05B
Bottle drinks 18.5 27.2 31.5 35.8 1.17B 1.94B 2.33B 2.46B
Cup drinks 5.2 4.9 4.9 4.0 331.00M 348.10M 362.60M 274.40M
Other 0.8 0.3 0.8 1.1 51.00M 2.10M 59.20M 75.46M
Average cold beverage prices, four-year review
Beverage type 1998 1999 2000 2001
Can beverage 59 cents 57 cents 59 cents 59 cents
Bottle beverage 90 93 98 95
Cup beverage 49 47 49 53
Unit bottle sales grew, but flat sellingprices undercut profits in the expandingbottle business.
The surge in bottle capable machinesbrought more price competition to thebusiness, as the average bottle price fellin 2001 for the first time in six years, asindicated in chart 9.
The survey indicated that the largeroperators placed more bottle machinesand sold a higher percentage of bottledrinks. Larger operators also succeededin charging slightly more for bottles thansmaller competitors.
One advantage larger operators hadin the bottle business was a greaterability to operate dedicated coldbeverage routes, which has proven amore cost-efficient way to inventory anddeliver bottle beverages.
Operators of all sizes noted thatmachine loan programs from beverage
bottlers offered them the fastest way toget into the growing bottle business.
Several operators interviewedreported subcontracting their cold drinkbusiness to full-service beverage bottlers.This relieved them of the costs andhassles associated with bottles. Bottles,being larger and bulkier than cans,required more warehouse space, tookmore room on the truck, increased somerisk exposure and insurance costs, wereheavier for drivers to load, and increasedwear and tear on delivery vehicles.
Many still prefer cans to bottlesThe costs involved in expanding intobottles caused many operators tocontinue to prefer cans, which offeredlower selling price but a higher grossprofit margin. Operators noted thatmany consumers, particularly older andfemale consumers, continued to prefer
cans over bottles. In many blue-collarwork sites, workers cannot carry bottlesto their work areas. Cans, on the otherhand, can be consumed in the breakroom faster than bottles.
While most operators agreed pricingpressure was less intense for cans thanbottles, most were nonetheless unable toraise can prices in 2001. One reason citedwas supermarkets’ practice of offeringmark-downs on can multipacks as promo-tional loss leaders.
While larger operators were able tocharge slightly more for bottles thansmaller operators, can prices were moreequitable among all size operators.
Dedicated can juice machinesdeclined as a percent of total coldbeverage machines for the secondconsecutive year. Juice companies recog-nized that many operators preferredother forms of marketing support to
27 Automatic Merchandiser • www.amonline.com • AUGUST 2002

dedicated juice machines. As only aminority of locations could supportdedicated juice machines in addition tocarbonated soft drink machines, opera-tors preferred price discounts andgenerous rebates to dedicated juicemachine programs.
Dedicated machine programs continueThe decline in dedicated can juicemachines did not signal any lack ofinterest in dedicated machines for otheralternative beverages, however. Thelarger sports drink, ready-to-drink-teaand bottled water manufacturerscontinued to support dedicated machineprograms in 2001. Sports, ready-to-drinkteas and bottled water were usuallymarketed in bottle machines rather thancan venders.
Overall, the number of machine loan
FLAVORED AND MINERAL-ENHANCED WATERSGIVE AN ADDED PUSH TO THE BOOMINGBOTTLED WATER BUSINESS
Bottled water continues to be the fastest growing segment of the coldbeverage business. The percentage of vending operators selling bottledwater has increased every year for the past seven years, and in recentyears, sales have consistently posted double-digit gains.
To sustain this growth, some manufacturers have introduced fruit-flavored, zero-calorie spring water. These fruit-enhanced waters have takenon a life of their own, with sales more than doubling every year for the pastthree years.
One cold drink manufacturer, Veryfine Inc., has further developed theflavored water business with vitamin-enhanced water.
In 1999, Veryfine Inc. introduced Fruit20®, a lightly fruit flavored naturalspring water sweetened with SPLENDA® sweetener, containing no caloriesand no carbonation, in six flavors. Fruit20® sales have more than doubledevery year.
Veryfine followed Fruit20® with Fruit20® Plus, a natural spring water fortifiedwith herbs and vitamins in three flavors. Combined, Fruit20® and Fruit20® Plusare the fastest selling water brands in U.S. convenience stores. According toChicago-based Information Resources Inc., Fruit20® and Fruit20® Plus sold260 units per store for the 24 weeks ending Feb. 23, 2002.
CONTINUED
Automatic Merchandiser • www.amonline.com • AUGUST 2002 28
programs from alternative cold drinkmanufacturers decreased. In 2001, only ahandful of large sports drink, ready-to-drink-tea and bottled watermanufacturers offered such programs.
The survey did not measure thenumber of glassfront cold drinkmachines. However, interviews withmachine manufacturers and vendingoperators alike confirmed that thenumber did not rise much in 2001 assome had anticipated in 2000, when theCoca-Cola Co. sanctioned a glassfrontmachine.
Glassfront machines increase slowlyWhile glassfront cold drink machineshad been available for several years,most were plagued with technical issues.In 2001, the new Coke machine washeralded as a major improvement.
With enhanced reliability, glassfront
cold drink machines offered the hope ofproviding a much-needed boost to thecold drink business. The machinesprovided better merchandising thanclosed-front venders, particularly theability to present a wider product selec-tion. Tests indicated the machinesincreased sales.
The Coca-Cola Co.’s glassfrontrollout got off to a late start in 2001. This,along with the reluctance of bottlers toinvest in new equipment, minimized themachines’ availability in 2001.
Operators using glassfront modelsreported mixed results in 2001. Theglassfronts required more service thanclosed-front machines. There was alsoless capacity per column, leaving opera-tors the choice of either doubling up oncolumns or stocking more variety. Whilegreater product variety was one of themachine’s purposes, maintaining the
variety required additional labor, trans-portation and warehouse costs.
Last year’s State of the VendingIndustry Report indicated a decade-longdrop in cold cup machine placement hadleveled off. This trend continued in 2001,as the survey once again reported aslight gain in cup machine placements.
But while machines increased, salesdipped. Cup drinks, like cans, lostmarket share to bottles once again in 2001.
Cold drink sales falter overallThe cold drink sector’s weak perfor-mance in 2001 largely reflected the stateof the cold beverage industry as a whole.According to the New York City-basedBeverage Marketing Corp. (BMC),which studies beverage trends, carbon-ated soft drinks (CSDs) posted theirthird consecutive soft year in 2001, withretail sales growing only 2.5 percentagepoints. CSD volume has increased 0.5points per year for the last three years.
While far and away the largest colddrink category, CSDs lost share of retailsales in 2001, as did juice drinks andmilk. Sports drinks and bottled waterwere the only beverages among thosetypically sold through vending machinesto gain share of total retail sales in 2001.
Bottled water was the only categoryto grow sales in double digits at 18.4percentage points in 2001, outside ofenergy drinks, a brand-new category thatwas barely visible in vending machines .
Energy drinks, a European importthat first emerged in U.S. bars on theWest Coast in 1997, found their way tovending in 2001. The nutrient-enhanceddrinks came in tall cans and commandedexceptionally high prices. They werepopular with young people and posteddouble-digit sales increases every yearthrough 2001. Several beverage compa-nies, including Coca Cola Co., SnappleBeverage Co., South Beach Beverage Co.
29 Automatic Merchandiser • www.amonline.com • AUGUST 2002
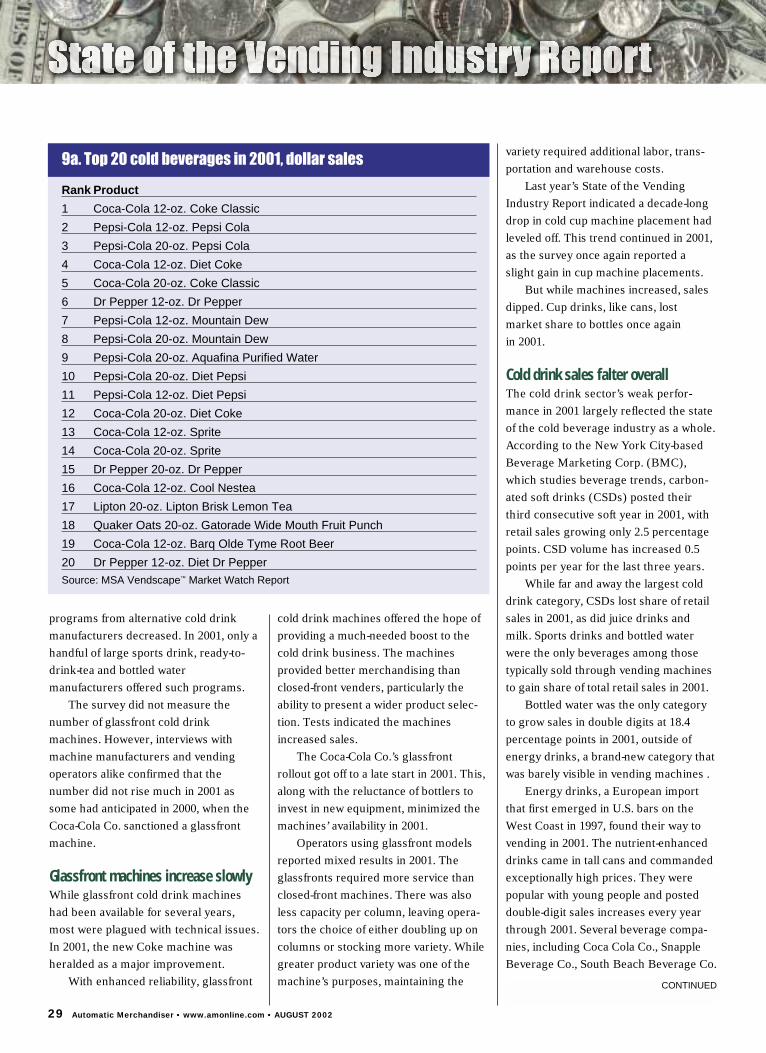
9a. Top 20 cold beverages in 2001, dollar sales
Rank Product
1 Coca-Cola 12-oz. Coke Classic
2 Pepsi-Cola 12-oz. Pepsi Cola
3 Pepsi-Cola 20-oz. Pepsi Cola
4 Coca-Cola 12-oz. Diet Coke
5 Coca-Cola 20-oz. Coke Classic
6 Dr Pepper 12-oz. Dr Pepper
7 Pepsi-Cola 12-oz. Mountain Dew
8 Pepsi-Cola 20-oz. Mountain Dew
9 Pepsi-Cola 20-oz. Aquafina Purified Water
10 Pepsi-Cola 20-oz. Diet Pepsi
11 Pepsi-Cola 12-oz. Diet Pepsi
12 Coca-Cola 20-oz. Diet Coke
13 Coca-Cola 12-oz. Sprite
14 Coca-Cola 20-oz. Sprite
15 Dr Pepper 20-oz. Dr Pepper
16 Coca-Cola 12-oz. Cool Nestea
17 Lipton 20-oz. Lipton Brisk Lemon Tea
18 Quaker Oats 20-oz. Gatorade Wide Mouth Fruit Punch
19 Coca-Cola 12-oz. Barq Olde Tyme Root Beer
20 Dr Pepper 12-oz. Diet Dr PepperSource: MSA Vendscape™ Market Watch Report
CONTINUED

(owned by PepsiCo) and Anheuser-Busch announced energy drink rollouts.
The category leader, Red Bull NorthAmerica, tested some dedicated Red Bull
machines on the West Coast in 2001. Butfor the most part, the category wasbarely visible in vending.
Sports drinks posted an 8.4-point
volume gain. The leading player,Gatorade, received a major boost afterPepsiCo acquired Quaker Oats andformed a new marketing divisioncombining Gatorade, Topicana, Frito Layand Quaker.
Coca-Cola responded with a strongmarketing push for its sports drink,Powerade.
A decline in the amount of milk soldin cold drink machines in 2001 reflectedthe negative trend of the milk category ingeneral, as discussed on page 52. TheBMC also reported producer volume ofmilk fell in 2001, following an increasethe previous year that was driven byaggressive dairy industry marketing.
Candy/snacks tough it out againWhile the economy was once again themain factor, the fact that most operatorschose to postpone computer upgrades in2001 partly accounted for thecandy/snack/confection segment’sweak performance. Candy, snacks andconfections, more than any productsegment, stands the most to gain whenoperators upgrade their data retrievaland computer systems.
Being the most SKU (stock keepingunit) intensive product segment,candy/snacks/confections required moremanagement than other vend productcategories. Operators equipped with toolssuch as handheld computers that canmeasure item-level change and quicklyassess the financial ramifications of amenu change were better able to deter-mine the most profitable product mix.
One reason the large and extra largeoperators reaped higher sales was thatthe management of these larger firmswas more involved in machine menuplanning and used more handheldcomputers. This was particularly impor-tant in the candy/snack/confectionsegment, which by far has the mostSKUs to manage.
The larger the company, the lessauthority the route drivers had in making
VETERAN INDEPENDENT FINDS SEVERALADVANTAGES IN HIS LIFE AFTER ACQUISITION
Life was not easy being an independent vending operator in a region thatwas suffering a lot of workplace downsizing. Steve and Dawn Melillo, whooperated Melillo Vending & Amusements Inc. in Brockport, Pa., were facingsome tough decisions as the economy worsened in western Pennsylvania in themiddle 1990s.
Having been raised in the business started by his father, Steve Melillo knewsomething had to be done to ensure the success of the enterprise he hadinherited and nurtured. Not only were the accounts downsizing, but operatingcosts were rising. Medical benefits, insurance premiums, and fuel costs were allcosting more each year.
There was not a lot of capital available to reinvest in equipment and vehicles.Product costs were also rising. Being a seven-route operation, the company didnot have a lot of buying clout with suppliers.
Melillo did not want to simply cash out, however. He liked the business, andfelt an obligation to his employees, some of whom he had known for more than20 years. With the right support, he knew the operation could prosper.
“We didn’t just want it to go away,” Melillo said. “We didn’t want to break itup. We wanted to keep our vision intact. So we went out and researched whowas available.”
From reading Automatic Merchandiser, Melillo was aware that Brockton,Mass.-based All Seasons Services Inc. was a large operation that preferred toacquire companies with existing management in place. It seemed like anopportunity for Melillo to stay with the business and preserve jobs for hisemployees. He placed a call to All Seasons Services.
“I never called anybody else,” Melillo said. He liked the fact that hisnegotiations were kept confidential. He didn’t want to alarm his employees or hiscustomers that he was negotiating a change in ownership.
The transaction was completed in March. Steve Melillo is now a salesexecutive for All Seasons Services’ Brockport, Pa. operation while Dawn isoperations manager. All of the employees were kept, and most have seen theirsalaries and benefits improve. “The employee has more in his pocket becausethe benefit price went down (as a result of a larger buying power).” Melillio said.The employees now have a retirement plan and dental insurance, which theydidn’t have previously.
In his new role, Melillo likes being able to focus on one job now instead ofseveral. He used to have to worry about finances and personnel in addition to
marketing and operations. Now thereare entire departments handling thosefunctions. “All those different things aretaken care of,” he said. “I don’t have toworry about those things any more.”Going from an owner to an employeehas been a transition for Melillo. He isglad that his employer understands this.
All Seasons Services Inc.’s capitalresources have put the operation in astronger competitive position, Melillonoted. He now has professionalmarketing materials, and the drivershave new trucks.
At home, Steve and Dawn now havemore time to enjoy life without theconstant worries that a businessdemands. CONTINUED
30 Automatic Merchandiser • www.amonline.com • AUGUST 2002

product selections. Larger companiesalso used more planogams. However,even the larger operators did not imple-ment DEX/UCS technology in 2001,mostly for cost reasons.
DEX/UCS, among its various
benefits, gives the operator the ability toquickly and accurately measure columnsales. To utilize DEX/UCS, however,operators must have DEX-capablemachines and integrate the DEX/UCSdata with their software.
Another reason for the category’sweak showing in 2001 was the lack ofinnovative new products, which hasplagued the category since FamousAmos came out in the early 1990s.
31 Automatic Merchandiser • www.amonline.com • AUGUST 2002
Candy/snacks/confections revenues, four-year review
Category % of total Projected total1998 1999 2000 2001 1998 1999 2000 2001
Candy bars 30.2% 30.9% 26.2% 27.4% $1.79B $1.92B $1.72B $1.660B
Bagged/boxed candy 3.3 6.8 4.6 2.7 195.40M 422.00M 301.70M 163.620M
Gum/mints 5.7 4.2 4.1 3.7 337.40M 260.70M 269.00M 224.220M
Bagged chips 27.8 28.5 31.6 30.3 1.64B 1.77B 2.07B 1.836B
Bagged crackers 1.7 3.1 1.6 1.9 100.60M 192.40M 105.00M 115.140M
Cracker sandwiches 5.9 4.0 4.5 5.3 349.30M 248.30M 295.20M 321.180M
Bagged/jumbo cookies 7.6 5.0 6.3 7.4 500.00M 310.30M 413.30M 448.440M
Pastries 12.6 12.7 15.0 14.2 746.00M 788.30M 985.00M 860.520M
Nuts 2.2 1.4 2.3 1.7 130.20M 86.90M 150.90M 103.020M
Microwave popcorn 2.1 1.8 2.2 2.1 124.30M 111.70M 144.30M 127.260M
Meat snacks - - 0.9 0.7 - - 59.00M 42.420M
Other 1 1.6 0.7 2.6 5.92M 99.30M 46.00M 157.560M
Average price points, four-year review
1998 1999 2000 2001
Candy bar 58 cents 58 cents 59 cents 59 cents
Bagged/boxed candy 62 65 65 62
Gum/mints 42 43 44 43
Bagged chips 50 51 48 RSS,70 LSS 51 RSS,70 LSS
Bagged crackers 54 53 54 58
Cracker sandwiches 52 51 49 53
Bagged/jumbo cookies 60 63 62 62
Pastries 69 71 70 73
Nuts 53 54 55 57
Microwave popcorn 64 66 67 67
Meat snacks - - 59 62
Candy/snacks/confections machines,four-year review
Year Projected total
1998 1,512,775
1999 1,676,900
2000 1,695,400
2001 1,508,906
2001 snack machines by type
Machine type % of total Projected total
Glassfront 83.5% 1,252,392
Columnar candy/pastry 4.5 67,901
Honor boxes 10.0 150,890
Other* 2.5 37,723*Includes tabletop and combination machines
10. Candy/snacks/confections, four-year review
CONTINUED

Several product manufacturersconsolidated in 2001, creating thepromise of more new products, moremarketing and merchandising support.However, the recessionary economy andinternal organizing slowed down thesedevelopments.
Within the candy/snack/confectioncategory, bagged chips commanded thelargest percent of sales for the secondconsecutive year in 2001. Last year’ssurvey reported bagged chips unseatedcandy bars as the top revenue producerfor the first time.
Candy bars regain some groundIn 2001, candy bars regained some of theground lost to bagged chips, markingcandy bars’ first upward movement inthree years. The gain, as slight as it was,most likely reflected a leveling off inlarge single serve (LSS) placements.
LSS as a percent of bagged chip salesheld steady in 2001. This was the second
year the survey measured LSS sales, andLSS once again commanded about 10percent of all bagged chip sales. LSSbagged chip sales began to level off in 1999.
The downsizing in industrialaccounts hurt LSS chip sales more thanother product segments in both 2000 and2001. The larger firms suffered morefrom the downsizing in this customerbase than smaller firms, and sold ahigher percentage of LSS.
Aside from candy bars, baggedcrackers, cracker sandwiches andbagged/jumbo cookies all gained marketshare within the candy/snack/confectionsegment in 2001. Categories losing sharebesides bagged chips includedbagged/boxed candy, gum/mints,pastries, nuts, microwave popcorn andmeat snacks.
All of the categories that gainedshare in 2001 included a large number ofnational name brand products, under-scoring the importance of strong brandsin vending. To be fair, some of thecategories losing share also includedname brand players. This was becauseother factors, such as weak marketingsupport and the small number ofproduct introductions, also cameinto play.
The pastry category was a segmentthat continued to suffer from lack ofproduct innovation. This was notconfined to the vending channel.
The pastry category has long reliedon regional and local suppliers. Hence,performance has often varied by regionand locale, based on the strength ofthese brands.
32 Automatic Merchandiser • www.amonline.com • AUGUST 2002
10b. Drivers are required touse a planogram forcandy/snack/confectionmachine
0 10 20 30 40 50 60 70 80
Yes
NoNo
answer
10c. Top 20 candy/snacks/confections in 2001, dollar sales
Rank Product
1 Masterfoods USA 2-oz. Snickers Original
2 Masterfoods USA 1.74-oz. M&M’s Peanut
3 Frito-Lay 1.75-oz. Doritos Nacho Cheesier Big Grab
4 Masterfoods USA 2-oz. Twix Bar
5 Kellogg/Keebler 1.5-oz. Cheez-It Original
6 Frito-Lay 2.125-oz. Chee•tos Crunchy LSS
7 Hershey 1.6-oz. Reese’s Peanut Butter Cups
8 Masterfoods USA 2.3-oz. Three Musketeers Original
9 Masterfoods USA 1.42-oz. Skittles
10 Masterfoods USA 1.69-oz. M&M’s Milk Chocolate
11 Masterfoods USA 2.07-oz. Starburst Original
12 Frito-Lay 2.25-oz. Fritos
13 Frito-Lay 1-oz. Lay’s Potato Chips
14 Hershey 1.45-oz. Almond Bar
15 Frito-Lay 1.7-oz. Chee•tos Crunchy
16 Frito-Lay 1.25-oz. Fritos Chili Cheese
17 Frito-Lay 1.5-oz. Ruffles Cheddar & Sour Cream
18 Kellogg/Keebler 2-oz Famous Amos Chocolate Chip Cookies
19 Kellogg/Keebler 3.6-oz. Strawberry Pop-tarts
20 General Mills 1.75-oz. Traditional Chex MixSource: MSA Vendscape™ Market Watch Report
10a. Who is primarilyresponsible for makingcandy/snack/confectionselections in machines
Management 64%
Route driver 40%
Other 7%
Indicated one or more 89%
CONTINUED
Heavy layoffs inindustrial accountsalso hurt pastry sales.In last year’s report,the pastries receivedan artificial boostwith the inclusion oftoaster pastries in thegrouping.
Nuts also lostmarket share in2001, largely due toindustrial layoffs inthe South, wherethey have histori-cally been morepopular. Theproduct’s perceptionas having high nutri-tion and an uptick inproduct introduc-tions bodes well for
the long term, however.Among the categories that gained
market share in 2001, bagged cookiesand bagged crackers both benefitedfrom the perception of fittingconsumers’ on-the-go lifestyles. Theseitems, supported by strong name brandrecognition, fit the demand for snacksthat can be eaten in transit or easilyconsumed at different periods of time.
Bagged crackers, it should benoted, was a growth area that wasdominated by the smaller operators.The only other “winning” categorywhere this also held true in 2001 wascandy bars.
The larger operators generallycharged higher prices forcandy/snack/confections. The excep-tions were gum/mints and meat snacks,also segments in which small operatorssold more than larger competitors on apercentage basis.
Honor box placements growThe survey reported a growth in honorbox placements in 2001. This likelyreflected the growth in small locations,which starkly contrasted thedownsizing in large locations.Operators active in honor snacks wereable to maintain and increasecustomer counts.
The financial challenges facinghonor snack operators in recent years— such as rising operating costs andpricing pressure — reduced thenumber of large operators. While thesurvey did not measure the number ofhonor box operators, product suppliersconfirmed a steady influx of newcomersin recent years.
Coffee still needs a joltGive the industry credit for persever-ance. No matter how hard it getshammered, it keeps fighting back.
With industrial accounts hurting
33 Automatic Merchandiser • www.amonline.com • AUGUST 2002
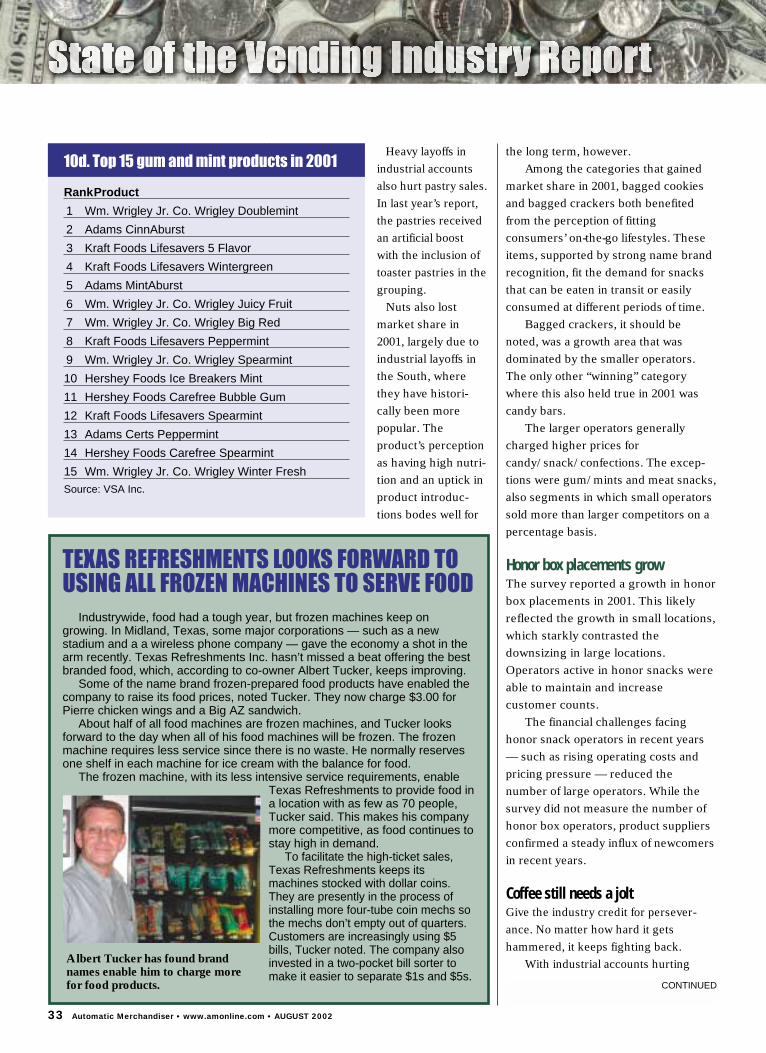
10d. Top 15 gum and mint products in 2001
RankProduct
1 Wm. Wrigley Jr. Co. Wrigley Doublemint
2 Adams CinnAburst
3 Kraft Foods Lifesavers 5 Flavor
4 Kraft Foods Lifesavers Wintergreen
5 Adams MintAburst
6 Wm. Wrigley Jr. Co. Wrigley Juicy Fruit
7 Wm. Wrigley Jr. Co. Wrigley Big Red
8 Kraft Foods Lifesavers Peppermint
9 Wm. Wrigley Jr. Co. Wrigley Spearmint
10 Hershey Foods Ice Breakers Mint
11 Hershey Foods Carefree Bubble Gum
12 Kraft Foods Lifesavers Spearmint
13 Adams Certs Peppermint
14 Hershey Foods Carefree Spearmint
15 Wm. Wrigley Jr. Co. Wrigley Winter FreshSource: VSA Inc.
TEXAS REFRESHMENTS LOOKS FORWARD TOUSING ALL FROZEN MACHINES TO SERVE FOOD
Industrywide, food had a tough year, but frozen machines keep ongrowing. In Midland, Texas, some major corporations — such as a newstadium and a a wireless phone company — gave the economy a shot in thearm recently. Texas Refreshments Inc. hasn’t missed a beat offering the bestbranded food, which, according to co-owner Albert Tucker, keeps improving.
Some of the name brand frozen-prepared food products have enabled thecompany to raise its food prices, noted Tucker. They now charge $3.00 forPierre chicken wings and a Big AZ sandwich.
About half of all food machines are frozen machines, and Tucker looksforward to the day when all of his food machines will be frozen. The frozenmachine requires less service since there is no waste. He normally reservesone shelf in each machine for ice cream with the balance for food.
The frozen machine, with its less intensive service requirements, enableTexas Refreshments to provide food ina location with as few as 70 people,Tucker said. This makes his companymore competitive, as food continues tostay high in demand.
To facilitate the high-ticket sales,Texas Refreshments keeps itsmachines stocked with dollar coins.They are presently in the process ofinstalling more four-tube coin mechs sothe mechs don’t empty out of quarters.Customers are increasingly using $5bills, Tucker noted. The company alsoinvested in a two-pocket bill sorter tomake it easier to separate $1s and $5s.
CONTINUED
Albert Tucker has found brandnames enable him to charge morefor food products.

more in 2001 than in 2000, what couldone expect but a further decline in acategory that largely relies on an indus-trial customer base?
Vend coffee sales in 2001 werefurther impeded by an unseasonablywarm winter in the Northern states,which followed the Sept. 11 tragedy.Since the survey indicated that hotbeverage machines were more concen-
trated in the New England and EastNorth Central regions, the weather’simpact was especially severe.
For the seventh straight year, hotdrink revenues lost market share, asindicated in chart 5. As in 2000, vendorscontinued to invest in equipment to servebetter quality beverages.
The vending industry once again
34 Automatic Merchandiser • www.amonline.com • AUGUST 2002
Hot beverage machines by type, four-year review
% of total Projected totalType of machine 1998 1999 2000 2001 1998 1999 2000 2001
Fresh-brew, preground 49.4% 52.5% 54.5% 55.8% 189,989 215,775 231,625 222,921
Fresh-brew, whole bean 32.0 29.7 29.8 32.3 122,712 122,067 126,650 129,038
Dedicated freeze-dried 15.3 12.3 10.4 6.9 58,150 50,553 44,200 27,566
Single-cup 3.3 5.0 5.3 4.8 15,629 20,550 22,525 19,176
Other 0 0.5 0 0.3 0 2,055 0 799
Hot beverage sales, four-year review
% of total Projected totalType 1998 1999 2000 2001 1998 1999 2000 2001
Fresh-brew regular 55.6% 59.5% 58.1% 54.0% $816.0M $880.6M $865.7M $696.60M
Fresh-brew decaf 7.7 7.4 6.5 6.2 141.0M 109.5M 96.9M 79.98MFresh-brewspecialty/flavored 9.0 8.1 8.4 6.3 129.0M 119.9M 125.2M 81.27M
Freeze-dried regular 5.6 6.7 6.5 5.6 82.0M 99.2M 96.8M 72.24M
Freeze-dried decaf 0.7 2.0 1.9 1.9 10.0M 29.6M 28.3M 24.51M
Freeze-dried specialty 6.0 4.1 9.0 12.4 88.0M 60.7M 134.1M 159.96M
Tea 7.6 2.0 1.9 1.9 105.0M 29.6M 28.3M 24.51M
Hot chocolate 7.6 8.1 6.5 8.7 105.0M 119.9M 96.8M 112.23M
Soup 0 1.4 0.6 1.2 0 20.7M 8.9M 5.48M
Other 0 0.7 0.6 1.8 0 10.4M 8.9M 23.22M
Hot beverage prices, four-year review
1998 1999 2000 2001
Fresh brew regular 38 cents 36 cents 38 cents 41 cents
Fresh-brew decaf 40 36 39 41
Freeze-dried regular 33 36 38 37
Fresh-brew specialty 48 42 51 51
Freeze-dried decaf 34 36 39 38
Freeze-dried specialty 44 45 51 47
Tea 37 35 38 40
Hot chocolate 38 39 40 42
Soup 38 36 35 40
11. Hot beverages, four-year review
Year Machine Total
1998 386,600
1999 411,000
2000 425,000
2001 399,500
CONTINUED
raced to catch up with conveniencestores, quick-serve restaurants andcoffee shops, all of which upgraded theirofferings to include more specialtycoffee. The number of specialty coffeestores and sales through these storesreached new highs in 2001 and evenoutpaced the previous year’s growth rate,according to the Specialty CoffeeAssociation of America.
Freeze-dried specialty coffee growsThe only positive news was that onceagain, sales of freeze-dried specialtycoffee products increased, in keepingwith the consumer’s growing apprecia-tion for these products.
As indicated in chart 11, sales of
freeze-dried specialty coffee grew for thesecond straight year, as did hot choco-late. Fresh-brew specialty sales dipped in2001, following a slight gain in 2000. Thiscategory, however, was smaller thanfreeze-dried specialty coffee.
While equipment manufacturersoffered machines with more selectionsand more attractive graphics, the cost ofthese machines prohibited vendingoperators from using them. The highmachine cost made it difficult for vendingoperators to provide these machines tostrengthen the merchandising andvariety of their hot beverage program.
Branded machine fronts met mixedreviews from operators in 2001.
The survey reported pricing for
fresh-brew regular coffee, whichaccounted for most hot beverage sales,edged up a few cents in 2001, asindicated in chart 11. Vend coffee pricingnevertheless trailed other channels by alarge spread.
The report indicated the placement ofsingle-cup brewers dipped a few points in2001, following four consecutiveincreases. Single-cup brewers repre-sented another tool to enable operatorsto provide specialty coffee in locationstoo small to support free-standing hotdrink machines.
OCS holds its ownWhile hot beverage machines presentedoperators their biggest challenge in2001, for many, OCS offered their onlybright spot. OCS was the only categoryother than manual foodservice to sustainits market share in 2001, even thoughtotal sales suffered. Operators were ableto sustain their OCS market share moreeasily because there was more opportu-nity to add customers.
The survey measured OCS sales byoperators active in both vending andOCS, not dedicated OCS operator sales.
The report indicated large operatorswere more active in OCS than smallones. Hence, most operators involved inOCS had the means to allocate resourcesto develop that business.
OCS sales were highest in the mid-Atlantic and New England regions.
Operators’ efforts to lure consumerswith specialty drinks, through vendingand OCS, will pay off as the popularitycontinues to grow.
The 2002 National Coffee AssociationCoffee Drinking Trends Survey reportedthat specialty coffee continued to buildthe coffee drinking population. Thestudy, based on telephone interviewswith 2,950 people 18 years old and older,reported that both consumption and thenumber of coffee drinkers grew in 2001
35 Automatic Merchandiser • www.amonline.com • AUGUST 2002
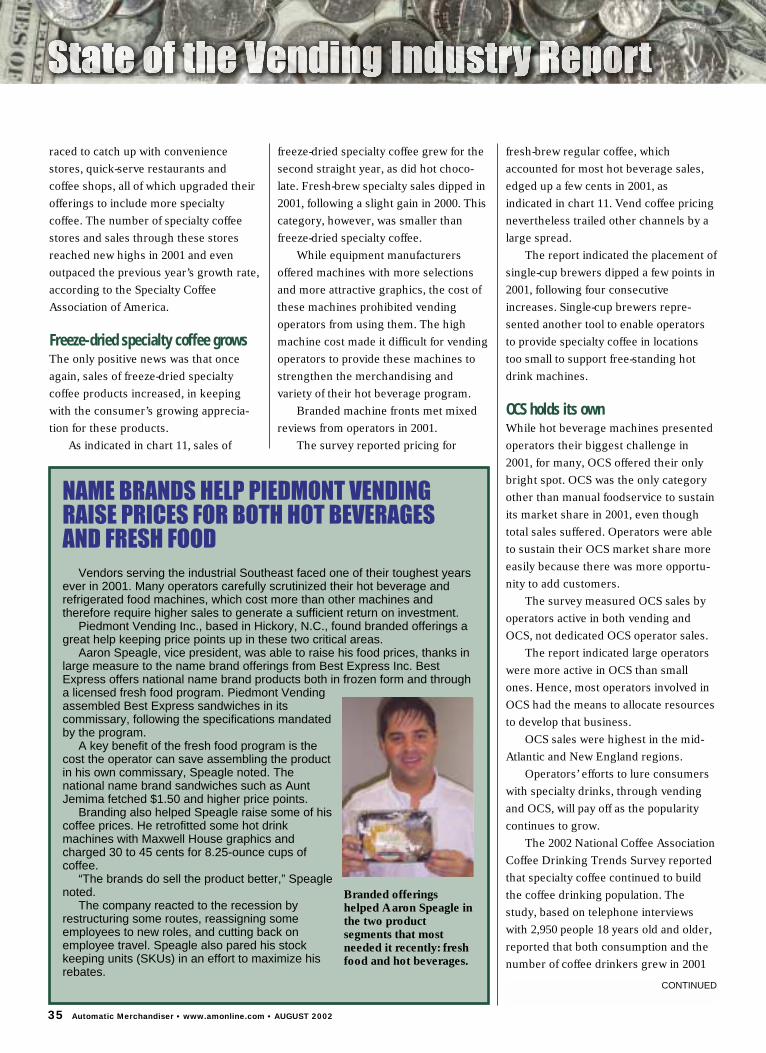
NAME BRANDS HELP PIEDMONT VENDINGRAISE PRICES FOR BOTH HOT BEVERAGESAND FRESH FOOD
Vendors serving the industrial Southeast faced one of their toughest yearsever in 2001. Many operators carefully scrutinized their hot beverage andrefrigerated food machines, which cost more than other machines andtherefore require higher sales to generate a sufficient return on investment.
Piedmont Vending Inc., based in Hickory, N.C., found branded offerings agreat help keeping price points up in these two critical areas.
Aaron Speagle, vice president, was able to raise his food prices, thanks inlarge measure to the name brand offerings from Best Express Inc. BestExpress offers national name brand products both in frozen form and througha licensed fresh food program. Piedmont Vendingassembled Best Express sandwiches in itscommissary, following the specifications mandatedby the program.
A key benefit of the fresh food program is thecost the operator can save assembling the productin his own commissary, Speagle noted. Thenational name brand sandwiches such as AuntJemima fetched $1.50 and higher price points.
Branding also helped Speagle raise some of hiscoffee prices. He retrofitted some hot drinkmachines with Maxwell House graphics andcharged 30 to 45 cents for 8.25-ounce cups ofcoffee.
“The brands do sell the product better,” Speaglenoted.
The company reacted to the recession byrestructuring some routes, reassigning someemployees to new roles, and cutting back onemployee travel. Speagle also pared his stockkeeping units (SKUs) in an effort to maximize hisrebates.
CONTINUED
Branded offeringshelped Aaron Speagle inthe two productsegments that mostneeded it recently: freshfood and hot beverages.

despite the recession. It further notedthat in the last five years, the number of“daily gourmet coffee drinkers”increased from 7 million to 27 million.
Food sales fall for first timeMany operators welcomed it. Vend food,the one category that doesn’t turn aprofit, lost market share in 2001 for thefirst time ever. And while some opera-tors were glad to sell less in anunprofitable category, the 13.5-percentage point decline in food salessimply reflected the industry’s overalldrop in sales. Food machines wereconfined to the larger accounts, whichled the population losses, which made2001 the worst year ever.
The larger operators who owned themajority of the food machines sufferedthe fallout in food sales disproportion-ately in 2001.
The decade-long growth in food
machine placements came to a halt in2001, although placements did not fall asmuch as revenues. The fact that salesdropped more than machine placementsindicated the category was even moreunprofitable than usual in 2001.
The only positive development on thefood front was a 3.4 percentage pointgain in average food prices. Food was theone category where operators experi-enced some success raising prices inrecent years. Growing product avail-ability enabled operators to add newproducts with higher price points,although most claimed it was still difficultto break the $2.00 price ceiling in 2001.
The slight price gain would haveimproved profitability were it not for thefact that food costs rose disproportion-ately in 2001. According to the NationalRestaurant Association, wholesale foodprices posted a 3.2 percentage point gainin 2001, following a miniscule 0.6 point
gain in 2000 and even decreases theprevious two years.
The wholesale price gain was mostlyconfined to bulk food as opposed toprepackaged food. This accounted forthe near 10 percentage-point dip infreshly prepared food as a percent ofsales in 2001, at the expense of frozenprepared and shelf-stable food, asindicated in chart 12.
Freshly prepared food held itsground the five years prior to 2001.Frozen-prepared food during that periodgrew mainly at the expense of shelf-stable food.
Low wholesale food prices during thefour-year period ending 2001 encouragedoperators to maintain in-house fresh food preparation.
In 2001, larger operators increasedtheir use of both frozen-prepared and shelf-stable food. Prior to 2001, the use of
36 Automatic Merchandiser • www.amonline.com • AUGUST 2002
12. Food machines, four-year review
Machine type 1998 1999 2000 2001
Refrigerated 176,753 177,150 177,450 158,050
Frozen* 13,367 19,017 26,520 33,183
Heated 1,900 1,900 1,700 1,500
Ambient 1,200 1,070 1,100 900Food systems (pizza,popcorn, french fries) 1,275 1,580 1,750 1,750*Most were used for ice cream.
Vend food sales, four-year review
% of sales Projected totalSource 1998 1999 2000 2001 1998 1999 2000 2001
Freshly prepared 62.1% 63.7% 63.4% 54.0% $968.7M $1.08B $1.17B $864.0M
Frozen-prepared 23.5 26.9 28.9 37.9 366.6M 458.10M 534.60M 606.4M
Shelf-stable 9.8 8.2 7.7 8.1 152.8M 139.60M 142.50M 129.6M
Other 4.6 1.2 0 0 71.7M 20.40M 0 0
Vend food prices, four-year review
Type 1998 1999 2000 2001
Freshly prepared $1.52 $1.47 $1.67 $1.73
Frozen-prepared 1.48 1.44 1.62 1.67
Shelf-stable 1.20 1.26 1.28 1.28
CONTINUED
shelf-stable food was almost confined tosmall operators.
While food prices rose in 2001, food
was one category in which larger opera-tors charged lower prices than smallones. With food, the larger operators
used their superior buying power to bemore price competitive. This trend heldin 2001, despite the larger companies’disproportionate sales declines.
Frozen food machines grew for theseventh consecutive year in 2001.However, the rate declined as operatorspostponed equipment purchases.
Restaurant brand food productscontinued to expand in 2001, but not atthe pace of the previous year.
Frozen food machines increaseThe survey did not measure how muchfood vendors sold through frozen foodmachines as opposed to ice cream.Operator interviews revealed that mostcarried a mixture. In recent years, thebalance moved to food as more opera-tors replaced refrigerated machines withfrozen machines to reduce costs.
Frozen food machines required lessfrequent service than refrigeratedmachines, and they significantly reducedfood waste.
Location downsizing undercut equip-ment manufacturers’ attempts to expandfrozen food placements by offering freefood to offset purchase costs in 2001.
37 Automatic Merchandiser • www.amonline.com • AUGUST 2002
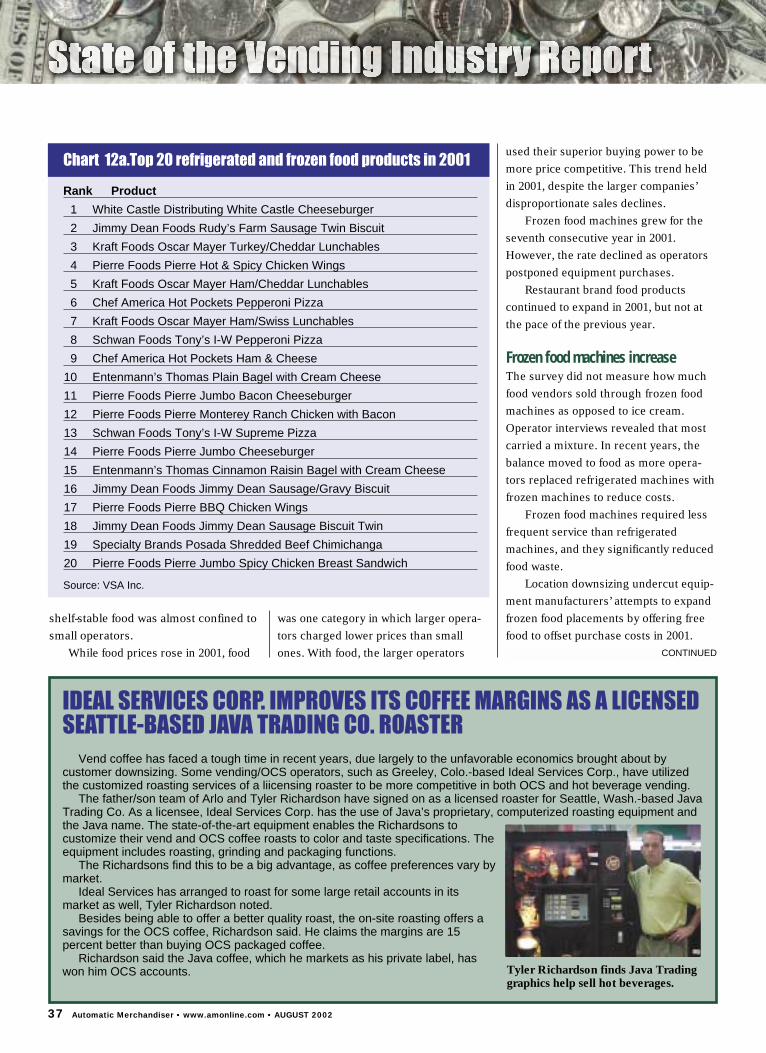
Chart 12a.Top 20 refrigerated and frozen food products in 2001
Rank Product
1 White Castle Distributing White Castle Cheeseburger
2 Jimmy Dean Foods Rudy’s Farm Sausage Twin Biscuit
3 Kraft Foods Oscar Mayer Turkey/Cheddar Lunchables
4 Pierre Foods Pierre Hot & Spicy Chicken Wings
5 Kraft Foods Oscar Mayer Ham/Cheddar Lunchables
6 Chef America Hot Pockets Pepperoni Pizza
7 Kraft Foods Oscar Mayer Ham/Swiss Lunchables
8 Schwan Foods Tony’s I-W Pepperoni Pizza
9 Chef America Hot Pockets Ham & Cheese
10 Entenmann’s Thomas Plain Bagel with Cream Cheese
11 Pierre Foods Pierre Jumbo Bacon Cheeseburger
12 Pierre Foods Pierre Monterey Ranch Chicken with Bacon
13 Schwan Foods Tony’s I-W Supreme Pizza
14 Pierre Foods Pierre Jumbo Cheeseburger
15 Entenmann’s Thomas Cinnamon Raisin Bagel with Cream Cheese
16 Jimmy Dean Foods Jimmy Dean Sausage/Gravy Biscuit
17 Pierre Foods Pierre BBQ Chicken Wings
18 Jimmy Dean Foods Jimmy Dean Sausage Biscuit Twin
19 Specialty Brands Posada Shredded Beef Chimichanga
20 Pierre Foods Pierre Jumbo Spicy Chicken Breast Sandwich
Source: VSA Inc.
IDEAL SERVICES CORP. IMPROVES ITS COFFEE MARGINS AS A LICENSEDSEATTLE-BASED JAVA TRADING CO. ROASTER
Vend coffee has faced a tough time in recent years, due largely to the unfavorable economics brought about bycustomer downsizing. Some vending/OCS operators, such as Greeley, Colo.-based Ideal Services Corp., have utilizedthe customized roasting services of a liicensing roaster to be more competitive in both OCS and hot beverage vending.
The father/son team of Arlo and Tyler Richardson have signed on as a licensed roaster for Seattle, Wash.-based JavaTrading Co. As a licensee, Ideal Services Corp. has the use of Java’s proprietary, computerized roasting equipment andthe Java name. The state-of-the-art equipment enables the Richardsons tocustomize their vend and OCS coffee roasts to color and taste specifications. Theequipment includes roasting, grinding and packaging functions.
The Richardsons find this to be a big advantage, as coffee preferences vary bymarket.
Ideal Services has arranged to roast for some large retail accounts in itsmarket as well, Tyler Richardson noted.
Besides being able to offer a better quality roast, the on-site roasting offers asavings for the OCS coffee, Richardson said. He claims the margins are 15percent better than buying OCS packaged coffee.
Richardson said the Java coffee, which he markets as his private label, haswon him OCS accounts.
CONTINUED
Tyler Richardson finds Java Tradinggraphics help sell hot beverages.
An attempt to develop machinesspecially designed to provide branded,take-home meals failed in 2001. About 60machines were tested featuring high-priced, branded frozen food entrées($4.95 to $6.95) in locations separatefrom traditional vending banks. Themachines took credit cards only — nocash — and were monitored over theInternet via wireless telemetry.
The take-home machine test markedthe automatic merchandising industry’sfirst attempt to capitalize on the growingdemand for take-home meals, achallenge that the entire foodserviceindustry struggled to address in 2001.
Fiscal 2001 was hardly a year forhigh expectations for food systems —high-ticket machines that heat and servefrozen food. The leading provider ofthese systems in the U.S., KRh ThermalSystems LLC, continued to market itsmultiple-selection Hot Choice® machine.In 2001, the company added more namebrand products to its portfolio. Thesystems have the capability of expandingthe availability of national name brand
products in vending.
Milk grows slowlyMilk, a small but highlypromising category in2000, fell victim to theeconomy in 2001.
This marked thesecond year the State ofthe Vending IndustryReport specificallymeasured milk sales.Prior to last year’s report,milk was combined withother dairy products. Thechange was madebecause of the dairyindustry’s growinginterest in the vendingchannel.
The double-digit salesgrowth reported in 2000
reflected the rising popularity of theplastic, resealable, pint-size bottle. Milkprocessors’ attempts to capitalize on thepreferred package benefited all retailchannels in 2000, including vending.
Dairy processors recognized thepotential to expand sales throughvending and sponsored several tests in2001, all of which demonstrated thesuccess of the new milk package.
Several factors prevented thevending industry from capitalizing on thepint-size milk bottle in 2001.
One factor was the downsizing inaccounts where milk was vended. Themajority of milk continued to be soldthrough refrigerated food machines,which lost business due to accountdownsizing in 2001.
Dairies slow to accommodate vendingAnother factor — also related to theeconomy — was the slowness of thedairy processors to make product avail-able to vending operators. Many dairiesdid not ship product in quantitiessuitable to vending operators. Even
those vendors that went out of their wayto find sources encountered difficulty.
Another factor was the lack of namebrand products — a long-standingproblem for milk. A handful of nationalname brand products was introduced in2000, but regional processing and distri-bution facilities failed to materializenationwide. Dairy industry consolida-tion facilitated this effort, but availabilitywas inconsistent in different geographicareas.
Still another factor was product cost.The national name brand milk productscost more than the traditional products.Hence, operators needed to charge morefor the name brand products, a processthat initially met customer resistance.
Milk did post the largest priceincrease of any category in 2001, asindicated in chart 13.
The milk vending tests in 2001indicated the best results in the glass-front, bottle drop machine, as opposed toclosed front machines. But as noted inthe cold drink discussion, glassfrontbeverage machines were slow to emergein 2001.
The Got Milk!/Milk MarketingCampaign also encouraged dairies to getinto the vending business. In 2001, veryfew did so.
The survey indicated a neardoubling of milk sales through coldbeverage machines in 2001, which cameat the expense of dedicated milkmachines. Operators were able to vendmilk in dedicated beverage machinesmore easily than in traditional, dedicatedmilk machines.
Milk offered operators a product toaddress nutritional concerns thatbecame more evident in 2001, particu-larly among secondary schools. Asschools came under pressure to improvethe nutrition content of food sold incafeterias, vending operators found milka popular alternative. Vending tests
38 Automatic Merchandiser • www.amonline.com • AUGUST 2002
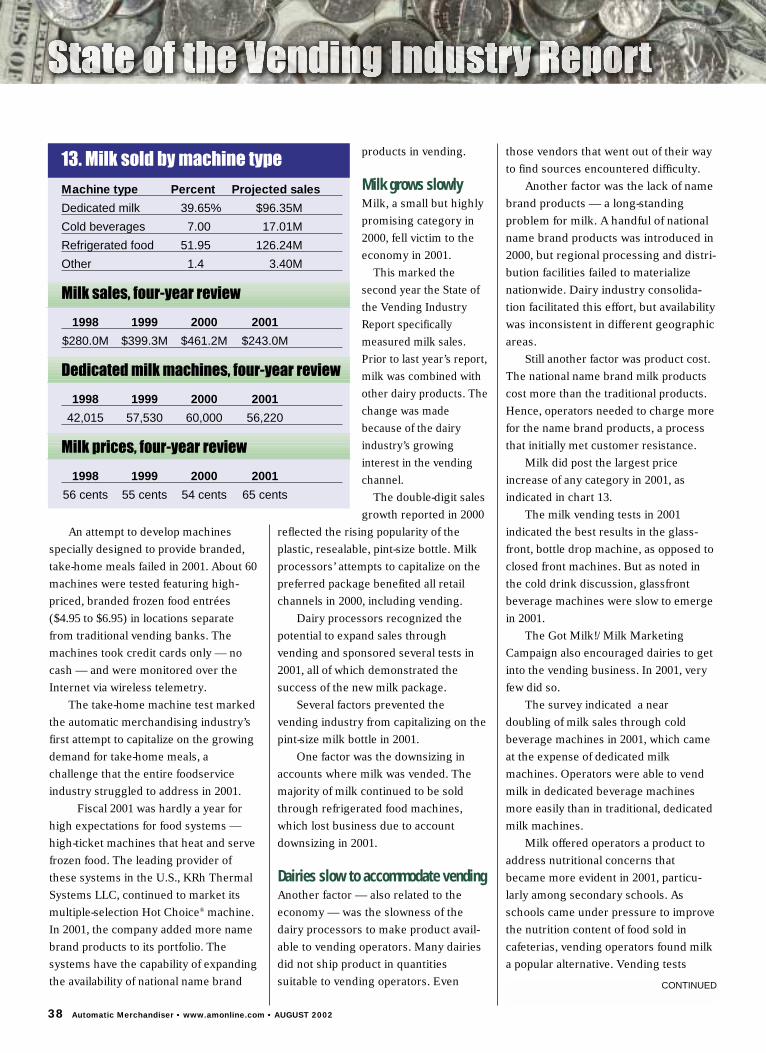
13. Milk sold by machine type
Machine type Percent Projected sales
Dedicated milk 39.65% $96.35M
Cold beverages 7.00 17.01M
Refrigerated food 51.95 126.24M
Other 1.4 3.40M
Milk sales, four-year review
1998 1999 2000 2001
$280.0M $399.3M $461.2M $243.0M
Dedicated milk machines, four-year review
1998 1999 2000 2001
42,015 57,530 60,000 56,220
Milk prices, four-year review
1998 1999 2000 2001
56 cents 55 cents 54 cents 65 cents
CONTINUED

revealed that flavored milk was morepopular than white milk in schools, eventhough preferences varied bygeographic market.
Milk has even more growth potentialas aging baby boomers become morehealth conscious. Data from theBeverage Marketing Corp. indicated thatlow-fat milk posted significant long-termsgains through the last decade at theexpense of whole milk.
The larger operators continued todominate the milk business in 2001.Extra large operators on average carriedfive times as many milk machines aseven the large operators.
But because large players operatedmore traditional, dedicated machines,they carried fewer of the new packagesand charged lower average prices.
Milk machines were most concen-
trated in the West North Central, EastNorth Central and New England regions.
Ice cream machines upgradeFrozen food machines overtook oldstyle, 3- and 4-select venders in 2001, butthe growth was not enough to offset theimpact of customer downsizing, leavingice cream sales flat. In the last few years,ice cream vending operators replacedthe old style 3- and 4-select machineswith new, multi-product machinescapable of carrying more variety. Thisresulted in a continuous rise in icecream prices, as indicated in chart 14.
Extra large vendors operated themajority of ice cream machines in largeindustrial locations which suffered signif-icant layoffs in 2001.
The report indicated more medium-size operators expanded into ice cream
in 2001 as they bought more frozen foodmachines. As a result, medium-sizeoperators expanded their share of icecream sales in 2001. But the extra-largeoperators continued to monopolize icecream business.
Ice cream specialists evolveIce cream vending continued to exist asa specialized business. Most full-linevendors subcontracted their ice creambusiness to larger operators or dedicatedice cream operators in 2001. Thenumber of dedicated ice cream opera-tors, while still estimated at less than 50nationwide, has increased in the lastthree years.
The survey also indicated a doublingin the number of dual-temperature icecream machines, although from a verysmall base of machines. Thesemachines merchandise ice cream alongwith food and snacks. Extra-largeplayers operated almost all of these dual-temperature machines.
Most ice cream machines werelocated in the South Atlantic and NewEngland regions.
While the introduction of multi-product machines promised higher salesper location, the higher investment madeit difficult for operators to build thisbusiness quickly. The multi-productmachines required a higher return oninvestment than the less expensive 3- and4-select machines. Minimum populationrequirements for multi-product machinesranged from 300 to 700.
The multi-product machines alsorequired more product variety, whichposed another challenge. As with frozenfood and milk, operators found it difficultto find reliable product sources in manygeographic regions. Vending productdistributors only carried a small amountof ice cream, and most ice cream distrib-utors were not set up to cater to vendingoperators. In recent years, consolidation
39 Automatic Merchandiser • www.amonline.com • AUGUST 2002
Ice cream prices, four-year review
1998 1999 2000 2001
Ice cream 72 cents 72 cents 80 cents 91 cents
Frozen confections $1.13 $1.00 $1.31 $1.49
14. Ice cream sold by machine type
Machine type Percent Projected sales
Combination food/ice cream 53.2% $129.3M
Old style, 3- and 4-select 18.6 45.2M
Dedicated, new style multiproduct 24.2 58.8M
Dual temperature machine 1.2 2.9M
Other 2.8 6.8M
Ice cream sales, four-year review
1998 1999 2000 2001
$186.2 $225.42M $281.8M $243M
Dedicated ice cream machines, four-year review
1998 1999 2000 2001
56,487 42,931 44,543 43,046*
*Of the 33,183 frozen food machines shown on page 48, 26,546 are included in this number
CONTINUED
in the ice cream industry actuallyreduced, not increased, the number ofice cream distribution sites.
Long term, consolidation among icecream manufacturers will benefit icecream vending. The manufacturers’immediate attention is on their largerretail channels.
Ice cream industry observers peggedice cream vending potential at around250,000 machines in the U.S. As withfrozen food, the number of machinesneeds to grow before product manufac-turers allocate resources to vending.
Ice cream manufacturer consolida-tion will also strengthen national namebrands, which will benefit all classes of trade.
Cafeterias struggle once againAs industrial accounts downsized,vending operators bolted the cafeteriabusiness as fast as possible. Thecafeteria business — once an enticingchallenge to operators looking to moveinto the “big leagues” — was relegatedto a small number of specialists for thesecond consecutive year.
In 2001, the extra-large operationsdid more than 90 percent of all cafeterias,a sharp change from the late 1990s whenmedium- and large-size firms expandedinto this segment.
The National Restaurant Associationreported that “noncommercial restaurantservice” (which encompasses foodser-
vice operators not involved in vending)posted a 2.1 percentage point gain in2001, one of its weakest years ever,following a 2.9-point gain in 2000.
Foodservice sales dipFoodservice performance in industrialand commercial accounts was evenweaker. According to the NRA, foodser-vice sales fell 11.1 percentage points inthe two-year period ending in 2001.
The NRA further noted that tradi-tional foodservice continued to losebusiness to more convenient diningformats, such as fast food restaurantsand convenience stores.
For the second straight year, manyfull-line vending operators in 2001 optedto partner with foodservice specialistswhen bidding on accounts that requiredcafeterias. The majority of accounts withboth vending and foodservice, however,were served by large operators thatprovided both services.
The extra large operators, besidesmonopolizing the largest accounts, werethe only operator group with the exper-tise needed to provide manualfoodservice. Cafeterias required signifi-cant training in sanitation and safetypractices . Foodservice regulationscontinued to increase at all levels ofgovernment as safety and sanitationconcerns grew again in 2001.
On the positive side, help was easierto find in 2001, a problem that plagued
foodservice operatorsduring the 1990s. Laborcosts also stopped risingas fast in 2000 and 2001.
On the downside,however, food productcosts rose in 2001.According to the NRA,wholesale food pricesposted a 3.2 percentagepoint gain in 2001,following a miniscule 0.6point gain in 2000 and
even decreases the previous two years.White collar cafeterias — a promising
segment during the “dotcom” boom inthe 1990s — fell from most operators’radar screens in 2001. The surveyindicated the traditional industrialaccounts increased their dominance ofthe cafeteria customer base.
The financially strapped industrialcustomers were less inclined to subsi-dize cafeterias in 2001 than in 2000,when cafeteria sales were flat against theprior year.
The majority of foodservice accountswere located in the South Atlantic, Westnorth central, West South Central andNew England regions.
2002: Outlook uncertainVendors generally agreed there weresigns of business recovery in mid-2002,but they had not made up for the lossessuffered in 2001. Nor were theyoptimistic that improvement was on theway, given an eroding stock market andother negative economic reports.
The most immediate economicindicator affecting vendors is employ-ment, which had not recovered from the2001 recession. Most operators reportedthat customers were beginning to rehireworkers, but very slowly.
According to the Labor Department,employment dropped for 13 consecutivemonths through April 2002 before risingin May. But while employers were notrehiring, many were expanding theirwork schedules. The average work weekrose to 34.3 hours from 34.2 hours, andin manufacturing, it rose from 31.1 to40.9 hours.
The tendency not to rehire was basedon hesitancy about the economy longterm. Besides a weak stock market, newsabout corporate scandals raised fearsabout new business regulations.
The fact that employers were notrehiring did not mean the economy was
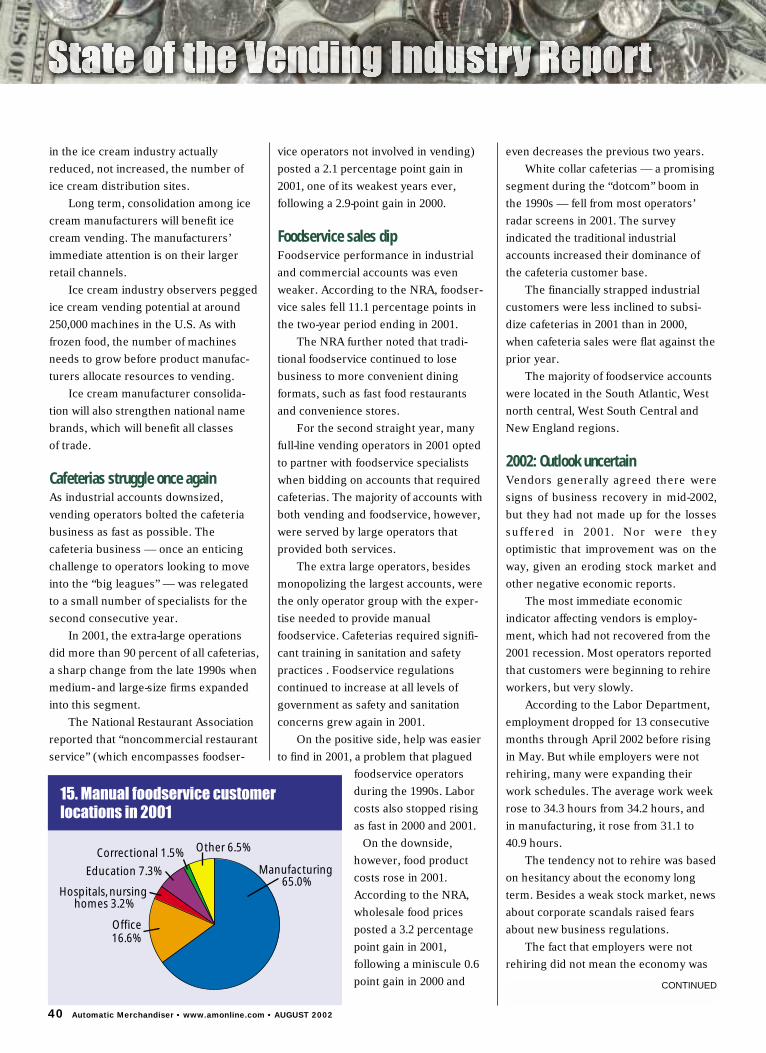
15. Manual foodservice customerlocations in 2001
Manufacturing 65.0%
Office16.6%
Hospitals, nursing homes 3.2%
Education 7.3%
Correctional 1.5% Other 6.5%
CONTINUED
40 Automatic Merchandiser • www.amonline.com • AUGUST 2002
Automatic Merchandiser • www.amonline.com • AUGUST 2002 41
shrinking. According to The Wall StreetJournal, output per hour workedexpanded at 8.4 percent in the firstquarter and more than a 3 percent annualrate in the second quarter.
Expectations in the automotive sector,the largest single industry automaticmerchandisers serve, were not positive.According to the Detroit, Mich.-basedAutomotive News Center, U.S. automobileproduction was expected to fall by 9.5percentage points in 2002.
Operating costs to hold steadyOn the positive side, most operating costswere not expected to rise significantly in2002. Inflation remained low in the firsthalf of the year, as did fuel costs.Wholesale food costs, which spiked in2001, were not expected to rise as much in2001. According to NRA, wholesale foodcosts were expected to rise 1.8 percentagepoints in 2002 following a 3.2-point gain in 2001.
Another positive sign for foodservice,according to the NRA, has been continuedgrowth in disposable personal income.Real disposable personal income wasexpected to grow 2.1 points in 2002.
Foodservice outlook challengingThe foodservice industry was expected tosee sales rise by 3.9 points in 2001, slightlybetter than the 3.7 points reported in 2001,according to the NRA. However, thenoncommercial sector was only expectedto grow by 1.3 points, marking an evenweaker year than 2001.
An uptick in product introductions —particularly in the cold drink segment —bodes well for 2002. The soft drink giantsgave the carbonated category some newsizzle this year in an effort to jump-startthis core part of their business: VanillaCoke, Pepsi Blue, and Dr Pepper RedFusion.
Snack manufacturers, for their part,have introduced some new package sizes
and shapes. Some salty snacks have beenrepackaged in candy size packages,allowing salty snacks to fit into candycolumns. Others have been repackaged inbottles, enabling salty snacks to be vendedin beverage machines.
With reorganizational work behindthem, the major candy/snack manufac-turers that merged in 2001 areexpected to utilize their new marketingand R&D strength to rejuvenate thecandy/snack segment.
More manufacturers of ethnic snackand beverage products expanded intovending this year, promising new oppor-tunities for operators serving heavilyethnic markets.
Legislative issues gain steamChallenges on the legislative and regula-tory fronts are expected to continue thisyear as schools come under fire to dosomething about child obesity. Whilemany school districts have consideredrestricting vending machines, others haverecognized vending’s potential to helpimprove children’s nutrition.
The dairy industry has taken an activerole in educating school officials about thebenefits of milk vending as an alternativeto soft drink machines.
The investments operators made intheir currency handling equipment in thelast two years will pay off in higher sales in2002. Outlays for new computer systems,DEX/UCS data retrieval and telemetry willalso continue, paying long-term dividends.
The glassfront cold drink merchan-diser, for its part, represents a more costefficient alternative to placing additionalbeverage machines at a location.
In the long term, technology promisesto make automatic merchandising a betteraccepted venue for snacking and dining. Inthe short-term, the industry faces seriouschallenges as locations continue todownsize. AM
17. Uses of internet, three-year review
1999 2000 2001
Do not use the Internet 38.0% 38.0% 25%
Purchasing product or equipment 33.0 39.0 44
Operate a web site 17.0 20.0 30
Marketing services to customers 15.0 19.0 20
One or more of the above 53.0 59.0 69
No answer 9.0 3.0 6
16. Handheld use
0 5 10 15 20 25 30 35 40 45 50 55 60 65 70 75 80 85
On routes
In the warehouse
Scan product codes
Other
One or more of above
Do not use handhelds
13%
12%
11%
1%
16%
84%