3 mechanisms of voice production
TRANSCRIPT

The Handbook of Speech Production, First Edition. Edited by Melissa A. Redford. © 2015 John Wiley & Sons, Inc. Published 2015 by John Wiley & Sons, Inc.
3.1 Introduction1
The aim of this chapter is to provide an overview of laryngeal anatomy and physiology, characteristics of vocal fold motion, transformation of vocal fold vibration to sound, and mechanisms of vocal fold vibration. Throughout the chapter computational models have been used for demonstration purposes to generate examples of vocal fold motion and resulting waveforms representing various quantities.
3.2 Laryngeal anatomy and physiology
The rigid structure of the larynx is formed primarily by four cartilages, the thyroid, cricoid, and two arytenoids (Figures 3.1 and 3.2). The cricoid cartilage is shaped like a signet ring set on its side with the signet portion most posterior. It is located just above the most superior tracheal ring. The thyroid cartilage is characterized by two wide plate‐like structures called the laminae that extend posteriorly from their vertex (called the thyroid prominence) in a V‐shape. This cartilage sits atop the cricoid and articulates with it via the inferior cornua that extend inferiorly from the laminae. Two arytenoid cartilages, shaped somewhat like pyramids, rest on the superior surface of the posterior portion of the cricoid (signet), one on the left side and one on the right. One leg of each arytenoid points anteriorly toward the thyroid prominence and is called the vocal process. This is the point of insertion for the thyroarytenoid muscle which originates near the vertex of the thyroid cartilage. Medial to the thyroarytenoid muscle on both left and right sides are layers of ligament and mucosal tissue, which together comprise the vocal folds (Hirano 1974).
In Figure 3.2a, the vocal folds are shown widely separated, or abducted, at the vocal process creating an open space between them called the glottis. This is a typical
3 Mechanisms of Voice Production
Brad H. STOry

Mechanisms of Voice Production 35
configuration during respiration and for developing pressure in the supraglottal airspace for consonant production (e.g., for stops, fricatives, and affricates). abductory maneuvers are executed and maintained by contraction of the posterior cricoarytenoid muscle (not shown in the figure). In preparation for phonation (or for breath‐holding), the arytenoids can be rotated and translated medially by contracting the lateral cricoarytenoid and interarytenoid muscles (also not shown in the figures). These contractions have the effect of moving the vocal fold surfaces toward each other, or adducting them, to reduce or eliminate the glottal airspace, as shown in Figure 3.2b.
Thyroid cartilage
Cricoid cartilage
Trachea
Location of thevocal folds (hidden)
Arytenoidcartilage(hidden)
Cricothyroid muscle
(b) Perspective view
Larynx
Trachea
(a) Midsagittal view
Figure 3.1 Schematic diagrams of speech production anatomy. (a) Midsagittal view of the upper portion of the trachea, larynx, and vocal tract. (b) Perspective view of laryngeal cartilages and cricothyroid muscle. The dashed lines represent structures hidden in the view by cartilage.
Glottis
Thyroarytenoidmuscle
Thyroid prominence
Thyroid cartilage
Vocal process
Cricoidcartilage
Arytenoid cartilages
LigamentMucosa
(a) Axial view: abducted
Cover
Supraglottal airway
Subglottal airway
Body
(c) Coronal view(b) Axial view: adducted
Figure 3.2 diagrams of the larynx and vocal folds. (a) Superior view of larynx when the vocal folds are abducted, as during respiration. (b) Superior view of larynx when the vocal folds are adducted, as during phonation. (c) division of the vocal fold into the cover and body portions (based on Hirano 1974).

36 The Speech Mechanism
Contraction of the thyroarytenoid muscle tends to slide the arytenoids anteriorly, decreasing the distance between the vocal processes and the thyroid prominence, and consequently shortening the vocal folds. The cricothyroid muscles originate on the anterior surface of the cricoid cartilage and insert on the inferior edge of the thyroid laminae. Their contraction tends to rotate the cricoid and thyroid cartilages toward each other, having the effect of increasing the distance between the vocal processes and the thyroid prominence, thereby lengthening the vocal folds. Thus, the thyroarytenoid and cricothyroid muscles are effectively configured as an agonist/antagonist pair and their relative degree of activation can precisely adjust the overall length of the vocal folds. More detailed descriptions of the effect of laryngeal muscle contractions can be found in Zemlin (1998), Titze (1994), and Hixon, Weismer, and Hoit (2008).
The internal structure of the vocal folds is often described by the cover‐body concept (Hirano 1974). It suggests that the vocal folds can be roughly divided into two tissue layers (Figure 3.2c) with different mechanical properties. The cover layer is comprised of pliable, non‐contractile mucosal tissue that serves as a sheath around the body. In contrast, the body layer consists of muscle fibers (thyroarytenoid) and some ligamentous tissue. Other more detailed schemes have been used to describe the layers of tissue in the vocal folds (see Titze 1994 for a summary), but the cover‐body scheme is particularly useful for purposes of studying the vibratory characteristics of the vocal folds.
In summary, the cartilages of the larynx form a structure that supports and houses the vocal folds. When differentially contracted, the intrinsic laryngeal musculature can move the cartilages relative to one another in order to open and close the glottis through abductory and adductory maneuvers, respectively, as well as to modify the length and mechanical properties of the vocal fold tissue. It is important to note that these movements are executed on a time scale similar to the other articulators such as the tongue, lips, jaw, and velum, and do not in themselves generate vibratory motion of the vocal folds, and hence, do not produce sound. Vibration, which causes a portion of the vocal folds to move back and forth hundreds of time per second and produces sound, occurs when the configuration of the medial surface of vocal folds, their mechanical properties, and the aerodynamic conditions surrounding them is sufficient to initiate and sustain self‐oscillation.
3.3 Kinematics of vocal fold vibration
In this section the kinematics of vocal fold motion during vibration will be described without consideration of how the vibration occurs. The physical mechanisms of oscillation will be explained in a later section, and are somewhat easier to under stand with prior knowledge of the kinematic patterns. For production of sound, the movement of the medial surfaces of the vocal folds is of primary importance because they modulate the airspace between them, giving rise to an acoustic excitation that can be formed into speech. a simplified 3d view of the medial

Mechanisms of Voice Production 37
surfaces is shown in Figure 3.3 based on Titze (1984, 2006), and is configured here to be representative of an adult male. The posterior‐anterior dimension represents the vocal fold length, whereas the thickness is represented on the inferior‐superior dimension. The point labeled “adduction/abduction” is where the vocal processes of the arytenoid cartilages would be located; adductory or abductory maneuvers can be conceived as moving this point medially or laterally, respectively.
Observations of the vibrating vocal folds with stroboscopic techniques or high‐speed film/video have shown that the cover tissue supports a surface wave that propagates from the inferior to superior portions of the vocal fold cover (a summary of vocal fold observation techniques can be found in Moore 1991). This wave is typically referred to as the mucosal wave or vertical phase difference and is most clearly observed in the coronal plane (e.g., Figure 3.2c). Vocal fold motion in this plane (along the axis of airflow) was first viewed with X‐ray techniques (Hollien and Moore 1968), studies of excised larynges (Baer 1975), and more recently with observations of excised hemilaryngeal vibration using videostroboscopy (Jiang and Titze 1993) and high‐speed video (Berry, Montequin, and Tayama 2001; doellinger, Berry, and Berke 2005; doellinger and Berry 2006).
an idealized cycle of vocal fold vibration in the coronal plane denoted by C in Figure 3.3 is demonstrated in the series of time‐frame plots of Figure 3.4. In the first time frame (t = 1) the vocal folds on the left and right sides are just barely in contact, the airway is closed, and the direction of tissue motion is outward away from midline as indicated by the arrows. The next two frames (t = 2 and t = 3) indicate large lateral movement of the inferior portion of cover surface and similar but
00.4
0.81.2
1.6
–0.5
0
0.50
0.1
0.2
0.3
Post.–Ant. (y – cm)
← T
hic
kn
ess
→
Midline
Lengt
h
Lateral–Medial (x – cm)
Adduction/abduction
In
f.−Su
p. (
z −
cm)
C
Figure 3.3 3d representation of the medial surfaces of the vocal folds based on the kinematic model of Titze (1984, 2006).

38 The Speech Mechanism
smaller lateral displacement of the upper portion which breaks contact between the left and right sides, thereby opening the airway. Once the maximum lateral displacement is achieved (t = 4), the lower portion of the vocal folds begins to move medially (note that the direction of the arrows has switched) while the upper portion continues its outward motion (t = 5). In frames t = 6 and t = 7 the upper portion of the vocal fold has changed its direction of motion and now follows the lower portion toward the midline. Eventually, the lower portions on the left and right sides collide with each other and again close the airway (t = 8). Medial displacement continues as the upper portions also collide as in the first frame t = 1. The entire process repeats itself cyclically at the fundamental frequency of vibration (F0).
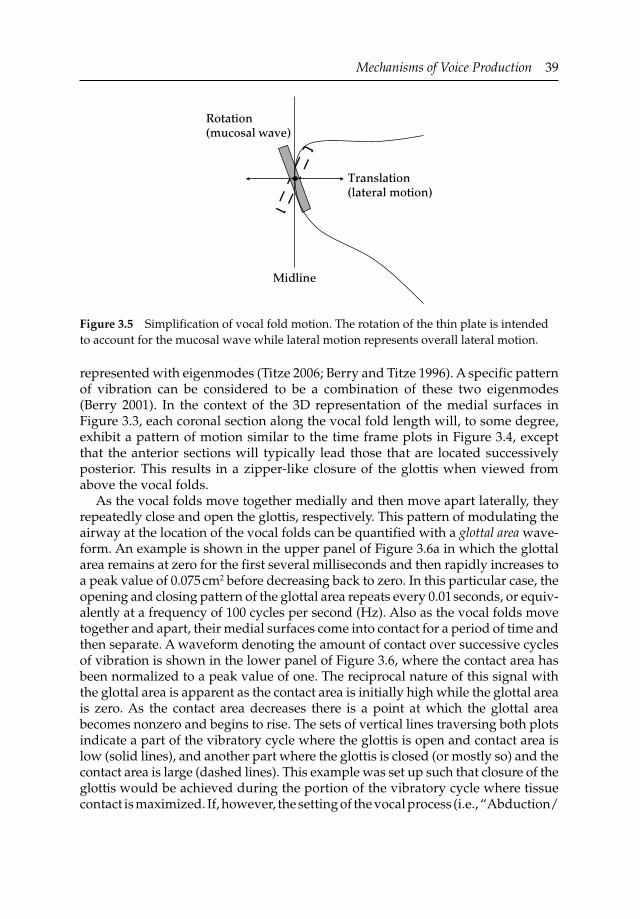
Note that the lateral displacement of the upper (superior) portion of each vocal fold is not in phase with the lower portion. That is, the lower part of the vocal fold leads the upper, creating wave‐like motion in the cover from bottom to top. a simplified view of the vibration pattern is shown in Figure 3.5 where the surface of a single vocal fold is represented as thin plate capable of both rotation and lateral displacement. The mucosal wave, indicated by the rotation of plate, can be conceived as “riding” on the overall back and forth movement of the tissue. These patterns are the two basic vibrational eigenmodes or natural modes of the vocal fold tissue system with regard to the motion in the coronal plane (Titze 1976, 2006; Berry and Titze 1996); vibration patterns in the transverse plane can also be
t = 1 t = 2 t = 3 t = 4
→
→
←
←
→
→
←
←
→
→
←
←
←
→
→
←
t = 5 t = 6 t = 7 t = 8
←
→
→
←
←
←
→
→
←
←
→
→
←
←
→
→
Figure 3.4 diagram showing eight frames of an idealized cycle of vocal fold vibration in the coronal plane denoted by C in Figure 3.3. Note that the lower portion of the vocal folds leads the upper portion creating a wave‐like motion on the vocal fold surface. This is called the mucosal wave.
Mechanisms of Voice Production 39
represented with eigenmodes (Titze 2006; Berry and Titze 1996). a specific pattern of vibration can be considered to be a combination of these two eigenmodes (Berry 2001). In the context of the 3d representation of the medial surfaces in Figure 3.3, each coronal section along the vocal fold length will, to some degree, exhibit a pattern of motion similar to the time frame plots in Figure 3.4, except that the anterior sections will typically lead those that are located successively posterior. This results in a zipper‐like closure of the glottis when viewed from above the vocal folds.
as the vocal folds move together medially and then move apart laterally, they repeatedly close and open the glottis, respectively. This pattern of modulating the airway at the location of the vocal folds can be quantified with a glottal area waveform. an example is shown in the upper panel of Figure 3.6a in which the glottal area remains at zero for the first several milliseconds and then rapidly increases to a peak value of 0.075 cm2 before decreasing back to zero. In this particular case, the opening and closing pattern of the glottal area repeats every 0.01 seconds, or equivalently at a frequency of 100 cycles per second (Hz). also as the vocal folds move together and apart, their medial surfaces come into contact for a period of time and then separate. a waveform denoting the amount of contact over successive cycles of vibration is shown in the lower panel of Figure 3.6, where the contact area has been normalized to a peak value of one. The reciprocal nature of this signal with the glottal area is apparent as the contact area is initially high while the glottal area is zero. as the contact area decreases there is a point at which the glottal area becomes nonzero and begins to rise. The sets of vertical lines traversing both plots indicate a part of the vibratory cycle where the glottis is open and contact area is low (solid lines), and another part where the glottis is closed (or mostly so) and the contact area is large (dashed lines). This example was set up such that closure of the glottis would be achieved during the portion of the vibratory cycle where tissue contact is maximized. If, however, the setting of the vocal process (i.e., “abduction/
Rotation(mucosal wave)
Translation(lateral motion)
Midline
Figure 3.5 Simplification of vocal fold motion. The rotation of the thin plate is intended to account for the mucosal wave while lateral motion represents overall lateral motion.

40 The Speech Mechanism
Glo
ttal
are
a (c
m2
)
0 0.005 0.01 0.015 0.02 0.025 0.03 0.035 0.040
0.05
0.1
0 0.005 0.01 0.015 0.02 0.025 0.03 0.035 0.040
0.5
1
Time (sec.)
Con
tact
are
a
Min. glottal area > 0
(b)
0 0.005 0.01 0.015 0.02 0.025 0.03 0.035 0.040
0.05
0.1G
lott
al a
rea
(cm
2 ) Glottal area largecontact area small
Glottal area smallcontact area large
0 0.005 0.01 0.015 0.02 0.025 0.03 0.035 0.040
0.5
1
Time (sec.)
Con
tact
are
a
(a)
Figure 3.6 Glottal area and contact area signals for two different vibrational patterns of the vocal folds. (a) Typical vibration with distinct closed and open phases. (b) Vibration with no glottal closure; may generate characteristics of a breathy voice.

Mechanisms of Voice Production 41
adduction” point in Figure 3.3) is considerably distant from the midline, the glottis may never truly close. Shown in Figure 3.6b are glottal area and contact area waveforms produced with such a configuration. although the glottal area varies cyclically at a frequency of 100 Hz much like in Figure 3.6a, it has a nonzero value at all points in time indicating that the glottis never fully closes. The contact area waveform also takes a somewhat different temporal shape, with the primary change being a shortened duration of tissue contact.
although the glottal area is of most interest relative to sound production, an electrical analog of the contact area is more easily obtained from human talkers in a laboratory or clinical environment. The electroglottograph (EGG) allows for a noninvasive measurement of contact area with an electrode array that is held in contact with the skin at the location of the thyroid lamina (Fourcin and abberton 1971). This device passes a low amplitude, alternating current through the larynx; as the vocal folds vibrate, they modulate the conductivity of the electrical (tissue) path between the two electrodes, effectively producing a contact area analog. due to its reciprocal nature with the glottal area, the EGG signal can be used to assess some aspects of voice production (e.g., rothenberg and Mahshie 1988; Orlikoff 1991; Henrich et al. 2004, 2005). a signal representative of the glottal area can also be obtained with a combination of a light source located on the supraglottal or subglottal side of the vocal folds, and a photosensor on the opposite side. as the vocal folds vibrate, the light passing through the glottis is modulated and the photosensor generates a signal proportional to the modulation, thus producing an analog to the glottal area. Called a photoglottograph (PGG), this instrument is somewhat more invasive than the EGG since ideally both the light source and sensor are located within the pharynx and trachea, respectively (rothenberg and Mahshie 1988; Zemlin 1959; Sonneson 1959). There have been some designs that have used an external light source and sensor with some success (druker 1999), but in general the PGG tends be less used than the EGG.
3.4 Acoustics of vocal sound production
The purpose of setting the vocal folds into vibration is, of course, to produce sound that provides the excitation of the vocal tract resonances for vowel production and voiced consonants. This section provides an overview of how the vibratory motion of the vocal folds is transformed into a sound source, and how that sound is shaped into speech.
Understanding sound production can be facilitated by “installing” the medial surface model of the vocal folds into a simplified system of airways representative of the trachea, pharynx, and oral cavity, the latter two comprising the “vocal tract.” This is shown in Figure 3.7 where, for sake of clarity, the vocal fold surfaces are displayed in magnified form and offset to the right of their actual location in the system. The vocal tract is configured in this case as a neutral vowel. at the inferior end of the trachea is the variable PL , and represents the static pressure supplied by the respiratory system (L = lungs). When the vocal folds are separated and the

42 The Speech Mechanism
glottis open, this pressure will drive air through the glottis and generate a glottal flow. If the vocal processes are in an abducted position and no vibration occurs, the glottal flow will be essentially a steady outward movement of air from the lungs. during vibration, however, the vocal fold surfaces cyclically and rapidly open and close the glottis, allowing air to flow during the period of time when the glottal area is nonzero and halting flow during the periods when the glottis is closed. The result is a glottal flow waveform that is a train of flow pulses, as demonstrated by the plot offset to the left in Figure 3.7, and serves as the primary acoustic excitation for vowels and voiced consonants. The amplitude and shape of the glottal flow pulses are influenced by the magnitude of PL and the temporal pattern of the glottal area waveform, as well as by the moment‐to‐moment variations in acoustic pressure just superior and inferior to the glottis.
The glottal flow initiates acoustic wave propagation in both the trachea and vocal tract. The reflected and transmitted pressures throughout the system shape the glottal flow excitation according to the natural resonance frequencies of the airways, but primarily those of the vocal tract. The pressure generated at the lip
PL
Oral cavity
Speech signal
Glottal �ow
Lips
Pharynx
Trachea
Vocal fold surfaces Length
Adduction
Figure 3.7 Schematic diagram of the airway system for speech production. The vocal folds, which are shown magnified, would be located where the arrow points and produce the glottal flow signal shown to the left. The flow pulses excite acoustic wave propagation in the vocal tract and produce the output (radiated) pressure waveform shown at the lips.

Mechanisms of Voice Production 43
termination radiates outward into free space and is the “speech waveform” or “speech signal” because it now carries information relative to the shape of the vocal tract.
The glottal flow and output pressure signals are shown in more detail in Figure 3.8a. The thick solid line in the upper panel is the glottal flow waveform and shows the train of air pulses generated by the opening of the closing of the glottis shown previously in Figure 3.6a. a typical characteristic of the glottal flow relative to the glottal area waveform is the rightward skew in time. This is due to the acoustic inertance (or mass‐like property) of the air in the vocal tract delaying the increase in flow as the glottis opens (Fant 1960, 1979; Flanagan 1968; rothenberg 1973, 1981; Titze 1984). also shown in the upper panel of Figure 3.8a is the time derivative of the glottal flow; it has been scaled in amplitude so that its temporal pattern can be easily compared to the glottal flow but is not displayed with the appropriate units of cm3/s2. as an indicator of change, this waveform clearly demonstrates the points in time during a vibratory cycle at which the glottal flow is rapidly increasing or decreasing. The large negative “peaks” are the points of maximum flow declination, and constitute the primary acoustic excitation during a glottal cycle. a secondary excitation occurs when the flow initially increases just as the glottis opens. The acoustic output pressure radiated at the lips is shown in the lower panel of Figure 3.8a. Because the radiation impedance is effectively a
0 0.01 0.02 0.03 0.04−200
−100
0
100
200
Time (sec.)
Pre
ssu
re (d
yn/c
m2
) Radiated pressure
0 1000 2000 3000 4000 5000
20406080
100
Frequency (Hz)
Rel
. Am
pl.
(dB
) F1 F2F3 F4 F5
Frequency domain
0 1000 2000 3000 4000 5000
20406080
100
Rel
. Am
pl.
(dB
) F0
(b)
Time domain
0 0.01 0.02 0.03 0.04–100
0
100
200
Glo
ttal
�ow
(cm
3 /s)
ugdug
(a)
Figure 3.8 Waveforms and spectra that demonstrate the source‐filter representation of speech production. (a) Time‐domain waveforms; the upper panel shows glottal flow (ug) and its derivative (dug) (scaled to fit on the same plot), and the bottom panel contains the output pressure waveform. (b) The upper panel is the glottal flow spectrum and the lower panel is the output pressure spectrum. The F0 and formants are marked in each panel.

44 The Speech Mechanism
differentiator, the pressure waveform has characteristics similar to that of the flow derivative except that it oscillates during the period of time that the glottis is closed (i.e., when the flow and derivative waveforms are zero). One such oscillatory period is indicated by the vertical dashed lines, and results from the acoustic filtering properties of the vocal tract resonances. Thus, the glottal flow can be considered the sound source for vowels and voice consonants, whereas the vocal tract is the filter that transforms the source waveform into the final speech signal.
The spectra of the glottal flow and output pressure waveforms are shown in Figure 3.8b. The components of the flow spectrum in the upper panel with the highest amplitudes are the fundamental frequency (F0) and the second harmonic (2 F0); the other harmonics are reduced in amplitude by roughly 12 dB per octave. although the frequencies of the harmonics in the output pressure spectrum (lower panel) are the same as in the flow spectrum, their amplitudes rise and fall with frequency. The regions of the spectrum where the amplitude is prominent are the formants and are the result of the vocal tract resonances transforming the flow into an output pressure. The gray dashed line is the spectral envelope whose peaks are marked as the formants F1–F5.
3.5 The vocal folds as a self‐oscillating system
In previous sections, the general characteristics of vocal fold motion during vibration were described, as well as the acoustic characteristics produced by that motion as it interacts with flow and pressure. These descriptions were presented under the assumption that the vocal folds were, in fact, already in vibration. The purpose of this section is to provide an overview of why the vocal folds vibrate. That is, what mechanical and aerodynamic conditions are necessary to allow the vocal folds to sustain a repeating oscillatory cycle of medial and lateral motion?
That the vocal folds are capable of converting a steady stream of airflow into vibratory tissue motion, and subsequently producing an acoustic wave, puts them into a category of physical systems that support self‐sustained oscillation. a early attempt at describing the process was Van den Berg’s (1958) “Myoelastic‐aerodynamic theory of voice production” which was an empirical investigation of the interaction of vocal fold tissue elasticity and aerodynamic forces. The oscillatory mechanisms were described in terms of tissue elasticity and the so‐called Bernoulli effect. That is, high air velocity through a narrow glottis would create a negative pressure that would “suck” the vocal folds together, after which a build‐up of subglottal pressure would blow the vocal folds apart (move them laterally) and start the process again. Subsequent theoretical studies, however, have assigned a secondary role to the Bernoulli effect and have formed the current view that the vocal folds may oscillate whenever an asymmetry exists between the aerodynamic driving forces produced within the glottis during the lateral and medial movement phases of a vibratory cycle (Ishizaka and Matsudaira 1972; Titze 1976, 1988; Stevens 1977). This asymmetry is facilitated by (1) the mucosal wave, which creates a time delay with respect to the upper and lower portions of the vocal folds because of

Mechanisms of Voice Production 45
the alternating convergent and divergent glottal shape, and (2) the inertial acoustic loading presented by the vocal tract which creates a time delay between the build‐up and release of supraglottal pressure and glottal opening/closing. Both of these mechanisms have the effect of decreasing the aerodynamic driving forces during the glottal closing phase and increasing them during the opening phase.
although self‐sustained oscillation is a complex process, the two mechanisms of vocal fold oscillation can be explained in large part under simplified conditions of idealized air flow and no collision of the vocal folds (Titze 1983, 1988, 1994). These may seem like severe limitations, but the mechanisms involved in the simplified case exist even when the more complex details of the system are included. In the next two subsections each mechanism is explained separately.
3.5.1 Alternating convergence and divergence of the glottisShown in Figure 3.9a are two representative convergent and divergent configurations of the glottis (in the coronal plane) that could occur during a vibratory cycle. In either case, a generalized force exerted on the vocal fold tissue can be represented as the mean intraglottal pressure over the medial surfaces based on the Bernoulli energy law (Titze 1983, 1988). Under conditions of no vocal fold collision and idealized flow in the glottis the intraglottal pressure Pg can be written as
Paa
P P Pg s i i1 2
1
(3.1)
where a1 and a2 are the cross‐sectional areas at the glottal entry and exit, respectively, Ps is the subglottal pressure, and Pi is the input pressure to the vocal tract (Titze 1994). Eqn. 3.1 shows that the vocal folds are driven by the sum of the vocal tract input pressure Pi and the transglottal pressure (Ps – Pi ) scaled by the glottal shaping factor (1 – a2/a1) . For purposes of illustration, the situation can be further simplified such that Pi ≈ 0, so that the mean intraglottal pressure becomes
Paa
Pg s1 2
1
(3.2)
This equation shows that when the tissue is moving laterally and the glottis is convergent (a1 > a2), Pg will be greater than zero. That is, the force exerted on the medial surfaces is in the same direction as their motion. as the folds move outward, restoring forces within the tissue grow in increasing opposition to the motion and cause them rotate into a divergent configuration (a1 < a2) and begin their movement back toward the glottal midline. as soon as the glottis becomes divergent, Pg will switch to a negative value, again exerting a force on the tissue in the direction of motion.
This sequence of events is demonstrated in Figure 3.9b where hypothetical variations of a1 and a2 for a single cycle of vibration are plotted as the solid and dashed

46 The Speech Mechanism
lines, respectively. The portion of the cycle for which a1 > a2 is shown in light gray, whereas the a1 < a2 portion is shown in darker gray. The intraglottal pressure Pg calculated with Eqn. 2 is plotted as the thick black line (it has been scaled so that it can easily be compared to the glottal area signals) and can be seen to be positively‐valued while the glottis is convergent and becomes negative during the time the glottis is divergent. Furthermore, Pg is highest when the vocal folds first separate and then decreases over the remainder of the cycle. This means that the
Supraglottal
Subglottal
Supraglottal
Subglottal
Pg Pg
PiPi
Convergent(a1 > a2)
Divergent(a1 < a2)
(a)
Time
0
Convergent Divergent
Glottalentry
a1
a1 a1
Glottal exita2
a2a2
Intraglottal pressurePg
+
–
(b)
PsPs
Figure 3.9 demonstration of the vibration mechanism based on alternating convergent/divergent glottal shape. (a) Coronal view of the glottis and vocal folds in the convergent and divergent conditions. (b) Time‐dependent glottal entry and exit areas superimposed with the intraglottal pressure.

Mechanisms of Voice Production 47
intraglottal pressure provides a large “push” on the vocal fold surfaces during the time that they are beginning their lateral excursion, and then “gets out of the way” as they move toward their maximum displacement. On the return path, the reduced and negative intraglottal pressure may provide some assistance in accelerating the vocal folds toward the midline.
This asymmetric pattern of intraglottal pressure during the open glottis part of the vibratory cycle was confirmed by Jiang and Titze (1993) who measured Pg directly in an excised larynx in which one vocal fold was replaced with a plexiglas plate embedded with a pressure transducer. Scherer et al. (2001) and Li et al. (2006) have investigated the intraglottal pressure distributions for a wide variety of glottal configurations and found that driving pressures are correlated with angle of glottal convergence. Using both a synthetic, physical model of the vocal folds and a computational model, Thomson, Mongeau, and Frankel (2005) also showed that the variation of the glottal shape from convergence to divergence generates a temporal asymmetry in the mean intraglottal pressure.
3.5.2 Inertance of the vocal tractThe second mechanism that can create an asymmetric driving force on the vocal fold surfaces is due to the inertive or mass‐like properties of the supraglottal air column (i.e., the vocal tract). To simplify the explanation, the alternating pattern of convergence and divergence will be removed and replaced with an assumed square glottis as shown in Figure 3.10a such that a1 = a2. Eqn. 3.2 now reduces to
P Pg i (3.3)
suggesting that the vocal folds are driven by only the vocal tract input pressure Pi. This may seem like an odd result because the subglottal pressure, and hence the transglottal pressure, is not involved in sustaining the vibration of the folds. The airflow through the glottis (typically referred to as glottal flow or Ug), however, is driven by the transglottal pressure, thus involving Ps in generation of the airflow waveform. as the vocal fold surfaces move laterally the glottal flow increases, and decreases when they move medially (see Figure 3.10a). The input pressure Pi is then determined by the rate of change of the glottal flow (i.e., flow derivative) multiplied by the vocal tract inertance I
P IdU
dtig (3.4)
For a cylindrical tube approximation of the vocal tract, the inertance can be calculated as
IlA
(3.5)

48 The Speech Mechanism
a2
a1 a1
Supraglottal
Subglottal
Pg
Ps Ps
Square(a1 = a2)
Supraglottal
Subglottal
Square
Pi < 0Pi > 0
(a)
0
Time
Opening
Pg > 0 Pg < 0
Closing
Glottal flowUg
Intraglottal pressurePg
+
–
(b)
a2
Pg
(a1 = a2)
Figure 3.10 demonstration of the vibration mechanism based on vocal tract inertance. (a) Coronal view of a rectangular glottis and vocal folds as they move laterally (left panel) and medially (right panel). (b) Time‐dependent glottal airflow superimposed with the intraglottal pressure.

Mechanisms of Voice Production 49
where ρl is air density, l is the length, and A is the cross‐sectional area of the vocal tract.
as the glottal flow increases during the opening phase, the rate of change will be positive (dU/dt > 0) and will result in a positive value of Pi; during the closing phase the flow derivative is negative resulting in a negative Pi. Since the intraglottal pressure is equal to Pi, according to Eqn. 3.3, the vocal folds will be driven by positive pressure during the time they move laterally, and by negative pressure when they move medially. This can be seen in Figure 3.10b where a hypothetical glottal flow signal is shown by the thin line, and an idealized intraglottal pressure based on the flow derivative is shown by the thick line. Early in the opening phase Pg rises to a peak value and then decreases over most of the duration of the cycle. Much like the effect of the alternating convergence and divergence, the intraglottal pressure due to the vocal tract inertance provides a “push” at the early part of lateral excursion before decreasing and becoming negatively‐valued to assist the return movement toward midline.
3.5.3 Two mechanisms in concertFor a real talker, the mechanisms of glottal convergence/divergence and vocal tract inertance are both more or less available whenever phonation is produced. although it is a simplified version of the pressure calculation, Eqn. 1 includes the effects of both mechanisms: the glottal geometry is included in the first term and the vocal tract input pressure, determined by the rate of change of the flow, is included in both terms. It has been shown that either an alternating pattern of glottal convergence and divergence, or vocal tract inertance can create sufficient conditions for sustained vocal fold oscillation. The negative driving pressure observed in the glottal closing phase, regardless of the mechanism of vibration, appears similar to the “Bernoulli effect” explanation in which the vocal folds are “sucked” together. It is not necessary, however, for Pg to become negative during the return phase toward midline. In fact, flow tends to detach from the duct walls in a divergent configuration to form a jet, causing Pg to be roughly equal to the value of the vocal tract inlet pressure Pi (Titze 2006) which may be either positive or negative depending on the tract configuration. The important point is that the intraglottal pressure generated when the vocal fold motion is in the lateral direction must be greater than the intraglottal pressure on the return path, thus creating the necessary asymmetric driving force over a cycle of vibration. In contrast, the “Bernoulli effect” explanation would generate identical forces on both the lateral and medial portions of the glottal cycle, and could not sustain oscillation (i.e., the suction force would be present on both the lateral excursion and medial return paths of the cycle).
Both mechanisms operating simultaneously can be studied with a computational model that allows self‐oscillation to be initiated and sustained. as an example, a three‐mass model (Story and Titze 1995) can be used to include the effect of the cover‐body vocal fold structure in which a “body” mass is positioned lateral to two masses representing the cover tissue (see Figure 3.11a). The cover masses are both connected to the body mass via spring and damper systems that

50 The Speech Mechanism
represent stiffness of the cover tissue as well as the effective coupling stiffness between the body and cover. The body mass, in turn, is connected to a rigid lateral boundary with another spring and damper system. This accounts for the effective stiffness of the body which is dependent on the level of contraction of the muscle tissue. To account for shear forces in the cover, the two cover masses are coupled to each other with another spring‐damper element. When coupled aerodynamically and acoustically to the tracheal airway on the subglottal side, and to the vocal tract on the supraglottal side (Titze 2002), the model can be (computationally) set into vibration.
With the vocal tract shape configured to be a uniform tube of cross‐sectional area 3 cm2 (not shown), the model produces the four quantities shown in Figure 3.11b for one cycle of vibration. The glottal entry and exit areas, a1 and a2, at the location of each of the two cover masses are again plotted such that the convergent and divergent phases of the cycle are apparent. The glottal flow, Ug, based on the minimum of a1 and a2 as well as Ps and Pi, is shown as the thin line in Figure 3.11b. It rises slowly, and with ripple, to a peak before sharply decreasing; the delay in achieving peak flow relative to the temporal pattern of the glottal areas is due the vocal tract inertance. The intraglottal pressure Pg, shown as the thick line, decreases over the course of the open glottis part of the cycle, but does contain some small peaks and valleys due to acoustic interaction with vocal tract resonances. In addition, Pg does not become negative at the point when the glottal shape switches from convergent to divergent as in Figure 3.9, but rather remains positive until the glottal flow reaches its peak value. Other configurations of the vocal tract may generate somewhat different patterns of Ug and Pg but, in any case, the important
(a) (b)
Ps
Pg
Pi
a1
k2 , d2
k1 , d1
kb , dbm1
m2
mb
a2
0
Convergent Divergent
Glottal entry
Glottal exitIntraglottal pressure
Time
Glottal flow
a1
Ug
a2Pg
Figure 3.11 demonstration of two vibration mechanisms in concert. (a) The three‐mass model of the vocal folds (Story and Titze 1995) which represents the mucosal wave, lateral motion, coupling between the cover and body, and vocal tract inertance (when coupled to a vocal tract). (b) Time‐dependent glottal entry and exit areas, and glottal airflow, superimposed with the intraglottal pressure.

Mechanisms of Voice Production 51
point is that the intraglottal pressure pattern over time is configured such that it pushes the tissue outward, and then decreases over the remainder of the cycle to allow it to return to the midline and start a new cycle. In addition, the build‐up of the glottal flow to its peak value lags behind the peak in glottal area because of the time required to accelerate the air column of the vocal tract (rothenberg 1981; Titze 1988).
This example points to an aspect of voice production that is sometimes overlooked. The delay of the peak glottal flow relative to the peak in glottal opening, and the presence of “ripple” on both the glottal flow and intraglottal pressure waveforms, indicates that the vocal tract and trachea can have a significant influence on the characteristics of the voice excitation signal itself. In fact, the ripple that can be observed on the opening phase of the glottal flow is essentially an imprint of the vocal tract resonances, and will thus contain spectral information from both the voice source and vocal tract. It is typical, however, to represent speech production as a linear combination of an excitation signal (i.e., glottal flow) and the vocal tract filter. a key assumption of a linear system approach is that the filter (i.e., the vocal tract and trachea) does not influence or modify the source, rather it can only enhance or suppress the amplitudes of the spectral components produced by the source. although the effect of the vocal tract on the glottal flow has been recognized for a long time (cf. Fant 1979; rothenberg 1981; Titze 1988, 2004; Titze and Story 1997), it is only recently that a nonlinear source‐filter theory has been formally stated that explicitly addresses various types of nonlinear interaction of the voice production components and the vocal tract (Titze 2008). The theory defines a “Level 1” interaction as the dependency of the glottal flow pulse shape on subglottal and supraglottal acoustic pressures, and a “Level 2” interaction as the flow dependency (Level 1) plus the effects of vocal tract inertance on the mechanical modes of tissue vibration.
In light of this new theoretical view, it is perhaps most accurate to consider the mechanisms of vocal sound production as existing along a continuum. at one end of the continuum the sound generated by vocal fold vibration is weakly coupled to the resonances of the vocal tract such that the output is a linear combination of their respective acoustic characteristics, whereas at the other end there is strong nonlinear coupling of the vibratory source to the vocal tract resonances. To adequately express phonetic properties in the output, such as formants, the linear case requires that the vibratory source produce sound that is rich in either harmonic or broadband energy, or both. In contrast, the nonlinear case allows for the possibility of an harmonically rich source signal to be generated even when the vibration pattern of the vocal folds (e.g., glottal area) is so simple that it may contain only a few harmonics (Titze 2008).
3.5.4 RegistersThe two mechanisms of oscillation contribute to any type of self‐sustained vibratory motion of the vocal folds, but the actual tempo‐spatial patterns of vibration produced can give rise to a variety of vocal qualities. One such quality descriptor
52 The Speech Mechanism
is the register which, for speaking, typically refers to the pulse, modal, and falsetto registers (Hollien 1974). In general, the pulse register (also called vocal fry) is characterized as vibration with a very low fundamental frequency (<70 Hz; Keidar 1986) such that a listener hears each glottal cycle as a separate burst of energy. It may also include period doublings or irregularities. Production of such low frequencies would presumably require that the intrinsic laryngeal muscles be activated at fairly low levels to minimize the tension within the tissue layers (cf. Lowell and Story 2006). Most speech is typically produced in the modal register, which can be characterized as a sound that is continuous (not pulse‐like) and harmonically rich. This is achieved when the vocal fold vibration causes the airflow through the glottis to rapidly decrease during the closing phase of each vibratory cycle; the example shown previously in Figure 3.8 would be characteristic of modal register. Falsetto register produces a vibratory pattern for which most of the acoustic energy is in the first few harmonic components, thus giving a “fluty” quality. Generally, falsetto occurs at fairly high fundamental frequencies and cut off of the glottal flow is less rapid than in modal register.
although the terminology of registers is common in the literature on phonetics, speech science, and singing, there is much that is not known about how they are produced and perceived. For example, Titze (1994) presents two hypotheses concerning the transition from modal to falsetto registers. The first hypothesis suggests that the rapid change between registers, often referred to as a voice break, is influenced by the acoustic resonances of the subglottal system. The second, alternative hypothesis is that the transition is due to rapid decrease in activation of the thyroarytenoid muscle. Both are plausible, but need to be further tested with experimental and computational studies.
3.6 Computational models of phonation
The three‐mass model used in the previous section is one of many models of vocal fold vibration that have been proposed throughout the past four decades or so. These range from simple to complex, and allow for investigations of various aspects of phonation.
One of the earliest computational models was reported by Flanagan and Landgraf (1968) in which the vocal fold tissue (of either the right or left side) was lumped into a single mass and allowed to have only lateral displacement. With its single‐degree of freedom this model cannot represent the mucosal wave unless it is allowed a rotational degree of freedom (Liljencrants 1991; Titze and Story 2002). as a result, coupling to the acoustic inertance of the vocal tract is essential to create a condition where the tissue velocity and the intraglottal pressure are in phase and hence initiate and sustain oscillation.
Shortly after the introduction of the one‐mass model, a slightly more complex version was proposed that represented a single vocal fold by two masses in the coronal (vertical) dimension (Ishizaka and Matsudaira 1972; Ishizaka and Flanagan 1972). The two degrees of freedom afforded by the two‐mass model allow for the

Mechanisms of Voice Production 53
mucosal wave to be represented as well as overall lateral tissue displacement. While it is admittedly a crude discretization of the real tissue structure, it provides appropriate conditions for oscillation to occur with or without a coupled vocal tract inertance. Because of its simplicity and reasonable agreement with physiologic data, the two‐mass model has been widely used in simulation/synthesis studies of vocal fold vibration (cf. Steinecke and Herzel 1995; Mergell, Herzel, and Titze 2000; Wong et al. 1991; Lucero 1996; Lucero and Koenig 2005). It is noted that a modified one‐mass model has recently been described by Fulcher et al. (2006) and enhanced by Zanartu, Mongeau, and Wodicka (2007) that generates intraglottal pressure distributions similar to the two‐mass model by imposing time‐varying fluid dynamic considerations. Zanartu et al. (2007) utilized this model to study the effects of both the subglottal and supraglottal systems on vocal fold vibration.
a limitation of both the one‐mass and two‐mass models is that their discretization of tissue in the coronal plane does not capture the known layered structure of the vocal folds (Hirano 1974). In the two‐mass model (Ishizaka and Flanagan 1972), the lower mass is made thicker (vertical dimension in the coronal plane) and more massive than the upper mass in an effort to simulate the effects of the body layer. However, since this arrangement does not allow for a coupled oscillation of both the cover and body layers, the two‐mass model is essentially a “cover” model rather than a “cover–body” model. It was this limitation that motivated the introduction of a three‐mass model (Story and Titze 1995) that was intended to include the effect of the cover‐ body vocal fold structure but also maintain the simplicity of a low–dimensional system. In addition to coupled oscillation of the cover and body layers, the advantage of the three‐mass configuration is that physiologically realistic control parameters characterizing the cover and body tissue are more easily determined (than with the two‐mass approach) when the discretization imposed by the model more closely follows anatomical boundaries. For example, a contraction of the thyroarytenoid muscle (muscle in the “body”) will increase the stiffness of the body but may not necessarily stiffen the cover. Titze and Story (2002) developed an extensive set of “rules” that allow transformation of specified laryngeal muscle activation levels (primarily for the thyroarytenoid and cricothyroid muscles) to values of model parameters such as masses and stiffnesses.
Other more complex models have been developed to simulate the layered vocal fold structure and also account for the vibrational patterns in the transverse plane. For example, the two‐mass approach was modified such that a single vocal fold could be represented by eight coupled transverse sections, each with two masses in the coronal plane that had both lateral and vertical degrees of freedom (Titze 1973, 1974). This model allows for simulation of the vibrational pattern of the vocal folds in both the coronal and traverse planes. recently, yang et al. (2010) described a lumped‐element multi‐mass model that permits motion in three dimensions, allowing for simulation of complex tissue trajectories. a further step up in computational complexity came with a continuum mechanics model (Titze and Talkin 1979) and a more recent finite‐element model (alipour, Berry, and Titze 2000) both of which provide a precise physiological and mechanical representation of the tissue layers of the vocal folds without lumping large anatomical regions into a

54 The Speech Mechanism
few mass elements. Their large number of degrees of freedom allows for detailed study of the complex vibratory pattern observed in human vocal folds. Interestingly, however, these complex models, capable of producing many modal vibration patterns, have shown that vocal fold vibration is largely dominated by only two or three modes of vibrations (Berry and Titze 1996), similar to movement patterns shown in Figures 3.4 and 3.5. Thus, the lumped‐element models seem to capture enough of the vibratory characteristics to serve as a useful research tool if fine detail is unnecessary.
The medial vocal fold surface configuration shown previously in Figure 3.3 is also representative of a type of computational model. It is not a self‐oscillating system, but rather one in which the kinematic characteristics of vocal fold vibration can be imposed on the medial surfaces. That is, the translational and rotational components of vibration are driven at a prescribed fundamental frequency and amplitude, and results in a pattern of glottal opening and closing that is dependent on the settings of vocal fold adduction, bulging, length, and thickness (Titze 1984, 2006). When combined with aerodynamic and acoustic considerations similar to those of the self‐oscillating models, glottal flow is produced in time‐synchrony with the vibratory pattern. a kinematic model is useful for relating physiologic aspects of voice production to both acoustic output and perception by listeners because the parameters of the model can be precisely controlled. For example, Samlan and Story (2011) recently reported a study in which variations of the medial surface parameters were related to acoustic measures often used to characterize breathiness. Samlan (2012) has taken this a step farther and studied the effects of left–right vibratory asymmetries on characteristics of glottal flow, acoustic output, and perceptual response.
3.7 Summary
The vocal folds are soft tissue structures contained within the cartilaginous framework of the larynx, and serve as the primary generator of sound for vowels as well as a pressure controller for many consonants. Their location in the neck and their function of generating and controlling sound makes the vocal folds the natural point of division between the subglottal and supraglottal airways. When adducted, motion of the vocal fold tissue is initiated and sustained over time by the steady air flow and pressure supplied by the lower respiratory system. The tissue motion is characterized by a translational component that captures the medial/lateral excursion, and a rotational component that produces an alternating pattern of glottal convergence and divergence (i.e., mucosal wave). The convergence and divergence of the glottis, as well as the inertive characteristics of the supraglottal vocal tract, are both mechanisms that facilitate vocal fold vibration by assuring that the intraglottal driving pressure is in phase with the tissue velocity. Once in vibration, the vocal folds effectively convert the steady air flow from the lungs into a series of flow pulses by periodically opening and closing the air space between the vocal folds, thus providing the excitation of the vocal tract. The acoustic
Mechanisms of Voice Production 55
resonances of the vocal tract and trachea, however, can influence the production of the glottal flow signal itself, suggesting that speech is produced by a nonlinear interaction of the voice source and airway resonances.
although much has been learned about the mechanisms of voice production, most of our knowledge has been, largely by necessity, derived from experiments and modeling studies that treat the vocal folds as an independent generator of sound. Future research needs to be directed toward an understanding of vocal fold vibration as an interactive component of the speech production system as a whole, and on time scales representative of words, phrases, and sentences. For example, more needs to be known about how vibration is initiated and sustained for the brief periods of time between production of consonants during connected speech. This may involve investigating the characteristics of an abduction/adduction maneuver that allows for both optimal production of a stop consonant and start‐up of vocal fold vibration for a following vowel, or finding out what effects tissue characteristics and muscle activation levels have on vocal fold vibration during a vocal tract occlusion as in production of a voiced stop or fricative. There is also much yet to be understood about how the nonlinear interaction of the vocal folds and the vocal tract contribute to connected speech. Perhaps such an interaction is more important in children’s speech production systems than for adults. Finally, there are many future studies that need be carried out to aid in understanding voice disorders and possible treatments. Experiments and simulation studies of vocal fold lesions, tissue scarring, asymmetric vocal fold vibration due to paralysis, neurological influences such as tremor, and therapeutic interventions are all needed to further our knowledge of human voice production.
NOTE
1 This work was supported by grants r01 dC04789 and r01 dC011275 from the National Institutes on deafness and Other Communication disorders.
rEFErENCES
alipour, Fariborz, david a. Berry, and Ingo r. Titze. 2000. a finite‐element model of vocal fold vibration. Journal of the Acoustical Society of America 108(6): 3003–3012.
Baer, Thomas. 1975. Investigation of phonation using excised larynges. Phd dissertation, Massachusetts Institute of Technology.
Berry, david a. 2001. Mechanisms of model and nonmodal phonation. Journal of Phonetics 29: 431–450.
Berry, david a. and Ingo r. Titze. 1996. Normal modes in a continuum model of vocal fold tissues. Journal of the Acoustical Society of America 100: 3345–3354.
Berry, david a., douglas W. Montequin, and Niro Tayama. 2001. High‐speed

56 The Speech Mechanism
digital imaging of the medial surface of the vocal folds. Journal of the Acoustical Society of America 110(5): 2539–2547.
doellinger, Michael and david a. Berry. 2006. Visualization and quantification of the medial surface dynamics of an excised human vocal fold during phonation. Journal of Voice 20(3): 401–413.
doellinger, Michael, david a. Berry, and Gerald S. Berke. 2005. Medial surface dynamics of an in vivo canine vocal fold during phonation. Journal of the Acoustical Society of America 117(5): 3174–3183.
druker, david. 1999. Vocal fold kinematics of voice types: data and modeling. Phd dissertation, University of Iowa.
Fant, Gunnar. 1960. The Acoustic Theory of Speech Production. Paris: Mouton.
Fant, Gunnar. 1979. Glottal source and excitation analysis. Speech Transmission Laboratory Quarterly Progress and Status Reports 20(1): 85–107.
Flanagan, James L. 1968. Source‐system interaction in the vocal tract. Annals of the New York Academy of Sciences 155: 9–17.
Flanagan, James L. and Lorinda Landgraf. 1968. Self‐oscillating source for vocal tract synthesizers. IEEE Transactions on Audio Electroacoustics aU‐16: 57–64.
Fourcin, adrian J. and Evelyn abberton. 1971. First applications of a new laryngograph. Medical and Biological Illustration 21(3): 172–182.
Fulcher, Lewis P., ronald C. Scherer, artem Melnykov, Vesela Gateva, and Mark E. Limes. 2006. Negative Coulomb damping, limiting cycles, and self‐oscillation of the vocal folds. American Journal of Physics 74(5): 386–393.
Henrich, Nathalie, Christophe d’alessandro, Boris doval, and Michele Castellengo. 2004. On the use of the derivative of electroglottographic signals for characterization of nonpathological phonation. Journal of the Acoustical Society of America 115(3): 1321–1332.
Henrich, Nathalie, Christophe d’alessandro, Boris doval and Michele Castellengo. 2005. Glottal open quotient
in singing: Measurements and correlation with laryngeal mechanisms, vocal intensity, and fundamental frequency. Journal of the Acoustical Society of America 117(3): 1417–1430.
Hirano, Minoru. 1974. Morphological structure of the vocal cord as a vibrator and its variations. Folia Phoniatrica 26: 89–94.
Hixon, Thomas J., Gary Weismer, and Jeannette d. Hoit. 2008. Preclinical Speech Science: Anatomy, Physiology, Acoustics, Perception. San diego, Ca: Plural.
Hollien, Harry. 1974. On vocal registers. Journal of Phonetics 2: 125–143.
Hollien, Harry and G. Paul Moore. 1968. Stroboscopic laminography of the larynx during phonation. Acta Oto‐laryngologica 65: 209–215.
Ishizaka, Kenzo and James L. Flanagan. 1972. Synthesis of voiced sounds from a two‐mass model of the vocal cords. Bell Systems Technical Journal 51(6): 1233–1268.
Ishizaka, Kenzo and M. Matsudaira. 1972. Fluid Mechanical Considerations of Vocal Cord Vibration. Santa Barbara, Ca: Speech Communications research Laboratory.
Jiang, Jack Jiaqi and Ingo r. Titze. 1993. a methodological study of hemilaryngeal phonation. Laryngoscope 103: 872–882.
Keidar, anat. 1986. Vocal register change: an investigation of perceptual and acoustic isomorphism. Phd dissertation, University of Iowa.
Li, Sheng, ronald C. Scherer, MingXi Wan, SuPin Wang, and HuiHui Wu. 2006. The effect of glottal angle on intraglottal pressure. Journal of the Acoustical Society of America 119(1): 539–548.
Liljencrants, Johan. 1991. a translating and rotating mass model of the vocal folds. Speech Transmission Laboratory Quarterly Progress and Status Reports 32(1): 1–18.
Lowell, Soren y. and Brad H. Story. 2006. Simulated effects of cricothyroid and thyroarytenoid muscle activation on adult‐male vocal fold vibration. Journal of the Acoustical Society of America 120(1): 386–397.

Mechanisms of Voice Production 57
Lucero, Jorge C. 1996. Chest‐ and falsetto‐like oscillations in a two‐mass model of the vocal folds. Journal of the Acoustical Society of America 100(5): 3355–3359.
Lucero, Jorge C. and Laura L. Koenig. 2005. Simulations of temporal patterns of oral airflow in men and women using a two‐mass model of the vocal folds under dynamic control. Journal of the Acoustical Society of America 117(3): 1362–1372.
Mergell, Patrick, Hanspeter Herzel, and Ingo r. Titze. 2000. Irregular vocal‐fold vibration: High‐speed observation and modeling. Journal of the Acoustical Society of America 108(6): 2996–3002.
Moore, Paul, 1991. a short history of laryngeal investigation. Journal of Voice 5(3): 266–281.
Orlikoff, robert F. 1991. assessment of the dynamics of vocal fold contact from the electroglottogram: data from normal male subjects. Journal of Speech and Hearing Research 34: 1066–1072.
rothenberg, Martin. 1973. a new inverse‐filtering technique for deriving the glottal airflow waveform during voicing. Journal of the Acoustical Society of America 53: 1632–1645.
rothenberg, Martin. 1981. acoustic interaction between the glottal source and the vocal tract. In Kenneth N. Stevens and Minoru Hirano (eds.), Vocal Fold Physiology, 305–328. Tokyo: University of Tokyo Press.
rothenberg, Martin and James M. Mahshie. 1988. Monitoring vocal fold abduction through vocal fold contact area. Journal of Speech and Hearing Research 31: 338–351.
Samlan, robin a. 2012. Kinematic modeling of asymmetric vocal fold vibration. Phd dissertation, University of arizona.
Samlan, robin a. and Brad H. Story. 2011. relation of structural and vibratory kinematics of the vocal folds to two acoustic measures of breathy voice based on computational modeling. Journal of Speech, Language, and Hearing Research 54(5): 1267–1283.
Scherer, ronald C., daoud Shinwari, Kenneth J. deWitt, Chao Zhang, Bogdan r. Kucinschi, and abdollah a. afjeh. 2001. Intraglottal pressure profiles for a symmetric and oblique glottis with a divergence angle of 10 degrees. Journal of the Acoustical Society of America 109(4): 1616–1630.
Sonneson, Bertil. 1959. a method for studying the vibratory movements of the vocal cords: a preliminary report. Journal of Laryngology and Otology 73: 732–737.
Steinecke, Ina and Hanspeter Herzel. 1995. Bifurcations in an asymmetric vocal‐fold model. Journal of the Acoustical Society of America 97(3): 1874–1884.
Stevens, Kenneth N. 1977. Physics of laryngeal behavior and larynx modes. Phonetica 34: 264–279.
Story, Brad H. and Ingo r. Titze. 1995. Voice simulation with a body‐cover model of the vocal folds. Journal of the Acoustical Society of America 97(2): 1249–1260.
Thomson, Scott L., Luc Mongeau, and Steven H. Frankel. 2005. aerodynamic transfer of energy to the vocal folds. Journal of the Acoustical Society of America 118(3): 1689–1700.
Titze, Ingo r. 1973. The human vocal cords: a mathematical model, part I. Phonetica 28: 129–170.
Titze, Ingo r. 1974. The human vocal cords: a mathematical model, part II. Phonetica 29: 1–21.
Titze, Ingo r. 1976. On the mechanics of vocal fold vibration. Journal of the Acoustical Society of America 60: 1366–1380.
Titze, Ingo r. 1983. Mechanisms of sustained oscillation of the vocal folds. In Ingo r. Titze and ronald C. Scherer (eds.), Vocal Fold Physiology: Biomechanics, Acoustics, and Phonatory Control, 349–357. denver, CO: denver Center for the Performing arts.
Titze, Ingo r. 1984. Parameterization of the glottal area, glottal flow, and vocal fold contact area. Journal of the Acoustical Society of America 75(2): 570–580.

58 The Speech Mechanism
Titze, Ingo r. 1988. The physics of small amplitude oscillation of the vocal folds. Journal of the Acoustical Society of America 83(4): 1536–1552.
Titze, Ingo r. 1994. Principles of Voice Production. Englewood Cliffs, NJ: Prentice Hall.
Titze, Ingo r. 2002. regulating glottal airflow in phonation: application of the maximum power transfer theorem to a low dimensional phonation model. Journal of the Acoustical Society of America 111(1): 367–376.
Titze, Ingo r. 2004. a theoretical study of F0–F1 interaction with application to resonant speaking and singing voice. Journal of Voice 18(3): 292–298.
Titze, Ingo r. 2006. The Myoelastic Aerodynamic Theory of Phonation. Iowa City, Ia: National Center for Voice and Speech.
Titze, Ingo r. 2008. Nonlinear source‐filter coupling in phonation: Theory. Journal of the Acoustical Society of America 123(5): 2733–2749.
Titze, Ingo r. and Brad H. Story. 1997. acoustic interactions of the voice source with the lower vocal tract. Journal of the Acoustical Society of America 101(4): 2234–2243.
Titze, Ingo r. and Brad H. Story. 2002. rules for controlling low‐dimensional vocal fold models with muscle activation. Journal of the Acoustical Society of America 112(3): 1064–1076.
Titze, Ingo r. and david T. Talkin. 1979. a theoretical study of the effects of various laryngeal configurations on the acoustics
of phonation. Journal of the Acoustical Society of America 66: 60–74.
Van den Berg, Janwillem. 1958. Myoelastic‐aerodynamic theory of voice production. Journal of Speech and Hearing Research 1: 227–244.
Wong, darrell, Mabo r. Ito, Neil B. Cox, and Ingo r. Titze. 1991. Observation of perturbations in a lumped‐element model of the vocal folds with application to some pathological cases. Journal of the Acoustical Society of America 89(1): 383–394.
yang, anxiong, Jorg Lohscheller, david a. Berry, Stefan Becker, Ulrich Eysholdt, daniel Voigt, and Michael dollinger. 2010. Biomechanical modeling of the three‐dimensional aspects of human vocal fold dynamics. Journal of the Acoustical Society of America 127(2): 1014–1031.
Zanartu, Matias, Luc Mongeau, and George r. Wodicka. 2007. Influence of acoustic loading on an effective single mass model of the vocal folds. Journal of the Acoustical Society of America 121(2): 1119–1129.
Zemlin, Willard. 1959. a comparison of a high‐speed cinematographic and a transillumination photo‐conductive technique in the study of the glottis during voice production. Master’s thesis, University of Minnesota.
Zemlin, Willard. 1998. Speech and Hearing Science: Anatomy and Physiology, 4th edn. Needham Heights, Ma: allyn and Bacon.