3 master thesis-wenqian-r0601448
TRANSCRIPT

Sensory marketing: This logo moves me! Revisiting and expanding the findings of Cian, Krishna and Elder (2014)
Wen Qian
Master’s Thesis Submitted for the Degree of Master in Business Administration
Graduation Subject: International Business Management
Supervisor: Filip GERMEYS
Academic Year: 2016–2017
Defended in: January 2017
FACULTY OF ECONOMICS AND BUSINESS - CAMPUS BRUSSELS WARMOESBERG 26 – B 1000 BRUSSELS BELGIUM
Internally Organised Master’s Thesis
FACULTY OF ECONOMICS AND BUSINESS
CAMPUS BRUSSELS

1
MASTER’S THESIS
Sensory marketing: This logo moves me! Revisiting and expanding the findings of Cian, Krishna and Elder (2014).
Wen Qian
Abstract Cian et al. proved that static visuals can evoke a perception of movement (i.e., dynamic imagery) and thereby affect consumer engagement and attitudes. Given the current replication crisis within psychology and related domains, we decided to replicate some of Cian and colleagues’ findings (their Study 2a & Study 4) directly, but we can not confirm effects of logo dynamism on engagement and most importantly not on attitudes (Studies 1 and 2). Contrary to Cian et al.’s original finding (their Study 4), a metaphorical match of forward movement with modern brands and backward movement with traditional brands had no effect on attitudes toward the brand (our Study 3). To summarize, we did not replicate the original result. We also carried out additional analyses including gender as a variable which was not the case in Cian et al.’s studies. The failure of this replication once again proves the replication crisis in science, such as falsified researches, faking results and the file-‐drawer problem, etc. As will be argued further on, a substantial number of findings in the grounded/embodied cognition literature have recently failed to replicate, thus both justifying and substantiating the need for further replication studies within this domain.
Keywords: replication; sensory marketing; static; dynamic; embodiment; grounded cognition; metaphors; visual imagery; logo 1. Introduction
In recent years, sensory marketing has taken a prominent place within the research field of marketing. One conceptual definition of sensory marketing is “marketing that engages the consumers’ senses and affects their perception, judgment, and behavior” (Krishna, 2012, p. 332; for reviews, see Krishna, 2012, 2013, and the contributions in Krishna, 2010). Some researchers treat sensory marketing as a way to clarify a firm’s identity and values, with the long-‐term goal of creating brand awareness and establishing a sustainable brand image. The past decade however, has seen a growing interest in research addressing how bodily experiences serve as a source of information in judgment and choice. These processes, collectively headed under the umbrella of embodied (or grounded) cognition, can be conceptualized within the feelings-‐as-‐information theory (Schwarz, 2012). This theory illustrates how bodily experiences can act as a source of information and impact judgment
FACULTY OF ECONOMICS AND BUSINESS
CAMPUS BRUSSELS

2
and choice. This relatively recent embodied or grounded cognition perspective stands in contrast to the view developed in the 1970’s following the cognitive revolution within psychological science.
In the 1970s, the development of general models of information processing took place, and an integrative framework for the conceptualization of human memory, judgment, and decision making was conceptualized (see Lachman, Lachman, & Butterfield, 1979; Wyer, 1974). This approach assumed that once people have acquired information through their senses, this information is translated into a common code which is independent of the initial modality. Contrary to this perspective, Krishna recently proposed a conceptual framework of sensory marketing, which highlights the difference between sensation and perception, and also introduces the concept of grounded cognition and metaphors. Within this framework, sensations such as haptics, olfaction, audition, taste and vision can affect cognition, and finally influence consumer’s attitudes and behaviors (Krishna 2012).
The focus of the present study is on the visual modality. Although sensations like haptics, olfaction, audition, taste and vision can influence the final decision behavior, visual cues have quite an important impact on customer behavior (e.g., Deng & Kahn, 2009; Hagtvedt & Patrick, 2008; Raghubir & Greenleaf, 2006; Scott, 1994). Visual imagery is one specific form of visual cues. Within visual imagery, a further distinction can be made between dynamic and static imagery. By “dynamic imagery”, we refer to a static image from which the viewer perceives a sense of movement (we return to static imagery further on). Callow, Roberts, and Fawkes (2006) showed that dynamic imagery has the ability to generate more vividness of imagery and aids the representational display in short-‐term working memory. Within a marketing context, Cian, Krishna, and Elder (2014) recently studied the impact of static images (i.e., brand logo’s) on the generation of the perception of movement (implied motion) and demonstrated effects of such evoked dynamism on consumer engagement, and further downstream, on brand attitude. Specifically, they showed that a simple manipulation of dynamism of, for example, a logo displaying Newton’s cradle (see Figure 1), affects consumer engagement and brand attitudes.
The focus of the present study is on the study of Cian et al. (2014). Specifically, the aim was to directly replicate some of Cian and colleagues’ findings given the current replication crisis within psychology and related domains. As will be argued further on, a substantial number of findings in the grounded/embodied cognition literature have recently failed to replicate, thus both justifying and substantiating the need for further replication studies within this domain.
Fig. 1. Newton’s cradle. Illustration of dynamism, which can influence customer engagement and brand attitudes.
We begin by discussing the relevant literature to our research, then build the conceptual framework for the hypothesized effects and our replication efforts. Finally, we compare the obtained experimental results with the original results by Cian et al. (2014), but we can not confirm effects of logo dynamism on engagement and most importantly not on attitudes (Studies 1 and 2). Contrary to Cian et al.’s original finding (their Study 4), a metaphorical match of forward movement with modern brands and backward movement with traditional brands had no effect on attitudes toward the brand (our Study 3). The failure of this replication once again proves the replication crisis in science, such as falsified researches, faking results and the file-‐drawer problem, etc. Given the current replication crisis within psychology and related domains, further replication studies are urgently needed.
3
2. Prior Literature 2.1. Sensory marketing and embodiment
In recent years, both within consumer and psychology research, there has been a strong interest in how the basic senses of touch, smell, audition, taste and vision can act as unconscious triggers influencing the attitudes and behaviors of consumers. Furthermore, experiments also show that combining several senses has a stronger influence on customers’ decision making than using just one sense. For example, Elder and Krishna (2010) showed participants food text advertisements that included information concerning one sense or multiple senses prior to tasting food. Results showed that the food tasted better when the information covered multiple senses. In line with these findings, the Swedish grocery retail chain, ICA Sverige AB, has used more sensory labels (e.g., ‘juicy oranges’ rather than ‘Florida oranges’; ‘succulent sea bass’ rather than ‘sea bass filet’). In the U.S., many food manufactures are also pointing out to their customers how their products appeal to the different senses. For instance, in an advertisement of Lindt chocolate, the art of chocolate tasting is highlighted and the reader is told how to apply all five senses when tasting their chocolate. Other companies, like Orangina, appeal to the consumers’ haptic sense. Orangina even adopted a bottle design with a shape and texture resembling the raw material which is the orange in this case. As a final example, many upscale hotel chains have adopted signature scents because they believe that their customers will remember the features of the hotels better and as a result will come back. For example, Shangri-‐La Hotels and Resorts has introduced a signature “Essence of Shangri-‐La” scent in the lobbies of selected Shangri-‐La hotels and resorts in Asia and the middle-‐East. The scent is fresh and clean, subtly Asian, and is said to evoke sensations of serenity and calm (Shangri-‐La Hotels to use 'Essence of Shangri-‐La' scent in Lobbies. 2006, November 6. Retrieved from http://www.asiatraveltips.com/news06/69-‐ShangriLaHotels.shtml). Similarly, Intel, MAC, NBC, MGM, and many other brands have signature sounds which are used as brand identities for customer to remember (Hitt & Blease, 2016).
Bodily experiences are a source of information. The assumption that people attend to their own bodily states and get information from them has a long tradition in psychology, philosophy and art. From the heart that beats faster when meeting the loved one, to the cold sweat of fear, perceptions of bodily states also figure prominently in popular images, songs and poems. Not surprisingly then, experimental studies confirm that bodily states inform human judgment and that people use this information as they use any other kind of information (for reviews, see Herbert & Pollatos, 2012; Schwarz & Clore, 2007).
However, according to the feeling-‐as-‐information theory, the impact of bodily states depends on their perceived informational value; it is enhanced when experienced, and diminished or eliminated when the experience is unrelated to the situation. A fast beating heart will increase the attractiveness of pin-‐up photos, but when one realizes that the elevated heart beat is the result of stair climbing, the attractiveness may disappear (Zillman, 1978). Similarly, the impact of a fear-‐arousing movie will be increased by physiological symptoms of fear, but this influence is eliminated when the symptoms can be attributed to an allegedly arousing pill (Schwarz, Servay, & Kumpf, 1985).
Provided correct attribution to the stimulus, bodily responses to a stimulus can influence people’s subjective judgment about the stimulus. For example, an experiment by Strack, Martin, and Stepper (1988) showed that a cartoon is perceived as funnier when participants hold a pen in their mouths than pursed lips, because a pen in the mouth can cause a smiling response, but a pen in pursed lips will damage the smile (however, note that this finding has recently been disputed in a large-‐scale replication study by Wagenmakers, Beek, Dijkhoff, & Gronau, 2016). In a similar vein, Proffitt, Bhalla, Gossweiler, and Midgett (1995) showed that hills seem steeper when people are fatigued, or wearing a heavy backpack (but for an alternative view see also Woods, Philbeck, & Danoff, 2009). Closer to a marketing context, Gross, Woelbert, and Strobel (2015) tested the hypothesis that the subjective value of snack food would be affected by the effort that one would exert when reaching for the product. Even though reaching was not required in the actual experiment, willingness to pay was significantly lower when subjects wore heavy wristbands on their arms. In other words, when reaching was made more difficult, items were perceived as less valuable. Together, these findings pose serious challenges to how we think about the human mind. In the following part, we elaborate upon this.
2.2. Information processing: Amodal versus modal representations
According to the information processing model, people acquire information through their senses and translate it into a common code, which is undone from its initial form. This amodal knowledge representation works like within a computer: encoding, storage, and retrieval operations, all need a common format. The

4
information processing model assumes context independence of representations, and is as such in contradiction with the feeling-‐as-‐information theory, which addresses how bodily experiences serve as a source of information. In psychological research, the information processing paradigm developed in the 1970’s neglected the role of moods, emotions, motivations, and other subjective experiences which were not easily conceptualized within a computer metaphor. However, social cognition theories did not fundamentally challenge the assumption of amodal representations, but held the opinion that feelings and bodily experiences are stored in memory in an amodal form, for example, as nodes in a semantic network (e.g., Bower, 1981).
Within the information processing paradigm, sensation and perception are stages of processing of the sensorial input. Sensation is natural and biochemical, it happens when the stimulus impinges upon the receptor cells of a sensory organ. Perception on the other hand, is the understanding and awareness of sensory information (Krishna, 2011). Two examples illustrate the difference between sensation and perception. First, in the café wall visual illusion (see Figure 2), the horizontal lines are actually parallel, that is, the biochemical sensation of light hitting the back of the eyes (i.e., on the retina) is horizontal, but the perception is that they are not horizontal following the interpretation of the sensory input by the brain. We think it logically that things will bend down when a block (such as a brick) is placed on top of it, so the lines with the bricks on top of them do not appear parallel. Another example relates to speech recognition. Newborn Japanese children can tell the difference between “l” and “r”, but Japanese adults cannot. Japanese adults have learned not to decipher the difference because it does not matter in their language, so when there’s the sound of “l” and “r”, the brain will interpret both as “l” although the auditory signal (sensation) is different (Wolfe et al., 2006).
Fig. 2. Café wall visual illusion illustrating the difference between sensation and perception.
The assumption of a largely decontextualized and amodal mind has been questioned by researchers who
support the theory of the situated, experiential, and embodied nature of human cognition. Situated cognition research suggests that thinking is for doing; any mind worth having needs to be geared towards facilitating action in ways that are sensitive to the requirement of one’s current situation (for a review, see Smith & Semen, 2004). This perspective includes contextual influences in decision making and choice. People experience the world through their senses, thus sensory information is important for human action and cognition. Semin and Smith (2004) also put forward the concept of socially situated cognition, they believe it is special because other people’s movements and other characteristics can be mapped onto our bodies. As, people experience the world through their senses, sensory information and related subjective experiences play an important role in human action and cognition, even in abstract domains and those far removed from immediate sensory inputs. There is the belief that humans “evolved from the creatures whose neural resources were devoted primarily to perceptual and motoric processing” (Wilson, 2002, p. 625). The evolutionarily older programs will be reused for new purposes during the later development of higher mental processes (Anderson, 2010). As the reuse of phylogenetically older neural circuitry, “higher mental processes” are grounded in bodily experience (for a review of supporting evidence, see Anderson, 2010). On the other hand, rather than phylogenetic learning, psychologists emphasize ontogenetics, they suggest that early experience with the physical and social world structures later thinking about abstract concepts. For example, feeling warm and safe in the presence of a caregiver can influence the feeling of security. So sensory experience associates with the abstract thoughts (e.g., Williams, Huang, & Bargh, 2009).
Besides the psychological research mentioned above, some neuroimaging studies show that mental simulation activates corresponding areas of the brain. For example, silent reading of strong smell words like “garlic” or “cinnamon” activates the primary olfactory cortex (González et al., 2006), imagining hearing

5
Beethoven being played leads to activation of the auditory cortex (Zatorre & Halpern, 2005), and seeing pictures of chocolate chip cookies activates the taste cortex (Rolls, 2005; Simmons, Martin, & Barsalou, 2005). In a similar vein, alternative visual depictions of a product in an advertisement can also lead to the mental simulation of using the product and consequently influence the customer’s purchasing behavior. For example, Elder and Krishna (2012) showed that a mug with the handle on the right results in greater mental simulation and higher purchase intension for right-‐handed people than a left handle mug (see Figure 3). Similarly, a match between handedness and product orientation (e.g., a right-‐handed person viewing a picture of a bowl of soup with a spoon on the right), versus a mismatch (e.g., a right-‐handed person seeing a picture of a bowl of soup with a spoon on the left), increases mental simulation of product interaction, which in turn seems to increase purchase intentions. However, Eldar and Krishna’s (2012) results also show that when the product is not appealing, a match between product orientation and handedness improves the simulation of a negative experience, resulting in a decrease of purchase intentions.
So far, we have discussed the information transfer and transformation process from input to output. We now turn to the relationship between sensory experience and abstract thought, as part of the information processing, with special emphasis on their metaphorical link.
Fig. 3. Visual depiction and mental simulation. Two different ads can cause different mental simulations and influence purchasing intention (Elder & Krishna, 2012).
2.3. Metaphors as the links between sensory experiences and abstract thoughts
Studies have shown that the links between sensory experience and abstract thoughts are reflected by metaphors (for a review, see Landau, Meier, & Keefer, 2010). For example, we can use the words “warm” or “cold” to describe a relationship, and this physical feeling can influence the relationship directly. To illustrate, it has been shown that touching a warm object can increase the perception of social warmth of others, also participants holding a hot (versus cold) therapeutic pad were more likely to choose a gift for a friend instead of for themselves (e.g., Williams & Bargh, 2008; however this finding has recently been disputed in a large-‐scale replication study by Lynott et al., 2014). Similar to this finding, Zhong and Leonardelli (2008) showed that social exclusion literally feels cold. In a first experiment they found that participants who recalled a social exclusion experience gave lower estimates of room temperature than did participants who recalled an inclusion experience. In a second experiment, social exclusion was directly induced through an on-‐line virtual interaction, and participants who were excluded reported greater desire for warm food and drink than did participants who were included.
Research by Lee and Schwarz (2015) also shows that fishy smells can generate suspicion in people, and when someone is suspicious, they are also more likely to identify a fishy smell as a fishy smell. Similarly, embodied dryness cues influence vitality and depletion (Shalev, 2014). Using dryness-‐related concepts within a scrambled sentence task increased the physical thirst and tiredness of participants, and also decreased self-‐reported vitality. Another experiment showed that, compared with participants primed with visual images of land and water, participants primed with visual images of arid land were also more likely to procrastinate in initiating a monetary investment task (Shalev, 2014).

6
The experiments discussed above, show that embodied cognition is reflected by metaphors. Next, we first specifically turn our attention to the visual modality and subsequently to visual imagery as a cue with a potentially strong impact on consumer behavior.
2.4. The impact of visual cues on persuasion
An increasing number of studies have explored the impact of visual cues on persuasion (e.g., Mitchell & Olson 1981; Peracchio & Meyers-‐Levy, 2005; Scott, 1994). One reason for the potentially strong impact of visual cues is that visual elements can increase customer engagement and attention (Finn, 1988; Pieters & Wedel, 2004; Pieters, Wedel, & Batra, 2010). For example, recent research has reported that visual artwork used on product packaging or in advertisements affects evaluations of luxury and has a positive influence on the attitudes toward the product (Huetti & Gierl, 2012). In the food industry, visual cues have been shown to have decisive influence on customers’ behavior. “The first taste is almost always with the eye”, especially when the food product is sold through its appearance, rather than through its packaging (Imram, 1999). But the packaging also impacts customers’ decisions. For example, Rebollar, Lidon, Serrano, Martin, and Fernandez (2012) showed that changing the package of chewing gun, affected purchasing behavior. In particular, packaging format influenced the expectations of functional attributes, sensory attributes of texture, and experience attributes, while color changes influenced expectations of sensory attributes of taste and flavor and experience attributes. This study also revealed that the willingness to buy the chewing gun was more influenced by the color of the packaging than its format.
Although bodily feelings stemming from visual, olfactory or haptic inputs can affect consumer behavior, visual aspects tend to have more decisive power relative to bodily feelings stemming from the other senses. Size-‐contrast illusions illustrate this point nicely, as they are more affected by the eye compared to the hand (Aglioti, DeSouza, & Goodale, 1995). Specifically, when we reach out to pick up an object, our judgment of the object’s size is influenced by the opening scale between our fingers and thumb. Evidence has shown that this calibration is mediated by visual mechanisms. However, pictorial illusions have larger effects on perceptual judgments of size. Meert, Pandelaere, and Patrick (2013), further illustrated the power of vision by showing that both adults and children prefer glossy objects to matte ones. When people are shown glossy and shiny surfaces, individuals tend to think of water, which tends to stimulate their thirst. Extending the study to other fields such as luxury goods, when the main stream of goods are glossy, customers would be more inclined to choose glossy products due to the direct link between glossiness and luxury. Exploring the association of brightness and temperature, it is suggested that ambient brightness may affect perceptions of temperature and as a result trigger emotional responses. An example of this is provided in the study by Xu and Labroo (2014), in which they stated that the stock market tends to perform better on sunny days due to people feeling more optimistic since the sun was out.
All these experiments and findings illustrate the importance of visual cues and visual imagery. In the present research, we will focus on brand logos, especially their visual aspect, and impact on consumer attitudes toward brands. As such, we continue with a short discussion on the characteristics of logo’s, followed by a more in depth discussion of static versus dynamic imagery as an introduction to the aim of the present study.
2.5. The importance of logo characteristics
Much of the prior literature on logo’s has studied their characteristics and impact on memory (e.g., Henderson & Cote 1998; Janiszewski & Meyvis, 2001; Van der Lans et al., 2009; Vartorella, 1990), and also on the perceptions of the company or brand (Schechter, 1993; Stafford, Tripp, & Bienstock, 2004). The image of the logo gives consumers the first and direct chance to remember the company or brand. There are different ways of presenting logos, such as banner ads, the product itself, posters, and product packaging. The importance of having a visually stimulating logo allows for consumers to remember the brand and recall its connection to their needs. Thus, a logo becomes a visual signature for the brand (Snyder, 1993) responsible for conveying the brand’s characteristics (Zakia & Nadin, 1987). Hence, organizations and companies realize that one of the most important parts of a company's branding strategy is choosing the right logo. Accordingly, they spend huge amounts of money to ensure a good way to market their brand. For example, British Petrol (BP) invested $211 million to redesign their logo in 2008, Accenture spent $100 million for the logo in 2000, BBC spent $1.8 million to redesign their logo in 1997, and the London Olympics paid $625,000 for their logo in 2007 (Famous logo designs and how much did they cost? 2012, July 8. Retrieved from https://stocklogos.com/topic/famous-‐logo-‐designs-‐and-‐how-‐much-‐did-‐they-‐cost).

7
Guidelines for selecting or modifying logos have been proposed (e.g., Henderson & Cote, 1998). Good logos should mainly be recognizable, familiar, elicit a consensually held meaning in the target market, and evoke positive affect (e.g., Cohen, 1986; Peter, 1989; Robertson, 1989; Vartorella, 1990). We discuss each of these goals. First, ideally logos should speed recognition of a company or brand (Peter, 1989). The rationale for the use of logos is that pictures are in principle perceived faster than words (Edell & Staelin, 1983). Recognition can be approached at two levels. On the one hand, consumers must remember having seen the logo. On the other hand, logos must remind consumers of the brand or company name (recall). The former depends largely on design. With equal exposures, a more memorable design will be recognized more easily than a less memorable one. So it is important to select a design that is recognized easily to facilitate recall of the company. While familiarity is mostly dependent on recognizability, some logos can create a sense of familiarity even when they have never been seen before. The feeling or perception of familiarity is called subjective familiarity. Subjective familiarity can be the result of a logo evoking a familiar meaning, or from the design being similar to well-‐known symbols. The reason why subjective familiarity can benefit a logo is that it can create more consensually held meanings (Matlin, 1971). A logo with consensually held meanings can evoke the same intended meaning across people within a culture or subculture. When a logo has such a clear meaning, it can also be linked to the company or product more easily (Block, 1969; Clark, 1988; Durgee & Stuart 1987; Kropp, French, & Hillard, 1990). A final guideline is about positive affect. Positive affective reactions are critical to a logo’s success because affect can transfer from the logo to the product or company, and this can influence customer behavior, that is to say, if the logo elicits positive affect, consumers are more likely to choose this brand and buy the product.
As discussed in this section, visual elements are quite critical to logos. In what follows, we specifically address the distinction between static imagery and dynamic imagery in logo design, and subsequently address how these different logo designs can affect customer behaviors.
Fig. 4. Illustration of “frozen motion” (left panel) and “visual friction” (right panel).

8
2.6. Static versus dynamic imagery
The distinction between static and dynamic imagery is familiar to us at the common sense level, as we can imagine both stationary objects and action scenes in which objects are in motion or in the process of being rotated. Static imagery has been defined as the brain’s ability to generate representations of unmoving and fixed objects. These representations facilitate figure recognition and judgment about the objects’ visual properties. In contrast, dynamic imagery is the brain’s ability to generate representations of moving objects, facilitating the simulation of transformations, rotations, and reorganizations of imagined information (Clark & Paivio, 1991; Harshman & Paivio, 1987; Thomas & Mulligan, 1995). Therefore, internalized motor processes enable perceptions of movement in static visual cues that have a dynamic quality (e.g., a static picture of a running animal could seem to be actually running).
There are several different ways to convey movement. “Frozen motion” is the most common one, and captures a moving figure in the midst of motion, either through sculpture, painting, or camera (see Figure 4, left panel). Some researchers have studied how “frozen motion” can generate a sense of movement (Freyd, 1983; Reed & Vinson 1996; Vinson & Reed, 2002). “Visual friction” on the other hand, refers to when an object appears to touch, clash against or slide along another object, in this case the perceived movement decreases (see Figure 4, right panel).
Having introduced the main concepts, and before setting out the specific aims of the current study, next we first provide a brief overview of Cian and colleagues’ (2014) study on dynamic imagery of logo’s and its potential effects on customer behavior, given its central role in the present work. 3. Present Study
Cian, et al. (2014) proposed that static visuals can evoke dynamic imagery and thereby affect consumer engagement and attitudes. In their first study (Study 1), they showed how dynamism within a static logo (implicit motion) can affect attitudes toward the brand. In Study 2 (2a & 2b), they introduced consumer engagement and showed it to be a mediator for the impact of perceived dynamism on attitudes. In a third study (Study 3), they examined the moderating impact of the metaphorical fit between logo dynamism and brand characteristics on brand attitudes. In particular, two versions of descriptions (traditional/modern) of a company were provided, and then the attitudes toward the company with more/less dynamic logos was explored. Attitudes towards companies described as traditional were found to be more positive when combined with a static logo (relative to a dynamic logo), whereas attitudes towards companies described as modern were found to be more positive when combined with a dynamic logo. In Study 4, they studied the effect of forward (backward) movement and its metaphorical match with modernity (traditionalism). Specifically, four logos were provided with different descriptions (traditional/modern) and movement directions (forward/backward). Attitudes toward the modern brand were found to be more positive when combined with a logo with forward implied motion (i.e., to the right), whereas for the traditional brand, more positive attitudes were observed when combined with a logo with backward implied motion (i.e., to the left). Finally, in Study 5, using an implicit measure of engagement, that is by using eye-‐tracking technology, they found converging evidence that logos with higher dynamism increase engagement, and increased attention can occur through increased refixations (i.e., longer gaze durations) on logos with higher dynamism.
In the present study we first wished to replicate some of the above findings by Cian and colleagues (2014). There are several reasons for carrying out replications studies. First, and most obviously, the study of Cian et al. (2014) hasn’t been replicated directly yet. Second, recently, the science of psychology (in particular social experimental psychology) has come under criticism because a number of research findings do not replicate, thus it makes sense to invest in replication studies. Recent replication failures that have been given quite some attention include such studies as “power posing will make you bolder” (Ranehill, Dreber, Johannesson, Leiberg, Sul, & Weber, 2015), and “cleaning your hands will wash away your guilt” (Kaspar, Krapp, & König, 2013). Similarly, a landmark study in terms of embodied cognition by Strack and colleagues (1988) showing that participants find cartoons funnier when they hold a pen between their teeth (making them smile), did not replicate in a recent massive replication attempt by 17 independent labs and involving nearly two thousand participants. This study found no overall effect of mouth position on people’s rating of the funniness of cartoons (Wagenmakers, Beek, Dijkhoff, & Gronau, 2016). Also, previous research suggested that consumers' intentions to purchase products are increased when the product's depiction affords an action with the dominant hand rather than with the non-‐dominant hand (Eldar & Krishna, 2012). However, in eight experiments Pecher and Dantzig (2016) recently failed to obtain any evidence for such claim. Also within the embodied cognition
9
tradition, Williams and Bargh (2008) concluded that touching a warm object can increase the perception of social warmth of others, and participants holding a hot (versus cold) therapeutic pad were also more likely to choose a gift for a friend instead of for themselves. However, again this finding has recently been disputed in a recent large-‐scale multiple lab replication study (Lynott et al., 2014).
The non-‐reproducibility of findings is disturbing because it could suggest the possibility that the original research was done sloppily. Even worse is the suspicion that some research may have even been falsified. In science, faking results is the biggest of sins, the unforgivable sin, and for this reason the field of psychology has been thrown into an uproar (see for example the famous Stapel case). However, a perhaps more common reason for non-‐replication is that, in original studies with small sample sizes, statistically-‐significant results may often be the result of chance when combined with the file-‐drawer problem (i.e., non-‐reporting of studies without significant results). In fact strategies such as the selective reporting (of under-‐sampled) studies together with other questionable research practices (QRP’s) may be more common than once believed (e.g., John, Loewenstein & Prelec, 2012). Such QRP’s include amongst others, failing to report all of a study’s dependent measures, deciding whether to collect more data after looking to see whether the results were significant, failing to report all of a study’s conditions, stopping collecting data earlier than planned because one found the result that one had been looking for, deciding whether to exclude data after looking at the impact of doing so on the results, etc.
Given the recent replication failures within social experimental psychology, and specifically within the domain of embodied/grounded cognition, the need for replications to provide not only converging but direct evidence for certain findings in the literature is paramount. As such the aim of the present study is to directly replicate some of the findings by Cian, et al. (2014). To this end we address Cian et al.’s (2014) finding that a logo that evokes greater perceived movement (logo dynamism) generates more favorable attitudes toward the brand, unless the perceived movement is incongruent with the brand characteristics. Furthermore, they showed that the impact of logo dynamism on attitudes toward the brand is mediated by engagement.
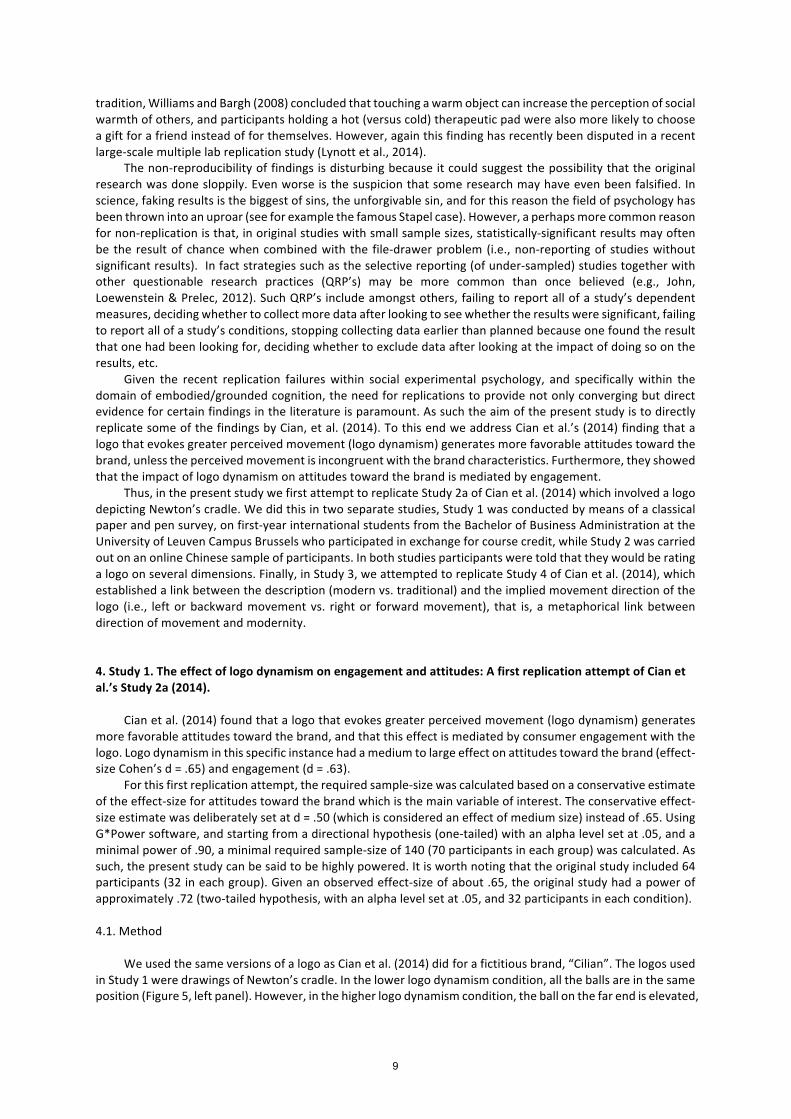
Thus, in the present study we first attempt to replicate Study 2a of Cian et al. (2014) which involved a logo depicting Newton’s cradle. We did this in two separate studies, Study 1 was conducted by means of a classical paper and pen survey, on first-‐year international students from the Bachelor of Business Administration at the University of Leuven Campus Brussels who participated in exchange for course credit, while Study 2 was carried out on an online Chinese sample of participants. In both studies participants were told that they would be rating a logo on several dimensions. Finally, in Study 3, we attempted to replicate Study 4 of Cian et al. (2014), which established a link between the description (modern vs. traditional) and the implied movement direction of the logo (i.e., left or backward movement vs. right or forward movement), that is, a metaphorical link between direction of movement and modernity. 4. Study 1. The effect of logo dynamism on engagement and attitudes: A first replication attempt of Cian et al.’s Study 2a (2014).
Cian et al. (2014) found that a logo that evokes greater perceived movement (logo dynamism) generates more favorable attitudes toward the brand, and that this effect is mediated by consumer engagement with the logo. Logo dynamism in this specific instance had a medium to large effect on attitudes toward the brand (effect-‐size Cohen’s d = .65) and engagement (d = .63).
For this first replication attempt, the required sample-‐size was calculated based on a conservative estimate of the effect-‐size for attitudes toward the brand which is the main variable of interest. The conservative effect-‐size estimate was deliberately set at d = .50 (which is considered an effect of medium size) instead of .65. Using G*Power software, and starting from a directional hypothesis (one-‐tailed) with an alpha level set at .05, and a minimal power of .90, a minimal required sample-‐size of 140 (70 participants in each group) was calculated. As such, the present study can be said to be highly powered. It is worth noting that the original study included 64 participants (32 in each group). Given an observed effect-‐size of about .65, the original study had a power of approximately .72 (two-‐tailed hypothesis, with an alpha level set at .05, and 32 participants in each condition). 4.1. Method
We used the same versions of a logo as Cian et al. (2014) did for a fictitious brand, “Cilian”. The logos used in Study 1 were drawings of Newton’s cradle. In the lower logo dynamism condition, all the balls are in the same position (Figure 5, left panel). However, in the higher logo dynamism condition, the ball on the far end is elevated,

10
giving the impression of frozen motion (Figure 5, right panel). The two logos differed only in the inclination of the last ball.
Fig. 5. Ad used in Experiment 1. Left panel depicts stimulus used in the low dynamism condition, right panel
the stimulus used in the high dynamism condition.
Similar to Cian et al.’s study, participants completed nine questions in the following order (see Appendix A). First, three evaluation items were included to measure attitudes: “Please evaluate this logo.” (1 = ”bad/dislike/unpleasant”; 9 = ”good/like/pleasant”. Next, four items were included to measure engagement: ”How involving do you think this logo is?” (1 = “not at all”, and 9 = “extremely”), “How engaging do you think this logo is?” (1 = “not at all”, and 9 = “extremely”), “How boring do you think this logo is?” (1 = “not at all”, and 9 = “extremely”; reverse scored), and “How stimulating do you think this logo is?” (1 = “not at all,” and 9 = “extremely”). Finally, two items were included measuring perceived movement (as a manipulation check): “How much movement did you see in the logo for the company?” (1 = “no movement at all”; 9 = “a lot of movement”), and “How dynamic was the logo?” (1 = “not at all dynamic”; 9 = “extremely dynamic”).
The questionnaires were printed and handed out to the students who were taking an introductory psychology course. Students filled in the survey during class, this took approximately 5 minutes. One hundred and fifty-‐three first-‐year international students from Bachelor of Business Administration at the University of Leuven participated in exchange for course credit, thus meeting our required sample-‐size of 140 participants. Of these one hundred and fifty-‐three students, eighty-‐three were female, sixty-‐nine male, one student did not provide gender information. Their ages ranged from 17 to 31 years (M = 19.14, SD = 1.85).
Participants were told that they would be rating a logo on several dimensions. Each participant was randomly assigned to view one of these two logos. They were allowed to view the logo for as long as they wanted.
4.2. Results and Discussion
Data were analyzed with SPSS Software. First, an attitude index was created by averaging the 3 attitude items (α = .91). Similarly, an index of engagement was created based on the four items (α = .82). Finally, the two items measuring perceived dynamism were averaged (r = .76). All three indexes thus showed sufficient internal consistency, furthermore these values were very similar to those found in the original study (i.e. Study 2a by Cian et al. 2014; αatt = .91, αeng = .86, rperc.dyn = .61).
Manipulation check: Perceived movement. An independent t-‐test was carried out to check whether the dynamic logo was perceived as being more dynamic than the static logo. This was indeed confirmed (p = .002*1; Mlower dynamism = 3.31, Mhigher dynamism = 4.16, SDlower dynamism = 1.82, SDhigher dynamism = 1.71; d = .48). Note that a medium effect-‐size was observed.
Engagement toward the brand. Next we conducted a similar analysis with engagement toward the brand as the dependent variable. No significant effect of logo dynamism was observed (p = .16*; Mlower dynamism = 3.65, Mhigher dynamism = 3.88, SDlower dynamism = 1.42, SDhigher dynamism = 1.40).
Attitudes toward the brand. Finally we conducted a similar analysis with attitudes toward the brand as the dependent variable. Again no significant effect of logo dynamism was observed (p = .45*; Mlower dynamism = 4.48, Mhigher dynamism = 4.45, SDlower dynamism = 1.75, SDhigher dynamism = 1.71).
1 All t-‐test with an * are one-‐sided tests because of an a priori directional hypothesis.
11
The data analyses above suggest that the two logos indeed differ in their level of perceived movement, however, higher logo dynamism did not result in stronger engagement nor did it show a statistically significant effect on the main variable of interest, namely attitude towards the brand. As such, the present study does not replicate the findings of Study 2a by Cian et al. (2014).
Although Cian et al. (2014) did not report any effects of participant gender (also note that Cian et al. did not report the gender composition of their participant sample), further exploration of the present data seemed to reveal some differences between men and women in terms of perceived dynamism of the two types of logo’s. Specifically, a 2x2 between-‐subjects ANOVA with logo dynamism (high/low) and gender as independent variables and perceived dynamism as the dependent variable showed a significant interaction effect of logo dynamism (high/low) and gender, F(1,147) = 4.15, p = .04. Independent t-‐tests further showed a significant and large effect of logo dynamism on perceived movement for female participants (p < .001*; Mlower dynamism = 3.02, Mhigher dynamism = 4.40, SDlower dynamism = 1.65, SDhigher dynamism = 1.71, d = .82), while this was not the case for male participants (p = .33*; Mlower dynamism = 3.66, Mhigher dynamism = 3.87, SDlower dynamism = 1.98, SDhigher dynamism
= 1.71). Given the absence of an effect of logo dynamism (i.e., the manipulation of interest) on perceived dynamism for male participants, we decided to carry out additional analyses on engagement and attitude towards the brand, each time considering the potential effect of gender. The idea being that an effect of logo dynamism on perceived dynamism would be required in order to observe an effect on engagement with the brand, and further downstream, on attitudes toward the brand.
First, a 2x2 between-‐subjects ANOVA with logo dynamism (high/low) and gender as independent variables and engagement as the dependent variable showed a marginally significant interaction effect of logo dynamism (high/low) and gender, F(1,147) = 2.90, p = .09. Independent t-‐tests showed more engagement in the more dynamic logo for female participants (p = .02*; Mlower dynamism = 3.35, Mhigher dynamism = 3.96, SDlower dynamism = 1.30, SDhigher dynamism = 1.45; d = .44), but not for male participants (p = .31* Mlower dynamism = 4.01, Mhigher dynamism
= 3.85, SDlower dynamism =1.49, SDhigher dynamism = 1.32). This result seems consistent with the fact we only observed a significant effect of logo dynamism on perceived dynamism in the female group, and is as such in line with Cian et al.’s observations (i.e., when we observe an effect of logo dynamism on perceived dynamism, we also observe an effect of logo dynamism on engagement).
Finally, a similar analysis with gender and logo dynamism was carried out on the attitude data. The 2x2 between-‐subjects ANOVA showed no significant interaction effect of logo dynamism (high/low) and gender, F(1,148) = .32, p = .57. We still carried out additional independent t-‐tests and found no evidence for more positive attitudes towards the brand for the more dynamic logo in female participants (p = .36*; Mlower dynamism
= 4.30, Mhigher dynamism = 4.44, SDlower dynamism = 1.76, SDhigher dynamism = 1.75), and, as expected, neither in the male sample (p = .32*; Mlower dynamism = 4.70, Mhigher dynamism = 4.52, SDlower dynamism = 1.74, SDhigher dynamism = 1.68). The current data seem consistent with males apparently not being sensitive to the perceived movement of the logo and as such not showing effects on engagement nor attitude towards the brand (that is, within the framework of Cian and colleagues). Females on the other hand did seem to be sensitive to the perceived movement (d = .82) and showed effects on engagement (d = .44). However, further downstream effects on attitude towards the brand were not observed. Together the present results do not provide evidence for the main conclusion of Cian et al. (2014) that logo dynamism may have a positive effect on attitudes towards a brand.
5. Study 2. The effect of logo dynamism on engagement and attitudes: A second replication attempt of Cian et al.’s Study 2a (2014) with an online Chinese sample of participants. Although Study 1 was highly powered to detect a medium-‐sized effect of logo dynamism on attitudes toward the brand, in Study 2 an additional attempt was made to replicate the same study (i.e., Study 2a of Cian et al., 2014). In our second study we intended to keep the same power of .90 but lowered the already conservatively estimated effect-‐size of logo dynamism on attitudes (i.e., d = .50 in our Study 1 instead of the original effect-‐size of .65 observed by Cian et al.) to d = .40, which meant increasing the minimal required sample-‐size from 140 to 216 participants (or 108 per condition). In other words, in this second study we wished to increase the sensitivity of the experiment. Increasing the sample size also provided an opportunity to better examine the potential effects of gender as observed in our first study (i.e., the fact that we did observe effects of logo dynamism on perceived dynamism and engagement in the female population but not in the male population).
12
5.1. Method
Study 2 was identical to Study 1 with the following exceptions. First, participants were Chinese residents. Second, the study was conducted online using Qualtrics software. Third, the same nine items were translated from English into Chinese. The logos were exactly the same as those used in Study 1 (Figure 5).
There were two hundred and thirty-‐four participants (one hundred and forty-‐three female, 61.1%), again clearly meeting the required sample-‐size of 216 participants. The participants’ age ranged from 18 to 50 years (M = 26.2, SD = 4.54). Participants were randomly assigned to view one of the two logos. They were allowed to view the logo for as long as they wanted.
5.2. Results and Discussion
Data were again analyzed with SPSS Software and identical indexes of attitude (α = .96), engagement (α = .87), and dynamism (r = .90) were created.
Manipulation check: Perceived movement. An independent t-‐test showed that the two logos differed in level of perceived movement (p = .02*; Mlower dynamism = 4.89, Mhigher dynamism = 5.51, SDlower dynamism = 2.58, SDhigher dynamism = 2.24, d = .28), with higher logo dynamism leading to more perceived movement than lower logo dynamism, yet the effect-‐size was rather small.
Engagement toward the brand. Next, we conducted a similar analysis with engagement toward the brand as the dependent variable. Engagement did not show a significant effect of dynamism (p = .25*; Mlower dynamism
= 4.81, Mhigher dynamism = 5.00, SDlower dynamism = 2.17, SDhigher dynamism = 2.05). Attitudes toward the brand. A similar analysis with attitudes toward the brand as the dependent variable
did not show a significant effect of logo dynamism (p = .18*; Mlower dynamism = 5.29, Mhigher dynamism = 5.57, SDlower
dynamism = 2.49, SDhigher dynamism = 2.23). Further analyses. Next, given the observed effect of gender in Study 1, we again carried out a 2x2 between-‐
subjects ANOVA with logo dynamism (high/low) and gender as independent variables and perceived dynamism as the dependent variable. This analysis revealed no significant interaction effect of logo dynamism (high/low) and gender, F(1,230) = .49, p = .48. Although the interaction effect was not significant, contrary to Study 1, the effect of logo dynamism on perceived dynamism was actually somewhat larger in males (4.47 vs. 5.35; p = .047*) than in females (5.18 vs. 5.61; p = .14*).
Similar 2 x 2 ANOVA’s with engagement and attitudes toward the brand as dependent variables revealed no significant interaction effects of logo dynamism and gender (all F-‐values < 1). Furthermore independent t-‐tests looking at the effect of logo dynamism on engagement and attitudes, within the male and female sample separately, did not reveal any significant or even marginally significant effects (all p-‐values > .16*).
To conclude, consistent with Study 1, we found no significant effect of logo dynamism on attitudes toward the brand. Thus again, we failed to replicate the main finding of Cian, et al.’s Study 2a (2014). Furthermore, we did not observe an effect of logo dynamism on engagement as found by Cian and colleagues either.
While the results of Study 1 seemed to indicate that the manipulation of dynamism was only successful in female participants (with downstream effects on engagement, but not attitudes), this was not the case in the current study, on the contrary, the effect of logo dynamism on perceived dynamism even seemed to be somewhat stronger in the male participant group. Furthermore, no interaction effects of logo dynamism and gender were observed for perceived dynamism (the manipulation check), engagement, or attitudes toward the brand. 6. Study 3. Direction of movement and metaphorical congruence
Cian et al. (2014) found that a metaphorical match between forward (backward) movement and modernity (traditionalism) can enhance attitudes toward the brand. In Study 3, this metaphorical link between direction of movement and modernity, as observed in Cian et al.’s Study 4 (2014), was reassessed by again conducting a replication study. The study consisted of a 2 x 2 between-‐subjects design with movement direction of a silhouette of a human figure (left/backward vs. right/forward) and company description (modern vs. traditional) as independent variables, and attitude towards the brand as the dependent variable. Cian et al. (2014) observed a significant interaction effect of movement direction and company description on attitudes toward the brand, such that the brand was perceived more positive when the logo displayed a backward (i.e. left) moving figure

13
for a company described as traditional, and when it displayed a forward (i.e., right) moving figure for a company described as modern. 6.1. Method
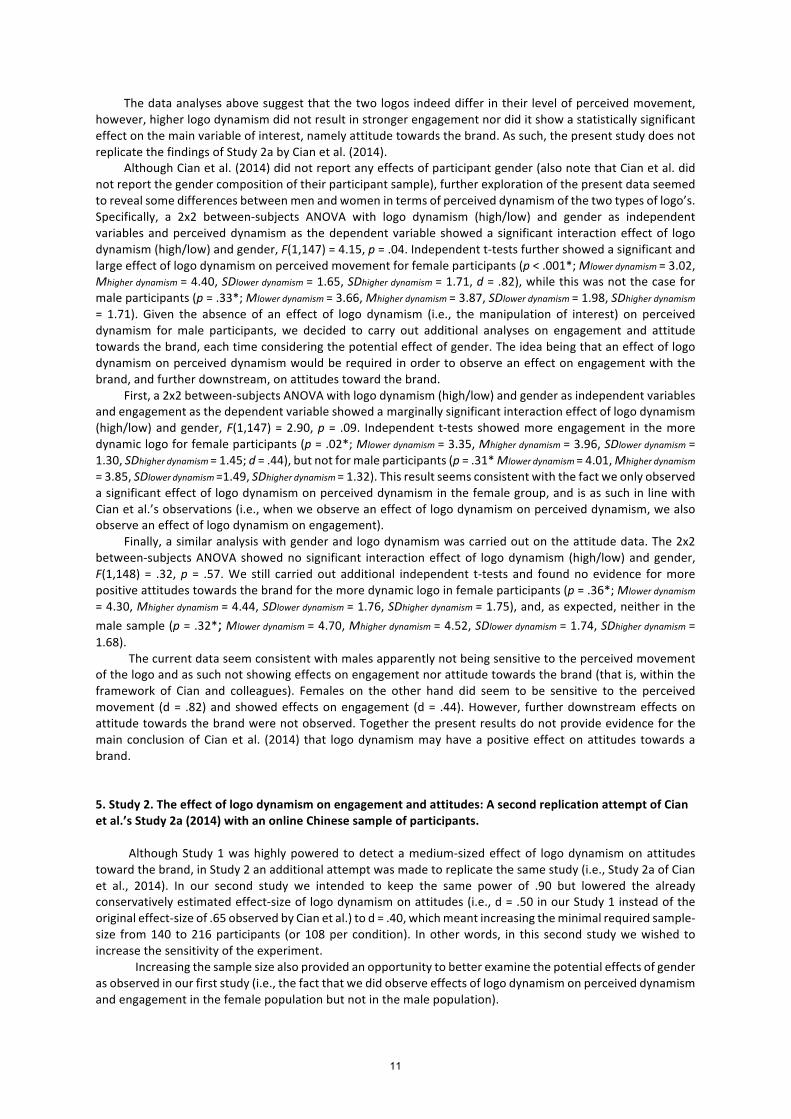
We used similar versions of a logo as used in Cian et al. (2014) for a fictitious fashion wool brand, “EE”. In two of these ads, the figure in the logo is shown in a pose suggesting movement from right to left (Figure 6, Panels A and D), which we defined as moving backward (cf. Cian et al., 2014). In the other two ads, the figure’s pose suggests movement from left to right (Figure 6, Panels B and C), which we defined as moving forward. As such, there were two versions of the logo which were identical except for the direction of the figure’s pose. The description of the company was either more traditional or modern, resulting in a 2 x 2 design.
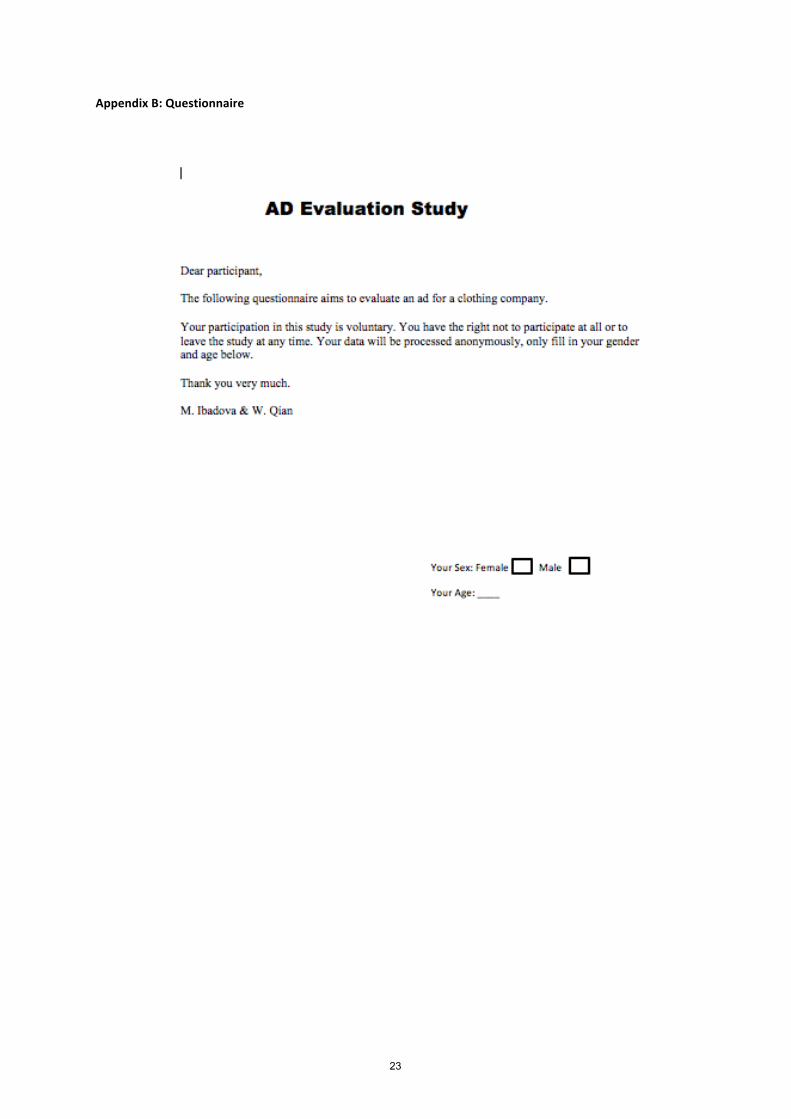
Similar to Cian et al.’s study (2014; Study 4), participants completed three items assessing the attitude towards the brand (i.e., “Please evaluate this logo.” 1 = ”bad/dislike/unpleasant”; 9 = ”good/like/pleasant”; also see Appendix B). The questionnaires were printed and handed out to the students who were taking an introductory psychology course. Students filled in the survey during class, this took approximately 5 minutes.
The original study of Cian et al. (2014; Study 4) included 117 participants (i.e., about 29 participants per condition). Cian and colleagues observed a significant interaction effect of movement direction and the company description. In particular, they observed a large and significant effect of movement direction on attitudes for the modern company description (p < .01 one-‐sided; forward = 6.58 vs. backward = 5.28; d = .80), and a medium (and marginally significant) effect for the traditional description (p = .07 one-‐sided; forward = 5.87 vs. backward = 6.62; d = .48). To determine our sample-‐size for the replication study, G*Power was used. Starting from a directional hypothesis (one-‐tailed) for the comparison in the modern company description and the originally observed effect-‐size of d = .80, with an alpha level set at .05, and a minimal power of .90, a minimal required sample-‐size of 28 participants in each condition was calculated. However, on the basis of the observed medium effect-‐size in the traditional description (a Cohen’s d of approximately .50), reaching the same minimal power of .90 would require 70 participants per condition. Thus ideally, a sample-‐size of 4 x 70, or 280 participants in total was required. Given the limited time-‐frame and limited access to participants, we knew in advance that this number of participants would not be reached, and instead aimed for a minimal sample-‐size of 29 participants per condition as in Cian et al. (2014). With this minimal sample-‐size, we reached .91 power to detect an effect of movement direction of similar size as the one found by Cian and colleagues for the modern company descriptions. For the traditional company descriptions this minimal sample-‐size implied only a power of .56 to detect an effect of similar size as that observed by Cian and colleagues (note that with this minimal sample-‐size the chance of observing an effect of similar size as that found by Cian et al. in the traditional conditions, assuming that it really exists with this magnitude, thus actually almost comes down to flipping a coin). In fact, one hundred and forty-‐three first-‐year international students from Bachelor of Business Administration at the University of Leuven participated in exchange for course credit, thus slightly exceeding this minimal sample-‐size of 4 x 29 or 126 participants. In fact, this meant that within the framework outlined above we achieved a (post hoc) power of respectively .95 for the modern company description (based on the assumption of d estimated at .80 and a directional hypothesis), and .65 for the traditional company description (based on the assumption d estimated at .50 and a directional hypothesis). Of the one hundred and forty-‐three students, seventy-‐nine were female, sixty-‐three male, one student did not provide gender information. Their ages ranged from 17 to 23 years (M = 19.0, SD = 1.40).
Participants were told that they would be rating a logo on several dimensions. Each participant was randomly assigned to view one of the four ads. They were allowed to view the logo for as long as they wanted. 6.2. Results and Discussion
Data were again analyzed with SPSS Software. An attitude index was created by averaging the 3 attitude items (α = .89). This index thus showed sufficient internal consistency.
A 2 x 2 between-‐subjects ANOVA with description (traditional, modern) and direction (forward, backward) as independent variables and attitude toward the logo as the dependent variable showed no significant interaction effect of description (traditional/modern) and direction (forward/backward), F(1,139) = .65, p = .42. Neither the main effect of movement direction or company description were significant (F-‐values < 1; p-‐values > .58). Independent t-‐tests further showed no significant effect of movement direction on attitude for the traditional description (p = .17*; Mbackward = 5.12, Mforward = 4.75, SDbackward = 1.64, SDforward = 1.64; d = .23), and this was also the case for the modern description (p = .42*; Mbackward = 4.75, Mforward = 4.82, SDbackward = 1.61, SDforward = 1.65; d = .04).

14
A: Backward Logo: Traditional Fashion Copy B: Forward Logo: Modern Fashion Copy
C: Forward Logo: Traditional Fashion Copy D: Backward Logo: Modern Fashion Copy
Fig. 6. Ads used in Study 3.
The data analyses above do not suggest that a metaphorical match between the logo’s movement direction
and the company description (i.e., forward and modern / backward and traditional) leads to more favorable attitudes toward the brand compared to a metaphorical mismatch (i.e., forward and traditional / backward and modern). As such, the present study does not replicate the findings of Study 4 by Cian et al. (2014).
Although Cian et al. (2014) did not report any effects of participant gender (also note that Cian et al. did not report the gender composition of their participant sample), given the observation of a gender effect in our Study 1, we decided to run an additional 2 x 2 x 2 between-‐subjects ANOVA with description (traditional, modern), movement direction (forward, backward), and gender as independent variables, and attitude as the dependent variable. First, the main effects of company description and movement direction were not significant (F-‐values < 1). The main effect of gender did not reach significance, F(1,134) = 2.62 , p = .11, although a weak tendency for males giving higher attitude scores was observed (4.68 vs. 5.11, d = .26). No other interaction effects involving company description, movement direction and/or gender proved significant (all p-‐values > .22).
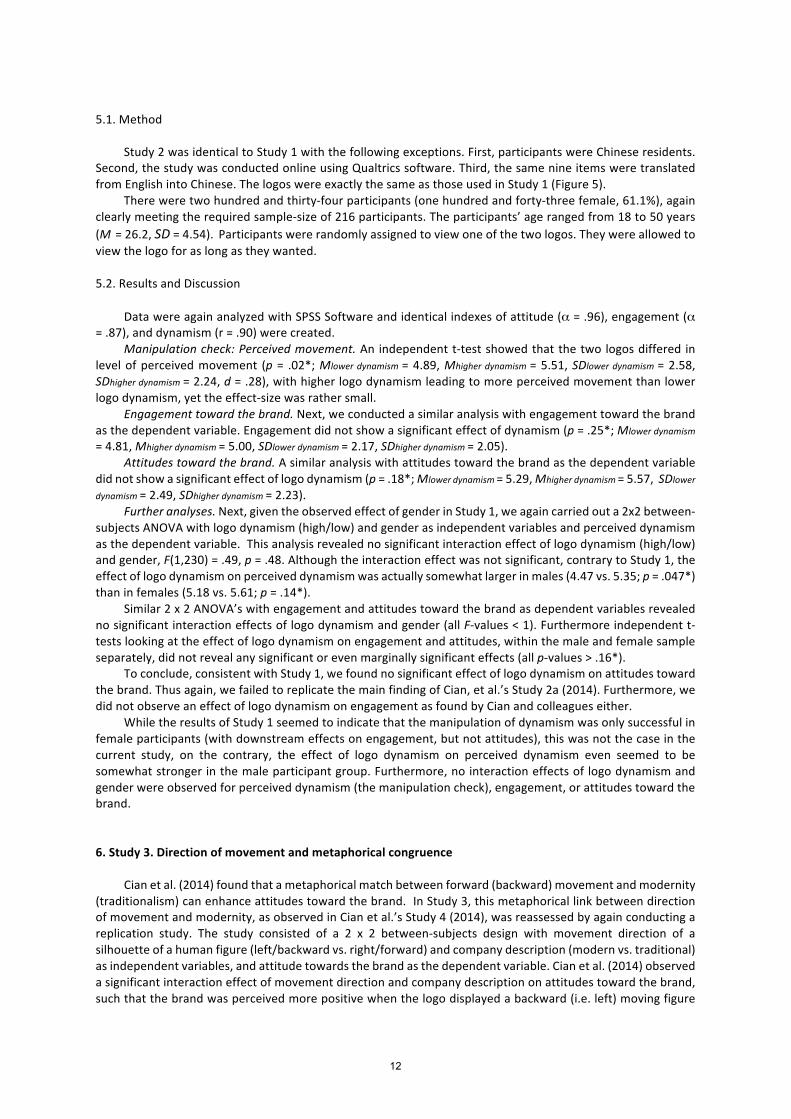
Coming back to our main finding that we do not replicate the metaphorical match effect, one needs to consider whether the absence of the effect in the present study may be due to some factors being different from those in Cian et al.’s original study (2014). First, we did not use the identical silhouette figure (see Figure 6 and Figure 7). But the reason is that I could not find the original image with high quality, and the silhouette figure I used is quite similar to the original one, so I don’t think this is the problem. Second, there may be cultural

15
differences within our sample, it is not necessary that in all cultures to the left means backward and to the right means forward, but there is no literature reference can prove this, so this should not be the reason.
A: Backward Logo: Traditional Fashion Copy B: Forward Logo: Modern Fashion Copy
C: Forward Logo: Traditional Fashion Copy D: Backward Logo: Modern Fashion Copy
Fig. 7. Original ads used in Cian et al.’s study.
7. General Discussion Across the three studies and compared with Cian et al.’s (2014) studies, we can conclude that we can not replicate their studies. Specifically, static visuals (e.g., brand logos) can generate perception of movement, but we can not confirm effects of logo dynamism on engagement and most importantly not on attitudes (Studies 1 and 2). Contrary to Cian et al.’s original finding (their Study 4), a metaphorical match of forward movement with modern brands and backward movement with traditional brands had no effect on attitudes toward the brand (our Study 3). To summarize, we did not replicate the original result. We also carried out additional analyses including gender as a variable which was not the case in Cian et al.’s studies. It showed a significant interaction effect of logo dynamism (high/low) and gender in Study 1, but not in Study 2 and Study 3. The current data is consistent with males apparently not being sensitive to the perceived movement of the logo and as such not showing effects on engagement nor attitude towards the brand (that is, within the framework of Cian and
16
colleagues), females on the other hand did seem to be sensitive to the perceived movement and showed effects on engagement (Study 1). There may be several reasons for why we did not observe significant effects in these replications. One possibility is that the attendants are not the same, Cian et al.’s experiments were done in U.S., but my experiments were conducted in Europe and China, there may be cultural differences among these participants. However, there’s no evidence showing that different cultures can influence the perception of logo dynamism/engagement/attitude. Another possibility is the questionnaire, Cian et al. just mention three factors(dynamism/engagement/attitude) for their questionnaire in the article, no exact question list. Since we don’t know the detail information about Cian et al.’s questionnaire, we just copied the three factors from the original questionnaire, and make up the questions by ourselves, so the exact questions were not totally the same. However, reliability analysis showed that questions in each factor were measuring exact the same thing for that factor, so the detail questions do not matter for the study. Of course there are many other possible explanations for why effects were found in the original study and not in the replication attempts, for example, small sample sizes of original studies. They just got 64 students for their Study 2a and 117 participants for their Study 4, but we had 153 participants for our study 1, 216 participants for our Study 2 and 143 participants for our Study 3. If they had more participants, the results of the original study may be different. Also, age differences could be another possibility, Cian et al. didn’t mention the mean age of their participants, but if we know the age of the participants from original study, we can invite participants with similar age, and results of our study may change. . However, it is important to emphasize that the current results do not suggest that there are no influences of engagement and attitudes, results may change if we enlarge our database. For instance, in Study 1, engagement is marginally significant (p = .09), but if we invited more participants (although my database is larger than the original one), which means the effect size can be bigger, engagement may be a significant variable. In short, we suggest more work is needed on this topic. The failure of this replication once again proves the replication crisis in science. How could this happen? As discussed before, it is possible that some research may have even been falsified, faking results is the biggest of sins. However, the file-‐drawer problem is more common, scientists choose not to report studies without significant results. Other questionable research practices (QRP’s) may be more serious than once believed (e.g., John, Loewenstein & Prelec, 2012). Such QRP’s include amongst others, failing to report all of a study’s dependent measures, deciding whether to collect more data after looking to see whether the results were significant, failing to report all of a study’s conditions, stopping collecting data earlier than planned because one found the result that one had been looking for, deciding whether to exclude data after looking at the impact of doing so on the results, etc. Regarding the file-‐drawer and QRP problems, what should we do in science in future? I strongly suggest the preregistration for every study, this ensures the publication of studies with non-‐significant results. The open data access is also recommended, this can ensure the pure transparency, people are able to check the accuracy of all the data with this access. Finally, the scientific publication pressure should be taken away, then the quality of publication will be improved. 8. References Aglioti, S., DeSouza, J., & Goodale, M. A. (1995). Size-‐contrast illusions deceive the eye but not the hand. Current
Biology, 5(6), 679-‐685. Anderson, M. (2010). Neural reuse: A fundamental organizational principle of the brain. Behavioral and Brain
Science, 33, 245-‐266. Bower, G. H. (1981). Mood and memory. American Psychologist, 36, 129-‐148. Callow, N., Roberts, R., & Fawkes, J. Z. (2006). Effects of dynamic and static imagery on vividness of imagery,
skiing performance, and confidence. Journal of Imagery Research in Sport and Physical Activity, 1(1), 1-‐13. Cian, L., Krishna, A., & Elder, R. S. (2014). This logo moves me: Dynamic imagery from static images. Journal of
Marketing Research, xx, 184-‐197. Clark, J., & Paivio, A. (1991). Dual Coding Theory and Education. Educational Psychology Review, 3 (3), 149–210. Deng, X. & Kahn, B. E. (2009). Is your product on the right side? The “location effect” on perceived product
heaviness and package evaluation. Journal of Marketing Research, 46, 725-‐38. Edell, A. J., & Staelin, R. (1983). The Information Processing of Pictures in Print Advertisements. Journal of
Consumer Research, xx , 45-‐61. Elder, R., & Krishna. A. (2010). The effect of advertising copy on sensory thoughts and perceived taste. The
Journal of Consumer Research, 36(5), 748-‐756.
17
Famous logo designs and how much did they cost? 2012, July 8. Retrieved from https://stocklogos.com/topic/famous-‐logo-‐designs-‐and-‐how-‐much-‐did-‐they-‐cost
Finn, A. (1988). Print Ad Readership Recognition Scores: An information Processing Perspective. Journal of Marketing Research, 25, 168-‐177.
Freyd, J. J. (1983). Representing the Dynamics of a Static Form. Memory & Cognition, 11(4), 342–46. González, J., Barros-‐Loscertales, A., Pulvermüller, F., Meseguer, V., Sanjuán, A., Belloch, V., et al. (2006). Reading
cinnamon activates olfactory brain regions. Neurolmage, 32(2), 906-‐912. Hagtvedt, H., & Patrick, V. M. (2008). Art infusion: The influence of visual art on the perception and evaluation
of consumer products. Journal of Marketing Research, 45(3), 379-‐389. Harshman, R. A., & Allan Paivio (1987). ‘Paradoxical’ Sex Differences in Self-‐Reported Imagery, Canadian Journal
of Psychology/Revue Canadienne de Psychologie, 41(3), 287– 302. Henderson, W. P., & Cote, A. J. (1998). Guidelines for Selecting or Modifying Logos. Journal of Marketing, 62,
14–30. Herbert, B., & Pollatos, O. (2012). The body in the mind: On the relationship between interoception and
embodiment. Topics in Cognitive Science, 4(4), 692-‐704. Hitt, J., & Blease, M. (2016, September 29). Building your sonic brand. The California Sunday Magazine, 22-‐23. Krishna, A. (2012). An integrative review of sensory marketing: Engaging the senses to affect perception,
judgment and behavior. Journal of Consumer Psychology, 22(3), 332-‐351. Huettl, V., & Gierl, H. (2012). Visual art in advertising: The effects of utilitarian vs. hedonic product positioning
and price information. Marketing Letters, 23(3), 893-‐904. Imram, N. (1999). The role of visual cues in consumer perception and acceptance of a food product. Nutrition &
Food Science, 99(5), 224-‐230. Janiszewski, C., & Meyvis, T. (2001). Effects of Brand Logo Complexity, Repetition, and Spacing on Processing
Fluency and Judgment. Journal of Consumer Research, 28(1), 18–32. Jarrett,C. (2016). Ten famous psychology findings that it’s been difficult to replicate. The British Psychology
Society. Retrieved from https://digest.bps.org.uk/2016/09/16/ten-‐famous-‐psychology-‐findings-‐that-‐its-‐been-‐difficult-‐to-‐replicate/
Kaspar,K., Krapp, V., & König, P. (2013). Emotions' Impact on Viewing Behavior under Natural Conditions. xxx Krishna, A. (2006). Interaction of senses: The effect of vision versus touch on the elongation bias. The Journal of
Customer Research, 32, 557-‐566. Krishna, A. (2010). Sensory marketing: Research on the sensuality of products. New York: Routledge. Krishna, A., Cian, L., & Sokolova, T. (2016). The power of sensory marketing in advertising. Current Opinion in
Psychology, 10, 142-‐147. Krishna, A., Lwin, M. O., & Morrin, M. (2010). Product scent and memory. The Journal of Customer Research,
37(1), 57-‐67. Lachman, R., Lachman, J. T., & Butterfield, E. C. (1979). Cognitive psychology and information processing.
Hillsdale, NJ: Erlbaum. Landau, M. J., Meier, B. P., & Keefer. L. A. (2010). A metaphor-‐enriched social cognition. Psychological Bulletin,
136, 1045-‐1067 Lee, S. W. S., & Schwarz, N. (2011, February). Something smells fishy here: Suspicion enhances identification of
a fishy smell, a fishy smell increases suspicion. Paper presented at the annual meeting of the Society for Consumer Psychology, Atlanta, GA.
Lynott, D., Corker, K. S., Wortman, J., Connell, L., Donnellan, M. B., …O’Brien, K. (2014). Replication of “Experiencing physical warmth promotes interpersonal warmth” by Williams and Bargh (2008). Social Psychology, 45(3), 216-‐222.
Matlin, M. W. (1971). Response competition, recognition, and affect. Journal of Personality and Social Psychology, 19(3), 295-‐300.
Meert, K., Pandelaere, M., & Patrick, V. M. (2014). Taking a shine to it: How the preference for glossy stems from an innate need for water. Journal of Consumer Psychology, 24(2), 195-‐206.
Mitchell, A., &Olson, J. (1981). Are product attribute beliefs the only mediator of advertising effects of brand attitude? Journal of Marketing Research, 18, 318-‐332.
Perracchio, L. A., & Meyers-‐Levy, J. (1994). How ambiguous cropped objects in ad photos can affect product evaluations. Journal of Consumer Research, 21, 190-‐204.
Pieters, R., & Wedel, M. (2004), Attention capture and transfer in advertising: brand, pictorial, and text-‐size effects. Journal of Marketing, 68, 36-‐50.
Pieters. R., Wedel. M., & Batra. R. (2010). The stopping power of advertising: measures and effects of visual complexity, Journal of Marketing, 74, 46-‐60.
18
Proffitt, D. R., Bhalla, M., Gossweiler, R., & Midgett, J. (1995). Perceiving geographical slant. Psychonomic Bulletin & Review, 2, 409-‐428.
Raghubir, P., & Greenleaf, E. A. (2006). Ratios in proportion: What should the shape of the package be? Journal of Marketing, 70(2), 95-‐107.
Ranehill, E., Dreber, A., Johannesson, M., Leiberg, S., Sul, S., & Weber, R. (2015). Assessing the robustness of power posing: no effects on hormones and risk taking in a large sample of men and women. Psychological Science, 26(5): 653-‐656.
Rebollar, R., Lidon, I., Serrano, A., Martin, J., & Fernandez, M. J. (2012). Influence of chewing gum packaging design on consumer expectation and willingness to buy. An analysis of functional, sensory and experience attributes. Food Quality and Preference, 24(1), 162-‐170.
Reed, C. L., & Vinson, G. N. (1996). Conceptual Effects on Representational Momentum. Journal of Experimental Psychology: Human Perception and Performance, 22(4), 839–50.
Rolls, E. T. (2005). Taste, olfactory, and food texture processing in the brain and the control of food intake. Physiology and Behavior, 85, 45-‐56.
Schechter, A. H. (1993). Measuring the Value of Corporate and Brand Logos. Design Management Journal, 4(1), 33–39.
Schwarz, N. (2012). Feelings-‐as-‐information theory. In P.A.M. Van Lange, A. Kruglanski, & Higgins E. T. (Eds), Handbook of theories of social psychology (pp. 289-‐308). Thousand Oaks, CA: Sage.
Schwarz, N., & Clore, G. L. (2007). Feelings and phenomenal experiences. In A. Kruglanski, & E.T. Higgins (Eds.), Social psychology. Handbook of basic principles (pp. 385-‐407) (2nd ed.). New York: Guilford.
Schwarz, N., Servay, W., & Kumpf, M. (1985). Attribution of arousal as a mediator of the effectiveness of fear-‐arousing communications. Journal of Applied Social Psychology, 15, 74-‐84.
Scott, L. M. (1994). Images in advertising: The need for a theory of visual rhetoric. Journal of Consumer Research, 21(2), 252-‐73.
Shalev, I. (2014). Implicit energy loss: Embodied dryness cues influence vitality and depletion. Journal of Consumer Psychology, 24(2), 260-‐270.
Shangri-‐La Hotels to use 'Essence of Shangri-‐La' scent in Lobbies. 2006, November 6. Retrieved from http://www.asiatraveltips.com/news06/69-‐ShangriLaHotels.shtml
Smith, E. R., & Semin, G. R. (2004). Socially situated cognition: Cognition in its social context. Advances in Experimental Social Psychology, 36, 53-‐117.
Snyder, A. (1993). Branding: Coming Up for More Air, Brandweek, 34 (December 6), 24–28. Simmons, W. K., Martin, A., & Barsalou, L. W. (2005). Pictures of appetizing foods activate gustatory cortices for
taste and reward. Cerebral Cortex, 15, 1602-‐1608. Stafford, M. R., Tripp, C., & Bienstock, C. C. (2004). The Influence of Advertising Logo Characteristics on Audience
Perceptions of a Nonprofit Theatrical Organization. Journal of Current Issues & Research in Advertising, 26(1), 37–45.
Strack, F., Martin, L. L., & Stepper, S. (1988). Inhibiting and facilitating conditions of the human smile: A nonobtrusive test of the facial feedback hypothesis. Journal of Personality and Social Psychology, 54, 768-‐777.
Thomas, N., & Mulligan, J. (1995). Dynamic Imagery in Children’s Representations of Number. Mathematics Education Research Journal, 7(1), 5–25.
Van der Lans, Ralf, Cote, A. J., Cole, C. A., Leong, M. S., … Henderson, W. P. (2009). Cross-‐ National Logo Evaluation Analysis: An Individual-‐Level Approach. Marketing Science, 28(5), 968–85.
Vartorella, William (1990). Doing the Bright Thing with Your Company Logo. Advertising Age, 61, 31. Vinson, N., & Reed, C. L. (2002). Sources of Object-‐Specific Effects in Representational Momentum. Visual
Cognition, 9, 41–65. Wagenmakers, J., Beek, T., Dijkhoff, L., & Gronau, Q. F. (2016). Effect of facial expression on emotional state
not replicated in multilab study. ScienceDaily, January 2, 2017. Williams, L. E., Huang, J. Y., & Bargh, J. A. (2009). The scaffolded mind: Higher mental processes are grounded in
early experience of the physical world. European Journal of Social Psychology, 39, 1257-‐1267. Wilson, M. (2002). Six views of embodied cognition. Psychonomic Bulletin and Review, 9, 625-‐636. Wolfe, J. M., Kluender, K.R., Levi, D. M., Bartoshuk, L. M., Herz, R. S., Klatzky, R. L., et al. (2006). Sensation &
perception. Sunderland, MA: Sinauer Associates. Woods, A. J., Philbeck, J. W., & Danoff, J. V. (2009). The various perceptions of distance: an alternative view of
how effort affects distance judgments. Journal of Experimental Psychology: Human Perception and Performance, 35, 1104–1117.

19
Wyer, R. S. (1974). Cognitive organization and change: An information processing approach. Hillsdale, NJ: Erlbaum.
Xu, A. J., & Labroo, A. (2014). Incandescent affect: Turning on the hot emotional system with bright light. Journal of consumer Psychology, 24(2), 207-‐216.
Zakia, D. R., & Nadin, M. (1987). Semiotics, advertising and marketing. Journal of Consumer Marketing, 4(2), 5-‐12.
Zatorre, R. J., & Halpern, A. R. (2005). Mental concerts: Musical imagery and auditory cortex. Neuron, 47, 9-‐12. Zhong, C., & Leonardelli, G. J. (2008). Cold and lonely: Does social exclusion literally feel cold? Psychological
Science, 19(9), 838-‐842.

20
Appendix A: Questionnaire

21

22
23
Appendix B: Questionnaire

24