3. linking assessment to instruction rti/mtss - three...
TRANSCRIPT

© 2006, Dynamic Measurement Group 1
Stephanie A. Stollar, Ph.D. Dynamic Measurement Group
DIBELS Next Updates
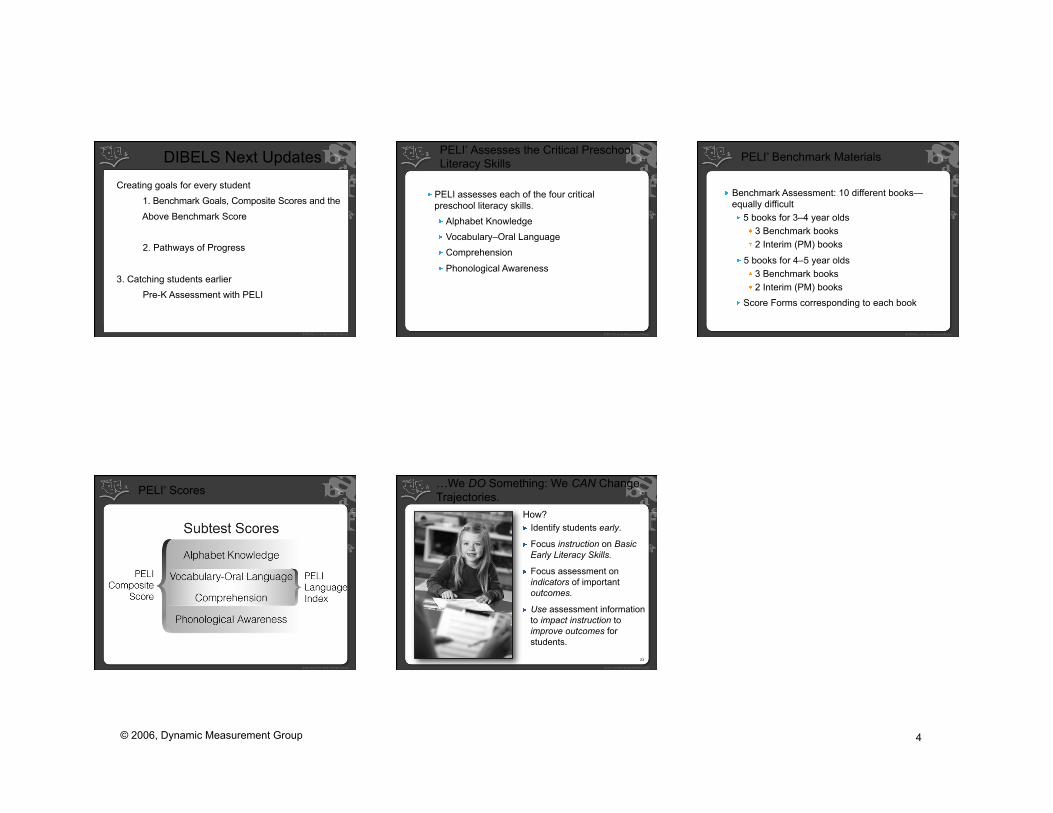
DIBELS Next Updates Creating goals for every student
1. Benchmark Goals, Composite Scores and the Above Benchmark Score 2. Pathways of Progress
3. Catching students earlier Pre-K Assessment with PELI
Prevention Focus
3
1 2 3 4 5 6 Grade
Grade 1 Cohort
Grade 2 Cohort
Grade 3 Cohort
Grade 4 Cohort
Grade 5 Cohort
Wor
ds P
er M
inut
e
Middle 10%
Low 10%
Good, R. H., Simmons, D. C., & Smith, S. B. (1998). Effective academic interventions in the United States: Evaluating and enhancing the acquisition of early reading skills. School Psychology Review, 27, 740-753. [Joint publication with Educational and Child Psychology.]
3. Linking Assessment to Instruction
4 *Word Use Fluency—Revised (WUF-R) is available as an experimental measure from http://dibels.org/.
RtI/MTSS - Three Tiers of Prevention
5
Continuum of services to provide support for 100% of students to reach benchmark goals
DIBELS Next Updates Creating goals for every student
1. Benchmark Goals, Composite Scores and the Above Benchmark Score

© 2006, Dynamic Measurement Group 2
DIBELS® Benchmark Goals
What is a Benchmark Goal? A research-based target score:
Represents the lowest level of performance on a measure that predicts reaching the next goal Consists of three parts: a basic early literacy skill, a level of performance, and a point in time
How are the Benchmark Goals derived? Based on longitudinal research examining how a score on a measure at a point in time predicts later reading outcomes
7
DIBELS Next Composite Scores
• A collection of scores on important measures
• Each component measure contributes equally
• The best overall predictor (start here)
• Good for seeing system growth over time
• What goes into DCS changes across grades and TOY, so...
Not used for: • deciding who needs help • what they need help on • which tier of support • how to group for the help • who needs progress monitoring • measuring individual student growth over time
Above Benchmark Zone
Purposes 1. A higher goal for which typical and high achieving
students/schools can aim 2. Reinforce that the benchmark goal represents the
lowest level of being on-track to reach future goals – and that a higher score is better
3. Enhance the prediction to state tests
Above Benchmark Zone Design Specifications
Above Benchmark Zone Score on the measure is at or above the 60th percentile according to the 2012-2013 DIBELS Next® national norms. 1. For students who earn scores Above Benchmark,
approximately 90% to 99% will achieve At or Above Benchmark status on subsequent benchmark assessments.
2. For students who earn scores Above Benchmark, approximately 60% to 70% will achieve Above Benchmark status on subsequent benchmark assessments.
3. For students who earn scores just Above Benchmark, the logistic regression probability for achieving later outcomes is approximately 80% to 95%.
DIBELS Next Benchmark Goals
11
If a student achieves a Benchmark Goal, the odds are in favor of that student achieving later reading outcomes.
At Benchmark: Odds are generally 70% to 85%
Well Below Benchmark: Odds are generally 10% to 20%
Below Benchmark: Odds are generally 40% to 60%
Above Benchmark: Odds are generally 90% to 99%
At/Above Benchmark: Odds are generally 80% to 90%
Prediction to State Tests
12

© 2006, Dynamic Measurement Group 3
DIBELS Next Updates Creating goals for every student
1. Benchmark Goals, Composite Scores and the Above Benchmark Score 2. Pathways of Progress
DIBELSnet Pathways of Progress Goal Setting
14
What is Pathways of Progress?
Pathways of Progress is a tool for: (a) setting student progress monitoring goals (BOY) (b) evaluating student progress (MOY & EOY) (c) evaluating system level progress (MOY & EOY)
DIBELS® for Accountability Decisions Use Manual8
The rate of progress that is:
• Possible with an effective, research-based intervention
• Typical or expected relative to other students with similar initial skills
Logic Behind Pathways of ProgressBased on the performance of students in over 1,000 classrooms in the DIBELSnet data system, the scores
at the 20th, 40th, 60th and 80th percentiles serve as boundaries for establishing five Pathways of Progress
across the school year. We start by measuring the student’s beginning-of-year DIBELS Next Composite
Score. From here, we can target the end-of-year DIBELS Next Composite Score for each of five Pathways.
The Pathway above the 80th percentile rank would be described as Well Above Typical Progress. Each
Pathway, its corresponding percentile range, and its descriptor are shown in Figure 2. Figure 3 provides an
illustration of how Pathways might be shown on a student’s progress monitoring booklet.
Figure 2. Pathways of Progress Descriptors
PathwayNumber
PathwayDescriptor
ProgressDescriptor
ProgressPercentile Range
WELL ABOVE TYPICAL
ABOVE TYPICAL
TYPICAL
BELOW TYPICAL
WELL BELOW TYPICAL
80th percentile and above
60th to 79th percentile
40th to 59th percentile
20th to 39th percentile
Below 20th percentile
5
4
3
2
1
Pathways of ProgressTM Descriptors
16
©2016 Dynamic Measurement Group
Pathways Classroom Report
17
DIBELS Next
School: Mockingbird Elementary SchoolGrade: Fourth Grade, Middle of YearYear: 2017-2018Class: Mock Grade4b
© 2018 Dynamic Measurement Group, Inc. | Printed on January 27, 2018 Page 1
Pathways of ProgressTM Report
BEGINNING OF YEARAll pathways are based on thebeginning-of-year composite score.
MIDDLE OF YEARCOMPONENT SCORE PATHWAYS
Component score pathways arecompared to other students with thesame beginning-of-year compositescore.
To support overall reading proficiency,more growth is needed in a student'sareas of relative weakness.
MIDDLE OF YEAROVERALL PATHWAY
A student's overall pathway is based onthe student's middle-of-year compositescore compared to other students withthe same beginning-of-year compositescore.
At or Above Benchmark / Likely to Need Core Support
Below Benchmark / Likely to Need Strategic Support
Well Below Benchmark / Likely to Need Intensive Support
Rate of progress compared to students with similar initial skills:
WELL ABOVE TYPICALABOVE TYPICAL
TYPICALBELOW TYPICAL
WELL BELOW TYPICAL
5
4
3
2
1
BEGINNING OF YEAR MIDDLE OF YEARCOMPONENT SCORE PATHWAYS
MIDDLE OF YEAROVERALL PATHWAY
Name
DIBELSCompositeScore
DORFWordsCorrectScore Pathway
DORFAccuracyScore Pathway
DORFRetellScore Pathway
DazeAdjustedScore Pathway
DIBELSCompositeScore Pathway
Daringdon, Damian 229 79 2 96% 3 10 1 12 3 235Deeptaupedal, Darin 29 43 5 90% 5 28 5 3 3 151Diamonddev, Dane 246 138 5 92% 1 16 1 26 5 330Reservedrug, Ronny 291 116 4 97% 3 29 3 18 4 342Spunkysub, Sachiko 170 51 1 96% 4 25 3 9 2 225Succinctsad, Shantel 301 70 1 96% 2 22 1 16 3 266Wheatwiz, Wynell 417 135 2 98% 2 46 3 24 3 427Xanaduxenic, Xavier 408 153 4 99% 3 14 1 21 2 377
mCLASS EOY Class Summary
Goal Set by Teacher
Actual PathwayAchieved
18
© 2006, Dynamic Measurement Group 4
DIBELS Next Updates Creating goals for every student
1. Benchmark Goals, Composite Scores and the Above Benchmark Score 2. Pathways of Progress
3. Catching students earlier Pre-K Assessment with PELI
PELI® Assesses the Critical Preschool Literacy Skills
PELI assesses each of the four critical preschool literacy skills. Alphabet Knowledge Vocabulary–Oral Language Comprehension
Phonological Awareness
PELI® Benchmark Materials
Benchmark Assessment: 10 different books— equally difficult 5 books for 3–4 year olds
3 Benchmark books 2 Interim (PM) books
5 books for 4–5 year olds 3 Benchmark books 2 Interim (PM) books
Score Forms corresponding to each book
PELI® Scores
23
…We DO Something: We CAN Change Trajectories.
How? Identify students early.
Focus instruction on Basic Early Literacy Skills.
Focus assessment on indicators of important outcomes.
Use assessment information to impact instruction to improve outcomes for students.