3 h o u s e h o l d s ’ c h o i c e s - econ100 · consumer equilibrium, 151 ... utility and...
TRANSCRIPT

h o u s e h o l d s ’c h o i c e s
c h a p t e r 7
utility and demandWhat shapes an individual’s demand? Why is demand
elastic for some goods and inelastic for others?
c h a p t e r 8
possibilities, pre f e rences, andc h o i c e s
How can we predict the effects of changes in pricesand incomes on what people buy, how much they
work, and how much they borrow and lend?
3
3

ut i l i ty and
d e m a n d
3
3 O B J E C T I V E S
After studying this chapter, you will be able to:
mt Explain the relationship between individualdemand and market demand
mt Describe the budget constraint and identify itsimpact on household choices
mt Understand how the concepts of total andmarginal utility are used to define preferences,another determinant of household choices
mt Explain how consumers make choices bymaximizing their utility (called the marginal utilitytheory)
mt Use the marginal utility theory to predict theeffects of changing prices and income
mt Appreciate the criticisms of marginal utilitytheory
mt Understand how to calculate consumer surplus,and how to explain the paradox of value

Consumer equilibrium, 151
Diminishing marginal utility, 149
Marginal utility, 149
Marginal utility per dollar spent, 151
Utility, 148
Value, 158
K E Y T E R M S
K E Y F I G U R ES A N D TA B L E S
mn Figure 7.1 Individual and Market Demand Curves, 147
mn Figure 7.2 Consumption Possibilities, 148
mn Figure 7.3 Total Utility and Marginal Utility, 150
mn Figure 7.4 Equalizing the Marginal Utility per Dollar Spent, 153
mn Figure 7.5 A Fall in the Price of Movies, 154
mn Figure 7.6 A Rise in the Price of Soft Drink, 155
mn Figure 7.7 Consumer Surplus, 159
mn Table 7.3 Maximizing Utility by Equalizing Marginal Utilities per DollarSpent, 152
mn Table 7.7 Marginal Utility Theory, 157

I N D I V I D UAL DEMAND AND MARKET DEMAND
The total quantity demanded of a good at aparticular price in a market will be made up of thequantities demanded by all the individuals who arebuying at that price. This means that the marketdemand curve is related to individual demandcurves. This connection is important to understandbecause market demand curves matter for pricedetermination but their features depend on those ofthe individual demand curves. Later in this chapterwe’ll spend more time on the determinants of anindividual’s demand curve.
The table in Fig. 7.1 illustrates the relationshipbetween individual demand and market demand. Inthis example, Lisa and Alex are the only people inthe market. The market demand is therefore thetotal demand of Lisa and Alex. At $3 a movie, Lisademands 5 movies and Alex 2, so that the totalquantity demanded by the market is 7 movies.Similarly, at a higher price, say $4, Lisa demands 4movies and Alex 1, so total demand is 5 movies.The market demand is formed by adding togetherthe individual demands.
Figure 7.1 illustrates the relationship betweenindividual and market demand curves. Part (c)plots the market demand at each price. It is thesum of the demand curves of Lisa and Alex. Lisa’sdemand curve for movies in part (a) and Alex’s inpart (b) sum horizontally to the market demandcurve in part (c).
W H AT IS THE RELATIONSHIP BETWEEN
I N D I V I D UAL AND MARKET DEMAND?
n Market demand is the relationship between thetotal quantity of a good demanded and its price.
n Individual demand is the relationship between thequantity of a good demanded by a single individualand its price.
n The market demand curve is the horizontal sum ofthe individual demand curves formed by adding thequantities demanded by each individual at each price.
HOUSEHOLD CONSUMPTIONC H O I C E S
The next step is to investigate an individualdemand curve. We do this by studying how a singlehousehold makes its consumption choices.
P A R T 3 H O U S E H O L D S ’ C H O I C E S
146
We need water to live. We don’t need diamonds for much besides decoration. Ifthe benefits of water far outweigh the benefits of diamonds, why, then, does watercost practically nothing while diamonds are terribly expensive?
When OPEC restricted its sale of oil in 1973, it created a dramatic rise in price,but people continued to use almost as much oil as they had before. Our demand
for oil was inelastic. But why?
In 1985, soon after CD players first became available, the price tag was $650 — morethan $1,000 in today’s money — and consumers were reluctant to buy them. Since then,the price has decreased dramatically, and people are buying them in enormous quantities.Our demand for CD players is elastic. What makes the demand for some things elasticwhile the demand for others is inelastic?
Over the past decade, after removing the effects of inflation, incomes have increased by35 per cent. Over that same period, expenditure on food has increased by 26 per cent,while expenditure on health has increased by 55 per cent. The proportion of incomespent on health has increased and the proportion spent on food has decreased. Why, asincomes rise, does the pro p o rtion of income spent on some goods rise and on others fall?
In the last three chapters, we’ve seen that demand has an important role in thedetermination of prices. But we have not analysed what exactly shapes a person’sdemand. This chapter does that. In doing so, it also explains why demand is elastic forsome goods and inelastic for others, and why the prices of some things, such asdiamonds and water, are so out of proportion to their benefits.

A household’s consumption choices aredetermined by many factors, but we can summarizeall of these factors under two concepts:n Budget constraintn Preferences
BUDGET CONSTRAINTA household’s consumption choices are constrainedby its income and by the prices of the goods andservices it buys. Households have a given amountof income to spend and cannot influence the pricesof the goods and services they buy. Householdstake prices as given.
The limits to a household’s consumption choicesare described by its budget line. To make theconcept of the household’s budget line as clear aspossible, we’ll consider the example of Lisa, whohas an income of $30 a month to spend. She buystwo goods — movies and soft drink. Movies cost$6 each; soft drink costs $3 a litre. If Lisa spendsall of her income, she will reach the limits to herconsumption of movies and soft drink.
In Fig. 7.2, each row of the table shows anaffordable way for Lisa to consume movies andsoft drink. Row a indicates that she can buy 10litres of soft drink and see no movies. You can seethat this combination of movies and soft drinkexhausts her monthly income of $30. Row f saysthat Lisa can watch 5 movies and have no softdrink — another combination that exhausts the$30 available. Each of the other rows in the tablealso exhausts Lisa’s income. (Check that each ofthe other rows costs exactly $30.) The numbers inthe table define Lisa’s consumption possibilities.We can graph Lisa’s consumption possibilities aspoints a to f in Fig. 7.2.
Lisa’s budget line is a constraint on her choices.It marks the boundary between what is affordableand what is unaffordable. She can afford all thepoints on the line and inside it. She cannot affordpoints outside the line. The constraint on herconsumption depends on prices and on her income,and the constraint changes when prices and herincome change.
C H A P T E R 7 U T I L I T Y A N D D E M A N D
147
FIGURE 7.1
Ind ividual and Market Demand Cur ve s
Price ofa movie Quantity of movies demanded(dollars) Lisa Alex Market
7 1 0 16 2 0 25 3 0 34 4 1 53 5 2 72 6 3 9
The table and diagram illustrate how the quantity of moviesdemanded varies as the price of a movie varies. In the table, themarket demand is the sum of the individual demands. Forexample, at a price of $3, Lisa demands 5 movies and Alexdemands 2 movies, so the total quantity demanded in themarket is 7 movies. In the diagram, the market demand curveis the horizontal sum of the individual demand curves. Thuswhen the price is $3, the market demand curve shows that thequantity demanded is 7 movies, the sum of the quantitiesdemanded by Lisa and Alex.

FIGURE 7.2
Consumption Po s s i b i l i t i e s
Movies Soft drinkExpenditure Expenditure Total
Quantity (dollars) Litres (dollars) expenditure
a 0 0 10 30 30b 1 6 8 24 30c 2 12 6 18 30d 3 18 4 12 30e 4 24 2 6 30f 5 30 0 0 30
Six possible ways of allocating $30 to movies and soft drinkare shown as the rows a to f in the table. For example, Lisacan buy 2 movies and 6 litres (row c). Each row shows thecombinations of movies and soft drink that cost $30. Thesepossibilities are points a to f in the figure. The line throughthose points is a boundary between what Lisa can afford andcannot afford. Her choices must lie inside the orange area oralong the line af.
H OW DOES THE BUDGET CONSTRAINT
AFFECT HOUSEHOLD CHOICES?
n A household’s consumption choices are constrainedby its income and by the prices of the goods andservices it buys.
n This constraint is described by its budget line.n The budget line marks the boundary between what
is affordable and what is unaffordable.
UTILITY AND PREFERENCES
The other determinant of household choices ispreferences. Preferences are used to answerquestions such as: ‘How does Lisa divide her $30between these two goods?’ The answer depends onher likes and dislikes — on her preferences.
The benefit or satisfaction that a person getsfrom the consumption of a good or service is calledutility. But what exactly is utility and in what unitscan we measure it? This question is the topic ofthis section, and in the next we’ll see how theconcept of utility can be used to explain howconsumers make choices.
T E M P E R ATURE — AN ANALOGYUtility is an abstract concept and its units arearbitrary. Temperature is an abstract concept andthe units of temperature are arbitrary. You knowwhen you feel hot and you know when you feelcold. But you can’t observe temperature. You canobserve water turning to steam if it’s hot enough orturning to ice if it’s cold enough. You can constructan instrument, called a thermometer, that will tellyou how hot or cold it is. The scale on thethermometer is what we call temperature. But theunits in which we measure temperature arearbitrary. For example, we can accurately predictthat when a Celsius thermometer shows atemperature of 0°, water will turn to ice. But theunits of measurement do not matter because thissame event also occurs when a Fahrenheitthermometer shows a temperature of 32°.
The concept of utility helps us make predictionsabout consumption choices in much the same waythat the concept of temperature helps us makepredictions about physical phenomena. It has to beadmitted, though, that the theory which does thisis not as precise as the theory that enables us topredict when water will turn to ice or steam.
TOTAL UTILITYTotal utility is the total benefit or satisfaction thata person gets from the consumption of goods andservices. Total utility depends on the person’s levelof consumption — more consumption gives moretotal utility. Table 7.1 shows Lisa’s total utilityfrom consuming different quantities of movies andsoft drink. If she sees no movies, she gets no utilityfrom movies. If she sees 1 movie in a month, shegets 50 units of utility. As the number of movies
P A R T 3 H O U S E H O L D S ’ C H O I C E S
148

TA B L E 7 . 1
L i s a ’s Total Uti l ity from Movies and Soft Drink
Movies Soft drinkQuantity Litres
per month Total utility per month Total utility
0 0 0 01 50 1 752 88 2 1173 121 3 1534 150 4 1815 175 5 2066 196 6 2257 214 7 2438 229 8 2609 241 9 276
10 250 10 291
she sees in a month increases, her total utilityincreases so that if she sees 10 movies a month, shegets 250 units of total utility. The other part of thetable shows Lisa’s total utility from soft drink. Ifshe drinks no soft drink, she gets no utility. As theamount of soft drink she consumes rises, her totalutility increases.
MARGINAL UTILITYMarginal utility is the change in total utilityresulting from a one-unit increase in the quantityof a good consumed. The table in Fig. 7.3 showsthe calculation of Lisa’s marginal utility of movies.When her consumption of movies increases from 4to 5 movies a month, her total utility from moviesincreases from 150 units to 175 units. Thus forLisa, the marginal utility of seeing a fifth movieeach month is 25 units. Notice that marginal utilityappears midway between the quantities ofconsumption. It does so because it is the change inconsumption from 4 to 5 movies that produces themarginal utility of 25 units. The table displayscalculations of marginal utility for each level ofmovie consumption.
Figure 7.3(a) illustrates the total utility that Lisagets from movies. As you can see, the more moviesLisa sees in a month, the more total utility she gets.Part (b) illustrates her marginal utility. This graphtells us that as Lisa sees more movies, the marginalutility that she gets from watching moviesdecreases. For example, her marginal utility fromthe first movie is 50 units, from the second, 38
units, and from the third, 33 units. We call thisdecrease in marginal utility as the consumption ofa good increases the principle of diminishingmarginal utility.
Figure 7.3 illustrates an important relationshipbetween total and marginal utility. Marginal utilityis equal to the slope of the total utility curve. Asthe total utility curve becomes flatter at the top inpart (a), and its slope declines, the marginal utilityalso falls. At low levels of consumption, when thetotal utility curve is steeper, the marginal utility ishigher. This relationship between marginal andtotal values is not unique to utility. We will discoverit again in other settings — for example, indeterminants of costs of production in Chapter 10.
Marginal utility is positive but generallydiminishes as the consumption of a good increases.Why does marginal utility have these two features?In Lisa’s case, she likes movies, and the more shesees the better. That’s why marginal utility ispositive. The benefit that Lisa gets from the lastmovie seen is its marginal utility. To see whymarginal utility diminishes, think about how you’dfeel in the following two situations. In one, you’vejust been studying for 29 evenings in a row. Anopportunity arises to see a movie. The utility youget from that movie is the marginal utility fromseeing one movie in a month. In the secondsituation, you’ve been on a movie binge. For thepast 29 nights, you have not even seen anassignment or a test. You are up to your eyeballs inmovies. You are happy enough to go to a movie onyet one more night. But the thrill that you get outof that 30th movie in 30 days is not very large. Itis the marginal utility of the 30th movie in amonth and is less than the marginal utility of your29th trip to the movies.
H OW CAN PREFERENCES BE
DESCRIBED BY UTILITY?
n Consumers’ preferences are described by using theconcept of utility — the total benefit or satisfactionthat a consumer gets from a good or service.
n The greater the quantity of a good consumed, thehigher is the total utility from consuming that good.
n As the quantity of a good consumed increases, themarginal utility from consuming that good decreases— the principle of diminishing marginal utility.
n Utility is an abstract concept and its units ofmeasurement are arbitrary.
C H A P T E R 7 U T I L I T Y A N D D E M A N D
149

MAXIMIZING UTILITY
Now that we’ve defined utility and examined itsmeasurement, we can apply the concept to thequestion of how households make choices.Households consume the quantities of goods andservices that maximize total utility. A household’sincome and the prices it faces limit the utility thatit can obtain. In making choices, households haveto take into consideration the income available forspending and the prices faced.
Lisa allocates her spending between movies andsoft drink to maximize her total utility. To see howshe does that, we’ll continue to assume that movies
cost $6 each, soft drink costs $3 a litre, and Lisahas $30 a month to spend.
THE UTILITY-MAXIMIZING CHOICE
To calculate how Lisa spends her money if shemaximizes her total utility, make a table like theone shown in Table 7.2. The table shows all Lisa’saffordable combinations of movies and soft drink,together with the total utility she gets from eachcombination.
The table shows the same affordablecombinations of movies and soft drink found onLisa’s budget line in Fig. 7.2. It records, first, thenumber of movies consumed and the total
P A R T 3 H O U S E H O L D S ’ C H O I C E S
150
FIGURE 7.3
Total Util ity and Marginal Ut il i ty
Total MarginalQuantity utility utility
1 50 502 88 383 121 334 150 295 175 25
The table shows that as Lisa’s consumption of mov i e sincreases, so does the utility she derives from movies. Thetable also shows her marginal utility — the change in utilityresulting from the last movie seen. Marginal utility declines asconsumption increases. Lisa’s utility and marginal utility from
movies are graphed in the figure. Part (a) shows total utility. Italso shows the extra utility gained from each additional movie— marginal utility — as a bar. Part (b) shows the diminishingmarginal utility from movies by placing the bars shown in part(a) side by side in declining steps.

utility derived from them (the left side of the table);second, the number of litres of soft drink consumedand the total utility derived from them (the rightside); and third, the total utility derived from bothmovies and soft drink (the middle column).
In the first row of Table 7.2, Lisa watches nomovies and buys 10 litres of soft drink. In thiscase, she gets no utility from movies and 291 unitsof total utility from soft drink. Her total utilityfrom movies and soft drink (the centre column) is291 units. The rest of the table is constructed inthe same way.
The consumption of movies and soft drink thatmaximizes Lisa’s total utility is highlighted in thetable. When Lisa consumes 2 movies and 6 litres ofsoft drink, she gets 313 units of total utility. This isthe best Lisa can do given that she has only $30 tospend and given the prices of movies and litres. Ifshe buys 8 litres of soft drink, she can see only 1movie and gets 310 units of total utility, 3 less thanthe maximum attainable. If she sees 3 movies anddrinks only 4 litres, she gets 302 units of totalutility, 11 less than the maximum attainable.
What we’ve just described is a consumerequilibrium. A consumer equilibrium is asituation in which a consumer has allocated his orher income in the way that maximizes total utility.
In finding Lisa’s consumer equilibrium, wemeasured her total utility from the consumption ofmovies and soft drink. There is a better way ofdetermining a consumer equilibrium, which doesnot involve measuring total utility at all. Let’s lookat this alternative, which is called the marginalutility theory of consumer choice.
E Q UALIZING MARGINAL UTILITY PERDOLLAR SPENTLisa has money to spend on movies and soft drink.Movies cost $6 each. Soft drink costs $3. Is itworth giving up a movie in order to buy two softdrinks? Lisa will do that if the utility gained fromthe extra soft drink exceeds that lost on the movies.Lisa is asking the question — can I reallocate mybudget to raise more utility? The answer dependson the utility yielded from Lisa’s budget dollars intheir different uses. The yield of utility from adollar of Lisa’s budget depends on two things: themarginal utility of the good bought, and thenumber of units of a good which can be bought.The second of these, the number of units whichcan be bought, depends on the price of the good.
TA B L E 7 . 2
L i s a ’s Affo rd a ble Combinat ions o f Movies and
Soft Dr ink
Total utilityMovies from movies Soft drink
Quantity Total utility and soft drink Total utility Litres
0 0 291 291 101 50 310 260 82 88 313 225 63 121 302 181 44 150 267 117 25 175 175 0 0
Important variables in this approach todetermining a consumer equilibrium are thereforemarginal utility and price. They are combined inthe following general rule. The allocation thatmaximizes a consumer’s total utility is the one thatmakes the marginal utility per dollar spent on eachgood equal for all goods. The marginal utility perdollar spent is the marginal utility obtained fromthe last unit of a good consumed divided by theprice of the good. For example, Lisa’s marginalutility from consuming the first movie is 50 unitsof utility. The price of a movie is $6, which meansthat the marginal utility per dollar spent on moviesis 50 units divided by $6, or 8.33 units of utilityper dollar.
Total utility is maximized when all the consumer’sincome is spent and when the marginal utility perdollar spent is equal for all goods. Lisa maximizestotal utility when she spends all her income andconsumes movies and soft drink such that
Marginal utility Marginal utility0from movies0 5 0from soft drink0Price of movies Price of soft drink
Call the marginal utility from movies MUm, themarginal utility from soft drink MUs, the price ofmovies Pm, and the price of soft drink Ps. ThenLisa’s utility is maximized when she spends all herincome and when
}MPU
m
m} 5 }MPU
s
s}
Let’s use this formula to find Lisa’s utility-maximizing allocation of her income.
Table 7.3 sets out Lisa’s total and marginalutilities per dollar spent for both movies and soft
C H A P T E R 7 U T I L I T Y A N D D E M A N D
151

drink. For example, in row b Lisa’s marginal utilityfrom the first movie is 50 units and, since moviescost $6 each, her marginal utility per dollar spenton movies is 8.33 units per dollar (50 units dividedby $6). When Lisa is consuming 8 litres of softdrink, her marginal utility is 17 units. This is theextra utility gained from increasing soft drinkconsumption from 7 to 8 units — that is, thedifference between 260 and 243 units of utility.(These numbers are found from Table 7.1 and areshown in brackets in the marginal utility columnfor movies in Table 7.3.) The marginal utility perdollar spent on soft drink is then 5.67 (17 unitsdivided by $3).
Each row in Table 7.3 contains an allocation ofLisa’s income that uses up her $30. You can seethat Lisa’s marginal utility per dollar spent on eachgood, like marginal utility itself, decreases asconsumption of the good increases.
Total utility is maximized when the marginalutility per dollar spent on movies is equal to themarginal utility per dollar spent on soft drink —possibility c, where Lisa consumes 2 movies and 6litres — the same allocation as we calculated inTable 7.2.
Figure 7.4 shows why the rule ‘equalizemarginal utility per dollar spent on all goods’works. Suppose that instead of consuming 2movies and 6 litres (possibility c), Lisa consumes 1movie and 8 litres (possibility b). She then gets8.33 units of utility from the last dollar spent on
movies and 5.67 units from the last dollar spent onsoft drink. In this situation it pays Lisa to spendless on soft drink and more on movies. If shespends a dollar less on soft drink and a dollarmore on movies, her total utility from soft drinkdecreases by 5.67 units and her total utility frommovies increases by 8.33 units. Lisa’s total utilityincreases if she spends less on soft drink and moreon movies.
Or, suppose that Lisa consumes 3 movies and 4litres of soft drink (possibility d). In this situation,her marginal utility per dollar spent on movies isless than her marginal utility per dollar spent onsoft drink. Lisa can now get more total utility bycutting her spending on movies and increasing herspending on soft drink.
UNITS OF UTILITYThe calculations of the utility-maximizingallocation of income in Table 7.3 and Fig. 7.4 havebeen performed using marginal utility and price. Bymaking the marginal utility per dollar spent equalfor both goods, we know that Lisa has maximizedher total utility.
This way of viewing maximum utility isimportant; it means that the units in which utilityis measured do not matter. We could double orhalve all the numbers measuring utility, or multiplythem by any other positive number, or squarethem, or take their square roots. None of thesetransformations of the units used to measure utility
P A R T 3 H O U S E H O L D S ’ C H O I C E S
152
TA B L E 7 . 3
Maximizing Util i ty by Equal izing Marg inal Util i t ies per Dollar Spent
Movies ($6 each) Soft drink ($3 per litre)
Total Marginal Marginal utility Total Marginal Marginal utilityQuantity utility utility per dollar spent Litres utility utility per dollar spent
a 0 0 0 10 291 15 5.00(= 291–276)
b 1 50 50 8.33 8 260 17 5.67(= 260–243)
c 2 88 38 6.33 6 225 19 6.33(= 225–206)
d 3 121 33 5.50 4 181 28 9.33(= 181–153)
e 4 150 29 4.83 2 117 42 14.00(= 117–75)
f 5 175 25 4.16 0 0

FIGURE 7.4
Equa liz ing the Marg inal Util ity per Dollar
S p e n t
If Lisa consumes 1 movie and 8 litres of soft drink (possibilityb), she gets 8.33 units of utility from the last dollar spent onmovies and 5.67 units of utility from the last dollar spent onsoft drink. She can get more total utility by buying one moremovie. If she consumes 4 litres and 3 movies (possibility d),she gets 5.50 units of utility from the last dollar spent onmovies and 9.33 units of utility from the last dollar spent onsoft drink. She can get more total utility by buying one fewermovie. When Lisa’s marginal utility per dollar spent on bothgoods is equal, her total utility is maximized.
make any difference to the outcome. It is in thisrespect that utility is analogous to temperature.Our prediction about the freezing of water doesnot depend on the temperature scale; ourprediction about maximizing utility does notdepend on the units of utility.
H OW DO CONSUMERS MAKE CHOICES
BY MAXIMIZING UTILITY?
n Consumers maximize total utility.n They do so by spending all the available income and
by making the marginal utility per dollar spent oneach good equal.
n When marginal utilities per dollar spent are equalfor all goods, a consumer cannot reallocatespending to get more total utility.
n This is called the marginal utility theory ofconsumer choice.
PREDICTIONS OF MARGINALUTILITY THEORY
We’ll now use marginal utility theory to makesome predictions. What happens to Lisa’sconsumption of movies and soft drink when theirprices change and when her income changes?
A FALL IN THE PRICE OF MOV I E STo determine the effect of a change in price onconsumption requires three steps: n First, determine the combinations of movies and
soft drink that can be bought at the new prices. n Second, calculate the new marginal utilities per
dollar spent. n Third, determine the consumption of each good
that makes the marginal utility per dollar spenton each good equal and that just exhausts themoney available for spending.Table 7.4 shows the combinations of movies and
soft drink that exactly exhaust Lisa’s $30 ofincome when movies cost $3 each and soft drinkcosts $3 a litre. Lisa’s preferences do not changewhen prices change, so her marginal utilityschedules remain the same. But now we divide hermarginal utility from movies by $3, the new priceof a movie, to get the marginal utility per dollarspent on movies.
What is the effect of the fall in the price of amovie on Lisa’s consumption? You can find theanswer by comparing her new utility-maximizingallocation (Table 7.4) with her original allocation(Table 7.3). Lisa responds to a fall in the price of amovie by watching more movies (up from 2 to 5 amonth) and drinking less soft drink (down from 6to 5 litres a month). That is, Lisa substitutesmovies for soft drink when the price of a moviefalls. Figure 7.5 illustrates these effects. In part (a)a fall in the price of movies produces a movementalong Lisa’s demand curve for movies, and in part(b) it shifts her demand curve for soft drink.
A RISE IN THE PRICE OF SOFT DRINKTable 7.5 shows the combinations of movies andsoft drink that exactly exhaust her $30 of income
C H A P T E R 7 U T I L I T Y A N D D E M A N D
153

when movies cost $3 each and soft drink costs $6a litre. Now we divide her marginal utility fromsoft drink by $6, the new price of a litre, to get themarginal utility per dollar spent on soft drink.
The effect of the rise in the price of soft drinkon Lisa’s consumption is seen by comparing her
new utility-maximizing allocation (Table 7.5) withher previous allocation (Table 7.4). Lisa respondsto a rise in the price of soft drink by drinking lesssoft drink (down from 5 to 2 litres a month) andwatching more movies (up from 5 to 6 a month).That is, Lisa substitutes movies for soft drink when
P A R T 3 H O U S E H O L D S ’ C H O I C E S
154
TA B L E 7 . 4
H ow a Change in the Price of Movies Affects Li sa ’s Choices
Movies ($3 each) Soft drink ($3 per litre)
Marginal Marginal utility Marginal Marginal utilityQuantity utility per dollar spent Litres utility per dollar spent
0 10 15 5.001 50 16.67 9 16 5.332 38 12.67 8 17 5.673 33 11.00 7 18 6.004 29 9.67 6 19 6.335 25 8.33 5 25 8.336 21 7.00 4 28 9.337 17 6.00 3 36 12.008 15 5.00 2 42 14.009 12 4.00 1 75 25.00
10 9 3.00 0
FIGURE 7.5
A Fa ll in the Price of Mov i e s
When the price of movies falls and the price of soft drinkremains constant, the quantity of movies demanded by Lisaincreases; in part (a), Lisa moves along her demand curve for
movies. Also, Lisa’s demand for soft drink decreases; in part(b), her demand curve for soft drink shifts to the left.

the price of soft drink rises. Figure 7.6 illustratesthese effects. In part (a) a rise in the price of softdrink produces a movement along Lisa’s demandcurve for soft drink, and in part (b) it shifts herdemand curve for movies.
Marginal utility theory predicts these tworesults: when the price of a good rises, the quantitydemanded of that good decreases; if the price ofone good rises, the demand for another good thatcan serve as a substitute increases. Does this soundfamiliar? It should. These predictions of marginal
utility theory correspond to the assumptions thatwe made about consumer demand in Chapter 4.There we assumed that the demand curve for agood sloped downward, and we assumed that arise in the price of a substitute increased demand.Marginal utility theory predicts these responses toprice changes. In doing so it makes threeassumptions. First, that consumers maximize totalutility. Second, that they get more utility as theyconsume more of a good. Third, that asconsumption increases, marginal utility declines.
C H A P T E R 7 U T I L I T Y A N D D E M A N D
155
TA B L E 7 . 5
H ow a Change in the Price of Sof t Dr ink Af fects Lisa’s Choices
Movies ($3 each) Soft drink ($6 per litre)
Marginal Marginal utility Marginal Marginal utilityQuantity utility per dollar spent Litres utility per dollar spent
0 5 25 4.172 38 12.67 4 28 4.674 29 9.67 3 36 6.006 21 7.00 2 42 7.008 15 5.00 1 75 12.50
10 9 3.00 0
FIGURE 7.6
A Rise in the Price o f Sof t Drink
When the price of soft drink rises and the price of moviesremains constant, the quantity of soft drink demanded by Lisadecreases; in part (a), Lisa moves along her demand curve for
soft drink. Also, Lisa’s demand for movies increases; in part (b),her demand curve for movies shifts to the right.

A RISE IN INCOMESuppose that Lisa’s income increases to $42 amonth and that movies cost $3 each and a litre ofsoft drink costs $3 (as in Table 7.4). We saw, inTable 7.4, that with these prices and with anincome of $30 a month, Lisa consumes 5 moviesand 5 litres of soft drink a month. We want tocompare this consumption of movies and soft drinkwith Lisa’s consumption at an income of $42. Thecalculations for the comparison are shown in Table7.6. With $42, Lisa can buy 14 movies a monthand no soft drink, or 14 litres of soft drink amonth and no movies, or any combination of thetwo goods as shown in the table. We calculate themarginal utility per dollar spent in exactly the sameway as we did before and find the quantities atwhich the marginal utilities per dollar spent onmovies and on soft drink are equal. With anincome of $42, the marginal utility per dollar spenton each good is equal when Lisa watches 7 moviesand drinks 7 litres of soft drink a month.
By comparing this situation with that in Table7.4, we see that with an additional $12 a month,Lisa consumes 2 more litres and 2 more movies.This response arises from Lisa’s preferences, asdescribed by her marginal utilities. Different
p re f e rences produce diff e rent quantitative re s p o n s e s .But for normal goods, a higher income alwaysbrings a larger consumption of all goods. For Lisa,soft drink and movies are normal goods. When herincome increases, Lisa buys more of both goods.
MARGINAL UTILITY AND CONSUMERC H O I C E S
The marginal utility theory is summarized in Table7.7. This theory can be used to answer a widerange of questions about the real world, some ofwhich were posed at the beginning of this chapter.Why is the demand for CD players elastic and thedemand for oil inelastic; and why, as incomeincreases, does the proportion of income spent onelectricity increase while the proportion spent ontransportation decreases?
These patterns in our spending result from therate at which our marginal utility for each gooddiminishes as its consumption is increased. Goodswhose marginal utilities diminish rapidly haveinelastic demands (e.g. oil). For example, when the price of a good falls, the consumer will increasetheir purchases. When marginal utility falls rapidly, just a small increase in consumption willequalize the marginal utilities per dollar spent. In
P A R T 3 H O U S E H O L D S ’ C H O I C E S
156
TABLE 7 .6
L i s a ’s Choices wi th an Income o f $42 a Month
Movies ($3 each) Soft drink ($3 per litre)
Marginal Marginal utility Marginal Marginal utilityQuantity utility per dollar spent Litres utility per dollar spent
0 141 50 16.67 132 38 12.67 123 33 11.00 114 29 9.67 10 15 5.005 25 8.33 9 16 5.336 21 7.00 8 17 5.677 17 6.00 7 18 6.008 15 5.00 6 19 6.339 12 4.00 5 25 8.33
10 9 3.00 4 28 9.3311 3 36 12.0012 2 42 14.0013 1 75 25.0014 0

that case, the percentage change in quantitydemanded will be less and so the demand curvewill be less elastic.
A good whose marginal utility falls rapidly willalso show a small income effect (e.g.transportation). A rise in income will lead to anincrease in quantity demanded, but quantitydemanded increases by a smaller amount whenmarginal utility declines rapidly. Goods whosemarginal utility diminish only slowly, on the otherhand, have elastic demands (e.g. oil) and largeincome effects (e.g. electricity).
W H AT DOES THE MARGINA L UTILITY
T H E O RY PREDICT WILL BE THE EFFECTS OF
CHANGES IN PRICES AND INCOMES?
n When the price of a good falls and the prices ofother goods remain constant, consumers increasetheir consumption of the good whose price hasfallen and decrease their demand for other goods.
n Other things being equal, a price change results in amovement along the demand curve for a goodwhose price has changed and in a shift in thedemand curves for other goods whose prices haveremained constant.
n When a consumer’s income increases, theconsumer can afford to buy more of all goods andthe quantity bought increases for all normal goods.
n Goods whose marginal utility diminishes rapidly
have inelastic demands and small income effects;goods whose marginal utility diminishes slowly haveelastic demands and large income effects.
CRITICISMS OF MARGINAL UTILITYT H E O RY
Marginal utility theory helps us to understand thechoices people make, but there are some criticismsof this theory.
‘UTILITY CAN’T BE OBSERVED ORM E A S U R E D ’Agreed — we can’t observe utility. But we don’tneed to observe it to use it. We can and do observethe quantities of goods and services that peopleconsume, the prices of those goods and services,and people’s incomes. Our goal is to understandthe consumption choices that people make and topredict the effects of changes in prices and incomeson these choices. To make such predictions, weassume that people derive utility from theirconsumption, that more consumption yields moreutility, and that marginal utility diminishes. Fromthese assumptions, we make predictions about thedirections of change in consumption when pricesand incomes change. We are building a model andusing that model to predict behaviour. In order tomake progress in that exercise, we use the conceptof utility.
C H A P T E R 7 U T I L I T Y A N D D E M A N D
157
TABLE 7.7
Marginal Util ity Theory
Assumptions
(a) A consumer derives utility from the goods consumed.(b) Each additional unit of consumption yields additional utility; marginal utility is positive.(c) As the quantity of a good consumed increases, marginal utility decreases.
Implication
Utility is maximized when all the available income is spent and when the marginal utility per dollar spent isequal for all goods.
Predictions
(a) Other things being equal, the higher the price of a good, the lower is the quantity bought (the law ofdemand).
(b) The higher the price of a good, the higher is the consumption of substitutes for that good.(c) The higher the consumer’s income, the greater is the quantity demanded of normal goods.
Furthermore, as we’ve already seen, the actualnumbers that might be used to express utility donot matter. Consumers maximize utility in thismodel by making the marginal utility per dollarspent on each good equal. As long as the samescale is used to express utility for all goods, themodel gives the same answer regardless of the unitson the scale. In this regard, utility is similar tot e m p e r a t u re — water freezes when it’s cold enough,and that occurs independently of the temperaturescale used. We don’t have to use a particular scalein order to get the model to work for us.
‘PEOPLE AREN’T THAT CLEVER’Some critics maintain that marginal utility theoryassumes that people are supercomputers. Itre q u i res people to look at the marginal utility ofe v e ry good at every diff e rent quantity they mightconsume, divide those numbers by the prices ofthe goods, and then calculate the quantities so asto equalize the marginal utility of each gooddivided by its price.
Such criticism of marginal utility theory onceagain confuses the actions of people in the realworld with those of people in a model economy.A model economy is no more an actual economythan a model railway is an actual railway. Thepeople in the model economy perform thecalculations that we have just described. People inthe real world just consume. We observe theirconsumption choices, not their mental gymnastics.The marginal utility theory proposes that theconsumption patterns we observe in the real worldare similar to those implied by the model economyin which people do compute the quantities ofgoods that maximize utility. We test how closelythe marginal utility model resembles reality bychecking the predictions of the model againstobserved consumption choices.
W H AT ARE THE CRITICISMS OF THE
MARGINAL UTILITY THEORY ?
n One criticism is that utility can’t be measured: thatis true, but as long as we use the same scale toexpress utility for all goods, we’ll get the samepredictions from the theory regardless of the unitson our scale.
n ‘People aren’t that clever’ says another criticism:maybe so, but we can test how closely the marginalutility model resembles reality by checking thepredictions of the model against observedconsumption choices.
I M P L I C ATIONS OF MARGINALUTILITY THEORY
We all love bargains — paying less for somethingthan its usual price. One implication of themarginal utility theory is that we almost always geta bargain when we buy something. That is, weplace a higher total value on the things we buythan the amount it costs us.
CONSUMER SURPLUS AND THE GAINSF ROM TRADEPeople can gain by specializing in the production ofthe things at which they have a comparativeadvantage and then trading with each other.Marginal utility theory gives us a way of measuringthe gains from trade.
When Lisa buys movies and soft drink, sheexchanges her income for them. Does Lisa profitfrom this exchange? Are the dollars she has to giveup worth more or less than the movies and softdrink are worth to her? The principle ofdiminishing marginal utility guarantees that Lisa,and everyone else, gets more value from the thingsthey buy than the amount of money they give up inexchange.
C A L C U L ATING CONSUMER SURPLUS The value a consumer places on a good is themaximum amount that person would be willing topay for it. The amount actually paid for a good isits price. Consumer surplus is the differencebetween the value of a good and its price. Thedefinition of consumer surplus was discussed inChapter 6 (p. 131). Diminishing marginal utilityguarantees that a consumer always makes someconsumer surplus. To understand why, let’s lookagain at Lisa’s consumption choices.
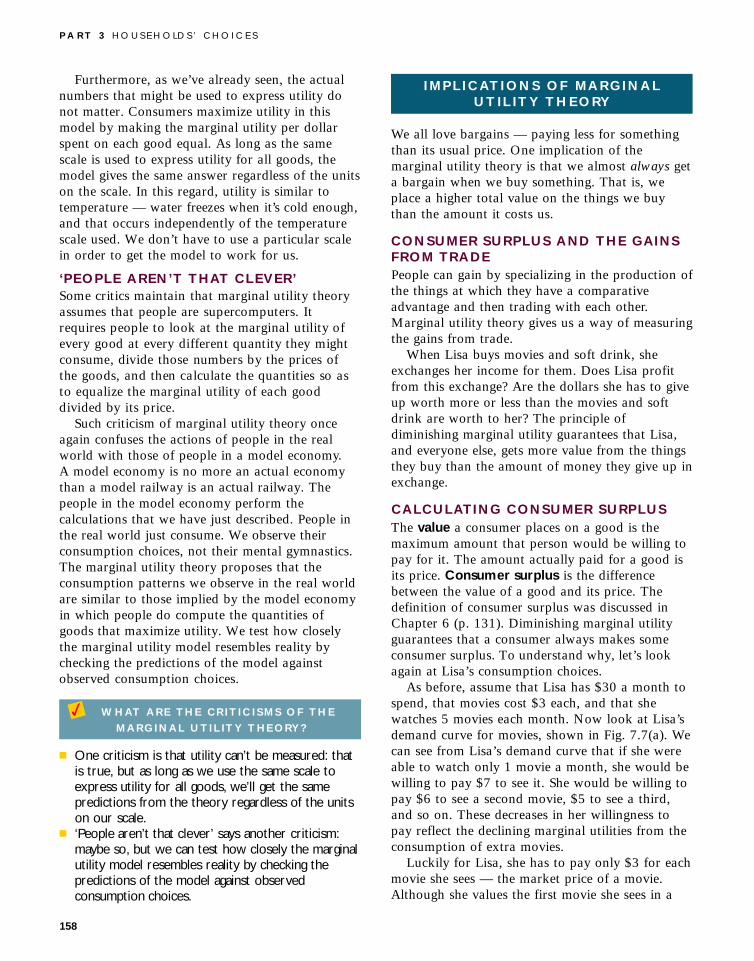
As before, assume that Lisa has $30 a month tospend, that movies cost $3 each, and that shewatches 5 movies each month. Now look at Lisa’sdemand curve for movies, shown in Fig. 7.7(a). Wecan see from Lisa’s demand curve that if she wereable to watch only 1 movie a month, she would bewilling to pay $7 to see it. She would be willing topay $6 to see a second movie, $5 to see a third,and so on. These decreases in her willingness topay reflect the declining marginal utilities from theconsumption of extra movies.
Luckily for Lisa, she has to pay only $3 for eachmovie she sees — the market price of a movie.Although she values the first movie she sees in a
P A R T 3 H O U S E H O L D S ’ C H O I C E S
158
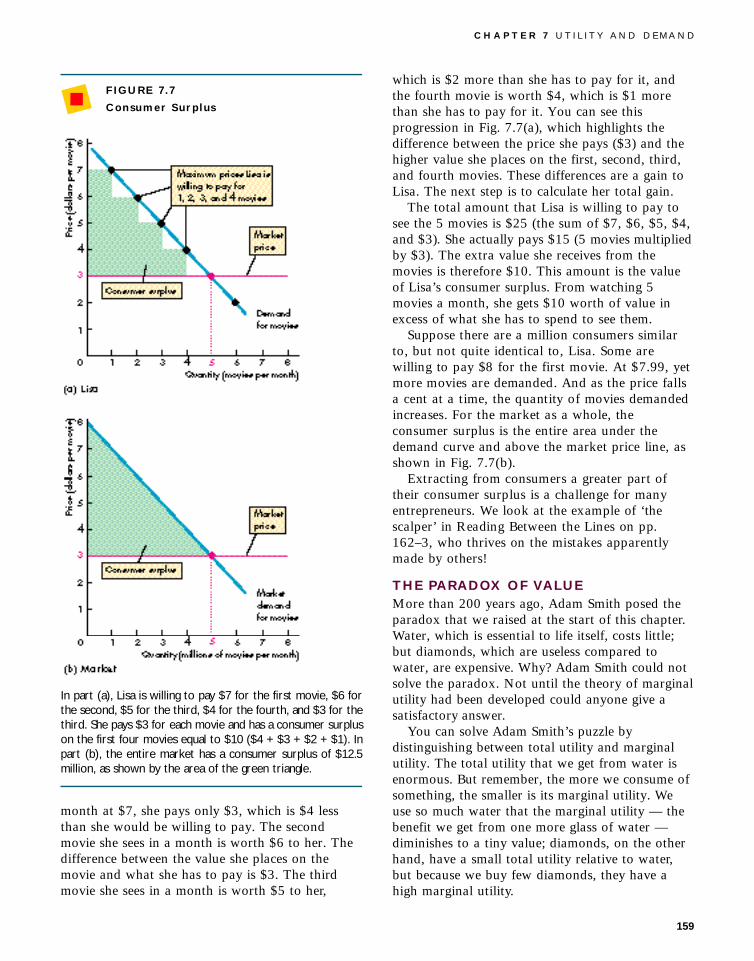
FIGURE 7.7
Consumer Surplus
In part (a), Lisa is willing to pay $7 for the first movie, $6 forthe second, $5 for the third, $4 for the fourth, and $3 for thethird. She pays $3 for each movie and has a consumer surpluson the first four movies equal to $10 ($4 + $3 + $2 + $1). Inpart (b), the entire market has a consumer surplus of $12.5million, as shown by the area of the green triangle.
month at $7, she pays only $3, which is $4 lessthan she would be willing to pay. The secondmovie she sees in a month is worth $6 to her. Thedifference between the value she places on themovie and what she has to pay is $3. The thirdmovie she sees in a month is worth $5 to her,
which is $2 more than she has to pay for it, andthe fourth movie is worth $4, which is $1 morethan she has to pay for it. You can see thisprogression in Fig. 7.7(a), which highlights thedifference between the price she pays ($3) and thehigher value she places on the first, second, third,and fourth movies. These differences are a gain toLisa. The next step is to calculate her total gain.
The total amount that Lisa is willing to pay tosee the 5 movies is $25 (the sum of $7, $6, $5, $4,and $3). She actually pays $15 (5 movies multipliedby $3). The extra value she receives from themovies is therefore $10. This amount is the valueof Lisa’s consumer surplus. From watching 5movies a month, she gets $10 worth of value inexcess of what she has to spend to see them.
Suppose there are a million consumers similarto, but not quite identical to, Lisa. Some arewilling to pay $8 for the first movie. At $7.99, yetm o re movies are demanded. And as the price fallsa cent at a time, the quantity of movies demandedi n c reases. For the market as a whole, theconsumer surplus is the entire area under thedemand curve and above the market price line, asshown in Fig. 7.7(b).
Extracting from consumers a greater part oftheir consumer surplus is a challenge for manye n t re p reneurs. We look at the example of ‘thes c a l p e r’ in Reading Between the Lines on pp.162–3, who thrives on the mistakes appare n t l ymade by others!
THE PA R A D OX OF VA L U EMore than 200 years ago, Adam Smith posed theparadox that we raised at the start of this chapter.Water, which is essential to life itself, costs little;but diamonds, which are useless compared towater, are expensive. Why? Adam Smith could notsolve the paradox. Not until the theory of marginalutility had been developed could anyone give asatisfactory answer.
You can solve Adam Smith’s puzzle bydistinguishing between total utility and marginalutility. The total utility that we get from water isenormous. But remember, the more we consume ofsomething, the smaller is its marginal utility. Weuse so much water that the marginal utility — thebenefit we get from one more glass of water —diminishes to a tiny value; diamonds, on the otherhand, have a small total utility relative to water,but because we buy few diamonds, they have ahigh marginal utility.
C H A P T E R 7 U T I L I T Y A N D D E M A N D
159

Marginal utility theory predicts that consumersspend their income in a way that makes themarginal utility from each good divided by its priceequal for all goods. This also holds true for theirspending on diamonds and water: diamonds have ahigh marginal utility divided by a high price, whilewater has a low marginal utility divided by a lowprice. In each case, the marginal utility per dollarspent is the same.
W H AT ARE SOME IMPLICATIONS OF
THE MARGINAL UTILITY THEORY ?
n Willingness to pay declines with the quantitypurchased because of diminishing marginal utility.
n Diminishing marginal utility guarantees that aconsumer always makes some consumer surplus.
n The paradox of value can be explained by thedifference between total and marginal utility.
n Something essential to life (like water) has a hightotal utility but low marginal utility and may have alow value because consumers are willing to paylittle for it.
LOOKING AHEAD
We’ve now completed our study of the marginalutility theory of consumption. We’ve used thattheory to examine how Lisa allocates her incomebetween the two goods that she consumes —movies and soft drink. We’ve also seen how thetheory can be used to resolve the paradox of value.Furthermore, we’ve seen how the theory can beused to explain our consumption choices.
In the next chapter we’ll study an alternativetheory of household behaviour. To help you see theconnection between the marginal utility theory ofthis chapter and the more modern theory ofconsumer behaviour of the next chapter, we’llcontinue with the same example and discoveranother way of understanding how Lisa gets themost out of her $30 a month.
I N D I V I D UAL DEMAND AND MARKET
D E M A N D
Individual demand is the relationship between theprice of a good and the quantity demanded by a singleindividual. Market demand is the sum of all individualdemands, and the market demand curve is found bysumming horizontally all the individual demand curves.(p. 146)
HOUSEHOLD CONSUMPTION CHOICES
AND THE BUDGET CONSTRAINT
An individual demand curve is derived from ahousehold’s consumption choices. These choices areconstrained by its income and by the prices of thegoods and services it buys. This constraint is describedby its budget line. It marks the boundary betweenwhat is affordable and what is unaffordable.(pp. 146–8)
UTILITY AND HOUSEHOLD
P R E F E R E N C E S
Consumers’ preferences are described by using theconcept of utility. The consumer derives utility fromthe goods consumed, and the consumer’s total utilityincreases as consumption of the good increases. Thechange in total utility resulting from a one-unitincrease in the consumption of a good is calledmarginal utility. Marginal utility declines asconsumption increases. (pp. 148–50)
MAXIMIZING UTILITY
The consumer’s goal is to maximize total utility, giventhe income available to be spent and given the pricesof the goods and services bought. Utility is maximizedwhen all the available income is spent and when themarginal utility per dollar spent on each good is equal.This way of determining a consumer equilibrium iscalled the marginal utility theory of consumer choice.(pp. 150–3)
P A R T 3 H O U S E H O L D S ’ C H O I C E S
160

PREDICTIONS OF MARGINAL UTILITY
T H E O RY
Marginal utility theory predicts how prices and incomeaffect the amounts of each good consumed. First, itpredicts the law of demand. That is, other things beingequal, the higher the price of a good, the lower is thequantity demanded of that good. Second, it predictsthat, other things being equal, the higher theconsumer’s income, the greater is the consumption ofall normal goods. (pp. 153–7)
CRITICISMS OF MARGINAL UTILITY
T H E O RY
Some people criticize marginal utility theory becauseutility cannot be observed or measured. However, thesize of the units of measurement of utility does notmatter. All that matters is that the ratio of themarginal utility from each good to its price is equal forall goods. Any units of measurement consistentlyapplied will do. The concept of utility is analogous tothe concept of temperature — it cannot be directlyobserved, but it can be used to make predictionsabout events that are observable.
Another criticism of marginal utility theory is thatconsumers can’t be as clever as the theory implies. Infact, the theory makes no predictions about thethought processes of consumers. It only makespredictions about their actions and assumes thatpeople spend their income in what seems to them tobe the best possible way. (pp. 157–8)
I M P L I C ATIONS OF MARGINAL UTILITY
T H E O RY
Marginal utility theory implies that every time we buygoods and services we get more value for ourexpenditure than the money we spend. We benefitf rom consumer surplus, which is equal to the diffe re n c ebetween the maximum amount that we are willing topay for a good and the price that we actually pay.
Marginal utility theory resolves the paradox ofvalue: water is extremely valuable to life but cheap,while diamonds are less valuable to life thoughexpensive. When we talk loosely about value, we arethinking of total utility. The total utility of water ishigher than the total utility of diamonds. The marginalutility of water, though, is lower than the marginalutility of diamonds. People choose the amount ofwater and diamonds to consume so as to maximize
total utility. In maximizing total utility, they make themarginal utility per dollar spent the same for water asfor diamonds. (pp. 158–60)
REVIEW QUESTIONS
1 What is the relationship between individualdemand and market demand?
2 How do we construct a market demand curvefrom individual demand curves?
3 What do we mean by utility?
4 Distinguish between total utility and marginal utility.
5 How does marginal utility change as the level ofconsumption of a good changes?
6 Susan is a consumer. When is Susan’s utilitymaximized?
a) When she has spent all her income
b) When she has spent all her income andmarginal utility is equal for all goods
c) When she has spent all her income and themarginal utility per dollar spent is equal for allgoods
Explain your answer.
7 What does the marginal utility theory predictabout the effect of a change in price on thequantity of a good consumed?
8 What does the marginal utility theory predictabout the effect of a change in the price of onegood on the consumption of another good?
9 What does the marginal utility theory predictabout the effect of a change in income onconsumption of a good?
10 How would you answer someone who says thatthe marginal utility theory is useless because utilitycannot be observed?
11 How would you respond to someone who tellsyou that the marginal utility theory is uselessbecause people are not clever enough to computea consumer equilibrium in which the marginalutility per dollar spent is equal for all goods?
12 What is consumer surplus? How is consumersurplus calculated?
13 What is the paradox of value? How does themarginal utility theory resolve it?
C H A P T E R 7 U T I L I T Y A N D D E M A N D
161

162
Consumer
surplus at work
Angry fans in jam after ‘scalping’By ADAM HARVEY
Fans have claimed that scalpersh ave robbed them of the chance
to buy cheap tickets for Pearl Jam,one of the rock industry’s mostpopular acts, which will tourAustralia next month.
While most rock bands say theyowe it all to their fans, it seemedthat for once, a major act wa sprepared to forgo huge profit forthe benefit of concertgoers. PearlJam tickets were $36.80, includinga booking fee — below the usualprice for a top act.
But fans claim scalpers boughtmost of the tickets minutes afterthey went on sale.
Pearl Jam’s Sydney Entertain-ment Centre concert sold out withinfive minutes, and all 30,000 ticketsfor the band’s Eastern Creekconcert went in three hours. All buttwo Pearl Jam concerts sold outwithin three hours.
Melanie Lyn, 17, of Carling-ford, a regular concertgoer, wasfourth in line at a Hornsby ticketagent — but when she got to the
counter, Pearl Jam’s EntertainmentCentre concert was sold out. Shebought tickets for Eastern Creek,but by then, even that concert washalf-sold.
‘We had people in front of usbuying 500 tickets — which meantthat only three people got tickets atHornsby . . . We go to every concertthat comes out because we lovemusic, but you always get scalpersat these things,’ she said.
‘ E very single concert we’vegone to, we’ve been sold bad seats,because scalpers buy up the ticke t salmost as soon as they go on sale.’In an industry where decent seatsoften sell for up to $150, Pearl Jamhas a reputation for being fa n -f r i e n d l y. It has taken the USt i c keting agent Ti c ketmaster tocourt for alleged anti-competitiveb e h av i o u r, and insists on lowp r i c e s .
Melanie says Pearl Jam’sAustralian promoters, FrontierTouring, should have imposed alimit of four tickets per person. She
is organising a protest against itspolicy, outside the EntertainmentCentre concert on March 10.
Frontier claims that scalping isnot a problem, and that limits ont i c kets are unnecessary. Ti c ke t swere sold through 54 box officesand 110 phone lines, so, of course,they sold exceptionally quickly, aFrontier spokesperson said.
But Triple J has receive dalmost 200 calls from peopleclaiming they saw scalpers buyingPearl Jam tickets. One scalpercalled to say he had bought 75tickets.
Scalping is not illegal. Butunder the Prices Regulation Act,anyone who sells tickets for morethan 5 per cent above their retailprice can be prosecuted.
The NSW Department ofConsumer Affairs used to prosecutescalpers before 1989, but says it isno longer worth it.
Sydney Morning Herald18 February 1995

ESSENCE OF THE S TO RY
n Pearl Jam concert tickets werepriced at just under $40.
n All but two concerts in Sydneysold out in less than three hours.
n Fans claimed that scalpers werebuying large blocks of tickets forresale and wanted limits put onthe number of tickets which eachperson could buy.
n The expected price for good seatswhen the tickets were resold bythe scalpers was $150.
A N A LYS I S
n Seats at Pearl Jam concerts arescarce. As shown in the figure, themarket clearing price ($150) ishigh. People are willing to payhigh prices because the utility ofhearing Pearl Jam play live is high.
n Concert promoters often decide tokeep seat prices low, and lowerthan the market clearing price, forexample at $40. There are about40,000 tickets for sale for theSydney concerts. At that pricethere is excess demand for seats.
n The market works by using otherdevices to ration the ticketsavailable.
n One of these is queuing. Peoplequeue up — they sleep overnightoutside the booking office beforeit opens — to be sure to get aticket.
n There are costs of queuing whichhave to be added to the ticketprice to estimate the full cost of a seat at the concert. Those whoobtain seats are likely to bepeople with a relatively low costof queuing.
n There is scope for trade betweenthe people who obtain the ticketsby queuing and those who arewilling to pay higher money
prices but who do not havetickets.
n This possibility leads to thesecond method of allocation,which is scalping. Some peoplebuy tickets at low prices (andincur costs of queuing in theprocess) and resell at the marketclearing price.
n Scalping is more likely to lead toan allocation of the available seatsto people whose willingness topay lies to the left of point f.Scalping provides the means bywhich seats are reallocated tothose who are willing to pay morefor them.
n Why are the ticket prices so low?Why does the promoter not try tocapture more of the surplusavailable by offering seats at ahigher price?
n One explanation is that thepromoter does not want to takethe risk of not filling the concert.
n A half-empty hall or stadiumcould send the wrong signal aboutthe popularity of the band.People’s willingness to listen tobands may depend on theirperception of the band’spopularity with others.
n The promoter wants to fill thehall, so prices are set low to makethat outcome more likely. Thatcreates the opportunity forscalpers, who take the risk thatthey cannot sell all the ticketsthey have bought. They thereforebear some of the risk that thepromoter has decided to avoid.
n A second explanation is that theconcert is not the only productwhich the promoters and theband are selling. They also sellcomplementary products such asCDs and clothing. The sales ofthese items will be increased, it isargued, as a result of greaternumbers at the concert. It mayalso be thought that the people
who queue for tickets have agreater propensity to buy this sortof material than those who wouldbe willing to pay a high price.
n A third explanation is that thereis a conflict of interest betweenthe band and the promoter.
n The band may want to retain theloyalty of fans, especially thosewith a high propensity to buyrecorded music. Those fans arethen more likely to buy otherproducts released some time later,like the next CD.
n High concert prices, and aperception that the band is not‘fan-friendly’, may diminish theband’s popularity and reducefuture sales of CDs. Low salesreduce the income of the band. Italso reduces the extent to whichtheir music is available now andthe extent to which it ‘survives’the band. Apart from income,longevity may be an objective ofthe musicians!
n Compared to the band, theconcert will put a higher weighton current revenue than onrevenue from future concerts, thelikelihood of which is difficult toestimate. This difference may be asource of disagreement betweenthe promoter and the band.
163

P RO B L E M S
1 Shirley’s demand for yoghurt is given by thefollowing:
Price Quantity(dollars per (cartons per
carton) week)
1 122 93 64 35 1
a) Draw a graph of Shirley’s demand for yoghurt.
Dan also likes yoghurt. His demand for yoghurt isgiven by the following:
Price Quantity(dollars per (cartons per
carton) week)
1 62 53 44 35 2
b) Draw a graph of Dan’s demand curve.
c) If Shirley and Dan are the only two individuals,construct the market demand schedule foryoghurt.
d) Draw a graph of the market demand foryoghurt.
e) Draw a graph to show that the marketdemand curve is the horizontal sum ofShirley’s demand curve and Dan’s demandcurve.
2 Calculate Lisa’s marginal utility from soft drinkfrom the numbers given in Table 7.1. Draw twographs, one of her total utility and the other ofher marginal utility from soft drink. Make yourgraphs look similar to those in Fig. 7.3.
3 Alex enjoys windsurfing and snorkelling. Heobtains the following utility from each of thesesports:
Half-hours Utility from Utility fromper month windsurfing snorkelling
1 60 202 110 383 150 534 180 645 200 706 206 757 211 798 215 829 218 84
a) Draw graphs showing Alex’s utility fromwindsurfing and from snorkelling.
b) Compare the two utility graphs. Can you sayanything about Alex’s preferences?
c) Draw graphs showing Alex’s marginal utilityfrom windsurfing and from snorkelling.
d) Compare the two marginal utility graphs. Canyou say anything about Alex’s preferences?
4 Alex has $35 to spend. Equipment for windsurfingrents for $10 a half-hour, while snorkellingequipment rents for $5 a half-hour. Use thisi n formation, together with that given in problem 3,to answer the following questions:
a) What is the marginal utility per dollar spenton snorkelling if Alex snorkels for:
(i) Half an hour?
(ii) One and a half hours?
b) What is the marginal utility per dollar spenton windsurfing if Alex windsurfs for:
(i) Half an hour?
(ii) One hour?
c) How long can Alex afford to snorkel if hewindsurfs for:
(i) Half an hour?
(ii) One hour?
(iii) One and a half hours?
d) Will Alex choose to snorkel for one hour andwindsurf for one and a half hours?
e) How long will Alex choose to windsurf and tosnorkel?
P A R T 3 H O U S E H O L D S ’ C H O I C E S
164

5 Alex’s sister gives him $20 to spend on his leisurepursuits, so he now has $55 to spend.
a) How long will Alex now windsurf and snorkel?
b) If Alex has only $55 to spend and the rent onwindsurfing equipment halves to $5 a half-hour, how will Alex now spend his timewindsurfing and snorkelling?
c) Does Alex’s demand curve for windsurfingslope downward or upward?
d) Alex takes a holiday in the Whitsundays, thecost of which includes unlimited sportsactivities — including windsurfing, snorkelling,and tennis. There is no extra charge for anyequipment. Alex decides to spend three hourseach day on both windsurfing and snorkelling.
How long does he windsurf? How long doeshe snorkel?
6 Sara’s demand for windsurfing is given by:
Price Time windsurfing(dollars per (half-hourshalf-hour) per month)
12.50 815.00 617.50 420.00 2
a) If windsurfing costs $17.50 a half-hour, what isSara’s consumer surplus?
b) If windsurfing costs $12.50 a half-hour, what isSara’s consumer surplus?
C H A P T E R 7 U T I L I T Y A N D D E M A N D
165