3 - epa - sa.gov.au
TRANSCRIPT

60
AQUACULTURE
AquacultureTrends
• Volume of production: INCREASED 349%
from 3883 tonnes in 1996/97 to 13,548
tonnes in 2001/02.
• The variety of farmed species: INCREASED
over the last five years.
• Environmental monitoring: INCREASED for
some operations.
• Industry legislation and regulation:
SIGNIFICANTLY IMPROVED, but from a
poor base.
• Escapes from finfish farms: INCREASED due
largely to increased Yellowtail kingfish farming.
Goal
To promote the ecologically sustainable developmentof marine and land based aquaculture; to maximise thebenefits to the community from the State’saquaculture resources; and to ensure the efficient andeffective regulation of the aquaculture industry.Aquaculture Act 2001
What are the issues?
Aquaculture is the commercial growing of marine andfreshwater animals and plants for the purposes oftrade, business or research. The aquaculture industryin South Australia has developed very rapidly over thelast decade and is diversifying and becomingincreasingly economically significant. The mostsignificant species in terms of value are Southernbluefin tuna, oysters, Yellowtail kingfish and abalone.In 2001/02 the farmgate value of the industry was
$284 million, representing 39% of the total industry inAustralia, rising from $50 million and 11% in 1996/97.
The aquaculture industry is now subject to muchgreater controls via licensing and environmentalmonitoring required under the Aquaculture Act 2001.This provides a framework for the sustainabledevelopment and management of the industry and isseen as a very positive development. It has led toimproved management in some sectors.
If inappropriately managed, aquaculture operationscan cause a significant impact on the environment.In poorly planned or overstocked developments, highlevels of feed and excreta may elevate nutrient levels inthe area immediately surrounding the farm. This canreduce water quality and affect the health of marineplants and animals. Other potential environmentalconcerns include marine animal entrapment in netssurrounding the farms, impact on seabird populations,the escape of farmed species (and the potential for theirestablishment in the wild), inbreeding and geneticpollution, disease risk through the use of imported feedand an impact on the scenic amenity of coastal areas.
Historically, significant and ongoing loss ofseagrass and the deterioration of ecosystems hasoccurred in coastal waters adjacent to significantdevelopments in South Australia. It is important thatsimilar ecological mistakes are not made in developingthe aquaculture industry, particularly as muchaquaculture development is taking place in relativelyuntouched marine environments.
Southern bluefin tuna now has well establishedenvironmental monitoring, however, there is a needfor others to significantly improve their managementoperations. The full extent of the environmental impactassociated with aquaculture is still unknown. Ongoingresearch has been commissioned to further enhancemanagement practices and improve the sustainabilityof the aquaculture industry.
See also chapters on Health of the Marine and
Coastal Environment; and Fisheries.
Tuna pen, Port LincolnPhoto: PIRSA
3 Coasts and the Sea
SOURCE: SARDI, 2002; PIRSA
Figure 3.1: Aquaculture production& value – 1989/90–2001/02
Valu
e ($
A,00
0)
0
50000
100000
150000
200000
250000
300000
Value ($A,000)
Production (000’kg)
19
89
/90
19
90
/01
19
91
/92
19
92
/93
19
93
/94
19
94
/95
19
95
/96
19
96
/97
19
97
/98
19
89
/90
19
98
/99
19
99
/00
20
00
/00
20
01
/02
Prod
uctio
n (’0
00kg
)
0
2000
4000
6000
8000
10000
12000
14000
YEAR

STATE OF THE ENVIRONMENT REPORT 2003 61
Environmental indicator
PRESSURE INDICATOR
• Total annual production and value ofmarine and land-based aquaculture(reported on in the State of the EnvironmentReport 1998)
This provides an indication of the rate of growth inthe aquaculture industry. It also provides anassessment of the impact of aquaculture operations.
What is the current situation?
PRESSURE INDICATOR: Total annualproduction and value of marine andland-based aquaculture
The aquaculture industry has grown significantly overthe last 10 years or so. Figure 3.1 shows the totalproduction and value of aquaculture (land and marinebased) in South Australia between 1989/90 and 2001/02. This indicates a steep increase in both productionand value from the aquaculture industry.
Since the State of the Environment Report 1998,total production levels have increased from 3357tonnes in 1996/97 to 13,548 tonnes in 2001/02, whilevalue has increased from $50 million in 1995/96 to$284 million in 2001/02.
Marine-based aquaculture dominates the industryin both value and volume of production. Of this, tunafarming contributes by far the greatest value andvolume of all activity in the State (see Tuna farms).
The following sections provide an overview of thevarious types of aquaculture activity in the State.
Marine based aquaculture
Tuna farms
The quantity of Southern bluefin tuna caught isrestricted through a global quota system introduced in1985 in an effort to arrest the rapid decline of the fishstock. As a result, since 1991 the vast majority of tunacaught in the Southern Ocean are farmed to increasetheir size and add value to the available quota.
Tuna farms were the source of approximately 70%of the total volume of aquaculture production in SouthAustralia in 2001/02. Over the last five years the value ofproduction has risen to approximately seven times the1996/97 level, while the total volume quadrupled.
FindingsMaking progressThe Aquaculture Act 2001 is a significant improvement in legislation for the management of aquacultureoperations in South Australia.
Nationally accepted sustainability indicators are being developed for each sector of the aquacultureindustry.
The State Government has committed to a three-year audit of the environmental performance of theaquaculture industry.
Attention requiredThere is insufficient information available on the impact aquaculture has on marine and freshwater environmentsin South Australia, despite the more regional focus for aquaculture planning and associated data collection. Muchof the concern is based on partially researched or anecdotal evidence or on information from overseas. Given therate this industry is growing, more research needs to be undertaken within South Australia.
There has been particular community concern about the escape of kingfish from farms in the EyrePeninsula region. Aquaculture stock escapes carry with them a presently unquantified risk to the local ecologyand organisms.
What more should we be doing?The Environment Protection Authority recommends that:3.1 The process by which the aquaculture industry is presently licensed and promoted should be reviewed to
ensure that there is no potential for conflict of interest.3.2 Aquaculture planning is integrated with the State’s proposed new marine planning process to ensure that
aquaculture zoning is compatible with competing interests and needs. As part of this, it is vital to provideadequate buffer zones between aquaculture ventures and for terrestrial and marine protected areas.
3.3 Regulatory guidelines for aquaculture design and operations should be strengthened to reduce the risks ofenvironmental harm.
3.4 In granting new aquaculture licences, caution must be exercised with regard to the farming of speciesthat are not native or outside of their normal distribution.
3.5 Adequate processes are established to ensure compliance with relevant environmental managementstandards, including development and implementation of site-specific monitoring plans.
3.6 Research is increased into methods of minimising and ameliorating the impact of aquaculture activities onthe marine and freshwater environments. In particular, commitment to independent long term study isrequired to provide for greater objectivity and improved knowledge.
Oyster Farm Denial Bay,Eyre Peninsula, South AustraliaPhoto: South AustralianTourism Commission
Endangered Australian Sea Lion,Seal Bay, Kangaroo Island,South AustraliaPhoto: South AustralianTourism Commission
AQUACULTURE

62
3 Coasts and the Sea
A large scale tuna fish-kill occurred in Boston Baynear Port Lincoln in 1996. There has been speculationas to the cause of this event. Monitoring wasundertaken in response to the mortalities by the SouthAustralian Research and Development Institute(SARDI) who forwarded samples to a number of otherState and national organisations. The South AustralianGovernment report that collated and synthesised theinformation on this event concluded the cause wasasphyxiation as a result of sediment stirred up by astorm (Clarke, 1996). However, there are differences ofopinion about the actual cause, with some suggestingthat the presence of toxic micro-algae was the mostlikely cause (Munday and Hallegraeff, 1998; Hallegraeffet. al., 1998; ASOEC, 2001). A lack of data prior to andat the time of the event makes it difficult to beconclusive about the cause.
All of the tuna pontoons have subsequently beenmoved further offshore as a result of a variety ofconcerns relating to their previous location. However,this resulted in these farms being moved closer to theSir Joseph Banks Conservation Park.
Tuna farms are now subject to establishedenvironmental monitoring and data collected to dateindicates that the impact on water quality andsediments is low (Clarke et. al., 1999; Clarke et. al.,2000; Madigan, 2002; Madigan, 2003).
Other marine aquaculture
Marine species being farmed other than tuna includeYellowtail kingfish, Atlantic salmon, Pacific oysters,
abalone and the Blue mussel. Yellowtail kingfish wasnot a farmed species five years ago, and Atlanticsalmon production has tripled in the last five years.
Production of Yellowtail kingfish is predicted toincrease significantly in the coming years. There hasbeen considerable community concern over theescape of kingfish from farms in the Eyre Peninsularegion because of the potential impact on localpopulations of other fish species. The impact of thekingfish escapes is not known, although kingfishnumbers in the upper Spencer Gulf appear to haveincreased markedly in recent times.
Atlantic salmon are farmed near Cape Jaffa inthe South East. Production of this species has morethan tripled in the last five years. Production in 2001/02was around 596 tonnes.
The volume of Pacific oyster farm productionmore than doubled in the period from 1996/97 to2001/02. South Australia’s oyster production occurs ina range of sheltered intertidal locations. Environmentalmonitoring of oyster farms is now conducted on a site-specific basis following research that indicated thateffects were not occurring on a broader regional scale.
A study conducted in 1998 as part of an OysterEnvironmental Monitoring Program conducted bySARDI found that feral oysters had settled in 3 out of10 bays surveyed near to the farming operations(Madigan and Clarke, 1998). There is ongoingmonitoring of these feral populations to ensure thatthey do not become established.
Most of the Blue mussel farms in South Australiaare located in Boston Bay near Port Lincoln. Productionhas increased from zero in 1996/97 to 171 tonnes in2001/02.
Land based farms
Land based aquaculture operations include freshwatercrayfish grown in dams and ponds, Rainbow troutfarms, marine hatcheries and land based abalonefarms and barramundi grown in recirculating systems,as well as a range of other minor industries.
Abalone farms have grown from minimalproduction in 1996/97 to 34 tonnes in 2001/02.Barramundi farms have doubled production during thesame period to 255 tonnes. There are environmentalissues associated with the establishment of someabalone farms including the clearance of nativevegetation, the impact on dune systems, the escapeof stock and antibiotic and nutrient pollution.
Animal interactions with aquaculture farms
Entanglement of marine species in the predatornetting that surrounds certain aquaculture operationsis of concern, most notably threatened seals andsharks. Kemper and Gibbs (1997) found that at least13% of all dolphin carcasses retrieved by the SouthAustralian Museum died as a result of entanglement,including many in the tuna feedlots near Port Lincoln.
Some action has been taken in an attempt toreduce mammal interactions with aquaculture farms,including a reduction in the use of predator nets, but itis unclear how successful this has been (seeWhat are we doing about it?).
These interactions not only pose challenges forexisting developments, they are also an importantconsideration in new developments.
Interactions with seabirds are also a significantconcern, most notably Silver gulls and Pacific gulls.Fish farm feeding patterns have provided increasedfood for these gulls and resulted in an increase intheir population (although the relative effect inrelation to other coastal developments is unknown).This has lead to concerns that they will out-competeother native seabirds.
What impact could inappropriateaquaculture development have?
If aquaculture operations are established ininappropriate locations or are managed in anunsustainable way, there is a high potential for anadverse impact on the environment.Impact on water quality. In poorly planned or over-stocked aquaculture developments, high levels of feedand excreta may elevate nutrient levels in the areaimmediately surrounding the farm reducing waterquality and potentially affecting seagrasses and othernaturally occurring marine species. This is potentiallysignificant in the Gulf St Vincent, Spencer Gulf and onthe West Coast of South Australia, as these aregenerally naturally low nutrient environments.Change in nutrient status in these areas can eliminateor severely damage these marine communities.
Land based aquaculture systems using waterfrom streams and rivers may have the potential tocause reduced downstream flows, increased nutrientlevels, depleted oxygen and temperature variationsbetween intake and discharge points.Disturbance to the benthic (sea-floor)
environment. Activities associated with some farms
Abalone TanksPhoto: PIRSA
KEY FACTS
• Tuna farms are now subject to
environmental monitoring.
• The entanglement of marine
animals such as sharks and
seals in the netting that
surrounds some aquaculture
operations is concerning.

STATE OF THE ENVIRONMENT REPORT 2003 63
AQUACULTURE
can have an adverse impact on the benthicenvironment, such as negative effects on seagrassesand other benthic species.Impact on sediment quality. The deposition oforganic matter on sediments directly underneathfarms has the potential to accumulate and potentiallyimpact on naturally occurring plants and animals.Establishment of feral populations. There ispotential for the introduction of species that do notnaturally occur in South Australia through escape fromaquaculture operations. These species include marronand Pacific oysters.Inbreeding and genetic pollution. There is a potentialfor inbreeding within aquaculture operations. If someindividuals then escape from the farm and breed withnaturally occurring members of their species, geneticpollution of native fish-stocks may occur. This hassignificant implications for marine biodiversity.Impact on marine animals. Marine animals canbecome entangled in the netting and cages ofmarine-based farms, often resulting in death. This is aparticular concern for threatened species such as sealions and great white sharks. For more informationsee the section on Animal interactions with
aquaculture farms.Impact on commercial fisheries. The economicimpact would be significant if commercial fish stockswere to be adversely affected by disease, in-breeding,predation by escaped Yellowtail kingfish or habitat lossas a consequence of aquaculture development.Impact on scenic amenity and terrestrial
vegetation. Some aquaculture operations, such asfinfish farms, oyster farms, and land-based abalonefarms, can have a significant impact on sea views andcoastal amenity. The establishment of land-basedfarms can also result in vegetation loss anddisturbance and coastal erosion.
What are we doing about it?
Aquaculture in South Australia is now subject to muchgreater regulation as a consequence of theAquaculture Act 2001, which seeks to significantlyimprove the management of aquaculture in SouthAustralia. The legislation it replaced (and/or itsadministration) was patently inadequate (Parliament ofSouth Australia, 2000). However, while there havebeen improvements to the management of somesections of the industry, there are other less wellestablished sections that require urgent improvementsto their management to ensure that the industry as awhole is managed sustainably.
Under the new Act, Aquaculture Zone Policies
are being established to improve the management ofaquaculture operations on a regional basis. It isessential that the development of Aquaculture ZonePolicies effectively integrates with the State’s newmarine planning process. To this end, the developmentof new aquaculture policies is being undertaken inparallel with the development of Marine Plans andwith strong administrative linkages.
All proposed aquaculture developments undergoan ecological sustainability risk assessment beforea licence is issued. Environmental risks are assessedand developments that are considered to carry
extreme risk are not allowed to proceed. TheDevelopment Assessment Commission isresponsible for the approval process. Environmental
monitoring is also an annual requirement for allaquaculture operators. However, the quality of
monitoring conducted by most licensees is
inadequate and improvements must be made as
a matter of priority.
Licence conditions are established for alldevelopments. These require specific operatingprocedures and environmental monitoring programswhich directly address the perceived risks. Thismonitoring is continually evaluated by PrimaryIndustries and Resources SA (PIRSA) as part of itsadaptive management approach and is also used toconduct an annual review of the licence conditionsbefore the licence is renewed.
An Aquaculture Environment Management
Policy has been developed by PIRSA in accordancewith Part 4 of the Aquaculture Act 2001. It is designedto ensure that sustainability principles underpin thedevelopment of the aquaculture industry.
PIRSA developed a series of recommendationsin 1998 to deal with interactions between marine
mammals and aquaculture in consultation with arange of marine experts. This appears to haveresulted in some reduction in the numbers of marinemammals becoming entangled. However, the truenumber of marine animals dying as a result ofentanglement, at least in the case of dolphins, islikely to be higher than the number of cases reported(Kemper and Gibbs, 2001).
The State Government has committed to a three-year audit of the environmental performance of theaquaculture industry. This is in addition to ongoingmonitoring of operations and additional research intocarrying capacity and fish health. The research willinvolve Aquaculture SA, SARDI and other institutions.
A National Framework for Aquaculture
Indicators is to be developed over the next few years.This will revise and incorporate current monitoringprograms as well as develop new programs.
For more information on programs and initiativessee the State of the Environment 2003Supplementary Report.

64
3 Coasts and the Sea
References
Australian State of the Environment SteeringCommittee (ASOEC) (2001). Coasts and Oceans.Australia State of the Environment Report 2001(Theme Report), CSIRO Publishing on behalf of theDepartment for Environment and Heritage, Canberra.
Clarke, S. (1996). ‘Report by the South AustralianGovernment: Tuna Mortalities, April-May 1996’. SouthAustralian Research and Development Institute, Adelaide.
Clarke, S., Cartwright, C., Smith, B. and Haskard, K.(1999). Southern bluefin tuna (Thunnus maccoyii)aquaculture environment monitoring report 1996 to1998. South Australian Research and DevelopmentInstitute, Adelaide.
Clarke, S., Madigan, S., Edwards, J., Matthews, C.,Preece, P. and Haskard, K. (2000). Southern bluefintuna (Thunnus maccoyii) aquaculture environmentmonitoring report 1999 to 2000. South AustralianResearch and Development Institute, Adelaide.
Hallegraeff, G.M., Munday, B.L., Baden, D.G. andWhitney, P.L. (1998). ‘Chattonella Marina Raphidophytebloom associated with mortality of cultured BluefinTuna (Thunnus Maccoyii) in South Australia’, in HarmfulAlgae, Reguera, B., Blanco, J., Fernandez, M.L., Wyatt,T., (eds), Xunta de Galicia and IntergovernmentalOceanographic Commission of UNESCO 1998.
Kemper, C.M. and Gibbs, S.E. (1997). A study of lifehistory parameters of dolphins and seals entangled intuna farms near Port Lincoln: Comparisons withinformation from other South Australian dolphincarcasses. Report to the Department for Environmentand Heritage (ANCA), Canberra.
Kemper, C.M. and Gibbs, S.E. (2001). ‘Dolphininteractions with tuna feedlots at Port Lincoln, SouthAustralia and recommendations for minimisingentanglements’ J. Cetacean Res. Manage.3(3):283-292, 2001.
Madigan, S. (2002). Summary of results from theSouthern bluefin tuna ((Thunnus maccoyii) licence-basedtuna environmental monitoring reports for 2001. SouthAustralian Research and Development Institute, Adelaide.
Madigan, S. (2003). Summary of results from theSouthern bluefin tuna ((Thunnus maccoyii) licence-basedtuna environmental monitoring reports for 2001. SouthAustralian Research and Development Institute, Adelaide.
Madigan, S. and Clarke, S. (1998). OysterEnvironmental Monitoring Program (OEMP): Waterquality and feral oyster field trips June to August 1998,report for OEMP, SARDI Aquatic Sciences InternalReport, 20pp.
Munday, B.L. and Hallegraeff, G.M. (1998). ‘MassMortality of Captive Southern Bluefin Tuna (Thunnusmaccoyii) in April/May 1996 in Boston Bay, SouthAustralia: A Complex Diagnostic Problem’. FishPathology, 33 (4) pp 343-350.
Parliament of South Australia (2000). Inquiry into TunaFeedlots at Louth Bay. Parliament of SA EnvironmentResources and Development Committee: ThirtyEighth Report of the Committee, Third Session, FortyNinth Parliament.
South Australian Research and Development Institute(SARDI) (2002). Information and Statistics Report(April 2002).
Further information
Aquaculture in South Australia – PIRSA websitewww.pir.sa.gov.au
Aquaculture Research – Aquafin CooperativeResearch Centrewww.aquafincrc.com.au
Aquaculture in Australia – Department of AgricultureFisheries & Forestry Australiawww.affa.gov.au

STATE OF THE ENVIRONMENT REPORT 2003 65
FISHERIES
FisheriesTrends
• Most of South Australia’s fisheries are
FULLY EXPLOITED.
• Snapper in Gulf St Vincent and Northern
Zone Rock Lobster are OVERFISHED.
Goal
Ensuring, through proper conservation, preservation andfisheries management measures, that the livingresources of the waters to which this Act applies are notendangered or overexploited; and achieving the optimumutilisation and equitable distribution of those resources.Fisheries Act 1982
What are the issues?
The marine and freshwater fisheries of South Australiaare renewable, but they are also limited and
vulnerable. Our fisheries must be cautiously managedto ensure that commercial and recreational fisheriesremain sustainable and that marine biodiversity is notadversely affected by overfishing or damaging habitatsthrough fishing practices.
Due to the practical difficulties involved in marineresearch, there is often insufficient information or a lackof scientific certainty regarding fish species. It isimportant, therefore, that the Government applies theprecautionary principle in the management of fisheries.
In some instances, recreational fishers take agreater proportion of the total fish catch for a particularspecies than commercial fishers (Figure 3.2). There arean estimated 319,000 recreational fishers in SouthAustralia (i.e. people who fish at least once everytwelve months), fishing on an average of eight daysper year. Recent survey results illustrate clearly thatthe recreational fishing sector also has a significantinfluence on South Australian fisheries.
See also chapters on Aquaculture; Health of
the Marine and Coastal Environment; andIntroduced Species.
Fishing on Lock’s Well Beach, EyrePeninsula, South AustraliaPhoto: South AustralianTourism Commission
FindingsMaking progressA review of the Fisheries Act 1982 is underway, with the aim of updating the legislation to reflectcontemporary management practices and provide for an ecosystem based approach to fisheries management.
Environment Australia is conducting independent assessments of selected key export fisheries with theassistance of State agencies. Assessments of the prawn, abalone, rock lobster, pilchard, blue crab and cocklefisheries are being conducted with the assistance of Primary Industries and Resources SA.
Attention requiredThere are concerns regarding the sustainability of Northern Zone rock lobster and snapper in Gulf St Vincent.
The recreational fishing sector takes a greater proportion of the fish catch for certain marine scalefishspecies (principally snapper and King George whiting) than the commercial sector, but, while it is subject tobag, boat and size limits, there are not the same levels of control in relation to total annual catch levels.
The management of fisheries tends to occur at the individual species level, rather than the habitat orecosystem level.
There are insufficient resources and funding available for research into marine scalefish. This leavessignificant gaps in our knowledge and is an impediment to making informed management decisions.
What more should we be doing?The Environment Protection Authority recommends that:3.7 Formal management plans for all major fisheries are developed and adhered to, in association with
appropriate monitoring programs. As part of this, a better integrated approach to fisheries management isneeded and full implementation of the Ecologically Sustainable Development Reporting Framework forSustainable Fisheries.
3.8 Recreational fish catches are taken into account in all reports assessing the status of fisheries and thatmanagement arrangements reflect the significance of this catch. As part of this, it is important to ensurethat recreational catch data is regularly updated.
3.9 A recreational fishing licence scheme is introduced, similar to those already operating in New SouthWales and Victoria. This will provide additional funding for marine scalefish research and funds for thereallocation of access from commercial and recreational fishers.
3.10 Research into fish populations and recruitment processes is expanded, particularly for marine scalefish,allowing for improved understanding of the nature of the resource.
3.11 Greater research is required into the effects of fishing on marine ecosystems (including the impact ofby-catch). At present, research focuses on the sustainability of individual species, rather thanentire ecosystems.
Kin
g G
eorg
e W
hiti
ng
SOURCE: PIRSA, 2003
Figure 3.2: Commercial and recreationalfish catches in South Australia – 2000/01
Catc
h (to
nnes
)
0
200
400
600
800
1000
1200
1400
Tom
my
Ruf
f
Bla
ck B
ream
Gar
fish
Sna
pper
Blu
e C
rabs
Squ
id /
Cut
tlef
ish
Sno
ok
Goo
lwa
Coc
kles
Mud
Coc
kles
Euro
pean
Car
p
Commercial
Recreational

66
3 Coasts and the Sea
Environmental indicator
PRESSURE INDICATOR
• Total seafood catch (reported on in theState of the Environment Report 1998)
Levels of fish catch directly affects thepopulations of marine species.
What is the current situation?
This chapter necessarily focuses on assessments ofindividual species populations as the management of,and collection of data regarding, fisheries also occursat the individual species level. Ideally, from asustainability perspective, assessments of fisheriesshould occur at a habitat or ecosystem level.However, there is no comprehensive informationavailable regarding the status of fisheries habitats orentire ecosystems.
Stock assessment reports for individual fisheriesprepared by the South Australian Research andDevelopment Institute (SARDI) have been used toprovide information for the following summaries. Onlyfisheries in South Australian waters and managed bySouth Australian agencies have been assessed.
PRESSURE INDICATOR:Total seafood catch
This indicator reports on commercial and recreationalfish catches, as well as making some mention ofpopulation trends and catch limits.
Marine fisheries
Abalone
Total catch levels for abalone have remained relativelysteady during the period 1986/98 to 2000/01 due tothe introduction of quota management arrangements.
Prawns
There are three Western king prawn fisheries in SouthAustralia: Spencer Gulf, Gulf St Vincent and the WestCoast, with average catches of approximately 1800tonnes, 300 tonnes and 100 tonnes per yearrespectively.
The Gulf St Vincent Prawn Fishery was closed in1991 and 1992 following concerns about the state ofthe prawn population. Biomass has recovered andannual catches vary between 300 and 400 tonnes.The Spencer Gulf Prawn Fishery is sustainable atcurrent levels. The West Coast Prawn Fishery is at itslowest level in recent years due to a lack ofrecruitment, which is characteristic of this oceanicfishery.
The South Australian prawn fishery has been thefocus of several environmental studies on the effectsof trawling and the impact on ecosystems caused byby-catch. Substantial efforts have been put into by-catch reduction.
Rock lobster
The South Australian Rock Lobster Fishery is dividedinto two zones – Northern and Southern.
The most recent Northern Zone fisheryassessment report indicated that the current
management strategy has resulted in declining stocklevels (Ward et. al., 2002b). This trend would continuewithout a significant reduction in fishing effort in theshort term. This has been implemented and a fullreview has been undertaken (see What are we doing
about it?). The Northern Zone will be managed by aquota system in 2003/04. Indications suggest that thisfishery is presently over-exploited.
The current management strategy for theSouthern Zone fishery, which aims to maintain aconstant harvest of lobster through holding the TotalAllowable Commercial Catch (TACC) at 1720 tonnes,has allowed the stock to build significantly (Ward et.al., 2002a). The TACC was increased by 50 tonnes inthe 2002/03 fishing season in recognition of thisachievement. CPUE is the highest of any lobsterfishery in Australia.
New management arrangements for recreationalcatches of rock lobster were introduced for 2000/01,restricting catches to a maximum of 4.5% of the totalState-wide lobster catch. Under the new arrangements,if this limit is exceeded, the Government will purchasesome quota from the commercial sector to maintainthe balance of fishing pressure on the resource.
Blue crab
The South Australian Blue Crab Fishery operates inSpencer Gulf and Gulf St Vincent. The fishery ismanaged using a quota system. Each licence holder isallocated a proportion of the annual TACC, which hasincreased from 27 tonnes in 1983/84 (whenmanagement of the fishery was first established) to546 tonnes in 1999/2000. In addition to thecommercial catches, an estimated 40% of the totalcatch is taken by the recreational fishery. Recreationalaccess is managed through daily bag and boat limitsand a minimum size limit.
As with prawns, recruitment of blue crabs ishighly variable. As a result, the TACC for blue crabshas historically been set at a conservative level in anattempt to ensure sustainability. More refined stockassessment methods that provide detailedinformation about stock abundance and variability arebeing developed.
Pilchards
Commercial catches of pilchards have increased from2460 tonnes in 1995 to 17,700 tonnes in 2002. Therewere two large-scale pilchard mortality events in 1995and 1998, both of which began near Eyre Peninsulaand spread rapidly east and west into Victoria andWestern Australia. These are believed to be the largestsingle marine species mortality events recordedanywhere in the world (Jones, 1997 and Westbury,1999 in Parliament of SA, 1999). The fish kill is knownto have been caused by a herpes-like virus, but thesource of this virus has not been traced. Assessmentsconducted by SARDI have shown that the populationhas recovered rapidly (Ward et. al., 2001).
Pilchards are a short-lived, fast-growing speciesand, as such, extreme fluctuations in stock abundancecan be experienced (Ward et. al., 2002c), making themparticularly vulnerable to overfishing. Pilchards are aparticularly significant fish species as they form part ofthe diet of native seabirds, and hence are a key link inthe food chain.
Greenlip AbalonePhoto: PIRSA
Prawn boats docked at Port LincolnPhoto: PIRSA
Rock lobster fishing boatPhoto: PIRSA

STATE OF THE ENVIRONMENT REPORT 2003 67
FISHERIES
Historically the TACC has been set at 10–15% ofthe estimated spawning biomass, which is consideredconservative. The Pilchard fishery is the single largestfishery landed by weight in Australia.
Marine scalefish
The ‘Marine Scalefish Fishery’ includes finfish,crustaceans, molluscs and other species in the marinewaters of the State, with the exception of prawns,rock lobsters, pilchards, blue crabs (apart from those inWest Coast waters), and abalone which are managedindependently. It is a multi-species fishery usingaround 27 different fishing devices and methods. Therecreational boat and shore-based fishing sectors arealso significant components of this fishery.
Up to 70 species are harvested in this fishery aseither targeted or by-product species. Of these, thekey species for which summaries have beenprepared are:• King George whiting• southern calamary (squid)• snapper• garfish.
King George whiting
The State of the Environment Report 1998 reported adrop in the commercial catch of King George whitingfrom 750 tonnes in 1991-92 to 586 tonnes in 1996-97.
Several biological indicators for the fishery havecontinued to show steady levels of recruitment andpopulation biomass, suggesting a sustainable fishery,although in 2000, the seasonal peak in mid-winterpopulation in some areas was noticeably lower than inthe previous four years.
Commercial fishing effort for this species hasdeclined considerably since the late 1970s. A licenceamalgamation scheme1 introduced to the marinescalefish fishery in the early 1990s and the non-transferability of some licences2 have also resulted in aconsiderable reduction in commercial licence numbersfor the whole marine scale fishery from over 700 to398 in 2002.
According to the National Recreational andIndigenous Fishing Survey, the recreational sectortakes approximately 58% of the total King Georgewhiting catch.
Southern calamary
The most recent stock assessment report forcalamary, prepared in 2000, reported decreases inCPUE for the two most common fishing methods inseveral of the seven main calamary fishing zones,suggesting that the fishery may be fully exploited inthose areas. Since 1984/85 commercial catches ofcalamary have steadily increased from 187 tonnes to488 tonnes in 2000/01.
The recreational catch of calamary is alsosignificant, representing approximately 46% ofthe total.
Prawn trawlers operating in the deeper waters ofthe two Gulf systems and the Far West Coast alsocatch some calamary incidentally, however, the size ofthis by-catch is presently unknown. A 1997 estimatesuggested approximately one million mostly juvenilesouthern calamary were captured by prawn trawlers inthe 1996/1997 fishing year.
Snapper
The State of the Environment Report 1998 reportedthat the commercial catch of snapper had declinedconsiderably in the early 1990s. Since then theState-wide catches have increased to record levels.These were 576 and 563 tonnes in 1999/00 and2000/01 respectively.
The recovery in fishery catches has not beenuniform across State waters. The recovery in SpencerGulf has been very strong but stock levels in Gulf StVincent remain relatively poor. The reduction in stockbiomass may relate to habitat modification orover-fishing. The reason for the difference inspecies abundance between the Gulfs warrantsfurther investigation.
The recreational catch in this fishery comprisesapproximately 40% of the total catch.
Garfish
The data for this fishery (from a forthcoming SARDIreport) indicates stable catches, stable or rising CPUE,rising biomass, and declining exploitation rates. Thesefour indicators show a stock steadily becominghealthier over the time period since 1983 for whichdata is available.
Inland fisheries
There are two separately managed commercial inlandfisheries: the River (i.e. River Murray) and the Lakesand Coorong fishery.
The following summaries discuss Goolwa cocklesand Murray cod as these are presently the onlyspecies that have had a fishery assessment reportprepared for them. The State Government is in theprocess of restructuring the commercial river fisheryand has implemented a ban on gill-net fishing in theRiver and a ban on the commercial taking of callop andMurray cod.
Murray cod
Murray cod has been a significant freshwatercommercial and recreational species in this State andis dependent on flooding for successful recruitment.
According to the latest fishery assessment report(Ye et. al., 2000), this species was assessed as fullyexploited. The commercial catch and effort increasedconsiderably in the two years prior to the report withthe total landings of nineteen and fifteen tonnesrespectively.
The State Government banned the commercialtaking of Murray Cod from the River and theCommonwealth Government listed Murray cod as avulnerable species in July 2003.
Goolwa cockle
Since the late 1980s there has been a markedincrease in the catches in this fishery, most notablyfrom 1990 onwards. The total commercial catchpeaked in 2000/01 at 1241 tonnes. The level of catchin this fishery tends to correspond to the level offishing effort.
1 Requires prospective fishers to purchase at least twolicences or purchase an existing amalgamated licencebefore they are allowed to participate in the fishery.2 Such licences cannot be sold or transferred to another operator.
KEY TERMS
Catch Per Unit Effort (CPUE)
refers to the number of kilogramsof fish caught per standard unit offishing effort. (For example, onehour of trawling, or 1000 hooks.The definition of a unit of effortdepends on the fishery beingmonitored.) This provides anindication of the size of the fishpopulation and, therefore, inconjunction with other data, someindication of whether the speciesis fully exploited, under exploitedor over exploited.
By-catch are species caughtincidentally when fishingspecifically for another species.Some of it may be returned to thesea (often dead or dying), whilesome may become byproduct.
Byproduct are non-target speciescaught and sold commercially bythe fishing operator.
Recruitment is the annual influxof new individual fish to a givenfishery. This may occur throughmigration or the growth of youngfish to a catchable size. In somecases, recruitment may be heavilyaffected by annual variations inenvironmental conditions, makingstock levels less predictable.
Total Allowable Commercial
Catch (TACC) is the catch limitestablished for a particular fisherywith the aim of ensuring thatstock levels are maintained at asustainable level. The TACC limitmay be allocated to individualfishers as a quota.
Fully exploited is a term used todescribe a species that is beingfished at close to its maximumsustainable yield.
Over exploited is used todescribe a species that is beingfished beyond the limit which isbelieved to be sustainable in thelong term and beyond which thereis a high risk of stock depletionand collapse.

68
3 Coasts and the Sea
The data on the commercial fishery indicates thatit is sustainable at present. Refinement of managementarrangements for this fishery is continuing.
What impact will over-exploiting ourfisheries have?
Some of the environmental, social and economicramifications of over-exploiting fisheries are listedbelow, to illustrate the broader significancefor sustainability.Reduced biodiversity. The species harvested from theocean each have a place within the ecology of themarine environment and, with a decline in numbers orthe extinction of a species, biodiversity is compromised.See also chapter on Health of the Marine and Coastal
Environment for a further discussion of theenvironmental impact associated with the destructionof marine biodiversity.Loss of employment. If fisheries are not appropriatelymanaged, the livelihoods of those who depend on theseafood industry are threatened. The fishing industryemploys about 4500 people (ABARE, 2003) directly andindirectly through processing and handling. In addition,there are significant flow-on effects in regionalcommunities through the creation of many jobs.Loss of opportunities for recreation. Recreationalfishing is also a significant recreational activity and animportant form of relaxation for many. Hence, withany decline in species numbers, the enjoyment ofmany is compromised.Reduced economic activity. The gross value to SouthAustralia in 2001–02 from the commercial fishingindustry was approximately $208 million. In addition,there is an annual recurrent expenditure of $149 millionby the State’s recreational fishers (RFIRC, 2001).
What are we doing about it?
The State Government is currently undertaking areview of the Fisheries Act 1982 to reflect significantchanges in the management of fisheries over the last20 years. The aim of the review is to ensure that theAct facilitates ecologically sustainable development ofthe State’s living marine and freshwater resources.
A number of fishery management committees
have been established to provide expert advice to theMinister for Agriculture, Food and Fisheries. IndividualFishery Management Committees (FMCs) are in placefor each of seven key South Australian fisheries(Southern Zone rock lobster, Northern Zone rocklobster, blue crab, prawn, marine scalefish, inlandwaters and abalone).
The Fisheries Act 1982 provides for thepreparation of Fishery Management Plans. ThesePlans are designed to ensure that each fishery ismanaged on a sustainable basis while allowing for thecontinued development of the relevant industry. ThePlans provide for annual monitoring of fisheries andalso specify future management directions andstrategies. A management plan is currently beingdeveloped for the marine scalefish fishery and willinclude a harvest strategy for each of the key species.
The aim is to develop more consistent managementmethods for these species.
Annual fishery assessment reports are preparedfor PIRSA and the relevant fisheries managementcommittees by SARDI. These documents bringtogether all available scientific information on thefishery and report on performance indicators detailedin the fishery management plans.
National Guidelines for the Ecologically
Sustainable Management of Fisheries werereleased in 2001. Detailed assessments against theguidelines have been prepared by PIRSA in relation toabalone, rock lobster and prawn fisheries and areawaiting assessment by Environment Australia. Thisprocess provides the first independent assessmentagainst specific sustainability guidelines of SouthAustralia’s export fisheries.
New management arrangements have beendeveloped for the Northern Zone Rock Lobster Fisheryinvolving the introduction of an individually transferablequota system3 and a lower Total Allowable Catch.
The State Government also introduced new
guidelines for recreational fishing in 2001. Theguidelines relate to the type and amount of gear peoplemay use to catch fish and other species, size and baglimits, the closure of certain important areas and thetotal protection of some rare and endangered species.
PIRSA Fisheries is currently developingmanagement arrangements for the charter fishing4
sector. This sector is not specifically regulated atpresent, and no catch history data is collected on thesize or extent of this sector’s catch and effort.
The first national survey of recreational and
indigenous fishing was undertaken in Australia fromMay 2000 to April 2001. Anecdotal reports suggestthat recreational fishing is an increasingly popularpastime among South Australians, and it is importantto consider fishing effort from this sector indetermining fishery management strategies.
Environment Australia conducts the Marine
Species Protection Program which seeks toconserve marine species threatened by human activitysuch as overfishing or marine pollution.
Regional Marine Plans are being developedacross South Australia to attempt to effectivelymanage the diversity of uses for South Australia’smarine environment. The Marine Protected Area
system is also being enhanced to conserverepresentative samples of marine habitat. For furtherinformation on the Marine Planning Framework andMarine Protected Areas, see also chapters on Health
of the Marine and Coastal Environment.
For more information on programs and initiativessee the State of the Environment 2003Supplementary Report.
3 An individually transferable quota (ITQ) refers to anallocation of the Total Allowable Catch for a fishery whichis assigned to one operator. An ITQ can be sold to anotheroperator.4 Charter fishing refers to the hire of services in order toundertake fishing for recreational purposes.

STATE OF THE ENVIRONMENT REPORT 2003 69
FISHERIES
References
Australian Bureau of Agricultural and ResourceEconomics (ABARE) (2003). Australian FisheriesStatistics 2002. ABARE, Canberra.
Boxshall, S. (2001). West Coast Prawn Fishery: DraftFishery Assessment Report to PIRSA for the PrawnFisheries Management Committee. South AustralianFisheries Assessment Series 01/2001. South AustralianResearch and Development Institute, West Beach.
Carrick, N. (2002). West Coast Prawn Fishery: DraftFishery Assessment Report to PIRSA for the PrawnFisheries Management Committee. South AustralianFisheries Assessment Series 02/2002. SouthAustralian Research and Development Institute,West Beach.
Fowler, A.J. (2002). Snapper (Pagrus auratus): FisheryAssessment Report to PIRSA for the Marine ScalefishFishery Management Committee. South AustralianFisheries Assessment Series 01/013. South AustralianResearch and Development Institute, West Beach.
Jones, G.K., Ye, Q., Ayvazian, S. and Coutin, P. (2002).Fisheries Biology and Habitat Ecology of Southern SeaGarfish (Hyporhamphus melanochir) in SouthernAustralian Waters. FRDC Project 97/133. SouthAustralian Research and Development Institute(SARDI) West Beach.
McGarvey, R. and Feenstra, J. (2002, in prep.).Unpublished FRDC report on sea garfish stockassessment model. FRDC grant 1999/193.
McGarvey, R., Feenstra, J.E. and Fowler, A.J. (2000).King George Whiting (Silliganoides punctata). FisheryAssessment Report to PIRSA for the Marine ScalefishFishery Management Committee. South AustralianFisheries Assessment Series 00/03. South AustralianResearch and Development Institute (SARDI),West Beach.
Murray-Jones S. and Johnson J. (2003). Goolwa cockle(Donax deltoides) Fishery Assessment Report toPIRSA for the Inland Waters Fishery ManagementCommittee. South Australian Fisheries AssessmentSeries 2002/21. South Australian Research andDevelopment Institute (SARDI) West Beach.
Parliament of South Australia (1999). The PilchardFishery. Parliament of SA Environment Resources andDevelopment Committee: Thirty Third Report of theCommittee, Second Session, Forty Ninth Parliament.
Recreational Fishing Industry Review Committee(RFIRC) (2001). Review of recreational fishing in SouthAustralia: A management strategy for the sustainabledevelopment of recreational fishing in South Australia.PIRSA, Adelaide
Ward, T.M., McGarvey, R. and Brock, D.J. (2002a).Southern Zone Rock Lobster (Jasus edwardsii) Fishery.South Australian Fisheries Assessment Series 2002/04a. 70 pp.
Ward, T.M., McGarvey R. and Xiao, Y. (2002b).Northern Zone Rock Lobster (Jasus edwardsii) Fishery.South Australian Fisheries Assessment Series 2002/04b. 109 pp.
Ward, T.M., McLeay, L.J., Rogers, P.J., Dimmlich, W.F.,Schmarr, D. and Deakin, S. (2002c). SpawningBiomass of Pilchard (sardinops sagax) in SouthAustralia in 2002. Report to PIRSA Fisheries.
Ward, T.M., McLeay, L.J., Rogers, P.J., Scmarr, D.,Dimmlich, W.F. and Deakin, S. (2001). Sardine(Sardinops sagax). South Australian FisheriesAssessment Series 2001/16.
Ye, Q. (1999). Southern Sea Garfish (Hyporhamphusmelanochir) Fishery Assessment Report to PIRSA forthe Marine Scalefish Fishery ManagementCommittee. South Australian Fisheries AssessmentSeries 99/07. South Australian Research andDevelopment Institute, West Beach.
Ye, Q., Jones, G.K. and Pierce B.E. (2000). Murray Cod(Maccullochella peelii peelii) Fisheries AssessmentReport to PIRSA and for the Inland Waters FisheryManagement Committee. South Australian FisheriesAssessment Series 00/17. South Australian Researchand Development Institute (SARDI) West Beach.
Further information
Australian Fisheries Management Authoritywww.afma.gov.au
Environment Australia – Fisheries and the Environmentwww.ea.gov.au/coasts/fisheries/index.html
Food & Agriculture Organisation of the United Nations– Fisherieswww.fao.org/fi/default_all.asp
PIRSA Fisherieswww.pir.sa.gov.au
SARDI Aquatic Scienceswww.sardi.sa.gov.au/aquatic/index.html

70
3 Coasts and the Sea
Health of theMarine and CoastalEnvironmentTrends
• Area of seagrass along the Adelaide
coastline: DECREASING with 720 hectares
lost between 1995 and 2002.
• Area of mangroves: DECREASING in
selected locations along the South
Australian coastline.
• Development along the South Australian
coastline: INCREASING.
• Pollutant loads in wastewater discharged
into Gulf St Vincent: DECREASING.
• Marine Protected Areas: UP from 3.5% of
total State waters in 1996 to 4.4% in 2002.
Goal
The long term conservation and productivity ofcoastal, estuarine and marine environments throughintegrated management and protection.Living Coast Strategy (Government of SouthAustralia, in prep.)
What are the issues?
South Australia has 4000 kilometres of coastline,ranging from cliffs, rocky shores and sandy beaches inthe South East and West Coast to mud flats, seagrass,samphire and mangrove habitats in the upper St Vincentand Spencer Gulf regions. Our marine environment isan extremely valuable resource. Coastal and marinewaters support large commercial and recreationalfisheries, as well as aquaculture worth approximately$500 million a year to the State’s economy.
Marine and estuarine waters provide habitat for adiverse range of plants and animals, includinginternationally and nationally important species suchas southern right whales, Australian sea lions, dolphinsand the leafy seadragon. Our marine waters areamong the most biologically diverse and unique in theworld, with many endemic species (those found onlyin southern Australia). The beaches provide recreationalfacilities for the community and are part of our culture.
There are many ways in which humans placepressure on coastal and marine environments.Major sources of pollution include treated wastewater(stormwater) that carries a range of pollutants fromroads, agricultural land and other sources; dischargesfrom powerstations and other industrial facilities;shipping and recreational boating. Coastaldevelopment has increased significantly over the lastthirty years. Houses and other buildings constructedalong the coast can disrupt the natural movement ofsand, destroy fragile habitat, result in vegetationclearance, have an impact on the natural beauty of thearea and create additional pressures on stormwater
and sewerage infrastructure. The aquaculture industryand the exploitation of wild fisheries may also, if notmanaged appropriately, exert pressures on marinehealth, particularly in regional locations (these arediscussed in separate chapters). Ballast water frominternational ships is a major source of marine pests.
Many of the pressures that affect SouthAustralia’s coastal and marine environments arefocused in shallow coastal waters where subtidal andsand mudflat habitats exist. These areas are verydiverse and valued for their biodiversity, as well asbeing important habitats for recreationally andcommercially valued species. They are extremelysusceptible to environmental change.
Many of the pressures on our marineenvironment are most acute in or near metropolitanAdelaide and much of the monitoring for marine healthis also conducted in this area. As a consequence, thisreport has a greater focus on the Adelaide region thanother areas of the State.
See also chapters on Aquaculture; Fisheries;Introduced Species; Land Use; and Water
Consumption in Urban Settlements.
Environmental indicators
CONDITION INDICATORS
• Change in the distribution and abundanceof seagrasses (reported on in the State ofthe Environment Report 1998)
Seagrass meadows stabilise marine sedimentsand provide habitat for many species of fish andcrustaceans in their juvenile stages. They areused to provide a surrogate measure of thehealth of the marine environment.• Change in the distribution and abundance
of mangroves (reported on in the State ofthe Environment Report 1998)
Mangroves, like seagrasses, provide habitat formany species of fish and crustaceans in theirjuvenile stages and stabilise marine sediments.They are also used to provide a surrogate measureof the health of the marine environment.• Quality of coastal waters assessed
against national water quality guidelines(reported on in the State of the EnvironmentReport 1998)
Ratings are assigned to water quality accordingto ANZECC water quality guidelines. Provides anindication of the risks marine pollution poses tohuman health and the pressure it is placing onthe health of ecosystems.• Condition of reefs (new indicator)Reefs are highly diverse and productiveecosystems. They are also used to providesome surrogate measure of the health of themarine environment.
SeagrassPhoto: V. Neverauskas, PIRSA
Mangroves at Port WakefieldPhoto: Kym Nicolson
Noarlunga Reef
STATE OF THE ENVIRONMENT REPORT 2003 71
HEALTH OF THE MARINE AND COASTAL ENVIRONMENT
FindingsMaking progressThe Living Coast Strategy, to be released in December 2003, is a new South Australian initiative that aims toachieve sustainable management of the coast and marine environment through the implementation ofecosystem-based management practices.
Marine planning is also undergoing review. Six ecosystem-based regional marine plans are to bedeveloped to provide a Marine Planning Framework for the State. A pilot marine plan for Spencer Gulf iscurrently in draft form and will be released for public consultation late in 2003. Priority must be given tocompleting Marine Plans for all regions.
Environment Improvement Programs have been commenced or completed at major wastewatertreatment plants along the Adelaide metropolitan coastline, with the aim of reducing the level of pollutantsentering Gulf St Vincent.
The ageing Port Adelaide Wastewater Treatment Plant is due to close in December 2004, with wastewaterbeing redirected to upgraded facilities at Bolivar. This should lead to reduced nutrient levels entering thePort River.
The Marine Protected Area system is being expanded in an attempt to create a network that is morerepresentative of the diverse range of marine ecosystems in South Australia.
The Adelaide Coastal Waters Study will provide valuable scientific information on the marine environmentthat will underpin the development of sustainable management strategies.
Attention requiredThe continued development of coastal areas, if allowed to proceed unchecked and without consideration ofthe long term and cumulative impact on the environment, will irreversibly affect the nature of South Australia’scoastline and lead to significant damage that may be difficult and costly to repair.
The loss of seagrass continues along sections of Adelaide’s metropolitan coastline, particularly nearBolivar, and in some regional locations such as Beachport and parts of the upper Spencer Gulf, the West Coastand Kangaroo Island.
Poor water quality continues to threaten the health of aquatic plant and animal communities in the PortRiver. Water quality in the Patawalonga Lake and beaches adjacent to the Barcoo Outlet are of poor quality forrecreational purposes in the days immediately following a storm.
There is insufficient information about the extent of changes in the health and distribution of mangrovecommunities. Anecdotal information suggests that there has been decline in some areas, but a lack of specificinformation makes it difficult to respond appropriately.
Reefs along the northern section of the Adelaide metropolitan coastline near West Beach and Semaphoreare in poor condition. This is due to pollution from wastewater and stormwater discharges.
Around 85% of treated wastewater and stormwater is currently discharged to sea. More opportunitiesmust be taken to re-use these valuable resources.
What more should we be doing?The Environment Protection Authority recommends that:3.12 A new Coast and Marine Management Act is developed to replace outdated legislation. High priority
should also be given to the implementation of a Marine Planning Framework for the State that focuseson an ecosystems based approach to management.
3.13 To ensure a more consistent and environmentally sensitive approach to coastal planning processes,revisions should be made to the State Planning Strategy, Development Plans and the developmentassessment process as a matter of priority.
3.14 A comprehensive estuarine monitoring program for South Australia is developed and implemented withlinks to monitoring work undertaken in other States. A comprehensive and ongoing monitoring programfor mangroves should also be established.
3.15 The re-use of stormwater and treated wastewater is encouraged on a larger scale through improvedurban and water supply planning, the development of re-use targets, the future replacement of watersupply infrastructure that accommodates re-use and more water-sensitive building design.
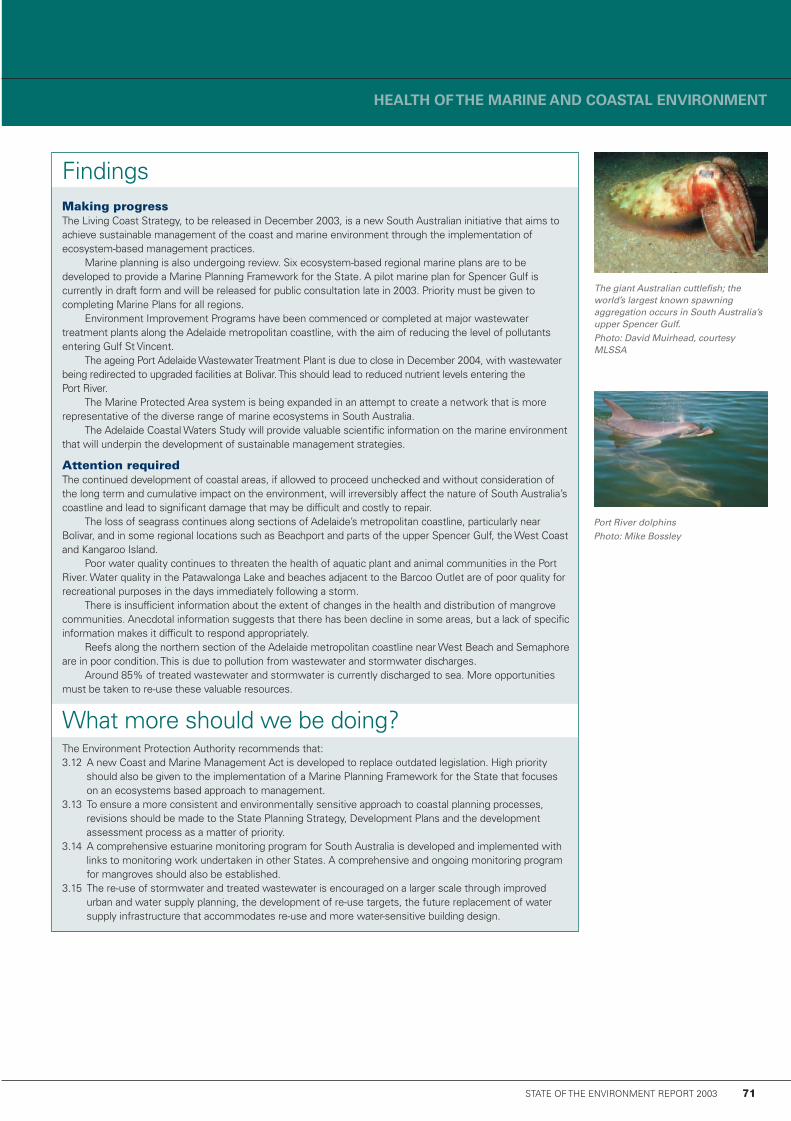
The giant Australian cuttlefish; theworld’s largest known spawningaggregation occurs in South Australia’supper Spencer Gulf.Photo: David Muirhead, courtesyMLSSA
Port River dolphinsPhoto: Mike Bossley

72
3 Coasts and the Sea
Port River
PRESSURE INDICATORS
• Location, number and volume of marinepollution incidents (new indicator)
Indicates the frequency and severity ofpotentially environmentally damaging incidentssuch as oil spills.• Other established marine pollution
sources (new indicator)Discusses established marine pollution sourcesother than stormwater and sewage outfalls.• Volume of stormwater and effluent
discharged to the marine environment(reported on in the State of the EnvironmentReport 1998)
The volume of stormwater and effluentdischarged and the pollutants carried with itaffect marine water quality.• Coastal development (new indicator)Coastal development places pressure onbeaches, dunes and nearshore environments.
RESPONSE INDICATORS
• Beach replenishment and stabilisationprograms (new indicator)
Beach replenishment is a costly and necessaryexercise to maintain our coastlines.• Area held in marine protected area
(reported on in the State of the EnvironmentReport 1998)
Examines the extent and representativeness ofthe marine reserve system. Protected areas arenecessary to help protect marine biodiversity.• Volume of stormwater and treated
wastewater re-used (reported on in theState of the Environment Report 1998)
Stormwater and wastewater re-use reducespressure on both terrestrial and marine aquaticenvironments.
What is the current situation?
CONDITION INDICATOR: Change inthe distribution and abundanceof seagrasses
Seagrasses are flowering plants, unlike seaweedswhich are a form of algae. The continuing loss ofseagrass in many of South Australia’s coastal regionsis a major concern for the health of the marineenvironment. Seagrasses contribute significantly tonutrient cycles, provide important fish nursery areasand habitat for many other plant and animal species.High nutrient levels (mainly nitrates and phosphates)are a major cause of seagrass loss. High levels ofnutrients promote the rapid growth of plant life,especially microalgae, which in turn can reduce oxygenlevels in the water (this process is called‘eutrophication’). This has a negative effect on allmarine life, often resulting in death.
The most extensive seagrass meadows inSouth Australia occur in the Spencer Gulf and Gulf StVincent; they also grow along sections of westernEyre Peninsula and in the South East. Species ofPosidonia tend to be most dominant.
Between 1995/96 and 2002, it is estimated thatapproximately 720 hectares of seagrass was lost inthe Gulf St Vincent in a study area stretching fromNorth Haven to Sellicks Beach (EnvironmentInformation, 2003). This is in addition to the 5000hectares of seagrass that had been lost off themetropolitan Adelaide coastline since 1935, asreported in the State of the Environment Report 1998.
The discharge of sludge (the solid by-product ofwastewater treatment) from the Glenelg and PortAdelaide wastewater treatment plants from 1968-1992and 1978–1992 respectively has resulted in the loss oflarge areas of seagrasses surrounding the point ofdischarge for these outfalls. Following the closure ofthese treatments plants (sludge is now disposed of onland), a slow, steady recovery of seagrass has beenobserved. At the Port Adelaide outfall, initial studieshave shown a 32.6% cover of seagrass. This indicatesthat seagrass communities can naturally recover whenthe pollution source is removed (Bryars andNeverauskas, 2001). Ongoing attempts to replantseagrass on the metropolitan coast has so far met withlittle success (Coast Protection Board, pers. comm.).
There have also been significant losses ofseagrass beds in the Spencer Gulf near Port Pirie,Whyalla, Boston Bay and Proper Bay (DEH, 2003;Resource Information, 1999b; Resource Information,1999c); in Rivoli Bay in the South East (Seddon et. al.,in prep.); in Smoky Bay and Coffin Bay on the West
Coast, and in Kangaroo Island’s Western Cove(Bryars et. al., 2003; EGI, 2002b; EGI, 2002c).
CONDITION INDICATOR: Change inthe distribution and abundanceof mangroves
Most mangrove and saltmarsh (or samphire)communities are found in the upper areas of SpencerGulf and Gulf St Vincent. There are also somecommunities at the eastern end of the GreatAustralian Bight. All South Australian mangrove forestsare composed exclusively of one species, the greymangrove (Avicennia marina var. resinifera). Mangrovecommunities are under threat from high nutrientlevels, industrial developments, trampling byrecreational fishers, changes in natural sedimentflows, large drifts of seaweed and seagrass thatsmother young seedlings and adult trees, boat ramps,marinas, land reclamation and oil spills.
In the Gulf St Vincent, dieback of at least 250hectares of mangroves has occurred around the Bolivarsewage outfall since the 1950s. These have beensmothered by the sea lettuce, Ulva lactuca, the growthof which has been promoted by elevated nutrient levelsas a result of the sewage outfall (ASOEC, 2001). Muchlarger areas of mangroves in the vicinity of Bolivar arealso in poor health. The tidal wetlands in this regionprovide important nursery areas for commercial andrecreational fish and the loss and declining health ofmangrove communities could have a significant impacton the abundance of these fish species.
In addition to Bolivar, other sites of concern formangroves include areas in the Spencer Gulf aroundPort Augusta and Point Davis near Port Pirie, and someareas along the West Coast such as Touville Bay.

STATE OF THE ENVIRONMENT REPORT 2003 73
HEALTH OF THE MARINE AND COASTAL ENVIRONMENT
Map 3.1: The health of reefs along the Adelaide metropolitan coastlineSOURCE: EPA, 2003

74
3 Coasts and the Sea
However, given the lack of information regarding changein the extent of mangroves in these areas, it is difficultto determine the nature of the risk to mangroves.
CONDITION INDICATOR:Condition of reefs
South Australia’s reefs are generally rocky outcropscovered in marine algae and invertebrates, as distinctfrom the formations established by coral species thatare found in tropical waters. South Australia’s reefs arehighly productive, highly diverse, unique ecosystems.
A recent study of reefs along the Adelaidemetropolitan coastline (EPA, 2003) showed that thenorthern reefs are in the poorest health. These reefsare adjacent to the outfall from the Glenelg and Bolivarwastewater treatment plants and the majority ofAdelaide’s stormwater discharges through the PortAdelaide, Torrens and Patawalonga Rivers (Map 3.1).
The central reefs are generally regarded as beingin moderate to good condition. There is concern aboutthe future effects of urban expansion on these reefs,with associated increases in urban stormwater andwastewater discharges.
The southern reefs are the least affected bycoastal discharges. These reefs are also subject togreater wave action and water movement than othersalong the coastline and, overall, are considered to be ingood health.
CONDITION INDICATOR: Quality ofcoastal waters assessed againstnational water quality guidelines
The health of marine habitats such as seagrass beds,mangrove forests and reef ecosystems is heavilyinfluenced by water quality. In South Australia thesecommunities have evolved to live in water with lowlevels of land-sourced nutrients and turbidity due tothe absence of significant river and stream inflows.
The amount of pollution entering the marineenvironment has increased significantly in associationwith coastal development and the urbanisation ofcoastal regions. Marine and estuarine monitoringprograms conducted by the EPA assess the quality ofcoastal waters in key locations against national waterquality guidelines for recreational use and ecosystemhealth. Data on heavy metals, nutrients and algallevels is collected. A rating is then given depending onhow the water is to be used. A ‘good’ rating meansthat levels are better than the guideline most of thetime; a ‘moderate’ reading means that the guidelinesare exceeded only occasionally; and a ‘poor’ ratingmeans that the guidelines are exceeded regularly.
Map 3.2 indicates water quality monitoring resultsfrom 1998 to 2002 for a range of locations along theSouth Australian coast. On the whole, water quality inthe Adelaide metropolitan bathing waters forrecreational purposes is rated as good to moderate;however, elevated levels of heavy metals (nickel) andnutrients (ammonia) compromise ecosystem health.This reduction in water quality is consistent withseagrass losses observed in these waters and thedecline in reef health in the northern reefs (Glenelg toSemaphore) along the Adelaide coastline.
Estuaries such as the Port River and Barker Inlet
are particularly sensitive environments. They act astransition zones between the land and the sea, wherefresh and salt water meet and mix. As a result, theyalso act as filters and channels for the pollutants thatrun off the land and into the marine environment.
The environmental health of the Port River hasbeen damaged, a legacy of the long term pollution ofthe Port River system. This was identified as a majorissue in the State of the Environment Report 1998and remains so today. Monitoring indicates thatelevated levels of heavy metals (cadmium and zinc),algae and nutrients compromise ecological health(Map 3.2). The State of the Environment Report 1998reported that sediment in the Port River wasmoderately contaminated in the upper reaches, withhigh levels of heavy metals recorded at some sites.There is no analysed monitoring data available toillustrate any change since the State of theEnvironment Report 1998.
Good to moderate water quality in both BostonBay (near Port Lincoln) and Nepean Bay (Kangaroo
Island) suggests that regional coastal water quality isgenerally likely to be good, with the possible exceptionof areas close to local pollution sources. Regionalwater quality was not reported on in the State of theEnvironment Report 1998.
PRESSURE INDICATOR: Location,number and volume of marinepollution incidents
The EPA records dozens of marine pollution incidentsevery year. Most are small in size and have a minimalimpact on the marine environment. Possibly the mostsignificant marine pollution incident since the State ofthe Environment Report 1998 occurred in 1999 at thePort Stanvac oil refinery1. When a pipe connectionbetween a tanker and the refinery failed, 230 tonnes ofOman crude oil was discharged three kilometresoffshore. Weather conditions at the time of the spill andthe effective use of dispersants ensured that most ofthe oil did not reach the shore. Subsequent EPA studiesof the coast and reefs have indicated that no significantenvironmental damage resulted from the spill.
PRESSURE INDICATOR: Otherestablished marine pollution sources
Two other major sources of marine pollution aremineral processing discharges and thermal dischargesfrom powerstations and industrial facilities.
Discharges of heavy metals from the PasmincoLead Smelter at Port Pirie into Spencer Gulf presentlyexceed the criteria listed in the EnvironmentProtection (Marine) Policy. Since 1993, Pasminco hasmade changes that have halved heavy metaldischarges over 1990 levels. A project that aims toreduce heavy metals to around 5% of 1990 levels isbeing investigated. Facilities associated with thermal
Boat launching facility at Smoky Bay,Eyre Peninsula; changes to sandmovement patterns as a result ofdevelopment cause problems withseagrass entrapment.Photo: Alison Eaton, Coast andMarine Branch
Marina development at Tumby BayPhoto: Alison Eaton, Coast andMarine Branch
KEY FACTS
• Between 1995/96 and 2002,
approximately 720 hectares of
seagrass was lost along the
Adelaide metropolitan coastline.
• Dieback of at least 250
hectares of mangroves has
occurred around the Bolivar
Wastewater Treatment Plant
since the 1950s.
1 In April 2003, Mobil announced that, for economicreasons, it would cease operations at the Port Stanvacrefinery within several months.

STATE OF THE ENVIRONMENT REPORT 2003 75
Map 3.2: Coastal water quality results for key locations along the South Australian coastline – 1998–2002Results for metropolitan bathing waters are an aggregate of results from eight different beach locations along the metropolitan coastline.Assessments are based on Guidelines for the protection of aquatic ecosystems that have been established by the Australian and New Zealand Environment and ConservationCouncil (ANZECC, 2000) and, for recreational use, the National Health and Medical Research Council (NHMRC, 1990).
SOURCE: EPA
HEALTH OF THE MARINE AND COASTAL ENVIRONMENT

76
3 Coasts and the SeaM
ap 3.3: Coastal development betw
een V ictor Harbor and Port Elliot – pre-1970 and post-1970SOURCE: DEH

STATE OF THE ENVIRONMENT REPORT 2003 77
HEALTH OF THE MARINE AND COASTAL ENVIRONMENT
2 Monitoring results of the lake and beaches adjacent tothe pipe can be accessed at www.environment.sa.gov.au/reporting/coast3 See the State of the Environment 2003 Supplementary Reportfor maps of other areas affected by coastal development.
discharges to the Spencer Gulf include the PortAugusta powerstations, the Port Pirie lead smelterand the Whyalla steelworks.
The Penrice Soda Products refinery at Osbornehas discharged large quantities of ammonia into thePort River for many years. In the light of improvedenvironmental knowledge, this practice is nowunacceptable. It is suggested that ammoniaconcentrations at the point of discharge into the river(in combination with warmer temperatures and highpH) may be high enough to be toxic (EPA, 2002).An Environment Improvement Program is presentlybeing developed with the aim of reducing ammoniaconcentrations in the wastewater discharged.
Several facilities in and around the Port Riverrelease hot water, including the Pelican Point, TorrensIsland and Osborne powerstations. Studies indicatethat there may be implications for local communitiesin the immediate vicinity of these discharges(Thomas et. al., 1986; Jones et. al., 1996).
PRESSURE INDICATOR: Volume ofstormwater and effluent dischargedto the marine environment
Stormwater and effluent discharges are a majorsource of marine pollution. There are fourwastewater treatment plants located on the Adelaidemetropolitan coastline which discharge treatedwastewater out to Gulf St Vincent. These arelocated at Christies Beach, Glenelg North, PortAdelaide and Bolivar. In 2001/02 around 85% (or77,329 megalitres) of this treated wastewater wasdischarged to sea. Figure 3.3 indicates the trendsince 1995/96. Despite a reduction in the volume oftreated wastewater discharged in recent years,nutrient enrichment and eutrophication of marinewaters continues.
On average, South Australia generates130 gigalitres of stormwater every year. Around110 gigalitres of this is discharged directly to sea.This is more than the amount piped from the RiverMurray to supplement Adelaide’s water supply.
There are four wastewater treatment plantsdischarging into Spencer Gulf, located at PortAugusta East, Port Lincoln, Port Pirie and Whyalla.All treated wastewater from these plants isdischarged directly to the Gulf. In 2001/02 thisamounted to 4057 megalitres. Finger Point (nearMount Gambier) is the only wastewater treatmentplant discharging directly to coastal waters in theSouth East. All treated wastewater is discharged tosea. In 2001/02 this amounted to 1813 megalitres.
The development of the Barcoo Outlet hasseen a significant change to the management offloodwater in Adelaide since the State of theEnvironment Report 1998. There has been someconjecture about the impact of this development onthe environment. While it has improved water quality
Onshore aquaculture development forabalone at Boston PointPhoto: Alison Eaton, Coast andMarine Branch
Storm at Tennyson
in the Patawalonga Lake for most of the time, after astorm the Patawalonga Lake and the beaches adjacentto the outlet are unsafe for swimming, as they werebefore the pipe’s construction.2
PRESSURE INDICATOR:Coastal development
Increasing and ad hoc development along the SouthAustralian coastline is placing significant pressure onfragile coastal and marine environments and impactingon coastal scenery. Such development includeshousing, on-shore aquaculture operations, marinas andboat ramps.
Land subdivision for housing development alongmany sections of the South Australian coastline hasincreased significantly over the last thirty years and isset to continue as more of our population invests in aholiday home or reaches retirement age and seeks aless demanding lifestyle. Map 3.3 indicates theincrease in housing development pre-1970 and post-1970 in the Victor Harbor-Port Elliot area3. This isplacing pressure on infrastructure, increasing thevolumes of stormwater and wastewater generatedand impacting on scenic amenity.
The demand for boat ramps and marinas is alsoincreasing as coastal populations continue to grow andpeople pursue water-based recreational activities suchas boating and fishing. If sited incorrectly these candisrupt sand movement, degrade habitat and waterquality, and disrupt the natural flows of coastal creeksand streams. On-shore aquaculture developments,particularly on the Eyre Peninsula, are also causingsimilar environmental impacts.
One of the major issues associated withincreasing coastal development is the erosion of theforeshore and a change in the rate of sand movementalong the coast. While Adelaide’s coastline isreceding naturally (the rate of new sand coming intothe system from the south is not equal to that whichmoves northward due to the prevailing direction ofwind and wave energy) increased coastaldevelopment has exacerbated this problem. Thecoast is now so highly developed that it is necessaryto artificially maintain the beaches and dunes toprotect these developments.
The Holdfast shores development and marina andthe Adelaide Shores boat harbour at West Beach haveinterrupted the movement of sand along a stretch ofcoast from Glenelg to West Beach and, as such,ongoing management is required to maintain sandmovement along the adjacent coast.
There is currently major sand accumulation atLargs Bay, while sand has been depleted atSemaphore Park. Sand is carted from Semaphore tomaintain this beach and protect coastal properties.An offshore breakwater is soon to be constructed inan attempt to reduce the rate of sand movement.From 1990 to 1997, sand was dredged from offshorenear Port Stanvac and pumped onto the beach atBrighton to supplement depleted sand supplies. Sandresources at Port Stanvac are now used up. Futuresand supplies will be sourced from further afield.Exploitation of these is likely to have an associatedimpact on the local environment.
1995
/96
SOURCE: SA WATER
Figure 3.3: Treated wastewaterdischarged to sea from majormetropolitan wastewater treatmentplants – 1995/96–2001/02
Meg
alitr
es
68000
70000
72000
74000
76000
78000
80000
82000
84000
1996
/97
1997
/98
1998
/99
1999
/00
2000
/01
2001
/02
YEAR

78
3 Coasts and the Sea
In regional areas, the pressures on beaches anddunes are generally less intense than thoseexperienced along the Adelaide metropolitan coast.However, there are still localised problems, and manybeaches and dunes have been affected by farmingmethods, grazing by animals such as rabbits, andmisuse, such as uncontrolled access by four-wheel-drive vehicles.
Perhaps the most significant problem forregional dunes and beaches occurs where shacks,other residential development and land division hasoccurred in a linear fashion along the coast. Shacks,formerly on Crown Land that has since been madefreehold (privately owned), are a significant issue in anumber of regional areas, as many are located veryclose to the shoreline. As a result, there are issuesassociated with the protection of these shacks fromcoastal erosion.
Other pressuresIntroduced marine species are a significant threat tomarine biodiversity. These are discussed in the chapteron Introduced Species. Aquaculture and commercialand recreational fisheries both have the potential toplace additional pressure on the marine environment ifinappropriately managed. See chapters onAquaculture; and Fisheries for more information.
What impact will deterioratingcoastal and marine health have?
Some of the environmental, social and economiceffects of deteriorating coastal and marine health arelisted below to illustrate the broader significancefor sustainability.Loss of marine biodiversity. Deteriorating waterquality (via wastewater, stormwater and industrialdischarges), inappropriately managed aquacultureactivities, recreational and commercial fishing activitiesand introduced species can all affect marinebiodiversity. Our marine waters are among the mostbiologically diverse in the world and we cannot affordto compromise the health of plants and animals thatinhabit South Australian waters. These waters arehome to nationally and internationally importantspecies, provide habitat for unique communities ofplants and animals and support large commercial andrecreational fisheries.Reduced commercial fish stocks. A less healthymarine and estuarine environment will result inreduced fish stocks and therefore reduced incomefrom the State’s commercial fisheries. Also, thereputation of our produce in international marketswould suffer, eliminating the premium associated witha product sourced from a clean environment.Reduced opportunities for aquaculture. Theaquaculture industry relies on good quality waters.Reduced water quality would compromiseaquaculture production.Increased degradation and loss of fragile coastal
areas. Increasing development along the SouthAustralian coastline (such as marinas and boat ramps)and the loss of stabilising seagrass beds due todeteriorating water quality is increasing coastal erosionand sand loss. This threatens valuable coastal habitat
and incurs high costs associated with rehabilitationand sand replacement.Loss of coastal swamps and native vegetation.
Increasing coastal development is leading to thereclamation of important coastal wetlands andswamps and the clearance of native vegetation.Loss of recreation and tourism opportunities. Lesshealthy marine, estuarine and coastal environmentscould affect tourism. If the water is not safe to swim inor the beach has been washed away, the humanexperience of our natural assets is compromised.Deteriorating coastal and marine health has manyflow-on effects for the community, particularly giventhat most South Australians live relatively close to thecoast. Recreational opportunities may becompromised, such as swimming, surfing, diving andfishing, as would opportunities for employmentthrough fisheries and tourism.Loss of sea views. Some of South Australia’s seaviews are among the most remarkable in the world.Continuing and inappropriate development along thecoast will compromise these views.
What are we doing about it?
RESPONSE INDICATOR:Beach replenishment andstabilisation programs
The Adelaide beaches (Gulf St Vincent region) are theonly sites where there is significant beachreplenishment. On average approximately 100,000cubic metres of sand is placed on these beaches fromoutside sources each year by the Coast ProtectionBoard.4 A further 120,000 cubic metres is eitherbypassed along the beach or shifted from areas wheresand has accrued to areas where it has been lost.Although this program is not conducted annually, thetotal cost has been approximately $1.4 million per yearin recent years. This estimate does not include thecost of bypassing and dredging sand in and aroundHoldfast Shores and the Adelaide Shores boat harbour,which costs approximately $1.7 million per year.A small amount of beach replenishment (severalhundred cubic metres, less than $10,000 annualaverage per year) occurs within bays in the South
East and along the Eyre Peninsula.
RESPONSE INDICATOR: Area heldin Marine Protected Areas
The network of Marine Protected Areas (MPAs) beingdeveloped in South Australia attempts to provide forthe conservation of South Australia’s marinebiodiversity by protecting a sample of all ecosystemtypes across the State. Since the State of theEnvironment Report 1998 (using 1996 figures), thenumber of Marine Protected Areas has increasedfrom 27 to 33 and the total area protected from197,905 to 265,677 hectares (Figure 3.4). This is anincrease from 3.5% to 4.4% of total State marinewaters. However, the current network of MPAs doesnot provide a comprehensive, effective and fullyrepresentative network of ecosystem types in South
Figure 3.4: Number and area of marineprotected areas in South Australia
Num
ber
SOURCE: DEH, 2002
Number MPAs
Area MPAs (000’s ha)
0
5
10
15
20
25
30
35He
ctar
es (0
00’s)
0
50
100
150
200
250
300
1966
1969
1972
1975
1978
1981
1984
1987
1990
1993
1996
1999
2002
YEAR

STATE OF THE ENVIRONMENT REPORT 2003 79
HEALTH OF THE MARINE AND COASTAL ENVIRONMENT
Hindmarsh River Estuary, Victor Harbor,Fleurieu Peninsula, South AustraliaPhoto: South Australian TourismCommission
4 Sand bypassing programs for harbours are carried outindependently of the beach replenishment program byTransport SA and these are not included in the figures above.
Australia’s marine environment. Many habitat typesare under-represented, most MPAs are too small, arerelatively isolated from each other and are notmanaged or assessed.
A shift in focus for marine management in recentyears has seen the strategy for MPAs evolve to focuson the protection of ecosystem types withconsideration given to their full range of uses. Planningfor additional Marine Protected Areas is presently inprogress for all South Australian waters.
RESPONSE INDICATOR: Volumeof stormwater and treatedwastewater re-used
Over recent years there has been a change in attitudetowards wastewater management, driven by advancesin technology, water pricing and regulation. It is nowseen as a resource rather than a byproduct to bediscarded. The amount of treated wastewater re-usedhas increased from 7.6% in 1995/96 to 15% in2001/02. However, considering that South Australia isa national and international leader in the developmentof water re-use technology more effort needs to bemade in this regard (see also chapter on Water
Consumption in Urban Settlements).The amount of urban stormwater re-used is
around 20 gigalitres (or 15% of the total generated)per year. This is used predominantly for irrigating parksand gardens. The State of the Environment Report1998 predicted that by 2003 we would be re-using29% of our treated wastewater and stormwater.Clearly this has not been achieved.
Policy and programsThe Living Coast Strategy, currently in preparation,will be South Australia’s newest initiative that aims tosee sustainable management of the coast and marineenvironment through the implementation ofecosystem-based management practices. Itsobjectives include the integration of planning andmanagement across the coast and marine zone(a major issue identified in this Report) and theconservation of coast and marine biodiversity andecosystems. Its success will depend upon a whole-of-Government approach to ensure that actions andstrategies are coordinated and complementary. It isexpected that the Living Coast Strategy will bereleased in late 2003.
The Environment Protection (Water Quality)
Policy (2003) commenced on 1 October 2003 andprovides, for the first time, a State-wide approach tothe protection of water quality across all SouthAustralian water bodies, including marine waters. Itwill replace the Environment Protection (Marine) Policy(1994) and the Environment Protection (Vessels andInland Waters) Policy (1998). It includes the use ofmandatory provisions to ensure that essentialpractices are met and the use of codes of practice
that will describe best practice environmentalmanagement for particular activities.
A State Government Marine Managers’ Forum
was established in 1999. The primary aim is to reducethe difficulties associated with cross-agencyresponsibilities in marine management. The forum also
informs State Government policy on a variety of marinemanagement issues and determines research priorities.
Work has commenced on the development of anEstuary Policy. This will outline clear objectives andactions to promote the sustainable use of estuaries inSouth Australia and increase awareness of the need forestuary conservation. In addition, recommendations forspecific estuary management will be developed forRegional Natural Resource Management Plans.
Marine planning is also undergoing review.This was a commitment made in the 1998 publicationOur Seas and Coasts: A Marine and EstuarineStrategy. Six ecosystem-based regional marine planswill be developed to provide a Marine PlanningFramework for the State and to effectively manage thediverse and potentially conflicting range of activitiesthat occur in marine and coastal areas. A pilot marineplan for Spencer Gulf is currently in draft form andwill be released for public consultation late in 2003. Amarine plan for Gulf St Vincent is also beingdeveloped. Plans for other regions must be developedas a priority.
A series of multiple use marine protected
areas is proposed to conserve representativeexamples of South Australia’s marine biodiversity.A marine reserve covering the Encounter Bay,Backstairs Passage and northern end of KangarooIsland is being developed as a pilot project.
The Adelaide Coastal Waters Study began in2001. The study seeks to address gaps in knowledgeabout the marine environment of Gulf St Vincent.It focuses on chemical, physical and biologicalprocesses and will provide some of the backgroundknowledge required to enable appropriatemanagement for sustainability.
The EPA conducts marine water qualitymonitoring at key areas around the State. Recentexpansion of the EPA’s Water Quality Monitoring
Program and completion of the Adelaide CoastalWaters Study will provide greater understanding of ourcoastal and marine waters to support managementdecisions and enable the success of managementstrategies to be monitored.
In recent years SA Water has undertakensignificant Environment Improvement Programs
(EIPs) at its metropolitan wastewater treatment plants(WWTP). As a consequence, nutrient (nitrogen andphosphorous) loads for the year 2002/03 are expectedto be reduced by 65% from Christies beach WWTPand by 72% at the Glenelg WWTP. Improvements tothe Bolivar WWTP are expected to produce a 45%reduction in nitrogen levels discharged to sea. Anupgrade of the Port Pirie wastewater treatment planthas commenced and, when operational, will reducenutrients, suspended solids and dissolved oxygenreaching Second Creek and ultimately Spencer Gulf.
There are also a number of community and
education initiatives that aim to improve ourunderstanding and management of coast and marineenvironments. The Coast and Marine Education

80
Framework developed by the Department forEnvironment and Heritage in 2003 provides avaluable web-based educational resource for teachersand students that links directly with the SouthAustralian curriculum.
The Marine and Coastal Community Network
promotes a more cooperative and coordinated approachto marine and coastal planning and management bybringing together all interest groups, both Governmentand non-Government. Coastcare is now wellestablished in South Australia and, to date, more than$1.22 million has been spent on a variety of projects.
For more information on programs and initiativessee the State of the Environment 2003Supplementary Report.
References
Australian and New Zealand Environment ConservationCouncil (2000). Guidelines for fresh and marine waterquality (2000). ANZECC.
Australian State of the Environment Committee(ASOEC) (2001). Coasts and Oceans. Australia State ofthe Environment Report 2001 (Theme Report), CSIROPublishing on behalf of the Department for Environmentand Heritage, Canberra.
Bryars, S. and Neverauskas, V.P. (2001). Naturalrecolonisation of seagrass at a disused sewage sludgeoutfall in Gulf St Vincent: Preliminary results of anunderwater survey. In Seddon, S. & Murray-Jones, S.(Eds) Proceedings of the seagrass restoration workshopfor Gulf St Vincent 15–16 May 2001. Department forEnvironment and Heritage and SARDI Aquatic Sciences,Adelaide, South Australia. pp 80–82
Bryars, S., Neverauskas, V., Brown, P., Gilliland, J., Gray,L., and Halliday, L. (2003). Degraded SeagrassMeadows and Evidence of Eutrophication in WesternCove, Kangaroo Island. Fish Habitat Program, PrimaryIndustries and Resources South Australia, Adelaide.
Department for Environment and Heritage (DEH)(2003). Focus: A Regional Perspective of Spencer Gulf.Department for Environment and Heritage, Adelaide.
Environment and Geographic Information (EGI) (2002b).Seagrass Mapping of Western Cove using Multi-temporal Satellite Imagery; Western Cove, KangarooIsland, South Australia. SA Department for Environmentand Heritage, Adelaide.
Environment and Geographic Information (EGI) (2002c).Nearshore Seagrass Mapping; Cygnet River, KangarooIsland, South Australia. SA Department for Environmentand Heritage, Adelaide.
Environment Information (2003). Nearshore SeagrassChange between 1995/96 and 2002: AdelaideMetropolitan Area – North Haven to Sellicks Beach. SADepartment for Environment and Heritage, Adelaide.
Environment Protection Authority (EPA) (2002). WaterMonitoring Report: Ambient Water Quality of the PortRiver Estuary 1995–2000. Environment ProtectionAuthority, Adelaide.
Environment Protection Authority (EPA) (2003).The health of subtidal reefs along the Adelaide
metropolitan coastline 1996-99. South AustralianEnvironment Protection Authority, Adelaide.
Government of South Australia (in preparation).The Living Coast Strategy.
Jones, G.K., Baker, J., Edyvane, K. and Wright, G.(1996). ‘Nearshore fish community of the Port River –Barker Inlet Estuary, South Australia: 1. The effect of thethermal effluent on the fish community structure, anddistribution and growth of economically important fishspecies’. Marine and Freshwater Research, 47:785–99.
National Health and Medical Research Council (1990).Australian Guidelines for Recreational Use of Water.Canberra, NHMRC.
Resource Information (1999b). Nearshore SeagrassChange between 1970s and 1996; Mapped UsingDigital Orthophotography, Port Lincoln Proper andBoston Bay South Australia. Report prepared for theEPA, SA Department for Environment, Heritage andAboriginal Affairs, Adelaide.
Resource Information (1999c). Nearshore SeagrassChange between 1989 and 1997; Mapped UsingLandsat TM Satellite Imagery, Spencer Gulf, SouthAustralia. SA Department for Environment Heritage andAboriginal Affairs, Adelaide.
Seddon, S., Miller, D., Fotheringham, D., Burgess, S.and McKechnie, J. (in prep.). Beachport seagrass lossand links to drain M in the Wattle Range catchment.Report to the Coast and Marine Branch (DEH). SARDIAquatic Sciences, Adelaide.
Thomas, I.M., Ainslie, R.C., Johnstone, D.A., Offler,E.W. and Zed, P.A. (1986). The Effects of Cooling WaterDischarge on the intertidal fauna of the Port RiverEstuary, South Australia. Trans. R. Soc. S. Aust. 110(4),159–172, 28 Nov, 1986.
Further information
Coastcare – South Australiawww.ea.gov.au/coasts/coastcare/state/sa/
index.html
Department for Environment and Heritage (SA) –Coasts and Marine Directoratewww.environment.sa.gov.au/coasts/index.html
Environment Australia (National) – Coasts and Oceanswww.ea.gov.au/coasts/index.html
Environment Protection Agency (SA) – AdelaideCoastal Waters Studywww.environment.sa.gov.au/epa/acws.html
Environment Reporting (SA) – Coasts and Marinewww.environment.sa.gov.au/reporting/coast/
index.html
Marine and Coastal Community Networkwww.mccn.org.au
SA Water (SA) – Information on Wastewater andStormwater systemswww.sawater.com.au
United Nations Environment Program (International) –Marine and Coastalwww.unep.org/themes/marine
Hindmarsh River Estuary, Victor Harbor,Fleurieu Peninsula, South AustraliaPhoto: South Australian TourismCommission