3. design of experiments (doe) (analysis of...
TRANSCRIPT

1
3. Design of Experiments (DOE)(Analysis of Variance – ANOVA)
Hae-Jin ChoiSchool of Mechanical Engineering,
Chung-Ang University

SCHOOL OF MECH. ENG.CHUNG-ANG UNIVERSITY
Advanced Design for Complex Systems
What is Design of Experiments (DOE)?
n Experiments are used widely in the engineering world ¨ Process characterization & optimization¨ Evaluation of material properties¨ Product design & development¨ Component & system tolerance determination
n Design of Experiments (DOE) is;¨ Planning experiments or tests to save resources
(time and money)¨ Analyzing results of experiments or tests to
characterize your system
2

SCHOOL OF MECH. ENG.CHUNG-ANG UNIVERSITY
Advanced Design for Complex Systems
Example: Golfingn How to improve my score in Golfing?n Practice!!!
n Other than that?¨ Type of driver used (oversized or regular sized)¨ Type of ball (2 piece or 3 piece)¨ Walking or riding cart¨ Drinking water or beer¨ Etc…
What combination of the factors is the best for me?
3

SCHOOL OF MECH. ENG.CHUNG-ANG UNIVERSITY
Advanced Design for Complex Systems
General model of a process or systemn System: function, model, or
manufacturing process to transform input to output¨ Golf game
n Input: provided materials or energy into the process or system¨ Physical energy to play golf
n Response (output): outcome of a process or performance of a system¨ Score
n Controllable factors: factors that experimenters can control¨ Driver type, ball type, etc.
n Uncontrollable factors (noise factors): factors that experiments cannot control¨ Course layout, grass type, weather,
etc.
Response(Output)System
(Process) y
…..
Input
x1 x2 xp
z1 z2 zq
Controllable factors
Uncontrollable factors (Noise factors)
4

SCHOOL OF MECH. ENG.CHUNG-ANG UNIVERSITY
Advanced Design for Complex Systems
What needs to be analyzed?n Determining which variables
are most influential on the response y
n Determining where to set the controllable factors x so that y is almost always near the desired nominal value
Response(Output)System
(Process) y
…..
Input
x1 x2 xp
z1 z2 zq
Controllable factors
Uncontrollable factors (Noise factors)
5

SCHOOL OF MECH. ENG.CHUNG-ANG UNIVERSITY
Advanced Design for Complex Systems
Experiments with One Factorn Plasma etching process:
6
SCHOOL OF MECH. ENG.CHUNG-ANG UNIVERSITY
Advanced Design for Complex Systems
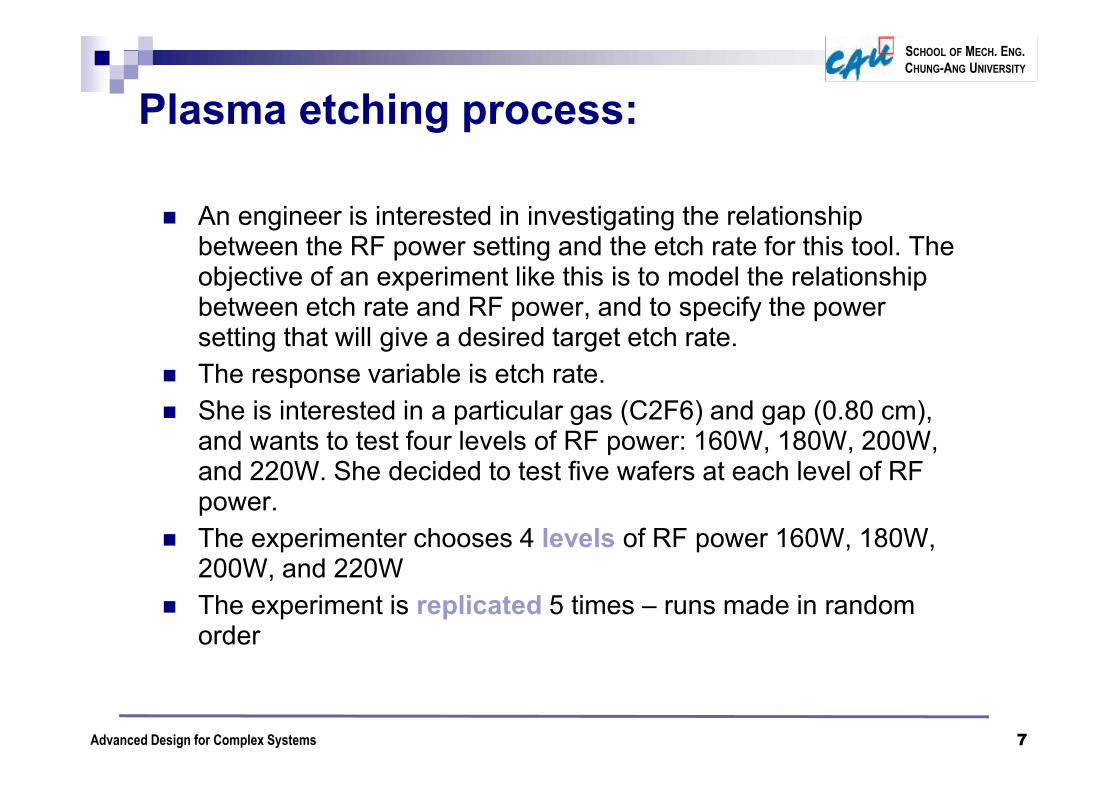
Plasma etching process:
n An engineer is interested in investigating the relationship between the RF power setting and the etch rate for this tool. The objective of an experiment like this is to model the relationship between etch rate and RF power, and to specify the power setting that will give a desired target etch rate.
n The response variable is etch rate.n She is interested in a particular gas (C2F6) and gap (0.80 cm),
and wants to test four levels of RF power: 160W, 180W, 200W, and 220W. She decided to test five wafers at each level of RF power.
n The experimenter chooses 4 levels of RF power 160W, 180W, 200W, and 220W
n The experiment is replicated 5 times – runs made in random order
7

SCHOOL OF MECH. ENG.CHUNG-ANG UNIVERSITY
Advanced Design for Complex Systems
Plasma etching process:
8

SCHOOL OF MECH. ENG.CHUNG-ANG UNIVERSITY
Advanced Design for Complex Systems 9
• Does changing the power change the mean etch rate?
• We would like to have a systematic way to answer these questions
Analysis of Variance (ANOVA)

SCHOOL OF MECH. ENG.CHUNG-ANG UNIVERSITY
Advanced Design for Complex Systems
The Analysis of Variance (ANOVA)
n In general, there will be a levels of the factor, or a treatments, and n replicates of the experiment, run in random order…a completely randomized design (CRD)
n N = an total runsn We consider the fixed effects case…the random effects case
will be discussed latern Objective is to test hypotheses about the equality of the a
treatment means
10

SCHOOL OF MECH. ENG.CHUNG-ANG UNIVERSITY
Advanced Design for Complex Systems
Statistical Hypothesisn A statistical hypothesis is a statement about the
parameters of a probability distribution. For example, we may think that the mean values of distributions are equal. This may be stated formally as
¨ Type I error: the null hypothesis is rejected when it is true.
¨ Type II error: the null hypothesis is accepted when it is false
11
0 1 2
1
: (Null Hypothesis): At least one mean is different (Alternative Hypothesis)
aHH
m m m= = =L

SCHOOL OF MECH. ENG.CHUNG-ANG UNIVERSITY
Advanced Design for Complex Systems
Basic Single-factor ANOVA model
n the total of the observations for the ith factor
level
n the average of the observations under the ith
factor level
n the grand total of all observations
n the grand average of all observation
12
1
= 0a
ii
t=å
. .1
. = / 1, 2, ,n
i ij i ij
y y y y n i a=
= =å K
.. .. ..1 1
= /a n
iji j
y y y y N= =
=åå.iy
.iy
..y
..y
SCHOOL OF MECH. ENG.CHUNG-ANG UNIVERSITY
Advanced Design for Complex Systems
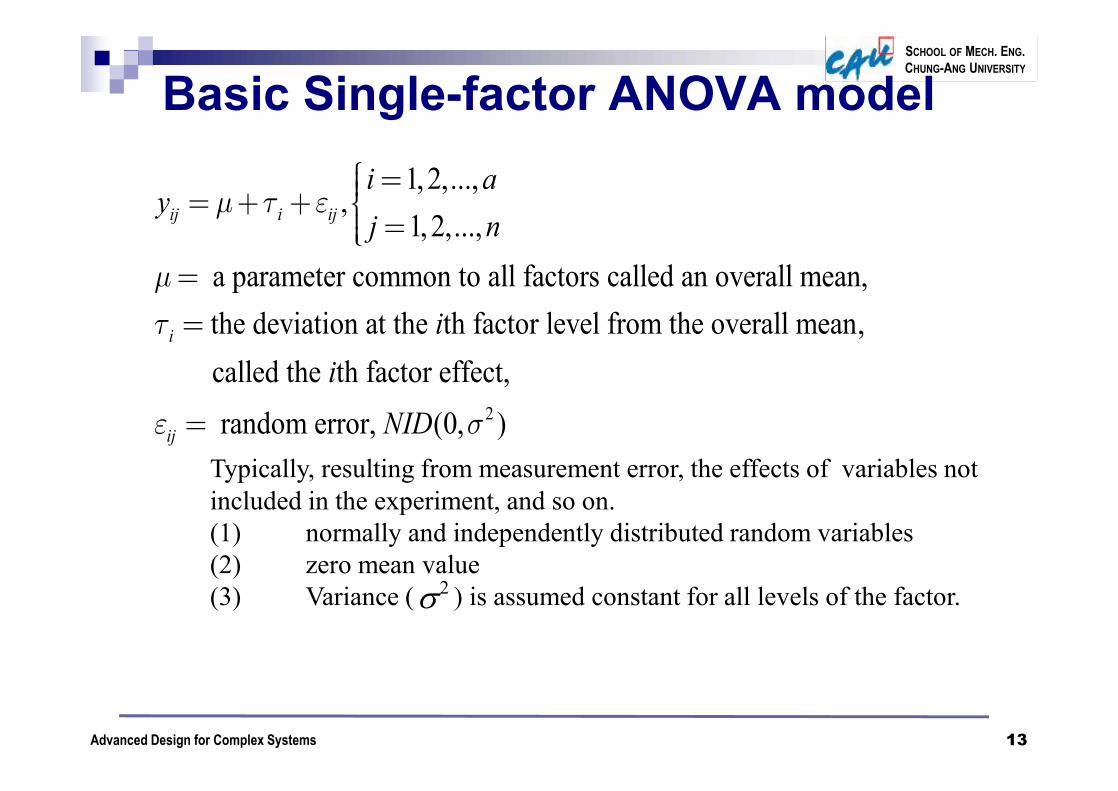
Basic Single-factor ANOVA model
13
1,2,...,,
1, 2,..., a parameter common to all factors called an overall mean,the deviation at the th factor level from the overall mean,
called the th factor effe
ij i ij
i
i ay
j n
ii
m t e
mt
ì =ïï= + + íï =ïî==
2
ct, random error, (0, )ij NIDe s=Typically, resulting from measurement error, the effects of variables not included in the experiment, and so on.(1) normally and independently distributed random variables(2) zero mean value(3) Variance ( ) is assumed constant for all levels of the factor.s2

SCHOOL OF MECH. ENG.CHUNG-ANG UNIVERSITY
Advanced Design for Complex Systems
The Analysis of Variancen Total variability is measured by the total
sum of squares:
n The basic ANOVA partitioning is:
14
2..
1 1( )
a n
T iji j
SS y y= =
= -åå
2 2.. . .. .
1 1 1 1
2 2. .. .
1 1 1
( ) [( ) ( )]
( ) ( )
a n a n
ij i ij ii j i j
a a n
i ij ii i j
T Treatments E
y y y y y y
n y y y y
SS SS SS
= = = =
= = =
- = - + -
= - + -
= +
åå åå
å åå
2..2
1 1
= - a n
ijTi j
ySS yan= =
ååor

SCHOOL OF MECH. ENG.CHUNG-ANG UNIVERSITY
Advanced Design for Complex Systems
The Analysis of Variance
n SSTreatments is the sum of squares due to the factor, that is the sum of squares of differences between factor-level averages and the grand average. It measurers the differences between factor levels
n A large value of SSTreatments reflects large differences in treatment means
n A small value of SSTreatments likely indicates no differences in treatment means
15
2. ..
1
( )a
Treatments ii
SS n y y=
= -å2 2
. ..
1
= - a
iTreatments
i
y ySSn an=
åor

SCHOOL OF MECH. ENG.CHUNG-ANG UNIVERSITY
Advanced Design for Complex Systems
The Analysis of Variance
n SSE is the sum of squares due to error, that is the sum of square of difference of observations within a specific factor level and the factor-level average. It measures the random error.
n If SSTreatments is large, it is due to differences among the means at the different factor levels.
n Thus, by comparing the magnitude of SSTreatments to SSE we can see how much variability is due to changing factor levels and how much is due to error.
n This comparison is facilitated if we first divide this sums by their number of degrees of freedom.
16
or 2.
1 1
( )a n
E ij ii j
SS y y= =
= -åå = - E T TreatmentsSS SS SS

SCHOOL OF MECH. ENG.CHUNG-ANG UNIVERSITY
Advanced Design for Complex Systems
The Analysis of Variancen While sums of squares cannot be directly compared to
test the hypothesis of equal means, mean squares can be compared.
n A mean square is a sum of squares divided by its degrees of freedom:
n If the treatment means are equal, the treatment and error mean squares will be (theoretically) equal.
n If treatment means differ, the treatment mean square will be larger than the error mean square.
17
1 1 ( 1)
,1 ( 1)
Total Treatments Error
Treatments ETreatments E
df df dfan a a n
SS SSMS MSa a n
= +- = - + -
= =- -
SCHOOL OF MECH. ENG.CHUNG-ANG UNIVERSITY
Advanced Design for Complex Systems
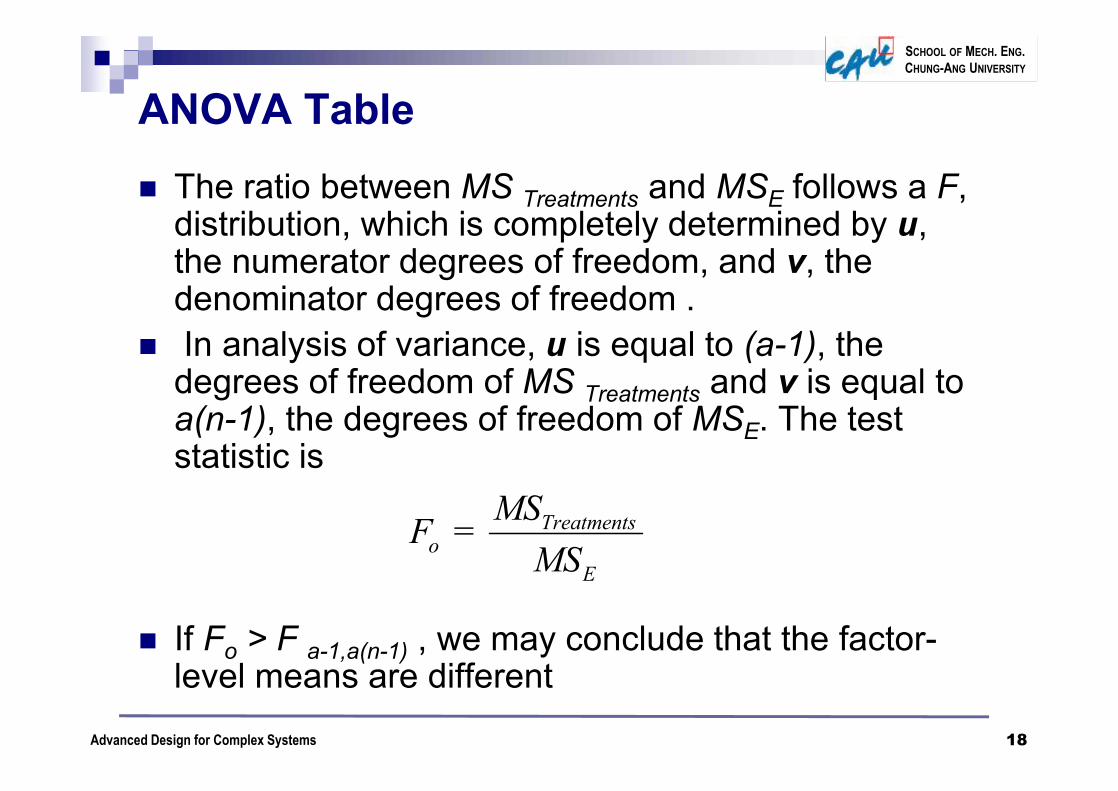
ANOVA Table
n The ratio between MS Treatments and MSE follows a F, distribution, which is completely determined by u, the numerator degrees of freedom, and v, the denominator degrees of freedom .
n In analysis of variance, u is equal to (a-1), the degrees of freedom of MS Treatments and v is equal to a(n-1), the degrees of freedom of MSE. The test statistic is
n If Fo > F a-1,a(n-1) , we may conclude that the factor-level means are different
18
= Treatmentso
E
MSFMS

SCHOOL OF MECH. ENG.CHUNG-ANG UNIVERSITY
Advanced Design for Complex Systems
ANOVA Table
n The reference distribution for F0 is the Fa-1, a(n-1) distributionn Reject the null hypothesis (equal treatment means) if
n P-value is the probability of Type I error ¨ i.e., the probability of rejecting the null hypothesis even if it is actually
TRUE
19
0 , 1, ( 1)a a nF Fa - ->

SCHOOL OF MECH. ENG.CHUNG-ANG UNIVERSITY
Advanced Design for Complex Systems
Plasma etching process:
20

SCHOOL OF MECH. ENG.CHUNG-ANG UNIVERSITY
Advanced Design for Complex Systems
Plasma etching process:
21

SCHOOL OF MECH. ENG.CHUNG-ANG UNIVERSITY
Advanced Design for Complex Systems22
Why Does the ANOVA Work?
22
2 21 0 ( 1)2 2
0
We are sampling from normal populations, so
if is true, and
Cochran's theorem gives the independence of these two chi-square random variables
/ (So
Treatments Ea a n
Treatments
SS SSH
SSF
c cs s- -» »
=2
11, ( 1)2
( 1)
2
2 21
1) / ( 1)/ [ ( 1)] / [ ( 1)]
Finally, ( ) and ( )1
Therefore an upper-tail test is appropriate.
aa a n
E a n
n
ii
Treatments E
a a FSS a n a n
nE MS E MS
aF
cc
ts s
-- -
-
=
- -» »
- -
= + =-
å

SCHOOL OF MECH. ENG.CHUNG-ANG UNIVERSITY
Advanced Design for Complex Systems
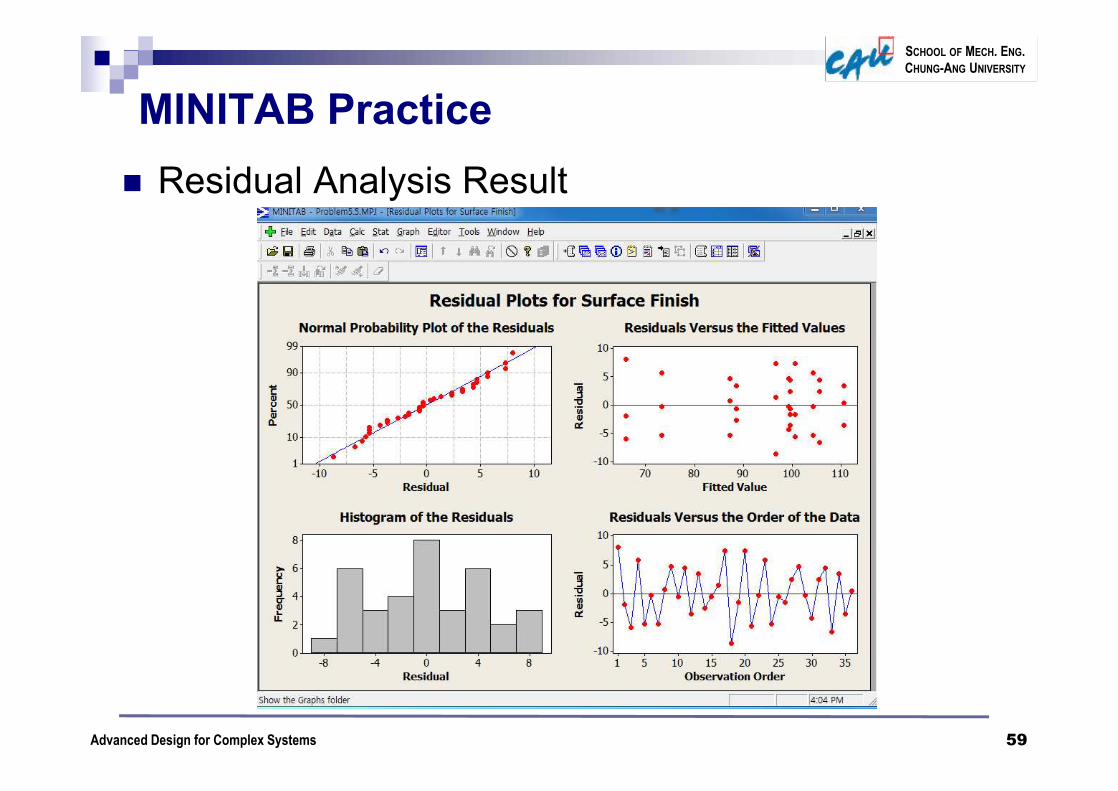
Residual Analysis
n We define a residual as the difference between the actual observation and the factor-level mean . Therefore, the residual is
n The difference between an observation and the corresponding factor-level mean.
n The normality assumption can be checked by plotting the residuals on normal probability paper.
n Residual Plotn Normal Probability Plot
23
. = - ij ij ie y y

SCHOOL OF MECH. ENG.CHUNG-ANG UNIVERSITY
Advanced Design for Complex Systems
Residual Analysisn Plasma etching process
24

SCHOOL OF MECH. ENG.CHUNG-ANG UNIVERSITY
Advanced Design for Complex Systems
Residual Plot
n To check the assumption of zero mean and equal variances at each factor level, plot the residuals against the factor levels and compare the spread in the residuals.
n The independent assumption can be checked by plotting the residuals against the run order in which the experiment was performed.
n A pattern in this plot, such as sequences of positive and negative residuals, may indicate that the observations are not independent.
25

SCHOOL OF MECH. ENG.CHUNG-ANG UNIVERSITY
Advanced Design for Complex Systems
Residual Plotn Plasma etching process
26

SCHOOL OF MECH. ENG.CHUNG-ANG UNIVERSITY
Advanced Design for Complex Systems
Normal Probability Plot
n A normal probability paper is a graph of the cumulative normal distribution of the residuals, that is, graph paper with the ordinate scaled so that the cumulative normal distribution plots as a straight line.
n To construct a normal probability plot, arrange the residuals in increasing order and plot the kth of these ordered residuals versus the cumulative probability point,
on normal probability paper. If the underlying error distribution is normal, this plot will resemble a straight line
27
= ( - 0.5) /kP k N

SCHOOL OF MECH. ENG.CHUNG-ANG UNIVERSITY
Advanced Design for Complex Systems
Normal Probability Plot
28

SCHOOL OF MECH. ENG.CHUNG-ANG UNIVERSITY
Advanced Design for Complex Systems
Contrasts
n We might suspect at the outset of the experiment that 200W and 220W produce the same etch rate, implying that we would like to test the hypothesis:
n This hypothesis could be tested by investigating an appropriate linear combination of factor level totals say
29
3 4
1 3 4
: = : =
oHHm m
m m/
3. 4. - = 0y y
3 4 - = 0m mOr

SCHOOL OF MECH. ENG.CHUNG-ANG UNIVERSITY
Advanced Design for Complex Systems
Contrasts
n If we have suspected that the average of 160 W and 180W did not differ from the average of 200W and 220W, then the hypothesis, would have been
n which implies the linear combination
30
1 2 3 4
1 1 2 3 4
: + = + : + = +
oHHm m m m
m m m m/
1. 2. 3. 4. + - y - y = 0y y
1 2 3 4 + - - = 0m m m mOr

SCHOOL OF MECH. ENG.CHUNG-ANG UNIVERSITY
Advanced Design for Complex Systems
Contrasts
n In general, the comparison of factor level means of interest will imply a linear combination of factor level totals such as
n with the restriction that Such linear combinations are called contrasts. The sum of squares of any contract is
31
.1
= ya
i ii
C c=å
1
= 0.a
ii
c=å
2
.1
2
1
c y =
1
a
i ii
c a
ii
SSc
n
=
-
æ ö÷ç ÷ç ÷ç ÷è øå
å

SCHOOL OF MECH. ENG.CHUNG-ANG UNIVERSITY
Advanced Design for Complex Systems
Contrastsn Plasma etching problem
32
Hypothesis Contrast
1 2
1 2 3 4
3 4
: = : + + : =
o
o
o
HHH
m mm m m mm m
=1 1. 2.
2 1. 2. 3. 4.
3 3. 4.
+
C y yC y y y yC y y
= -
= - -
= -

SCHOOL OF MECH. ENG.CHUNG-ANG UNIVERSITY
Advanced Design for Complex Systems
Contrastsn Plasma etching problem
33
( )1
2
12
22
1(551.2) 1(587.4) 36.2
36.23276.101 (2)
5 1(551.2) 1(587.4) 1(625.4) 1(707.0) 193.8
( 193.8) 46,948.051 (4)5
C
C
C
SS
C
SS
=+ - =-
-= =
= + + - - =-
-= =
3
32
1(625.4) 1(707.6) 81.6
( 81.6) 16,646.401 (2)5
C
C
SS
=+ - =-
-= =

SCHOOL OF MECH. ENG.CHUNG-ANG UNIVERSITY
Advanced Design for Complex Systems
Contrastsn Plasma etching problem
n A contrast is tested by comparing its sum of squares to the error mean square. The resulting statistic would be distributed as Fwith 1 and a(n-1) degrees of freedom.
n Contrast is always single degree of freedom since two comparing data and one equation
34

35
3. Design of Experiments (DOE)(Experiments with Two Factors)
Hae-Jin ChoiSchool of Mechanical Engineering,
Chung-Ang University

SCHOOL OF MECH. ENG.CHUNG-ANG UNIVERSITY
Advanced Design for Complex Systems
Introduction to Factorials
n Most experiments for process and quality improvement involve several variables. Factorial experimental designs are used in such situations. Specially, by a factorial experiment we mean that in each complete trial or replicate of the experiment all possible combinations of the levels of the factors are investigated. Thus, if there are two factors A and B with a levels of factor A and b levels of factor B, then each replicate contains all abpossible combinations.
36

SCHOOL OF MECH. ENG.CHUNG-ANG UNIVERSITY
Advanced Design for Complex Systems
Some Basic Definitions
37
Definition of a factor effect: The change in the mean response when the factor is changed from low to high
40 52 20 30 212 2
30 52 20 40 112 2
52 20 30 40 12 2
A A
B B
A y y
B y y
AB
+ -
+ -
+ += - = - =
+ += - = - =
+ += - = -
Main effect of A
Main effect of B
Interaction effectbetween A and B

SCHOOL OF MECH. ENG.CHUNG-ANG UNIVERSITY
Advanced Design for Complex Systems
The Case of Interaction:
38
50 12 20 40 12 2
40 12 20 50 92 2
12 20 40 50 292 2
A A
B B
A y y
B y y
AB
+ -
+ -
+ += - = - =
+ += - = - = -
+ += - = -
Main effect of A
Main effect of B
Interaction effectbetween A and B

SCHOOL OF MECH. ENG.CHUNG-ANG UNIVERSITY
Advanced Design for Complex Systems
The Battery Life Experimentn An engineer is designing a battery for use in a device
that will be subjected to some extreme variations in temperature. The only design parameter that he can select at this point is the plate material for the battery, and he has three possible choices. When the device is manufactured and is shipped to the field, the engineer has no control over the temperature extremes that the device will encounter, and the knows from experience that temperature will probable affect the effective battery life. However, temperature can be controlled in the product development laboratory for the purposes of a test
n The engineer decides to test all three plate materials at three temperature levels,15, 70, 125 oF, because these temperature levels are consistent with the product end-use environment.
39

SCHOOL OF MECH. ENG.CHUNG-ANG UNIVERSITY
Advanced Design for Complex Systems40
The Battery Life Experiment
40
A = Material type; B = Temperature
1. What effects do material type & temperature have on life?
2. Is there a choice of material that would give long life regardless of temperature (a robust product)?

SCHOOL OF MECH. ENG.CHUNG-ANG UNIVERSITY
Advanced Design for Complex Systems41
General Two-Factor Factorial Experiment
41
a levels of factor A; b levels of factor B; n replicates
This is a completely randomized design

SCHOOL OF MECH. ENG.CHUNG-ANG UNIVERSITY
Advanced Design for Complex Systems
1,2,...,( ) 1, 2,...,
1, 2,...,ijk i j ij ijk
i ay j b
k nm t b tb e
=ìï= + + + + =íï =î
Statistical Model of Two-factor Factorial Design
n The observations may be described by
n where is the overall mean effect, is the effect of the ith level of factor A, is the effect of the jthlevel of factor B, is the effect of the interaction between A and B. is a NID (0, ) random error component.
42
m itjb
( )ijtb
ijke 2s

SCHOOL OF MECH. ENG.CHUNG-ANG UNIVERSITY
Advanced Design for Complex Systems
Hypotheses for Two-factor Analysisn Hypotheses of no significant factor A effect, no
significant factor B effect, and no significant AB interaction. That is,
43
H at least one
at least one
for all i, j
H at least one ( )
o
i
1 ij
: ...:: ...:
:( )
:
t t tt
b b bb
tb
tb
1 2
1
1 2
1
0000
0
0
= = = =
¹
= = =
¹
=
¹
a
o b
j
o ij
HHH
H

SCHOOL OF MECH. ENG.CHUNG-ANG UNIVERSITY
Advanced Design for Complex Systems44
Extension of the ANOVA to Factorials
44
2 2 2... .. ... . . ...
1 1 1 1 1
2 2. .. . . ... .
1 1 1 1 1
( ) ( ) ( )
( ) ( )
a b n a b
ijk i ji j k i j
a b a b n
ij i j ijk iji j i j k
y y bn y y an y y
n y y y y y y
= = = = =
= = = = =
- = - + -
+ - - + + -
ååå å å
åå ååå
breakdown:1 1 1 ( 1)( 1) ( 1)
T A B AB ESS SS SS SS SSdfabn a b a b ab n
= + + +
- = - + - + - - + -

SCHOOL OF MECH. ENG.CHUNG-ANG UNIVERSITY
Advanced Design for Complex Systems 45

SCHOOL OF MECH. ENG.CHUNG-ANG UNIVERSITY
Advanced Design for Complex Systems46
ANOVA Table – Fixed Effects Case
46

SCHOOL OF MECH. ENG.CHUNG-ANG UNIVERSITY
Advanced Design for Complex Systems47
The Battery Life Experiment
47
SS y yabni
a
j
b
k
nijkT S S S= -
= = =1 1 1
22...
SS ybn
yabnA
i
a i= -=1
2 2
S .. ...
SSyan
yabnB
j
b j= -=1
2 2
S . . ...

SCHOOL OF MECH. ENG.CHUNG-ANG UNIVERSITY
Advanced Design for Complex Systems48
The Battery Life Experiment
48
SSyn
yabnsubtotals
i
a
j
b ij= -= =1 1
2 2
S S . ...
SS SS SS SSAB subtotals A B= - -
SS SS SS SS SSE AB A B= - - -T

SCHOOL OF MECH. ENG.CHUNG-ANG UNIVERSITY
Advanced Design for Complex Systems
The Battery Life Experiment
n ANOVA Table
49

SCHOOL OF MECH. ENG.CHUNG-ANG UNIVERSITY
Advanced Design for Complex Systems
Residual Analysis
50

SCHOOL OF MECH. ENG.CHUNG-ANG UNIVERSITY
Advanced Design for Complex Systems
Residual Analysis
51

SCHOOL OF MECH. ENG.CHUNG-ANG UNIVERSITY
Advanced Design for Complex Systems
Interaction Plot
52
DESIGN-EXPERT Plot
Life
X = B: TemperatureY = A: Material
A1 A1A2 A2A3 A3
A: MaterialInteraction Graph
Life
B: Temperature
15 70 125
20
62
104
146
188
2
2
22
2
2

SCHOOL OF MECH. ENG.CHUNG-ANG UNIVERSITY
Advanced Design for Complex Systems
MINITAB Practice
n An engineer suspects that the surface finish of a metal part is influenced by the feed rate and the depth of cut. She selects three feed rates and four depths of cut. She then conducts a factorial experiment and obtains the following data:
53

SCHOOL OF MECH. ENG.CHUNG-ANG UNIVERSITY
Advanced Design for Complex Systems
Summary
n What is DOE?n Analysis of Variances (ANOVA)n Contrastn Main Effectn Interaction Effectn Residual Analysis
54

SCHOOL OF MECH. ENG.CHUNG-ANG UNIVERSITY
Advanced Design for Complex Systems
MINITAB Practicen Data input
55

SCHOOL OF MECH. ENG.CHUNG-ANG UNIVERSITY
Advanced Design for Complex Systems
MINITAB Practicen Two way ANOVAn Stat -> ANOVA -> Two wayn Select response, row factor (control factor), and
column factor (uncontrollable factor)
56

SCHOOL OF MECH. ENG.CHUNG-ANG UNIVERSITY
Advanced Design for Complex Systems
MINITAB Practicen Select Graphn Select residual plot (Four in one)n Select ‘feedrate’ and ‘depth of cut’ for residual
57

SCHOOL OF MECH. ENG.CHUNG-ANG UNIVERSITY
Advanced Design for Complex Systems
MINITAB Practicen AVOVA result
58
SCHOOL OF MECH. ENG.CHUNG-ANG UNIVERSITY
Advanced Design for Complex Systems
MINITAB Practicen Residual Analysis Result
59
SCHOOL OF MECH. ENG.CHUNG-ANG UNIVERSITY
Advanced Design for Complex Systems
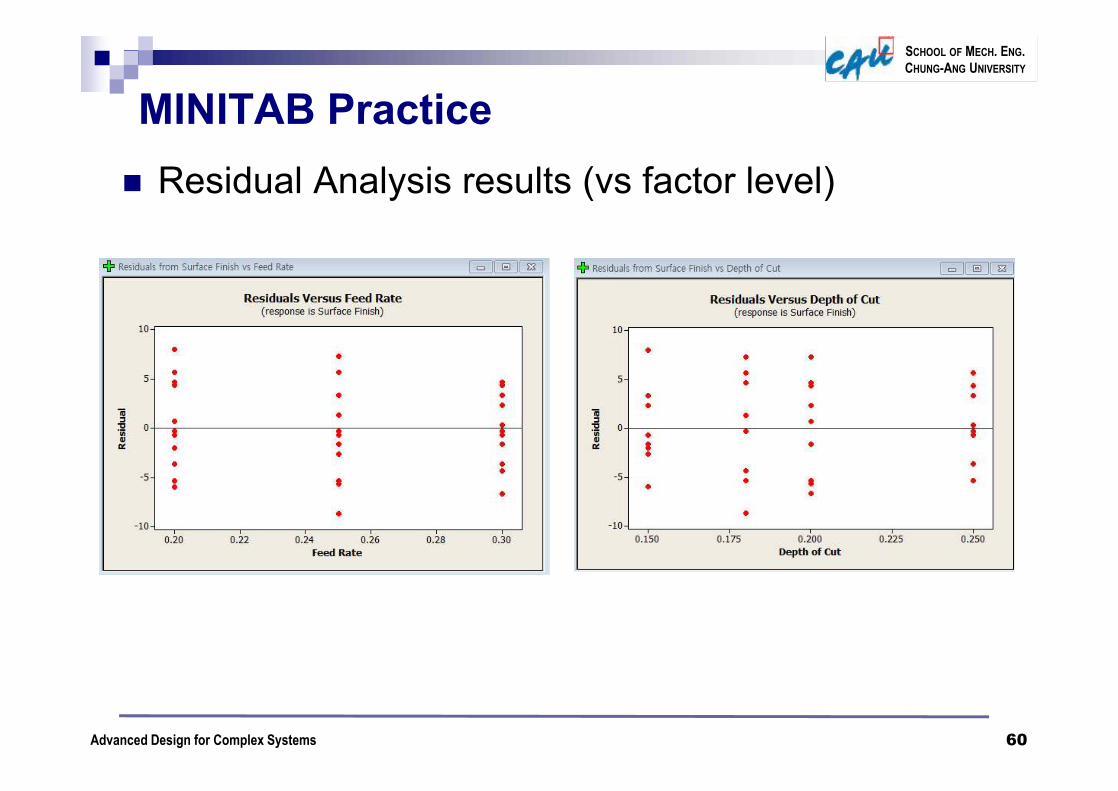
MINITAB Practicen Residual Analysis results (vs factor level)
60

SCHOOL OF MECH. ENG.CHUNG-ANG UNIVERSITY
Advanced Design for Complex Systems
MINITAB Practicen Interaction plotn Stat -> ANOVA -> Interactions plot..n Select response and factors
61