3-d migration deconvolution jianxing hu, gxt bob estill, unocal jianhua yu, university of utah...
Post on 20-Dec-2015
219 views
TRANSCRIPT
3-D Migration Deconvolution3-D Migration Deconvolution
Jianxing Hu, GXTJianxing Hu, GXTBob Estill, Unocal Bob Estill, Unocal
Jianhua Yu, University of UtahJianhua Yu, University of UtahGerard T. Schuster, University of Utah Gerard T. Schuster, University of Utah

Why Do Migration Deconvolution (MD) ?
OutlineOutline
Migration Deconvolution
Examples
Conclusions
Implementation of MD

Why Do Migration Deconvolution (MD) ?
OutlineOutline
Migration Deconvolution
Examples
Conclusions
Implementation of MD

Migration noise and artifacts
Migration Noise ProblemsMigration Noise Problems0
3.5
Dep
th (
km)
Weak illumination
Footprint

Purpose of MD Processing:
Improving spatial resolution
Enhancing illumination
Suppressing migration noise and artifacts

Why Do Migration Deconvolution (MD) ?
OutlineOutline
Migration Deconvolution
Examples
Conclusions
Implementation of MD

M = M = L LTT
Migration:
Migrated imageMigrated image
L RL R
L is modeling operatorL is modeling operator
ReflectivityReflectivity

TTRR = ( = (L LL L ) M ) M
-1-1
3-D PRESTACK MD3-D PRESTACK MD
ReflectivityReflectivity
Design an improved MD filter
Migrated SectionMigrated Section
MD is to eliminate the blurring influence in migration image by designing MD operator
Goal:

Why Do Migration Deconvolution (MD) ?
OutlineOutline
Migration Deconvolution
Examples
Conclusions
Implementation of MD

MD Implementation Steps:MD Implementation Steps:
Step 1: Prepare traveltime table
Velocity cube
Acquisition geometry information
or
Use migration timetable

Calculate the migration Green’s function
MD Implementation Steps:MD Implementation Steps:
Step 2:Y (km)
Dep
th (
km
)
Depth LevelDepth Level ii N
L

Step 4: Invert MD image at the depth Zi by solving linear equations
R
MD Implementation Steps:MD Implementation Steps:
Step 5: Repeat Steps 2-4 until the maximum depth is finished

Why Do Migration Deconvolution (MD) ?
OutlineOutline
Migration Deconvolution
Examples : Synthetic data
Conclusions
Implementation of MD

00
3 km3 km
00
3-D Point Scatterer Model
3 km3 km
11 X 11 Receivers11 X 11 Receivers dxg=dyg=0.3 km
Imaging: dx=dy=50 m
dz=100 m
3X3 Sources; 3X3 Sources; dxshot=dyshot=1.5 km
10 k
m

0
3 X (km)03
Y (km)0
3 X (km)03
Y (km)
0
3 X (km)03
Y (km)
0
3 X (km)03
Y (km)
0
3 X (km)03
Y (km)
0
3 X (km)03
Y (km)
MIG MD
Z=1 km
Z=3 km
Z=5 km
Depth Slices

0
3 X (km)03
Y (km)0
3 X (km)03
Y (km)
0
3 X (km)03
Y (km)
0
3 X (km)03
Y (km)
0
3 X (km)03
Y (km)
0
3 X (km)03
Y (km)
MIG MD
Z=7 km
Z=9 km
Z=10 km
Depth Slices

00
2.5 km2.5 km
00
Meandering Stream Model
2.5 km2.5 km
5 X 1 Sources; 11 X 7 Receivers5 X 1 Sources; 11 X 7 Receivers
3.5
km
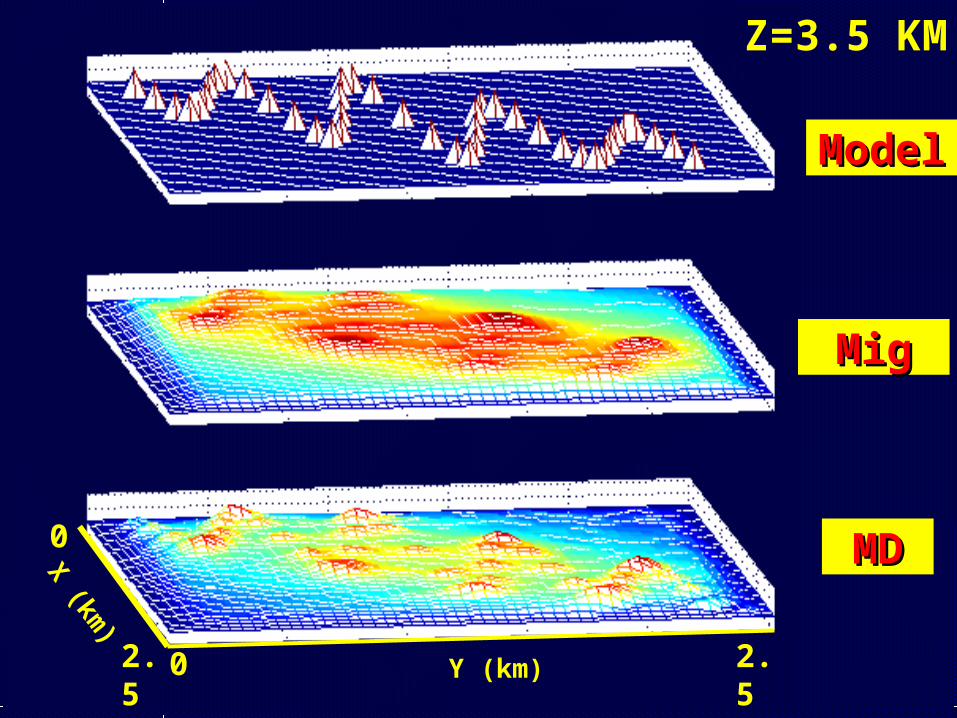
MigMig
MDMD
ModelModel
0 Y (km)
X (km
)
2.5
0
2.5
Z=3.5 KM

00
12.2 km12.2 km
00
3-D SEG/EAGE Salt Model
12.2 km12.2 km
9 X5 Sources; 9 X5 Sources; dxshot=dyshot=1 km
201 X 201 Receivers201 X 201 Receivers
Imaging: dx=dy=20 m
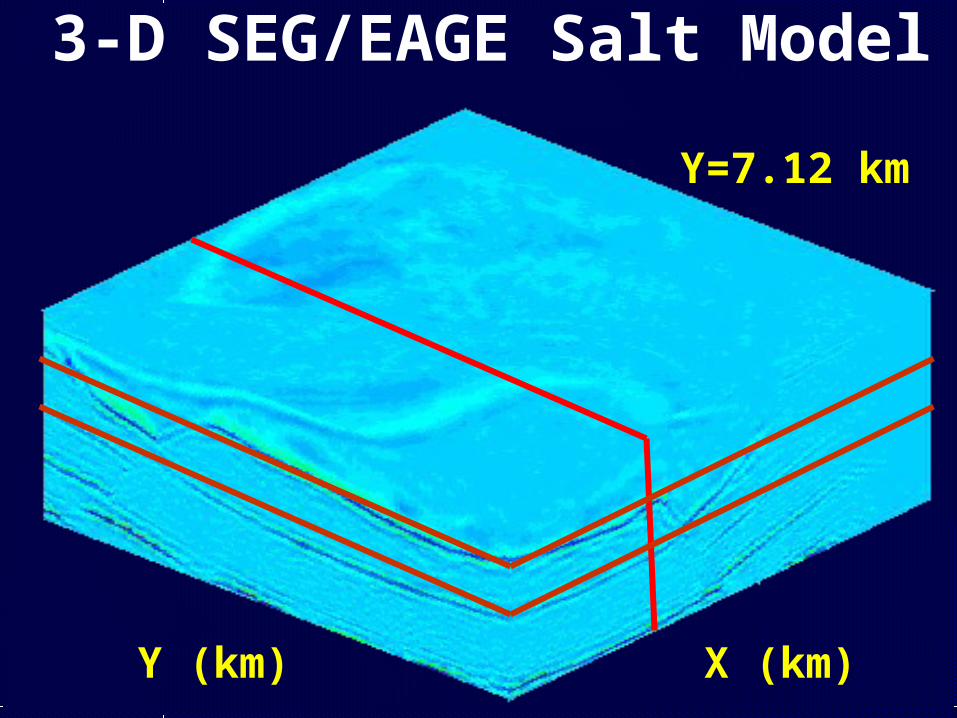
3-D SEG/EAGE Salt Model
X (km)Y (km)
Y=7.12 km

Mig and MD ( z=1.4 km, negative polarity)
X (km)3
10
Y (
km
)
5 9.8 5 9.8X (km)
MDMig

MD (z=1.2 km)Mig (z=1.2 km)X (km)
3
10
Y (
km
)
5 9.8 5 9.8X (km)

MD (z=1.2 km)Mig (z=1.2 km)

Why Do Migration Deconvolution (MD) ?
OutlineOutline
Migration Deconvolution
Examples: 2-D field data
Conclusions
Implementation of MD
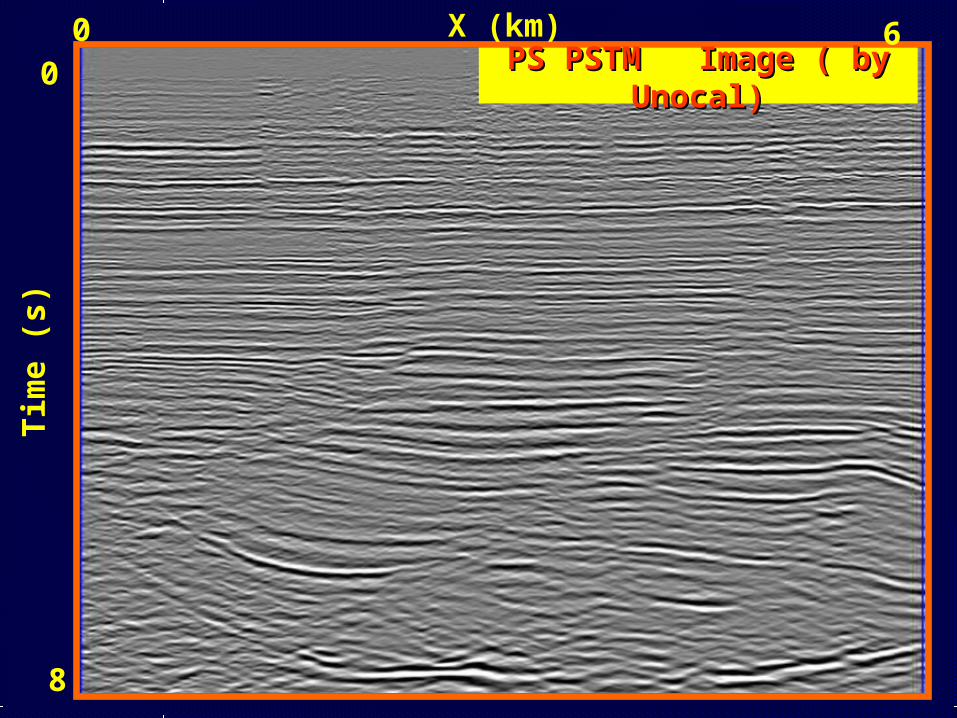
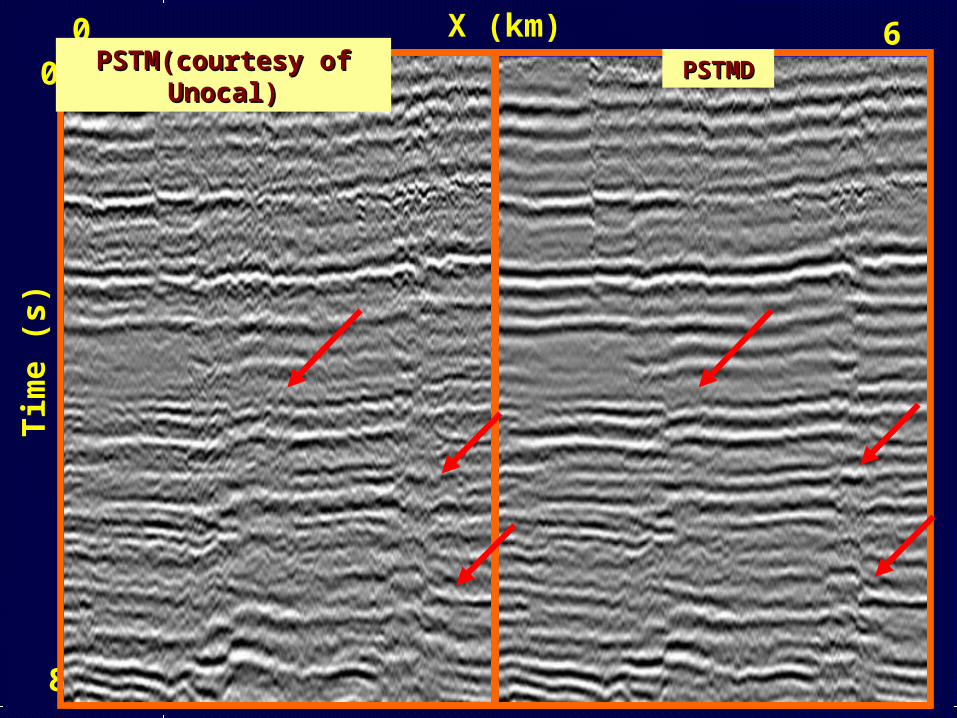
PS PSTM Image ( by Unocal)PS PSTM Image ( by Unocal)
0 6X (km)
0
8
Tim
e (s
)
0 6X (km)
0
8
Tim
e (s
)
MDMDPSTM(courtesy of Unocal)PSTM(courtesy of Unocal) PSTMDPSTMD

0 6X (km)
3
8
Tim
e (s
)
MDMDPSTM(courtesy of Unocal)PSTM(courtesy of Unocal) PSTMDPSTMD

Why Do Migration Deconvolution (MD) ?
OutlineOutline
Migration Deconvolution
Examples: 3-D field data
Conclusions
Implementation of MD
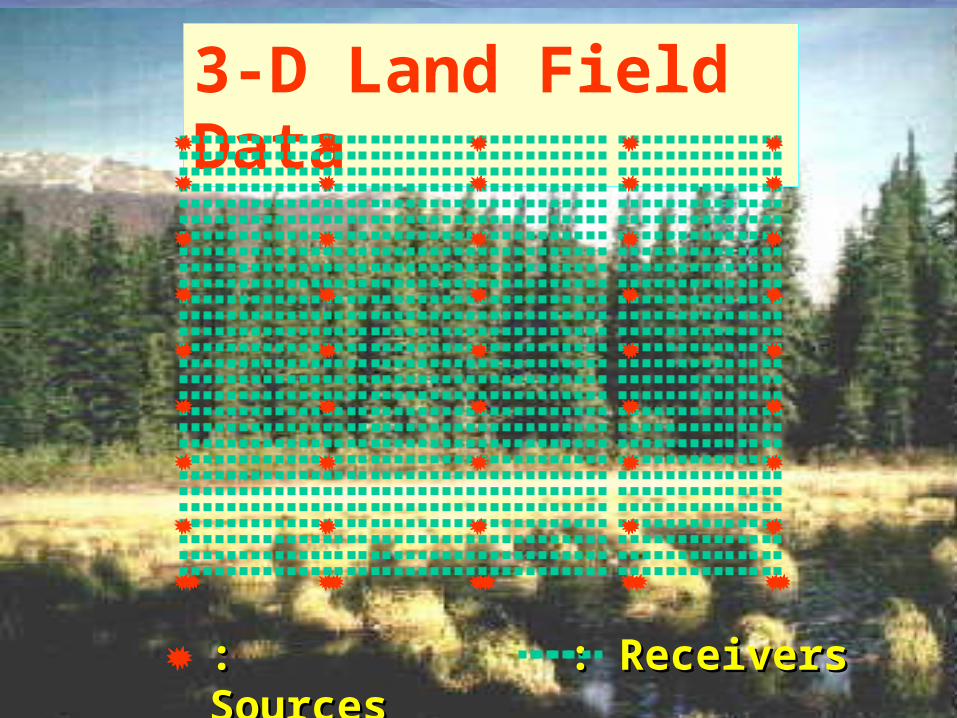
3-D Land Field Data
: Receivers: Receivers: Sources : Sources

1.6 s1.6 s
Inline
Cro
sslin
e3D PSTM (courtesy of Unocal) MD

2.0 s2.0 s
Cro
ssli
ne
3D PSTM (courtesy of Unocal) MD

3
Mig in Inline (Courtesy of Unocal) MD

Mig
MD
Mig
MD

Mig (Courtesy of Unocal) MDInline Number1 90 1 90
1
300
Cro
sslin
e N
um
ber
Inline Number
(2 kft)
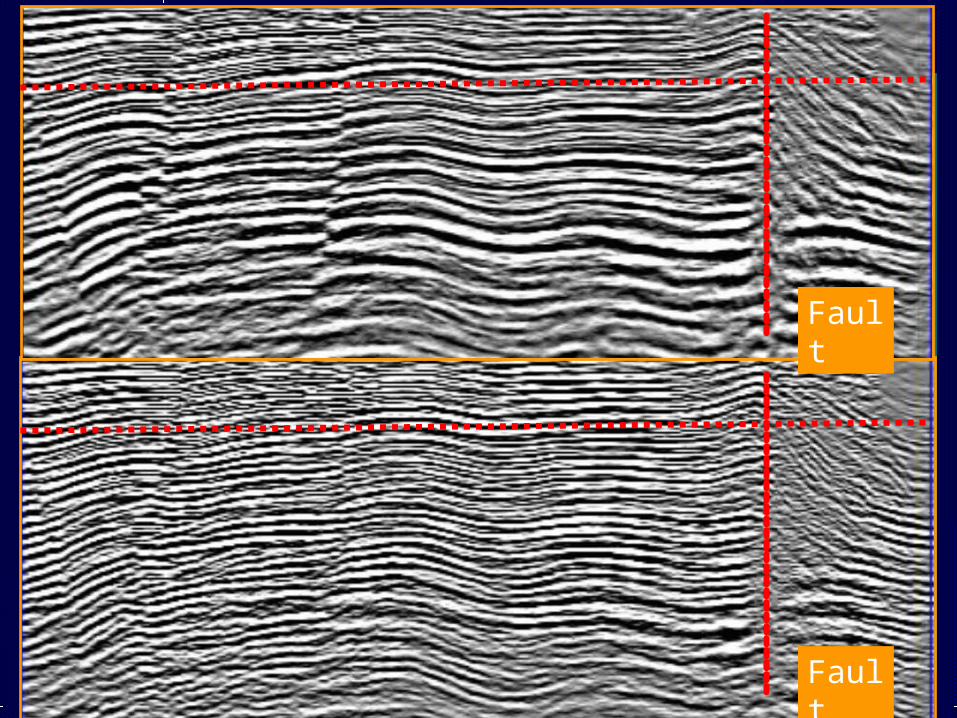
Fault
Fault

(3.6 kft)
Inline Number1 90 1 901
265
Cro
sslin
e N
um
ber
Inline Number
Mig (Courtesy of Unocal) MD

Inline Number1 901.1
7.0
Dep
th (
kft
)
90 Inline Number1
Mig (courtesy of Unocal) MD
(Crossline=50)

(crossline 200)
1 90 1 901.1
8.0
Dep
th (
kft
)Mig (courtesy of Unocal) MD

1 2501.1
7.0
Dep
th (
kft
)Crossline Number
7.01.1
(Inline =50)
Mig (Unocal)
MD

Why Do Migration Deconvolution (MD) ?
OutlineOutline
Migration Deconvolution
Examples
Conclusions
Implementation of MD

ConclusionsConclusions
Aperture width and filter length in designing MD filter are two key parameters
Improve resolution and suppress migration artifacts
MD cost is related with acquisition geometry

AcknowledgmentsAcknowledgments• Thank Thank Amramco, UnocalAmramco, Unocal, and , and ChevronChevron--
Texaco Texaco for providing the data sets for providing the data sets
• Thank 2002 Thank 2002 UTAM sponsorsUTAM sponsors for their for their financial supportfinancial support
• The help and comments from The help and comments from Alan LeedsAlan Leeds and and George YaoGeorge Yao are very appreciated are very appreciated
• http://utam.gg.utah.eduhttp://utam.gg.utah.edu