3-d active source tomography around simeulue island offshore sumatra
TRANSCRIPT
3-D active source tomography around Simeulue Island offshoreSumatra: Thick crustal zone responsible for earthquakesegment boundary
Genyang Tang,1,8 Penny J. Barton,1 Lisa C. McNeill,2 Timothy J. Henstock,2
Frederik Tilmann,1,3 Simon M. Dean,2 Muhammad D. Jusuf,4 Yusuf S. Djajadihardja,4
Haryadi Permana,5 Frauke Klingelhoefer,6 and Heidrun Kopp7
Received 8 October 2012; revised 27 November 2012; accepted 29 November 2012; published 15 January 2013.
[1] We present a detailed 3-D P-wave velocity modelobtained by first-arrival travel-time tomography with seismicrefraction data in the segment boundary of the Sumatrasubduction zone across Simeulue Island, and an image of thetop of the subducted oceanic crust extracted from depth-mi-grated multi-channel seismic reflection profiles. We havepicked P-wave first arrivals of the air-gun source seismic datarecorded by local networks of ocean-bottom seismometers,and inverted the travel-times for a 3-D velocity model of thesubduction zone. This velocity model shows an anomalouszone of intermediate velocities between those of oceaniccrust and mantle that is associated with raised topography onthe top of the oceanic crust. We interpret this feature as athickened crustal zone in the subducting plate with compo-sitional and topographic variations, providing a primarycontrol on the upper plate structure and on the segmentationof the 2004 and 2005 earthquake ruptures.Citation: Tang, G.,P. J. Barton, L. C. McNeill, T. J. Henstock, F. Tilmann, S. M. Dean,M. D. Jusuf, Y. S. Djajadihardja, H. Permana, F. Klingelhoefer,and H. Kopp (2013), 3-D active source tomography aroundSimeulue Island offshore Sumatra: Thick crustal zone responsiblefor earthquake segment boundary, Geophys. Res. Lett., 40, 48–53,doi:10.1029/2012GL054148.
1. Introduction
[2] Large megathrust earthquakes occurring at subductionzones generally only rupture a segment of the plate boundaryfault in each event. Along-strike propagation of such rupturesmay be obstructed by geometric discontinuities in the
subducted plate such as slab tears [e.g., Cummins et al.,2002], topographic anomalies on the subducting plate suchas seamount chains, ridges and fracture zones [e.g., Robinsonet al., 2006], or major upper plate structures [e.g., Melnicket al., 2006]. Subduction of large-scale seamounts, ridges,or even fracture zones has been proposed to increase localseismic coupling in subduction zones [e.g., Scholz and Small,1997; Robinson et al., 2006] or, contrastingly, reduce cou-pling [e.g., Mochizuki et al., 2008; Wang and Bilek, 2011].Increased interplate coupling may generate rupture barriers,as proposed for the Southwest Japan [Kodaira et al., 2000],Costa Rican [Bilek et al., 2003], and South American subduc-tion zones [Robinson et al., 2006]. In other regions where,conversely, decreased coupling is suggested, basal erosionand faulting within the overriding plate, and/or sedimentmigration and fluid interaction may cause stress heterogeneityon the megathrust fault [Wang and Bilek, 2011; Mochizukiet al., 2008], forming a weak zone and thus inhibiting accumu-lation of elastic strain, also acting as a barrier to rupture.[3] The Sumatra subduction zone also shows distinct seg-
ments of megathrust rupture, particularly the 2004 and 2005ruptures [e.g., Ammon et al., 2005; Briggs et al., 2006], withsegment boundaries demarcated by changes in coseismicslip and aftershock distribution [e.g., Briggs et al., 2006;Chlieh et al., 2007; Tilmann et al., 2010]. The segmentboundary between the 2004 Mw = 9.2 Aceh-Andaman earth-quake and the 2005 Mw = 8.7 Nias earthquake is identified atcentral Simeulue Island, where there seems to be a narrowand persistent barrier [Briggs et al., 2006; Meltzner et al.,2012]. Franke et al. [2008], among others, proposed that thisbarrier is controlled by a reactivated fossil fracture zone(96� FZ on Figures 1 and 2) associated with the WhartonFossil Ridge (Figure 1), which may have developed into aramp or a shallow slab tear beneath the forearc. To investi-gate the structure of the 2004–2005 segment boundary ofthe Sumatra subduction zone, we provide a detailed, well-resolved 3-D velocity model of the region with an image ofthe top surface of the subducting plate and oceanic crustalthickness relative to seismicity distribution. This studyimproves our understanding of the influence of subductingoceanic crustal structure on rupture behavior and provides in-sight into the primary controls on the segmentation of mega-thrust earthquakes in subduction zones.
2. Data and Methods
[4] 3-D refraction data were collected around Simeulue Is-land in 2008 using ocean-bottom seismometers (OBS) [Min-shull et al., 2005] and an air-gun source of total capacity
1Bullard Laboratories, University of Cambridge, Cambridge, UK.2National Oceanography Centre Southampton, University of Southampton,
Southampton, UK.3GFZGerman Research Centre for Geosciences, Helmholtz Centre Potsdam,
Telegrafenberg, Potsdam, Germany.4Agency for the Assessment and Application of Technology (BPPT),
Jakarta, Indonesia.5Indonesian Institute of Sciences (LIPI), Bandung, Indonesia.6IFREMER, Plouzané, France.7GEOMAR Helmholtz-Centre for Ocean Sciences Kiel, Kiel, Germany.8State Key Laboratory of Petroleum Resource and Prospecting, China
University of Petroleum, Beijing, China.
Corresponding author: G. Tang, China University of Petroleum, Beijing,China. ([email protected])
©2012. American Geophysical Union. All Rights Reserved.0094-8276-/13/2012GL054148
All Supporting Information may be found in the online version of thisarticle.
48
GEOPHYSICAL RESEARCH LETTERS, VOL. 40, 48–53, doi:10.1029/2012GL054148, 2013
5420 cubic inch (Figure 1). Fifty OBSs were deployed in anarea 203 km� 192 km, and 10,462 air-gun shots were firedalong 1550 km of profiles. About 125,000 P-wave first-arrival refractions were picked from the OBS data andinverted to give a velocity model. First-arrival travel-timedata from two additional 2-D OBS refraction surveysapproximately coincident with the northwest and southeastboundaries of the 3-D refraction survey area were alsoincluded in the velocity inversion [Klingelhoefer et al.,2010]. The tomography method is that of Zelt and Barton[1998], which inverts the travel-times picked from theselocal active-source experiments for the velocity model. TheSupporting Information describes details of the tomographyas well as resolution tests. The horizontal resolution is10–20 km in the top 15 km of the model, except immediatelyunder Simeulue. At depths larger than ~20 km, horizontalresolution is 20–40 km, and only the structures less than~100 km from the trench are resolved (i.e., underneath andseaward of Simeulue). The vertical resolution is about5 km. The velocity model inverted from the first-arrivaltravel-time tomography was later used to relocate localearthquake events from October 2005 toMarch 2006 recordedby a passive seismic network installed in approximately thesame area [Tilmann et al., 2010] (Figures 2 and 3) using atomographic inversion technique [Eberhart-Phillips, 1990].The velocity model is allowed to be simultaneously updated
with the earthquake locations. From this data set, relocationswere made for events with hypocenter depth 8–50 km, withmore than 10 records of each event, and initial travel-timeresidual< 0.5 s.[5] Multichannel seismic data (MCS) were also acquired
in the area, and processed with the conventional Kirchhoffprestack depth migration method. The top of oceanic crust(TOC) of the subducting plate was picked and interpolatedfrom the depth-migrated MCS profiles seaward of Simeulue(see Supporting Information). TOC picks from other depth-migratedMCS profiles digitized from Franke et al. [2008] werealso included in the interpolation and smoothing (see auxiliarymaterial). The integrated TOC surface is assumed to representthe plate interface in the subduction zone (Figure 2).
3. Results
[6] Trench-normal and trench-parallel sections extractedfrom the 3-D velocity model are shown in Figure 3. Shallowsediments with velocities lower than 4 km/s are confined to athin surface layer (1–6 km in thickness) in both the accretion-ary prism and the forearc basin. The deep part of the
95˚ 96˚ 97˚ 98˚0˚
1˚
2˚
3˚
4˚
−6 −4 −2 0 2 4
Topo/Bathy (km)
100 km
2004
2005
Nias
Simeulue
56 mm/yr
Banyak
94˚ 98˚ 102˚
−4˚
0˚
4˚
IAP
SF
MF
BF
WAF
IFZ96 FZ
SUMA
WFR
ST
FZ FZ
FZ
97
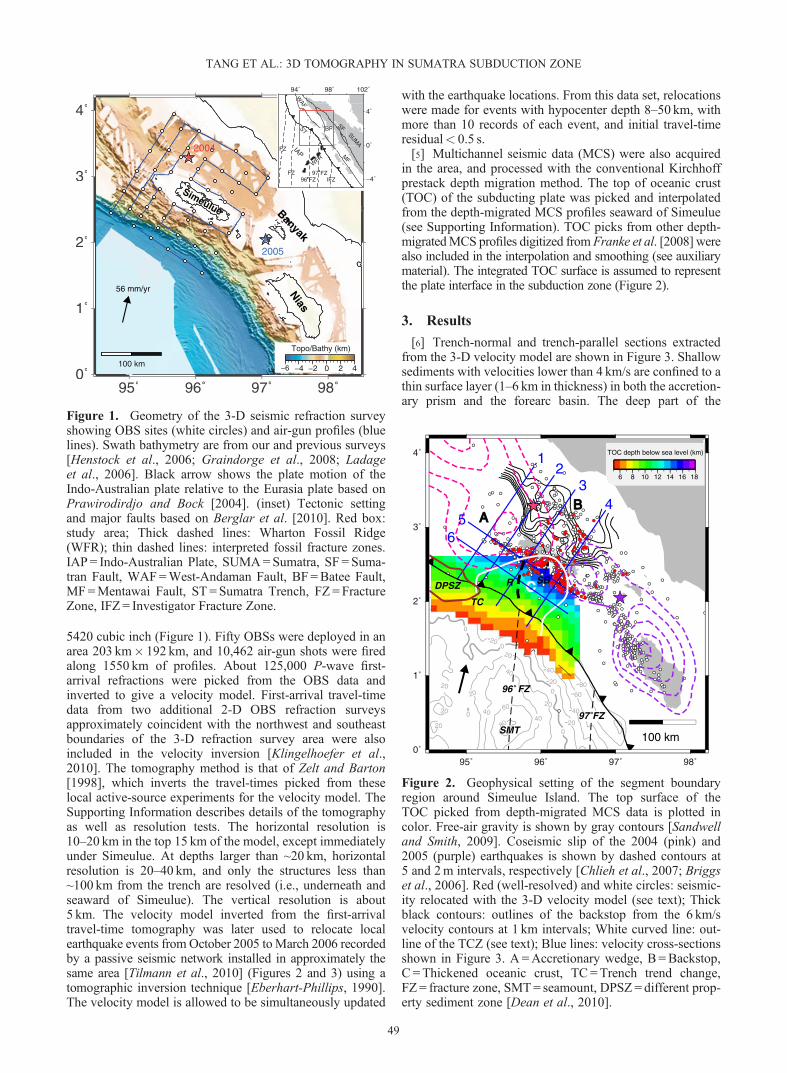
Figure 1. Geometry of the 3-D seismic refraction surveyshowing OBS sites (white circles) and air-gun profiles (bluelines). Swath bathymetry are from our and previous surveys[Henstock et al., 2006; Graindorge et al., 2008; Ladageet al., 2006]. Black arrow shows the plate motion of theIndo-Australian plate relative to the Eurasia plate based onPrawirodirdjo and Bock [2004]. (inset) Tectonic settingand major faults based on Berglar et al. [2010]. Red box:study area; Thick dashed lines: Wharton Fossil Ridge(WFR); thin dashed lines: interpreted fossil fracture zones.IAP = Indo-Australian Plate, SUMA=Sumatra, SF = Suma-tran Fault, WAF=West-Andaman Fault, BF =Batee Fault,MF=Mentawai Fault, ST = Sumatra Trench, FZ =FractureZone, IFZ = Investigator Fracture Zone.
80
0
60
40
20
0
-20
20
040
20
0-20
-40
-80
-6020
4020
20
-40
-200
TOC depth below sea level (km)
6 8 10 12 14 16 18
100 km
AB
C
95˚ 96˚ 97˚ 98˚0˚
1˚
2˚
3˚
4˚ 12
34
56
96 FZ
FZ
SMT
97
TC
DPSZ R SB
Figure 2. Geophysical setting of the segment boundaryregion around Simeulue Island. The top surface of theTOC picked from depth-migrated MCS data is plotted incolor. Free-air gravity is shown by gray contours [Sandwelland Smith, 2009]. Coseismic slip of the 2004 (pink) and2005 (purple) earthquakes is shown by dashed contours at5 and 2m intervals, respectively [Chlieh et al., 2007; Briggset al., 2006]. Red (well-resolved) and white circles: seismic-ity relocated with the 3-D velocity model (see text); Thickblack contours: outlines of the backstop from the 6 km/svelocity contours at 1 km intervals; White curved line: out-line of the TCZ (see text); Blue lines: velocity cross-sectionsshown in Figure 3. A =Accretionary wedge, B =Backstop,C =Thickened oceanic crust, TC =Trench trend change,FZ = fracture zone, SMT= seamount, DPSZ = different prop-erty sediment zone [Dean et al., 2010].
TANG ET AL.: 3D TOMOGRAPHY IN SUMATRA SUBDUCTION ZONE
49
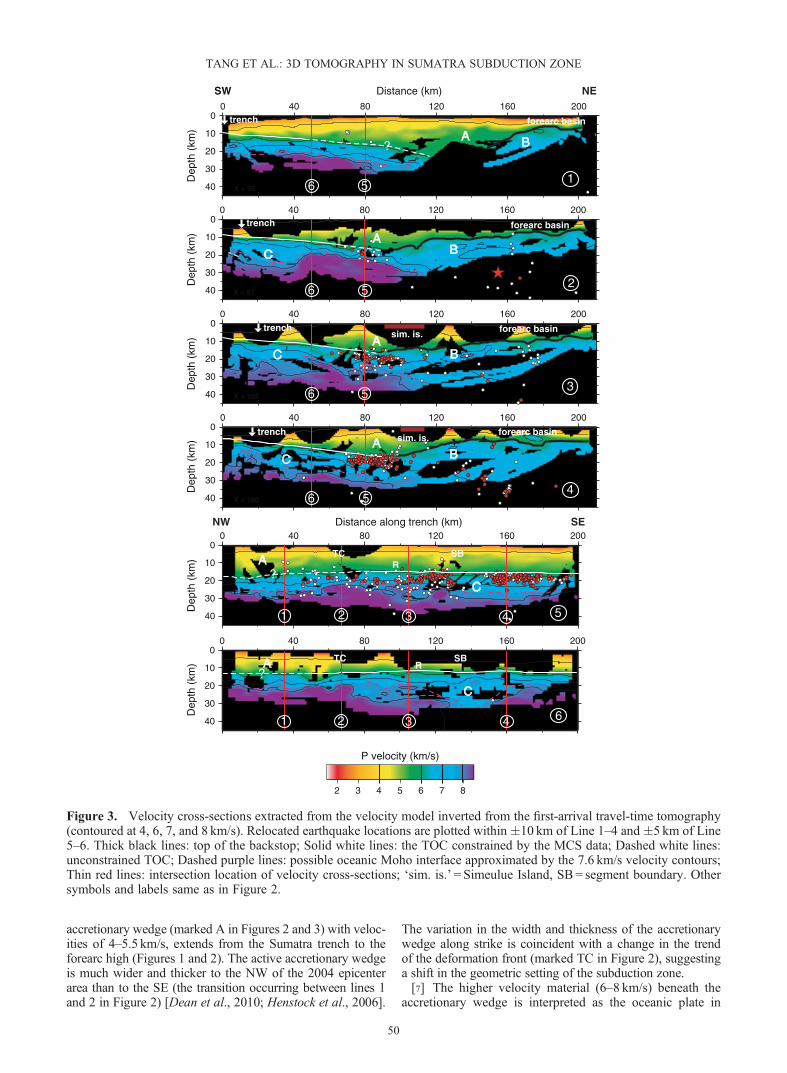
accretionary wedge (marked A in Figures 2 and 3) with veloc-ities of 4–5.5 km/s, extends from the Sumatra trench to theforearc high (Figures 1 and 2). The active accretionary wedgeis much wider and thicker to the NW of the 2004 epicenterarea than to the SE (the transition occurring between lines 1and 2 in Figure 2) [Dean et al., 2010; Henstock et al., 2006].
The variation in the width and thickness of the accretionarywedge along strike is coincident with a change in the trendof the deformation front (marked TC in Figure 2), suggestinga shift in the geometric setting of the subduction zone.[7] The higher velocity material (6–8 km/s) beneath the
accretionary wedge is interpreted as the oceanic plate in
0
10
20
30
40
Dep
th (
km)
0 40 80 120 160 200
6
C
1 2 3 4
RA TC
?
0
10
20
30
40
0 40 80 120 160 200
Distance (km)
Dep
th (
km)
X = 35
0
10
20
30
40
Dep
th (
km)
0 80 120 160 200
X = 67
40
0
20
40
Dep
th (
km)
0 40 80 120 160
30
200
X = 105
10
0
20
30
40
10
Dep
th (
km)
0 40 80 120 160 200
X = 160
0
10
20
30
40
Dep
th (
km)
0 40 80 120 160 200Distance along trench (km)
A B
AB
AB
AB
C
C
C
A
C
1
2
3
4
5
SW NE
NW SE
2 3 4 5 6 7 8
P velocity (km/s)
sim. is.
sim. is.
?
trench
trench
trench
trench
forearc basin
forearc basin
forearc basin
forearc basin
SBTC
1 2 3 4
5
5
5
5
?R
SB
6
6
6
6
Figure 3. Velocity cross-sections extracted from the velocity model inverted from the first-arrival travel-time tomography(contoured at 4, 6, 7, and 8 km/s). Relocated earthquake locations are plotted within �10 km of Line 1–4 and �5 km of Line5–6. Thick black lines: top of the backstop; Solid white lines: the TOC constrained by the MCS data; Dashed white lines:unconstrained TOC; Dashed purple lines: possible oceanic Moho interface approximated by the 7.6 km/s velocity contours;Thin red lines: intersection location of velocity cross-sections; ‘sim. is.’ =Simeulue Island, SB= segment boundary. Othersymbols and labels same as in Figure 2.
TANG ET AL.: 3D TOMOGRAPHY IN SUMATRA SUBDUCTION ZONE
50
the region seaward of Simeulue Island and as the upper plate‘backstop’ block (older forearc material) landward of the is-land. This ‘backstop’ block, outlined by the 6 km/s contoursurface (marked B in Figures 2 and 3), is located beneaththe forearc basin, slopes seaward and bulges seaward atSimeulue Island. It is likely to act as a mechanical boundaryin the subduction zone.[8] Another striking feature identified in the velocity model
is a broad zone of anomalous velocities (7.2–7.7 km/s) below15–20 km depth from sea level along the normal-to-trenchdirection seaward of Simeulue Island (marked C in Figures 2and 3), in contrast to higher velocities (>8 km/s) along striketo the NW and SE. Zero velocity variations relative to theaveraged along-strike velocities at fixed depths from theTOC define the boundary of this anomalous crustal zone(see auxiliary Figure S12), which is about 100 km wide alongstrike at the trench and extends for at least 100 km perpendic-ular to the trench (Figure 2), and shows a velocity range inter-mediate between oceanic crust and mantle. These velocitiescould indicate either partially serpentinized oceanic mantleor thicker oceanic crust. We prefer the latter interpretationbecause the observed raised topography of the TOC is con-sistent with underplating of oceanic crustal material to thebase of the crust. The TOC under the accretionary prismshows a broad topographic high seaward of Simeulue(marked R in Figure 2). Near the trench, this topographichigh has an amplitude up to 3 km over a distance of ~ 90 kmboth to the NW and SE, and appears to extend seaward ontothe oceanic plate, evident from a series of gravity and bathy-metric highs (Figures 1 and 2), which are usually interpretedas fracture zone structures (Figure 1, inset). We note thatbathymetric and gravity data indicate these interpreted frac-ture zones have variable surface expression along their extent(Figures 1 and 2), possibly suggesting a more complex origin.[9] The distribution of local earthquakes [Tilmann et al.,
2010], relocated using the 3-D velocity model inverted fromthe first-arrival travel-time data, shows a concentration alongand below the top surface of the subducting plate. Few earth-quakes occur in the accretionary prism (Figures 2 and 3),suggesting that recent deformation within the prism is
minimal or aseismic. Another pronounced feature of theseismicity is a landward indentation of the main belt ofearthquake epicenters at central Simeulue [e.g., Tilmannet al., 2010].
4. Discussion and Conclusion
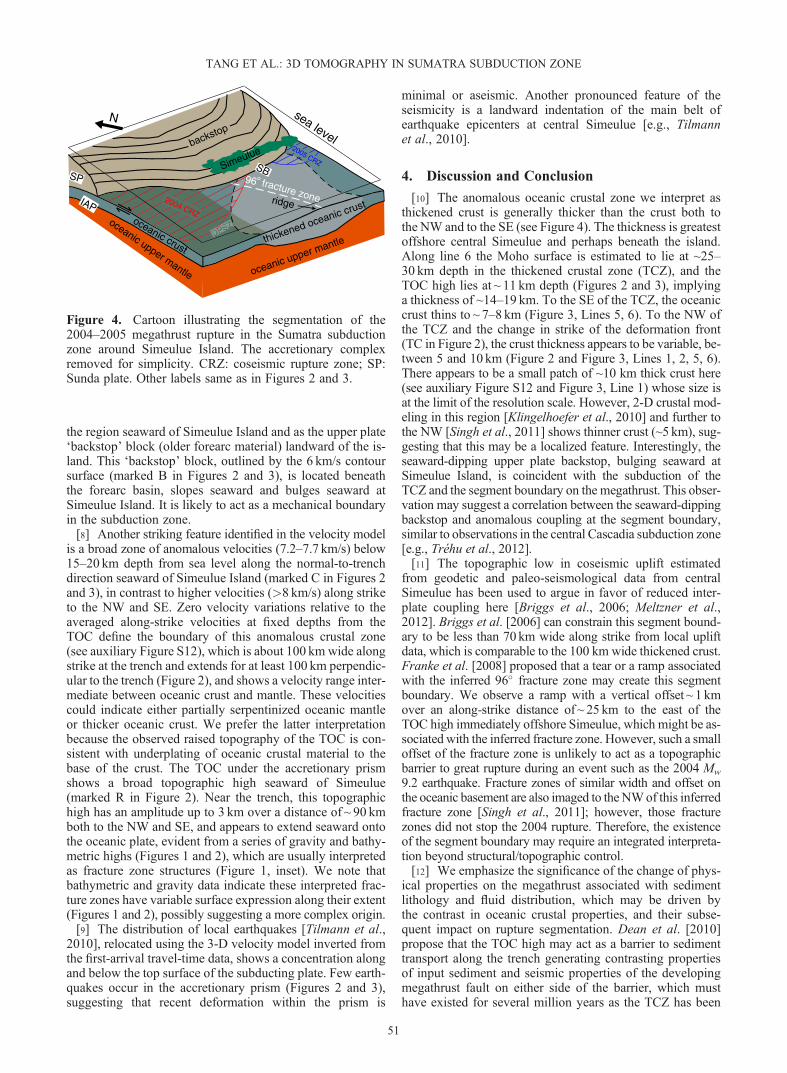
[10] The anomalous oceanic crustal zone we interpret asthickened crust is generally thicker than the crust both tothe NW and to the SE (see Figure 4). The thickness is greatestoffshore central Simeulue and perhaps beneath the island.Along line 6 the Moho surface is estimated to lie at ~25–30 km depth in the thickened crustal zone (TCZ), and theTOC high lies at ~ 11 km depth (Figures 2 and 3), implyinga thickness of ~14–19 km. To the SE of the TCZ, the oceaniccrust thins to ~ 7–8 km (Figure 3, Lines 5, 6). To the NW ofthe TCZ and the change in strike of the deformation front(TC in Figure 2), the crust thickness appears to be variable, be-tween 5 and 10 km (Figure 2 and Figure 3, Lines 1, 2, 5, 6).There appears to be a small patch of ~10 km thick crust here(see auxiliary Figure S12 and Figure 3, Line 1) whose size isat the limit of the resolution scale. However, 2-D crustal mod-eling in this region [Klingelhoefer et al., 2010] and further tothe NW [Singh et al., 2011] shows thinner crust (~5 km), sug-gesting that this may be a localized feature. Interestingly, theseaward-dipping upper plate backstop, bulging seaward atSimeulue Island, is coincident with the subduction of theTCZ and the segment boundary on the megathrust. This obser-vation may suggest a correlation between the seaward-dippingbackstop and anomalous coupling at the segment boundary,similar to observations in the central Cascadia subduction zone[e.g., Tréhu et al., 2012].[11] The topographic low in coseismic uplift estimated
from geodetic and paleo-seismological data from centralSimeulue has been used to argue in favor of reduced inter-plate coupling here [Briggs et al., 2006; Meltzner et al.,2012]. Briggs et al. [2006] can constrain this segment bound-ary to be less than 70 km wide along strike from local upliftdata, which is comparable to the 100 km wide thickened crust.Franke et al. [2008] proposed that a tear or a ramp associatedwith the inferred 96� fracture zone may create this segmentboundary. We observe a ramp with a vertical offset ~ 1 kmover an along-strike distance of ~ 25 km to the east of theTOC high immediately offshore Simeulue, which might be as-sociated with the inferred fracture zone. However, such a smalloffset of the fracture zone is unlikely to act as a topographicbarrier to great rupture during an event such as the 2004 Mw
9.2 earthquake. Fracture zones of similar width and offset onthe oceanic basement are also imaged to the NWof this inferredfracture zone [Singh et al., 2011]; however, those fracturezones did not stop the 2004 rupture. Therefore, the existenceof the segment boundary may require an integrated interpreta-tion beyond structural/topographic control.[12] We emphasize the significance of the change of phys-
ical properties on the megathrust associated with sedimentlithology and fluid distribution, which may be driven bythe contrast in oceanic crustal properties, and their subse-quent impact on rupture segmentation. Dean et al. [2010]propose that the TOC high may act as a barrier to sedimenttransport along the trench generating contrasting propertiesof input sediment and seismic properties of the developingmegathrust fault on either side of the barrier, which musthave existed for several million years as the TCZ has been
2004 CRZ
oceanic upper mantlethickened oceanic crust
96 fracture zone
backstop
Simeulue
oceanic crust
ridge
oceanic upper mantle
IAP
SP
sea level
SB
N
DPSZDDDPSZDPSZDPSZDDDPDP
Figure 4. Cartoon illustrating the segmentation of the2004–2005 megathrust rupture in the Sumatra subductionzone around Simeulue Island. The accretionary complexremoved for simplicity. CRZ: coseismic rupture zone; SP:Sunda plate. Other labels same as in Figures 2 and 3.
TANG ET AL.: 3D TOMOGRAPHY IN SUMATRA SUBDUCTION ZONE
51
subducting beneath the accretionary prism over a down-trench distance of at least 100 km. The megathrust sectionwith distinct seismic properties NW of the barrier is markedas DPSZ on Figures 2 and 4. The overlying sediments, prob-ably derived from different lithology, are suggested to bedenser and mechanically stronger than those to the SE [Deanet al., 2010] due to dewatering and lithification during burial[Gulick et al., 2011], contributing to strengthening of themegathrust. We speculate that the TCZ itself might be intrin-sically compositionally weak relative to adjacent regionsindicated by the velocity variations, which could potentiallychange the rheology of the megathrust in the segmentboundary. The TCZ structure and topography may furtherintensify the contrast in the megathrust strength. The inferredfracture zone, a preexisting structure coincident with theTCZ, could be a locus of enhanced fluid release into themegathrust [Tilmann et al., 2010]. Such a localized influencecould explain the indentation of the seismicity band (stablesliding/seismogenic zone transition), suggesting an along-strike change in physical properties on the megathrust. Thisphysical property change at the TCZ may in turn influencethe frictional behavior on the megathrust, leading to weakinterplate coupling and aseismic slip [e.g.,Moore and Saffer,2001].[13] We propose that the TCZ, with associated composi-
tional (indicated by seismic velocity) and topographicchanges, provides a primary control on the segmentation ofsubduction zone rupture along the Sumatra megathrustthrough impact on sediment and megathrust properties(Figure 4). The possible intrinsically weak nature of thisanomalous crustal section, and/or physical property changesacross it, may additionally result in heterogeneous frictionalbehavior and specifically reduced interplate coupling at thesegment boundary, thus creating a clearly persistent and dis-tinct earthquake segment boundary.
[14] Acknowledgments. We thank the master and crew of the F/SSonne and all those involved in SO198 cruises for their assistance, andour partners BPPT, Jakarta, and LIPI, Bandung for their logistical assis-tance. The OBSs were provided by the UK Ocean Bottom InstrumentationFacility. This work was funded by Natural Environment Research Council(NE/D004381/1). We thank the Dorothy Hodgkin Postgraduate Award forfunding a PhD studentship and the CUP Science Foundation for financialsupport (No. YJRC-2013-33). We thank Satish Singh for useful discussionand ideas, and referees Anne Tréhu and Nathan Bangs for their suggestionsfor improving this paper.
ReferencesAmmon, C. J., C. Ji, H. Thio, D. Robinson, S. Ni, V. Hjorleifsdottir,H. Kanamori, T. Lay, S. Das, D. Helmberger, G. Ichinose, J. Polet, andD. Wald (2005), Rupture process of the 2004 Sumatra-Andaman earth-quake, Science, 308(5725), 1133‐1139, doi:10.1126/science.1112260.
Berglar, K., C. Gaedicke, D. Franke, S. Ladage, F. Klingelhoefer, andY. Djajadihardja (2010), Structural evolution and strike-slip tectonicsoff north-western Sumatra, Tectonophysics, 480, 119‐132, doi:10.1016/j.tecto.2009.10.003.
Bilek, S. L., S. Y. Schwartz, and H. R. DeShon (2003), Control of seafloorroughness on earthquake rupture behavior, Geology, 31(5), 455‐458,doi:10.1130/0091-7613(2003)031<0455:COSROE>2.0.CO;2.
Briggs, R. W., K. Sieh, A. J. Meltzner, D. Natawidjaja, J. Galetzka,B. Suwargadi, Y. Hsu, M. Simons, N. Hananto, I. Suprihanto, D. Prayudi,J. Avouac, L. Prawirodirdjo, and Y. Bock (2006), Deformation and slipalong the Sunda megathrust in the great 2005 Nias-Simeulue earthquake,Science, 311(5769), 1897‐1901, doi:10.1126/science.1122602.
Chlieh, M., J. Avouac, V. Hjorleifsdottir, T. A. Song, C. Ji, K. Sieh, A. Sladen,H. Hebert, L. Prawirodirdjo, Y. Bock, and J. Galetzka (2007), Coseismicslip and afterslip of the great Mw 9.15 Sumatra-Andaman earthquake
of 2004, Bulletin of the Seismological Society of America, 97(1A),S152‐S173, doi:10.1785/0120050631.
Cummins, P. R., T. Baba, S. Kodaira, and Y. Kaneda (2002), The 1946Nankai earthquake and segmentation of the Nankai Trough, Physics ofEarth Planet Interior, 132, 75‐87, doi:10.1016/S0031-9201(02)00045-6.
Dean, S. M., L. C. McNeill, T. J. Henstock, J. M. Bull, S. P. S. Gulick, J. A.Austin, N. L. B. Bangs, Y. S. Djajadihardja, and H. Permana (2010),Contrasting décollement and prism properties over the Sumatra 2004-2005 earthquake rupture boundary, Science, 329, 207‐210, doi:10.1126/science.1189373.
Eberhart-Phillips, D. (1990), Three-dimensional P and S velocity structurein the Coalinga Region, California, Journal of Geophysical Research,95(B10), 15,343‐15,363, doi:10.1029/JB095iB10p15343.
Franke, D., M. Schnabel, S. Ladage, D. R. Tappin, S. Neben, Y. S. Djajadihardja,C. Muller, H. Kopp, and C. Gaedicke (2008), The great Sumatra-Andamanearthquakes- imaging the boundary between the ruptures of the great 2004and 2005 earthquakes, Earth and Planetary Science Letters, 269, 118‐130,doi:10.1016/j.epsl.2008.01.047.
Graindorge, D., et al. (2008), Impact of lower plate structure on upper platedeformation at the NW Sumatran convergent margin from seafloor mor-phology, Earth and Planetary Science Letters, 275(3-4), 201‐210,doi:10.1016/j.epsl.2008.04.053.
Gulick, S. P. S., J. A. Austin, L. C. McNeill, N. L. B. Bangs, K. M. Martin,T. J. Henstock, J. M. Bull, S. Dean, Y. D. Djajadihardja, and H. Permana(2011), Updip rupture of the 2004 Sumatra earthquake extended by thickindurated sediments, Nature Geoscience, 4, 453‐456, doi:10.1038/ngeo1176.
Henstock, T. J., L. C. McNeill, and D. R. Tappin (2006), Seafloor morphol-ogy of the Sumatran subduction zone: Surface rupture during megathrustearthquakes? Geology, 34(6), 485‐488, doi:10.1130/22426.1.
Klingelhoefer, F., M.-A. Gutscher, S. Ladage, J.-X. Dessa, D. Graindorge,D. Franke, C. André, H. Permana, T. Yudistira, and A. Chauhan(2010), Limits of the seismogenic zone in the epicentral region of the26 December 2004 great Sumatra-Andaman earthquake: Results fromseismic refraction and wide-angle reflection surveys and thermal model-ing, J. Geophy. Res., 115, B01304, doi:10.1029/2009JB006569.
Kodaira, S., N. Takahashi, A. Nakanishi, S. Miura, and Y. Kaneda (2000),Subducted seamount imaged in the rupture zone of the 1946 Nankaido earth-quake, Science, 289(5476), 104‐106, doi:10.1126/science.289.5476.104.
Ladage, S., C. Gaedicke, U. Barckhausen, I. Heyde, W. Weinrebe, E. R.Flueh, A. Krabbenhoeft, H. Kopp, S. Fajar, and Y. Djajadihardja(2006), Bathymetric survey images structure off Sumatra, Eos Transac-tions, American Geophysical Union, 87(17), 165, doi:10.1029/2006EO170001.
Melnick, D., B. Bookhagen, H. P. Echtler, and M. P. Strecker, 2006,Coastal deformation and great subduction earthquakes, Isla SantaMaría, Chile (37º S), Geological Society of America Bulletin, 118,1463‐1480, doi:10.1130/B25865.1.
Meltzner, A. J., K. Sieh, H. Chiang, C. Shen, B. W. Suwargadi, D. H.Natawidjaja, B. Philibosian, and R. W. Briggs (2012), Persistent terminiof 2004- and 2005-like ruptures of the Sunda megathrust, J. Geophys.Res., 117, B04405, doi:10.1029/2011JB008888.
Minshull, T. A., M. C. Sinha, and C. Peirce (2005), Multidisciplinary sub-seabed geophysical imaging, Sea Technology, 46(10), 27‐31.
Mochizuki, K., T. Yamada, M. Shinohara, Y. Yamanaka, and T. Kanazawa(2008), Weak interplate coupling by seamounts and repeating M 7 earth-quakes, Science, 321, 1194‐1197, doi:10.1126/science.1160250.
Moore, J. C., and D. Saffer (2001), Updip limit of the seismogenic zonebeneath the accretionary prism of southwest Japan: An effect of diage-netic to low grade metamorphic processes and increasing effective stress,Geology, 29(2), 183‐186, doi:10.1130/0091-7613(2001)029<0183:ULOTSZ>2.0.CO;2.
Prawirodirdjo, L. and Y. Bock (2004), Instantaneous global plate motionmodel from 12 years of continuous GPS observations, Journal of Geo-physical Research, 109, B08405, doi:10.1029/2003JB002944.
Robinson, D. P., S. Das, and A. B. Watts (2006), Earthquake rupture stalledby subducting fracture zone, Science, 312, 1203‐1205, doi:10.1126/science.1125771.
Sandwell, D. T., and W. H. F. Smith (2009), Global marine gravity fromretracked Geosat and ERS-1 altimetry: Ridge segmentation versus spread-ing rate, J. Geophys. Res., 114, B01411, doi:10.1029/2008JB006008.
Scholz C. H., and C. Small (1997), The effect of seamount subduction onseismic coupling, Geology, 25, 487‐490, doi:10.1130/0091-7613(1997)025<0487:TEOSSO>2.3.CO;2.
Singh, S. C., H. Carton, A. S. Chauhan, S. Androvandi, A. Davaille,J. Dyment, M. Cannat, and N. D. Hananto (2011), Extremely thin crustin the Indian Ocean possibly resulting from Plume-Ridge interaction,Geophys. J. Int., 184(1), 29‐42, doi:10.1111/j.1365-246X.2010.04823.x.
Tilmann, F., T. J. Craig, I. Grevemeyer, B. Suwargadi, H. Kopp, and E. Flueh(2010), The updip seismic/aseismic transition of the Sumatra megathrust il-luminated by aftershocks of the 2004 Aceh-Andaman and 2005 Nias
TANG ET AL.: 3D TOMOGRAPHY IN SUMATRA SUBDUCTION ZONE
52

events, Geophys. J. Int., 181(3), 1261‐1274, doi:10.1111/j.1365-246X.2010.04597.x.
Tréhu, A. M., R. J. Blakely, and C. W. Mark (2012), Subducted seamountsand recent earthquakes beneath the central Cascadia forearc, Geology, 40(2),103‐106, doi:10.1130/G32460.1.
Wang, K., and S. L. Bilek (2011), Do subducting seamounts generate or stoplarge earthquakes?Geology, 39(9), 819‐822, doi:10.1130/G31856.1.
Zelt, C. A., and P. J. Barton (1998), Three-dimensional seismic refractiontomography: A comparison of two methods applied to data from the FaeroeBasin, Geophys. J. Int., 103(B4), 7187‐7210, doi:10.1029/97JB03536.
TANG ET AL.: 3D TOMOGRAPHY IN SUMATRA SUBDUCTION ZONE
53