2q|17 government pension fund global · 2017-08-22 · contents norges bank investment management...
TRANSCRIPT

GOVERNMENTPENSION FUNDGLOBAL
2Q|17
QUARTERLY REPORT/2017

Second quarter 2017 in brief
The Government Pension Fund Global returned 2.6 percent, or 202 billion kroner, in the second quarter of 2017.
2.6 %202 Bn. KR
HIGHLIGHTS
ISSN 1893-4846 (print) | ISSN 1893-5524 (web) | Design: Brandlab | Photo: Getty Images/Allan Davey/unexpected | Production: 07 Media AS | Paper: Galerie Art Matt 250 g / 150 g | Copies: 200

Equity investments returned 3.4 percent, while fixed-income investments returned 1.1 percent. Investments in unlisted real estate returned 2.1 percent.
The return on the fund’s investments was 0.3 percentage point higher than the return on the benchmark index the fund is measured against.
3.4% 2.1%1.1%
EQUITYINVESTMENTS
FIXED-INCOMEINVESTMENTS
UNLISTED REAL ESTATE
INVESTMENTS

The fund had a market value of 8,020 billion kroner at the end of the quarter
and was invested 65.1 percent in equities, 32.4 percent in fixed income and
2.5 percent in unlisted real estate.
8,020 Bn. KR
2.5%
UNLISTED REAL ESTATE
INVESTMENTS
32.4%
FIXED-INCOMEINVESTMENTS
65.1%
EQUITYINVESTMENTS

Contents
WWW.NBIM.NO Norges Bank Investment Management manages the Government Pension Fund Global.Our mission is to safeguard and build financial wealth for future generations.
INVESTMENTS
Equity investments _________ 6
Fixed-income investments __9
Real estate investments ___ 12
MANAGEMENT
Management ______________13
Risk ________________________14
Responsible investment ___ 16
KEY FIGURES AND FINANCIAL REPORTING
Key figures ________________ 18
Financial reporting ________ 21
Notes _______________________ 26
Auditor’s report ____________ 47
1 2 3
Translated from Norwegian. For information only.

InvestmentsEQUITY INVESTMENTSEquity investments returned 3.4 percent and made up 65.1 percent of the fund at the end of the quarter. The return was driven by further healthy growth in the global economy. Some macroeconomic data, especially for the US economy, were nevertheless weaker than the market had anticipated. Growth expectations for emerging markets were largely unchanged from the previous quarter, while those for developed markets improved, fuelled by greater optimism in the euro area. There was little volatility in global equity markets during the quarter. Towards its end, however, signals of tighter monetary policy from a number of central banks contributed to increased volatility, higher long-term yields and lower equity prices.
Strongest return in Europe European stocks returned 6.3 percent and accounted for 36.6 percent of the fund’s equities at the end of the quarter. The UK, which was the fund’s largest European market with 9.7 percent of its equity investments, returned 3.3 percent, or 1.5 percent in local currency.
North American stocks returned 0.7 percent and amounted to 38.6 percent of the equity portfolio. US stocks, which were the fund’s single largest market with 36.4 percent of its equity investments, returned 0.8 percent, or 2.9 percent in local currency.
Chart 1 Price developments in stock sectors in the FTSE Global All Cap Index. Measured in US dollars. Indexed total return 31.12.2016 = 100
80
85
90
95
100
105
110
115
120
80
85
90
95
100
105
110
115
120
Jul-16 Oct-16 Jan-17 Apr-17 Jul-17
Health care IndustrialsConsumer goods Oil and gasTelecommunications
Source: FTSE
Chart 2 Price developments in regional equity markets. Measured in US dollars, except for the StoxxEurope 600, which is measured in euros. Indexed total return 31.12.2016 = 100
80
85
90
95
100
105
110
115
120
80
85
90
95
100
105
110
115
120
Jul-16 Oct-16 Jan-17 Apr-17 Jul-17
FTSE Global All Cap (global) S&P 500 (US)Stoxx Europe 600 (Europe) MSCI Asia Pacific (Asia)
Source: Bloomberg
6
Investments | 2Q 2017 | Government Pension Fund Global

INVESTMENTS 1
Stocks in Asia and Oceania, which made up 22.0 percent of the fund’s equity investments, returned 3.9 percent. Japanese stocks returned 3.4 percent, or 6.4 percent in local currency, and amounted to 9.0 percent of equity investments.
Emerging markets accounted for 9.9 percent of the equity portfolio and returned 3.4 percent. The Chinese stock market, home to 2.9 percent of the fund’s equity investments, returned 7.7 percent.
Health care performs best Health care stocks delivered the best return in the second quarter at 5.7 percent and have produced a substantial return in the year to
date, driven by market expectations of stronger earnings in the sector. Proposals to overhaul the regulatory framework for health care in the US have yet to result in any actual changes, which the market is interpreting as a continuation of stable operating conditions.
Industrials returned 4.9 percent on the back of the improved outlook for economic growth, especially in Europe and emerging markets. PMIs in both the US and Europe were strong throughout the quarter. Returns were strong in the industrial machinery sector, driven by increased demand for construction machinery and more stable demand for capital goods in the commodity industry.
Table 1 Return on the fund’s equity investments in second quarter 2017 by sector. Percent
Sector
Return in international
currency
Share of equity
investments1
Financials 4.3 24.3
Industrials 4.9 14.4
Consumer goods 4.4 13.5
Health care 5.7 10.5
Technology 3.9 10.4
Consumer services 2.0 10.0
Basic materials 1.9 5.5
Oil and gas -6.1 5.3
Telecommunications -0.1 3.0
Utilities 3.2 2.8
1 Does not sum up to 100 percent because cash and derivatives are not included.
Table 2 The fund’s largest equity holdings as at 30 June 2017. Millions of kroner
Company Country Holding
Apple Inc US 58,219
Nestlé SA Switzerland 50,699
Alphabet Inc US 42,705
Royal Dutch Shell Plc UK 40,145
Microsoft Corp US 39,251
Novartis AG Switzerland 37,375
Roche Holding AG Switzerland 35,640
Amazon.com Inc US 29,705
HSBC Holdings Plc UK 28,500
Johnson & Johnson US 26,912
7

Consumer goods companies returned 4.4 percent, due partly to returns in the European food and beverage industry. Luxury goods also made a positive contribution, while the automobile industry made the most negative contribution.
Oil and gas stocks were the weakest performers, returning -6.1 percent. Oil prices continued to fall during the quarter despite the OPEC cartel’s efforts to limit the supply of oil and keep prices stable around 50 dollars per barrel.
Individual stocks The investment in consumer goods company Nestlé SA made the most positive contribution to the return in the second quarter, followed by technology company Tencent Holding Ltd and
health care company Novartis AG. The companies that made the most negative contributions were industrial company General Electric Co, telecommunications company AT&T Inc and technology company International Business Machines Corp.
The fund participated in 41 initial public offerings in the quarter. The largest was at financial company Allied Irish Banks Plc, followed by consumer services company Altice USA Inc and health care company Galenica Santé AG. The offerings in which the fund invested the most were those in Allied Irish Banks Plc, industrial company ALD Automotive SA and Altice USA Inc.
RETURN IN INTERNATIONAL CURRENCY The fund invests in international securities. Returns are generally measured in international currency – a weighted combination of the currencies in the fund’s benchmark indices for equities and bonds. This is known as the fund’s currency basket and consisted of 34 currencies at the end of the second quarter. Unless otherwise stated in the text, results are measured in this currency basket.
8
Investments | 2Q 2017 | Government Pension Fund Global

INVESTMENTS 1
FIXED-INCOME INVESTMENTSFixed-income investments returned 1.1 percent and accounted for 32.4 percent of the fund at the end of the quarter. Global yields changed little during the quarter.
Positive return on fixed-income investments Government bonds returned 0.7 percent and made up 55.9 percent of the fund’s fixed-income investments at the end of the quarter.
US Treasuries returned -0.6 percent, or 1.5 percent in local currency, and accounted for 19.5 percent of fixed-income investments, making them the fund’s largest holding of government debt from a single issuer. The Federal Reserve raised its policy rate by 0.25 percentage point in June, which was in line with
market expectations. The dollar weakened somewhat against the fund’s currency basket during the quarter.
Euro-denominated government bonds represented 11.9 percent of the fund’s fixed-income holdings and returned 4.8 percent, or 0.3 percent in local currency. The European Central Bank (ECB) left its policy rate unchanged during the quarter. The market expects the ECB to scale down its quantitative easing in 2018 once the current bond repurchase programme draws to a close at the end of this year. The euro strengthened against the fund’s currency basket during the quarter.
Japanese government bonds amounted to 6.4 percent of the fund’s fixed-income holdings and
Table 4 The fund’s largest bond holdings as at 30 June 2017. Millions of kroner
Issuer Country Holding
United States of America US 591,333
Japanese government Japan 169,090
Federal Republic of Germany Germany 104,571
Mexican government Mexico 63,269
UK government UK 62,241
French Republic France 58,006
South Korean government South Korea 52,516
Italian Republic Italy 42,971
Spanish government Spain 41,903
Kreditanstalt für Wiederaufbau Germany 33,451
Table 3 Return on the fund’s fixed-income investments in second quarter 2017 by sector. Percent
Sector
Return in international
currency
Share of fixed-income investments1
Government bonds2 0.7 55.9
Government-related bonds2 1.8 13.1
Inflation-linked bonds2 -0.9 5.0
Corporate bonds 1.2 24.9
Securitised bonds 2.9 5.4
1 Does not sum up to 100 percent because cash and derivatives are not included.
2 Governments may issue different types of bonds, and the fund’s investments in these bonds are grouped accordingly. Bonds issued by a country’s government in the country’s own currency are categorised as government bonds. Bonds issued by a country’s government in another country’s currency are government-related bonds. Inflation-linked bonds issued by governments are grouped with inflation-linked bonds.
9

returned -3.0 percent, or -0.1 percent in local currency. The Bank of Japan made no changes to monetary policy during the quarter, leaving its key rate unchanged. The yen was relatively stable against the dollar during the quarter and so weakened somewhat against the fund’s currency basket.
The fund also holds bonds from government-related institutions such as Kreditanstalt für Wiederaufbau (KfW), the European Investment Bank (EIB) and Canada Housing Trust (Canhou). These bonds returned 1.8 percent and accounted for 13.1 percent of fixed-income investments.
Corporate bonds returned 1.2 percent and made up 24.9 percent of fixed-income investments at the end of the period. Credit premiums declined during the quarter and are approaching the levels of before the financial crisis.
Securitised debt, consisting mainly of covered bonds denominated in euros, returned 2.9 percent and made up 5.4 percent of fixed-income holdings.
Inflation-linked bonds returned -0.9 percent and accounted for 5.0 percent of total fixed-income investments.
Chart 3 Price developments for bonds issued in dollars, euros, pounds and yen. Measured in local currencies. Indexed total return 31.12.2016 = 100
90
95
100
105
110
90
95
100
105
110
Jul-16 Oct-16 Jan-17 Apr-17 Jul-17
Dollar Euro Pound Yen
Source: Bloomberg Barclays Indices
Chart 4 10-year government bond yields. Percent
-0.5
0.0
0.5
1.0
1.5
2.0
2.5
3.0
-0.5
0.0
0.5
1.0
1.5
2.0
2.5
3.0
Jul-16 Oct-16 Jan-17 Apr-17 Jul-17
Germany US Italy Spain Japan UK
Source: Bloomberg
10
Investments | 2Q 2017 | Government Pension Fund Global

INVESTMENTS 1
Changes in fixed-income holdings The market value of investments in bonds denominated in emerging market currencies fell from 12.8 to 12.3 percent of total fixed-income investments during the quarter.
Investments in dollars, euros, pounds and yen accounted for 79.6 percent of fixed-income holdings at the end of the quarter, against 79.2 percent at its start.
The biggest increases in the market value of the fund’s government bond holdings in the second quarter were in US, Spanish and UK bonds. The biggest decreases were in bonds from Japan, Germany and Italy.
Chart 5 Price developments in fixed-income sectors. Measured in US dollars. Indexed total return 31.12.2016 = 100
95
100
105
110
115
95
100
105
110
115
Jul-16 Oct-16 Jan-17 Apr-17 Jul-17
Government bonds Government-related bondsInflation-linked bonds Corporate bondsSecuritised bonds
Source: Bloomberg Barclays Indices
Table 5 The fund’s fixed-income investments as at 30 June 2017 based on credit ratings. Percentage of bond holdings
AAA AA A BBBLower rating Total
Government bonds 25.7 8.0 11.6 6.7 1.5 53.6
Government-related bonds 5.5 4.9 1.6 0.5 0.1 12.6
Inflation-linked bonds 3.9 0.4 0.1 0.3 0.1 4.8
Corporate bonds 0.2 2.5 8.7 12.1 0.3 23.9
Securitised bonds 4.5 0.5 0.1 0.1 0.0 5.1
Total bonds 39.9 16.3 22.1 19.7 2.0 100.0
11

REAL ESTATE INVESTMENTS Unlisted real estate investments returned 2.1 percent and amounted to 2.5 percent of the fund at the end of the quarter.
The return on unlisted real estate investments depends on rental income, operating expenses, changes in the value of properties and debt, movements in exchange rates, and transaction costs for property purchases and sales. Measured in local currency, rental income net of operating expenses made a positive contribution of 0.9 percentage point to the return, and changes in the value of properties and debt contributed 0.6 percentage point. Currency movements added a further 0.6 percentage point.
The management mandate for the fund was amended with effect from 1 January 2017. The fund’s real estate investments no longer form part of the strategic benchmark index, which now consists exclusively of equities and bonds.
The fund may still invest in real estate, but it is up to Norges Bank to determine the scope and mix of real estate investments within the general limits in the mandate. The changes to the mandate ensure a holistic approach to managing a portfolio that includes both listed and unlisted investments.
Unlisted and listed real estate investments are managed under a combined strategy for real estate. Investments in listed real estate returned 3.6 percent.
Purchases and sales of unlisted real estateThe fund further expanded its Regent Street partnership with The Crown Estate in May, with the partners acquiring three properties totalling 54,000 square feet. The fund paid 30.0 million pounds, or 331.0 million kroner, for its 25 percent stake.
Table 6 Return on the fund’s real estate investments in second quarter 2017
Return
Rental income (percentage points) 0.9
Change in value (percentage points) 0.6
Transaction costs (percentage points) 0.0
Result of currency adjustments (percentage points) 0.6
Unlisted real estate investments (percent) 2.1
Listed real estate investments (percent) 3.6
Aggregated real estate investments (percent) 2.4
Table 7 Market value of real estate investments as at 30 June 2017. Millions of kroner
Holding1
Unlisted real estate investments 198,707
Listed real estate investments 57,033
Aggregated real estate investments 255,740
1 Including bank deposits and other receivables
12
Investments | 2Q 2017 | Government Pension Fund Global

MANAGEMENTWe aim to leverage the fund’s long-term outlook and considerable size to generate high returns and safeguard wealth for future generations.
The management mandate issued by the Ministry of Finance was amended with effect from 1 January 2017. The return on all of the fund’s investments, including real estate, is now measured against a benchmark index from the Ministry of Finance consisting solely of global equity and bond indices. This benchmark index comprises an equity index based on FTSE Group’s Global All Cap stock index and a bond index based on various bond indices from Bloomberg Barclays Indices. The benchmark index serves as a general limit for market and currency risk in the management of the fund.
With this model, it is up to Norges Bank to decide how much to invest in real estate and what types of property to invest in. Purchases are financed through the sale of equities and bonds, which means that the proportion of the fund invested in equities and bonds will differ from the benchmark index. Unlisted and listed real estate investments are managed under a combined strategy for real estate.
The overall return on the fund was 0.3 percentage point higher than the return on the benchmark index in the second quarter, due mainly to a positive relative return on equity investments.
The fund’s equity investments outperformed the benchmark index for equities by 0.4 percentage point in the quarter, making a contribution of 0.25 percentage point to the fund’s relative return. Investments in financials,
Management
Chart 6 The fund’s quarterly return and accumulated annualised return. Percent
-15
-12
-9
-6
-3
0
3
6
9
12
15
-15
-12
-9
-6
-3
0
3
6
9
12
15
07 08 09 10 11 12 13 14 15 16 17
Quarterly returnAccumulated annualised return
Chart 7 The fund’s quarterly relative return and accumu lated annualised relative return. Calculations based on aggregated equity and fixed-income investments until end of 2016. Percentage points
-2.5
-2.0
-1.5
-1.0
-0.5
0.0
0.5
1.0
1.5
2.0
2.5
-2.5
-2.0
-1.5
-1.0
-0.5
0.0
0.5
1.0
1.5
2.0
2.5
07 08 09 10 11 12 13 14 15 16 17
Quarterly relative return
Accumulated annualised relative return
13
MANAGEMENT 2

industrials and basic materials made the most positive contributions to the relative return in the second quarter. The return on investments in listed real estate was in line with the benchmark index for equities. Broken down by country, equity investments in China, Germany and France made the most positive contributions to the relative return, while UK stocks made the most negative contribution.
The return on the fund’s fixed-income investments was on a par with the return on the benchmark index for bonds, making a contribution of 0.01 percentage point to the fund’s relative return. In the second quarter, the fund’s fixed-income investments had a higher weight of emerging markets and a lower weight of developed markets than the benchmark. This made a positive contribution from higher yields, but a much stronger euro and a weaker Brazilian real cancelled out most of the positive contribution.
Unlisted real estate underperformed the fund’s benchmark index, making a contribution of -0.01 percentage point to the fund’s relative return. These investments did, however,
outperform the actual equities and bonds sold to finance the properties.
The fund’s relative performance is also affected by the allocation between asset classes. In the second quarter, this allocation effect made a positive contribution of 0.03 percentage point.
RISKThe fund’s market risk is determined by the composition of its investments and by movements in share prices, exchange rates, interest rates, property prices and credit risk premiums. As no single measure or analysis can fully capture the fund’s market risk, we use a variety of measures and analyses – including expected volatility, factor exposures, concentration analysis and liquidity risk – to gain the broadest possible picture of this risk.
The fund’s expected absolute volatility, calculated using the statistical measure standard deviation, uses a three-year price history to estimate how much the annual return on the fund’s investments can normally be expected to fluctuate. The fund’s expected absolute volatility was 11.0 percent, or about 880 billion kroner, at the end of the second quarter, compared with 10.9 percent at the start of the quarter. The increase was due mainly to a higher weight of equities in the portfolio.
We invest in real estate to create a more diversified portfolio. We expect real estate investments to have a different return profile to equities and bonds in both the short and the longer term. The relative risk that this entails will impact on calculations of the fund’s expected relative volatility. As daily pricing is not available for our real estate investments,
Table 8 Contributions from asset classes to the fund’s relative return in second quarter 2017. Percentage points
Total
Attributed to external
management
Equity investments 0.25 0.08
Fixed-income investments 0.01 0.00
Unlisted real estate investments -0.01
Cross-asset allocation 0.03
Total 0.28 0.08
14
Management | 2Q 2017 | Government Pension Fund Global

we use a model from MSCI to calculate the risk for the fund’s unlisted real estate investments.
The Ministry of Finance and Norges Bank’s Executive Board have set limits for how far the fund’s investments may deviate from the benchmark index. One of these limits is expected relative volatility, or tracking error,
which puts a ceiling on how much the return on these investments can be expected to deviate from the return on the benchmark index.
The mandate from the Ministry of Finance was amended with effect from 1 January 2017. All of the fund’s investments, including unlisted real estate, are now included in the calculation of
Chart 8 Expected absolute volatility of the fund. Percent (left-hand axis) and billions of kroner (right-hand axis)
0
100
200
300
400
500
600
700
800
900
1,000
0
2
4
6
8
10
12
14
16
18
20
Jul-16 Oct-16 Jan-17 Apr-17 Jul-17
Risk measured in percent Risk measured in kroner
Chart 9 Expected relative volatility of the fund. Basis points
0
10
20
30
40
50
60
70
0
10
20
30
40
50
60
70
Jul-16 Oct-16 Jan-17 Apr-17 Jul-17
Fund Fund, excluding real estateEquity investments Fixed-income investments
Table 9 Key figures for the fund’s risk and exposure
Limits set by the Ministry of Finance 30.06.2017
Allocation Equity portfolio 50–80 percent of fund's market value1 64.8
Fixed-income portfolio 20–50 percent of fund's market value1 33.7
Unlisted real estate no more than 7 percent of fund's market value 2.5
Market risk 1.25 percentage points expected relative volatility for the fund's investments 0.3
Credit risk Maximum 5 percent of fixed-income investments may be rated below BBB- 2.0
Ownership Maximum 10 percent of voting shares in a listed company in the equity portfolio2 8.3
1 Derivatives are represented with their underlying economic exposure.2 Equity investments in listed and unlisted real estate companies are exempt from this restriction.
15
MANAGEMENT 2

expected relative volatility and measured against the fund’s benchmark index. The limit for expected relative volatility, including unlisted real estate, is 1.25 percentage points. The actual level, including unlisted real estate, was 0.33 percentage point at the end of the quarter.
The Executive Board has also set a limit for expected shortfall between the return on the fund and the benchmark index. The fund is to be managed in such a way that the expected negative relative return in extreme situations does not exceed 3.75 percentage points. With effect from 1 January 2017, investments in unlisted real estate have also been included in the calculation of expected shortfall for the fund. The actual level was 1.44 percentage points at the end of the quarter.
Operational risk management Norges Bank’s Executive Board sets limits for operational risk management and internal controls at Norges Bank Investment Management. It has decided there must be less than a 20 percent probability that operational risk factors will have a financial impact of 750 million kroner or more over a 12-month period, referred to as the Executive Board’s risk tolerance.
Each quarter, Norges Bank Investment Management estimates the size of the potential losses or gains it may incur over the next year because of unwanted operational events related to its investment management activities. The estimate is based on past events and an assessment of future risks and represents the fund’s estimated operational risk exposure. This estimated operational risk exposure remained within the Executive Board’s tolerance limit in the second quarter. A total of 136 unwanted
operational events were registered in the quarter, with an estimated financial impact of 15.2 million kroner.
The Ministry of Finance has issued rules on the fund’s management and is to be informed of any significant breaches of the specified limits. No such breaches were registered during the quarter, and we did not receive any notifications from local supervisory authorities of any significant breaches of market rules or general legislation.
RESPONSIBLE INVESTMENT Responsible investment is an integral part of our management of the fund. We have structured this work into three areas: standard setting, ownership and risk management. We held a meeting with Norwegian NGOs during the quarter to secure dialogue and provide information on our work on responsible investment.
Standard setting We published a new expectations document on tax and transparency during the quarter. Aimed at the boards of the companies we invest in, the expectations are based on international principles. The purpose of the expectations is to express how Norges Bank Investment Management as a financial investor expects multinational enterprises to exhibit appropriate, prudent and transparent tax behaviour.
We also participated in two separate consultation processes organised by index providers S&P Dow Jones Indices and FTSE Russell, where we advocated the use of voting rights as a criterion for the inclusion of companies in their indices.
16
Management | 2Q 2017 | Government Pension Fund Global

In 2016, Norges Bank Investment Management commissioned professor George Serafeim at Harvard Business School to look into the relationship between sustainability disclosure and corporate performance. This research was based on the fund’s own data on companies’ reporting. A report summarising the results was published during the quarter.
As part of our work on improving sustainability disclosure, Norges Bank Investment Management submitted a consultation response and hosted a meeting between investors, companies and CDP in connection with CDP’s ongoing project to update its questionnaires for companies on climate change, water and deforestation.
OwnershipWe voted at 6,818 general meetings in the second quarter, which sees the bulk of the year’s meetings, considering and voting on a total of 79,876 proposals.
We also published a position paper on CEO remuneration during the quarter. The board is responsible for ensuring that the CEO is rewarded in a way that promotes long-term value creation for the company and its shareholders. The board should develop pay practices that are simple and do not put undue strain on corporate governance, provide transparency on total remuneration to avoid unacceptable outcomes, and ensure that all benefits have a clear business rationale. We announced our support during the quarter for the board’s remuneration proposals at Royal Bank of Scotland and for changes to executive remuneration at Credit Suisse.
Risk managementNorges Bank Investment Management worked on an internal analysis of climate risk in the portfolio during the quarter. The analysis focused on sectors with particularly high risk exposure and was based on non-financial data.
In addition, the Norwegian Finance Initiative (NFI) awarded grants for two separate research projects at Columbia University and New York University to increase understanding of the relationship between climate change and financial economics.
Observation and exclusion Norges Bank published a number of decisions on exclusion, observation and active ownership during the quarter.
Bharat Heavy Electricals Ltd was excluded based on an assessment of the risk of severe environmental damage.
PetroChina Co Ltd and Leonardo SpA were placed under observation based on an unacceptable risk that they contribute to, or are responsible for, gross corruption. Hansae Yes24 Holdings Co Ltd and Hansae Co Ltd were placed under observation due to an unacceptable risk that they are responsible for systematic human rights violations.
The Executive Board also decided that Norges Bank Investment Management should follow up the risk of gross corruption with Eni SpA and Saipem SpA through active ownership.
17
MANAGEMENT 2

Key figuresTable 10 Quarterly return
2Q 2017 1Q 2017 4Q 2016 3Q 2016 2Q 2016Year-to-date
30.06.2017
Returns in international currency
Return on equity investments (percent) 3.37 5.53 4.91 6.03 0.66 9.09
Return on fixed-income investments (percent) 1.12 0.77 -2.35 0.89 2.49 1.90
Return on real estate investments (percent)1 2.05 0.62 1.25 2.29 -1.42 2.69
Return on fund (percent) 2.60 3.78 2.17 4.00 1.27 6.48
Relative return on fund (percentage points)2 0.28 0.09 0.28 0.17 -0.11 0.38
Management costs (percent) 0.02 0.02 0.01 0.01 0.01 0.03
Return on fund after management costs (percent) 2.59 3.76 2.15 3.98 1.26 6.45
Returns in kroner (percent)
Return on equity investments 2.92 6.85 8.74 1.54 1.11 9.97
Return on fixed-income investments 0.68 2.03 1.21 -3.39 2.95 2.73
Return on real estate investments1 1.61 1.88 4.95 -2.04 -0.98 3.52
Return on fund 2.15 5.08 5.90 -0.41 1.72 7.34
1 From 2017, the return on real estate investments includes exclusively unlisted real estate investments.2 Relative return on fund includes real estate investments from 01.01.2017. Relative return prior to 2017 is calculated on the
aggregated equity and fixed-income investments.
Table 11 Accumulated return since first capital inflow in 1996. Billions of kroner
2Q 2017 1Q 2017 4Q 2016 3Q 2016 2Q 2016
Return on equity investments 2,576 2,404 2,129 1,866 1,650
Return on fixed-income investments 1,001 975 955 1,022 1,004
Return on real estate investments1 44 41 38 37 31
Total return 3,622 3,420 3,123 2,925 2,685
1 From 2017, the return on real estate investments includes exclusively unlisted real estate investments.
18
Key figures and financial reporting | 2Q 2017 | Government Pension Fund Global

Table 12 Historical key figures as at 30 June 2017. Annualised data, measured in the fund’s currency basket
Since 01.01.1998
Last 10 years
Last 5 years
Last 3 years
Last 12 months
Fund return (percent) 5.89 5.52 9.57 6.21 13.13
Relative return on fund (percentage points)1 0.27 0.05 0.26 0.12 0.89
Annual price inflation (percent) 1.75 1.73 1.30 0.96 1.58
Annual management costs (percent) 0.09 0.08 0.06 0.06 0.06
Net real return on fund (percent) 3.98 3.65 8.10 5.14 11.32
The fund's actual standard deviation (percent) 7.41 9.05 5.92 6.36 3.47
The fund's tracking error (percentage points)1 0.70 0.91 0.37 0.38 0.26
The fund's information ratio (IR)1,2 0.41 0.11 0.66 0.30 3.02
1 Based on aggregated equity and fixed-income investments until end of 2016.2 The fund’s information ratio (IR) is the ratio of the fund’s average monthly relative return to the fund’s tracking error.
The IR indicates how much relative return has been achieved per unit of relative risk.
19
KEY FIGURES AND FINANCIAL REPORTING 3

Table 13 Key figures. Billions of kroner
2Q 2017 1Q 2017 4Q 2016 3Q 2016 2Q 2016
Market value
Market value of equity investments 5,225 5,082 4,692 4,317 4,275
Market value of fixed-income investments 2,597 2,592 2,577 2,584 2,681
Market value of real estate investments1 199 194 242 218 221
Market value of fund2 8,020 7,867 7,510 7,118 7,177
Accrued, not paid, management fees2 -2 -1 -4 -3 -2
Owner's capital2 8,018 7,866 7,507 7,116 7,175
Inflow/withdrawal of capital3 -16 -20 -27 -30 -24
Paid management fees3 0 -4 0 0 0
Return on fund 202 297 198 240 94
Changes due to fluctuations in krone -32 83 221 -269 28
Total change in market value 153 357 392 -58 98
Changes in value since first capital inflow in 1996
Total inflow of capital4 3,360 3,375 3,397 3,423 3,452
Return on fund 3,622 3,420 3,123 2,925 2,685
Management fees5 -37 -36 -35 -34 -33
Changes due to fluctuations in krone 1,076 1,108 1,025 804 1,073
Market value of fund 8,020 7,867 7,510 7,118 7,177
Return after management costs 3,585 3,384 3,088 2,891 2,652
1 Includes exclusively unlisted real estate investments from 2017.2 The fund’s market value shown in this table does not take into account the management fee. Owner’s capital in the financial
statements equals the fund’s market value less accrued, not paid, management fees.3 Paid management fees are specified separately, and not included in Inflow/withdrawal of capital.4 Total inflow of capital shown in this table is adjusted for accrued, not paid, management fees.5 Management costs in subsidiaries, see Table 9.2 in the financial reporting section, are not included in the management fees.
Management costs in subsidiaries have been deducted from the fund’s return before management fees.
20
Key figures and financial reporting | 2Q 2017 | Government Pension Fund Global

Financial statements
Income statement _______________________ 22
Balance sheet ____________________________ 23
Statement of cash flows __________________24
Statement of changes in owner’s capital __ 25
Notes
Note 1 General information ___________ 26
Note 2 Accounting policies ____________ 27
Note 3 Returns per asset class _________28
Note 4 Income/expense from Equities and units, Bonds and Financial derivatives _______ 29
Note 5 Holdings of Equities and units, Bonds and Financial derivatives _____________________30
Note 6 Unlisted real estate ____________ 31
Note 7 Fair value measurement _______34
Note 8 Risk ___________________________ 39
Note 9 Management costs ____________45
Auditor
Auditor’s report __________________________47
Financial reporting
21
KEY FIGURES AND FINANCIAL REPORTING 3
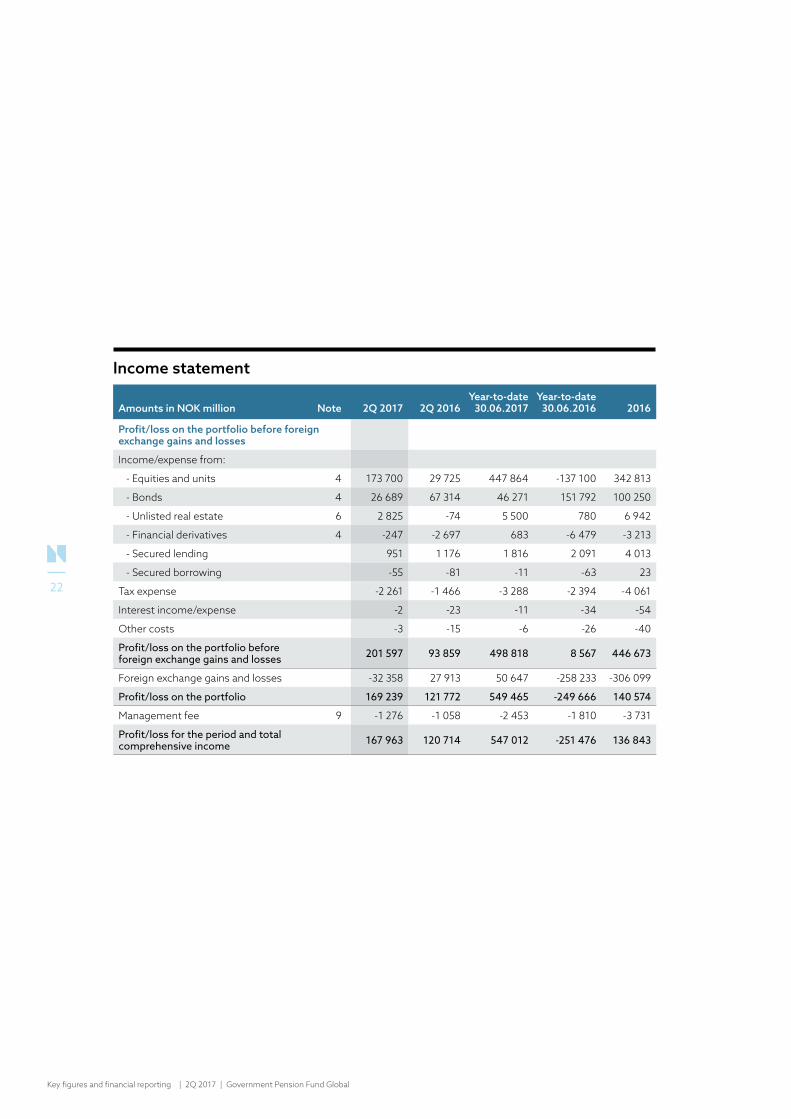
Income statement
Amounts in NOK million Note 2Q 2017 2Q 2016Year-to-date
30.06.2017Year-to-date
30.06.2016 2016
Profit/loss on the portfolio before foreign exchange gains and losses
Income/expense from:
- Equities and units 4 173 700 29 725 447 864 -137 100 342 813
- Bonds 4 26 689 67 314 46 271 151 792 100 250
- Unlisted real estate 6 2 825 -74 5 500 780 6 942
- Financial derivatives 4 -247 -2 697 683 -6 479 -3 213
- Secured lending 951 1 176 1 816 2 091 4 013
- Secured borrowing -55 -81 -11 -63 23
Tax expense -2 261 -1 466 -3 288 -2 394 -4 061
Interest income/expense -2 -23 -11 -34 -54
Other costs -3 -15 -6 -26 -40
Profit/loss on the portfolio before foreign exchange gains and losses 201 597 93 859 498 818 8 567 446 673
Foreign exchange gains and losses -32 358 27 913 50 647 -258 233 -306 099
Profit/loss on the portfolio 169 239 121 772 549 465 -249 666 140 574
Management fee 9 -1 276 -1 058 -2 453 -1 810 -3 731
Profit/loss for the period and total comprehensive income 167 963 120 714 547 012 -251 476 136 843
22
Key figures and financial reporting | 2Q 2017 | Government Pension Fund Global

Balance sheet
Amounts in NOK million Note 30.06.2017 31.12.2016
ASSETS
Deposits in banks 16 273 17 759
Secured lending 152 532 134 338
Cash collateral posted 1 604 2 320
Unsettled trades 60 791 13 196
Equities and units 5 4 832 476 4 373 042
Equities lent 5 372 621 340 865
Bonds 5 2 241 326 2 220 286
Bonds lent 5 467 431 454 735
Unlisted real estate 6 197 784 188 469
Financial derivatives 5 8 636 9 366
Other assets 4 017 1 966
TOTAL ASSETS 8 355 491 7 756 342
LIABILITIES AND OWNER'S CAPITAL
Liabilities
Secured borrowing 250 321 213 520
Cash collateral received 3 411 3 688
Unsettled trades 78 427 22 195
Financial derivatives 5 2 839 4 501
Other liabilities 265 1 944
Management fee payable 9 2 453 3 731
Total liabilities 337 716 249 579
Owner's capital 8 017 775 7 506 763
TOTAL LIABILITIES AND OWNER'S CAPITAL 8 355 491 7 756 342
23
KEY FIGURES AND FINANCIAL REPORTING 3

Statement of cash flows
Amounts in NOK million, receipt (+) / payment (-)Year-to-date
30.06.2017Year-to-date
30.06.2016 2016
Operating activities
Receipts of dividend from equities and units 75 091 71 456 118 517
Receipts of interest from bonds 38 471 37 582 74 832
Receipts of interest and dividend from unlisted real estate subsidiaries 1 758 1 898 3 657
Net receipts of interest and fee from secured lending and borrowing 1 635 1 828 4 097
Receipts of interest, dividend and fee from holdings of equities and units, bonds and unlisted real estate 116 955 112 764 201 103
Net cash flow from purchase and sale of equities and units -91 488 -59 217 -72 588
Net cash flow from purchase and sale of bonds 9 767 -19 366 -38 151
Net cash flow to/from investments in unlisted real estate subsidiaries -4 383 -1 379 -17 269
Net cash flow financial derivatives -3 047 -1 891 84
Net cash flow cash collateral related to derivative transactions 225 -7 086 983
Net cash flow secured lending and borrowing 17 927 39 049 50 236
Net payment of taxes -5 486 -4 052 -3 116
Net cash flow related to interest on deposits in banks and bank overdraft -73 6 -
Net cash flow related to other expenses, other assets and other liabilities -1 490 1 482 -430
Management fee paid to Norges Bank1 -3 731 -3 933 -3 933
Net cash inflow/outflow from operating activities 35 176 56 377 116 919
Financing activities
Inflow from the Norwegian government2 - - -
Withdrawal by the Norwegian government2 -36 185 -44 552 -100 616
Net cash inflow/outflow from financing activities -36 185 -44 552 -100 616
Net change in cash
Deposits in banks at 1 January 17 759 2 543 2 543
Net increase/decrease of cash in the period -1 009 11 825 16 303
Net foreign exchange gains and losses on cash -477 -1 239 -1 087
Deposits in banks at end of period 16 273 13 129 17 7591 Management fee shown in the Statement of cash flows for a period is the settlement of the fee that was accrued and
expensed in the previous year.2 Inflows/withdrawals included here only represent transfers that have been settled in the period (cash principle). Inflows/
withdrawals in the Statement of changes in owner’s capital are based on accrued inflows/withdrawals.
24
Key figures and financial reporting | 2Q 2017 | Government Pension Fund Global

Statement of changes in owner’s capital
Amounts in NOK millionInflows from
ownerRetained earnings
Total owner's capital1
1 January 2016 3 494 640 3 976 580 7 471 220
Total comprehensive income - -251 476 -251 476
Net inflow/withdrawal during the period1 -44 800 - -44 800
30 June 2016 3 449 840 3 725 104 7 174 944
1 July 2016 3 449 840 3 725 104 7 174 944
Total comprehensive income - 388 319 388 319
Net inflow/withdrawal during the period -56 500 - -56 500
31 December 2016 3 393 340 4 113 423 7 506 763
1 January 2017 3 393 340 4 113 423 7 506 763
Total comprehensive income - 547 012 547 012
Net inflow/withdrawal during the period1 -36 000 - -36 000
30 June 2017 3 357 340 4 660 435 8 017 7751 In the first two quarters of 2017 there was a withdrawal from the krone account of NOK 39.7 billion. Of this, NOK 3.7 billion
was used to pay the accrued management fee for 2016. In the first two quarters of 2016, there was a withdrawal from the krone account of NOK 48.7 billion. Of this, NOK 3.9 billion was used to pay the accrued management fee for 2015.
25
KEY FIGURES AND FINANCIAL REPORTING 3

Note 1 General information
1. INTRODUCTIONNorges Bank is Norway’s central bank. The bank manages Norway’s foreign exchange reserves and the Government Pension Fund Global (GPFG).
The GPFG shall support saving to finance future government expenditure and underpin long-term considerations relating to the use of Norway’s petroleum revenues. The Norwegian Parliament has established the legal framework in the Government Pension Fund Act, and the Ministry of Finance has formal responsibility for the fund’s management. The GPFG is managed by Norges Bank on behalf of the Ministry of Finance, in accordance with section 2, second paragraph of the Government Pension Fund Act and the management mandate for the GPFG issued by the Ministry of Finance. The Executive Board of Norges Bank has delegated day-to-day management of the GPFG to the Bank’s asset management area, Norges Bank Investment Management (NBIM).
The Ministry of Finance has placed funds for investment in the GPFG in the form of a
Norwegian krone deposit with Norges Bank (the krone account). Norges Bank manages the krone account in its own name by investing the funds in an investment portfolio consisting of equities, fixed-income securities and real estate. The GPFG is invested in its entirety outside of Norway.
In accordance with the management mandate for the GPFG, transfers are made to and from the krone account. When the Norwegian State’s petroleum revenue exceeds the use of petroleum revenue in the fiscal budget, deposits will be made into the krone account. In the opposite situation, withdrawals will be made. Transfers to and from the krone account lead to a corresponding change in Owner’s Capital.
2. APPROVAL OF THE QUARTERLY FINANCIAL STATEMENTS The quarterly financial statements of Norges Bank for the second quarter of 2017, which only encompass the financial reporting for the GPFG, were approved by the Executive Board on 16 August 2017.
Notes to thefinancial reporting
26
Key figures and financial reporting | 2Q 2017 | Government Pension Fund Global

Note 2 Accounting policies
1. BASIS OF PREPARATIONThe regulation concerning the annual financial reporting for Norges Bank, which has been laid down by the Ministry of Finance, requires that Norges Bank’s financial statements shall include the financial reporting for the GPFG, and that these shall be prepared in accordance with International Financial Reporting Standards (IFRS) as adopted by the EU.
Norges Bank prepares quarterly financial statements for the GPFG, with closing dates of 31 March, 30 June and 30 September. The quarterly financial statements are prepared in accordance with IAS 34 Interim Financial Reporting.
The quarterly financial statements are prepared using the same accounting policies and calculation methods as used for 2016. Accounting policies are described in the annual report 2016, and the quarterly financial statements should therefore be read in conjunction with this. No new or amended standards with a significant impact on the financial reporting have been implemented in the first half of 2017.
2. SIGNIFICANT ESTIMATES AND ACCOUNTING JUDGEMENTSThe preparation of the financial statements involves the use of estimates and judgements that may affect assets, liabilities, income and expenses. Estimates and judgements are based on historical experience and expectations about future events that are considered probable at the time the financial statements are presented. Estimates are based on best judgement. However, actual results may deviate from estimates.
In cases where there are particularly uncertain estimates, this is described in the respective notes. For additional information on significant estimates and critical accounting judgements, see the relevant notes in the annual report 2016.
27
KEY FIGURES AND FINANCIAL REPORTING 3

Note 3 Returns per asset class
Table 3.1 Returns per asset class
2Q 2017 1Q 2017 4Q 2016 3Q 2016 2Q 2016Year-to-date
30.06.2017
Returns in the fund's currency basket
Return on equity investments (percent) 3.37 5.53 4.91 6.03 0.66 9.09
Return on fixed-income investments (percent) 1.12 0.77 -2.35 0.89 2.49 1.90
Return on real estate investments1 (percent) 2.05 0.62 1.25 2.29 -1.42 2.69
Return on fund (percent) 2.60 3.78 2.17 4.00 1.27 6.48
Relative return on fund2 (percentage points) 0.28 0.09 0.28 0.17 -0.11 0.38
Returns in Norwegian kroner (percent)
Return on equity investments 2.92 6.85 8.74 1.54 1.11 9.97
Return on fixed-income investments 0.68 2.03 1.21 -3.39 2.95 2.73
Return on real estate investments1 1.61 1.88 4.95 -2.04 -0.98 3.52
Return on fund 2.15 5.08 5.90 -0.41 1.72 7.341 Return on real estate investments includes exclusively unlisted real estate investments from 2017.2 Relative return on fund includes real estate investments from 01.01.2017. Relative return on fund prior to 2017 is calculated
on the aggregated equity and fixed-income investments.
For additional information on the method used in the return calculation, see note 3 Returns per asset class in the annual report 2016.
28
Key figures and financial reporting | 2Q 2017 | Government Pension Fund Global

Note 4 Income/expense from Equities and units, Bonds and Financial derivatives
Tables 4.1 to 4.3 specify the income and expense elements for Equities and units, Bonds and Financial derivatives, where the line
Income/expense shows the amount recognised in profit and loss for the respective income statement line.
Table 4.1 Specification Income/expense from equities and units
Amounts in NOK million 2Q 2017 2Q 2016Year-to-date
30.06.2017Year-to-date
30.06.2016 2016
Dividends 49 774 46 712 78 484 74 079 118 584
Realised gain/loss 77 386 24 118 146 127 33 031 107 005
Unrealised gain/loss 46 540 -41 105 223 253 -244 210 117 224
Income/expense from equities and units before foreign exchange gain/loss
173 700 29 725 447 864 -137 100 342 813
Table 4.2 Specification Income/expense from bonds
Amounts in NOK million 2Q 2017 2Q 2016Year-to-date
30.06.2017Year-to-date
30.06.2016 2016
Interest 18 287 18 584 36 631 35 582 72 573
Realised gain/loss 3 375 9 419 3 624 16 174 30 861
Unrealised gain/loss 5 027 39 311 6 016 100 036 -3 184
Income/expense from bonds before foreign exchange gain/loss
26 689 67 314 46 271 151 792 100 250
Table 4.3 Specification Income/expense from financial derivatives
Amounts in NOK million 2Q 2017 2Q 2016Year-to-date
30.06.2017Year-to-date
30.06.2016 2016
Dividends 52 61 72 63 102
Interest -51 -345 -1 396 -364 -2 113
Realised gain/loss 191 -198 168 -1 261 -3 251
Unrealised gain/loss -439 -2 215 1 839 -4 917 2 049
Income/expense from financial derivatives before foreign exchange gain/loss
-247 -2 697 683 -6 479 -3 213
29
KEY FIGURES AND FINANCIAL REPORTING 3

Note 5 Holdings of Equities and units, Bonds and Financial derivatives
Table 5.1 Equities and units
30.06.2017 31.12.2016
Amounts in NOK millionFair value including
dividendsAccrued
dividendsFair value including
dividendsAccrued
dividends
Equities and units 5 205 097 8 951 4 713 907 5 557
Total equities and units 5 205 097 8 951 4 713 907 5 557
Of which equities lent 372 621 340 865
Table 5.2 Bonds
30.06.2017 31.12.2016
Amounts in NOK millionNominal
value
Fair value including
accrued interest
Accrued interest
Nominal value
Fair value including
accrued interest
Accrued interest
Government bonds 1 280 403 1 450 608 10 773 1 290 977 1 461 360 11 356
Government-related bonds 328 221 341 118 2 122 319 602 334 137 2 390
Inflation-linked bonds 111 454 130 875 426 114 916 140 814 547
Corporate bonds 624 000 647 143 5 772 573 749 591 146 5 992
Securitised bonds 145 470 139 013 830 141 566 147 564 1 478
Total bonds 2 489 548 2 708 757 19 923 2 440 810 2 675 021 21 763
Of which bonds lent 467 431 454 735
Table 5.3 Financial derivatives
30.06.2017 31.12.2016
Amounts in NOK millionNotional amount
Fair valueNotional amount
Fair value
Asset Liability Asset Liability
Foreign exchange derivatives 231 632 1 464 1 457 321 580 4 586 1 995
Interest rate derivatives 35 381 932 1 382 31 284 528 2 506
Equity derivatives 6 611 6 240 - 6 645 4 252 -
Total financial derivatives 273 624 8 636 2 839 359 509 9 366 4 501
30
Key figures and financial reporting | 2Q 2017 | Government Pension Fund Global

Note 6 Unlisted real estate
Investments in unlisted real estate are made through subsidiaries of Norges Bank, which exclusively constitute investments as part of the management of the GPFG. Subsidiaries presented in the balance sheet as Unlisted real estate are designated upon initial recognition as financial instruments at fair value through profit or loss. Changes in fair value are recognised in the income statement and are presented as Income/expense from unlisted real estate.
The fair value of unlisted real estate is determined as the sum of the GPFG’s share of the assets and liabilities in the underlying
subsidiaries, measured at fair value. For further information on fair value measurement of unlisted real estate investments, see note 7 Fair value measurement.
Subsidiaries are financed through equity and long-term debt. Income generated in the real estate subsidiaries may be distributed to the GPFG in the form of interest and dividends as well as repayment of equity and loan financing provided from the GPFG to the subsidiary. There are no significant restrictions on distribution of dividends and interest from the subsidiaries to the GPFG.
Table 6.1 provides a specification of the income statement line Income/Expense from unlisted real estate, before foreign exchange gains and losses.
Table 6.1 Income/expense from unlisted real estate
Amounts in NOK million 2Q 2017 2Q 2016Year-to-date
30.06.2017Year-to-date
30.06.2016 2016
Dividends received 566 714 953 1 247 2 167
Interest received 445 478 805 651 1 490
Unrealised gain/loss 1 814 -1 266 3 742 -1 118 3 285
Income/expense from unlisted real estate before foreign exchange gain/loss 2 825 -74 5 500 780 6 942
31
KEY FIGURES AND FINANCIAL REPORTING 3

UNDERLYING REAL ESTATE COMPANIESReal estate subsidiaries have investments in other non-consolidated, unlisted companies. These companies in turn invest in real estate assets, primarily properties.
In the tables below, a further specification of Unlisted real estate is provided. Table 6.3 specifies the GPFG’s share of the net income generated in the underlying real estate companies, which is the basis for Income/expense from unlisted real estate presented in
table 6.1. Table 6.4 specifies the GPFG’s share of assets and liabilities in the underlying real estate companies which comprise the closing balance for Unlisted real estate as presented in table 6.2.
The change in the period for the balance sheet line Unlisted real estate is specified in table 6.2.
Table 6.2 Changes in carrying amounts unlisted real estate
Amounts in NOK million 30.06.2017 31.12.2016
Unlisted real estate, opening balance for the period 188 469 180 021
Payments to new investments1 2 959 19 147
Payments to existing investments1 2 341 2 808
Payments from existing investments1 -917 -4 686
Unrealised gain/loss 3 742 3 285
Foreign currency translation effect 1 190 -12 106
Unlisted real estate, closing balance for the period 197 784 188 4691 This represents the net cash flows between the GPFG and subsidiaries presented as Unlisted real estate. The GPFG makes
cash contributions to the subsidiaries in the form of equity and long-term loan financing to fund investments in real estate assets, primarily properties. Net income generated in the subsidiaries may be distributed to the GPFG in the form of repayment of equity and long-term loan financing.
32
Key figures and financial reporting | 2Q 2017 | Government Pension Fund Global

Table 6.3 Income from underlying real estate companies
Amounts in NOK million 2Q 2017 2Q 2016Year-to-date
30.06.2017Year-to-date
30.06.2016 2016
Net rental income1 2 121 1 907 4 134 3 829 7 645
Realised gain/loss 7 31 15 53 109
Fair value changes – properties2 1 233 -1 440 2 555 -1 590 1 416
Fair value changes – debt2 -32 -179 -220 -511 -191
Transaction costs -31 -13 -47 -32 -411
Interest expense external debt -146 -163 -307 -335 -622
Tax expense payable -53 -22 -65 -50 -151
Change in deferred tax -100 -56 -157 -140 -174
Asset management – fixed fees3 -122 -151 -249 -254 -454
Asset management – variable fees3 -6 64 -76 -85 -39
Operating costs within the limit from the Ministry of Finance4 -22 -20 -38 -40 -81
Other costs -24 -32 -45 -65 -105
Net income underlying real estate companies 2 825 -74 5 500 780 6 9421 Net rental income mainly comprises received and earned rental income, less costs relating to the operation and
maintenance of properties. 2 Comprises solely fair value changes of properties and debt and will therefore not reconcile with unrealised gain/loss
presented in table 6.1 which includes undistributed profits.3 Fixed and variable asset management fees are directly related to the underlying properties and are primarily linked to
the operation and development of properties and leases. Variable fees to external managers are based on achieved performance over time.
4 See table 9.2 for specification of the operating costs that are measured against the management fee limit from the Ministry of Finance.
Table 6.4 Assets and liabilities underlying real estate companies
Amounts in NOK million 30.06.2017 31.12.2016
Deposits in banks 2 527 2 272
Properties 210 731 204 635
External debt -14 103 -15 727
Tax payable -82 -204
Net deferred tax -1 363 -1 153
Net other assets and liabilities 74 -1 354
Total assets and liabilities underlying real estate companies 197 784 188 469
33
KEY FIGURES AND FINANCIAL REPORTING 3

SIGNIFICANT ESTIMATELevel 3 investments consist of instruments held at fair value that are not traded or quoted in active markets. Fair value is determined using valuation techniques that use models with unobservable inputs. This implies substantial uncertainty regarding the establishment of fair value.
Note 7 Fair value measurement
1. INTRODUCTIONThe fair value of the majority of assets and liabilities is based on official closing prices or observable market quotes. If the market for a security or an asset is not active, fair value is established by using standard valuation techniques.
All assets and liabilities measured at fair value are categorised in the three categories in the
fair value hierarchy presented in table 7.1. The level of valuation uncertainty determines the categorisation.
For an overview of valuation techniques and models, together with definitions and appli cation of the categories of valuation uncertainty, see note 7 Fair value measurement in the annual report 2016.
34
Key figures and financial reporting | 2Q 2017 | Government Pension Fund Global

2. FAIR VALUE HIERARCHY
Table 7.1 Investments by level of valuation uncertainty
Amounts in NOK million
Level 1 Level 2 Level 3 Total
30.06.2017 31.12.2016 30.06.2017 31.12.2016 30.06.2017 31.12.2016 30.06.2017 31.12.2016
Equities and units 5 162 133 4 673 199 32 258 28 845 10 706 11 863 5 205 097 4 713 907
Government bonds 1 388 559 1 369 188 62 049 92 172 - - 1 450 608 1 461 360
Government-related bonds 291 498 279 772 48 451 53 463 1 169 902 341 118 334 137
Inflation-linked bonds 121 847 124 646 9 028 16 168 - - 130 875 140 814
Corporate bonds 616 298 538 692 30 582 52 293 263 161 647 143 591 146
Securitised bonds 130 352 136 088 8 498 11 149 163 327 139 013 147 564
Total bonds 2 548 554 2 448 386 158 608 225 245 1 595 1 390 2 708 757 2 675 021
Financial derivatives (assets) 117 291 8 519 9 075 - - 8 636 9 366
Financial derivatives (liabilities) - - -2 839 -4 501 - - -2 839 -4 501
Total financial derivatives 117 291 5 680 4 574 - - 5 797 4 865
Unlisted real estate - - - - 197 784 188 469 197 784 188 469
Other1 - - -97 207 -71 768 - - -97 207 -71 768
Total 7 710 804 7 121 876 99 339 186 896 210 085 201 722 8 020 228 7 510 494
Total (percent) 96.1 94.8 1.2 2.5 2.6 2.7 100.0 100.0 1 Other consists of non-investment assets and liabilities limited to money-market instruments such as secured lending and borrowing
positions, deposits in banks, unsettled trades, posted and received cash collateral and other assets and liabilities.
Valuation uncertainty for the GPFG as a whole at the end of the second quarter of 2017 is virtually unchanged compared to the end of 2016. The majority of the total portfolio has low valuation uncertainty. At the end of the second quarter, 97.3 percent was classified as Level 1 or 2. Movements between levels in the fair value hierarchy are described in section 3 of this note.
Equities and units Measured as a share of total value, virtually all equities and units (99.2 percent) are valued based on official closing prices from stock exchanges and are classified as Level 1. A few equities and units (0.6 percent) are valued based on other observable inputs than quoted prices included in Level 1 and are classified as Level 2. These include equities for which trading has recently been suspended or illiquid securities that are not traded daily. Some holdings (0.2 percent), for example equities that are not
35
KEY FIGURES AND FINANCIAL REPORTING 3

listed, are illiquid due to lock-in periods, or where trading has been suspended over a prolonged period, are measured at fair value with considerable use of non-observable market inputs. These holdings have high uncertainty related to fair value and are classified as Level 3.
BondsThe majority of bonds (94.1 percent) have observable, executable market quotes and are classified as Level 1. A minority of bonds (5.8 percent) are classified as Level 2. These are valued using observable market inputs such as quoted prices in markets that are not considered active, or priced based on comparable but liquid bonds. A few bonds (0.1 percent) that do not have observable quotes are classified as Level 3.
Unlisted real estateAll unlisted real estate investments are classified as Level 3, since models are used to value the underlying assets and liabilities with extensive use of non-observable market inputs. All properties are measured at the value determined by external valuers. Exceptions to this policy are cases of newly acquired properties where the purchase price, excluding transaction costs, is normally considered to be the best estimate of fair value, or where there
are indications that external valuation reports do not reflect fair value so that adjustments to valuations are warranted.
3. MOVEMENTS BETWEEN LEVELS OF VALUATION UNCERTAINTY Reclassifications between Level 1 and Level 2The relative share of equities classified as Level 1 or 2 has essentially remained unchanged during the quarter and compared to year-end 2016.
There has been a decrease in valuation uncertainty for bonds in the first half of 2017. The year-to-date decrease is due to the majority of new purchases in the second quarter being within Level 1, and further that a significant share of Level 2 securities have matured or been sold. In the first quarter, there was a decrease in valuation uncertainty as certain US corporate bonds were reclassified from Level 2 to Level 1 due to a sufficient amount of observable quotes being available at the end of the quarter. This confirms a pattern previously observed, where some bonds tend to have less liquidity at year-end compared to other quarters.
36
Key figures and financial reporting | 2Q 2017 | Government Pension Fund Global

The relative amount of holdings classified as Level 3 is virtually unchanged from year-end 2016. In absolute terms, Level 3 equity holdings have decreased by NOK 1.2 billion. This is mainly due to the sale of some equities previously classified as Level 3. The value of
bonds classified as Level 3 has increased by NOK 205 million, mainly due to two corporate bonds denominated in US dollar that have been reclassified to Level 3 as there was no observable market data for these two bonds.
Table 7.2 Changes in Level 3 holdings
Amounts in NOK million 01.01.2017 Pur chases Sales
Settle-ments
Net gain/
loss
Trans-ferred into
Level 3
Trans-ferred out of Level 3
Foreign exchange gains
and losses 30.06.2017
Equities and units 11 863 13 -1 508 -199 -92 289 -165 505 10 706
Bonds 1 390 - - -193 -7 436 - -31 1 595
Unlisted real estate1 188 469 4 383 - - 3 742 - - 1 190 197 784
Total 201 722 4 396 -1 508 -392 3 643 725 -165 1 664 210 085
Amounts in NOK million 01.01.2016 Pur chases Sales
Settle-ments
Net gain/
loss
Trans-ferred into
Level 3
Trans-ferred out of Level 3
Foreign exchange gains
and losses 31.12.2016
Equities and units 3 607 9 956 -455 -41 -533 257 -842 -86 11 863
Bonds 2 731 - -1 011 -163 -33 6 -91 -49 1 390
Unlisted real estate1 180 021 17 269 - - 3 285 - - -12 106 188 469
Total 186 359 27 225 -1 466 -204 2 719 263 -933 -12 241 201 7221 Purchases represent the net cash flow in the period from the GPFG to subsidiaries presented as Unlisted real estate.
37
KEY FIGURES AND FINANCIAL REPORTING 3

4. SENSITIVITY ANALYSIS FOR LEVEL 3 HOLDINGS
Table 7.3 Additional specification Level 3 and sensitivities
Amounts in NOK million
Specification of Level 3 holdings
30.06.2017
Sensitivities 30.06.2017
Specification of Level 3 holdings
31.12.2016
Sensitivities 31.12.2016
Unfavour-able
changes
Favour-able
changes
Unfavour-able
changes
Favour-able
changes
Equities and units 10 706 -2 222 2 222 11 863 -2 638 2 606
Government-related bonds 1 169 -117 117 902 -90 90
Corporate bonds 263 -26 26 161 -16 16
Securitised bonds 163 -16 16 327 -33 33
Total bonds 1 595 -159 159 1 390 -139 139
Unlisted real estate 197 784 -9 537 10 708 188 469 -9 678 10 711
Total 210 085 -11 918 13 089 201 722 -12 455 13 456
There is uncertainty associated with the fair value of holdings classified as Level 3 due to the use of unobservable inputs in the valuation. In the sensitivity analysis presented in table 7.3, reasonably possible alternative assumptions for the key unobservable inputs have been applied. The alternative fair value estimates, given for a favourable and unfavourable outcome, illustrate the sensitivity of the fair value estimates to changes in the key unobservable inputs.
Real estate values are particularly sensitive to changes in yields and assumptions influencing future revenues. In an unfavourable outcome, it is calculated that an increase in the yield of 0.2 percentage points, and a reduction in future market rents of 2 percent will result in a decrease in value of the real estate portfolio of
approximately 4.8 percent or NOK 9 537 million. In a favourable outcome, a decrease in the yield of 0.2 percentage points and an increase in future market rents of 2 percent will increase the value of the real estate portfolio by 5.4 percent or NOK 10 708 million.
The sensitivity for bonds classified as Level 3 is essentially unchanged compared to year-end, however in absolute terms the sensitivity is higher due to the increased holdings of bonds classified as Level 3. The sensitivity for equities classified as Level 3 is slightly reduced mainly due to reduced holdings of equities classified as Level 3.
38
Key figures and financial reporting | 2Q 2017 | Government Pension Fund Global

Note 8 RISK
MARKET RISKMarket risk is the risk of changes in the value of the portfolio due to movements in equity prices, interest rates, real estate values, exchange rates and credit spreads. Norges Bank Investment Management measures market risk both for the actual portfolio and the relative market risk for the holdings in the GPFG.
Asset class per country and currencyThe portfolio is invested across several asset classes, countries and currencies as shown in table 8.1.
39
KEY FIGURES AND FINANCIAL REPORTING 3

Table 8.1 Allocation by asset class, country and currency
Market value in percent by country and currency1
Market value in percent by asset class
Assets minus liabilities excluding management fee
Asset class Market 30.06.2017 Market 31.12.2016 30.06.2017 31.12.2016 30.06.2017 31.12.2016
Equities Developed 90.0 Developed 90.5
US 36.3 US 37.6
UK 9.7 UK 9.8
Japan 9.0 Japan 9.0
Germany 5.6 Germany 5.4
France 5.3 France 5.2
Total other 24.1 Total other 23.5
Emerging 10.0 Emerging 9.5
China 2.9 China 2.7
Taiwan 1.7 Taiwan 1.5
India 1.1 India 1.0
Brazil 0.7 Brazil 0.8
South Africa 0.6 South Africa 0.6
Total other 3.0 Total other 2.9
Total equities 65.14 62.47 5 224 545 4 691 863
Fixed income Developed 87.7 Developed 87.6
US Dollar 43.0 US Dollar 43.7
Euro 26.4 Euro 25.3
Japanese Yen 6.1 Japanese Yen 5.9
British Pound 4.0 British Pound 4.6
Canadian Dollar 3.1 Canadian Dollar 3.0
Total other 5.1 Total other 5.1
Emerging 12.3 Emerging 12.4
Mexican Peso 2.3 Mexican Peso 1.9
South Korean Won 1.8 South Korean
Won 1.7
Polish Zloty 1.0 Indian Rupee 0.9
Indian Rupee 0.9 Polish Zloty 0.8
Indonesian Rupiah 0.9 Brazilian Real 0.8
Total other 5.4 Total other 6.3
Total fixed income 32.38 34.31 2 596 976 2 576 875
Unlisted real estate US 49.1 US 46.0
UK 22.9 UK 23.0
France 15.2 France 14.6
Switzerland 4.5 Germany 7.6
Germany 3.5 Switzerland 3.6
Total other 4.8 Total other 5.2
Total unlisted real estate2 2.48 3.22 198 707 241 7561 Market value in percent by country and currency includes derivatives and cash.2 Listed real estate investments are presented as Equities from 01.01.2017. These were previously included in the asset class Real estate.
Comparatives have not been restated.
40
Key figures and financial reporting | 2Q 2017 | Government Pension Fund Global

At the end of the second quarter, the share of equities in the fund was 65.1 percent. This is an increase from 62.5 percent at year-end 2016. The bond portfolio’s share of the fund decreased to 32.4 percent in the second quarter, from 34.3 percent at year-end. The year-to-date change in asset class allocation is mainly due to stronger returns for equities than bonds, as well as the transfer of listed real estate to the equity portfolio at the start of the year, following a change in the investment mandate issued by the Ministry of Finance. Emerging equity markets have had a stronger year-to-date return than developed equity markets. This has led to an increase in the share of equities invested in emerging markets.
VolatilityRisk models are used to quantify the risk of changes in values associated with all or parts of the portfolio. One of the risk measures is expected volatility. Tables 8.2 and 8.3 present risk both in terms of the portfolio’s absolute risk and in terms of the relative risk.
The mandate set by the Ministry of Finance was changed with effect from 1 January 2017. All the fund’s investments, including unlisted real estate, are now included in the calculation of expected relative volatility, and measured against the fund’s benchmark index, which comprises global equity and bond indices. The limit for expected relative volatility for the fund, now including unlisted real estate, is still 1.25 percentage points.
MSCI’s Barra Private Real Estate 2 (PRE2) model is used to calculate risk for the fund’s unlisted real estate investments. The model consolidates information from global listed and unlisted real estate markets to compose a risk profile for unlisted real estate investments, based on location and type of real estate.
The overall method applied in the calculations of expected absolute and relative volatility is explained in note 8 Risk in the annual report 2016. This method is also applied to investments in unlisted real estate.
Table 8.2 Portfolio, expected volatility, in percent
Expected volatility, actual portfolio
30.06.2017 Min 2017 Max 2017Average
2017 31.12.2016 Min 2016 Max 2016Average
2016
Portfolio 11.0 10.7 11.1 10.9 10.6 10.2 10.7 10.5
Equities 14.1 13.9 14.1 14.0 14.0 12.9 14.1 13.7
Fixed income 9.7 9.6 9.8 9.7 9.7 9.6 10.3 10.0
Unlisted real estate1 12.5 12.3 12.7 12.61 The risk for the fund’s unlisted real estate investments has been calculated separately from 2017.
41
KEY FIGURES AND FINANCIAL REPORTING 3

Risk measured in terms of expected volatility shows an expected annual change in value in the fund of 11.0 percent, or approximately NOK 880 billion at the end of the second quarter, compared to 10.6 percent at year-end 2016. The year-to-date increase in expected volatility is mainly due to an increased weight of equities in the portfolio. Expected volatility for the equity portfolio has increased by 0.1 percentage point since the end of 2016, to 14.1 percent at the end of the second quarter, while expected volatility for the bond portfolio is unchanged so far this year at 9.7 percent.
The fund’s expected relative volatility, including unlisted real estate, was 33 basis points at the end of the second quarter, compared to 34 basis points at year-end 2016.
Expected shortfall is a tail risk measure that measures the expected loss in extreme market situations. The expected shortfall measure provides an estimate of the annualised expected loss for a given confidence level. By means of historical simulations, relative returns
of the current portfolio and benchmark are calculated on a weekly basis over the last ten years. The average relative return measured in the currency basket for the 2.5 percent worst weeks is then annualised, giving the expected shortfall measured at a 97.5 percent confidence level.
With effect from 1 January 2017, investments in unlisted real estate are also included in the calculation of expected shortfall for the fund. The Executive Board has determined that the annual expected shortfall shall not exceed 3.75 percentage points. At the end of the second quarter, the measure was 1.44 percentage points.
CREDIT RISKCredit risk is the risk of losses from issuers of fixed-income instruments defaulting on their payment obligations. Credit risk in the bond portfolio is monitored, among other things, through the use of credit ratings. Table 8.4 shows the distribution of the bond portfolio across different credit rating categories.
Table 8.3 Relative risk measured against the benchmark indices of the fund and asset classes, expected relative volatility, in basis points
Expected relative volatility
30.06.2017 Min 2017 Max 2017Average
2017 31.12.2016 Min 2016 Max 2016Average
2016
Portfolio1 33 31 35 32 34 - - -
Equity and fixed-income portfolio1 - - - - 28 26 29 28
Equities 41 36 43 38 37 34 38 36
Fixed income 45 41 49 44 44 41 55 51
1 In the new investment management mandate, effective from 2017, real estate is included in the framework for relative volatility. Prior to 2017, the framework in the investment management mandate was based on the aggregated equity- and fixed-income portfolio.
42
Key figures and financial reporting | 2Q 2017 | Government Pension Fund Global

Table 8.4 Bond portfolio specified by credit rating
Amounts in NOK million, 30.06.2017 AAA AA A BBB
Lower rating Total
Government bonds 696 977 216 776 313 927 182 529 40 399 1 450 608
Government-related bonds 149 458 132 292 43 942 13 545 1 881 341 118
Inflation-linked bonds 105 720 10 662 2 910 8 915 2 668 130 875
Corporate bonds 5 809 67 935 236 246 327 821 9 332 647 143
Securitised bonds 121 725 13 374 2 368 1 546 - 139 013
Total bonds 1 079 689 441 039 599 393 534 356 54 280 2 708 757
Amounts in NOK million, 31.12.2016 AAA AA A BBB
Lower rating Total
Government bonds 716 767 260 859 271 238 173 321 39 176 1 461 360
Government-related bonds 143 279 136 550 36 316 15 579 2 413 334 137
Inflation-linked bonds 109 025 9 493 3 662 12 459 6 175 140 814
Corporate bonds 5 290 59 469 219 333 297 198 9 856 591 146
Securitised bonds 126 001 16 054 2 010 3 499 - 147 564
Total bonds 1 100 361 482 424 532 559 502 058 57 620 2 675 021
The proportion of bond holdings categorised with a credit rating A increased to 22.1 percent at the end of the second quarter, compared to 19.9 percent at year-end 2016. The majority of the increase was in government bonds. Chinese government and government-related bonds were downgraded from AA- to A+ in the second quarter. This contributed to an increase in the A category and a decrease in the AA category. Bonds with AAA credit ratings were reduced to 39.9 percent of the portfolio at the end of the
second quarter, from 41.1 percent at year-end 2016, mainly as a result of a reduction in government bond holdings in this category. The overall credit quality of the bond portfolio has slightly declined since year-end.
COUNTERPARTY RISKCounterparty risk is the risk of loss due to counterparty bankruptcy or other events leading to counterparties defaulting.
43
KEY FIGURES AND FINANCIAL REPORTING 3

Counterparty risk measured as net risk exposure has increased slightly compared to year-end 2016. The net exposure was NOK 114.0 billion at the end of the second quarter, compared to NOK 113.1 billion kroner at year-end. Risk
exposure from OTC derivatives and participatory certificates has increased slightly since year-end, while risk exposure from most other instrument groups has been reduced.
Table 8.5 shows counterparty risk by type of position as at 30 June 2017, aggregated for the GPFG.
Table 8.5 Counterparty risk by type of position
Amounts in NOK million, 30.06.2017Gross
exposureEffect of
nettingCollateral and
guaranteesNet
exposure
Securities lending 63 448 - 815 62 633
Unsecured bank deposits1 18 810 - - 18 810
OTC derivatives including foreign exchange contracts 20 208 3 760 211 16 237
Cleared OTC and listed derivatives2 9 014 1 609 -425 7 830
Participatory certificates 6 037 - - 6 037
Repurchase and reverse repurchase agreements 2 321 509 -499 2 311
Settlement risk towards broker and long settlement transactions 170 - - 170
Total 120 008 5 878 102 114 028
Amounts in NOK million, 31.12.2016Gross
exposureEffect of
nettingCollateral and
guaranteesNet
exposure
Securities lending 64 908 - 868 64 040
Unsecured bank deposits1 20 570 - - 20 570
OTC derivatives including foreign exchange contracts 19 347 3 667 2 608 13 071
Cleared OTC and listed derivatives2 8 003 1 183 -1 685 8 505
Participatory certificates 3 934 - - 3 934
Repurchase and reverse repurchase agreements 3 523 492 149 2 882
Settlement risk towards broker and long settlement transactions 50 - - 50
Total 120 335 5 342 1 940 113 054 1 Includes bank deposits in non-consolidated real estate subsidiaries.2 Relates to futures trades and interest rate swaps cleared by a central clearing counterparty.
44
Key figures and financial reporting | 2Q 2017 | Government Pension Fund Global

Table 9.1 Management fee
Year-to-date Year-to-date 2016
Amounts in NOK million 2Q 2017 2Q 2016 30.06.2017Basis
points 30.06.2016Basis
pointsBasis
points
Salary, social security and other personnel related costs 291 287 624 556 1 177
Custody costs 98 93 197 184 379
IT services, systems, data and information 169 151 323 305 649
Research, consulting and legal fees 53 65 86 122 261
Other costs 53 60 117 117 244
Allocated costs Norges Bank 43 42 85 83 161
Base fees to external managers 221 191 430 361 638
Management fee excluding performance-based fees 928 889 1 862 4.8 1 728 4.8 3 509 4.9
Performance-based fees to external managers 348 169 591 82 222
Total management fee 1 276 1 058 2 453 6.4 1 810 5.1 3 731 5.2
Note 9 Management costs
The GPFG is managed by Norges Bank. Costs relating to the management of the fund are mainly incurred in Norges Bank. Management costs are also incurred in subsidiaries of Norges Bank exclusively established as part of the management of the GPFG’s investments in unlisted real estate.
MANAGEMENT COSTS IN NORGES BANKThe Ministry of Finance reimburses Norges Bank for costs incurred in connection with the management of the GPFG, in the form of a management fee. The management fee is equivalent to the actual costs incurred by Norges Bank, including performance-based fees to external managers, and is expensed in the income statement line Management fee. Costs included in the management fee are specified in table 9.1.
MANAGEMENT COSTS IN SUBSIDIARIESManagement costs incurred in subsidiaries consist of operating costs related to the management of the unlisted real estate portfolio. Management costs incurred in non-
consolidated and consolidated subsidiaries are presented in the income statement as Income/expense from unlisted real estate and Other costs, respectively. These costs are specified in table 9.2.
45
KEY FIGURES AND FINANCIAL REPORTING 3

Table 9.2 Management costs, real estate subsidiaries
Amounts in NOK million 2Q 2017 2Q 2016Year-to-date
30.06.2017Year-to-date
30.06.2016 2016
Salary, social security and other personnel related costs 6 6 12 11 27
IT services, systems, data and information 9 8 17 17 36
Research, consulting and legal fees 7 6 10 12 19
Other costs 4 5 8 9 18
Total management costs, real estate subsidiaries 26 25 47 49 100
Of which management costs non-consolidated subsidiaries 22 20 38 40 81
Of which management costs consolidated subsidiaries 4 5 9 9 19
In addition to the management costs presented in table 9.2, operating costs are also incurred in subsidiaries related to the ongoing maintenance, operation and development of properties and leases. These costs are not defined as manage-ment costs, since they are directly related to the underlying properties, and are not part of the management of the real estate portfolio. Other operating costs incurred in non-consolidated companies are expensed directly in the portfolio result and are presented in the income statement line Income/expense from unlisted real estate. See table 6.3 in note 6 Unlisted real estate for further information. Other operating costs incurred in consolidated subsidiaries are expensed in the income statement line Other costs.
UPPER LIMIT FOR REIMBURSEMENT OF MANAGEMENT COSTSThe Ministry of Finance has established an upper limit for the reimbursement of manage-ment costs. For 2017, the sum of total manage-ment costs incurred in Norges Bank and its subsidiaries, excluding performance-based fees to external managers, is limited to 7.5 basis
points of average assets under manage ment. In accordance with guidelines from the Ministry of Finance, the calculation of average assets under management is based on the market value of the portfolio in Norwegian kroner at the start of each month in the calendar year. Other operating costs incurred in subsidiaries, as well as costs incurred in partly-owned real estate entities, are not included in the costs that are measured against this limit. Year-to-date management costs that are measured against the limit amount to NOK 1 909 million at the end of the second quarter of 2017. This consists of management costs of NOK 1 862 million in Norges Bank, excluding performance-based fees to external managers, and management costs of NOK 47 million in subsidiaries. This corresponds to 4.9 basis points of assets under management on an annual basis.
Year-to-date management costs including performance-based fees amount to NOK 2 500 million. This corresponds to 6.5 basis points of assets under management on an annual basis.
46
Key figures and financial reporting | 2Q 2017 | Government Pension Fund Global

To the Supervisory Council of Norges Bank
Report on review of interim financial information
IntroductionWe have reviewed the financial reporting for the investment portfolio of the Government Pension Fund Global. Subsidiaries of Norges Bank that exclusively constitute investments as part of the management of the investment portfolio are included in the financial reporting. The financial reporting comprises the balance sheet as at 30 June 2017, the income statement, the statement of changes in owner’s capital, the statement of cash flows for the six-month period then ended and selected explanatory notes. The Executive Board and management are responsible for the preparation and presentation of this interim financial information in accordance with International Accounting Standard 34 “Interim Financial Reporting” as adopted by the EU. Our responsibility is to express a conclusion on this interim financial information based on our review.
Scope of reviewWe conducted our review in accordance with International Standard on Review Engagements 2410, “Review of Interim Financial Information Performed by the Independent Auditor of the Entity”. A review of interim financial information consists of making inquiries, primarily to persons responsible for financial and accounting matters, and applying analytical and other review procedures. A review is substantially less in scope than an audit conducted in accordance with international standards on auditing, and consequently does not enable us to obtain assurance that we would become aware of all significant matters that might be identified in an audit. Accordingly, we do not express an audit opinion.
ConclusionBased on our review, nothing has come to our attention that causes us to believe that the interim financial information is not prepared, in all material respects, in accordance with International Accounting Standard 34 “Interim Financial Reporting” as adopted by the EU.
Oslo, 16 August 2017
Deloitte AS
Henrik WoxholtState Authorised Public Accountant (Norway)
Translation from the original Norwegian version
47
KEY FIGURES AND FINANCIAL REPORTING 3

NORGES BANK INVESTMENT MANAGEMENTBankplassen 2, Postboks 1179 Sentrum, 0107 Oslo
T: 24 07 30 00, www.nbim.no