2q06 results presentation
TRANSCRIPT
0
Company’s Presentation2Q06

1
Forward-looking Statements
Notice Notice –– Data and OutlookData and Outlook
The material shown is a presentation of general information about Rossi Residencial S.A.’s record until the present date. It’s a summary of the information with no intention of being complete, that should not be taken under consideration by potential investors as a recommendation. We make no statements nor guarantee the correctness, the conformity or the scope of the following information and any investment decision should not be based on them.
Although ROSSI believes in the expectation and assumption contained on this statement, as well as the prospective information to be reasonable and also based on current data available to its management, ROSSI could not guarantee results nor future events. ROSSI fully exempts itself from the duty of updating any one of the prospective statement and information.

2
1. Highlights
2. Financial Information
3. Closing Remarks
3
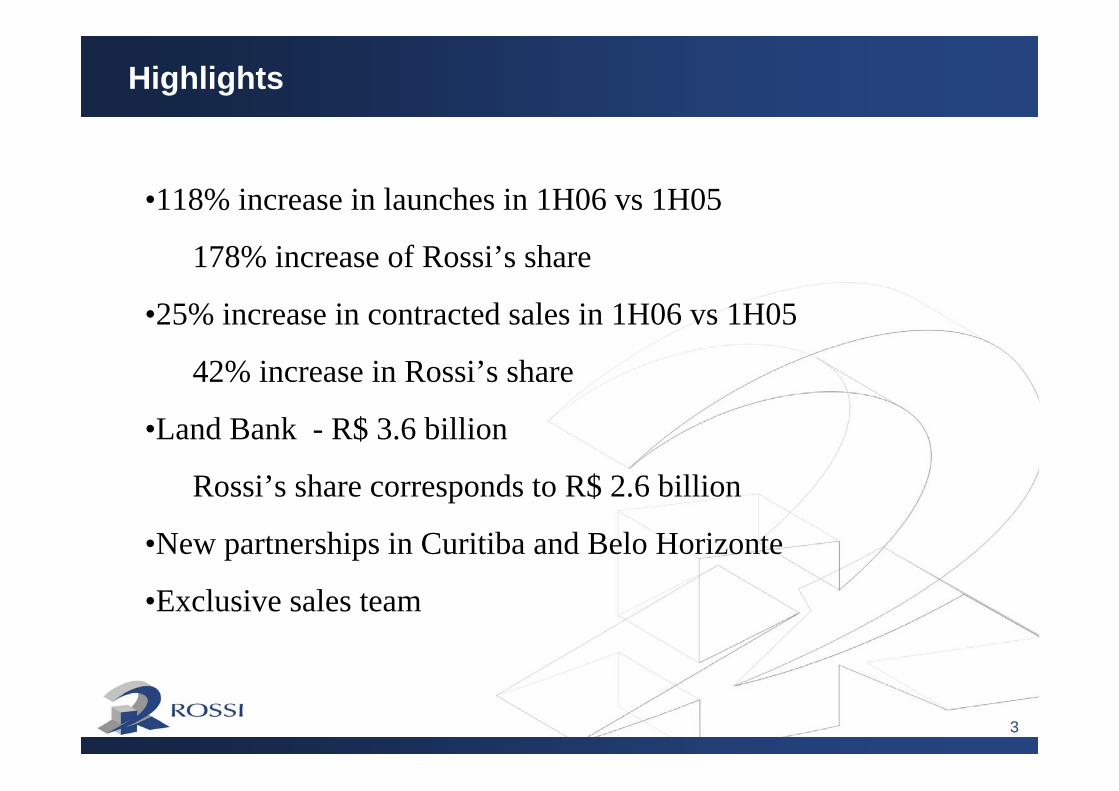
Highlights
•118% increase in launches in 1H06 vs 1H05
178% increase of Rossi’s share
•25% increase in contracted sales in 1H06 vs 1H05
42% increase in Rossi’s share
•Land Bank - R$ 3.6 billion
Rossi’s share corresponds to R$ 2.6 billion
•New partnerships in Curitiba and Belo Horizonte
•Exclusive sales team
4
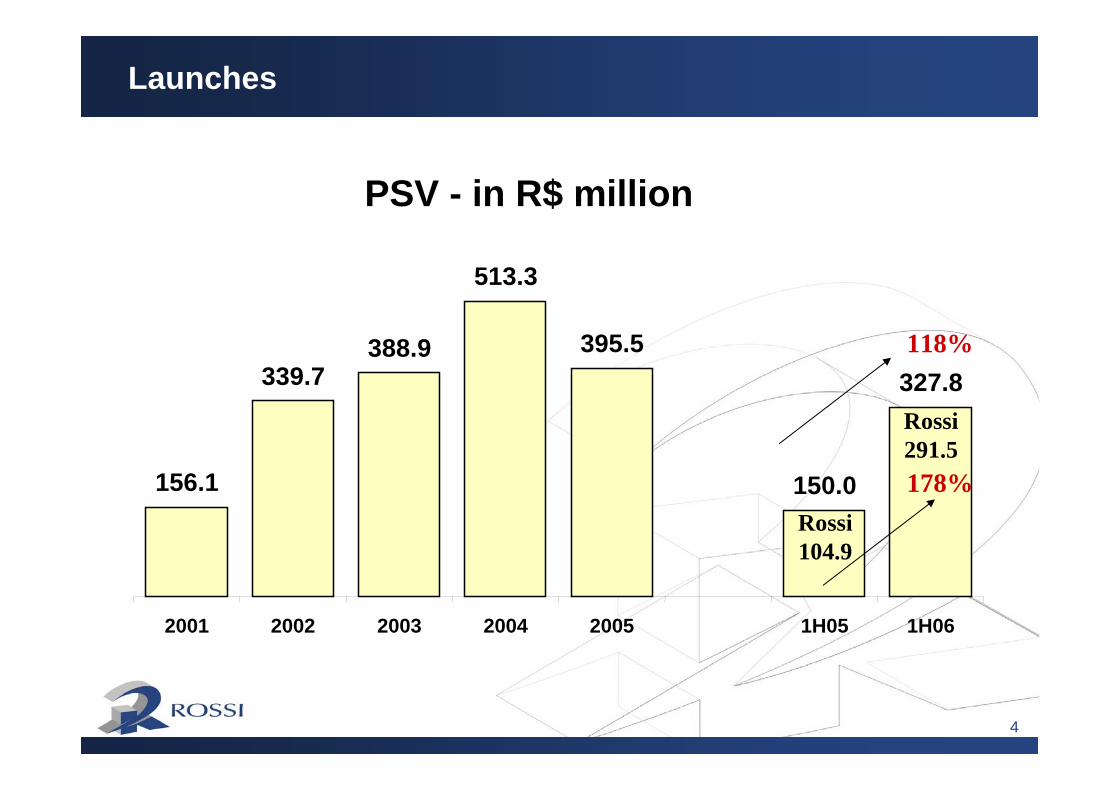
PSV - in R$ million
156.1
339.7388.9
513.3
395.5
150.0
327.8
2001 2002 2003 2004 2005 1H05 1H06
Launches
118%
Rossi104.9
Rossi291.5178%

5
Launches breakdown
Per Regional Office
42%
29%
3%
27%
45%
16%
31%
9%
São Paulo Campinas Porto Alegre Rio de Janeiro
2005 1H06
6
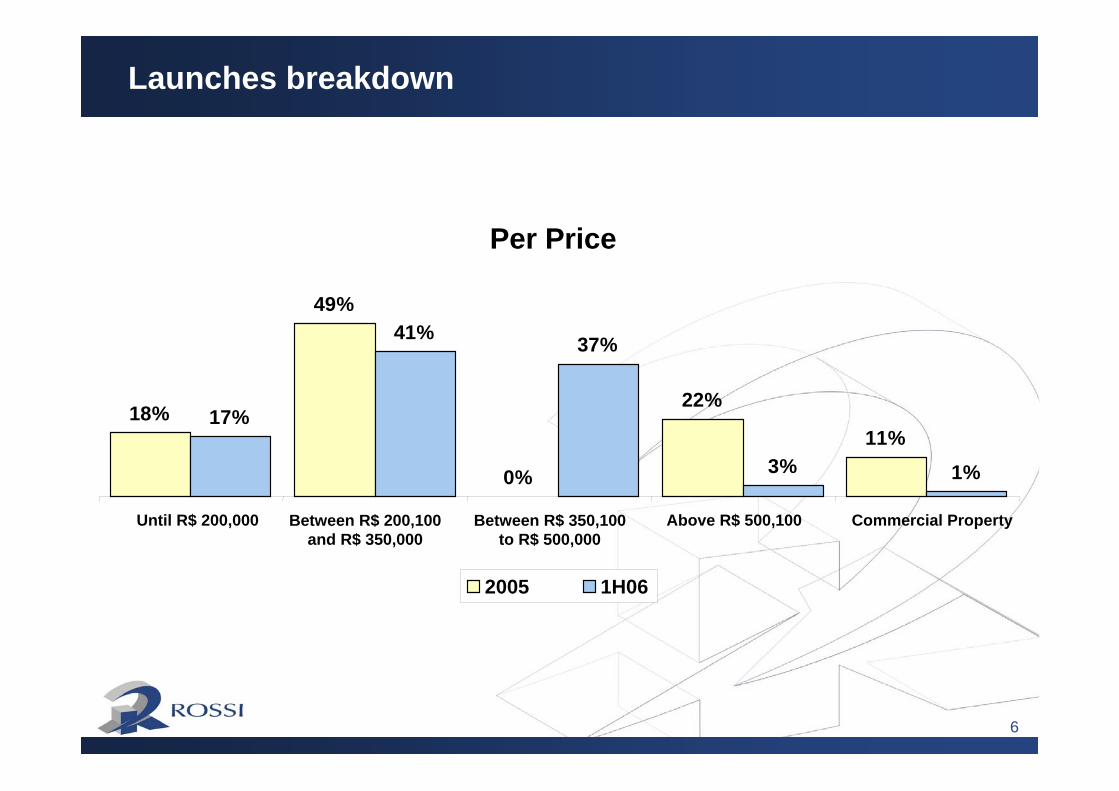
Launches breakdown
Per Price
18%
49%
0%
22%
11%17%
41% 37%
3% 1%
Until R$ 200,000 Between R$ 200,100and R$ 350,000
Between R$ 350,100to R$ 500,000
Above R$ 500,100 Commercial Property
2005 1H06
7
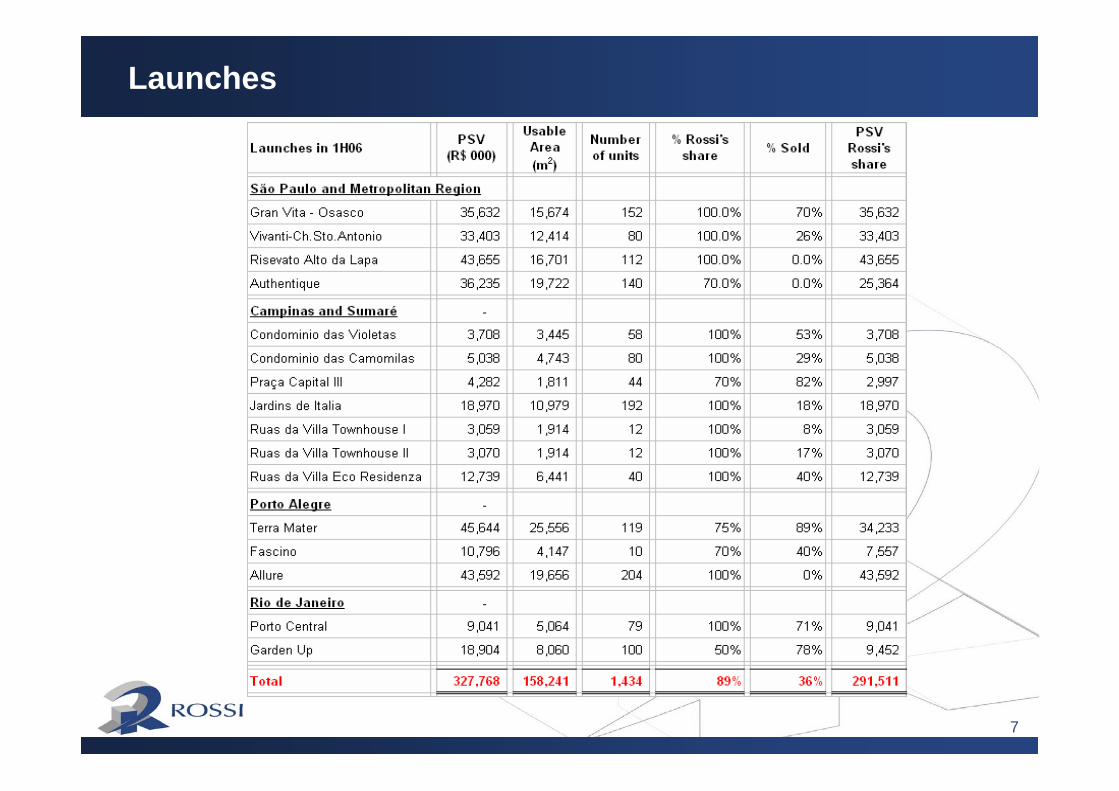
Launches

8
Sales - in R$ million
123.0
257.7 268.7
433.4 444.5
209.2261.6
2001 2002 2003 2004 2005 1H05 1H06
Contracted Sales – per period
2001 – 2005CAGR = 38%
25%
Rossi159.7
Rossi227.142%
9
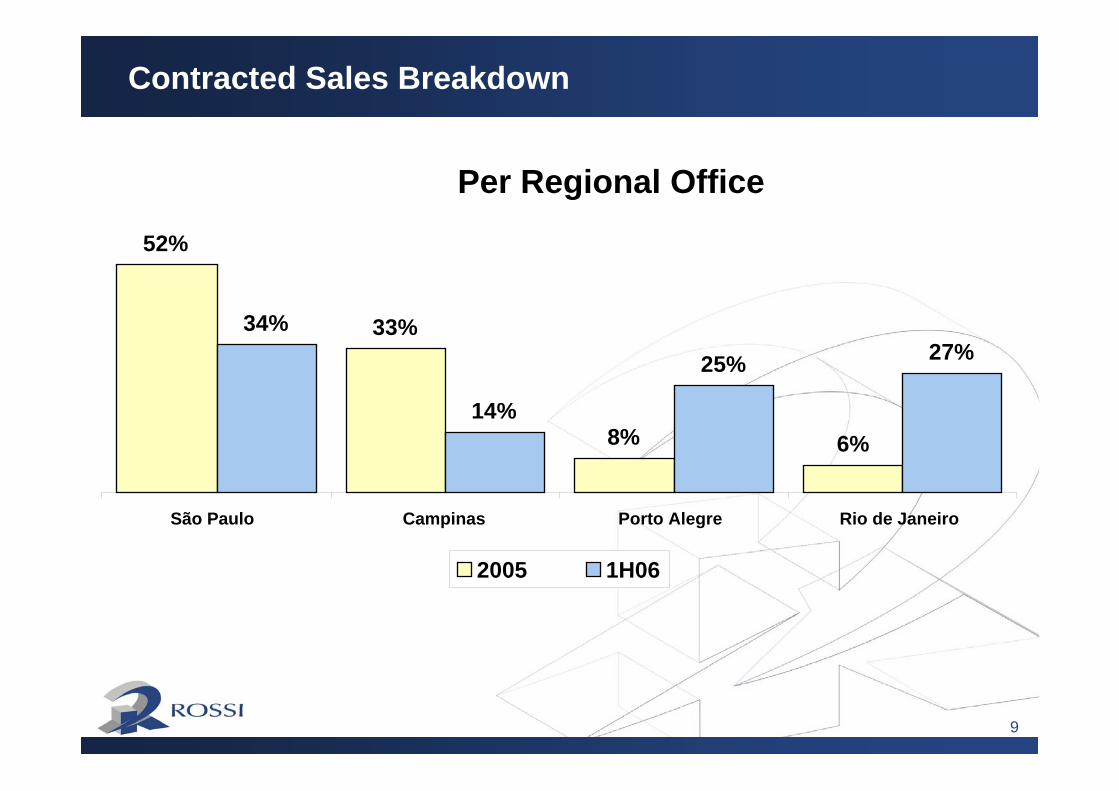
Contracted Sales Breakdown
Per Regional Office
52%
33%
8% 6%
34%
14%
25% 27%
São Paulo Campinas Porto Alegre Rio de Janeiro
2005 1H06

10
Contracted Sales Breakdown
Per Price
22%
42%
4%
21%
11%
30%
39%
18%10%
3%
2005 1H06
Until R$ 200,000 Between R$ 200,100and R$ 350,000
Between R$ 350,100to R$ 500,000
Above R$ 500,100 Commercial Property

11
Land Bank – m²
TOTAL BUILDABLE AREA in m2……2.7MM
USABLE AREA in m2 (+/- 60%)……………….1.6MM

12
Land Bank – R$ thousand
TOTAL POTENTIAL PSV.……………...R$3.6 billionPOTENTIAL PSV Rossi’s share (72%)...R$2.6 billion
Average sales price estimated (R$/m2 usable area)…R$2,250.00

13
Land Bank – performance
1.826
3.567
2.066 98%
Land Bank - in R$ MM
1,326 1,4722,628500 594
939
Dec'2005 Mar'2006 Jun'2006
Rossi Share Partners
1,826
3,567
2,066

14
Joint Venture
• Grupo THÁ – Curitiba PR
The Company announced a joint venture with Grupo THÁ (Curitiba – PR), to operate exclusively in the states of Paraná and Santa Catarina, through which 6 new projects, totaling R$ 200.0 million, will be launched within the next 12 months. The agreement grantsRossi first refusal in Grupo THÁ’s future business undertakings.
•Alicerce – Belo Horizonte MG
More recently, we formed a similar joint venture with AlicerceEmpreendimentos, to operate exclusively in Belo Horizonte – MG. The agreement envisages four projects, with a joint PSV of R$ 100 million.
15
Sales Team
This quarter the Company concluded the setting of its sales team, exclusively focused on selling Rossi’s developments.
The team, with 23 real estate brokers, aims to maintain the units sales liquidity after six months from the launch date.

16
FINANCIALINFORMATION

17
Financial information
Net Revenue - R$ MM
170.9 175.6
1H05 1H06
Gross Income - R$ MM
51.8 46.2
30.3%26.3%
1H05 1H06
Gross Income Gross Margin
Net Income (Adjusted)R$ MM
9.3
28.0
5.4%
15.9%
1H05 1H06
Net Income Net Margin
EBITDA (Adjusted)R$ MM
20.9 19.1
12.2% 10.9%
1H05 1H06
EBITDA EBITDA Margin

18
Contracted sales %
Booked revenues %
Contracted sales %
Booked revenues %
2006 Launches 64,311 50% 8,773 10% 119,275 46% 14,421 8%
2005 Launches 34,263 26% 11,393 13% 76,544 29% 19,848 11%
2004 Launches 10,569 8% 37,199 41% 24,529 9% 71,215 41%
2003 Launches 15,082 12% 24,263 27% 33,410 13% 60,933 35%
2002 Launches 5,669 4% 8,747 10% 7,827 3% 9,168 5%
Total 129,894 100% 90,375 100% 261,585 100% 175,585 100%
Year
1S062Q06
Contracted Sales x Booked revenues
76% 75%
81%78%
19
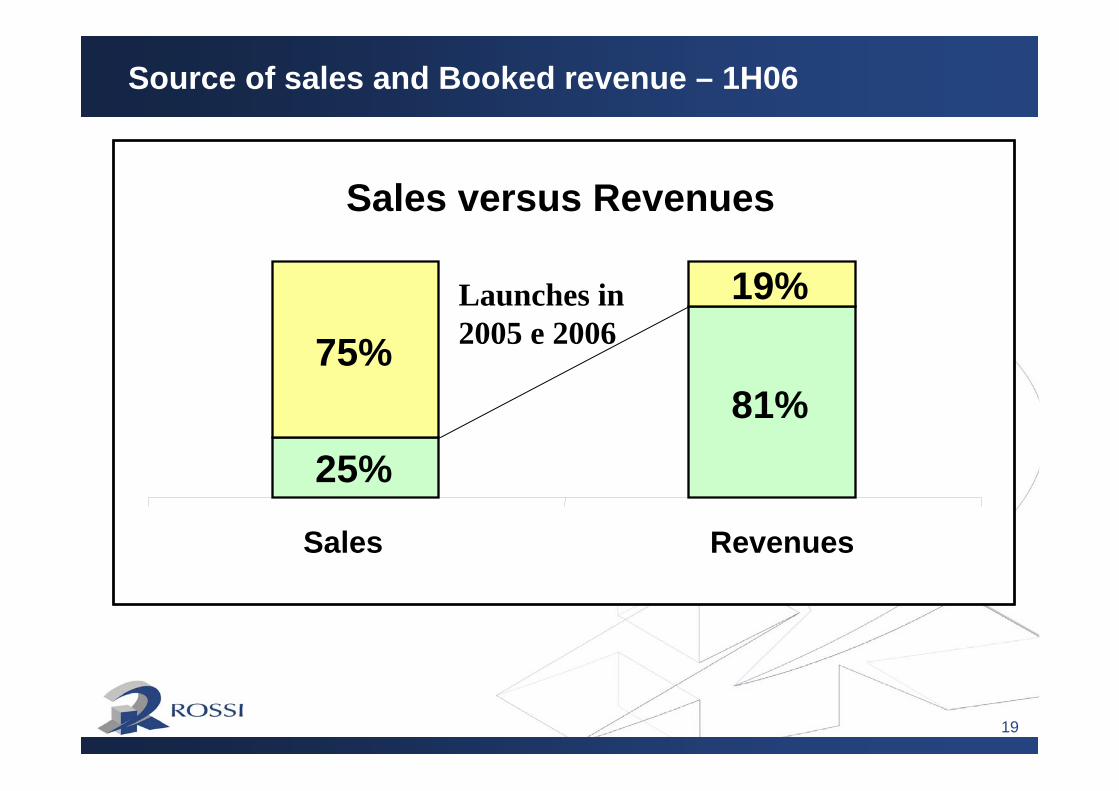
Sales versus Revenues
25%81%
75%19%
Sales Revenues
Source of sales and Booked revenue – 1H06
Launches in 2005 e 2006
20
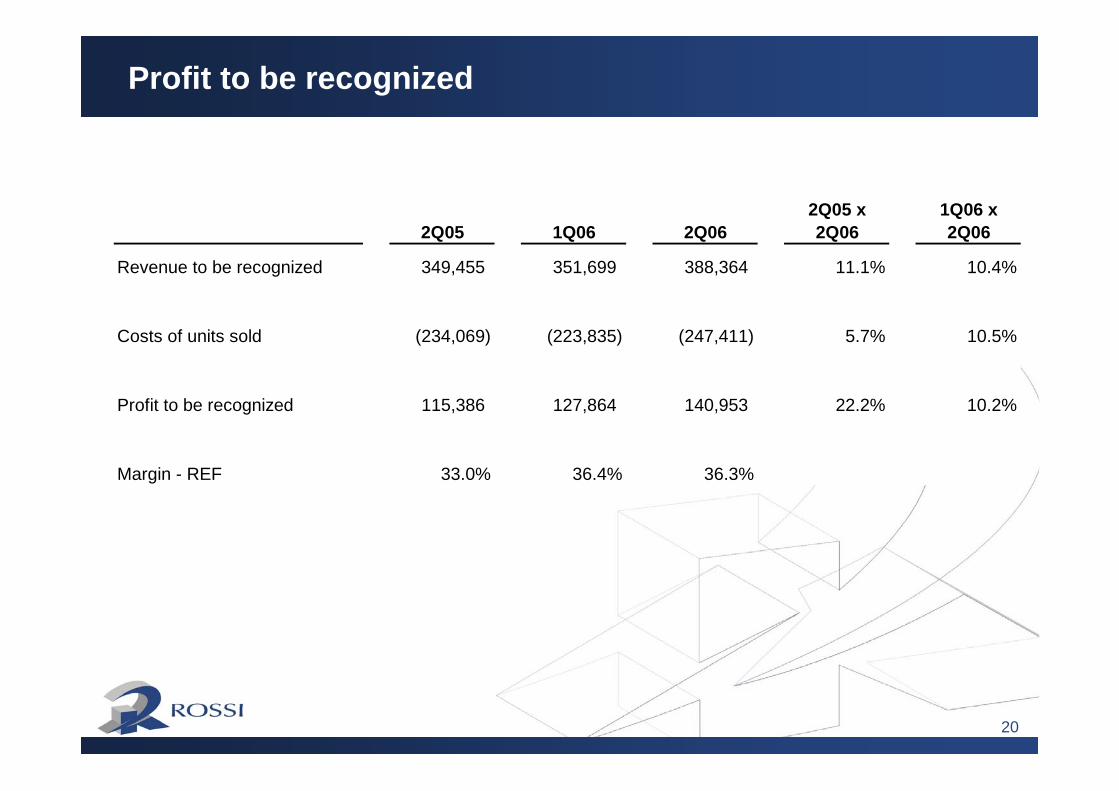
Profit to be recognized
2Q05 1Q06 2Q062Q05 x 2Q06
1Q06 x 2Q06
Revenue to be recognized 349,455 351,699 388,364 11.1% 10.4%
Costs of units sold (234,069) (223,835) (247,411) 5.7% 10.5%
Profit to be recognized 115,386 127,864 140,953 22.2% 10.2%
Margin - REF 33.0% 36.4% 36.3%

21
Net Debt
Indebtedness 2Q06 1Q06 Chg (%)Indebtedness - Short termFinancing for construction 74,442 67,974 9.5%Loans - working capital 2,078 1,882 10.4%Indebtedness - Long termFinancing for construction 24,000 25,159 -4.6%Loans - working capital 506 1,059 -52.2%Total debt 101,026 96,074 5.2%
Cash positionCash and cash equivalents 12,504 13,653 -8.4%Investments - short term 541,520 574,626 -5.8%Investments - long term 1,817 1,816 0.1%Total cash position 555,841 590,095 -5.8%
Net Debt -454,815 -494,021 -7.9%

22
CLOSING REMARKS
23
A question of time:
• Start-up of the development of the recent launches;
• Continuity of the launch plan;
• Scale economy and fixed costs;
• Business generated by recent joint ventures.
Promising Results

24
Why Rossi?
Interest decreaseCredit expansionMaturity extensionHigher demand for new property
Leadership at the Middle Class SegmentFlexibility to adjust according to demandExposure to different markets
Adequate Product Mix
Geographic diversificationPresence in regions with highhousing deficit
The Right Place
Deep local knowledge – regional offices
Experienced Management
30 executives with, at least, 30-year experience in the sectorSAP / Integrated operationsCapacity of managing a high number of projectsStrong market acknowledgment
The Right Time

25
APPENDIX
26
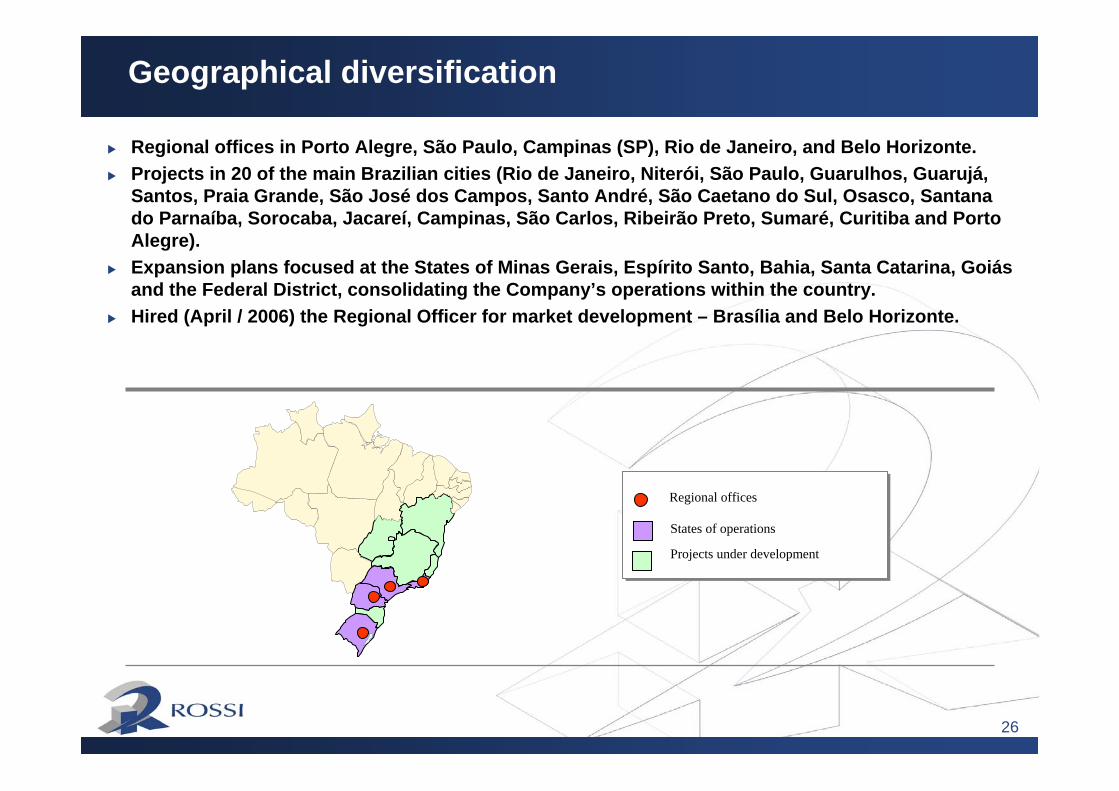
Geographical diversification
Regional offices
Projects under development
States of operations
Regional offices in Porto Alegre, São Paulo, Campinas (SP), Rio de Janeiro, and Belo Horizonte. Projects in 20 of the main Brazilian cities (Rio de Janeiro, Niterói, São Paulo, Guarulhos, Guarujá, Santos, Praia Grande, São José dos Campos, Santo André, São Caetano do Sul, Osasco, Santana do Parnaíba, Sorocaba, Jacareí, Campinas, São Carlos, Ribeirão Preto, Sumaré, Curitiba and Porto Alegre).Expansion plans focused at the States of Minas Gerais, Espírito Santo, Bahia, Santa Catarina, Goiásand the Federal District, consolidating the Company’s operations within the country.Hired (April / 2006) the Regional Officer for market development – Brasília and Belo Horizonte.

27
A Typical Project
Launch 6th Month 12th Month 18thMonth 24th Month 30th Month 36thMonth
0% 60% 80% 85% 90% 95% 100%
Cost Incurred in construction % - - 5% 41% 82% 100% 100%
- 14% 25% 47% 77% 100% 100%
- 8% 17% 24% 33% 44% 100%
CONSTRUCTION
Commercial Launch
Incorporation Confirmation
Start up of the projects
Keysdelivery
End of receivables
Repass
Accumulated sales %
Booked revenues %
Receivables %

28(2.800.000)
(2.550.000)
(2.300.000)
(2.050.000)
(1.800.000)
(1.550.000)
(1.300.000)
(1.050.000)
(800.000)
(550.000)
(300.000)
(50.000)
200.000
450.000
700.000
950.000
1.200.000
1.450.000
1.700.000
1.950.000
2.200.000
-5 -4 -3 -2 -1 1 2 3 4 5 6 7 8 9 11 12 13 14 15 16 17 18 19 20 21 22 23 26 27 29 30 31 32 33 34 35 36
With financing for development
Without financing for development
Investment financed by own cash or debt
• 30% of developments completed• 80% of units sold
Months
Intensive use of capital for expanding
growth
Cash Flow for a Typical Project
Purc
hase
of t
he s
ite
Com
mer
cial
Lau
nch
Beg
inni
ng o
f the
dev
elop
men
ts
Con
clus
ion
of th
e de
velo
pmen
tsD
eliv
ery
of th
e ke
ys
Secu
ritiz
atio
n