2_invbotdl_adani group presentation may 14
DESCRIPTION
SHARETRANSCRIPT

Thinking big Doing better
Resources Logistics Energy

Adani Group – Vision, Values and Commitment
2
To be globally admired leader in integrated infrastructure businesses with a deepcommitment to nation building. We shall be known for the scale of our ambition, speed ofexecution and quality of operation.
India:Generation:
9240 MW thermal capacity by 2014.
40 MW Solar Power Plant operational
Transmission:
2923km of transmission network.
CGD:
Operate in 3 cities in India.
India: No. 1 Port of India
(cargo handled)
Biggest Private Port Developer & Operator
4 Operating Ports
Developing 4 other terminals# pan India
Largest Private Rail.
Shipping:
• Own & operate 4 capesize vessels
India Largest trader of
Coal.
Mine developer and operator with 97 mtpa order book
Indonesia: Resource 269 mn tn
Mine life: 15 yrs
11 mtpa (peak)
Australia JORC Resource: 11
bn ton
Mine life:100 yrs
100 mtpa (peak)
Building an energy sufficient INDIA
with world class
Infrastructure and integrated value
chain
•Coal Trading•Coal Mining•Agro
Resources
• Sea Ports• Railways• Shipping
Logistics• Power
• Generation• Transmission• Trading
• CGDEnergy
#: Construction completed at coal terminal at Goa and Vizag

200 384
1,000 1,084 1,271
1,700
-
500
1,000
1,500
2,000
FY09 FY10 FY11 FY12 FY13 FY14
3,077 5,654
12,822
15,762 17,273
16,738
-
5,000
10,000
15,000
20,000
FY09 FY10 FY11 FY12 FY13 FY14
Adani Group – Thinking Big, Doing Better
3
Net Asset (USD mn)
EBIDTA (USD mn)
• Commercial Port in India
• Coal Import Terminal at Mundra
• Private Power Producer in India
• Mine Developer and Operator in India
• Trader of coal in India with consistent share of
about 50%
• Edible Oil Company in India in terms of market share
No.1 :-

Resources Logistics Energy
•Coal Trading
•Coal Mining
•Sea Ports
•Railways
•Power
• Generation• Transmission

Coal: Indigenous Supply Deficit to Continue
5
2012 2017 2020
602 84190036
70100
2
70
200
25%
640
981
1200
Units in MMTPA
Mining (AEL) Imports (AEL)
CIL & Other Imports AEL Market Share
Source: Ministry of Coal/XIIth FYP & Plan Working Group.
14%6%
Adani : Key Supplier to growing coal Demand
in India
• Coal demand driven predominantly by
Indian Power Sector – estimated to reach
~288 GW by 2017 from 245 GW as on 30th
Apr 14.
640*981* 1200*
Indigenous Supply Deficit in India
Growing Demand Increasing Demand-Supply Gap
100
185234
• Coal imports to cater the deficit arising from
the demand-supply gap.
• Indigenous supply to grow at slow pace of
7.5% against demand growth of 8.2%,
increasing the deficit from 15.6% in FY12 to
19.5% in FY20
• Coal imports to grow at 11.2% p.a. over 2012-2020
* Annual Demand

Coal Trading : Largest Integrated Coal Management
6
Multi-CountryProcurement
Multi modal Logistics
Customer Account Management
Financing
Consistent market share of
~50%
Map not to scale
South Africa
Richard Bay
Ports
Locations served
Indonesia
Indonesia
TarakanTanjung Bara
BontangSamarinda
Muara Satui TanjungPemancingan
Australia
Queensland
1019
29 33 3646
70
100
-
20
40
60
80
100
120
Mundra
GangavaramKakinada
Vishakhaptnam
Tuticorin
Haldia
Suratgarh
Tanda
Unchahar
SipatKorba
Koradi
Parli
Chanderpur
Simhadri
Kota
Chhabra
GandhinagarWanabori
Dadri
Panipat
Yamunagar
Hissar
Panki
Parichha
Harduaganj
Kahalgaon
Ramagundam
Kondapalli
North ChennaiMettur Tuticorin
Rihand
Vindyachal
Paradip
[Talcher]
Mejia
Badarpur
Ennore
Dahej
Bedi Navlakhi
Kandla
Kolaghat
BakreshwarBandel
Sagardighi
Durgapur
Hazira
Goa
Tiroda

Mining LocationsPorts
Mundra
Machhakata
Dahej PortHazira Port
Parsa
Chhendipada
Parsa – KenteMormugao Port
Vizag
Kandla
7
Land Acquisition
Develop, Plan, Operate & Manage Mining
Operations
Establishment of Washery & Rejects based Power Plants
Logistic Solutions
State Chhattisgarh Orrisa
Mine Parsa -Kente
(RRUVNL)
Parsa (CSPGCL)
KenteExtension (RRUVNL)
Machhakata(MGCL)
Chendipada (UCMCCL)
Block Area (Sq Km) 27.67 12.52 17.00 20.43 21.91
Mineable Reserve (Mn MT)
452 150 200 1244 1589
Capacity at peak level (MMTPA)
15 5 7 30 40
Overall Stripping Ratio 5.16 5.46 5.10 2.44 2.75
Commencement of Production
Started Jan 13 2016 2017 2015 2016
Notes:1. RRVUNL – Rajasthan Rajya Vidyut Utpadan Nigam Limited ; 2. MGCL – Mahaguj Collieries Ltd. ; 3. CSPGCL – Chhattisgarh State Power Generation Company
Limited 4. UCMCCL - UCM Coal Company Limited
Coal Mining: Largest Mine Developer & Operator

8
Coal Mining: Indonesia
Indonesia
Bunyu Island
Coal Crushing
Coal Loading
Particulars Capacity
Location Bunyu Island, Indonesia
Resource 269 MMT (JORC)
Peak Capacity 11 MMTPA
Current Capacity 7 MMPTA
Coal Mining

9
Coal Mining: Carmichael Coal Mine
Acquisition• Adani Mining Pty Ltd, entered into Asset
sales agreement with LINC Energy inAugust, 2010 for ownership of EPC 1690
Location • Galilee Basin - Queensland, Australia
Resource Base • Thermal Coal – 11.04 Bn Tonnes (JORC)
ProductionTarget
• Phase I : 40 MTPA
Status• EIS approved for Carmichael Mine & Rail
project• EIS filed for NGBR Project
EIS – Environment Impact StatementNGBR – North Galilee Basin Rail
Proposed Rail Connectivity

Agro
10
• Capacity of 21000 MT of storage of Apple• State of Art Control Atmosphere Storage facility at 3 locations in Himachal
Pradesh• Distribution set up across India under brand “Farm-Pik”• One of largest importer of fruits into India
Agri Infrastructure: Fruits
• Operates storage capacities of 6,00,000 MT across 7 locations across India• Another 3,50,000 MT in development across 7 locations in Madhya Pradesh• State of Art mechanized storage facilities with private railway siding• Operates storages facilities under Build Own Operate model for FCI for 20 years
Agri Infrastructure: Food Grains
• Joint venture with Wilmar , Singapore• “FORTUNE” - India’s number 1 edible oil brand with more than 20% market share
(AC Nielson) • Revenues in excess of $ 2.5 Bn• Volumes more than 3.5 MMTPA• Major Exporter of Castor Oil/derivatives and Soya De-oiled cake• Manufacturing facilities spread across 18 locations pan India with 10k refining
& 7k crushing capacity
Edible Oil
Agri Infrastructure: Fruits
Agri Infrastructure: Food Grains

Resources Logistics Energy
•Coal Trading
•Coal Mining
•Sea Ports
•Railways
•Power
• Generation• Transmission

Ports & Logistics: Unique Asset Profile
India’s Gateway for International Trade
4 Ports having 14 terminals with 33 berths *(Mundra, Dahej, Hazira & Dhamra)
2 inland container depots at Patli (Punjab) and Kishangharh (Rajasthan) in the north of India
Terminals : Operational
Trial Runs at: 1 Coal terminal each at Vizag port and Mormugao Port
1 bulk terminal with total 4 berths at the Kandla 1 container terminal with 1 berth at the Ennore
Terminals: Being Developed
Energy Gateway
Crude – Crude Products Imports
2 operational SPM. Potential to develop 2 more SPM at Mundra Port
LNG Terminal being developed
Coal: Feeding Power Projects Across India
PAN India network of ports and terminals to handle coal cargo
Availability of Adequate Draft: Only “Deep Draft” Ports and Terminals of West India
• Deep water drafts: 17.5 – 20 Mtrs at Berth & 32 Mtrs at SPM at Mundra• Accommodates cape size bulk vessels & container cargo vessels of >14,000 TEUs, and • Very large crude carriers (“VLCCs”) of up to 360,000 DWTs
Supporting Facilities
• Mobile harbor cranes, conveyors, port crafts and other equipment and back-up and storage areas• Two ICDs at Patli and Kishanghar, to provide an outreach to land locked northern India• 6,641 hectares SEZ- Opportunity to expand storage and back up area
• Fleet of 13 dredgers capable of doing capital dredging across various marine conditions• 22 tug boats which are used to maneuver vessels inside out the port terminals
Port Craft and Mechanization
12
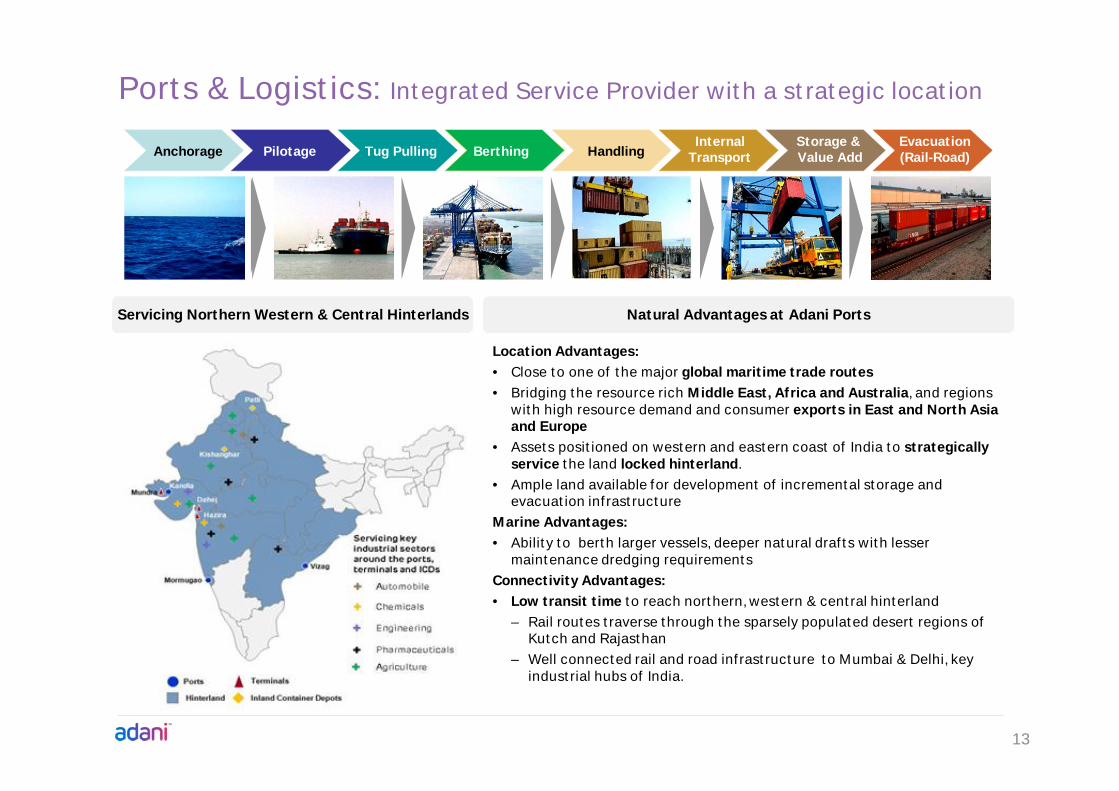
Ports & Logistics: Integrated Service Provider with a strategic location
13
Anchorage Pilotage Tug Pulling Berthing HandlingInternal
TransportStorage & Value Add
Evacuation(Rail-Road)
Natural Advantages at Adani PortsServicing Northern Western & Central Hinterlands
Location Advantages:• Close to one of the major global maritime trade routes• Bridging the resource rich Middle East, Africa and Australia, and regions
with high resource demand and consumer exports in East and North Asia and Europe
• Assets positioned on western and eastern coast of India to strategically service the land locked hinterland.
• Ample land available for development of incremental storage and evacuation infrastructure
Marine Advantages:• Ability to berth larger vessels, deeper natural drafts with lesser
maintenance dredging requirements Connectivity Advantages:• Low transit time to reach northern, western & central hinterland
– Rail routes traverse through the sparsely populated desert regions of Kutch and Rajasthan
– Well connected rail and road infrastructure to Mumbai & Delhi, key industrial hubs of India.

Ports & Logistics: Only PAN India Port Company
14
Particulars Mundra Dahej Hazira Dhamra Goa Vizag Kandla EnnoreCapacity (mmt)
Bulk 100 20 15 24 10 6 - -
Crude 50 - - - - - - -
Container (mn TEUs) 4 - 1.5 - - - - -
Operational 210 20 35 24 10 6 - -
LNG 5 - - - - - - -
Bulk 40 - 6 - - 20Containers (mn TEUs) - 1.4
Being Developed 45 - 6 - - 20 18
Total Capacity 255 20 35 30 10 6 20 18
Status Operational Trial Runs FY 16 FY 17
Expansion √ √ √ √ X X X √Berth Length-mtr 6384 566 1,580 800 300 310 1200 780
Mechanisation √ √ √ √ √ √ √ √
Connectivity
Road √ √ √ √ √ √ √ √
Rail √ √ √ √ √ √ √ √
Pipeline √ X X X X X X X
Air √ X X X X X X X
Revenue Share NIL NIL 3% > 10yrs 5% 20% 40% 25% 37%
Tariff Fixation Commercially Negotiated Regulated
Only indigenous PAN India Port Company…
A network of Multi Purpose Terminals, Coal Handling facilities and Container Terminals
across India
A network of Multi Purpose Terminals, Coal Handling facilities and Container Terminals
across India
Mundra
Hazira
Mormugao Vizag
Kishanghar
Patli
Ennore
Dahej
Kandla
Dhamra

Ports & Logistics: Key Milestones
15
2011• Terminal at Dahej becomes
operational • 20 million MT capacity now• 60 million MT of handling
capacity-commissions the world’s largest coal import terminal at Mundra
2009• Automobile handling
terminal commences operations
2010• Hazira: Sub - Concession
signed
2013• Mundra port
becomes 2nd largest in India
• Hazira became operational
2012• Doubling of the rail connectivity
between Mundra and Adipurcompleted
• Operations Commenced:• Container terminal - III
• Name changed to Adani Ports and Special Economic Zone Limited
2001• Commences
commercial operations
• Sets up first commercial terminal
2003• First container
terminal, MundraInternational Container Terminal commences operations
2002• 4 million MMT of cargo-Mundra
becomes largest private port in India
• Agreements signed with IOC and HMEL for setting up SPM and crude oil handling at Mundra
2005• First non-captive Single
point mooring facility in India at Mundra Port
• A double-stack container train began operations
2007• Initial public offering of shares
oversubscribed 117 times• Operations Commenced:
• Multi Purpose Terminal II• Container terminalII
• Dahej: Sub-Concession Signed
2014• Mundra handles 101 mtpa of
cargo• Only port in India to handle
such large volumes• CT III assets operations by
AICTPL – 50-50 JV APSEZL-MSC
• Terminals at Mormugao and Vizag complete constructions
• APSEZL signs definite agreement to acquire DPCL –marks its foot steps on eastern coast of India

Ports & Logistics: The Differentiating Factors
16
2 1 1
7
1 2
12
2.01
6 6
3
Dry Liquid Containers
Turn Around Time (in days)
Mundra
Kandla
Mumbai
JNPT
0%
20%
40%
60%
80%
100%
Dry Liquid Containers
Berth Occupancy
Mundra
Kandla
Mumbai
JNPT
8294 58
65
0
50
100
150
200
Mundra Kandla Mumbai JNPT
Capacity & Cargo Handled (million MT)
Liquid
Container
Dry
CargoHandled
• Mundra Port provides the best vessel turn around time in the region ensuring advantage to customers
• Capacity utilization at competing ports is very high leading to congestion in operations
• Capacity expansion at competing ports is bound to take time and will be capital intensive
• Investments at our Ports have been done to ensure readily available capacity to handle additional cargo without any congestion
2

Ports & Logistics: Cargo Diversity Key Feature
17
3C: Coal, Container & Crude Traffic to Drive Volume in India
912
318 233 188 131 16221 2,019
0
1,000
2,000
3,000
FY12 Coal Containers Crude Iron Ore Fertilizers Others FY17
Cargo Handled in MMT)
696
981
559
795
0
300
600
900
1,200
FY12 FY17E
Coal: Critical for India’s Energy RequirementsMMT
Indigenous SupplyTotal Demand Refining Capacity
Crude Requirement
184
358
190
364
0
150
300
450
FY12 FY25E
Increasing crude importsMMT
Increasing Containerization
12
31
0
5
10
15
20
25
30
35
FY12 FY17E
Container traffic
No. 1 port to
service coal
requirements of
India
Services ~20% of
Indian coal
imports
No.1 port in India
No. 2 port to
handle
containers in
India;
Equipped to
handle up to 14K
TEUs vessels
2 operational
offshore single
point mooring
facilities
Long Term
Contracts with
IOCL, HPCL,
HMEL
TEUs
APSEZL’s Capability APSEZL’s Capability APSEZL’s Capability
Sources: Ministry of Shipping (GoI), Ministry of Road Transport and Highways (GoI), Indian Ports Association

Ports & Logistics: Growth Strategies
18
Become Gateway for Energy Resource Imports to India
Focus on Increasing Margins from OurOperational Facilities
Facilities in operation are positioned in West and South Gujarat to service northwest, west and central India
Developing terminals at the Mormugao Port and the Vizag Port to expand presence to southwest and southeast India
Growing presence on East coast with Vizag terminal
Growth on East coast through organic and inorganic means
Mundra already the enegry gate way fro India.
Focusing on coal and crude oil cargo services and providing connectivity to power plants and petroleum refineries
All adani ports equipped to handle coal cargo
For crude oil cargo, two operational single point mooring facilities and have the potential to develop two additional single point mooring facilities at the Mundra Port
Potential to develop an LNG Terminal
Establish Pan-India PresencePursue Benefits of Both Long-term and Short-term Arrangements with Customers To enhance existing long term as well as short term
customer relationships for steady mix of contracted and spot cargo
Try to convert short and medium term arrangements into long term arrangements
Plan to continue to increase the amount of cargo pursuant to these arrangements by increasing our capacity and continuing to refine our operating procedures
Offer Customers Multi-cargo Ports and Related Infrastructure
Positioned growth plans to accommodate the diversity of throughput by developing multi-cargo ports and infrastructure to cater to the diverse cargo needs ofthe customers
1
2
5
3
4 Focusing on revenue maximization and cost
optimization
Focus on providing various value add services at the port to enhance the revenue horizon above marine, handling, storage and evacuation incomes.
Implementing globally benchmarked operational practices for reduction in operating costs
Use of information technology and mechanization at port facilities to reduce turnaround times, pilferage and wastage and resulting into minimal human intervention.
APSEZL

Resources Logistics Energy
•Coal Trading
•Coal Mining
•Sea Ports
•Railways
•Power
• Generation• Transmission

Power: Sectorial Demand continue to rise…
20
Average Deficit in the Last Decade:Peak deficit: 12%; Energy deficit: 9%
India – Installed Capacity: 245 GW*
Installed Capacity in India - Category
Source: 11th & 12th FYP, Ministry of Power, CEA* As on 30th Apr 2014
Units in GW
2012 2017 2020
132 204
240 39
50 57
5
10 19
25
25 32
Thermal Hydro Nuclear Renewables
200
288347
Peak & Energy Deficit : Year-wise
Hydro40 GW
Other32 GW
Nuclear5 GW
Thermal168 GW13361
6460 5741
2942 2384884
0
2000
4000
6000
8000
10000
12000
14000
16000
USA Russia UK China Brazil India
Lowest per capita electricity consumption
12% 12%14%
17%
12% 13% 13%11% 9%
5% 5%7% 8% 9% 10% 11% 10% 9% 8% 9%
4% 4%
Peak Deficit Energy Deficit
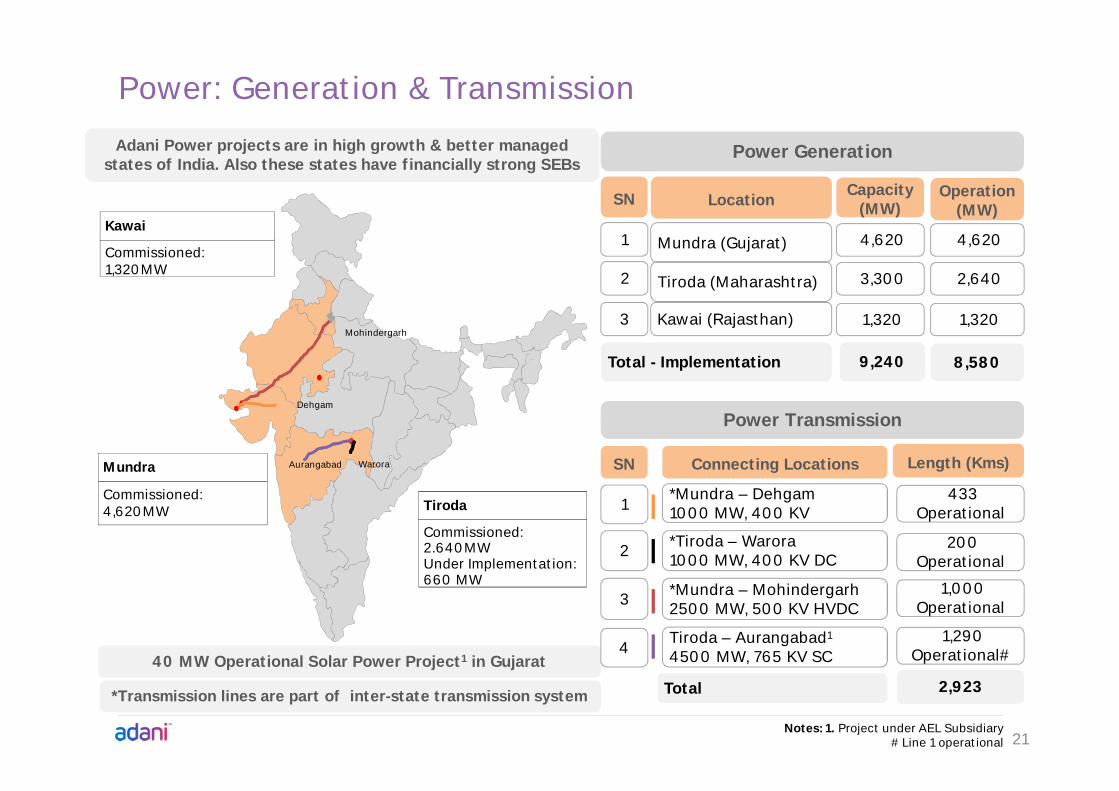
Power: Generation & Transmission
21Notes: 1. Project under AEL Subsidiary
# Line 1 operational
Commissioned: 2.640MW Under Implementation:660 MW
Commissioned: 1,320MW
Kawai
Commissioned: 4,620MW
Mundra
Tiroda
Dehgam
Mohindergarh
Aurangabad Warora
Adani Power projects are in high growth & better managed states of India. Also these states have financially strong SEBs
40 MW Operational Solar Power Project1 in Gujarat
SN LocationCapacity
(MW)
1 Mundra (Gujarat) 4,620
2 Tiroda (Maharashtra) 3,300
3 Kawai (Rajasthan) 1,320
Total - Implementation 9,240
Power Generation
Power Transmission
SN Connecting Locations Length (Kms)
1*Mundra – Dehgam1000 MW, 400 KV
433Operational
2 *Tiroda – Warora1000 MW, 400 KV DC
200 Operational
3 *Mundra – Mohindergarh2500 MW, 500 KV HVDC
1,000Operational
4Tiroda – Aurangabad1
4500 MW, 765 KV SC1,290
Operational#
Total 2,923
Operation(MW)
4,620
2,640
1,320
8,580
*Transmission lines are part of inter-state transmission system

22
Power: Fuel Security & Off-take in PlaceCustomer
TotalCapacity
(MW)
Capacitycontracted
(MW)
Levelisedtariff
(INR/unit)
PPA starts from
Coal AvailabilityQty (MMT)
Coal Required (MMT)
Tariff revision requested
Gujarat - GUVNL (330x4) 1,320 1,000 2.89 Feb-10
Imported Coal 10.2Gujarat - GUVNL (660x2) 1,320 1,000 2.35 Feb-12
CERC final order received; full coal cost pass
through
Haryana - UHBVNL & DHBVNL (660x3)
1,980 475 + 949 2.94 Aug-12 /Feb-13 FSA signed for 6.4 MMT 6.4
CERC final order received; full coal cost pass
through
Mundra 4,620 3,424 16.6
Maharashtra - MSEDCL (660x2) 1,320 1,320 2.64 Aug-12 FSA signed for 4.91 MMT
FSA - Tapering linkage signed for 800 MW
8.3
MERC final order received; full coal cost pass through
Maharashtra - MSEDCL (660x3)
660 125 + 4403.28**
Aug-14 / Feb-17
1,320 1200 Apr-14 MoU signed for 3.39 MMT 5.5
Tiroda 3,300 3,085 13.8
Rajasthan - RRVPNL (660x2) 1,320 1,200 3.24** Aug-13 MoU signed for 3.39 MMT 5.5 P
Kawai 1,320 1,200 5.5Grand Total 9240 7709^ 35.9
**Fuel & Fuel Transportation are linked to CERC escalation index in PPA tariff^ PPA Capacity 92% of Net capacity

Power: Compensatory Tariff
23
• CERC final order on compensatory tariff entitled Adani Power forrecovery of past losses
• SCOD to 31-Mar-13 - Rs 830 crs and shall be recovered in 36monthly EMIs from the date of the order
• 1-Apr-13 to 28-Feb-14 - The compensatory tariff for the periodworks out - Rs 0.85/kwh for Gujarat Bid – 02 PPA andRs 0.36/kwh for Haryana PPA, and shall be recovered in 12monthly EMIs in accordance with the order
• CERC final order entitles Adani Power for full coal cost pass through
Compensatory
tariff
APL Phase III/IV
• Petition filed in MERC for for MSEDCL 1320 MW PPA to overcomethe hardship due to non-availability of captive coal mine
• MERC final order entitles APML for compensatory energy charge forsupply over and above 520 MW in the 1,320 MW PPA
• Compensatory energy charge at the current level of linkage (25%) for800 MW works out to Rs. 1.01/kWh
Compensatory
tariff
APML Phase I / II

Power: Other Developments
24
Pass through of additional imported coal cost
• Imported coal may be used to mitigate domestic coal shortage andincremental coal cost will be considered for pass-through over andabove existing PPA tariff
• Ministry of Coal has issued suitable orders supplementing the NewCoal Distribution Policy and MoP has issued appropriate advisory toregulators
12th Plan Power Projects – having PPA
• Government has asked CIL to work out modalities to provide longterm coal linkage to these projects
• Accordingly, till the time long term linkage is awarded CIL has agreedto provide coal to APRL (1320 MW) and APML Ph III (1320 MW)through MoU route. MoUs were signed for 3.39 MMT of Coalquantity for each project.
CCEA Directive
• CIL has allowed inter plant coal swapping which will result in overallbenefit due to savings in logistics cost and improved availability ofcoal to hinterland plants
• We have requested for conversion of 800 MW Tapering linkage(Received by APML in lieu of cancelled Lohara mine) into long termlinkage
Other
Developments

25
AEL assumes no responsibility to publicly amend, modify or revise any forward looking statements, on the basis of any subsequent development, information or events, or otherwise. Unless otherwise stated in this document, the information contained herein is based on management information and estimates. The information contained herein is subject to change without notice and past performance is not indicative of future results. AEL may alter, modify or otherwise change in any manner the content of this presentation, without obligation to notify any person of such revision or changes. No person is authorized to give any information or to make any representation not contained in and not consistent with this presentation and, if given or made, such information or representation must not be relied upon as having been authorized by or on behalf of AEL. This presentation is strictly confidential.This presentation does not constitute an offer or invitation to purchase or subscribe for any securities in any jurisdiction, including the United States. No part of its should form the basis of or be relied upon in connection with any investment decision or any contract or commitment to purchase or subscribe for any securities. None of our securities may be offered or sold in the United States, without registration under the U.S. Securities Act of 1933, as amended, or pursuant to an exemption from registration therefrom.This presentation is confidential and may not be copied or disseminated, in whole or in part, and in any manner.This presentation contains translations of certain Rupees amounts into U.S. dollar amounts at specified rates solely for the convenience of the reader.
Certain statements made in this presentation may not be based on historical information or facts and may be “forward-looking statements,” including those relating to general business plans and strategy of Adani Enterprises Limited (“AEL”) and Adani Ports and Special Economic Zone Limited (“APSEZ”) & Adani Power Limited (“APL”), their future outlook and growth prospects, and future developments in their businesses and their competitive and regulatory environment, and statements which contain words or phrases such as ‘will’, ‘expected to’, etc., or similar expressions or variations of such expressions. Actual results may differ materially from these forward-looking statements due to a number of factors, including future changes or developments in their business, their competitive environment, their ability to implement their strategies and initiatives and respond to technological changes and political, economic, regulatory and social conditions in India. This presentation does not constitute a prospectus, offering circular or offering memorandum or an offer, or a solicitation of any offer, to purchase or sell, any shares and should not be considered as a recommendation that any investor should subscribe for or purchase any of AEL’s shares. Neither this presentation nor any other documentation or information (or any part thereof) delivered or supplied under or in relation to the shares shall be deemed to constitute an offer of or an invitation by or on behalf of AEL. AEL, as such, makes no representation or warranty, express or implied, as to, and does not accept any responsibility or liability with respect to, the fairness, accuracy, completeness or correctness of any information or opinions contained herein. The information contained in this presentation, unless otherwise specified is only current as of the date of this presentation.
Legal disclaimer