2d inversion of magnetotelluric data for imaging the...
TRANSCRIPT

2D inversion of Magnetotelluric Data for Imaging the Subsurface Geological Structures Derived from
Magnetotelluric Soundings
Behrooz Oskooi*, Masoud Ansari*
* Institute of Geophysics, University of Tehran Tehran, Iran. P.O.Box: 14155-6466
[email protected], [email protected]
Abstract
During year 2006 wide frequency range magnetotelluric measurements was carried
out at the western part of Arak city in Iran to understand the crustal electrical
conductivity of the region by putting emphasis on relocating the fault zones. The
electric and magnetic field components were acquired from along a profile across the
geological trend at 15 stations. A robust single site processing followed by the
inversion and one dimensional as well as two dimensional modeling was performed.
The inversion results revealed electrical conductivity structures in good correlation
with geological features. As significant results, true locations of two major faults,
Talkhab and Tabarteh Faults, were recognized in Arak area.
Keywords: Magnetotellurics, geoelectrical resistivity, Talkhab Fault, Arak, Iran.
1. Introduction
Because of the reflection and refraction of EM waves at vertical interfaces
separating media of different electrical parameters, geoelectromagnetic methods have
been developed and employed to recognize the fault zones in many regions. Due to its
lateral resolution and also greater depth penetration MT method is one of the effective
electromagnetic techniques to electrically image the subsurface structures.
22. Kolloquium Elektromagnetische Tiefenforschung, Hotel Maxičky, Děčín, Czech Republic, October 1-5, 2007 302
Magnetotelluric (MT) transfer functions are calculated from measurements of
horizontal electric and magnetic fields at the surface of the earth and could image the
subsurface electrical resistivity in Arak area located in west central Iran (Fig. 1).
From the tectonostructure point of view the area of study is in the west of two NW-
SE compressional strike-slip fault systems which are located in the border of the
Central-Iran and Sanandaj-Sirjan zones. The faults are hidden under Quaternary
alluviums. The seismicity of the area is controlled by these two parallel faults,
especially Talkhab Fault which is the source of the slight seismicity of the region.
Small magnitudes earthquakes on these long faults suggest an ambiguity in that; these
faults are capable of producing great earthquakes. There are great numbers of
earthquakes occurred in this area with ambiguous seismicity characteristics. The
recurrence intervals of these faults are so long that can not be determined by
instrumental seismicity. Therefore, identifying the characteristics of these faults must
be dealt with first degree priority.
In this paper we present a case study of magnetotelluric survey conducted in 15
stations with site spacing varying from 5 to 10 kilometers to image the subsurface
structures related to fault zones in Arak area.
2. Geological setting
The area of study is a part of Arak watershed located in the two Central-Iran and
Sanandaj-Sirjan Zones. A simplified geological map of Arak area is shown in Fig. 1.
The presence of folded mountains and pressure ridges are the main characteristics of
this region. Two parallel faults named Talkhab and Tabarteh Faults pass through the
region and divide it in to three blocks. These blocks are “Ashtian-Naragh” (ANB),
“Haftad-Gholeh” (HGB) and “Sanandaj-Sirjan” Blocks (SSB). The Talkhab Fault
separates ANB from HGB while Tabarteh Fault separates HGB from SSB. The
amount of water discharge in HGB, SSB and ANB are different and decrease
respectively. Talkhab and Tabarteh Faults control the seismicity of the region.
Talkhab spring, travertine and the emanation of gas from some wells are the reasons
indicating the activity of Talkhab Fault in Quternary. Statistical analysis regarding the
hypocenters of earthquakes shows that most of the events are located near Talkhab
Fault. The oldest block in this region is SSB which involves crystallized limestones,
slates from the Jurassic to cretaceous period that underwent faulting and
22. Kolloquium Elektromagnetische Tiefenforschung, Hotel Maxičky, Děčín, Czech Republic, October 1-5, 2007 303
metamorphism without any volcanic activity. The HGB contains shale, Jurassic
sandstones and cretaceous limestone with no metamorphism but severely folded and
has a sequence of anticline and syncline without any volcanism.
3.Methodology
Magnetotelluric method is a passive electromagnetic technique that uses the
natural, time varying electric and magnetic fields components measured at right
angles at the surface of the earth to make inferences about the earth’s electrical
structure which, in turn, can be related to the geology tectonics and subsurface
conditions. The depth of investigation of MT method is much higher than that of other
electromagnetic methods. Measurements of the horizontal components of the natural
electromagnetic field are used to construct the full complex impedance tensor, Z, as a
function of frequency,
���
����
��
yyyx
xyxx
ZZZZ
Z
(1)
The principal values of the tensor Z are two complex quantities which expressed
in terms of rotational invariants, and, hence are independent of the direction of the
axes (Berdichevsky and Dimitriev, 2002). For a D1 structure in which the resistivity
of the earth varies only with depth, the diagonal elements of above matrix are equal to
zero, whilst the off-diagonal components are equal in magnitude and have apposite
signs. In a D2 case, wherein X or Y are aligned along the geoelectric strike, the
diagonal element of Z would be zero again. We can define the geometric mean of
this principal values as effective impedance which is a simplest approximation of the
Tikhonov-Cagniard impedance,
yxxyyyxxDET ZZZZZ �� effZ (2)
The advantage of using determinant data is that it provides a useful average of the
impedance for all current directions. Furthermore, it is unique and independent of the
strike direction. Using the effective impedance, determinant apparent resistivities and
phases are computed and used for the inversion.
4. Data processing and analysis of the MT data
22. Kolloquium Elektromagnetische Tiefenforschung, Hotel Maxičky, Děčín, Czech Republic, October 1-5, 2007 304
Time series measurements collected and cross power spectra computed to estimate
the impedance tensor as a function of frequency. MT data were processed using a
processing code from Smirnov (2003) aiming at a robust single site estimates of
electromagnetic transfer function. As the area of measurements is populated and close
to cultural noise sources, the recorded data were not with good quality which justify
the low coherency between electric and magnetic channels. The parameter Swift's
(1967) skew which is called a measure of asymmetry of a medium (Berdichevsky and
Dimitriev, 2002) showed us dominant 1D and/or 2D structures in the area (Fig. 2).
Swift's Skew values for the majority of sites are generally below 0.2. Some signatures
of 3D effects are disturbing our modeling which could not be avoided due to lack of a
3D code at our disposal.
5. Inversion
5.1. One-dimensional inversion
One-dimensional (1D) inversion of the data carried out showing a good fit between
the measured data and the responses of the models. Generally speaking the better the
fit between measured and predicted data result in better resolution for model. We
performed 1D inversion of the determinant data using a code from Pedersen (2004)
for all sites. The resistivity model at site 2, located at the northeastern end of the
profile, together with data and model responses is shown in Fig. 3. A transition from a
less resistive formation (about 150 �m) at surface to a moderately resistive structure
(about 500 �m) at 1500 m depth is resolved. By 10 km depth a consequence of
conductive-resistive-conductive structure is provided by the 1D model.
5.2. Two-dimensional inversion
Regardless of the true dimensionality it is practicable to earn an overview of the
subsurface resistivity with 1D inversion of MT data and actually, inversion of
rotationally invariant data like the determinant data. Based on the results of the 1D
inversion, a reasonable starting model and strategy can be constructed for two-
dimensional (2D) inversion. Since the quality of the determinant data was acceptable,
22. Kolloquium Elektromagnetische Tiefenforschung, Hotel Maxičky, Děčín, Czech Republic, October 1-5, 2007 305
we performed 2D inversions of determinant data using a code from Siripunvaraporn
and Egbert (2000).
Due to relief topography compared with the depth of investigation, a flat
topography is assumed. The final model, data, model responses and the residuals are
shown in Fig. 4. Along with the profile at sites 1, 2, 3 and 4 a high resistive structure
is resolved which corresponds to the red conglomerate (shown in Fig. 1 in red). A low
resistive zone at the location of site 5 is a good signature of Quaternary clay
formation. The data from site 6 is not involved in the inversion due to bad quality.
Site 7 which is located on Talkhab fault shows a resistive thin layer at the surface
which converts to a less resistive body towards the deeper parts of the ground. Site 8
is located on a resistive body which most probably is missed to be located on the
geological map of Fig. 1. Site 9 at the border of the clay and limestone formations
show a conductor from surface to the depth of a few kilometers. We measure this
location as a probable hidden fault. Patches of limestone with clay at sites 10 and 11
show an intermediate resistivity structure. Site 12 located on Talkhab fault clearly
shows a conductive zone spreading down to 3-4 km depth. At sites 13 to 15 again
more resistive formations of garvel fans and travertine appeared.
6. Conclusions
The magnetotelluric technique is an influential method for recognizing fault zones.
The case study presented here proved the efficiency of this method and the geological
structures and formations are well recognized by interpretation of the MT data.
Highly resistive formations like conglomerate and limestone, a clay formation and
two major fault zones were resolved along the profile. The 2D model significantly
illustrate two highly conductive zones hidden under the Quaternary alluviums.
As significant results, in collaboration with geological information about the
presence of Talkhab and Tabarteh faults the conductivity features can be attributed to
the faults. Besides, a probable hidden fault is also recognizable.
7. Acknowledgment
We wish to place on record our thanks to professor Laust Pedersen from Uppsala
University in Sweden for lending us the MTU2000 systems. The last version of the
22. Kolloquium Elektromagnetische Tiefenforschung, Hotel Maxičky, Děčín, Czech Republic, October 1-5, 2007 306

processing software from Maxim Smirnov is also appreciated. We particularly
acknowledge Arash Mansoori and Alireza Babaii for great helps both in field and
processing works. We also would like to thank Dr. Mirzaie from Arak University for
partial supports and providing facilities in the field. The Research Council of the
University of Tehran is acknowledge for financial supports as well.
8. References
Berdichevsky, M., and Dmitriev, V., 2002, Magnetotelluric in the context of the
theory of ill posed problems: 12.2 Magnetotelluric in exploration for oil and gas,
edited by Keller, G.V., published by Society of Exploration Geophysicists.
Pedersen, L.B., Engels, M., 2005. Routine 2D inversion of magnetotelluric data using
the determinant of the impedance tensor. Geophysics 70, G33-G41.
Siripunvaraporn, W. and Egbert, G.: 2000, 'An Efficient Data-Subspace Inversion
Method for 2-D Magnetotelluric Data', Geophysics 65, 791-803.
Smirnov, M. Yu., 2003, Magnetotelluric data processing with a robust statistical
procedure having a high breakdown point. Geophys. J. Int. 152, 1-7.
Swift, C. M., 1967, A magnetotelluric investigation of electrical conductivity anomaly
in the southwestern United States, PhD Thesis Massachusetts Institute of Technology,
Cambridge, MA.
22. Kolloquium Elektromagnetische Tiefenforschung, Hotel Maxičky, Děčín, Czech Republic, October 1-5, 2007 307

Clay flat (clay and silt).
Talkhab Fault
Cre
tace
ous
Light grey,Globotruncana-bearing marl.
Grey, sandy, glauconitic limestone.
Limestone with Orbitolina and Rudist.
Red conglomerate, sandstone, dolomitic sandstone and dolomite
Recent alluvium.
Young terraces and lower gravel fans (Dasht).
Old terraces and higher gravel fans.
Travertine.
Qua
tern
ary
340 00'
340 30'
490 45' 500 00' 500 30'500 15'
Fig.1. A simplified geological map of Arak and adjacent areas illustrating the major geologic and tectonic features. Location of the MT sites and Talkhab and Tabarteh faults are also shown on the map.
Tabarteh Fault
22. Kolloquium Elektromagnetische Tiefenforschung, Hotel Maxičky, Děčín, Czech Republic, October 1-5, 2007 308

Fig. 2. Swift’s skew values for some sites along MT-profile.
(b) (a)
(c)
Fig.3. Data-fit and the 1D model of the data from site S2. (a) Apparent resistivity, (b) Phase and (c) 1D model.
Rho (ohmm)
22. Kolloquium Elektromagnetische Tiefenforschung, Hotel Maxičky, Děčín, Czech Republic, October 1-5, 2007 309
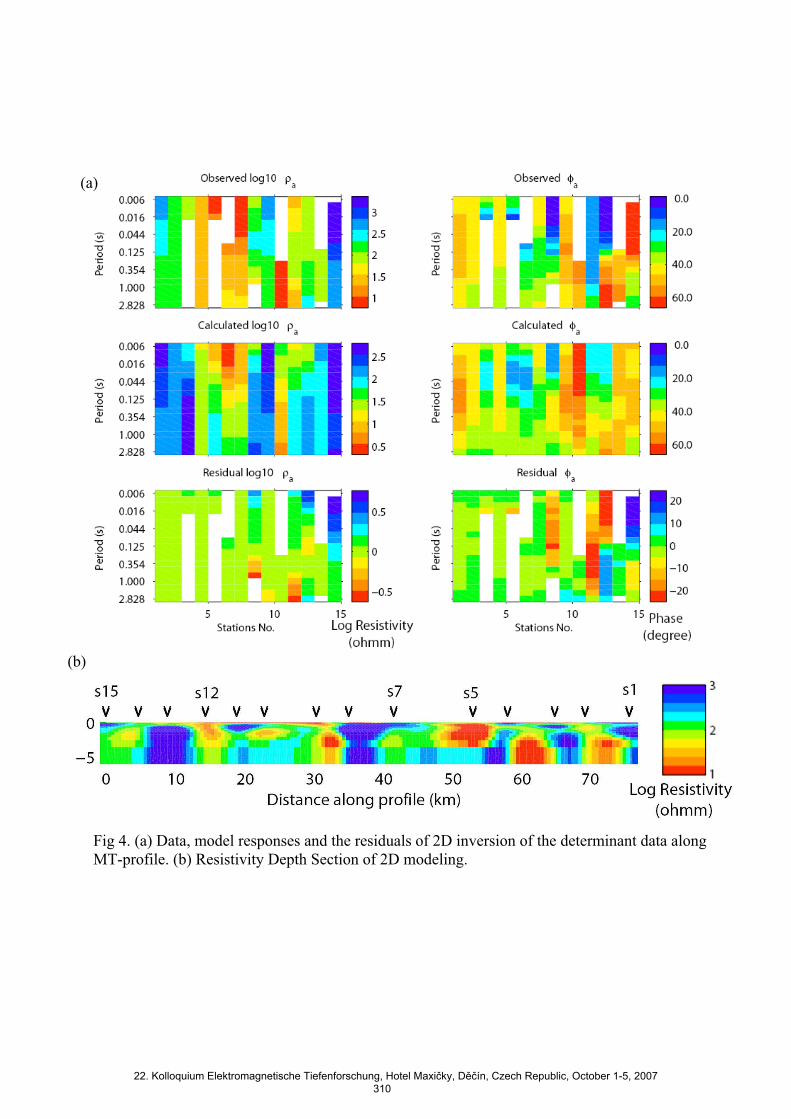
Fig 4. (a) Data, model responses and the residuals of 2D inversion of the determinant data along MT-profile. (b) Resistivity Depth Section of 2D modeling.
)a(
)b(
22. Kolloquium Elektromagnetische Tiefenforschung, Hotel Maxičky, Děčín, Czech Republic, October 1-5, 2007 310