29 october census 2011 release p0301.4 28 oct 2012 joey ak final from
TRANSCRIPT


Statistical release P0301.4
Census 2011
Embargoed until:30 October 2012
10:00 Enquiries:
Angela Ngyende Tel. (012) 310 4699

Statistics South Africa P0301.4
Census 2011 Statistical release – P0301.4
Census 2011 Statistical release – P0301.4 / Statistics South Africa Published by Statistics South Africa, Private Bag X44, Pretoria 0001 © Statistics South Africa, 2012 Users may apply or process this data, provided Statistics South Africa (Stats SA) is acknowledged as the original source of the data; that it is specified that the application and/or analysis is the result of the user's independent processing of the data; and that neither the basic data nor any reprocessed version or application thereof may be sold or offered for sale in any form whatsoever without prior permission from Stats SA. Stats SA Library Cataloguing-in-Publication (CIP) Data Census 2011 Statistical release – P0301.4 / Statistics South Africa. Pretoria: Statistics South Africa, 2012 83 pp A complete set of Stats SA publications is available at Stats SA Library and the following libraries:
National Library of South Africa, Pretoria Division National Library of South Africa, Cape Town Division Library of Parliament, Cape Town Bloemfontein Public Library Natal Society Library, Pietermaritzburg Johannesburg Public Library Eastern Cape Library Services, King William’s Town Central Regional Library, Polokwane Central Reference Library, Nelspruit Central Reference Collection, Kimberley Central Reference Library, Mmabatho
This publication is available on the Stats SA website: www.statssa.gov.za For technical enquiries please contact: Calvin Molongoana Tel: 012 310 4754 Fax: 012 310 4865 Email: [email protected] For dissemination enquiries please contact Printing and Distribution, Statistics South Africa Ina du Plessis Email: [email protected]

Statistics South Africa P0301.4
Census 2011 Statistical release – P0301.4
ii
Cautionary notes Data
- Comparison of Census 2011 and previous Censuses requires alignment of data to 2011 municipal boundaries
Disability
- Questions on disability were replaced by General health and functioning questions. Due to change in question, 2011 results are not comparable with previous Censuses 1996 and 2001.
- Due to misreporting on general health and functioning questions for children younger than five years, data on this variable are only profiled for persons five years and older.
Labour statistics (employment)
- Quarterly Labour Force Survey (QLFS) remains the official source of labour statistics - The QLFS_Q4: 2011 has not been benchmarked to Census 2011 figures and the differences between the
two are therefore only broadly indicative - Boundaries - provincial trends over time are difficult to establish due to changes in boundaries
o Census is a de facto measure of the population; while QLFS survey is a de jure measure. o The reference period in Census (Census night) is fixed while it is a moving reference period over
three months for QLFS
- Formal and informal sector: o An objective measure is used in the QLFS based on vat/income tax registration and establishment
size, a subjective measure is used in Census 2011. Also, in line with ILO guidelines, persons employed in agriculture and private households are not usually included in the formal and informal sectors, but are identified as separate categories. It is not currently possible to identify agricultural employment in Census 2011, since the coding of industry and occupation has not yet been completed. Sectoral distributions therefore include persons employed in agriculture. And with regards to persons employed in private households, the results are not based on the relevant questions that determine the international classification for industry but instead are based on the question which determines the sector in which respondents were employed. Thus, after coding is completed the numbers may change.
Rounding off
Due to rounding, the displayed totals in the tables do not always match the sum of the displayed rows or columns
Statistics South Africa P0301.4
Census 2011 Statistical release – P0301.4
iii
Contents Contents....................................................................................................................................................................... iii
1. INTRODUCTION ..................................................................................................................................................1
1.1 Overview .......................................................................................................................................................1
1.2 How the count was done ..............................................................................................................................1
1.2.1 Planning ................................................................................................................................................1
1.2.2 Pre-enumeration ...................................................................................................................................1
1.2.3 Enumeration..........................................................................................................................................1
1.2.4 Data processing ....................................................................................................................................2
1.2.5 Data editing and validation system.......................................................................................................2
1.2.5.1 Editing team ..................................................................................................................................2
1.2.5.2 Role of the team............................................................................................................................2
1.2.5.3 Editing strategy for Census 2011..................................................................................................3
1.2.6 Independent monitoring and evaluation of Census field activities........................................................3
1.2.7 Post-enumeration survey (PES) ...........................................................................................................3
1.2.7.1 Preparations for the PES.....................................................................................................................4
1.2.7.2 Methodology .................................................................................................................................4
1.2.7.3 Sampling .......................................................................................................................................5
1.2.7.4 Questionnaire development..........................................................................................................5
1.2.7.5 Fieldwork methodology.................................................................................................................5
1.2.7.6 Matching and reconciliation methodology.....................................................................................5
1.2.7.7 PES data collection.......................................................................................................................6
1.2.7.8 Matching and reconciliation ..........................................................................................................6
1.2.7.9 Estimation and tabulation..............................................................................................................7
1.2.8 Conclusion ................................................................................................................................................8
2. GEOGRAPHY OF SOUTH AFRICA ....................................................................................................................9
2.1 Provincial boundary changes: 2001 to 2011 ................................................................................................9
2.2 Local municipal boundary changes, 2001–2011 ........................................................................................11
2.3 Comparing Census 2011 with previous Censuses.....................................................................................13
3. FINDINGS...........................................................................................................................................................14
3.1 Demographic characteristics ......................................................................................................................14
3.1.1 Introduction .........................................................................................................................................14
3.1.2 Population size....................................................................................................................................14
3.2 Population composition...............................................................................................................................17
3.3 Sex ratio......................................................................................................................................................17
3.4 Median age .................................................................................................................................................20
3.5 Population structure ....................................................................................................................................21
3.6 Concluding remarks ....................................................................................................................................22
3.7 Migration .....................................................................................................................................................22
3.7.1 Introduction .........................................................................................................................................22
3.7.2 Patterns of migration between Censuses 2001 and 2011..................................................................22

Statistics South Africa P0301.4
Census 2011 Statistical release – P0301.4
iv
3.7.3 Life-time migration patterns ................................................................................................................24
3.8 Citizenship ..................................................................................................................................................26
3.9 Education ....................................................................................................................................................26
3.9.1 Introduction .........................................................................................................................................26
3.9.2 Attendance at an educational institution.............................................................................................27
3.10 Average annual household income ............................................................................................................38
3.11 General health and functioning...................................................................................................................41
3.11.1 Introduction .........................................................................................................................................41
3.12 Labour market status ..................................................................................................................................44
3.12.1 The labour market in South Africa ......................................................................................................44
3.12.1.1 Introduction ................................................................................................................................44
3.12.1.2 National labour market results from Census 2011 and the QLFS_Q4:2011..............................45
3.12.1.3 Provincial labour market rates based on Census 2011 and QLFS_Q4:2011.............................46
3.12.1.4 Key labour market rates by population group, based on Census 2011......................................47
3.12.1.5 Key labour market rates by sex and population group, based on Census 2011........................48
3.12.1.6 Key labour market rates by age group based on Census 2011 .................................................50
3.13 Conclusion ..................................................................................................................................................51
3.14 Housing.......................................................................................................................................................52
3.14.1 Introduction .........................................................................................................................................52
3.15 Conclusion ..................................................................................................................................................64
3.16 Mortality data: Household deaths ...............................................................................................................64
3.17 Parental survival .........................................................................................................................................73
List of maps Map 2.1: Provincial boundary changes since 2001....................................................................................................10 Map 2.2: Municipal boundary changes since 2001 ....................................................................................................12

Statistics South Africa P0301.4
Census 2011 Statistical release – P0301.4
1
1. INTRODUCTION
1.1 Overview
Censuses are principal means of collecting basic population and housing statistics required for social and economic development, policy interventions, their implementation and evaluation. South Africa has conducted three Censuses (1996, 2001 and 2011). Census 2011 was the third Census to be conducted since the post democratic elections in 1994 and a number of population and household attributes were measured and variety of indicators generated. This chapter provides profiles results on all Census topics; demographics, migration, education, general health and functioning, labour force, mortality, and households.
1.2 How the count was done
Census 2011 was conducted from 9th to 31st October 2011. This section focuses on the various activities that were carried out prior to the finalisation of the results. They can be summarised as follows: Planning, Pre-enumeration, Enumeration, Processing and Editing.
1.2.1 Planning
This process involved the development of the overall strategy, the structure for the project, component plans and budget. These processes were started in 2003 and were subsequently reviewed in 2008, after the completion of the Community Survey (CS) in 2007. Methodologies and procedures were then developed and tested in a form of mini tests and pilot in 2008 and 2009 respectively. The findings from these tests helped to refine the plans and methods for the final test in 2010 called the “Dress Rehearsal”. The latter was expected to be a replica of how the actual count was to be conducted in 2011, and therefore the timing had to be the same month as the main Census, i.e. October month.
1.2.2 Pre-enumeration
The pre-enumeration phase mainly involved the final preparatory work before the actual count. It started with mass production of Census instruments like questionnaires, manuals, field gear etc. The phase also involved acquisition of satellite offices required in the districts, recruitment of the 1st level of field management staff (District Census Coordinators - 130 DCCs) and Field work Co-ordinators – 6 000 FWCs. These groups of people were then given intense training based on their key performance areas. At the same time the country was being sub-divided into small pockets called enumeration areas (EAs); the underlying principle for this sub-division is that an EA should be within reach of a Fieldworker and all households in that EA can be covered within the allocated number of days. This process yielded 103 576 EAs. The other benefit for this sub-division is the finalisation of the distribution plan of all materials required in the provinces and districts. It also gives a better estimate of the number of field staff to recruit for the count. The pre-enumeration phase involved over 7 000 staff.
1.2.3 Enumeration
The enumeration phase, started with the training of supervisors as listers. Each person had to list all dwellings within an EA and had a minimum of 4 EAs to cover. These areas were called supervisory units. As they were listing, they were also expected to publicise the activities of the Census within their supervisory units. Upon completion of listing, final adjustments of workload and number of enumerators required were finalised. Training of enumerators started in earnest, and it mainly covered how to complete the questionnaire and to read a map. The latter was to aid them to identify the boundaries of their assigned areas. An enumerator was also given a few days before the start of the count to update their orientation book with any developments that might have happened since listing, as well as introduce themselves to the communities they were to work with, through posters bearing their photos and special identification cards. On the night of the 9th October the actual count started with the homeless and special institutions given special attention. The enumeration phase was undertaken by an army of field staff in excess of 160 000, inclusive of management.
Statistics South Africa P0301.4
Census 2011 Statistical release – P0301.4
2
1.2.4 Data processing
The processing of over 15 million questionnaires commenced in January 2012, immediately after the completion of the reverse logistics in December 2011. Each box and its contents were assigned a store location in the processing centre via a store management system. Each time a box was required for any process it was called through this system. The processing phase was sub-divided in the following processes: primary preparation - where all completed questionnaires were grouped into clusters of 25 and the spine of the questionnaire cut off. Secondary preparation - where questionnaires were finally prepared for scanning, by removing foreign materials in between pages and ensure that all pages are loose. Scanning - questionnaires were put through a scanner to create an electronic image. Finally Tilling and completion - where any unrecognised reading/ badly-read image by the scanner had to be verified by a data capturer. This process took 8 months. Over 2 000 data processors working 3 shifts per day were employed for this phase to ensure that 225 million single pages are accounted for.
1.2.5 Data editing and validation system
The execution of each phase of Census operations introduces some form of errors in Census data. Despite quality assurance methodologies embedded in all the phases; data collection, data capturing (both manual and automated), coding, and editing, a number of errors creep in and distort the collected information. To promote consistency and improve on data quality, editing is a paramount phase in identifying and minimising errors such as invalid values, inconsistent entries or unknown/missing values. The editing process for Census 2011 was based on defined rules (specifications).
The editing of Census 2011 data involved a number of sequential processes: selection of members of the editing team, review of Census 2001 and 2007 Community Survey editing specifications, development of editing specifications for the Census 2011 pre-tests (2009 pilot and 2010 Dress Rehearsal), development of firewall editing specifications and finalisation of specifications for the main Census.
1.2.5.1 Editing team
The Census 2011 editing team was drawn from various divisions of the organisation based on skills and experience in data editing. The team thus composed of subject matter specialists (demographers and programmers), managers as well as data processors.
Census 2011 editing team was drawn from various divisions of the organization based on skills and experience in data editing. The team thus composed of subject matter specialists (demographers and programmers), managers as well as data processors
1.2.5.2 Role of the team
Among other Census activities, editing team roles and responsibilities included:
• Establishment of editing plan/schedule • Formulation and application of clear and concise editing specifications • Validation of Census data using other data sources • Ensuring of consistency of editing rules between Censuses (2001 and 2011) where applicable • Provision of imputation flags and rates • Identification of errors and provide corrections where possible • Review and refinement of the edit specifications based on edit trail evaluations, cross tabulations, and
comparison of Census data with other datasets • Testing the specifications before confirming and applying them
Editing specification process commenced with activities relating to review of existing editing specifications guidelines. Census 2001 specifications as well as Community Survey 2007 survey specifications and UN handbook on Census editing were reviewed to form the basis of the specifications.

Statistics South Africa P0301.4
Census 2011 Statistical release – P0301.4
3
1.2.5.3 Editing strategy for Census 2011
The Census 2011 questionnaire was very complex, characterised by many sections, interlinked questions and skipping instructions. Editing of such complex, interlinked data items required application of a combination of editing techniques. Errors relating to structure were resolved using structural query language (SQL) in Oracle dataset. CSPro software was used to resolve content related errors. The strategy used for Census 2011 data editing was implementation of automated error detection and correction with minimal changes. Combinations of logical and dynamic imputation were used. Logical imputations were preferred, and in many cases substantial effort was undertaken to deduce a consistent value based on the rest of the household’s information. To profile the extent of changes in the dataset and assess the effects of imputation, a set of imputation flags are included in the edited dataset. Imputation flags values include the following:
Census 2011 questionnaire was very complex, characterized by many sections, interlinked questions and skipping instructions. Editing of such complex, interlinked data items required application of a combination of editing techniques. Errors relating to structure were resolved using structural query language (SQL) in Oracle dataset. CSPro software was used to resolve content related errors. The strategy for Census 2011 data editing was implementation of automated error detection and correction with minimal changes. Combinations of logical and dynamic imputation were used. Logical imputations were preferred, and in many cases substantial effort was undertaken to deduce a consistent value based on the rest of the household’s information. To profile the extent of changes in the dataset and assess the effects of imputation, a set of imputation flags are included in the edited dataset. Imputation flags values include the following:
0 no imputation was performed; raw data were preserved
1 Logical editing was performed, raw data were blank
2 logical editing was performed, raw data were not blank
3 hot-deck imputation was performed, raw data were blank
4 hot-deck imputation was performed, raw data were not blank
1.2.6 Independent monitoring and evaluation of Census field activities
Independent monitoring of the Census 2011 field activities was carried out by a team of 31 professionals and 381 Monitoring and Evaluation Monitors from Monitoring and Evaluation division. These included field training, publicity, listing and enumeration. This was to make sure that the activities were implemented according to the plans and have independent reports on the same. They also conducted Census 2011 and the Post Enumeration Survey (PES) Verification studies to identify the out-of-scope cases within Census (a sample of 7 220 EAs) and the PES sample (600 EAs) as reported in the Census 2011 PES EA Summary Books.
1.2.7 Post-enumeration survey (PES)
A post-enumeration survey (PES) is an independent sample survey that is conducted immediately after the completion of Census enumeration in order to evaluate the coverage and content errors of the Census. The PES for Census 2011 was undertaken shortly after the completion of Census enumeration, from November to December 2011, in approximately 600 enumeration areas (EAs) (which later increased to 608 due to subdivision of large EAs). The main goal of the PES was to collect high quality data that would be compared with Census data in order to determine how many people were missed in the Census and how many were counted more than once.
A population Census is a massive exercise, and while every effort is made to collect information on all individuals in the country, including the implementation of quality assurance measures, it is inevitable that some people will be missed and some will be counted more than once. A PES assists in identifying the following types of errors:

Statistics South Africa P0301.4
Census 2011 Statistical release – P0301.4
4
• Coverage error: this includes both erroneous omissions (e.g. a household that was not enumerated) and erroneous inclusions (e.g. a household that moved into the enumeration area (EA) after Census but was still enumerated, or a household that was enumerated more than once).
• Content error: this refers to the errors on the reported characteristics of the people or households enumerated during Census.
The errors may emanate from the following reasons:
• Failure to account for all inhabited areas in the EA frame; • EA boundary problems; • Incomplete listing of structures and failure to identify all dwellings within an EA; • Failure to enumerate/visit all listed dwellings within an EA; • Failure to identify all households within a dwelling unit in instances whereby a dwelling unit has more than
one household; • Failure to enumerate households (complete questionnaires) for all households due to refusals, unreturned
questionnaires for self-enumeration, inability to contact households, etc); • Failure to include all individuals within households; • Failure to observe the inclusion rule based on a person’s presence on Census night (i.e. failure to apply the
de facto rule accurately); and • Lost questionnaires or damaged questionnaires that could not be processed.
Usually more people are missed during a Census, so the Census count of the population is lower than the true population. This difference is called net undercount. Rates of net undercount can vary significantly for different population groups depending on factors such as sex, age and geographic location. Stats SA obtains estimates of the net undercount, including the type and extent of content errors (reported characteristics of persons and households enumerated in the Census) using information collected through the PES.
1.2.7.1 Preparations for the PES
Planning involved the development of documents outlining the goal and objectives of the PES, timelines of the project, identification of resources (financial, human and otherwise) required for implementing the project, and the development of methodology documents. Timelines for the PES were synchronised with those of Census to ensure the relevance of the project, and adhered to international best practice for maintaining a closed population between Census and PES data collection, i.e. it should be carried out within a few months, preferably within six (6) months, after the completion of Census fieldwork to ensure that the impact of natural population changes, such as births, deaths and migration, as well as lapses in respondent recall do not complicate the exercise. Activities of the PES included the following:
• Sampling: sample design and selection; • Development of data collection methodologies: methods and procedures for data collection (publicity, listing
and enumeration), including quality control measures applied during data collection; • Development of matching and reconciliation procedures and systems: guidelines for matching, including
rules for determining the match status of households and individuals, as well as computer-based system for capturing household and person records for matching purposes;
• Questionnaire development: selection of data items which allowed measurement of coverage and content, including layout design and printing of questionnaire;
• Data collection: publicity, listing and enumeration of households in selected enumeration areas (EAs); • Matching and reconciliation: office matching (comparison) of Census and PES household and person
records, and revisits to households in order to confirm or get more information that might assist in matching unresolved cases; and
• Analysis and reporting: compilation of tables and report on PES results.
1.2.7.2 Methodology
The PES is an independent survey that replicates the Census in sampled enumeration areas (EAs). The major assumption used in the PES is that the Census and the PES are independent, the estimate of the percentage

Statistics South Africa P0301.4
Census 2011 Statistical release – P0301.4
5
missed by the PES but found by the Census, and the percentage missed by the Census but found by the PES, can be used to construct estimates of the percentage missed by both PES and Census. The PES sought to estimate the total number of persons and households in housing units on the night of 09–10 October 2011 (Census night). The units of observation were the persons who spent the Census night and/or the PES night in these living quarters.
1.2.7.3 Sampling
The sampling frame for the PES was the complete list of Census 2011 EAs, amounting to 103 576 EAs. The primary sampling units (PSUs) were the Census EAs. The principle for selecting the PES sample is that the EA boundaries for sampled EAs should have well defined boundaries, and these boundaries should correspond with those of Census EAs to allow for item-by-item comparison between the Census and PES records. The stratification and sampling process followed will allow for the provision of estimates at national, provincial, urban (geography type = urban) and non-urban (geography type = farm and traditional) levels, but estimates will only be reliable at national and provincial levels. The sample of 600 EAs was selected and allocated to the provinces based on expected standard errors which were based on those obtained in PES 2001. Populations in institutions (other than Workers’ Hostels), floating and homeless individuals were excluded from the PES sample.
1.2.7.4 Questionnaire development
The approach to questionnaire design focused on capturing the main elements for measuring coverage and content errors. Only a few elements from the Census 2011 questionnaire which were not likely to change within a short period (that is between the Census and the PES reference nights) were retained. The questionnaire allowed for the classification of each listed person as ‘non-mover’, ‘in-mover’, ‘out-mover’, or ‘out-of-scope’, with regard to their household presence status on Census night (09–10 October 2011). The data items for the PES questionnaire included first name and surname, date of birth, age, sex, population group and presence of person in dwelling unit on Census and/or PES night.
1.2.7.5 Fieldwork methodology
The PES replicated the Census in the sampled EAs, which meant that all methodologies and procedures for data collection were based on Census methodologies and procedures. PES fieldwork was split into the following three (3) phases; publicity and listing, enumeration and mop-up operations.
• Publicity and listing were conducted at the same time. Publicity focused on informing and educating respondents and relevant stakeholders about the purpose of the PES to ensure successful coverage of all dwelling units (DUs) in selected EAs. Listing involved the recording of all structures (including all DUs, number of households in DUs and number of persons in households) in the sampled EAs in the EA Summary Books.
• Enumeration involved interviewing respondents and recording responses in the fields provided in the PES questionnaire. Self-enumeration for the PES was discouraged, but was used in instances where the respondent insisted on self-enumeration.
• Mop-up operations were conducted in the form of follow-up visits by senior field staff to households that could not be contacted during the enumeration period.
1.2.7.6 Matching and reconciliation methodology
The matching exercise involved the comparison of household and person records in Census data and PES data. A two-way case-by-case matching was conducted using the two sources: PES questionnaires and Census questionnaires. Reconciliation visits were conducted in order to confirm or get more information that would assist in matching unresolved cases, i.e. households or individuals enumerated in the Census that did not correspond with households or individuals enumerated in the PES. Guidelines for matching, including rules for determining the match status of households and individuals, were developed. A computer-assisted manual matching system was developed for the capturing of data for matching purposes.

Statistics South Africa P0301.4
Census 2011 Statistical release – P0301.4
6
1.2.7.7 PES data collection
PES data collection commenced immediately after the completion of Census fieldwork. The PES is a much smaller scale operation (and hence easier to control) than the Census. These features enable the PES to deliver a more accurate estimate of the percentage of people and dwellings missed by the Census. PES data collection (field operations) was independent from Census operations and the following measures were taken to maintain the operational independence of the PES:
• independent listing of enumeration areas (EAs) in the PES sample; • using separate/independent office staff in the PES and Census where possible; • ensuring the PES interviewers were not employed as Census field staff in the same area, and vice versa;
and • maintaining the confidentiality of the PES sample so that Census field and office staff were not aware which
areas are included in the PES.
Temporary personnel (Fieldworkers and Fieldwork Supervisors) were recruited from the EAs/districts in which they would be working and underwent rigorous training on fieldwork procedures to ensure that they deliver work of high quality at the end of the fieldwork phase. Experienced permanent staff from Household Surveys (based in provincial offices) was seconded to the project for the duration of data collection in supervisory positions to ensure high quality data and minimise costs. The PES followed the integrated approach towards fieldwork; whereby 1 Fieldworker conducted publicity, listing and enumeration in 1 EA. A total of 768 Fieldworkers and Fieldwork Supervisors were appointed for the collection of data in the 608 EAs (initially 600, but increased to 608 due to split EAs). A ratio of 1 Fieldwork Supervisor for four (4) Fieldworkers was applied, but due to the spread of the sample in various districts, this ratio could not always be applied.
1.2.7.8 Matching and reconciliation
The matching process involved the comparison of household and person records in Census data and PES data. The main phases in the matching process were:
• Initial matching involved searching through the Census records in order to find the corresponding cases from the PES enumeration records, and vice-versa (a two-way match);
• Capturing involved the capturing of PES and Census information on a capturing tool which formed part of the computer-assisted manual matching system. Information for non-matched households and persons was also captured;
• Computer-assisted matching which was the automated assigning of an initial match status for the household and persons, and persons moving status. This process was done concurrently with the capturing process. Classifications from initial matching are as follows:
1. Matched 2. possible match
Statistics South Africa P0301.4
Census 2011 Statistical release – P0301.4
7
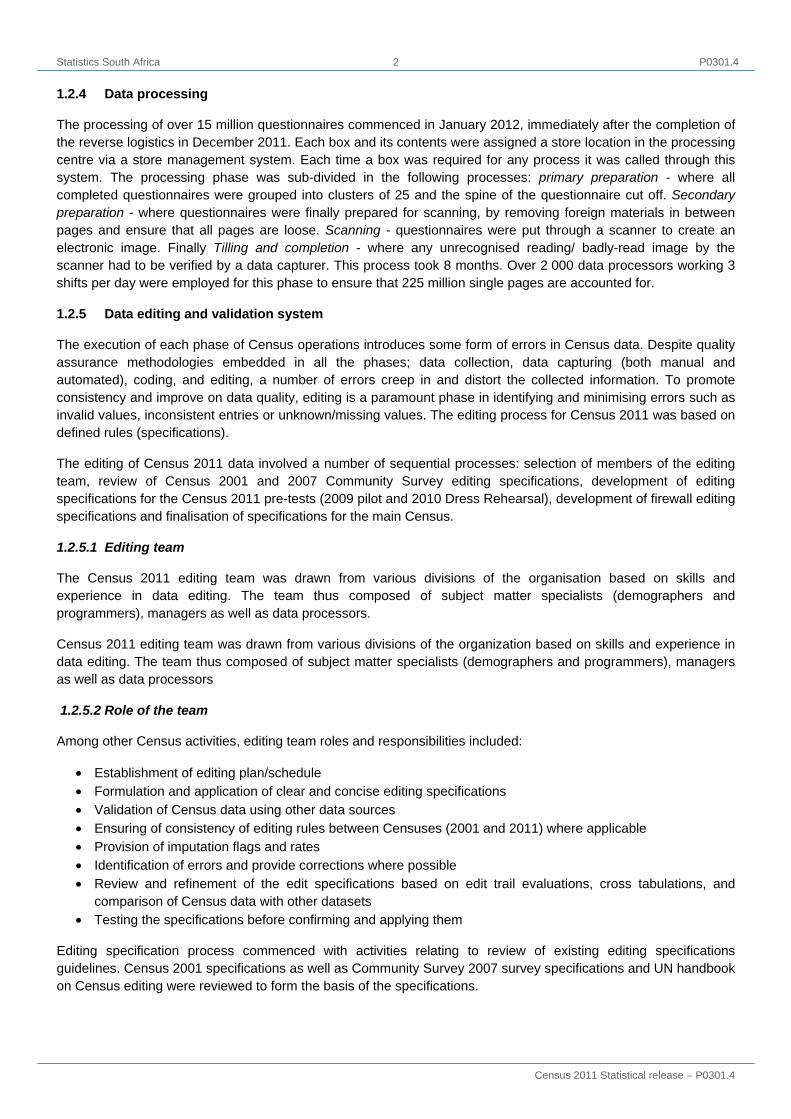
1. matched
In PES not in Census:
2. missed in Census 3. PES erroneous inclusion - cases in PES not in Census that were outside
the EA boundaries or otherwise erroneously included in PES 4. PES insufficient information - cases in PES not in Census for which a final
match status cannot be assigned due to insufficient information 5. in-mover 6. born after Census
In Census not in PES:
7. correctly enumerated in Census, missed in PES 8. Census erroneous inclusion 9. Census insufficient information – cases in Census not in PES for which a
final match status cannot be assigned due to insufficient information
In PES not in Census:
3. in PES not in Census - definite non-match 4. in PES not in Census - insufficient or unclear information 5. in-mover 6. born after Census 7. in Census not in PES;
• Reconciliation visits are follow-up visits to households in the PES sampled EAs. The purpose of reconciliation visits was to collect relevant information in order to determine the final match status of unresolved cases identified during initial matching. Cases of ‘possible match’, ‘in PES not in Census - insufficient or unclear information’, and ‘in Census not in PES’ were considered unresolved and were sent to the field for reconciliation; and
• Final matching involved the use of the results obtained from the reconciliation visits and initial matching phases to assign a definite match status to each case. The table below illustrates the outcomes from final matching.
1.2.7.9 Estimation and tabulation
Coverage measures were calculated only for cases belonging to the PES universe.
The initial estimates – weighted estimates of total from the sample include the following:
a) Estimated number of non-movers; b) Estimated number of out-movers; c) Estimated number of matched non-movers; d) Estimated number of matched out-movers; e) Estimated number on in-movers; f) Estimated number of erroneous inclusions in the Census; and g) Estimated number of correctly enumerated persons missed in the PES
Dual system estimation was used to arrive at the true population of the country. This means that two independent sources or ‘systems’ are used to arrive at the estimate of the true population: the Census and the PES. Both estimates contribute to the dual-system estimate, which is more complete than either the Census or the PES estimate alone. In the end, this true population is compared with the Census-enumerated population and the difference is the net undercount (or overcount). The following table indicates the undercount rates as estimated by the PES.

Statistics South Africa P0301.4
Census 2011 Statistical release – P0301.4
8
Net Census Coverage Error: Total and Rate by Province
Province Omission rate for
persons Omission rate for
households
Western Cape 18,6 17,8
Eastern Cape 12,9 10,3
Northern Cape 13,4 14,8
Free State 10,1 9,4
KwaZulu-Natal 16,7 16,5
North West 14,9 17,0
Gauteng 14,7 15,2
Mpumalanga 15,5 14,4
Limpopo 10,0 9,6
All provinces 14,6 14,3
The adjustment procedure consisted of creating homogeneous adjustment classes with similar coverage rates and calculating a common undercount rate, adjustment factor and adjustment figure for each class separately. The adjusted figure for the total population was obtained by summing across the adjustment classes. In addition, only the population of households received adjustment classes. The totals for the balance of the population, namely people living in collective quarters and the homeless on the streets, were not adjusted.
1.2.8 Conclusion
The 2011 Census project had its own challenges and successes, like any other massive project. Be that as it may, the following are worth mentioning; the Census fieldworkers who traverse the country to collect information from households and those that we lost in the process. The respondents who opened their doors and locked their dogs to aid the field staff to do their work, the processors who worked 24hrs/7days a week to ensure that the data can be released within a year of enumeration. The Census management team who met daily for two years to steer the project forward, the Stats SA EXCO for the leadership they provided, the Statistics Council and in particular the sub-committee on population and social statistics for their continued guidance and support and finally the Minister in the Presidency: responsible for planning for the robust interrogation of the plans and guidance on this project. It is through such concerted efforts that as a country we can and will continuously improve on our endeavours.

Statistics South Africa P0301.4
Census 2011 Statistical release – P0301.4
9
2. GEOGRAPHY OF SOUTH AFRICA
2.1 Provincial boundary changes: 2001 to 2011
A number of changes occurred in terms of provincial and municipal boundaries during the period between Censuses 2001 and 2011. Of the nine provinces, only two provinces (Western Cape and Free State) were not affected by changes. The provincial boundary changes were mostly as a result of eight cross boundary municipalities which were absorbed in full into respective provinces.
Table 2.1: Geographical land area changes since 2001
Province name Provincial code Land area in square
kilometres _2011Land area in square
kilometres 2001
Western Cape 1 129 462 129 449
Eastern Cape 2 168 966 169 954
Northern Cape 3 372 889 362 599
Free State 4 129 825 129 824
KwaZulu-Natal 5 94 361 92 305
North West 6 104 882 116 231
Gauteng 7 18 178 16 936
Mpumalanga 8 76 495 79 487
Limpopo 9 125 754 122 816
Total 1 220 813 1 219 602 The shift of the national boundary over the Indian Ocean in the North East corner of KwaZulu-Natal to cater for the Isimangaliso Wetland Park led to the increase in South Africa's
land area.

Statistics South Africa P0301.4
Census 2011 Statistical release – P0301.4
10
Map 2.1: Provincial boundary changes since 2001
Provincial boundary changes mostly affected North West (land size decreased to 11348,9 square kilometres). Most of this was absorbed by Northern Cape. The second largest decrease in land size was for Mpumalanga which decreased by 2991,9 square kilometres with Limpopo being the main recipient of this land area.
It should be noted that the increased extent of KwaZulu-Natal is not mainly based on the exchange of Umzimkulu (formerly in the Eastern Cape Province) and Matatiele (formerly in KwaZulu-Natal), but due to the shift of the national boundary over the Indian Ocean in the north east corner of the province to cater for the iSimangaliso Wetland Park. In terms of which areas moved to which province, a detailed outline is provided for below.
Northern Cape and North West:
• Ga Segonyana and Phokwane municipalities were cross boundary municipalities between Northern Cape and North West in 2001 and were allocated to Northern Cape in full based on the current provincial boundaries.
• Kagisano municipality (2001) was split into Kagisano/ Molopo municipality and Joe Morolong municipality, with the former portion now in North West and the latter now part of the Northern Cape province.
• Moshaweng municipality (now part of Joe Morolong municipality) was incorporated in full in Northern Cape based on the current provincial boundaries.

Statistics South Africa P0301.4
Census 2011 Statistical release – P0301.4
11
North West and Gauteng
• Merafong City municipality (2001) was a cross boundary local municipality between North West and Gauteng and was allocated to the Gauteng province based on the current provincial boundaries.
• West Rand (DMA) municipality (2001) was not aligned to the then provincial boundary and was absorbed into Mogale City municipality in full based on the current provincial boundaries.
• City of Tshwane Metropolitan Municipality was a cross boundary municipality between Gauteng and North West provinces. The portions adjacent to Moretele and Madibeng municipalities were allocated to Gauteng in full based on the current provincial boundaries.
North West and Limpopo:
• Limpopo lost a portion of the Bela Bela municipality to North West’s Moretele municipality. In turn North West lost a portion of the Moretele Municipality to Limpopo’s Bela Bela municipality based on the current provincial boundaries.
Gauteng and Mpumalanga:
• A portion of Delmas municipality (2001) now called Victor Kanye was allocated to the City of Tshwane in Gauteng based on the current provincial boundaries.
• Kungwini municipality, now incorporated into the City of Tshwane, was a cross boundary municipality and is now fully allocated to Gauteng, based on the current provincial boundaries.
Mpumalanga and Limpopo:
• Greater Groblersdal, now Elias Motsoaledi, Greater Marble Hall now Ephraim Mogale, and Greater Thubatse were cross boundary municipalities between Mpumalanga and Limpopo and have now been allocated in full to the Limpopo province. Ephraim Mogale municipality was absorbed into the Schuinsdraai Nature Reserve.
• Bushbuck Ridge municipality was a cross boundary municipality between Limpopo and Mpumalanga and has now been allocated in full to the Mpumalanga province. (Bushbuck Ridge also absorbed a portion of the Kruger Park cross boundary District Management Area.)
KwaZulu-Natal and Eastern Cape:
Umzimkulu, formerly in Eastern Cape, and Matatiele, formerly in KwaZulu-Natal were in effect exchanged, with Umzimkulu now being in KwaZulu-Natal and Matatiele now being in Eastern Cape based on the current provincial boundaries.
2.2 Local municipal boundary changes, 2001–2011
In 2001, the Geographical Frame consisted of 262 local municipalities. This total has been reduced to 234 local municipalities in the 2011 geographical frame. The difference of 28 municipalities is explained as follows:
In total, 25 District Management Areas (DMAs) were absorbed into the existing provinces.
• The City of Tshwane absorbed a further two municipalities (Nokeng Tsa Taemane and Kungwini). • A new municipality (Kagisano Molopo – NW379) was established by merging NW391 (Kagisano) and
NW395 (Molopo).
For municipalities, 107 municipalities decreased in geographical area while 155 municipalities had an increase in geographical area.

Statistics South Africa P0301.4
Census 2011 Statistical release – P0301.4
12
Map 2.2: Municipal boundary changes since 2001

Statistics South Africa P0301.4
Census 2011 Statistical release – P0301.4
13
Figure 2.1: Percentage distribution of land area by province, 2011
2.3 Comparing Census 2011 with previous Censuses
Comparison of Census 2011 with previous Censuses (1996 and 2001) required alignment of data for the two Censuses to 2011 municipal boundaries. This is because the country’s provincial demarcations underwent changes through a number of changes at provincial and municipal boundaries. The provincial and municipal changes are outlined below.

Statistics South Africa P0301.4
Census 2011 Statistical release – P0301.4
14
3. FINDINGS The 2011 Population and Housing Census was comprehensive, with a number of topics: demographics, migration, general health and functioning, education, parental survival status, employment, fertility, mortality and statistics on households. The section presents key findings from each of the outlined topics.
3.1 Demographic characteristics
3.1.1 Introduction
A Census is the basic source of demographic information at all levels of geography in a given area at a defined time. This chapter provides information on size, composition and structure of the population of South Africa from 1996–2007.
3.1.2 Population size
Figure 3.1 indicates that the population size of South Africa has increased noticeably from 40,5 million in 1996 to 51,7 million in 2011. KwaZulu-Natal, followed by Gauteng had the majority of population in both the two Censuses (1996 and 2001), but was overtaken by Gauteng during C S 2007, leaving KwaZulu-Natal to take second place. However, there was a noticeable increase in the share of the population in Gauteng from 18,8 % in 1996 to 23,7% in 2011 while the share of the population in KZN remained almost constant (21,1% in 1996 to 19,8% in 2011). Amongst all the provinces, Northern Cape had the lowest share (2,5% in 1996 and 2,2% in 2011). Eastern Cape on the other hand showed a marked decline from 15,1% 1996 to 12,7% in 2011.
Figure 3.1: Percentage distribution of population by province, 1996–2007
Statistics South Africa P0301.4
Census 2011 Statistical release – P0301.4
15
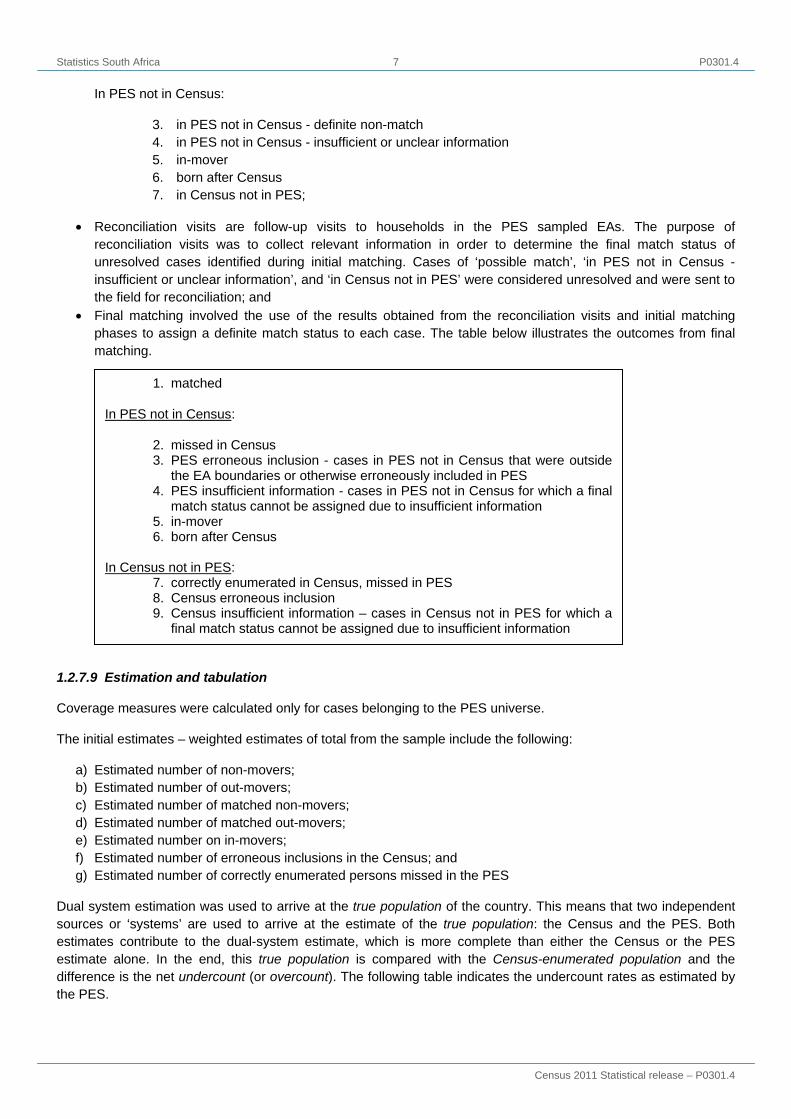
Table 3.1: Population and percentage change by province - Censuses 1996, 2001 and 2011, and CS 2007
Province 1996 2001
1996-2001%
change 2007
2001-2007%
change 2011
2007-2011%
change
WC 3 956 875 4 524 335 14,3 5 278 584 16,67 5 822 734 10,3
EC 6 147 244 6 278 651 2,1 6 527 747 3,97 6 562 053 0,5
NC 1 011 864 991 919 -2,0 1 058 059 6,67 1 145 861 8,3
FS 2 633 504 2 706 775 2,8 2 773 058 2,45 2 745 590 -1,0
KZN 8 572 302 9 584 129 11,8 10 259 229 7,04 10 267 300 0,1
NW 2 936 554 2 984 097 1,6 3 056 083 2,41 3 509 953 14,9
GP 7 624 893 9 388 855 23,1 10 667 505 13,62 12 272 263 15,0
MP 3 124 203 3 365 554 7,7 3 643 507 8,26 4 039 939 10,9
LP 4 576 133 4 995 462 9,2 5 238 285 4,86 5 404 868 3,2South Africa 40 583 572 44 819 777 10,4 48 502 057 8,,22 51 770 560 6,7
Table 3.1 provides the provincial percentage share of the total population in four periods (1996–2001, 2001–2007 and 2007 to 2011). The results show a noticeable decrease of -2% in the percentage share of the total population of Northern Cape from 1996 to 2001 that increased to 8,3% in 2011. Gauteng, Western Cape and KZN show a marked decrease of the population share of 15%, 10,3% and 0,1% in 2007 to 2011 respectively.
Statistics South Africa P0301.4
Census 2011 Statistical release – P0301.4
16
Table 3.2: Percentage distribution of the population by population group and province, 1996–2011
Black African Coloured Asian White Other
Province 1996 2001 2007 2011 1996 2001 2007 2011 1996 2001 2007 2011 1996 2001 2007 2011 2011
WC 21,6 26,7 30,1 32,9 56,0 53,9 50,2 48,8 1,1 1,0 1,3 1,0 21,4 18,4 18,4 15,7 1,6
EC 86,6 87,2 87,6 86,3 7,7 7,7 7,5 8,3 0,3 0,3 0,3 0,4 5,4 4,9 4,7 4,7 0,3
NC 44,9 46,5 39,8 50,4 43,7 42,9 50,0 40,3 0,2 0,2 0,2 0,7 11,2 10,3 10,0 7,1 1,6
FS 84,8 88,0 87,1 87,6 3,0 3,1 3,0 3,1 0,1 0,1 0,2 0,4 12,1 8,8 9,6 8,7 0,3
KZN 82,8 85,2 86,0 86,8 1,4 1,5 1,4 1,4 9,3 8,3 8,1 7,4 6,6 5,0 4,4 4,2 0,3
NW 90,1 90,0 91,2 89,8 1,6 1,8 1,7 2,0 0,4 0,3 0,4 0,6 7,9 7,8 6,7 7,3 0,3
GP 72,3 75,2 75,4 77,4 3,6 3,6 3,7 3,5 2,1 2,3 2,6 2,9 22,0 18,8 18,3 15,6 0,7
MP 91,0 93,2 92,0 90,7 0,7 0,7 0,8 0,9 0,4 0,3 0,4 0,7 7,9 5,9 6,8 7,5 0,2
LP 96,9 97,0 97,5 96,7 0,2 0,2 0,2 0,3 0,1 0,2 0,2 0,3 2,8 2,7 2,2 2,6 0,2
SA 77,4 79,0 78,9 79,2 9,0 8,9 9,0 8,9 2,6 2,5 2,6 2,5 11,0 9,6 9,5 8,9 0,5
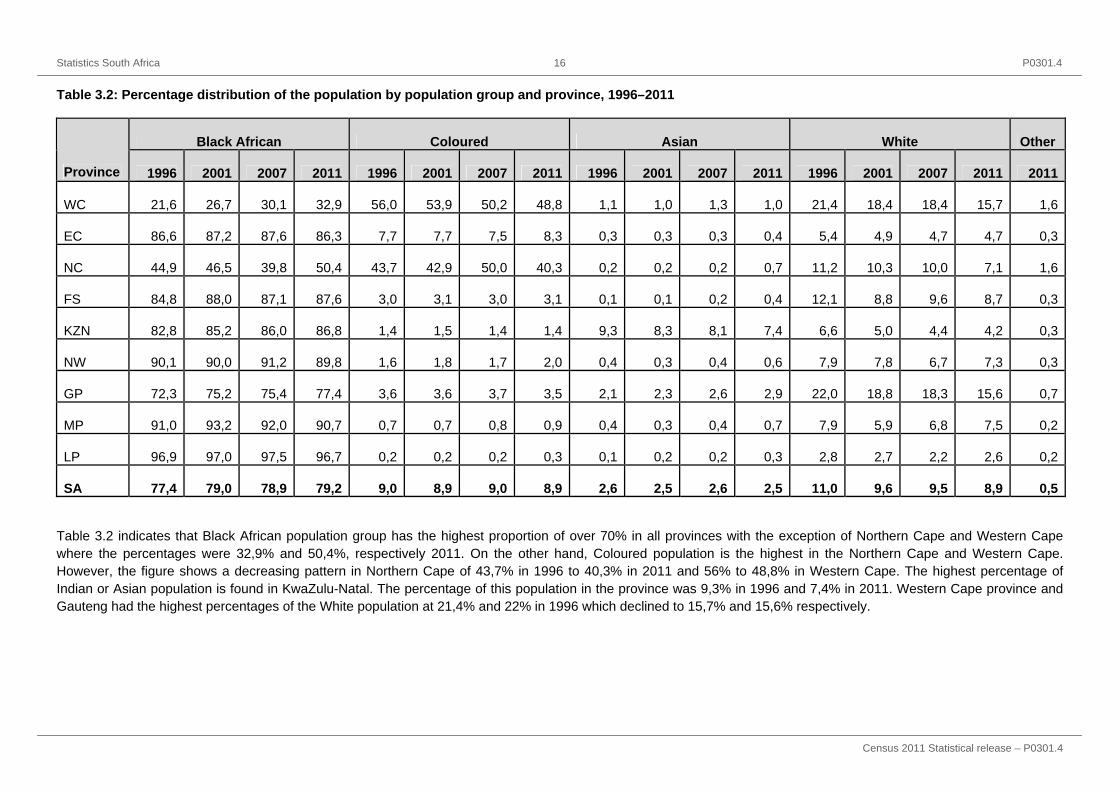
Table 3.2 indicates that Black African population group has the highest proportion of over 70% in all provinces with the exception of Northern Cape and Western Cape where the percentages were 32,9% and 50,4%, respectively 2011. On the other hand, Coloured population is the highest in the Northern Cape and Western Cape. However, the figure shows a decreasing pattern in Northern Cape of 43,7% in 1996 to 40,3% in 2011 and 56% to 48,8% in Western Cape. The highest percentage of Indian or Asian population is found in KwaZulu-Natal. The percentage of this population in the province was 9,3% in 1996 and 7,4% in 2011. Western Cape province and Gauteng had the highest percentages of the White population at 21,4% and 22% in 1996 which declined to 15,7% and 15,6% respectively.
Statistics South Africa P0301.4
Census 2011 Statistical release – P0301.4
17
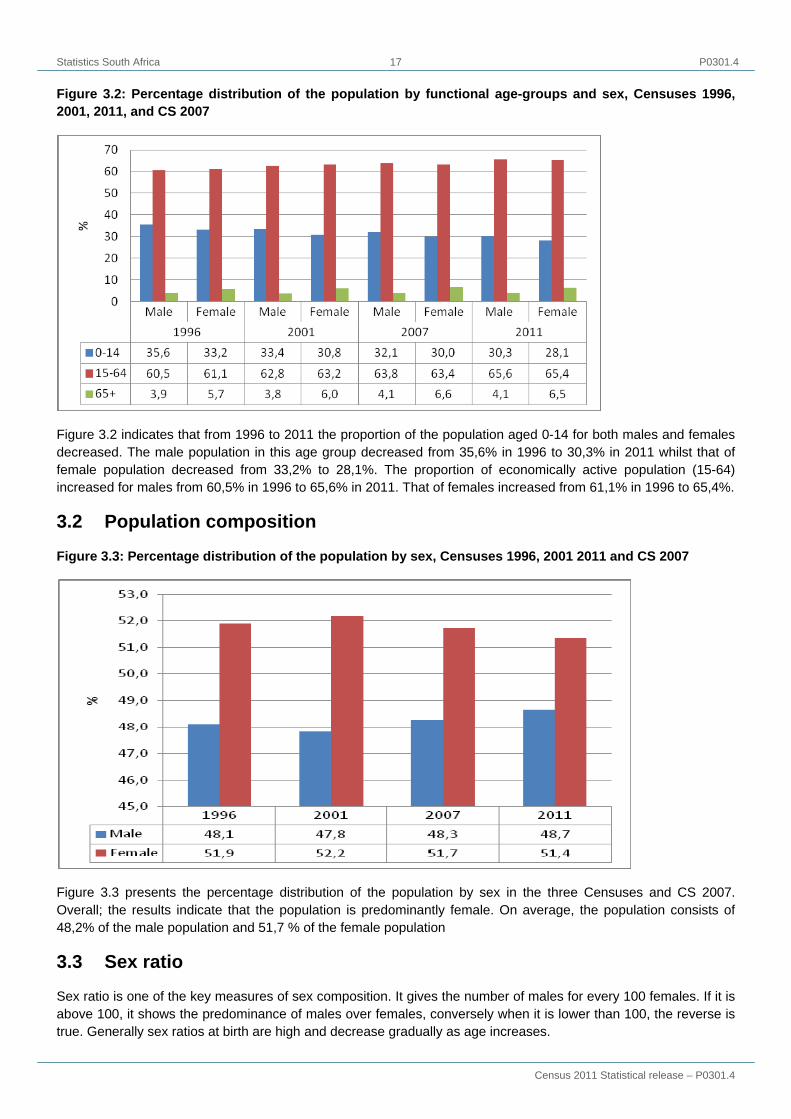
Figure 3.2: Percentage distribution of the population by functional age-groups and sex, Censuses 1996, 2001, 2011, and CS 2007
Figure 3.2 indicates that from 1996 to 2011 the proportion of the population aged 0-14 for both males and females decreased. The male population in this age group decreased from 35,6% in 1996 to 30,3% in 2011 whilst that of female population decreased from 33,2% to 28,1%. The proportion of economically active population (15-64) increased for males from 60,5% in 1996 to 65,6% in 2011. That of females increased from 61,1% in 1996 to 65,4%.
3.2 Population composition
Figure 3.3: Percentage distribution of the population by sex, Censuses 1996, 2001 2011 and CS 2007
Figure 3.3 presents the percentage distribution of the population by sex in the three Censuses and CS 2007. Overall; the results indicate that the population is predominantly female. On average, the population consists of 48,2% of the male population and 51,7 % of the female population
3.3 Sex ratio
Sex ratio is one of the key measures of sex composition. It gives the number of males for every 100 females. If it is above 100, it shows the predominance of males over females, conversely when it is lower than 100, the reverse is true. Generally sex ratios at birth are high and decrease gradually as age increases.

Statistics South Africa P0301.4
Census 2011 Statistical release – P0301.4
18
Figure 3.4: Age-specific sex ratios, Censuses 1996, 2001, 2011 and CS 2007
Figure 3.4 indicates that the overall sex ratio increased from 92 in 1996 to 95 in 2011. In general, more males are born than females hence sex ratios above 100 are expected at younger age groups. The table further indicates an unexpected pattern of sex ratios of 93 and 91 at ages 25–29 and 30–34 in 2001 that increased markedly to 101 and 102 in 2007 and remained the same for 2011.
Figure 3.5: Overall sex ratios by province
The results in Figure 3.5 show that among all the provinces, GP and NW had the highest sex ratios of over 100 in 2011. NW had a sex ratio of 98 in 1996 that increased to103 in 2011. Conversely, Limpopo and Eastern Cape had sex ratios lower than 90 across the years. Evidence from 1996 and 2001 Censuses showed that the two provinces (Limpopo and Eastern Cape) were the most affected by outmigration in terms of inter-provincial migration.

Statistics South Africa P0301.4
Census 2011 Statistical release – P0301.4
19
Figure 3.6: Age-specific sex ratios for South Africa by population group, Censuses 2001 and 2011
Figure 3.6 indicates an even pattern of age specific sex ratios of population groups in 2001 and 2011 that begins to decline as age increases. In contrast, age specific sex ratios for the Indian population in 2011 shows considerable increases from ages 20–24, 25–29 and 30–34 of 114;117 and 114 respectively.
Figure 3.7: Overall sex ratios by population group, Censuses 1996, 2001, 2011 and CS 2007
Figure 3.7 indicates a stable but increasing pattern of sex ratios ranging from 92 in 1996 to 94 in 2011 for the black African population group. The coloured population group sex ratios fluctuated between 93 and 94 in all the four points. However; sex ratios for the Indian population show considerable increase from 96 in 1996 to101 in 2011.

Statistics South Africa P0301.4
Census 2011 Statistical release – P0301.4
20
3.4 Median age
Generally median age gives an indication of whether the population is young, old or intermediate. Shryock et al1. (1976) described a population as being young when it has a median of less than 20 and those with medians of 30 and above as being old. Those with median ages between 20 and 29 are referred to as populations of intermediate age.
Figure 3.8: Median age by province
Figure 3.8 indicates that the overall median age in South Africa was 22 (1996), 23 (2001), 24 (2007) and 25 (2011) respectively. This implies that South Africa had intermediate populations in the four periods. Gauteng, followed by Western Cape had higher but consistent median ages over time, whilst Limpopo and Eastern Cape had lower median ages of 20 and lower than 20 in 1996 to 2001 that steadily increased to 22 in 2011.
Figure 3.9: Median age by population group
Although South Africa’s population had the median age of between 22 and 25 in the period 1996–2011, the results pertaining to the four main population groups show a different pattern. Figure 3.9 indicates that the white population had a relatively old population with an increasing median age from 33 to 38 from 1996 and 2011 respectively. On the other hand, Black African and the Coloured populations’ structures were predominantly intermediate with the median ages ranging from 21 to 26. 1 Shryock et al. (1976) (1971). The methods and materials of demography. U.S. Bureau of Census, Washington

Statistics South Africa P0301.4
Census 2011 Statistical release – P0301.4
21
3.5 Population structure
Knowledge about the age-sex distribution of a population is valuable information on demographics and socio-economic concerns. Amongst its importance, it can be used to evaluate, adjust the completeness and accuracy of Census counts. Figures 3.10 to 3.13 show the pyramids for the three Censuses and the CS 2007 at national level.
Nationally, the figures show that there was a fairly large proportion of females than males in all age groups except for younger age groups where the proportion of males is higher than females. The population in 1996, 2001, and 2007 began to increase from 5–9 age groups and decreased as age increases. Contrary; in 2011, there was a marked decrease of males and females aged 5–9 and 10–14. Many factors could have contributed to this decrease. Further analysis is scheduled to be done to ascertain the key drivers to this occurrence.
Figure 3.10 (1996) Figure 3.11 (2001)
Figure 3.12 (2007) Figure 3.13 (2011)
Statistics South Africa P0301.4
Census 2011 Statistical release – P0301.4
22
3.6 Concluding remarks
The population of South Africa increased from 40,5 million in 1996 to 51,7 million in 2011.
Age-sex distribution indicates a marked decline of both males and females at ages 5-14.
The provincial share of the population indicates an increase of population in Gauteng from 18,8% in 1996 to 23,7% in 2011, and a decrease in KwaZulu-Natal.
Among the population groups, black African population constitutes more than 75% during the four periods.
Provincial sex ratios suggest that Limpopo and Eastern Cape consistently had sex ratios lower than 90 in the Censuses 1996, 2001, 2011 and CS 2007.
Functional age group pattern show that 0–14 age group for both males and females decreased whilst those of the economically active population (15-64) increased over time.
3.7 Migration
3.7.1 Introduction
Migration can be defined as a change in a person’s permanent or usual place of residence2. Along with fertility and mortality, migration is one of the components of population change. Information on previous and usual province of residence refers to migration between the 2001 and 2011 Censuses. Lifetime migration on the other hand deals with movements based on where the person was born and where they currently reside. This section provides information on internal migration as well as immigration. Information regarding emigration is not part of the analysis.
3.7.2 Patterns of migration between Censuses 2001 and 2011
Table 3.3 is based on the question "Has (name) been living in this place since October 2001? The March 2011 provincial boundaries were used for this analysis. Respondents were asked to report on the month and year they moved to the place where the enumeration took place and data therefore only reflect the last movement. Although a person might have moved several times before the last move, it is unfortunately not possible to ask about all these movements in a Census.
From Table 3.3 the movements of people from a certain province to another, the in-and out-migration and net migration are shown. Turnover figures obtained as the summation of in- and out-migration, provide an indication of total movements.
2 Hinde, A. Demographic Methods. London: Arnold. 1998.

Statistics South Africa P0301.4
Census 2011 Statistical release – P0301.4
23
Table 3.3: Province of previous residence by province of usual residence
Province of usual residence Province of previous residence
Western Cape
Eastern Cape
Northern Cape Free State
KwaZulu- Natal
North West Gauteng
Mpuma- langa Limpopo
Out- migration
In- migration
Net- migration Turn over
Western Cape 5 158 316 40 152 10 566 5 155 9 221 5 039 50 694 4 759 3 381 128 967 432 790 303 823 561 757
Eastern Cape 170 829 6 250 135 5 081 15 542 73 831 32 341 117 964 12 001 8 877 436 466 158 205 -278 261 594 671
Northern Cape 17 577 4 077 1 054 841 8 559 5 708 11 478 16 019 4 202 1 907 69 527 62 792 -6 735 132 319
Free State 12 644 8 155 7 103 2 524 282 8 881 24 090 74 387 10 859 5 283 151 402 127 101 -24 301 278 503
KwaZulu-Natal 21 857 19 178 2 437 11 481 9 812 129 8 655 184 337 28 904 4 719 281 568 250 884 -30 684 532 452
North West 6 013 3 085 17 000 9 917 3 882 3 146 255 103 550 8 495 14 066 166 008 273 177 107 169 439 185
Gauteng 74 915 40 161 9 446 31 455 55 620 75 260 10 416 258 61 269 54 145 402 271 1 440 142 1 037 871 1 842 413
Mpumalanga 7 256 3 390 1 932 5 032 12 511 13 091 122 578 3 723 843 25 299 191 089 243 934 52 845 435 023
Limpopo 7 826 2 742 1 847 5 481 4 574 26 826 283 495 39 492 5 088 084 372 283 219 426 -152 857 591 709
Outside South Africa 113 873 37 265 7 380 34 479 76 656 76 397 487 118 73 953 101 749
*Note: This table excludes cases where the province was unspecified and do not know, Information ONLY obtained from Questionnaire A (Household Questionnaire).
Statistics South Africa P0301.4
Census 2011 Statistical release – P0301.4
24
It can be seen from Table 3.3 that Eastern Cape, Northern Cape, Free State, KwaZulu-Natal and Limpopo experienced a net out-flow of people during the 10-year period (between the 2001 and 2011 Censuses). Western Cape and Gauteng showed the highest in-flow figures.
Surprisingly, North West and Mpumalanga also showed high net in-flow. Focusing on the North West province, it seems that the highest migration interaction was with Gauteng and that North West gained less people from Gauteng than it lost to it (75 260 against 103 550). It is also worth noting that the highest inflow to the North West came from outside South Africa (about 28 % of all inflow). The turnover data also revealed some interesting figures. Some provinces with a low net migration showed relative high turnover numbers. KwaZulu-Natal for example has a net migration loss of 30 684, but the turnover is just over half a million. This is also the case with the Free State and North West.
3.7.3 Life-time migration patterns
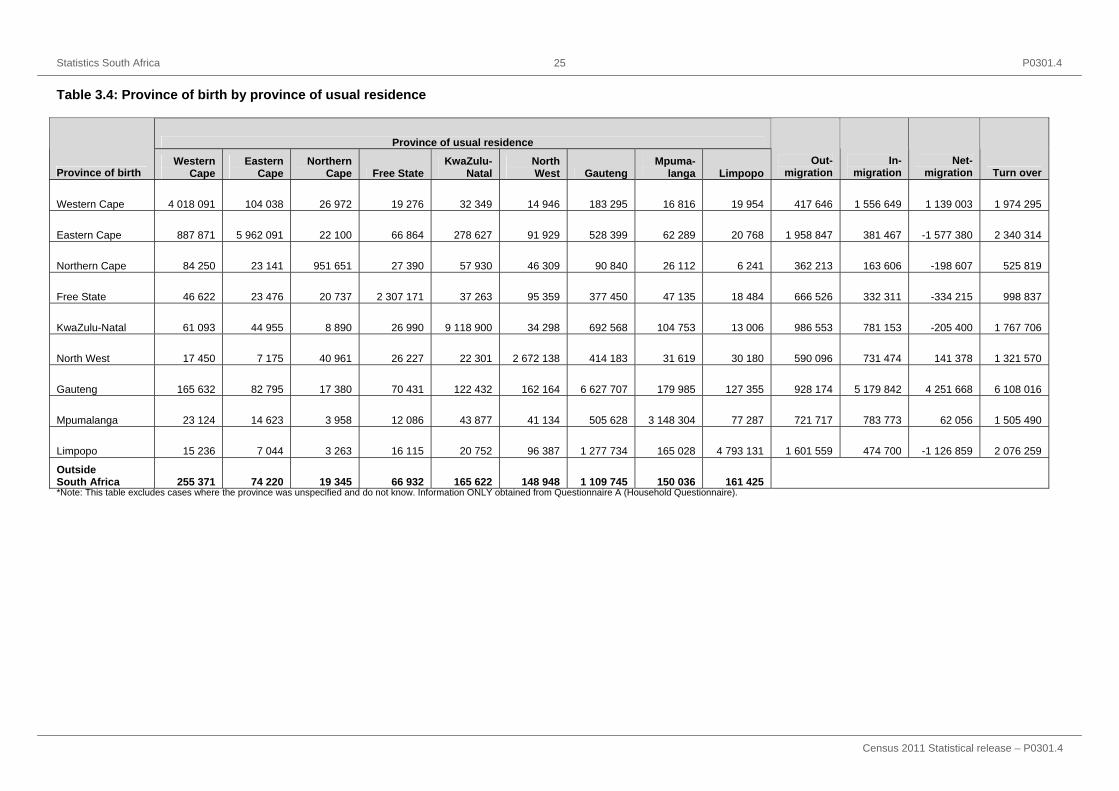
In the previous section we discussed the migration patterns based on the usual residence and previous residence (ten years before the Census) information. For the analysis in this section the birth province will replace previous residence to give life-time migration patterns. The results can be found in Table 3.4. Patterns however become clearer if we calculate net migration and turnover numbers.
Table 3.4 shows that Eastern Cape, Northern Cape, Free State, KwaZulu-Natal and Limpopo all had negative net migration figures, meaning that more people have migrated out of these provinces than have moved in over time. Life-time migrants to Gauteng are high as expected but surprisingly high net figures are also found North West and Mpumalanga. If we focus only on those that were born outside North West, it seems that 20% were born outside South Africa, and about 13% and 22% in the Free State and Gauteng respectively. Doing the same analysis with Mpumalanga it is found that 19% were born outside the country and 23% and 21% were born in Gauteng and Limpopo respectively.
Statistics South Africa P0301.4
Census 2011 Statistical release – P0301.4
25
Table 3.4: Province of birth by province of usual residence
Province of usual residence
Province of birth Western
Cape Eastern
Cape Northern
Cape Free State KwaZulu-
Natal North West Gauteng
Mpuma- langa Limpopo
Out- migration
In- migration
Net- migration Turn over
Western Cape 4 018 091 104 038 26 972 19 276 32 349 14 946 183 295 16 816 19 954 417 646 1 556 649 1 139 003 1 974 295
Eastern Cape 887 871 5 962 091 22 100 66 864 278 627 91 929 528 399 62 289 20 768 1 958 847 381 467 -1 577 380 2 340 314
Northern Cape 84 250 23 141 951 651 27 390 57 930 46 309 90 840 26 112 6 241 362 213 163 606 -198 607 525 819
Free State 46 622 23 476 20 737 2 307 171 37 263 95 359 377 450 47 135 18 484 666 526 332 311 -334 215 998 837
KwaZulu-Natal 61 093 44 955 8 890 26 990 9 118 900 34 298 692 568 104 753 13 006 986 553 781 153 -205 400 1 767 706
North West 17 450 7 175 40 961 26 227 22 301 2 672 138 414 183 31 619 30 180 590 096 731 474 141 378 1 321 570
Gauteng 165 632 82 795 17 380 70 431 122 432 162 164 6 627 707 179 985 127 355 928 174 5 179 842 4 251 668 6 108 016
Mpumalanga 23 124 14 623 3 958 12 086 43 877 41 134 505 628 3 148 304 77 287 721 717 783 773 62 056 1 505 490
Limpopo 15 236 7 044 3 263 16 115 20 752 96 387 1 277 734 165 028 4 793 131 1 601 559 474 700 -1 126 859 2 076 259
Outside South Africa 255 371 74 220 19 345 66 932 165 622 148 948 1 109 745 150 036 161 425 *Note: This table excludes cases where the province was unspecified and do not know. Information ONLY obtained from Questionnaire A (Household Questionnaire).
Statistics South Africa P0301.4
Census 2011 Statistical release – P0301.4
26
3.8 Citizenship
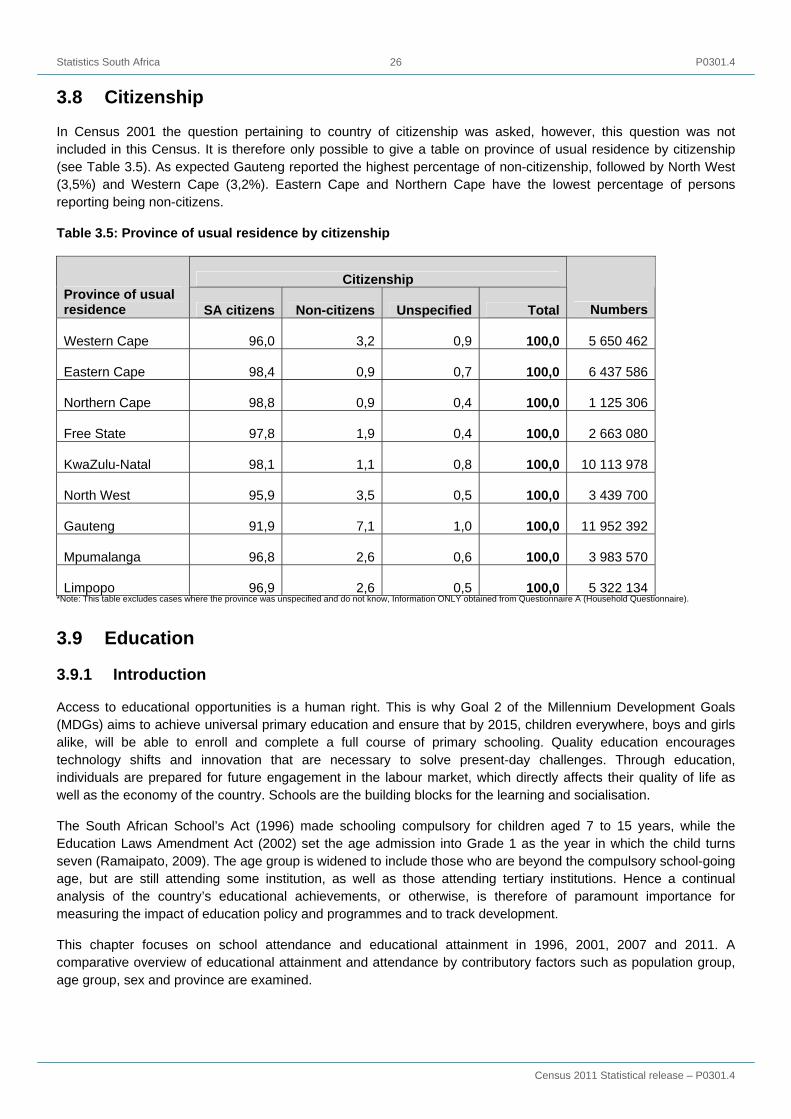
In Census 2001 the question pertaining to country of citizenship was asked, however, this question was not included in this Census. It is therefore only possible to give a table on province of usual residence by citizenship (see Table 3.5). As expected Gauteng reported the highest percentage of non-citizenship, followed by North West (3,5%) and Western Cape (3,2%). Eastern Cape and Northern Cape have the lowest percentage of persons reporting being non-citizens.
Table 3.5: Province of usual residence by citizenship
Citizenship Province of usual residence SA citizens Non-citizens Unspecified Total Numbers
Western Cape 96,0 3,2 0,9 100,0 5 650 462
Eastern Cape 98,4 0,9 0,7 100,0 6 437 586
Northern Cape 98,8 0,9 0,4 100,0 1 125 306
Free State 97,8 1,9 0,4 100,0 2 663 080
KwaZulu-Natal 98,1 1,1 0,8 100,0 10 113 978
North West 95,9 3,5 0,5 100,0 3 439 700
Gauteng 91,9 7,1 1,0 100,0 11 952 392
Mpumalanga 96,8 2,6 0,6 100,0 3 983 570
Limpopo 96,9 2,6 0,5 100,0 5 322 134 *Note: This table excludes cases where the province was unspecified and do not know, Information ONLY obtained from Questionnaire A (Household Questionnaire).
3.9 Education
3.9.1 Introduction
Access to educational opportunities is a human right. This is why Goal 2 of the Millennium Development Goals (MDGs) aims to achieve universal primary education and ensure that by 2015, children everywhere, boys and girls alike, will be able to enroll and complete a full course of primary schooling. Quality education encourages technology shifts and innovation that are necessary to solve present-day challenges. Through education, individuals are prepared for future engagement in the labour market, which directly affects their quality of life as well as the economy of the country. Schools are the building blocks for the learning and socialisation.
The South African School’s Act (1996) made schooling compulsory for children aged 7 to 15 years, while the Education Laws Amendment Act (2002) set the age admission into Grade 1 as the year in which the child turns seven (Ramaipato, 2009). The age group is widened to include those who are beyond the compulsory school-going age, but are still attending some institution, as well as those attending tertiary institutions. Hence a continual analysis of the country’s educational achievements, or otherwise, is therefore of paramount importance for measuring the impact of education policy and programmes and to track development.
This chapter focuses on school attendance and educational attainment in 1996, 2001, 2007 and 2011. A comparative overview of educational attainment and attendance by contributory factors such as population group, age group, sex and province are examined.

Statistics South Africa P0301.4
Census 2011 Statistical release – P0301.4
27
3.9.2 Attendance at an educational institution
Figure 3.14: Percentage of persons attending an educational institution amongst person aged 5–24 years, Censuses 1996, 2001 and 2011
Figure 3.14 shows comparisons between Censuses 1996, 2001 and 2011. Up to age 15 years there was a general increase in the percentage of persons attending an educational institution between 1996 and 2011. However, the Census 2001 data point was slightly lower than the general trend line for 14 and 15 year olds. The 5–7 year age group has shown the most significant progress in terms of increased enrolment rates between 1996 and 2011. Amongst individuals 16 years and older, enrolment rates tended to fluctuate from data point to data point and the only trend that tends to manifest itself for the age cohort 18 to 24 years is that the Census 1996 estimates tend to be significantly higher than all three other data points for all individual ages between 18 and 24 years.
Figure 3.15: The percentage of individuals aged 5–24 years and currently attending an educational institution who attend private and public educational institutions, Censuses 2001 and 2011
Statistics South Africa P0301.4
Census 2011 Statistical release – P0301.4
28
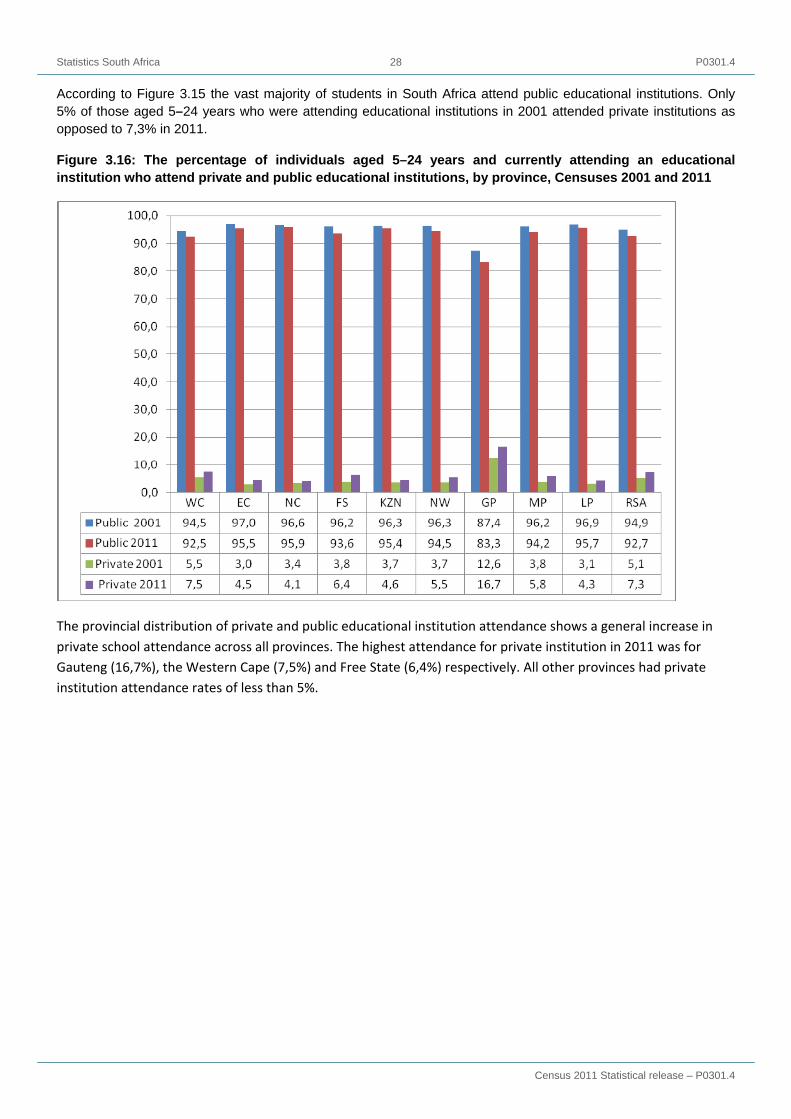
According to Figure 3.15 the vast majority of students in South Africa attend public educational institutions. Only 5% of those aged 5–24 years who were attending educational institutions in 2001 attended private institutions as opposed to 7,3% in 2011.
Figure 3.16: The percentage of individuals aged 5–24 years and currently attending an educational institution who attend private and public educational institutions, by province, Censuses 2001 and 2011
The provincial distribution of private and public educational institution attendance shows a general increase in private school attendance across all provinces. The highest attendance for private institution in 2011 was for Gauteng (16,7%), the Western Cape (7,5%) and Free State (6,4%) respectively. All other provinces had private institution attendance rates of less than 5%.

Statistics South Africa P0301.4
Census 2011 Statistical release – P0301.4
29
Figure 3.17: Percentage of persons attending an educational institution amongst those aged 5–24 years by population group: 1996, 2001 and 2011
NB: option “Other” for population group is excluded.
Figure 3.17 compares attendance of educational institutions among persons aged 5–24 years by population group. Attendance amongst the black African population increased steadily from 70,7% in 1996 to 72,1% in 2001 and 73, 9% in 2011. Amongst the Indian/Asian population attendance rates increased from 70,7% in 1996 to 71,8% in 2011. Amongst whites attendance also improved from 70,6% in 1996 to 77,7% in 2011.

Statistics South Africa P0301.4
Census 2011 Statistical release – P0301.4
30
Table 3.6: Percentage of persons aged 5–24 attending an educational institution by type of institution and province, 2001 and 2011
Pre-school School College Technikon – University
Adult education
centre Other
Province 2001 2011 2001 2011 2001 2011 2001 2011 2001 2011 2001 2011Western Cape 5,4 1,5 87,7 90,5 1,9 2,9 4,3 4,5 0,2 0,1 0,4 0,4Eastern Cape 3,9 0,5 93,7 96,3 0,7 1,3 1,4 1,4 0,1 0,1 0,2 0,3Northern Cape 4,7 0,8 93,5 96,6 0,9 1,4 0,5 0,6 0,2 0,1 0,2 0,4
Free State 3,8 1,3 92,5 92,8 1,2 2,5 1,9 2,9 0,4 0,2 0,2 0,3KwaZulu-Natal 3,3 0,5 93,5 94,2 0,9 2,1 1,9 2,5 0,2 0,1 0,2 0,5
North West 4,8 1,0 92,5 94,4 0,9 2,0 1,4 2,1 0,3 0,2 0,2 0,3
Gauteng 5,7 1,7 84,1 85,7 3,8 5,0 5,7 6,8 0,3 0,3 0,4 0,5
Mpumalanga 3,8 0,6 94,3 96,0 0,8 2,0 0,7 1,0 0,1 0,1 0,2 0,3
Limpopo 3,6 0,5 94,8 96,0 0,6 2,0 0,8 1,1 0,1 0,2 0,2 0,3
RSA 4,2 0,9 91,7 93,0 1,4 2,6 2,3 3,0 0,2 0,2 0,2 0,4
NB: Ordinary school and Special school are classified under school. FET and other colleges are combined and classified under college. Literacy classes and Home based education schooling are classified under other.
The primary reason why there has been a decrease between 2001 and 2011 in children attending pre-school is that Grade 0 was incorporated into the primary school system, which is also partly reflected in the increased proportion of individuals who attended school in 2011 compared to 2001.
Figure 3.18: Highest level of education attained amongst persons aged 20 years and older and above, Censuses 1996, 2001 and 2011

Statistics South Africa P0301.4
Census 2011 Statistical release – P0301.4
31
Figure 3.18 shows that the proportion of persons aged 20 years who have no schooling halved from 19,1% in 1996 to 8,6% in 2011. The percentage of persons who have some primary level education decreased from 16,6% in 1996 to 12,3% in 2011; whilst the proportion of those who had completed primary level decreased from 7,4% in 1996 to 4,6% in 2011. There was also a considerable increase in the percentage of persons who completed higher education from 7,1% in 1996 to 11,8% in 2011.
Figure 3.19: Highest level of education attained amongst persons aged 20 years and older by population group, 1996, 2001 and 2011
The black African population group has more than doubled the proportion of persons with higher education between 1996 and 2011. Those with no schooling more than halved during the same time period for the black African, coloured and Asian/Indian population. The percentage of individuals with no schooling has always been the lowest amongst the white population group, whilst this group also has the highest proportion of individuals with a higher education. There has also been a steady increase in the proportion of individuals in this group as well as amongst Indians/Asians who have attained a higher qualification during the reference period.
Figure 3.19 shows that at the time of Census 2011, 10,5% of black Africans, compared with 4,2% of coloured, 2,9% of Indian/Asian and 0,6% of white, aged 20 years and older had no schooling. A further 36,5% of the White population attained a level of education higher than Grade 12, compared to 8,3% of black African population, 7,4% of the coloured population and 21,6% of Indian/Asian persons of Asian origin. The figure also indicates that 35,5% of the black Africans, 42,0% of coloured persons, 26,1% of Indian/Asian and 21,4% of white persons had at least some secondary education.

Statistics South Africa P0301.4
Census 2011 Statistical release – P0301.4
32
Table 3.7: Highest level of education amongst those aged 20 years and older by population group and sex, 2011
Population group No schooling Some primary Completed primary Some secondary Grade 12/Std 10 Higher Total
Black- African N % N % N % N % N % N % N
Male 968 141 8,7 1 546 769 13,9 544 120 4,9 4 036 403 36,4 3 122 651 28,2 873 439 7,9 11 091 523
Female 1 516 351 12,1 1 733 245 13,8 604 791 4,8 4 297 729 34,3 3 271 806 26,1 1 095 162 8,7 12 519 083
Total 2 484 492 10,5 3 280 014 13,9 1 148 911 4,9 8 334 131 35,3 6 394 457 27,1 1 968 601 8,3 23 610 606
Coloured
Male 54 682 4,2 177 376 13,6 90 574 6,9 555 335 42,5 333 374 25,5 95 491 7,3 1 306 831
Female 64 334 4,3 210 227 14,0 116 729 7,8 617 291 41,1 379 524 25,3 112 820 7,5 1 500 924
Total 119 015 4,2 387 603 13,8 207 303 7,4 1 172 626 41,8 712 898 25,4 208 310 7,4 2 807 755
Indian/ Asian
Male 8 987 2,0 21 558 4,8 9 807 2,2 118 324 26,2 193 394 42,8 100 016 22,1 452 086
Female 17 227 3,8 38 595 8,4 15 642 3,4 115 801 25,3 173 901 38,0 96 969 21,2 458 134
Total 26 214 2,9 60 153 6,6 25 449 2,8 234 124 25,7 367 294 40,4 196 985 21,6 910 220
White
Male 9 519 0,6 20 845 1,3 10 808 0,7 317 114 19,5 647 317 39,8 619 374 38,1 1 624 977
Female 11 233 0,6 24 266 1,4 12 681 0,7 362 288 20,5 737 108 41,8 616 881 35,0 1 764 458
Total 20 752 0,6 45 111 1,3 23 489 0,7 679 402 20,0 1 384 425 40,8 1 236 255 36,5 3 389 434
Other
Male 10 543 8,3 11 539 9,1 5 537 4,4 39 640 31,4 39 159 31,0 19 875 15,7 126 291
Female 4 859 6,8 5 715 8,0 3 206 4,5 21 654 30,3 21 374 29,9 14 591 20,4 71 399
Total 15 402 7,8 17 253 8,7 8 743 4,4 61 294 31,0 60 533 30,6 34 465 17,4 197 690
Total
Male 1 051 871 7,2 1 778 086 12,2 660 846 4,5 5 066 815 34,7 4 335 895 29,7 1 708 194 11,7 14 601 707
Female 1 614 003 9,9 2 012 048 12,3 753 049 4,6 5 414 762 33,2 4 583 713 28,1 1 936 423 11,9 16 313 998
Total 2 665 875 8,6 3 790 134 12,3 1 413 895 4,6 10 481 577 33,9 8 919 608 28,9 3 644 617 11,8 30 915 705

Statistics South Africa P0301.4
Census 2011 Statistical release – P0301.4
33
Table 3.7 indicates that at the time of the 2011 Census; 12,1% of the female black Africans aged 20 years and older had no schooling as compared to 8,7% of males, 13,8% of females and 13,9% males had some primary education, whereas 4,8% of females and 4,9% of males had completed primary school. 34,3% of females and 36,4% of males had some secondary schooling, while 26,1% of females and 28,2% of males had completed Grade12/standard 10, more females (8,7%) had higher education as compared to males (8,1%). A similar trend is observed with the coloured population with a similar demographic profile, where females dominate all the educational categories except higher education. Just over 4% (4,3%) of female and 4,2% of males had no schooling, 14,0% of females and 13,6% of males had some primary schooling. More than a quarter (25,3%) of females and 25,5% of males had completed Grade12/Standard10, whereas 7,5% of females had a higher education as compared to 7,3% of males.
The same trend is observed for the Asian/Indian population who had no schooling, or had some primary, and completed primary, with a higher proportion of females compared to males in each category. However, a lower proportion of females (25,6%) had some secondary education, compared to 26,4% of males. Further, 38,0% of females and 42,8% of males had Grade12/Standard 10, whereas 21,8% of females and 22,1% of males had a higher qualification. The white population group remains the most highly educated group in the population, with only 0,6% of males and females who had no schooling, 0,7% of females and 1,7% of males who completed only primary school. More than a fourth (41,8%) of females and 39,8% of males completed Grade12/Standard10, a further 35,0% of females and 38,1% of males had a higher qualification. Of those classified as ‘Other’ there weren’t any significant differences between males and females’ educational attainment.
Figure 3.20: Highest level of education attained amongst those aged 20 years or more, in five-year age intervals, 2011
Figure 3.20 illustrates the highest level of education of those aged 20 years or more in five-year age intervals. It shows that age is indeed a significant variable, inversely related to highest level of education attained. In general, older persons are likely to have lower levels of education than younger ones. For example, 2,0% of those aged 20–24 years have received no schooling, compared to 44,1% of those aged 80 years or more; 40,6% of those aged 20–24 years completed Grade 12/Std 10 compared with only 9,9% of those aged 80 years or more.

Statistics South Africa P0301.4
Census 2011 Statistical release – P0301.4
34
Figure 3.21: Field of education for persons aged 20 years and above by sex, 2001 and 2011
Figure 3.21 illustrates the distribution of the highest qualifications of persons aged 20 years and older that have attained post-school qualifications. In 2001 most of these qualifications for men were in the field of business, commerce or management science (19,4%) and engineering or engineering technology (19,1%), whilst most women tended to have qualifications in the fields of education, training and related fields (30,8%) as well as being represented in low levels in business, commerce or management science (16,8%). The picture in relation to the main fields of qualifications did not change in 2011 for men albeit with greater proportions qualifying in the two dominant categories. However, for women, a significant shift took place in 2011 towards business, commerce or management science (26,1%) and away from education, training and related fields (19,8%) making the former the dominant field of higher education. Healthcare and health sciences remained important for women in both periods with 12,8% in 2001 and 11,5% in 2011, whilst qualifications in the third most dominant field for men decreased significantly from 16,1% in 2001 to 9,4% in 2011.
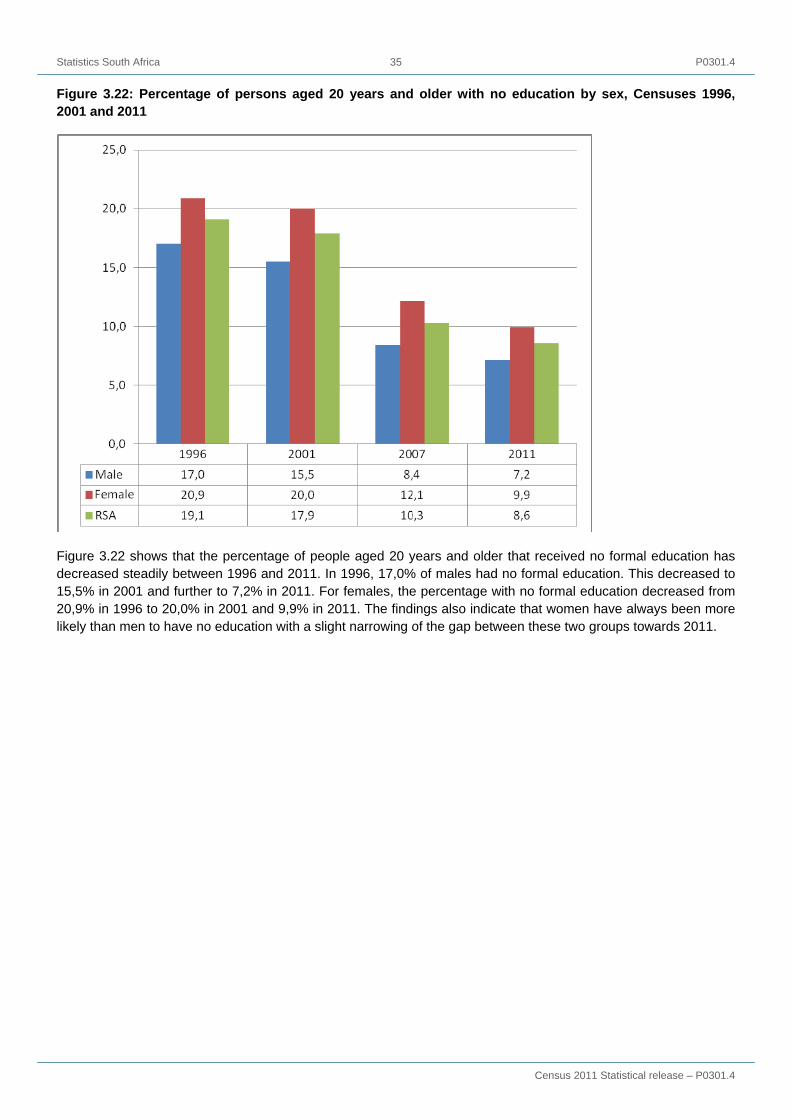
Statistics South Africa P0301.4
Census 2011 Statistical release – P0301.4
35
Figure 3.22: Percentage of persons aged 20 years and older with no education by sex, Censuses 1996, 2001 and 2011
Figure 3.22 shows that the percentage of people aged 20 years and older that received no formal education has decreased steadily between 1996 and 2011. In 1996, 17,0% of males had no formal education. This decreased to 15,5% in 2001 and further to 7,2% in 2011. For females, the percentage with no formal education decreased from 20,9% in 1996 to 20,0% in 2001 and 9,9% in 2011. The findings also indicate that women have always been more likely than men to have no education with a slight narrowing of the gap between these two groups towards 2011.
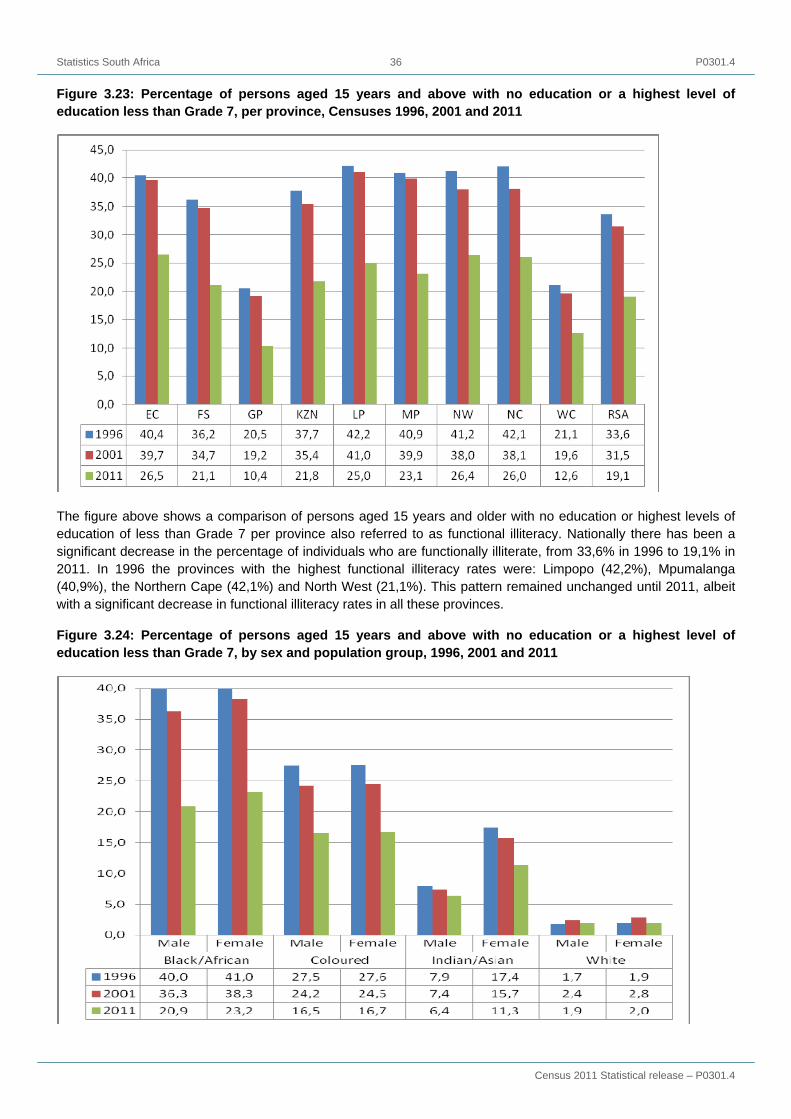
Statistics South Africa P0301.4
Census 2011 Statistical release – P0301.4
36
Figure 3.23: Percentage of persons aged 15 years and above with no education or a highest level of education less than Grade 7, per province, Censuses 1996, 2001 and 2011
The figure above shows a comparison of persons aged 15 years and older with no education or highest levels of education of less than Grade 7 per province also referred to as functional illiteracy. Nationally there has been a significant decrease in the percentage of individuals who are functionally illiterate, from 33,6% in 1996 to 19,1% in 2011. In 1996 the provinces with the highest functional illiteracy rates were: Limpopo (42,2%), Mpumalanga (40,9%), the Northern Cape (42,1%) and North West (21,1%). This pattern remained unchanged until 2011, albeit with a significant decrease in functional illiteracy rates in all these provinces.
Figure 3.24: Percentage of persons aged 15 years and above with no education or a highest level of education less than Grade 7, by sex and population group, 1996, 2001 and 2011
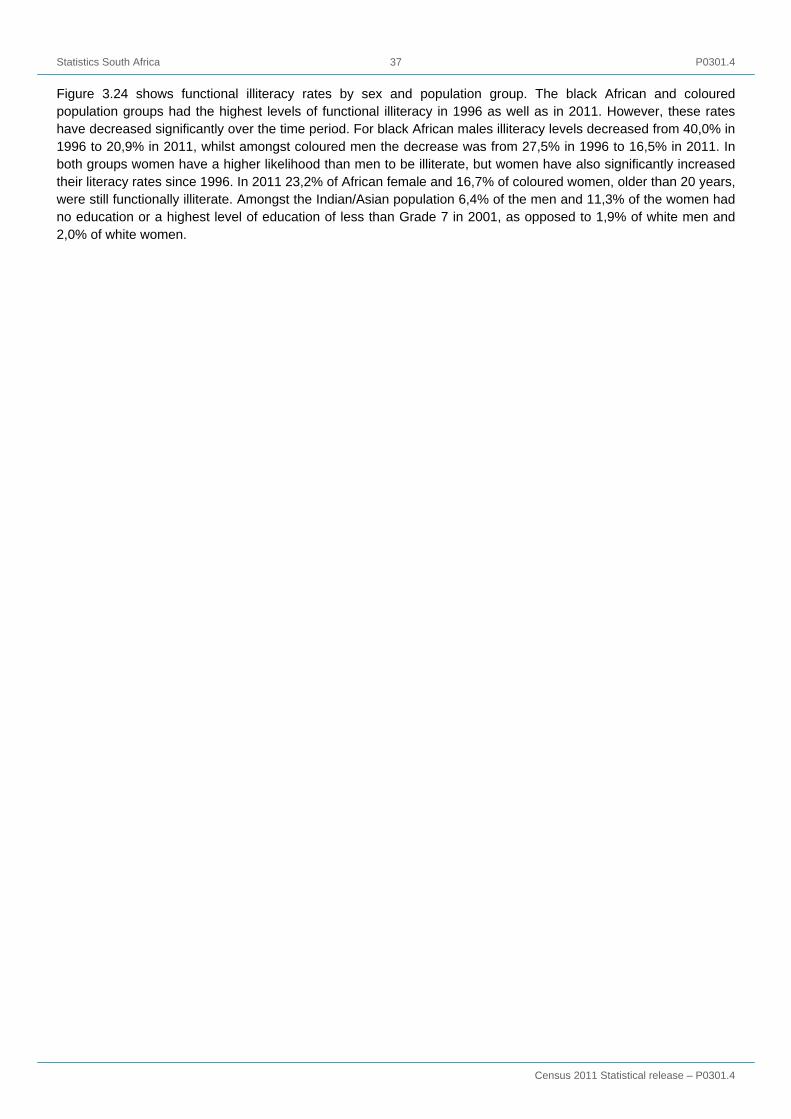
Statistics South Africa P0301.4
Census 2011 Statistical release – P0301.4
37
Figure 3.24 shows functional illiteracy rates by sex and population group. The black African and coloured population groups had the highest levels of functional illiteracy in 1996 as well as in 2011. However, these rates have decreased significantly over the time period. For black African males illiteracy levels decreased from 40,0% in 1996 to 20,9% in 2011, whilst amongst coloured men the decrease was from 27,5% in 1996 to 16,5% in 2011. In both groups women have a higher likelihood than men to be illiterate, but women have also significantly increased their literacy rates since 1996. In 2011 23,2% of African female and 16,7% of coloured women, older than 20 years, were still functionally illiterate. Amongst the Indian/Asian population 6,4% of the men and 11,3% of the women had no education or a highest level of education of less than Grade 7 in 2001, as opposed to 1,9% of white men and 2,0% of white women.

Statistics South Africa P0301.4
Census 2011 Statistical release – P0301.4
38
3.10 Average annual household income3
Figure 3.25: Average annual household income by sex of head of household
Census 2011 found that over the past ten years, the average annual household income for all households in South Africa more than doubled. It was up to R103 204 from R48 385 recorded in Census 2001. This represents an increase of 113,3% in nominal terms – the Consumer Price Index indicates that income should have increased by 77,5% during this period to have stayed in line with inflation.
Figure 3.25: shows that the average female-headed household had just more than half the annual income in 2011 of their male counterpart, (at R67 330) who earn an average of at least R128 329. However, the average female-headed household had increased their income by 141,6% from 2001 as compared with male-headed households that saw a relatively lower increase of 101,7%.
3 This has been calculated for housing units and converted hostels only, according to the method outlined in the metadata document for Census 2001.

Statistics South Africa P0301.4
Census 2011 Statistical release – P0301.4
39
Figure 3.26: Average annual household income by population group of household head
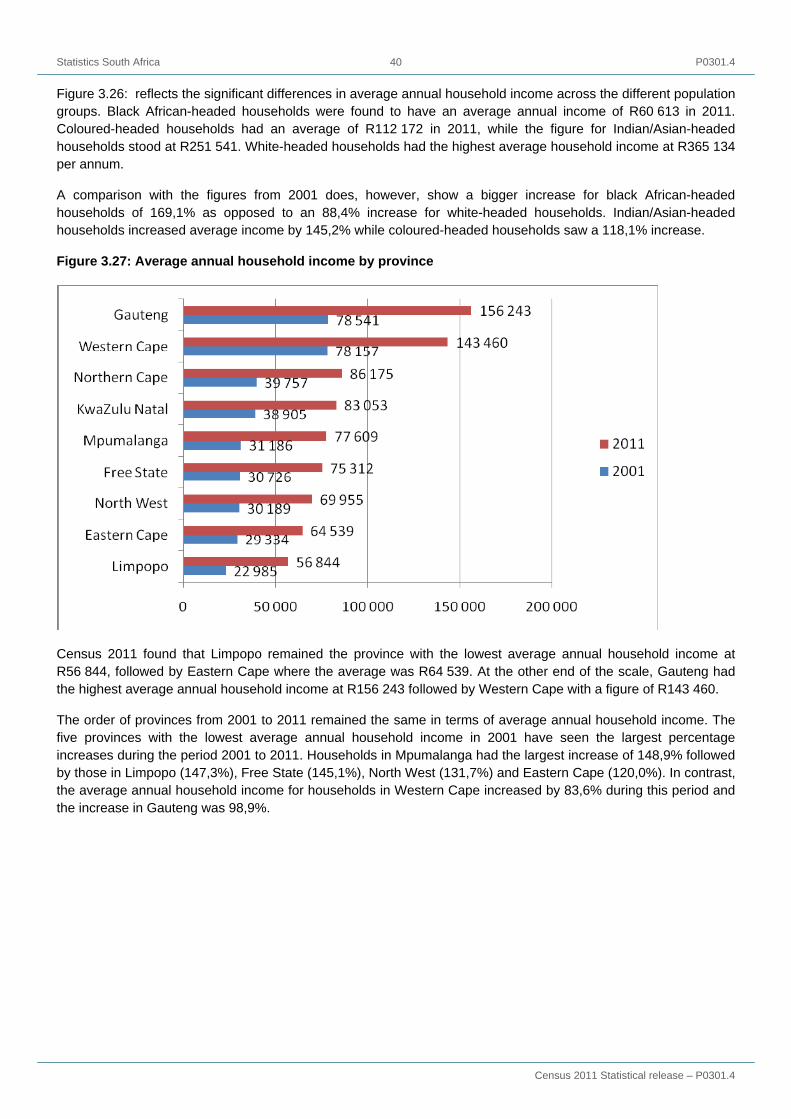
Statistics South Africa P0301.4
Census 2011 Statistical release – P0301.4
40
Figure 3.26: reflects the significant differences in average annual household income across the different population groups. Black African-headed households were found to have an average annual income of R60 613 in 2011. Coloured-headed households had an average of R112 172 in 2011, while the figure for Indian/Asian-headed households stood at R251 541. White-headed households had the highest average household income at R365 134 per annum.
A comparison with the figures from 2001 does, however, show a bigger increase for black African-headed households of 169,1% as opposed to an 88,4% increase for white-headed households. Indian/Asian-headed households increased average income by 145,2% while coloured-headed households saw a 118,1% increase.
Figure 3.27: Average annual household income by province
Census 2011 found that Limpopo remained the province with the lowest average annual household income at R56 844, followed by Eastern Cape where the average was R64 539. At the other end of the scale, Gauteng had the highest average annual household income at R156 243 followed by Western Cape with a figure of R143 460.
The order of provinces from 2001 to 2011 remained the same in terms of average annual household income. The five provinces with the lowest average annual household income in 2001 have seen the largest percentage increases during the period 2001 to 2011. Households in Mpumalanga had the largest increase of 148,9% followed by those in Limpopo (147,3%), Free State (145,1%), North West (131,7%) and Eastern Cape (120,0%). In contrast, the average annual household income for households in Western Cape increased by 83,6% during this period and the increase in Gauteng was 98,9%.

Statistics South Africa P0301.4
Census 2011 Statistical release – P0301.4
41
3.11 General health and functioning
3.11.1 Introduction
The inclusion of questions on disability in a Census serves a crucial role in the identification of persons living with disabilities. This is one of the most marginalized and vulnerable groups in many societies regardless of whether they are rich or poor. The disabled who come from the poorest cohorts of society inevitably have more serious problems than their wealthy counterparts as they lack resources to ameliorate their circumstances. Statistics on disability prevalence are paramount in assessing development challenges and other life circumstances faced by persons living with disabilities. Disparities are apparent between persons with impairments and those without. Disabled persons often have inadequate access to education, transport, health, and other basic services, making them vulnerable to the poverty trap and its associated vices.
Disaggregated statistics on disabled persons by type of disability, sex, age, population group, employment status, educational attainment, and their general living conditions, provide key indicators essential for assessing demographic trends, needs, challenges, and designing effective policies that contribute to improving lives of disabled persons. Statistics South Africa collected data on disability status in the population Censuses of 1996 and 2001 and in the large scale community survey conducted in February of 2007 using similar questions. In the three data points, measurement of disability was based on the definition from the 1980 WHO International Classification of Impairments, Disabilities and Handicaps (ICIDH); which defined it as a physical or mental handicap which has lasted for six months or more, or is expected to last at least six months, which prevents the person from carrying out daily activities independently, or from participating fully in educational, economic or social activities as shown below.
• “Does (the person) have a serious sight, hearing, physical or mental disability?”- 1996
1 = Yes 2 = No
(If “Yes”) Circle all applicable disabilities for the person.
1 = Sight (serious eye defects) 2 = Hearing/speech 3 = Physical disability (e.g. paralysis) 4 = Mental disability
• “Does (the person) have any serious disability that prevents his/her full participation in life activities such as education, work, social life)?”- 2001
0 = None 1 = Sight (blind/severe visual limitation) 2 = Hearing (deaf, profoundly hard of hearing) 3 = Communication (speech impairment) 4 = Physical (e.g. needs wheelchair, crutches or prosthesis, limb hand usage limitations) 5 = Intellectual (serious difficulties in learning) 6 = Emotional (behavioural, psychological)
Community survey question on disability, 2007
• Does (the person) have any kind of disability?
1 = Yes 2 = No 3 = Do not know
• What type(s) of disability does (the person) have?
Statistics South Africa P0301.4
Census 2011 Statistical release – P0301.4
42
1 = Sight (blind/severe visual limitation) 2 = Hearing (deaf, profoundly hard of hearing) 3 = Communication (speech impairment) 4 = Physical (e.g. needs wheelchair, crutches or prosthesis, limb hand usage limitations) 5 = Intellectual (serious difficulties in learning) 6 = Emotional (behavioural, psychological)
• Does the disability seriously prevent (the person) from full participation in life activities (such as education, work, social life, etc.)?
The 2010 Round of Population Censuses adopted a set of disability questions developed by the Washington Group (WG). The questions relate to difficulties people have in executing a series of activities; seeing, hearing, walking, communicating, and self-care, remembering and concentrating. Many countries that adopted the WG questions believe that this approach of measuring disability provides adequate estimates compared to the traditional approach where only severe disabilities are measured, leading to underestimation of people with disabilities. To test applicability of WG disability questions in South Africa, two studies were conducted:
- Testing a disability schedule for Census 2011; outsourced to Human Science Research Council (2007). This was a qualitative research where 26 focus group discussions were held nationwide.
- Census content research study on disability schedule (2006), conducted by Research and Methodology component in Stats SA. The survey constituted 6 000 households.
Results from both studies showed that use of WG questions led to much higher disability estimates compared to the traditional questions of “Do you have any serious disability that prevents your full participation in life activities?” In both studies, the term “difficulty” instead of “disabled” seemed to be more acceptable among persons with impairments that do not prevent them from participating in life activities. Some people did not want to identify themselves as being disabled if the question was addressed as “are you/is your child disabled”. Both studies recommended use of WG questions for Census 2011.
As a result of changes in the approach of asking disability questions the Census 2011 data are not comparable with previous Censuses. In Census 2011, disability was defined as difficulties encountered in functioning due to body impairments or activity limitation, with or without the use of assistive devices.
Figure 3.12.1 below shows the type and degree of difficulty persons had at the time of the Census. It should be noted that the responses in this question are subjective, that is, dependent on how the respondent rated himself/herself or the proxy respondent rated another household member.

Statistics South Africa P0301.4
Census 2011 Statistical release – P0301.4
43
Figure 3.28: Percentage distribution of population aged 5 years and older by type and degree of difficulty
Results indicate that most people (more than 90%) had no difficulty or limitation that prevented them from carrying out certain functions at the time of the Census.
Figure 3.29: Percentage distribution of population using assistive devices
In addition to the question on general health and functioning, a question was included in the Census to measure to what extent does the population, particularly those with disabilities access assistive devices to execute certain functions. However, due to poor response to this question, only persons aged 5 years and older are profiled in this report. It should also be noted that this question was not limited to persons that indicated that they have difficulties. Figure 3.12.2 depicts that eye glasses and chronic medication were more used compared to other assistive devices (14% and 12 % respectively).

Statistics South Africa P0301.4
Census 2011 Statistical release – P0301.4
44
3.12 Labour market status
3.12.1 The labour market in South Africa
3.12.1.1 Introduction
The source of ‘official’ labour market statistics in the country is the Quarterly Labour Force Survey (QLFS). Census 2011 also included labour market questions; however, the results may be different from those obtained from the QLFS completed in the fourth quarter of 2011 (QLFS_Q4:2011) for two main reasons. The reference period for employment in Census 2011 was fixed (the week before the Census night – 9 October 2011). In contrast, the QLFS used a moving reference period (the week prior to the date of the interview) over a three-month period. The QLFS therefore included persons who were employed during the course of every month in the October–December quarter while in principle, the Census only included those employed in the first week of October. In addition, Census 2011 results are based on the de facto measure of the population while the QLFS is based on the de jure measure. As a result, the household questionnaire used in Census 2011 to collect labour market information was not intended for persons who either spent Census night in institutions or were transients. To the extent that these groups included employed persons, their labour market status would not be known, since they were only required to complete a shorter questionnaire which excluded labour market questions.
Comparisons of the results of the post-apartheid population Censuses over time will not be discussed here but will be analysed in detail in a forthcoming publication. Changes to key questions over the years mean that the labour market outcomes based on the post-apartheid Censuses and the Community Survey have to be analysed with caution.
The analysis in the first section compares the results of the population Census conducted in October 2011 (Census 2011) with the Quarterly Labour Force Survey (QLFS_Q4:2011) conducted in the fourth quarter of 2011 (October–December). The QLFS has not been benchmarked to the new population figures and the results are therefore only broadly indicative of the differences with Census 2011. The QLFS_Q4:2011 figures will therefore change after the benchmarking process. Although the analysis in the final section focuses only on the results of Census 2011, the patterns are similar to those in the QLFS_Q4:2011.
Key labour market concepts and definitions
Employed: Persons who work for pay, profit, or family gain, in the reference period.
Unemployed (official definition): Persons who did not work, but who looked for work and were available to work in the reference period.
Unemployed (expanded definition): Persons who did not work, but were available to work in the reference period.
Not economically active: Persons who were neither employed nor unemployed (e.g. full-time students; retired persons; and homemakers who did not want to work).
Labour force: Employed persons plus unemployed persons.
Working-age population: Persons aged 15–64 years.
Unemployment rate: Unemployed persons as a percentage of the labour force.
Labour force participation rate: Labour force as a percentage of the working age population.
Labour absorption rate: Employed persons as a percentage of the working age population.
Formal and informal sector: An objective measure is used in the QLFS based on VAT/income tax registration and establishment size, while a subjective measure is used in Census 2011. Also, in line with ILO guidelines, persons employed in agriculture and private households are not usually included in the formal and informal sectors, but are identified as separate categories. It is not currently possible to identify agricultural employment in Census 2011 since the coding of industry and occupation has not yet been completed. Sectoral distributions therefore include persons employed in agriculture. And with regard to persons employed in private households, the results are not based on the

Statistics South Africa P0301.4
Census 2011 Statistical release – P0301.4
45
3.12.1.2 National labour market results from Census 2011 and the QLFS_Q4:2011
This section focuses on the national results of Census 2011 compared with the QLFS_Q4:2011 for key labour market indicators.
Table 3.8: Labour market outcomes in Census 2011 and QLFS_Q4:2011
QLFS_Q4:2011 Census 2011 *Difference % difference
Formal sector (including agriculture) 10 163 553 9 756 228 -407 325 -4,0
Informal sector (including agriculture) 2 216 063 1 613 078 -602 985 -27,2
Unspecified 311 064 311 064
Private households 1 117 678 1 499 708 382 030 34,2
Employed 13 497 294 13 180 077 -317 217 -2,4
Working age 32 670 416 33 238 752 568 336 1,7
Absorption rate 41,3 39,7 -1,6
Official definition
Unemployed 4 244 197 5 594 055 1 349 858 31,8
Not economically active 14 928 925 14 464 620 -464 305 -3,1
Labour force 17 741 491 18 774 132 1 032 641 5,8
Unemployment rate 23,9 29,8 5,9
Labour force participation rate 54,3 56,5 2,2
Expanded definition
Unemployed 7 395 871 8 779 621 1 383 750 18,7
Not economically active 11 777 251 11 279 054 -498 197 -4,2
Labour force 20 893 165 21 959 698 1 066 533 5,1
Unemployment rate 35,4 40,0 4,6
Labour force participation rate 64,0 66,1 2,1 *Census 2011 minus QLFS_Q4:2011
Table 3.8 shows that nationally, based on Census 2011, both formal and informal sector employment was lower than in QLFS_Q4:2011. As a result, the total number of employed persons was lower in Census 2011 by 317 217 (2,4%) than in QLFS_Q4:2011. This is largely due to the difference in the reference period used in Census 2011 (one week) compared with the reference period of three months used in the QLFS_Q4:2011. In effect, persons employed in short-term/casual jobs are more likely to be captured in QLFS than in Census 2011. Also, as discussed earlier, Census 2011 measured the de facto population while QLFS_Q4:2011 measured the de jure population.

Statistics South Africa P0301.4
Census 2011 Statistical release – P0301.4
46
Reflecting the employment outcomes, the labour absorption rate was lower in Census 2011 by 1,6 percentage points compared with the QLFS_Q4:2011. Based on the official definition, the difference in the labour force participation rate between Census 2011 and the QLFS was 2,2 percentage points. Based on the expanded definition, the difference was 2,1 percentage points.
The difference in the unemployment rate was somewhat larger. In terms of the official definition, the unemployment rate was 23,9% in the QLFS_Q4:2011 and 29,8% in Census 2011 – a difference of 5,9 percentage points. In terms of the expanded definition, the difference between the unemployment rates from the two instruments was smaller (4,6 percentage points).
3.12.1.3 Provincial labour market rates based on Census 2011 and QLFS_Q4:2011
The national labour market rates shown in Table 1 often mask large variations by province. This reflects differences in urbanisation as well as differences in the economic structure of the provinces.
Figure 3.30: Unemployment rate (official) Figure 3.31: Unemployment rate (expanded) by province* by province*
WC GP NC NW MP FS KZN EC LP RSA
QLFS_Q4:2011 21.6 25.1 26.7 24.6 27.7 29.4 19.3 27.1 20.2 23.9
Census 2011 21.6 26.3 27.4 31.5 31.6 32.6 33.0 37.4 38.9 29.8
0.0
10.0
20.0
30.0
40.0
50.0
60.0
%
* Note: The provincial order in the above two figures corresponds with the order used in the QLFS, and is therefore different from the geocode which is used in other publications.
Figure 3.30 and Figure 3.31 show that, based on both the official and the expanded definitions, the difference in the unemployment rate between Census 2011 and QLFS_Q4:2011 is largest in KwaZulu-Natal, Eastern Cape and Limpopo. In these provinces, the informal sector accounts for a larger share of total employment compared to most of the other provinces, and this sector is known to generate short-term/casual jobs. The difference in the reference periods for employment in Census 2011 and the QLFS means that such jobs are more likely to have been captured in QLFS than in Census 2011.
WC GP NC NW MP FS KZN EC LP RSA
QLFS_Q4 24.3 29.9 35.1 45.0 42.8 37.1 36.6 40.9 44.7 35.4
Census 29.3 32.8 38.6 41.4 42.0 42.1 47.6 51.2 49.9 40.0
0.0
10.0
20.0
30.0
40.0
50.0
60.0
%

Statistics South Africa P0301.4
Census 2011 Statistical release – P0301.4
47
Figure 3.32: Labour force participation rate Figure 3.33: Labour force participation rate (official) by province* (expanded) by province*
WC GP NC NW MP FS KZN EC LP RSA
QLFS_Q4 67.9 70.0 54.9 45.3 54.4 56.9 46.7 43.4 36.5 54.3
Census 65.7 70.0 54.0 55.3 55.5 55.5 47.7 42.5 45.7 56.5
0.0
10.0
20.0
30.0
40.0
50.0
60.0
70.0
80.0
90.0
%
WC GP NC NW MP FS KZN EC LP RSA
QLFS_Q4 70.4 74.8 62.0 62.1 68.8 63.8 59.4 53.5 52.7 64.0
Census 72.9 76.7 63.8 64.7 65.4 64.6 61.0 54.5 55.7 66.1
0.0
10.0
20.0
30.0
40.0
50.0
60.0
70.0
80.0
90.0
%
* Note: The provincial order in the above two figures corresponds with the order used in the QLFS, and is therefore different from the geocode which is used in other publications.
The similarity in the labour force participation rate (official and expanded) based on Census 2011 and QLFS_Q4:2011 at national level is reflected in most provinces (Figure 3.32 and Figure 3.33).
3.12.1.4 Key labour market rates by population group, based on Census 2011
This section analyses the results of Census 2011 by population group. The black African population group accounts for 78,2% of the working age population while the white population accounts for 9,3%, the coloured population for 9,1% and the Indian/Asian population for 2,8%. This distribution affects many of the labour market outcomes analysed in this section.
Figure 3.34: Unemployment rate by population Figure 3.35: Labour force participation rate by group, Census 2011 population group, Census 2011
Black African Coloured Indian/Asian White Total
Official 35,6 22,3 11,7 5,9 29,8
Expanded 46,3 31,5 17,8 10,2 40,0
0,0
10,0
20,0
30,0
40,0
50,0
60,0
70,0
80,0
%
Figure 3.34 shows that the unemployment rate among the black African population group is highest, while among the white population group it is the lowest. In terms of the labour force participation rate (LFPR), the reverse is true – the LFPR among black Africans is lowest while that among the white population group is highest (Figure 3.35). A similar pattern is observed in the QLFS.
Black African Coloured Indian/Asian White Total
Official 53,7 60,4 61,7 73,3 56,5
Expanded 64,4 68,5 66,4 76,8 66,1
0,0
10,0
20,0
30,0
40,0
50,0
60,0
70,0
80,0
%
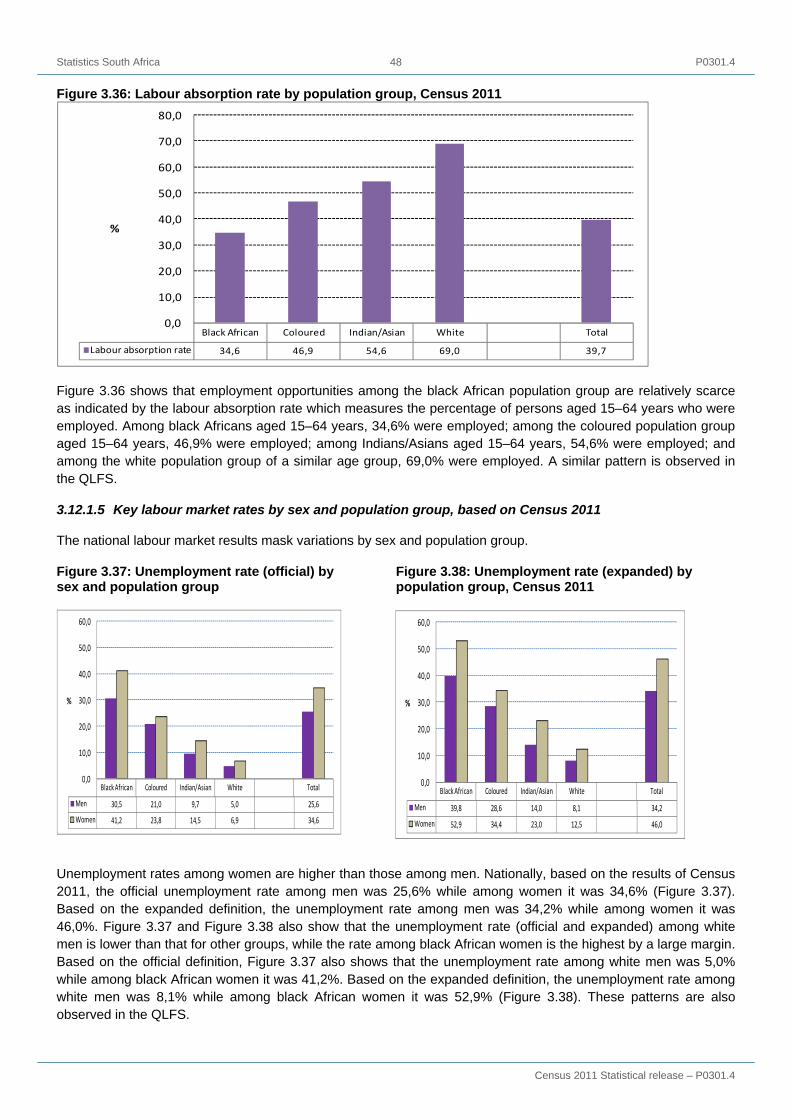
Statistics South Africa P0301.4
Census 2011 Statistical release – P0301.4
48
Figure 3.36: Labour absorption rate by population group, Census 2011
Black African Coloured Indian/Asian White Total
Labour absorption rate 34,6 46,9 54,6 69,0 39,7
0,0
10,0
20,0
30,0
40,0
50,0
60,0
70,0
80,0
%
Figure 3.36 shows that employment opportunities among the black African population group are relatively scarce as indicated by the labour absorption rate which measures the percentage of persons aged 15–64 years who were employed. Among black Africans aged 15–64 years, 34,6% were employed; among the coloured population group aged 15–64 years, 46,9% were employed; among Indians/Asians aged 15–64 years, 54,6% were employed; and among the white population group of a similar age group, 69,0% were employed. A similar pattern is observed in the QLFS.
3.12.1.5 Key labour market rates by sex and population group, based on Census 2011
The national labour market results mask variations by sex and population group.
Figure 3.37: Unemployment rate (official) by Figure 3.38: Unemployment rate (expanded) by sex and population group population group, Census 2011
Black African Coloured Indian/Asian White Total
Men 30,5 21,0 9,7 5,0 25,6
Women 41,2 23,8 14,5 6,9 34,6
0,0
10,0
20,0
30,0
40,0
50,0
60,0
%
Unemployment rates among women are higher than those among men. Nationally, based on the results of Census 2011, the official unemployment rate among men was 25,6% while among women it was 34,6% (Figure 3.37). Based on the expanded definition, the unemployment rate among men was 34,2% while among women it was 46,0%. Figure 3.37 and Figure 3.38 also show that the unemployment rate (official and expanded) among white men is lower than that for other groups, while the rate among black African women is the highest by a large margin. Based on the official definition, Figure 3.37 also shows that the unemployment rate among white men was 5,0% while among black African women it was 41,2%. Based on the expanded definition, the unemployment rate among white men was 8,1% while among black African women it was 52,9% (Figure 3.38). These patterns are also observed in the QLFS.
Black African Coloured Indian/Asian White Total
Men 39,8 28,6 14,0 8,1 34,2
Women 52,9 34,4 23,0 12,5 46,0
0,0
10,0
20,0
30,0
40,0
50,0
60,0
%

Statistics South Africa P0301.4
Census 2011 Statistical release – P0301.4
49
Figure 3.39: Labour force participation rate Figure 3.40: Labour force participation rate (official) by sex and population group (expanded) by sex and population group
Black African Coloured Indian/Asian White Total
Men 58,7 65,7 71,9 79,7 61,9
Women 49,0 55,5 51,4 67,2 51,4
0,0
10,0
20,0
30,0
40,0
50,0
60,0
70,0
80,0
90,0
%
Figure 3.39 shows that the labour force participation rate (official) is lowest among women in the black African population group and highest among men in the white population group. Based on the expanded definition, Figure 3.40 shows that the labour force participation rate is lowest among women in the Indian/Asian population group.
Figure 3.41: Labour absorption rate by sex and population group
Black African Coloured Indian/Asian White Total
Men 40,8 52,0 64,9 75,7 46,0
Women 28,8 42,3 43,9 62,5 33,6
0,0
10,0
20,0
30,0
40,0
50,0
60,0
70,0
80,0
90,0
%
Figure 3.41 reflects a skewed distribution of employment opportunities among men and women by population group. The labour absorption rate among black African men was 40,8% compared with 75,7% among white men, while the LFPR among black African women was 28,8% compared with 62,5% among white women.
Figure 3.41 also shows that in terms of the other population groups, the labour absorption rate among men in the coloured population group was 52,0% and among women in that group it was 42,3%. Among the Indian/Asian population group, the absorption rate was 64,9% among men and 43,9% among women.
Black African Coloured Indian/Asian White Total
Men 67,8 72,8 75,5 82,4 70,0
Women 61,2 64,5 57,0 71,5 62,4
0,0
10,0
20,0
30,0
40,0
50,0
60,0
70,0
80,0
90,0
%
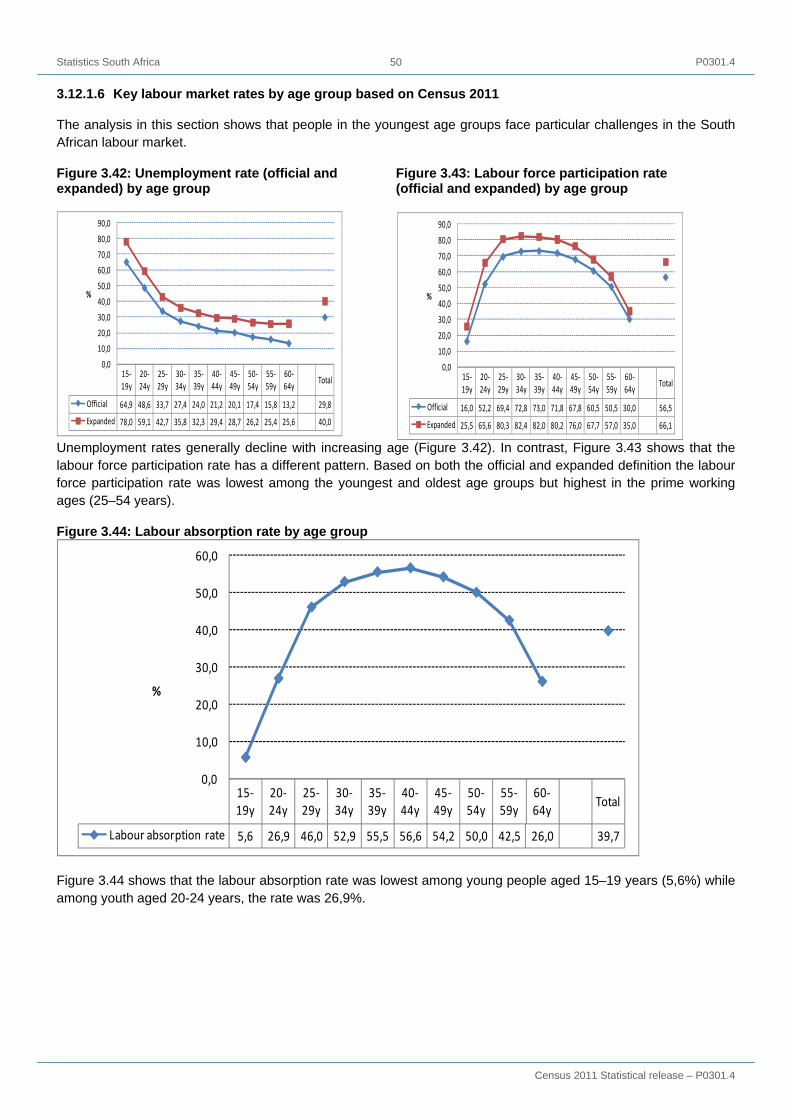
Statistics South Africa P0301.4
Census 2011 Statistical release – P0301.4
50
3.12.1.6 Key labour market rates by age group based on Census 2011
The analysis in this section shows that people in the youngest age groups face particular challenges in the South African labour market.
Figure 3.42: Unemployment rate (official and Figure 3.43: Labour force participation rate expanded) by age group (official and expanded) by age group
15-19y
20-24y
25-29y
30-34y
35-39y
40-44y
45-49y
50-54y
55-59y
60-64y
Total
Official 64,9 48,6 33,7 27,4 24,0 21,2 20,1 17,4 15,8 13,2 29,8
Expanded 78,0 59,1 42,7 35,8 32,3 29,4 28,7 26,2 25,4 25,6 40,0
0,0
10,0
20,0
30,0
40,0
50,0
60,0
70,0
80,0
90,0
%
Unemployment rates generally decline with increasing age (Figure 3.42). In contrast, Figure 3.43 shows that the labour force participation rate has a different pattern. Based on both the official and expanded definition the labour force participation rate was lowest among the youngest and oldest age groups but highest in the prime working ages (25–54 years).
Figure 3.44: Labour absorption rate by age group
15-19y
20-24y
25-29y
30-34y
35-39y
40-44y
45-49y
50-54y
55-59y
60-64y
Total
Labour absorption rate 5,6 26,9 46,0 52,9 55,5 56,6 54,2 50,0 42,5 26,0 39,7
0,0
10,0
20,0
30,0
40,0
50,0
60,0
%
Figure 3.44 shows that the labour absorption rate was lowest among young people aged 15–19 years (5,6%) while among youth aged 20-24 years, the rate was 26,9%.
15-19y
20-24y
25-29y
30-34y
35-39y
40-44y
45-49y
50-54y
55-59y
60-64y
Total
Official 16,0 52,2 69,4 72,8 73,0 71,8 67,8 60,5 50,5 30,0 56,5
Expanded 25,5 65,6 80,3 82,4 82,0 80,2 76,0 67,7 57,0 35,0 66,1
0,0
10,0
20,0
30,0
40,0
50,0
60,0
70,0
80,0
90,0
%

Statistics South Africa P0301.4
Census 2011 Statistical release – P0301.4
51
3.13 Conclusion
The specialised labour market surveys were introduced by Stats SA in the 1990s specifically for collecting ‘Official’ labour market information regarding persons who are employed, those who are unemployed and those who are not economically active. Although Census 2011 also included labour market questions, the results differ from those in the QLFS for two main reasons. Firstly, the reference period for employment in Census 2011 was one week while in the QLFS it covered a three-month period. Compared with Census 2011, the QLFS is therefore more likely to have captured individuals who worked on a casual/part-time basis. Secondly, the Census used a de facto measure of the population while QLFS used a de jure measure. As a result, employed persons who were not in private households on Census night (e.g. persons who were in hotels or guest houses) were required to complete a shorter questionnaire which did not include labour market questions.
The comparison of Census 2011 national results with those of the QLFS_Q4:2011 suggest that the patterns of key labour market indicators based on population group, age, and sex are similar although the levels may sometimes be different. The Census 2011 results show that among the black African population, the unemployment rate (official and expanded) is higher than among the other groups, while among the white population group the unemployment rate is lowest. Census 2011 results also show that the unemployment rate among black African women is 41,2% based on the official definition and 52,9% based on the expanded definition. In contrast, the unemployment rate among white women is 6,9% based on the official definition and 12,5% based on the expanded definition. With regard to the situation of young people in the South African labour market, the Census 2011 results show that the unemployment rate among youth aged 15-24 years is higher than in the older age groups.
The provincial comparisons of Census 2011 results with those of QLFS_Q4:2011 suggest that, based on both the official and the expanded definition, the difference in the unemployment rate between Census 2011 and QLFS_Q4:2011 is largest in KwaZulu-Natal, Eastern Cape and Limpopo. In these provinces, the informal sector accounts for a larger share of total employment compared to most of the other provinces, and this sector is known to generate short-term/casual jobs. The difference in the reference periods for employment in Census 2011 and the QLFS means that such jobs are more likely to have been captured in the QLFS than in Census 2011.

Statistics South Africa P0301.4
Census 2011 Statistical release – P0301.4
52
3.14 Housing
3.14.1 Introduction
Housing is one of the basic human needs and has both direct and indirect implications on lives of households including health, welfare and social status in communities. A number of questions were included in Census 2011 to enable analysis on how households live and their access to various services and facilities. This section highlights Census findings relating to types of main dwellings and basic services which have important policy implications.
Table 3.9: Distribution of households by province - Censuses 1996, 2001, 2011 and Community Survey 2007
Census 2001 CS 2007 Census 2011
Province Households (%) Households (%) Households (%)
Western Cape 1 173 304 10,5 1 369 180 11 1 634 000 11,3
Eastern Cape 1 481 640 13,2 1 586 739 12,7 1 687 385 11,7
Northern Cape 245 086 2,2 264 653 2,1 301 405 2,1
Free State 733 302 6,5 802 872 6,4 823 316 5,7
KwaZulu-Natal 2 117 274 18,9 2 234 129 17,9 2 539 429 17,6
North West 816 643 7,3 911 120 7,3 1 062 015 7,3
Gauteng 2 735 168 24,4 3 175 579 25,4 3 909 022 27,1
Mpumalanga 785 433 7,0 940 403 7,5 1 075 488 7,4
Limpopo 1 117 855 10,0 1 215 935 9,7 1 418 102 9,8
South Africa 11 205 705 100,0 12 500 609 100,0 14 450 161 100,0
Table 3.3.1 shows that Gauteng and KwaZulu-Natal have the highest number of households; approximately 3,9 and 2,5 million respectively while Northern Cape and Free State have the lowest number of households 823 316 and 301 405 respectively.
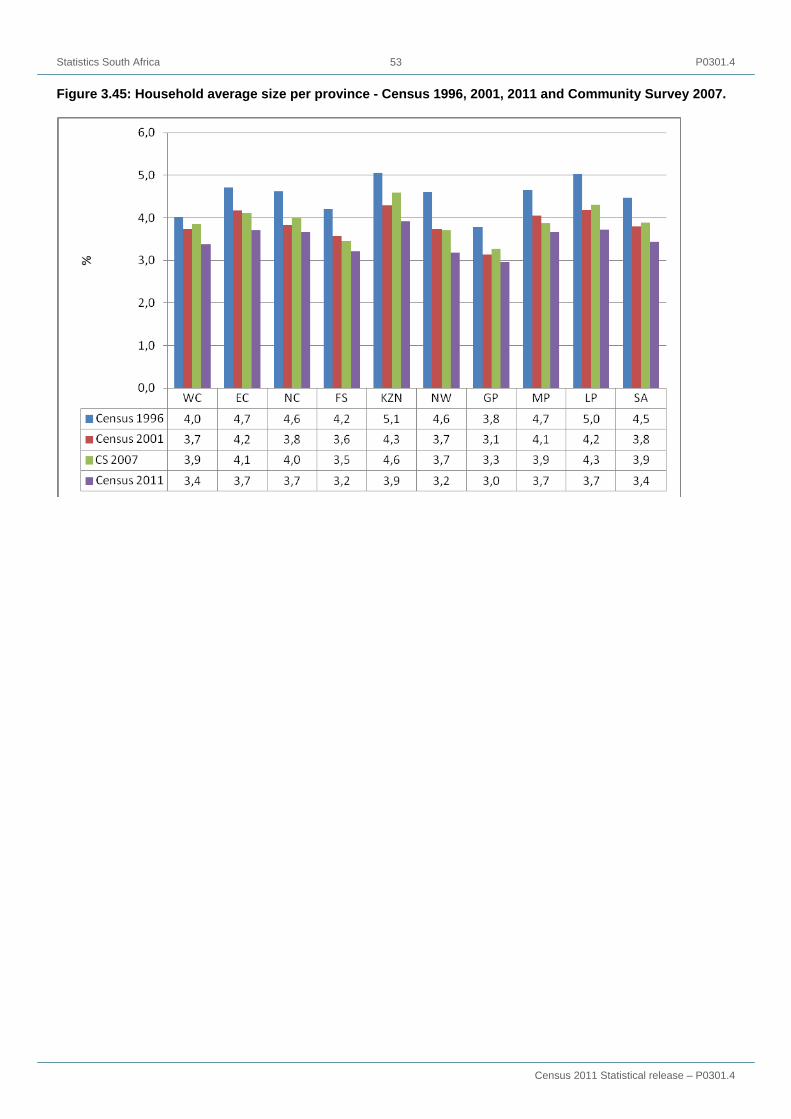
Statistics South Africa P0301.4
Census 2011 Statistical release – P0301.4
53
Figure 3.45: Household average size per province - Census 1996, 2001, 2011 and Community Survey 2007.

Statistics South Africa P0301.4
Census 2011 Statistical release – P0301.4
54
Figure 3.45: above shows that the average household size for South Africa has decreased by approximately 1,1 persons since 1996. Estimated household size in KwaZulu-Natal has been the highest while it has been the lowest for Gauteng since 1996.
Figure3.46: Percentage distribution of households by type of main dwelling, Censuses 1996, 2001, 2011 and 2007 Community Survey
Figure3.46: above shows a steady increase in the percentage of households living in formal dwellings over time; the percentage of households living in traditional dwellings has almost halved while the percentage of households living in informal dwellings has decreased from 16,2% in 1996 to 13,6 in 2011.

Statistics South Africa P0301.4
Census 2011 Statistical release – P0301.4
55
Figure 3.47: Percentage distribution of households by tenure status, Censuses 2001, 2011, and 2007 Community Survey

Statistics South Africa P0301.4
Census 2011 Statistical release – P0301.4
56
Figure 3.47: shows that the proportion of households that owned and paid off their properties was the same in 1996 and 2011 (41,3%). The proportion of households who rented their dwellings has increased while that of those which occupied rent free dwellings and those owning their homes but not yet paid off decreased slightly .
Figure 3.48: Percentage distribution of households by tenure status per province according to Census 2011
From the above figure, Gauteng and Western Cape have relatively high proportions of households with rented housing tenure status of 37,1% and 28,9% respectively. Eastern Cape and Limpopo have relatively lower proportions; 14,9% and 12,6% respectively. Those who owned but had not yet paid off their houses are higher in Western Cape (17,2%) and Gauteng (16,4%) and lower in North West (6,6%) and Limpopo (5,0%), while Eastern Cape and Free State each have 9%.
Among those who occupied their houses rent free are more prevalent in Limpopo than in other provinces with 27,4%, followed by 20,9% and 20% in Northern Cape and North West respectively. The households who owned fully paid off houses are highest in Limpopo (52,7%) and Mpumalanga (52,0%) followed by Free State and Eastern Cape with 51,6% and 50,7% respectively. However, Western Cape and Gauteng have less proportions of households who have this kind of housing tenure status; 35,3% and 27,9% respectively.
Figure 3.49: Proportion of households which had access to piped water, Census 1996, Census 2001, Community Survey 2007, and Census 2011

Statistics South Africa P0301.4
Census 2011 Statistical release – P0301.4
57
Figure 3.49: above shows an increase in the proportion of households which had access to piped water, and this has significantly increased since 1996.
The figure also shows a constant decrease in the number of households without access to piped water.
Figure 3.50: Percentage of households which have access to piped water by province, Census 2011
The above table shows the proportion of households that have access to piped water within each province. The combination of piped water inside the dwelling and outside the yard is high in all provinces apart from Eastern Cape and Limpopo which have the lowest proportions. The highest proportion of those with piped water inside the dwelling or yard is found in Gauteng with 89,4% followed closely by Free State with 89,1%. Western Cape is the third highest at 88,4% of households in this category.
The households that reported to have no access to piped water are highest in Eastern Cape (22,2%), followed by 14,1% in KwaZulu-Natal and Limpopo with 14,0%. However, there are only 1,8% households in Gauteng with no access to piped water, followed by Free State and Northern Cape at 2,2% and 2,6% respectively.

Statistics South Africa P0301.4
Census 2011 Statistical release – P0301.4
58
Figure 3.51: Percentage distribution of households by type of toilet facility, Census 2001, Community Survey 2007, and Census 2011
The government has a responsibility to improve sanitation to its people. According to the above graph, households that have flush toilets connected to the sewage system increased persistently to 57,0% in Census 2011 from 50% and 55% in both Census 2001 and CS 2007 respectively. Those which have flush toilets with septic tank were lower in CS 2007 (2,8%) compared to 3% and 3,1% in Census 2001 and Census 2011 respectively.
Households having pit toilet with ventilation (i.e. VIP) increased to 8,8% in Census 2011 from 5,6% and 6,6% in Census 2001 and CS 2007 respectively. Access to pit toilet without ventilation declined from 22,3% in Census 2001 to 19,3% in Census 2011. Chemical toilets were under-utilised in CS 2007 with only 0,4% less than 1,9% in Census 2001 and 2,5% in Census 2011. Bucket toilet system was more common in Census 2001 with 3,9% compared to CS 2007 and Census 2011 that reported 2,2% and 2,1% respectively. The percentage of households that were without toilets declined significantly to 5,2% in Census 2011 from the 13,3% and 8,3% reported in both Census 2001 and CS 2007 respectively.

Statistics South Africa P0301.4
Census 2011 Statistical release – P0301.4
59
Figure 3.52: Percentage distribution of households by type of energy used for lighting, Census 1996, 2001, and 2011, CS 2007
Note: Category ‘None’ is excluded from the Census 2011 analysis
Figure 3.52 shows that households using electricity for lighting increased from 58,2% in 1996 to 84,7% in 2011, while those using paraffin and candles decreased over the same period. The use of paraffin and candles for lighting also decreased from 12,7% to 3,0% and from 28,7% to 11,4% in 1996 and 2011, respectively.
Figure 3.53: Percentage of households that use electricity for lighting, Census 1996, 2001, 2011 and 2007 CS 2007

Statistics South Africa P0301.4
Census 2011 Statistical release – P0301.4
60
Figure 3.53 shows that the proportion of households that are using electricity for lighting has increased in all the provinces.
Figure 3.54: Percentage distribution of households by type of energy used for cooking, Census 1996, 2001, 2011 and 2007 CS
Note: Category ‘None’ is excluded from the Census 2011 analysis
From the above figure, electricity has been more common in South Africa as a source of energy for cooking since Census 1996. Figure 3.54 shows that the proportion of households using electricity for cooking increased from 47,5% to 73,9% in 1996 to 2011 respectively. The proportion of households using paraffin, wood and coal as sources of energy for cooking decreased from 21,6%, 23,0% and 3,6% to 8,5%, 12,5% and 0,7% in Census 1996 and 2011 respectively.
Figure 3.55: Percentage of households using electricity for cooking by province, Census 1996, 2001, 2011 and 2007 CS

Statistics South Africa P0301.4
Census 2011 Statistical release – P0301.4
61
Figure 3.55: shows upward trend in proportion of households using electricity for cooking in all provinces.
Figure 3.56: Percentage distribution of households by type of energy used for heating, Censuses 1996, 2001, 2011 and CS 2007
Note: Category ‘None’ is excluded from the Census 2011 analysis
Figure 3.56: shows that the proportion of households using electricity for heating has increased since 1996. The proportion of households using wood for heating increased sharply between 1996 and 2001 and gradually decreased thereafter.
Figure 3.57: Percentage of households using electricity for heating by province, Censuses 1996, 2001, 2011 and 2007 CS

Statistics South Africa P0301.4
Census 2011 Statistical release – P0301.4
62
Figure 3.57: shows an increase in the proportion of households using electricity for heating, and shows that it has increased since 1996 in all provinces. The highest proportions were recorded in Gauteng (74,7%).
Figure 3.58: Provincial percentage distributions of households by mode of refuse removal according to Censuses 1996, 2001, 2011 and CS 2007
Figure 3.58 shows that the percentages of households that have refuse disposal service where the refuse is removed by local authority weekly have increased consistently from 52,1% in 1996 to 62,1% in 2011 while those removed less often declined from 2,2% in 2001 to 1,5% in 2011. The households depending on communal refuse dump decreased slightly to 1,9 % in Census 2011 from 2,2% in CS 2007. There is minor decrease of those owning refuse dumps at 28,2% in Census 2011 from 28.8% in CS 2007. Proportion of households without refuse disposal declined significantly from 9,7% to 5,4% in 1996 and 2011 respectively.
Figure 3.59: Percentage distribution of households owning various household goods, Censuses 2001, 2011 and CS 2007

Statistics South Africa P0301.4
Census 2011 Statistical release – P0301.4
63
The above graph shows the proportion of households owning cell phones increased from 31,9% in 2001 to 88,9% in Census 2011 while the proportion using landline/telephone has decreased from 23,9% in 2001 to 14,5% in 2011. The proportion owning radios decreased from 72,1% in 2001 to 67,5% in Census 2011. Proportion of households with computers increased from 8,5% to 21,1% between 2001 and 2011 respectively, followed by ownership of refrigerators with 49,9% in 2001 increasing to 67,6% in 2011.
Figure 3.60: Percentage of households by ownership of selected household goods in working condition, Census 2011
The above figure shows the proportions of households who own selected goods and services (in working condition) for Census 2011. Households with electric/ gas stove, DVD player and Mail delivery at residence are more prevalent at 77%, 59,3% and 48,1% respectively. Households with Mail post boxes are at 27,4% while those with satellite TV remain at 25,8%. The households that use vacuum cleaners have the lowest proportions at 17,5% while those owning washing machine and motorcar differ slightly at 31,5% and 29,5% respectively.
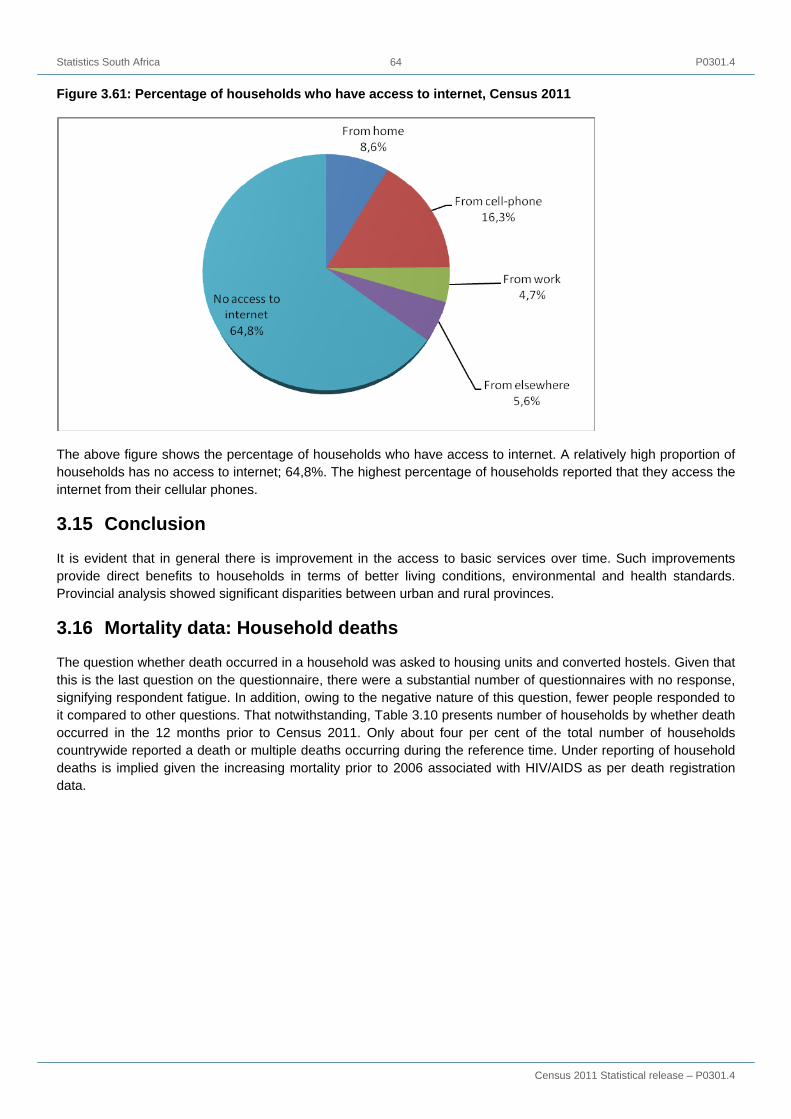
Statistics South Africa P0301.4
Census 2011 Statistical release – P0301.4
64
Figure 3.61: Percentage of households who have access to internet, Census 2011
The above figure shows the percentage of households who have access to internet. A relatively high proportion of households has no access to internet; 64,8%. The highest percentage of households reported that they access the internet from their cellular phones.
3.15 Conclusion
It is evident that in general there is improvement in the access to basic services over time. Such improvements provide direct benefits to households in terms of better living conditions, environmental and health standards. Provincial analysis showed significant disparities between urban and rural provinces.
3.16 Mortality data: Household deaths
The question whether death occurred in a household was asked to housing units and converted hostels. Given that this is the last question on the questionnaire, there were a substantial number of questionnaires with no response, signifying respondent fatigue. In addition, owing to the negative nature of this question, fewer people responded to it compared to other questions. That notwithstanding, Table 3.10 presents number of households by whether death occurred in the 12 months prior to Census 2011. Only about four per cent of the total number of households countrywide reported a death or multiple deaths occurring during the reference time. Under reporting of household deaths is implied given the increasing mortality prior to 2006 associated with HIV/AIDS as per death registration data.

Statistics South Africa P0301.4
Census 2011 Statistical release – P0301.4
65
Table 3.10: Number of households by whether death occurred or not, Census 2011
Status of households by whether death occurred or not
Western Cape
Eastern Cape
Northern Cape
FreeState
KwaZulu-Natal
NorthWest Gauteng Mpumalanga Limpopo
South Africa
Yes 41 888 82 452 13 201 40 921 121 256 41 703 105 131 47 534 52 209 546 295
No 1 588 958 1 602 236 287 658 780 843 2 413 529 1 018 056 3 794 050 10 26 123 1 363 839 13 875 292
Do not know 3 154 2 697 547 1 551 4 644 2 256 9 841 1 831 2 054 28 575
Total 1 634 000 1 687 385 301 405 823 316 2 539 429 1 062 015 3 909 022 10 75 488 1 418 102 14 450 162 Note: Total number of households includes housing units and converted hostels Table 3.5.2 presents the number of deaths reported per household by province. Overall, about 87% of households reported only one death occurrence during the 12 months prior to Census 2011. Even so, about two per cent of households reported three deaths within the reference period. Nevertheless, it appears that eight is the limit of number of deaths within one household annually.

Statistics South Africa P0301.4
Census 2011 Statistical release – P0301.4
66
Table 3.11: Number of deaths reported by households by province, Census 2011
Number of deaths per household
Western Cape
Eastern Cape
Northern Cape
Free State
KwaZulu-Natal
North West Gauteng Mpumalanga Limpopo
South Africa
1 41 261 79 051 12 470 38 744 113 509 39 669 102 931 45 733 50 484 523 852
2 3 122 10 490 1 493 4 448 17 571 4 847 10 632 4 881 4 274 61 758
3 634 1551 205 672 3 057 805 2 194 621 525 10 264
4 202 558 122 247 1 504 341 1 049 361 278 4 662
5 58 236 5 45 352 86 543 77 61 1 463
6 0 106 29 25 262 19 219 76 36 772
7 78 25 7 56 121 45 143 35 22 532
8 and above 98 168 36 81 261 92 356 43 106 1 241
Total 45 453 92 185 14 369 44 318 136 636 45 903 118 066 51 828 55 786 604 544 Note: Total number of deaths may not be the same due to rounding off
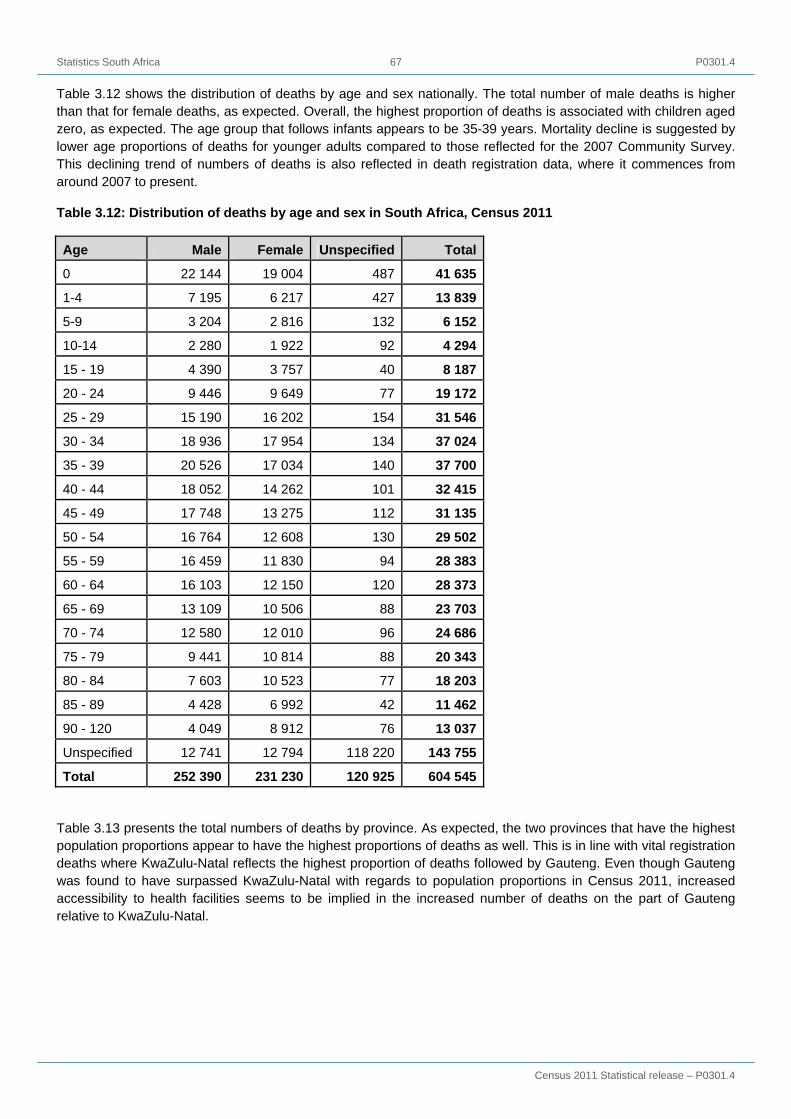
Statistics South Africa P0301.4
Census 2011 Statistical release – P0301.4
67
Table 3.12 shows the distribution of deaths by age and sex nationally. The total number of male deaths is higher than that for female deaths, as expected. Overall, the highest proportion of deaths is associated with children aged zero, as expected. The age group that follows infants appears to be 35-39 years. Mortality decline is suggested by lower age proportions of deaths for younger adults compared to those reflected for the 2007 Community Survey. This declining trend of numbers of deaths is also reflected in death registration data, where it commences from around 2007 to present.
Table 3.12: Distribution of deaths by age and sex in South Africa, Census 2011
Age Male Female Unspecified Total
0 22 144 19 004 487 41 635
1-4 7 195 6 217 427 13 839
5-9 3 204 2 816 132 6 152
10-14 2 280 1 922 92 4 294
15 - 19 4 390 3 757 40 8 187
20 - 24 9 446 9 649 77 19 172
25 - 29 15 190 16 202 154 31 546
30 - 34 18 936 17 954 134 37 024
35 - 39 20 526 17 034 140 37 700
40 - 44 18 052 14 262 101 32 415
45 - 49 17 748 13 275 112 31 135
50 - 54 16 764 12 608 130 29 502
55 - 59 16 459 11 830 94 28 383
60 - 64 16 103 12 150 120 28 373
65 - 69 13 109 10 506 88 23 703
70 - 74 12 580 12 010 96 24 686
75 - 79 9 441 10 814 88 20 343
80 - 84 7 603 10 523 77 18 203
85 - 89 4 428 6 992 42 11 462
90 - 120 4 049 8 912 76 13 037
Unspecified 12 741 12 794 118 220 143 755
Total 252 390 231 230 120 925 604 545
Table 3.13 presents the total numbers of deaths by province. As expected, the two provinces that have the highest population proportions appear to have the highest proportions of deaths as well. This is in line with vital registration deaths where KwaZulu-Natal reflects the highest proportion of deaths followed by Gauteng. Even though Gauteng was found to have surpassed KwaZulu-Natal with regards to population proportions in Census 2011, increased accessibility to health facilities seems to be implied in the increased number of deaths on the part of Gauteng relative to KwaZulu-Natal.

Statistics South Africa P0301.4
Census 2011 Statistical release – P0301.4
68
Table 3.13: Distribution of deaths by age, sex and province, Census 2011
Western Cape Eastern Cape Northern Cape Age Male Female Unspecified Total Male Female Unspecified Total Male Female Unspecified Total
0 957 796 21 1 775 3 094 2 642 53 5 789 480 450 8 938
1-4 310 222 17 549 1 089 909 46 2 044 197 129 7 332
5-9 192 149 12 353 539 470 10 1 019 98 42 3 143
10-14 123 90 5 218 355 314 7 676 53 39 0 91
15 - 19 366 189 3 558 954 731 6 1 691 121 84 0 205
20 - 24 895 500 3 1 398 2 048 1 795 15 3 858 214 205 0 419
25 - 29 1 004 706 3 1 712 2 854 3 041 31 5 926 324 340 2 666
30 - 34 986 680 10 1 676 3 341 3 170 10 6 521 419 373 1 794
35 - 39 1 176 760 7 1 943 3 425 2 824 23 6 271 429 412 1 843
40 - 44 1 024 857 10 1 891 2 813 2 209 13 5 035 477 382 4 862
45 - 49 1 216 879 11 2 106 2 866 2 147 17 5 030 489 385 3 877
50 - 54 1 393 1 057 3 2 453 2 825 2 112 22 4 959 513 387 9 909
55 - 59 1 573 1 109 6 2 689 2 608 1 945 10 4 562 463 337 3 803
60 - 64 1 679 1 244 12 2 935 2 633 2 059 21 4 713 466 373 5 844
65 - 69 1 501 1 155 6 2 662 2 066 1 826 10 3 901 406 327 4 736
70 - 74 1 465 1 242 11 2 718 2 305 2 154 22 4 481 369 364 0 733
75 - 79 1 269 1 180 5 2 454 1 651 1 938 15 3 604 311 305 1 618
80 - 84 957 988 2 1 947 1 347 1 894 12 3 252 175 243 0 418
85 - 89 519 644 9 1 173 790 1 268 7 2 064 124 190 0 314
90+ 293 602 4 899 669 1 400 5 2 075 93 212 2 306
Unspecified 472 377 10 494 11 343 1 234 1 120 12 359 14 714 201 185 2 130 2 517
Total 19 374 15 426 10 654 45 453 41 506 37 967 12 711 92 185 6 420 5 764 2 185 14 369 Note: Total number of deaths may not be the same due to rounding off

Statistics South Africa P0301.4
Census 2011 Statistical release – P0301.4
69
Table 3.13: Distribution of deaths by age, sex and province, Census 2011 (continued)
Free State KwaZulu-Natal North West Age Male Female Unspecified Total Male Female Unspecified Total Male Female Unspecified Total
0 1 644 1 468 18 3 131 6 175 5 235 166 11 575 1 958 1 715 17 3 690
1-4 502 444 18 964 1 937 1 715 129 3 781 595 512 14 1 121
5-9 221 192 4 417 849 753 42 1 645 249 227 7 483
10-14 133 136 1 269 676 547 34 1 257 186 111 9 306
15 - 19 292 247 2 542 1 099 1 046 12 2 158 300 261 4 564
20 - 24 582 713 3 1 298 2 532 2 808 32 5 372 554 741 6 1 300
25 - 29 1 090 1 197 11 2 298 4 546 4 349 51 8 947 902 1 169 6 2 077
30 - 34 1 452 1 409 8 2 869 5 285 4 448 53 9 785 1 452 1 363 16 2 831
35 - 39 1 621 1 456 8 3 084 5 192 3 982 44 9 218 1 762 1 543 10 3 315
40 - 44 1 555 1 373 14 2 942 4 122 3 050 19 7 190 1 580 1 208 5 2 794
45 - 49 1 474 1 245 11 2 730 3 840 2 731 30 6 601 1 489 1 153 8 2 650
50 - 54 1 395 1 061 22 2 478 3 374 2 467 36 5 877 1 379 1 096 10 2 485
55 - 59 1 226 1 004 3 2 234 3 317 2 320 33 5 671 1 352 1 008 8 2 368
60 - 64 1 245 1 013 9 2 268 3 388 2 578 29 5 995 1 300 856 10 2 165
65 - 69 949 761 5 1 716 2 552 2 198 26 4 776 1 112 784 2 1 898
70 - 74 863 825 4 1 693 2 328 2 685 25 5 038 1 023 807 3 1 834
75 - 79 621 785 2 1 408 1 574 2 342 33 3 949 831 779 7 1 617
80 - 84 434 682 3 1 119 1 374 2 479 25 3 878 654 715 2 1 371
85 - 89 258 466 3 727 765 1 432 3 2 200 398 534 2 933
90+ 280 654 4 938 718 1 745 21 2 483 324 734 7 1 065
Unspecified 443 438 8 315 9 195 5 012 2 936 21 292 29 240 690 512 7 832 9 034
Total 18 281 17 567 8470 44 318 60 654 53 846 22 136 136 636 20 091 17 825 7 987 45 903 Note: Total number of deaths may not be the same due to rounding off

Statistics South Africa P0301.4
Census 2011 Statistical release – P0301.4
70
Table 3.13: Distribution of deaths by age, sex and province: Census 2011 (concluded)
Gauteng Mpumalanga Limpopo Age Male Female Unspecified Total Male Female Unspecified Total Male Female Unspecified Total
0 3 617 3 092 136 6 846 2 110 1 773 37 3 920 2 109 1 834 30 3 973
1-4 1 199 1 029 163 2 391 655 623 10 1 289 711 634 23 1 368
5-9 530 490 41 1 061 281 251 4 536 245 242 8 495
10-14 324 310 27 662 231 203 4 437 199 173 5 377
15 - 19 642 545 10 1 198 317 349 1 667 300 305 1 606
20 - 24 1 379 1 293 12 2 684 644 936 5 1 584 598 657 3 1 259
25 - 29 2 236 2 487 27 4 750 1 244 1 621 11 2 876 988 1 294 11 2 293
30 - 34 3 006 2 998 16 6 020 1 568 1 763 9 3 340 1 426 1 750 12 3 189
35 - 39 3 583 2 848 26 6 457 1 699 1 559 12 3 269 1 640 1 651 8 3 299
40 - 44 3 265 2 553 15 5 833 1 593 1 382 16 2 990 1 624 1 247 6 2 877
45 - 49 3 330 2 438 15 5 783 1 457 1 127 6 2 590 1 586 1 171 10 2 768
50 - 54 3 172 2 486 18 5 675 1 304 960 6 2 271 1 410 982 4 2 395
55 - 59 3 160 2 319 18 5 497 1 283 899 6 2 188 1 475 889 7 2 371
60 - 64 2 941 2 342 22 5 305 1 138 852 7 1 998 1 314 833 3 2 150
65 - 69 2 534 1 968 18 4 520 864 711 11 1 586 1 125 777 6 1 907
70 - 74 2 329 2 219 18 4 566 757 805 7 1 569 1 139 907 6 2 052
75 - 79 1 825 1 947 16 3 788 543 571 2 1 117 816 967 6 1 789
80 - 84 1 474 1 801 22 3 297 469 632 5 1 106 721 1 089 5 1 815
85 - 89 839 1 344 11 2 194 267 436 0 704 469 677 7 1 153
90+ 698 1 412 19 2 129 379 710 2 1 091 596 1 445 11 2 052
Unspecified 3 621 6 362 27 427 37 411 574 472 13 656 14 701 493 392 14 715 15 600
Total 45 704 44 284 28 078 118 066 19 377 18 634 13 816 51 828 20 983 19 916 14 887 55 786 Note: Total number of deaths may not be the same due to rounding off
Statistics South Africa
Census 2011 Statistical release – P0301.4
71
Table 3.14 presents the distribution of deaths by whether the death was caused by natural or unnatural causes. When tabulated by sex of the deceased, this variable shows an expected pattern where mortality due to unnatural causes is higher for males than for females, as expected. However, the proportion of household deaths enumerated during Census 2011 due to unnatural causes appears to be higher (13%) than those provided by the 2009 registered deaths (9%). This scenario is in line with what was observed in the 2001 Census data, where proportions of deaths due to unnatural cause were about 14%. This proportion varies by province where Western Cape, Eastern Cape and KwaZulu-Natal seem to be above the average, as expected. Such mortality appears to be linked to the population aged 30 years as well as the male population.

Statistics South Africa P0301.4
Census 2011 Statistical release – P0301.4
72
Table 3.14: Distribution of numbers of deaths by age, sex and cause nationally: Census 2011
Males Females Total
Age Natural Unnatural Do not
know Unspecified Total Natural Unnatural Do not
know Unspecified Total Natural Unnatural Do not
know Unspecified Total
0 17 535 1 958 2 065 588 22 144 15 554 1 372 1 653 422 19 005 33 089 3 330 3 718 1 010 41 149
1-4 5 492 1 147 239 318 7 195 5 005 803 207 204 6 217 10 497 1 950 446 522 13 412
5-9 2 255 768 69 111 3 204 2 186 501 57 72 2 816 4 441 1 269 126 183 6 020
10-14 1 463 669 60 88 2 280 1 438 398 43 42 1 923 2 901 1 067 103 130 4 203
15 - 19 2 008 2 227 81 74 4 391 2 691 956 74 36 3 757 4 699 3 183 155 110 8 148
20 - 24 4 068 5 070 149 158 9 446 7 995 1 353 188 112 9 648 12 063 6 423 337 270 19 094
25 - 29 9 096 5 564 263 265 15 188 14 169 1 614 288 134 16 204 23 265 7 178 551 399 31 392
30 - 34 13 949 4 334 301 349 18 935 16 017 1 481 312 146 17 954 29 966 5 815 613 495 36 889
35 - 39 16 387 3 491 315 333 20 527 15 405 1 178 293 156 17 035 31 792 4 669 608 489 37 562
40 - 44 14 892 2 559 303 297 18 053 12 852 1 033 233 145 14 261 27 744 3 592 536 442 32 314
45 - 49 14 815 2 401 258 275 17 747 11 962 950 226 137 13 276 26 777 3 351 484 412 31 023
50 - 54 14 380 1 859 235 292 16 765 11 358 812 206 234 12 608 25 738 2 671 441 526 29 373
55 - 59 14 382 1 573 201 304 16 457 10 751 665 187 227 11 830 25 133 2 238 388 531 28 287
60 - 64 14 465 1 155 194 291 16 104 11 211 564 158 215 12 150 25 676 1 719 352 506 28 254
65 - 69 12 001 748 142 217 13 109 9 735 464 126 182 10 507 21 736 1 212 268 399 23 616
70 - 74 11 653 576 105 246 12 578 11 211 472 120 207 12 008 22 864 1 048 225 453 24 586
75 - 79 8 842 364 74 163 9 441 10 170 375 89 180 10 814 19 012 739 163 343 20 255
80 - 84 7 124 270 62 145 7 605 9 953 281 87 204 10 523 17 077 551 149 349 18 128
85 - 89 4 170 139 37 82 4 429 6 592 173 72 154 6 991 10 762 312 109 236 11 420
90 - 120 3 807 132 27 84 4 050 8 512 192 61 146 8 914 12 319 324 88 230 12 964
Unspecified 8 561 2 309 837 1 036 12 740 5 886 3 095 3 078 734 12 794 14 447 5 404 3 915 1 770 25 534
Total 201 348 39 314 6 019 5 712 252 390 200 648 18 732 7 760 4 088 231 229 401 996 58 046 13 779 9 800 483 619
Note: Total number of deaths excludes about 120,926 cases of unspecified sex of the deceased
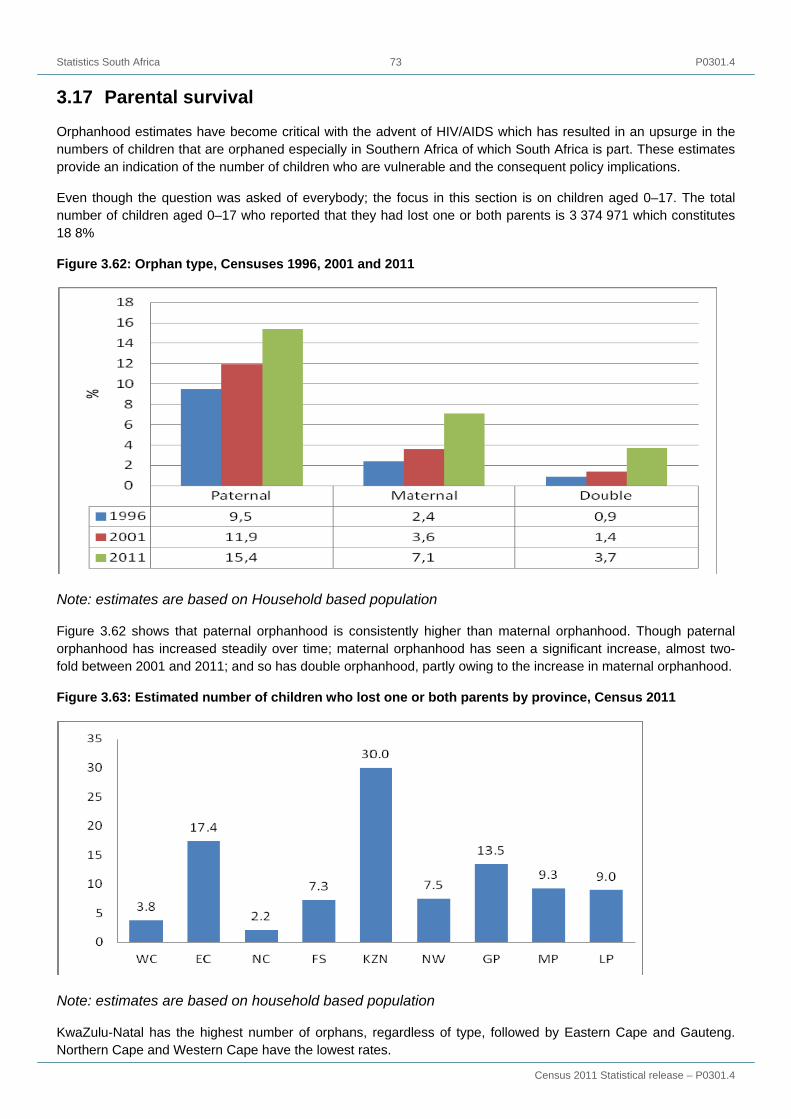
Statistics South Africa P0301.4
Census 2011 Statistical release – P0301.4
73
3.17 Parental survival
Orphanhood estimates have become critical with the advent of HIV/AIDS which has resulted in an upsurge in the numbers of children that are orphaned especially in Southern Africa of which South Africa is part. These estimates provide an indication of the number of children who are vulnerable and the consequent policy implications.
Even though the question was asked of everybody; the focus in this section is on children aged 0–17. The total number of children aged 0–17 who reported that they had lost one or both parents is 3 374 971 which constitutes 18 8%
Figure 3.62: Orphan type, Censuses 1996, 2001 and 2011
Note: estimates are based on Household based population
Figure 3.62 shows that paternal orphanhood is consistently higher than maternal orphanhood. Though paternal orphanhood has increased steadily over time; maternal orphanhood has seen a significant increase, almost two-fold between 2001 and 2011; and so has double orphanhood, partly owing to the increase in maternal orphanhood.
Figure 3.63: Estimated number of children who lost one or both parents by province, Census 2011
Note: estimates are based on household based population
KwaZulu-Natal has the highest number of orphans, regardless of type, followed by Eastern Cape and Gauteng. Northern Cape and Western Cape have the lowest rates.

Statistics South Africa P0301.4
Census 2011 Statistical release – P0301.4
74
Annexure: Terms and definitions Assistive devices and medication
A person who uses eyeglasses or a hearing aid or walking stick/frame or a wheelchair or chronic medication as enablers in correcting for certain impairments.
Bucket toilet system
A toilet system with a pail or other removable receptacle placed directly under the toilet seat, and where no water or chemicals are used.
Census (Population Census)
The process of counting the number of people, at a given point in time in a country, and collecting information about their demographic, social and economic characteristics. After data collection, the process includes the processing, analysis and dissemination of the information collected.
Census night
The night before Census day. It is the decisive point of time for being included in the Census (midnight on that night).
Collective living quarters/ communal living quarters
Structurally separate and independent places of abode intended for habitation by large groups of individuals or several households. Such quarters usually have certain common facilities, such as cooking and ablution facilities, lounges or dormitories which are shared by the occupants. Collective living quarters may be further classified into hotels, rooming houses and other lodging houses, institutions and camps.
Living quarters where certain facilities are shared by groups of individuals or households. They can be divided into: (a) hotels, motels, guesthouses, etc.; (b) workers' hostels and students' residences; and (c) institutions.
Confidentiality
A property of data indicating the extent to which their unauthorised disclosure could be prejudicial or harmful to the interest of the source or other relevant parties.
Converted hostels
Hostels where the accommodation has been converted into self-contained units for households
De facto Census
A Census in which people are enumerated according to where they were on Census night.
De jure Census
A Census in which people are enumerated according to where they usually live.
Disability
Difficulties encountered in functioning due to body impairments or activity limitation, with or without assistive devices.
Domestic worker
Person employed to work in a household as a cleaner, cook, nanny, gardener, driver, etc. If a domestic worker lives in the same house as the employers, e.g. in a spare bedroom, does not get a form of salary in cash, and shares meals and other resources with the household, then he/she should be treated as part of the main household.

Statistics South Africa P0301.4
Census 2011 Statistical release – P0301.4
75
Dwelling unit
Structure or part of a structure or group of structures occupied or meant to be occupied by one or more than one household. Includes structure or part of structure which is vacant and/or under construction, but can be lived in at the time of the survey. Includes units in collective living quarters, unlike housing units. Dwelling units may therefore comprise housing units plus units in collective living quarters when applicable. (Examples of each are a house, a group of huts, and a flat.)
A dwelling unit has a separate entrance from outside or from a common space, as in a block of flats.
Premises not intended for use as living quarters, but used for human habitation at the time of the Census, such as a barn, warehouse, etc., are also classified as dwelling units for Census purposes.
Emigrant
A person who leaves a country with the intention of staying in the country of arrival
Employed:
Persons who work for pay; profit or family gain in the reference period.
Enumeration area
An enumeration area (EA) is the smallest geographical unit (piece of land) into which the country is divided for Census or survey purposes. EAs typically contain between 100 and 250 households. Each EA is expected to have clearly defined boundaries.
Formal dwelling
A structure built according to approved plans, i.e. house on a separate stand, flat or apartment, townhouse, room in a backyard or rooms or flat let elsewhere.
Formal sector
Sector of employment made up of all employing businesses that are registered in any way.
Health and functioning
Whether a person has difficulty in seeing, hearing, communicating, walking or climbing stairs, remembering or concentrating, and self-care such as washing all over, dressing or feeding.
Household
A household is a group of persons who live together and provide themselves jointly with food or other essentials for living, or a single person who lives alone. Note that a household is not necessarily the same as a family.
Household head
A person recognised as such by household, usually the main decision-maker, or the person who owns or rents the dwelling, or the person who is the main breadwinner. The head can be either male or female. If two people are equal decision-makers, the oldest can be named as the household head.
Household income
All receipts by all members of a household, in cash and in kind, in exchange for employment, or in return for capital investment, or receipts obtained from other sources such as pension.
Immigrant
A person who enters a country from another country with the intention of staying in that country

Statistics South Africa P0301.4
Census 2011 Statistical release – P0301.4
76
In-migrants
A person who moves from one part of a country to another part with the intention of staying where they move to. This person would be regarded as an in-migrant at the place where they move to.
Informal dwelling
Makeshift structure not approved by a local authority and not intended as a permanent dwelling. Typically built with found materials (corrugated iron, cardboard, plastic, etc.). Contrasted with formal dwelling and traditional dwelling.
Informal sector
A subset of unincorporated enterprises comprising those that produce at least some output for the market; and are less than a specialised size in terms of the number of persons engaged or of employees employed on a continuous basis; and/or not registered under specific forms of national legislation, such as factories, or commercial acts, social security laws, professional groups’ regulatory acts, or similar acts, laws or regulations established by national legislative bodies.
Labour absorption rate
The proportion of the working-age population that is employed.
Labour force
All employed and unemployed persons of working age.
Labour force participation rate
Labour force as a percentage of the working age population.
Labour absorption rate
Employed persons as a percentage of the working age population.
Not economically active:
Persons who were neither employed or unemployed (e.g full-time students; retired persons; and homemakers who did not want to work)
Out-migrants
A person who moves from one part of a country to another part with the intention of staying where they move to. This person would be regarded as an out-migrant at the place where they move from.
Overcount
The number of persons or households inadvertently counted twice in a Census.
Post-enumeration survey
A sample survey conducted immediately after a Census to evaluate the Census. Results are used to make adjustments for the Census undercount or overcount.
Proxy
A person who answers on behalf of another person (who is absent or ill, for example). For a Census, a proxy is the person that answered on behalf of other members of the household.
Reference period
The period of time (day, week, month, or year) for which information is relevant. The reference period for Census 2011 was 9–10 October 2011.

Statistics South Africa P0301.4
Census 2011 Statistical release – P0301.4
77
Respondents
The person (or persons) responding in this interview should be a member (members) of the household and be in a position to answer the questions. This will preferably be any responsible adult. For the rest of the questionnaire the respondents should answer these questions for themselves, if possible.
Sex
Biological distinction between males and females.
Traditional dwelling
A dwelling made primarily of clay, mud, reeds or other locally available natural materials. This is a general term that includes huts, rondavels, etc. Such dwellings can be found as single units or in clusters.
Transient
For the purposes of a Census, a transient is a person who was travelling on Census night (9–10 October), e.g. those at airports, harbours, border posts, people in tourist hotels, camping sites, caravan parks, the homeless and long-distance truck/bus and taxi drivers.
Unemployed (official definition)
Persons who did not work, but who looked for work and were available to work in the reference period.
Unemployed (expanded definition)
Persons who did not work, but were available to work in the reference period.
Unemployment rate
Unemployed persons as a percentage of the labour force.
Undercount
The number of people or households that were not counted in a Census.
Unspecified
All cases whereby an answer was expected but was left blank during enumeration.
Unoccupied dwelling
A dwelling whose inhabitants are absent at the time of the visit or during the reference period during a Census or survey, e.g. respondents on holiday or migrant workers.
Visitor
By definition of a household, a person visiting or staying with a household who is not a usual member of the household, that is, does not stay in the household four nights a week on average.
Wattle and daub
Traditional construction method whereby walls are built with wooden sticks/poles and covered with mud or a mixture of mud and clay.
Working age population
Persons aged 15-64 years.
Note
For a complete list of concepts, refer to metadata document

Statistics South Africa P0301.4
Census 2011 Statistical release – P0301.4
78
Key labour market concepts and definitions
Employed: Persons who work for pay; profit or family gain in the reference period.
Unemployed (official definition): Persons who did not work, but who looked for work and were available to work in the reference period.
Unemployed (expanded definition): Persons who did not work, but were available to work in the reference period.
Not economically active: Persons who were neither employed or unemployed (e.g full-time students; retired persons; and homemakers who did not want to work)
Labour force: Employed persons plus unemployed persons.
Working age population: Persons aged 15-64 years.
Unemployment rate: Unemployed persons as a percentage of the labour force.
Labour force participation rate: Labour force as a percentage of the working age population.
Labour absorption rate: Employed persons as a percentage of the working age population.
Formal and informal sector: An objective measure is used in the QLFS based on vat/income tax registration and establishment size, a subjective measure is used in Census 2011. Also, in line with ILO guidelines, persons employed in agriculture and private households are not usually included in the formal and informal sectors, but are identified as separate categories. It is not currently possible to identify agricultural employment in Census 2011, since the coding of industry and occupation has not yet been completed. Sectoral distributions therefore include persons employed in agriculture. And with regards to persons employed in private households, the results are not based on the relevant questions that determine the international classification for industry but instead are based on the question which determines the sector in which respondents were employed. Thus, after coding is completed the numbers may change.