29 may 2013 brewin dolphin holdings plc interim …/media/files/b/brewin...29 may 2013 brewin...
TRANSCRIPT

29 May 2013
Brewin Dolphin Holdings PLC
Interim Financial Report For the Half Year Ended 31 March 2013
Highlights
● Total managed funds £28.1 billion at 31 March 2013 (30 September 2012: £25.9 billion, 31 March 2012: £25.7 billion).
● Strong growth in discretionary funds £20.4 billion at 31 March 2013 (30 September 2012: £18.2 billion, 31 March 2012: £17.3 billion).
● Total adjusted income £139.0 million (31 March 20121: £127.0 million), an increase of 9.4%.
● Adjusted2 profit before tax £23.8 million (31 March 2012: £18.9 million), an increase of 25.9%.
● Adjusted2 earnings per share:
- Basic earnings per share 7.5p (31 March 2012: 5.8p) an increase of 29.3%. - Diluted earnings per share 7.1p (31 March 2012: 5.5p) an increase of 29.1%.
● Total income £139.0 million (31 March 2012: £131.4 million) an increase of 5.8%.
● Profit before tax £6.9 million (31 March 2012: £12.3 million).
● Earnings per share:
- Basic earnings per share 2.2p (31 March 2012: 3.7p). - Diluted earnings per share 2.1p (31 March 2012: 3.5p).
1 the March 2012 income figure has been adjusted to exclude shared revenue which prior to the Retail Distribution Review (“RDR”) was recorded as income for Brewin Dolphin with a corresponding operating expense apportioning the income to external parties. 2 these figures have been adjusted to exclude redundancy costs, additional FSCS levy, onerous lease provision and amortisation of client relationships.
Declaration of Interim Dividend
The Board declares a maintained interim dividend of 3.55p per share. The interim dividend is payable on 28 June 2013 to shareholders on the register at the close of business on 14 June 2013 with an ex-dividend date of 12 June 2013.

2
David Nicol, Chief Executive said “We are now two years into the transformation and growth strategy announced in 2011. We have made good progress against our stated objectives including delivering strong growth in funds under management. Our strategy has two main objectives: continued strong growth and increased efficiency. These objectives are underpinned by a series of initiatives to transform the business which will improve efficiency, ensure it is best placed to meet regulatory demands, and at the same time continue to enhance client service and improve shareholder returns. In a separate announcement today, we have announced the intention to raise up to circa £40 million via a placing. The new capital will provide us with additional investment capacity, enabling us to accelerate the implementation of our on-going strategy, capitalise on our competitive position and drive future growth in earnings and shareholder returns.” For further information David Nicol, Chief Executive Brewin Dolphin Holdings PLC 020 7248 4400 Andrew Westenberger, Finance Director Brewin Dolphin Holdings PLC 020 7248 4400 Andrew Hayes/Wendy Baker Hudson Sandler 020 7796 4133

3
Interim Management Report To the members of Brewin Dolphin Holdings PLC Results and review of the past six months Overall the Group has made significant progress against our stated objectives. Underlying profit before tax (excluding redundancy costs, additional FSCS levy, onerous lease provision and amortisation of client relationships) grew strongly by 26% to £23.8 million (H1 2012: £18.9 million). The strong underlying profit growth was driven by increased income, 9% higher than the same period last year, together with improved efficiency as reflected in the increase in adjusted profit before tax margin to 17% from 15% in the previous period. Profit before tax for the first half of 2013 was £6.9 million (H1 2012: £12.3 million), 44% lower than the same period last year. This decline resulted from both significant restructuring costs and material provisions for onerous leases which are explained below. Unaudited
26 weeks to 31 March
2013
Unaudited 26 weeks to
31 March 2012
% Change
£’000 £’000
Total income1 138,983 127,014 9%
Salaries (53,436) (47,050) 14%
Other operating costs2 (42,087) (44,583) -6%
Adjusted profit before profit share3 43,460 35,381 23%
Profit share (20,091) (16,463) 22%
Adjusted operating profit3 23,369 18,918 24%
Net finance income and other gains and losses 414 (17)
Adjusted profit before tax3 23,783 18,901 26%
Redundancy costs (3,378) (87)Additional FSCS levy (1,107) (553)Onerous lease provision (5,882) - Amortisation of client relationships (6,494) (5,954)
Profit before tax 6,922 12,307 -44% Taxation (1,656) (3,533)
Profit after tax 5,266 8,774 Earnings per share
Basic earnings per share 2.2p 3.7p -41% Diluted earnings per share 2.1p 3.5p -40%
Adjusted earnings per share 3
Basic earnings per share 7.5p 5.8p 29% Diluted earnings per share 7.1p 5.5p 29%
1 March 2012 income figure has been adjusted to exclude shared revenue which prior to RDR was recorded as income for Brewin Dolphin with a corresponding operating expense apportioning the income to external parties.
2 March 2012 operating expenses have been amended in line with note 1 above.
3 these figures have been adjusted to exclude redundancy costs, additional FSCS levy, onerous lease provision and amortisation of client relationships.

4
Total managed funds were up 8.5% to £28.1 billion and discretionary funds up 12.1% to £20.4 billion at 31 March 2013.
Funds under management Advisory Discretionary Total
managed funds
£ billion £ billion £ billion
Value of funds at 30 September 2012 7.7 18.2 25.9
Inflows 0.2 1.1 1.3
Outflows (0.4) (0.5) (0.9)
Transfers (0.3) - (0.3*) Market movement 0.5 1.6 2.1
Value of funds at 31 March 2013 7.7 20.4 28.1
% increase in funds since 30 September 2012 nil 12.1% 8.5% *£0.2m transferred to Execution Only service
Whilst average market levels were 4% higher than the same period last year, overall income growth exceeded that rise due primarily to the continued strong net inflow in funds under management as well as the on-going transitioning to a new national rate card. This was offset by the reduction in net interest earned of £1.8 million as a result of declining margins on cash deposits and £6.0 million decline in trail income, following the planned move away from trail paying unit trusts as part of our RDR readiness. A significant restructuring exercise of the head office functions was conducted towards the end of the period resulting in a £3 million redundancy cost which, together with redundancies earlier in the period, has resulted in an overall redundancy charge of £3.4 million. This is offset by an on-going staff cost saving of £6 million per annum. An onerous lease provision of £5.9 million has been made in respect of surplus office space which the Group may not be able to sub-let in the short term. Strategy The Group is now two years into the transformation and growth strategy announced in 2011. The strategy has two main objectives: continued strong growth and increased efficiency. These objectives are underpinned by a series of initiatives to transform the business which will improve efficiency, ensure it is best placed to meet regulatory demands, and at the same time continue to enhance client service and improve shareholder returns. Overall the business has made significant progress against the objectives set. Growth in funds under management and income has continued, reflecting the success in focusing on discretionary management services. The transfer to a new pricing structure is largely completed. Efforts to improve efficiency have been focused on strengthening general cost discipline and implementing a new core software system to enable the rebasing of operational support and technology costs.

5
Work to design the new systems architecture has continued in the period and is now mostly complete. Although some delays have been encountered, the focus has been on ensuring that the design of the new systems is optimal. Implementation is due to commence in the final quarter of this financial year and to complete by the end of 2014. Although this is some nine months later than initially planned, the benefits of enhanced client service and greater efficiency through lower operating support costs will be greater than originally anticipated and will provide a solid base on which to build the business for continued growth. Benefits will begin to be materially achieved in the second half of 2014. The target to increase margin to 20% is on track to be reached, with the full benefits coming through into the 2015 financial year. Board Andrew Westenberger was appointed as Finance Director on 1 January 2013, following the retirement of Robin Bayford. On 21 March 2013 Simon Miller was appointed Chairman, David Nicol Chief Executive and Stephen Ford an Executive Director, responsible for Investment Management. At the same time, Jamie Matheson, Barry Howard, Henry Algeo, Ben Speke and Sarah Soar stepped down from the Board. Dividend A maintained interim dividend of 3.55p per share will be paid on 28 June 2013 to shareholders on the register on 14 June 2013. Related party transactions Related party transactions are disclosed in Note 3 to the condensed set of financial statements. Going concern As stated in Note 2 to the condensed set of financial statements, the directors are satisfied that the Group has sufficient resources to continue in operation for the foreseeable future, a period of time not less than 12 months from the date of this report. Accordingly, the directors continue to adopt a going concern basis in preparing the condensed financial statements. Principal risks and uncertainties Principal risks and uncertainties are covered in Note 4 to the condensed financial statements. Outlook Improved equity market sentiment and early signs of a return in broader economic confidence are resulting in increasingly positive trading conditions. The Group’s strategy of continued growth in its client base, whilst focusing also on further improving efficiency and client service through disciplined investment, means that it is well placed to take advantage of this environment.
David Nicol Chief Executive 28 May 2013

6
Condensed Consolidated Income Statement for the 26 week period ended 31 March 2013
Unaudited 26 weeks to
31 March 2013
Unaudited 26 weeks to
31 March 2012
Audited 52 weeks to
30 September 2012
Note £'000 £'000 £'000Continuing operations Revenue 132,193 122,812 253,112 Other operating income 6,790 8,566 16,419 Total income 5 138,983 131,378 269,531
Staff costs (73,527) (63,513) (133,242)Redundancy costs (3,378) (87) (570)Additional FSCS levy (1,107) (553) (553)Onerous lease provision (5,882) - - Amortisation of intangible assets - client relationships 10 (6,494) (5,954) (11,871)Other operating costs (42,087) (48,947) (94,196)Operating expenses (132,475) (119,054) (240,432)
Operating profit 6,508 12,324 29,099 Finance income 6 612 554 1,661 Other gains and losses (13) (13) (74)Finance costs 6 (185) (558) (803)Profit before tax 5 6,922 12,307 29,883 Tax 7 (1,656) (3,533) (8,389)
Profit for the period from continuing operations 5,266 8,774 21,494
Discontinued operations Loss for the period from discontinued operations 18 - (3,172) (3,092)Profit for the period 5,266 5,602 18,402
Attributable to: Equity shareholders of the parent from continuing operations 5,266 5,602 18,402
5,266 5,602 18,402
Earnings per share
From continuing operations Basic 8 2.2p 3.7p 9.1p
Diluted 8 2.1p 3.5p 8.6p

7
Condensed Consolidated Statement of Comprehensive Income for the 26 week period ended 31 March 2013
Unaudited26 weeks to
31 March 2013
Unaudited 26 weeks to
31 March 2012
Audited 52 weeks to
30 September 2012
£'000 £'000 £'000Profit for the period 5,266 5,602 18,402
Items that will not be reclassified subsequently to profit and loss: Actuarial loss on defined benefit pension scheme (1,126) (3,247) (5,063)
Deferred tax credit on actuarial loss on defined benefit pension scheme
259 779 1,164
(867) (2,468) (3,899)
Items that may be reclassified subsequently to profit and loss:
Gain on revaluation of available-for-sale investments 875 - -
Deferred tax (charge)/credit on revaluation of available-for-sale investments
(201) 112 167
Exchange differences on translation of foreign operations
163 (66) (196)
837 46 (29)Other comprehensive income for the period (30) (2,422) (3,928)Total comprehensive income for the period 5,236 3,180 14,474
Attributable to: Equity shareholders of the parent 5,236 3,180 14,474
5,236 3,180 14,474

8
Condensed Consolidated Statement of Changes in Equity for the 26 week period ended 31 March 2013
Attributable to the equity shareholders of the parent Called
up share capital
Share premium account
Own shares
Revaluation reserve
Merger reserve
Profit and loss
account Total £'000 £'000 £'000 £'000 £'000 £'000 £'000
26 week period ended 31 March 2013 Balance at 30 September 2012 2,469 124,271 (12,569) 4,285 22,950 21,331 162,737 Profit for the period - - - - - 5,266 5,266 Other comprehensive income for the period Gain on revaluation of available-for-sale investments - - - 875 - - 875 Deferred and current tax on other comprehensive income - - - (201) - 259 58 Actuarial loss on defined benefit pension scheme - - - - - (1,126) (1,126) Exchange differences on translation of foreign operations - - - - - 163 163 Total comprehensive income for the period - - - 674 - 4,562 5,236 Dividends - - - - - (8,755) (8,755) Issue of shares 44 7,872 - - - - 7,916 Own shares acquired in the period - - (102) - - - (102) Share-based payments - - - - - 2,729 2,729 Current tax charge on share-based payments - - - - - 1 1 Deferred tax charge on share-based payments - - - - - 50 50 Balance at 31 March 2013 2,513 132,143 (12,671) 4,959 22,950 19,918 169,812
26 week period ended 31 March 2012 Balance at 30 September 2011 2,405 116,028 (10,686) 4,118 22,950 19,970 154,785 Profit for the period - - - - - 5,602 5,602 Other comprehensive income for the period Deferred and current tax on other comprehensive income - - - 112 - 779 891 Actuarial loss on defined benefit pension scheme - - - - - (3,247) (3,247) Exchange differences on translation of foreign operations - - - - - (66) (66) Total comprehensive income for the period - - - 112 - 3,068 3,180 Dividends - - - - - (8,412) (8,412) Issue of shares 45 5,752 - - - - 5,797 Own shares acquired in the period - - (1,777) - - - (1,777) Share-based payments - - - - - 1,332 1,332 Deferred tax credit on share-based payments - - - - - 138 138 Balance at 31 March 2012 2,450 121,780 (12,463) 4,230 22,950 16,096 155,043
52 week period ended 30 September 2012 Balance at 30 September 2011 2,405 116,028 (10,686) 4,118 22,950 19,970 154,785 Profit for the period - - - - - 18,402 18,402 Other comprehensive income for the period Deferred and current tax on other comprehensive income - - - 167 - 1,164 1,331 Actuarial loss on defined benefit pension scheme - - - - - (5,063) (5,063) Exchange differences on translation of foreign operations - - - - - (196) (196) Total comprehensive income for the period - - - 167 - 14,307 14,474
Dividends - - - - - (16,887)
(16,887) Issue of shares 64 8,243 - - - - 8,307 Own shares acquired in the period - - (1,891) - - - (1,891) Own shares disposed of on exercise of options - - 8 - - (8) - Share-based payments - - - - - 3,852 3,852 Current tax charge on share-based payments - - - - - 193 193 Deferred tax credit on share-based payments - - - - - (96) (96) Balance at 30 September 2012 2,469 124,271 (12,569) 4,285 22,950 21,331 162,737
9
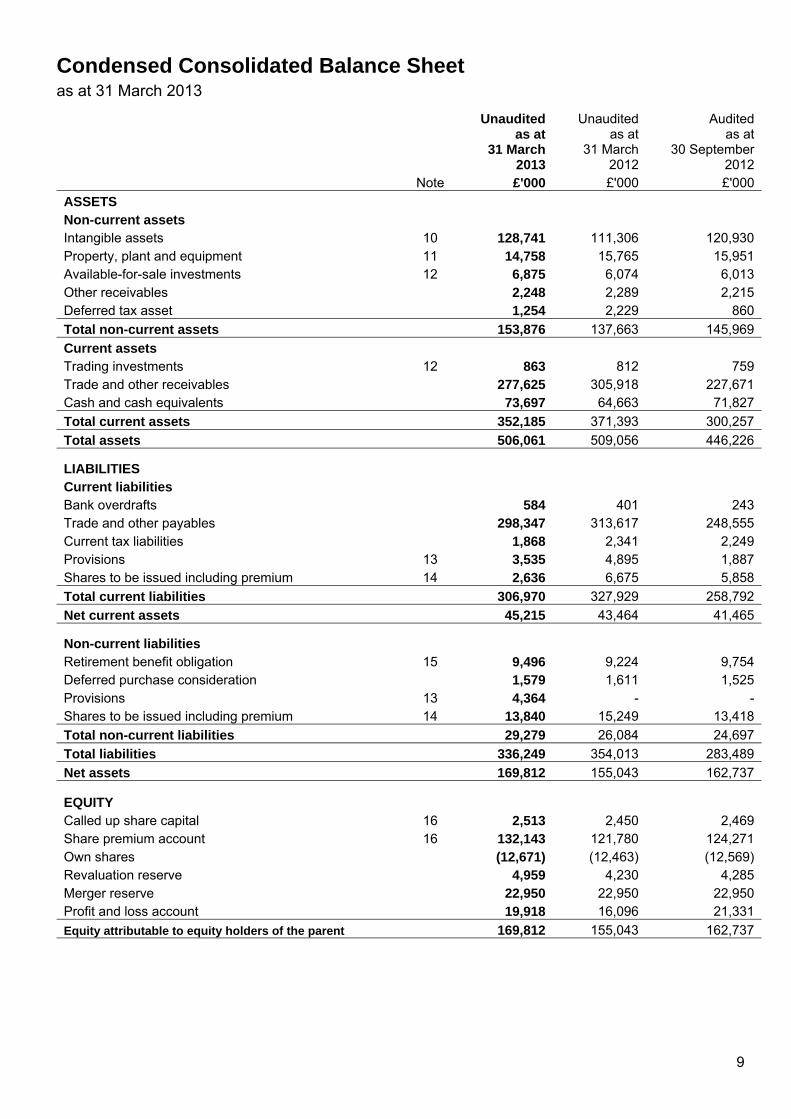
Condensed Consolidated Balance Sheet as at 31 March 2013
Unaudited as at
31 March 2013
Unaudited as at
31 March 2012
Audited as at
30 September 2012
Note £'000 £'000 £'000
ASSETS Non-current assets Intangible assets 10 128,741 111,306 120,930 Property, plant and equipment 11 14,758 15,765 15,951 Available-for-sale investments 12 6,875 6,074 6,013 Other receivables 2,248 2,289 2,215 Deferred tax asset 1,254 2,229 860
Total non-current assets 153,876 137,663 145,969
Current assets Trading investments 12 863 812 759 Trade and other receivables 277,625 305,918 227,671 Cash and cash equivalents 73,697 64,663 71,827
Total current assets 352,185 371,393 300,257
Total assets 506,061 509,056 446,226
LIABILITIES Current liabilities Bank overdrafts 584 401 243 Trade and other payables 298,347 313,617 248,555 Current tax liabilities 1,868 2,341 2,249 Provisions 13 3,535 4,895 1,887 Shares to be issued including premium 14 2,636 6,675 5,858
Total current liabilities 306,970 327,929 258,792
Net current assets 45,215 43,464 41,465
Non-current liabilities Retirement benefit obligation 15 9,496 9,224 9,754 Deferred purchase consideration 1,579 1,611 1,525 Provisions 13 4,364 - - Shares to be issued including premium 14 13,840 15,249 13,418
Total non-current liabilities 29,279 26,084 24,697
Total liabilities 336,249 354,013 283,489
Net assets 169,812 155,043 162,737
EQUITY Called up share capital 16 2,513 2,450 2,469 Share premium account 16 132,143 121,780 124,271 Own shares (12,671) (12,463) (12,569)Revaluation reserve 4,959 4,230 4,285 Merger reserve 22,950 22,950 22,950 Profit and loss account 19,918 16,096 21,331
Equity attributable to equity holders of the parent 169,812 155,043 162,737

10
Condensed Consolidated Cash Flow Statement for the 26 week period ended 31 March 2013
Unaudited 26 weeks to
31 March 2013
Unaudited 26 weeks to
31 March 2012
Audited 52 weeks to
30 September 2012
Note £'000 £'000 £'000 Net cash inflow/(outflow) from operating activities 17 13,467 (9,799) 34,979 Cash flows from investing activities Purchase of intangible assets - client relationships (3,079) (2,697) (6,878) Purchase of intangible assets - software (9,098) (2,713) (16,356) Purchases of property, plant and equipment 11 (1,708) (4,154) (7,412) Dividend received from available-for-sale investments - - 278 Net cash used in investing activities (13,885) (9,564) (30,368)
Cash flows from financing activities Dividends paid to equity shareholders - - (16,887) Purchase of own shares (102) (1,777) (1,891) Proceeds on issue of shares 2,049 372 721 Net cash generated by/(used in) financing activities 1,947 (1,405) (18,057)
Net increase/(decrease) in cash and cash equivalents
1,529 (20,768) (13,446)
Cash and cash equivalents at the start of period 71,584 85,030 85,030 Cash and cash equivalents at the end of period 73,113 64,262 71,584 Firm's cash 45,739 42,775 48,003 Firm's overdraft (584) (401) (243)Firm's net cash 45,155 42,374 47,760 Client settlement cash 27,958 21,888 23,824
Net cash and cash equivalents 73,113 64,262 71,584
Cash and cash equivalents shown in current assets 73,697 64,663 71,827 Bank overdrafts (584) (401) (243)
Net cash and cash equivalents 73,113 64,262 71,584
For the purposes of the cash flow statement, cash and cash equivalents include bank overdrafts.

11
Notes to the Condensed Set of Financial Statements 1. General information
Brewin Dolphin Holdings PLC (the “Company”) is a public limited company incorporated in the United Kingdom. The shares of the Company are listed on the London Stock Exchange. The address of its registered office is 12 Smithfield Street, London EC1A 9BD. This Interim Financial Report was approved for issue on 28 May 2013. A copy of this Interim Financial Report including Condensed Financial Statements for the 26 week period ended 31 March 2013 is available at the Company’s registered office and a copy will be posted to shareholders. The information for the 52 week period ended 30 September 2012 does not constitute statutory accounts as defined in section 434 of the Companies Act 2006. A copy of the statutory accounts for that year has been delivered to the Registrar of Companies. The auditor reported on those accounts: their report was unqualified, did not draw attention to any matters by way of emphasis and did not contain a statement under section 498(2) or (3) of the Companies Act 2006. 2. Accounting policies
Basis of preparation The annual financial statements of Brewin Dolphin Holdings PLC are prepared in accordance with International Financial Reporting Standards (IFRS) as adopted by the European Union. The condensed set of financial statements included in this Interim Financial Report for the 26 week period ended 31 March 2013 should be read in conjunction with the annual audited financial statements of Brewin Dolphin Holdings PLC for the 52 week period ended 30 September 2012. The condensed set of financial statements included in this Interim Financial Report has been prepared in accordance with International Accounting Standard 34 “Interim Financial Reporting”, as adopted by the European Union and the Interim Financial Report has been prepared in accordance with the Disclosure and Transparency Rules (DTR) of the Financial Services Authority. Going concern The Directors are satisfied that the Group has sufficient resources to continue in operation for the foreseeable future, a period of not less than 12 months from the date of this report. Accordingly they continue to adopt the going concern basis in preparing the condensed financial statements. Changes in accounting policy and disclosure The same accounting policies, presentation and methods of computation are followed in the condensed set of financial statements as applied in the Group’s latest annual audited financial statements for the 52 week period ended 30 September 2012. 3. Related party transactions
There have been no related party transactions that have taken place in the period that have materially affected the financial position or the performance of the Group during the period and no changes to related party transactions from those disclosed in the 2012 Annual Report and Accounts available via our website www.brewin.co.uk that could have a material effect on the financial position or the performance of the Group. Transactions between the Company and its subsidiaries have been eliminated on consolidation and are not disclosed. There were no other transactions with related parties which were not part of the Group during the period, with the exception of remuneration paid to key management personnel.

12
4. Principal risks and uncertainties
The Directors consider that the nature of the principal risks and uncertainties which may have a material effect on the Group’s performance during the remainder of its financial year remain unchanged from those identified on pages 26 and 27 of the 2012 Annual Report and Accounts available via our website www.brewin.co.uk. The inherent risk to our business which has a direct impact on revenue, remains adverse movements in the market in the short term. The other major financial and non-financial risks identified in the 2012 Annual Report and Accounts were:
Risk Type Risk Earnings Risk Loss of client facing staff Legal and Regulatory Risk Changing regulatory environment and regulatory
breaches; poor advice/portfolio performance (including mis-selling)
Operational and IT risk Business continuity; electronic dealing errors (e.g. fat fingers); project control; significant strategic change
13
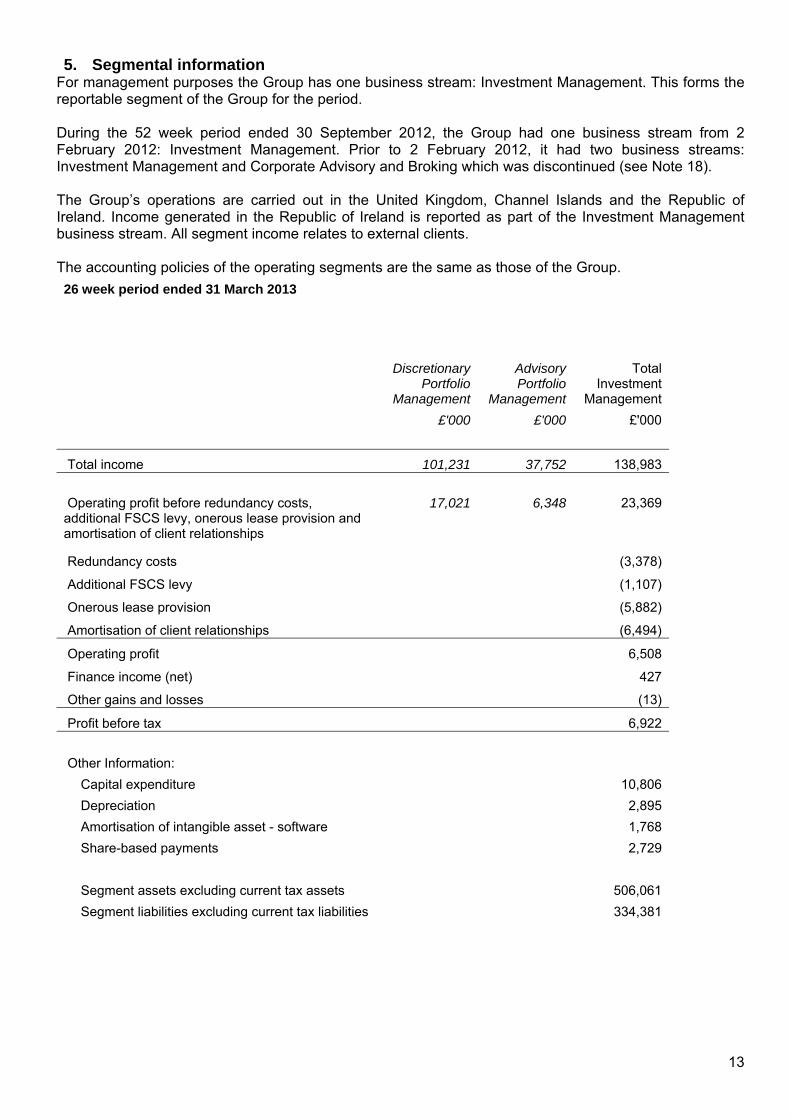
5. Segmental information
For management purposes the Group has one business stream: Investment Management. This forms the reportable segment of the Group for the period. During the 52 week period ended 30 September 2012, the Group had one business stream from 2 February 2012: Investment Management. Prior to 2 February 2012, it had two business streams: Investment Management and Corporate Advisory and Broking which was discontinued (see Note 18). The Group’s operations are carried out in the United Kingdom, Channel Islands and the Republic of Ireland. Income generated in the Republic of Ireland is reported as part of the Investment Management business stream. All segment income relates to external clients. The accounting policies of the operating segments are the same as those of the Group.
26 week period ended 31 March 2013
Discretionary Portfolio
Management
Advisory Portfolio
Management
Total Investment
Management
£'000 £'000 £'000
Total income 101,231 37,752 138,983
Operating profit before redundancy costs, additional FSCS levy, onerous lease provision and amortisation of client relationships
17,021 6,348 23,369
Redundancy costs (3,378)
Additional FSCS levy (1,107)
Onerous lease provision (5,882)
Amortisation of client relationships (6,494)
Operating profit 6,508
Finance income (net) 427
Other gains and losses (13)
Profit before tax 6,922
Other Information:
Capital expenditure 10,806
Depreciation 2,895
Amortisation of intangible asset - software 1,768
Share-based payments 2,729
Segment assets excluding current tax assets 506,061
Segment liabilities excluding current tax liabilities 334,381
14
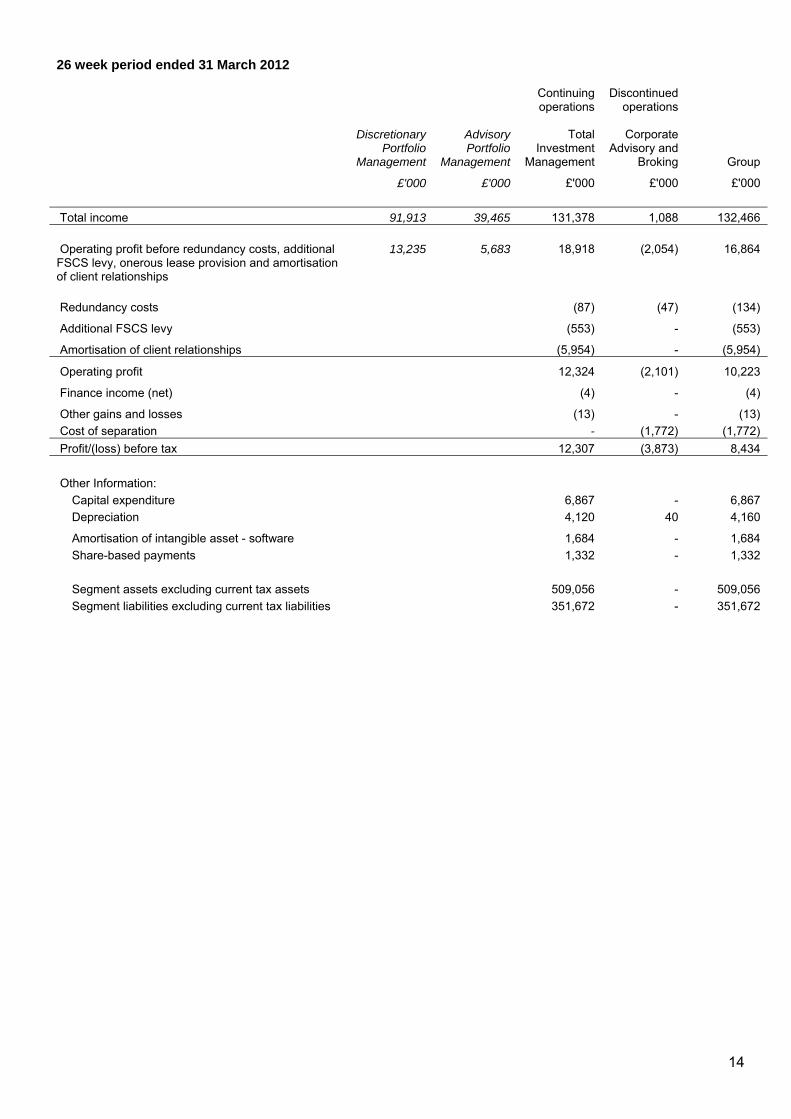
26 week period ended 31 March 2012
Continuing operations
Discontinued
operations
Discretionary Portfolio
Management
Advisory Portfolio
Management
Total Investment
Management
Corporate Advisory and
Broking Group
£'000 £'000 £'000 £'000 £'000
Total income 91,913 39,465 131,378 1,088 132,466
Operating profit before redundancy costs, additional FSCS levy, onerous lease provision and amortisation of client relationships
13,235 5,683 18,918 (2,054) 16,864
Redundancy costs (87) (47) (134)
Additional FSCS levy (553) - (553)
Amortisation of client relationships (5,954) - (5,954)
Operating profit 12,324 (2,101) 10,223
Finance income (net) (4) - (4)
Other gains and losses (13) - (13)
Cost of separation - (1,772) (1,772)
Profit/(loss) before tax 12,307 (3,873) 8,434
Other Information:
Capital expenditure 6,867 - 6,867
Depreciation 4,120 40 4,160
Amortisation of intangible asset - software 1,684 - 1,684
Share-based payments 1,332 - 1,332
Segment assets excluding current tax assets 509,056 - 509,056
Segment liabilities excluding current tax liabilities 351,672 - 351,672

15
52 week period ended 30 September 2012
Continuing operations
Discontinued
operations
Discretionary Portfolio
Management
Advisory Portfolio
Management
Total Investment
Management
Corporate Advisory and
Broking Group
£'000 £'000 £'000 £'000 £'000
Total income 191,460 78,071 269,531 1,235 270,766
Operating profit before redundancy costs, additional FSCS levy, onerous lease provision and amortisation of client relationships
29,901 12,192 42,093 (2,317) 39,776
Additional FSCS levy (553) - (553)
Redundancy costs (570) (47) (617)
Amortisation of client relationships (11,871) - (11,871)
Operating profit/(loss) 29,099 (2,364) 26,735
Finance income (net) 858 - 858
Other gains and losses (74) - (74)
Costs of separation - (1,143) (1,143)
Profit/(loss) before tax 29,883 (3,507) 26,376
Other Information
Capital expenditure 23,768 - 23,768
Depreciation 7,174 40 7,214
Amortisation of intangible asset - software 3,563 - 3,563
Share-based payments 3,852 - 3,852
Segment assets excluding current tax assets 446,226 - 446,226
Segment liabilities excluding current tax liabilities 256,543 - 256,543

16
6. Finance income and costs
Unaudited 26 weeks to
31 March 2013
Unaudited 26 weeks to
31 March 2012
Audited 52 weeks to
30 September 2012
£'000 £'000 £'000 Finance income Dividends from available-for-sale investments - - 278 Interest on bank deposits 612 554 1,383 612 554 1,661
Finance costs Finance cost of deferred consideration 62 164 192 Interest expense on defined pension obligation 116 373 581 Interest on bank overdrafts 7 21 30 185 558 803 7. Taxation
U.K. Overseas tax U.K. deferred tax Current
tax Prior
period Current tax Prior periodCurrent
year Prior
period Total £'000 £'000 £'000 £'000 £'000 £'000 £'000 Unaudited 26 weeks to 31 March 2013 Continuing operations 1,498 328 113 - (11) (272) 1,656 Discontinued operations - - - - - - 1,498 328 113 - (11) (272) 1,656
Unaudited 26 weeks to 31 March 2012 Continuing operations 3,498 556 122 - 63 (706) 3,533 Discontinued operations (701) - - - - (701) 2,797 556 122 - 63 (706) 2,832
Audited 52 weeks to 30 September 2012 Continuing operations 6,650 554 261 - 1,140 (216) 8,389 Discontinued operations (617) - - - 202 (415) 6,033 554 261 - 1,140 (14) 7,974

17
8. Earnings per share
The calculation of the basic and diluted earnings per share is based on the following data:
Unaudited 26 weeks
to 31 March
2013
Unaudited 26 weeks
to 31 March
2012
Audited 52 weeks
to 30 September
2012
Number of shares Basic Weighted average number of shares in issue in the period 241,421 235,712 236,921 Diluted Weighted average number of options outstanding for the period 11,570 7,434 7,996
Estimated weighted average number of shares earned under deferred consideration arrangements 1,796 6,328 6,374 Diluted weighted average number of options and shares for the period 254,787 249,474 251,291
Earnings attributable to ordinary shareholders Continuing operations £'000 £'000 £'000Profit for the period from continuing operations 5,266 8,774 21,494 Redundancy costs 3,378 87 570 less tax (794) (22) (143)Additional FSCS levy 1,107 553 553 less tax (260) (138) (138)Onerous lease provision 5,882 - - less tax (1,382) - - Amortisation of intangible assets - client relationships 6,494 5,954 11,871 less tax (1,526) (1,488) (2,968)
Adjusted basic profit for the period and attributable earnings excluding redundancy costs, additional FSCS levy, onerous lease provision and amortisation of client relationships 18,165 13,720 31,239
Profit for the period from continuing operations 5,266 8,774 21,494 Finance costs of deferred consideration (Note a) 19 95 115 less tax (4) (24) (29)Adjusted fully diluted profit for the period and attributable earnings 5,281 8,845 21,580 Redundancy costs 3,378 87 570 less tax (794) (22) (143)Additional FSCS levy 1,107 553 553 less tax (260) (138) (138)Onerous lease provision 5,882 - - less tax (1,382) - - Amortisation of intangible assets - client relationships 6,494 5,954 11,871 less tax (1,526) (1,488) (2,968)
Adjusted basic profit for the period and attributable earnings excluding redundancy costs, additional FSCS levy, onerous lease provision and amortisation of client relationships 18,180 13,791 31,325

18
From continuing operations
Basic 2.2p 3.7p 9.1p
Diluted 2.1p 3.5p 8.6p
From continuing operations excluding redundancy costs, additional FSCS levy, onerous lease provision and amortisation of client relationships Basic 7.5p 5.8p 13.2p
Diluted 7.1p 5.5p 12.5p
a) Finance costs of deferred consideration are added back where the issue of shares is more dilutive than the interest cost saved.
Unaudited 26 weeks
to 31 March
2013
Unaudited 26 weeks
to 31 March
2012
Audited 52 weeks
to 30
September 2012
Earnings attributable to ordinary shareholders Continuing and discontinued operations £'000 £'000 £'000Profit for the period from continuing and discontinued operations 5,266 5,602 18,402 Redundancy costs 3,378 134 617 less tax (794) (34) (154)Additional FSCS levy 1,107 553 553 less tax (260) (138) (138)Onerous lease provision 5,882 - - less tax (1,382) - - Amortisation of intangible assets - client relationships 6,494 5,954 11,871 less tax (1,526) (1,488) (2,968)
Adjusted basic profit for the period and attributable earnings excluding redundancy costs, additional FSCS levy, onerous lease provision and amortisation of client relationships 18,165 10,583 28,183
Profit for the period 5,266 5,602 18,402 Finance costs of deferred consideration (Note a above) 19 95 115 less tax (4) (24) (29)Adjusted fully diluted profit for the period and attributable earnings 5,281 5,673 18,488 Redundancy costs 3,378 134 617 less tax (794) (34) (154)Additional FSCS levy 1,107 553 553 less tax (260) (138) (138)Onerous lease provision 5,882 - - less tax (1,382) - - Amortisation of intangible assets - client relationships 6,494 5,954 11,871 less tax (1,526) (1,488) (2,968)
Adjusted basic profit for the period and attributable earnings excluding redundancy costs, additional FSCS levy, onerous lease provision and amortisation of client relationships 18,180 10,654 28,269
19
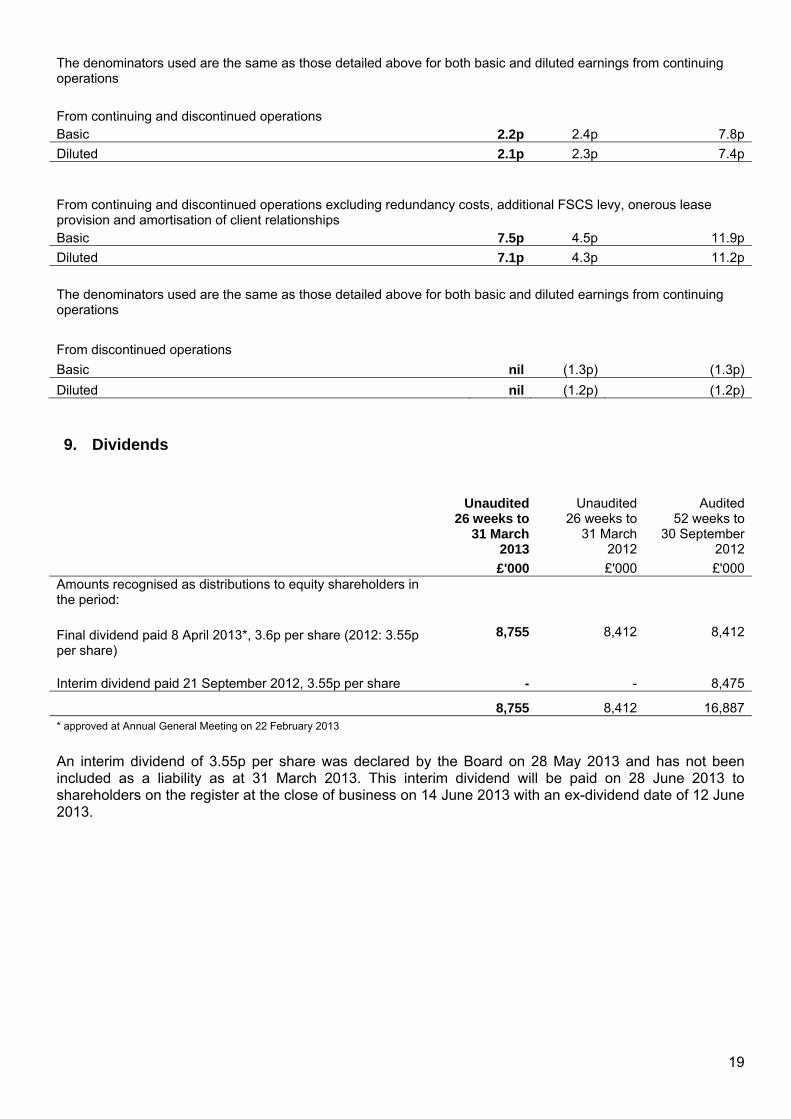
The denominators used are the same as those detailed above for both basic and diluted earnings from continuing operations
From continuing and discontinued operations Basic 2.2p 2.4p 7.8p
Diluted 2.1p 2.3p 7.4p
From continuing and discontinued operations excluding redundancy costs, additional FSCS levy, onerous lease provision and amortisation of client relationships Basic 7.5p 4.5p 11.9p
Diluted 7.1p 4.3p 11.2p
The denominators used are the same as those detailed above for both basic and diluted earnings from continuing operations
From discontinued operations
Basic nil (1.3p) (1.3p)
Diluted nil (1.2p) (1.2p) 9. Dividends
Unaudited26 weeks to
31 March 2013
Unaudited 26 weeks to
31 March 2012
Audited 52 weeks to
30 September 2012
£'000 £'000 £'000Amounts recognised as distributions to equity shareholders in the period:
Final dividend paid 8 April 2013*, 3.6p per share (2012: 3.55p per share)
8,755 8,412 8,412
Interim dividend paid 21 September 2012, 3.55p per share - - 8,475
8,755 8,412 16,887 * approved at Annual General Meeting on 22 February 2013
An interim dividend of 3.55p per share was declared by the Board on 28 May 2013 and has not been included as a liability as at 31 March 2013. This interim dividend will be paid on 28 June 2013 to shareholders on the register at the close of business on 14 June 2013 with an ex-dividend date of 12 June 2013.

20
10. Intangible assets
Goodwill Client
relationships Software
development costs
Purchased software
Total
£'000 £'000 £'000 £'000 £'000 Cost At 30 September 2011 48,637 90,485 1,134 13,083 153,339 Additions - 3,465 86 2,627 6,178
Revaluation of shares to be issued and deferred purchase consideration in respect of acquisitions in prior periods - (3,039) - - (3,039) At 31 March 2012 48,637 90,911 1,220 15,710 156,478 Additions - 4,200 388 13,255 17,843 Disposals - - - (90) (90)
Revaluation of shares to be issued and deferred purchase consideration in respect of acquisitions in prior periods - (421) - - (421) At 30 September 2012 48,637 94,690 1,608 28,875 173,810 Additions - 4,330 517 8,581^ 13,428 Exchange differences - 9 - - 9
Revaluation of shares to be issued and deferred purchase consideration in respect of acquisitions in prior periods - 2,636 - - 2,636 At 31 March 2013 48,637 101,665 2,125 37,456 189,883
^ £8.5m relates to purchased software acquired in the period which is under development and not yet in use; in total there is £23.5m which is not yet in use.
Accumulated amortisation and impairment At 30 September 2011 - 31,606 458 5,470 37,534 Amortisation charge for the period - 5,954 149 1,535 7,638 Impairment losses for the period - - - - - At 31 March 2012 - 37,560 607 7,005 45,172 Amortisation charge for the period - 5,917 155 1,724 7,796 Eliminated on disposal - - - (88) (88) Impairment losses for the period - - - - - At 30 September 2012 - 43,477 762 8,641 52,880 Amortisation charge for the period - 6,414 156 1,612 8,182 Impairment losses for the period - 80 - - 80 At 31 March 2013 - 49,971 918 10,253 61,142
Net book value At 30 September 2011 48,637 58,879 676 7,613 115,805 At 31 March 2012 48,637 53,351 613 8,705 111,306 At 30 September 2012 48,637 51,213 846 20,234 120,930 At 31 March 2013 48,637 51,694 1,207 27,203 128,741

21
11. Property, plant and equipment
During the period the Group spent £0.6 million (26 weeks to 30 March 2012: £1.2 million, 52 weeks to 30 September 2012: £1.6 million) on leasehold improvements, £0.8 million (26 weeks to 30 March 2012: £1.5 million, 52 weeks to 30 September 2012: £3.8 million) on computer equipment and £0.3 million (26 weeks to 30 March 2012: £1.4 million, 52 weeks to 30 September 2012: £2.0 million) on office equipment. The depreciation charge for the period was £2.9m (30 March 2012: £4.1m, 30 September 2012: £7.2m). 12. Investments
Available-for-sale investments
Listed investments
Unlisted investments Total
£'000 £'000 £'000 Fair value
At 31 March 2013 - 6,875 6,875
At 31 March 2012 74 6,000 6,074
At 30 September 2012 13 6,000 6,013
The unlisted available-for-sale investments are in Euroclear plc and N+1 Singer Limited (see note 18). The holding in Euroclear plc is as a result of a £431,000 strategic investment in Crest, the London based settlement system. Crest was taken over by Euroclear plc and the resultant stake in Euroclear plc was 0.52% of its share capital or 19,899 ordinary shares. As at 30 September 2012 the Directors updated their valuation of the Group’s holding in Euroclear plc; the valuation is £6 million (30 March 2012: £6 million, 30 September 2012: £6 million). This valuation takes into account a number of different valuation methods including dividend yield. The N+1 Singer Limited is valued by the Directors at £875,000 (30 March 2012: n/a, 30 September 2012: £nil). This valuation takes into account a number of different valuation methods. Trading investments
Listed investments
Unlisted investments Total
£'000 £'000 £'000 Fair value
At 31 March 2013 863 - 863
At 31 March 2012 812 - 812
At 30 September 2012 759 - 759
Investments are measured at fair value which is determined directly by reference to published prices in an active market where available.

22
13. Provisions
Unauditedas at
31 March 2013
Unaudited as at
31 March 2012
Audited as at
30 September 2012
Sundry claims and
associated costs
Onerous leases Total Total Total
£'000 £'000 £'000 £'000 £'000At start of period 1,887 - 1,887 5,931 5,931Additions 888 5,882 6,770 1,004 1,199Utilisation of provision (292) - (292) (623) (3,848)Unused amounts reversed during the period (466) - (466) (1,417) (1,395)At end of period 2,017 5,882 7,899 4,895 1,887
Provisions Included in current liabilities 2,017 1,518 3,535 4,895 1,887Included in non-current liabilities - 4,364 4,364 - - 2,017 5,882 7,899 4,895 1,887 The timing of settlements in relation to sundry claims and associated costs cannot be accurately forecast; settlement of £0.3m (27 March 2012: £nil, 30 September 2012: £nil) has been made since the balance sheet date. The onerous lease provision of £5.9m is in respect of surplus office space which the Group may not be able to sublet in the short term. 14. Shares to be issued including premium and other deferred purchase liabilities
The Group acquires investment businesses and teams of investment managers, bringing with them funds under management (the latter classified as the intangible asset client relationships) on deferred purchase terms based on the value of income introduced over, normally, a three year period. The payment is normally made in ordinary shares and these shares typically have to be held for a further three years. At the discretion of the Board these shares can be purchased in the market rather than issued. The estimated likely cost of these shares has been updated at the half year in light of actual results of previously acquired business teams and to include new acquisitions. 15. Retirement benefit obligation
The main financial assumptions used in calculating the Group’s retirement benefit obligation are as follows:
As at 31 March
2013
As at 31 March
2012
As at 30 September
2012 Discount rate 4.40% 4.70% 4.50% Rate of inflation (RPI) 3.40% 4.70% 2.90% Rate of inflation (CPI) 2.40% 2.35% 1.90% Salary increases 3.40% 3.10% 2.90% Rate of increase to pensions in payment 3.30% 3.10% 2.90% Expected return on equities 6.50% 7.00% 6.40% Expected return on bonds 3.50% 4.00% 3.40% Expected return on other assets 0.50% 0.50% 0.50% Average assumed life expectancies for members on retirement at age 65 Existing pensioners Males 88.8 years 87.5 years 88.7 years Females 90.0 years 89.0 years 89.9 years Future pensioners Males 90.1 years 88.7 years 90.0 years Females 91.5 years 90.1 years 91.4 years
A full actuarial valuation was carried out as at 1 January 2012 and the results of this valuation have been updated to 31 March 2013 by a qualified independent actuary.

23
16. Called up share capital
The following movements in share capital occurred during the period: Date No. of Fully
Paid Shares No. of Nil
Paid Shares
Exercise/ Issue Price
(pence)
Called up
share capital
Share premium account
Total
£'000 £'000 £'000
At 30 September 2012 246,962,243 2,396,098 2,469 124,271 126,740
Settlement of deferred consideration
6 December 2012 3,079,997 190.5p 31 5,837 5,868
Issue of options Various 895,291 - 37.5p-175.25p
9 1,382 1,391
Nil paid shares now paid up Various 436,643 (436,643) 103.3p-217.5p
4 665 669
Cost of issue of shares - - (12) (12)
At 31 March 2013 251,374,174 1,959,455 2,513 132,143 134,656
17. Note to the cash flow statement
Unaudited 26 weeks to
31 March 2013
Unaudited 26 weeks to
31 March 2012
Audited 52 weeks to
30 September 2012
£'000 £'000 £'000
Operating profit from continuing operations 6,508 12,324 29,099
Loss for the period from discontinued operations (note 18) - (3,873) (3,507)Adjustments for: Depreciation of property, plant and equipment 2,895 4,160 7,214Amortisation of intangible assets - client relationships 6,414 5,954 11,871Amortisation of intangible assets - software 1,768 1,684 3,563Loss on disposal of property, plant and equipment 6 98 105Intangible asset impairment 80 - -Retirement benefit obligation (1,384) (1,124) (2,410)Share-based payment cost 2,729 1,334 3,852Translation adjustments 163 (66) (196)Own shares disposed of on exercise of options - - (8)Unwind of discount of shares to be issued and deferred purchase consideration
62164 192
Interest income 612 554 1,383Interest expense (185) (558) (803)Operating cash flows before movements in working capital 19,668 20,651 50,355
Increase/(decrease) in payables and trading investments 46,212 35,480 (24,375)(Increase)/decrease in receivables and trading investments (50,091) (63,375) 14,910Cash generated/(used) by operating activities 15,789 (7,244) 40,890 Tax paid (2,322) (2,555) (5,911)Net cash inflow/(outflow) from operating activities 13,467 (9,799) 34,979
Cash and cash equivalents comprise cash at bank and bank overdrafts.

24
18. Discontinued Operations
The disposal of the Corporate Advisory and Broking division was completed on 1 February 2012. At this date, the Group received a 14% preferred interest in N+1 Brewin LLP. In July 2012, N+1 Brewin LLP merged with Singer Capital Markets Limited, the Group’s holding is currently 5.6%. This holding has been valued at £875,000, on a fair value basis (30 September 2012 £nil) (see note 12). The Corporate Advisory and Broking Division represented a reportable segment of the Group until its disposal and the effect of the discontinued operation on segment results is disclosed in note 5. The results of the discontinued operations, which have been included in the consolidated income statement, were as follows:
Unaudited 26 weeks to
31 March 2013
Unaudited 26 weeks to
31 March 2012
Audited 52 weeks to
30 September 2012
£'000 £'000 £'000 Revenue - 1,088 1,235 Expenses - (3,189) (3,599)Operating loss - (2,101) (2,364)Costs of separation - (1,772) (1,143)Loss before tax - (3,873) (3,507)Attributable tax - 701 415
Net loss attributable to discontinued operations (attributable to the owners of the Company) - (3,172) (3,092)
The division before its disposal contributed the following to the Group’s net operating cash flows 26 weeks to 31 March 2012: £3.6 million outflow and 52 weeks to 30 September 2012: £3.5 million outflow to the Group’s net operating cash flows.

25
Funds under management (Unaudited)
At 31 March
2013
At 31 March
2012
At 30 September
2012
£ billion £ billion £ billion
In Group's nominee or sponsored member 20.0 17.0 17.9
Stock not held in Group's nominee 0.4 0.3 0.3
Discretionary funds under management 20.4 17.3 18.2
In Group's nominee or sponsored member 6.8 7.3 6.7
Other funds where valuations are carried out but where the stock is not under the Group's control 0.9 1.1 1.0
Advisory funds under management 7.7 8.4 7.7
Managed funds 28.1 25.7 25.9
In Group's nominee or sponsored member 5.9 5.0 5.2
Stock not held in Group's nominee 0.2 0.3 0.2
Execution only stock 6.1 5.3 5.4
Total funds 34.2 31.0 31.3
Stock
In Group's nominee or sponsored member 32.7 29.3 29.8
Stock not held in Group's nominee 1.5 1.7 1.5
34.2 31.0 31.3

26
Cautionary statement The Interim Management Report (the “IMR”) for the 26 week period ended 31 March 2013 has been prepared solely to provide additional information to shareholders to assess the Group’s strategies and the potential for those strategies to succeed. The IMR should not be relied on by any other party or for any other purpose. The IMR contains certain forward-looking statements. These statements are made by the directors in good faith based on the information available to them up to the time of their approval of this report but such statements should be treated with caution due to the inherent uncertainties, including both economic and business risk factors, underlying any such forward-looking information.
Responsibility Statement The Directors confirm that to the best of their knowledge:
a) the condensed set of financial statements has been prepared in accordance with IAS 34 “Interim Financial Reporting”;
b) the interim management report includes a fair view of the information required by Disclosure and Transparency Rules (DTR) 4.2.7 R (indication of important events during the first six months and description of principal risks and uncertainties for the remaining six months of the year); and
c) the interim management report includes a fair view of the information required by DTR 4.2.8 R (disclosures of related parties’ transactions and changes therein).
By order of the Board D Nicol A Westenberger Chief Executive 28 May 2013
Finance Director

27
Independent Review Report Independent Review Report to Brewin Dolphin Holdings PLC We have been engaged by the company to review the condensed set of financial statements in the half-yearly financial report for the 26 week period ended 31 March 2013 which comprise the condensed consolidated income statement, the condensed consolidated statement of comprehensive income, the condensed consolidated statement of changes in equity, the condensed consolidated balance sheet, the condensed consolidated cash flow statement and related notes 1 to 18. We have read the other information contained in the half-yearly financial report and considered whether it contains any apparent misstatements or material inconsistencies with the information in the condensed set of financial statements. This report is made solely to the company in accordance with International Standard on Review Engagements (UK and Ireland) 2410 "Review of Interim Financial Information Performed by the Independent Auditor of the Entity" issued by the Auditing Practices Board. Our work has been undertaken so that we might state to the company those matters we are required to state to it in an independent review report and for no other purpose. To the fullest extent permitted by law, we do not accept or assume responsibility to anyone other than the company, for our review work, for this report, or for the conclusions we have formed. Directors' responsibilities The half-yearly financial report is the responsibility of, and has been approved by, the directors. The directors are responsible for preparing the half-yearly financial report in accordance with the Disclosure and Transparency Rules of the United Kingdom’s Financial Services Authority. As disclosed in note 2, the annual financial statements of the company are prepared in accordance with IFRSs as adopted by the European Union. The condensed set of financial statements included in this half-yearly financial report has been prepared in accordance with International Accounting Standard 34, "Interim Financial Reporting," as adopted by the European Union. Our responsibility Our responsibility is to express to the Company a conclusion on the condensed set of financial statements in the half-yearly financial report based on our review. Scope of Review We conducted our review in accordance with International Standard on Review Engagements (UK and Ireland) 2410 "Review of Interim Financial Information Performed by the Independent Auditor of the Entity" issued by the Auditing Practices Board for use in the United Kingdom. A review of interim financial information consists of making inquiries, primarily of persons responsible for financial and accounting matters, and applying analytical and other review procedures. A review is substantially less in scope than an audit conducted in accordance with International Standards on Auditing (UK and Ireland) and consequently does not enable us to obtain assurance that we would become aware of all significant matters that might be identified in an audit. Accordingly, we do not express an audit opinion. Conclusion Based on our review, nothing has come to our attention that causes us to believe that the condensed set of financial statements in the half-yearly financial report for the 26 week period ended 31 March 2013 is not prepared, in all material respects, in accordance with International Accounting Standard 34 as adopted by the European Union and the Disclosure and Transparency Rules of the United Kingdom's Financial Services Authority. Deloitte LLP Chartered Accountants and Statutory Auditor London, United Kingdom 28 May 2013