29 june 2011 - board meeting - item 10 rail and...
TRANSCRIPT

1
AGENDA ITEM 10
TRANSPORT FOR LONDON
BOARD
SUBJECT: RAIL AND UNDERGROUND ASSET BENCHMARKING
DATE: 29 JUNE 2011
1 PURPOSE AND DECISION REQUIRED
1.1 This paper provides an update on the benchmarking of Rail and Underground assets and programmes which has been carried out recently by TfL. The Board is asked to note the publication of the Rail and Underground Asset Benchmarking Initial Report.
1.2 The Finance and Policy Committee considered a paper on Rail and Underground Asset Benchmarking at its meeting on 25 May 2011.
2 BACKGROUND
2.1 London Underground (LU) and Tube Lines have been benchmarking the historic costs of maintaining assets under the PPP Contract since April 2006. Five annual reports were prepared under the auspices of the Office of the PPP Arbiter (OPPPA), known as the Joint Benchmarking Exercise. The reports included comparison of the unit costs of maintaining fleet, signals, track, stations, lifts and escalators for each of the nine lines on LU’s network.
2.2 In the summer of 2010, OPPPA carried out a short study to assess future cost scenarios for the LU Infracos. OPPPA used its Periodic Review determination of Tube Lines as a basis for an efficient “glide path” for the next seven-and-a-half years and extrapolated the Bakerloo, Central and Victoria lines (BCV) and Sub Surface Lines (SSL). OPPPA concluded:
“London Underground is already forecasting significant cost savings for BCV and SSL and we consider that the quantum of cost represented in the 2010 AAMPs is moving towards good industry practice, assuming that ..... service performance targets are achieved.”
2.3 However, OPPPA’s view was that further opportunities of up to £0.5bn may be available based on a comparison with international peer metros although:
“...this would involve alteration of established and heavily negotiated working practices. We acknowledge that it is unlikely that such major change will be achieved without the full support of Government and the Mayor of London.”
2.4 Since the closure of OPPPA in October 2010, LU and Tube Lines have increased their focus on benchmarking, recognising its importance as a catalyst of future performance improvement and efficiency. The annual benchmarking report has been prepared, using the same protocols and methodology previously agreed with OPPPA (Appendix 1).
2
2.5 OPPPA did not publish the detailed Joint Benchmarking Exercise. However, a high level summary was included in the international benchmarking analysis commissioned by OPPPA from BSL (Management Consultants of the Lloyd’s Register Group)i. To provide greater transparency of LU and Tube Lines maintenance costs and efficiency initiatives, the unit cost benchmarks and detailed analysis are being published for the first time.
2.6 This report includes, also for the first time, the forecast maintenance unit costs to 2017/18, together with a commentary on the planned efficiencies, which substantially reduce the gap between LU and Tube Lines and bring both closer to the international peers.
2.7 TfL also recognises that the coverage of the current benchmarking does not fully extend to capital investment and sets out a detailed proposal for the benchmarking of capital projects - both the management of capital projects and the underlying unit rates related to renewal and upgrade activities. A study into the unit costs of track renewals has already commenced and LU has initiated a review of Communication Based Train Control (CBTC) signalling upgrades through CoMETii.
2.8 LU continues to participate actively in international benchmarking activities with other metros through its membership of CoMET and UITPiii.
3 KEY FINDINGS – ASSET MAINTENANCE BENCHMARKING
3.1 The report provides detailed analysis on the development of asset maintenance costs in LU (former Metronet) and Tube Lines from the start of the PPP Contract in 2002/03 through to 2017/18.
3.2 The analysis is set against the backdrop of performance, which is central to asset management planning and costs. The achievability of future efficiencies will need to be considered in the light of reliability trends.
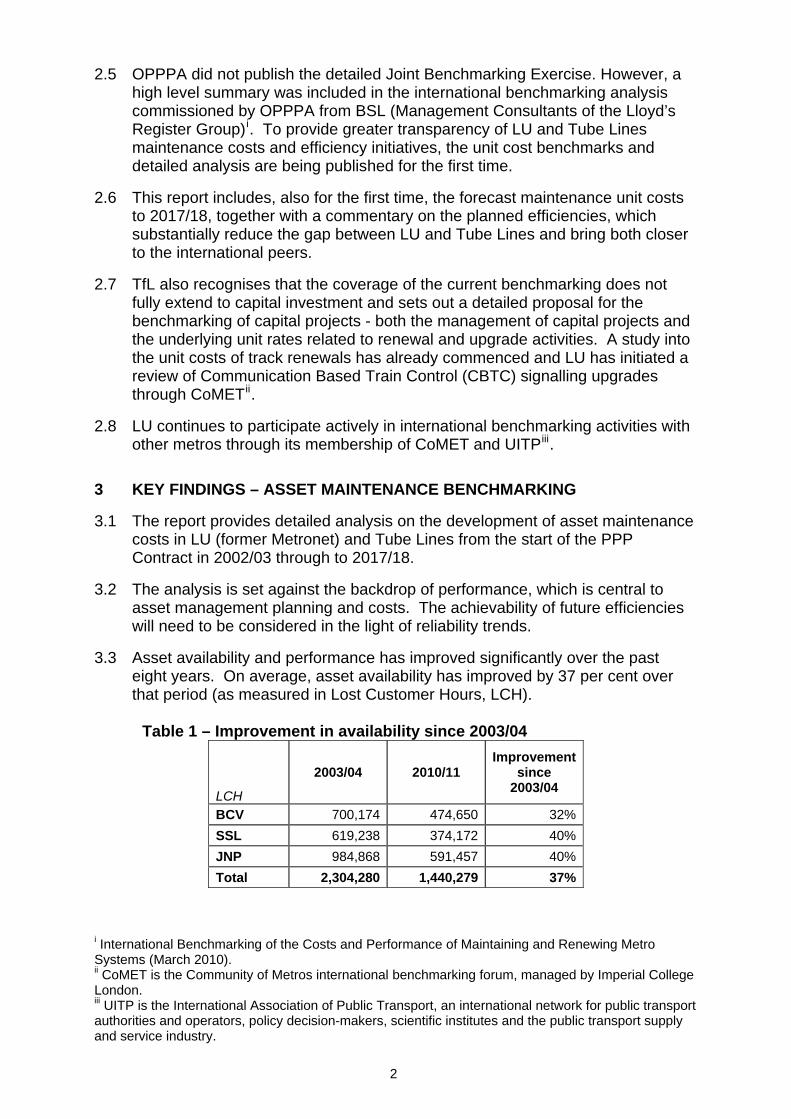
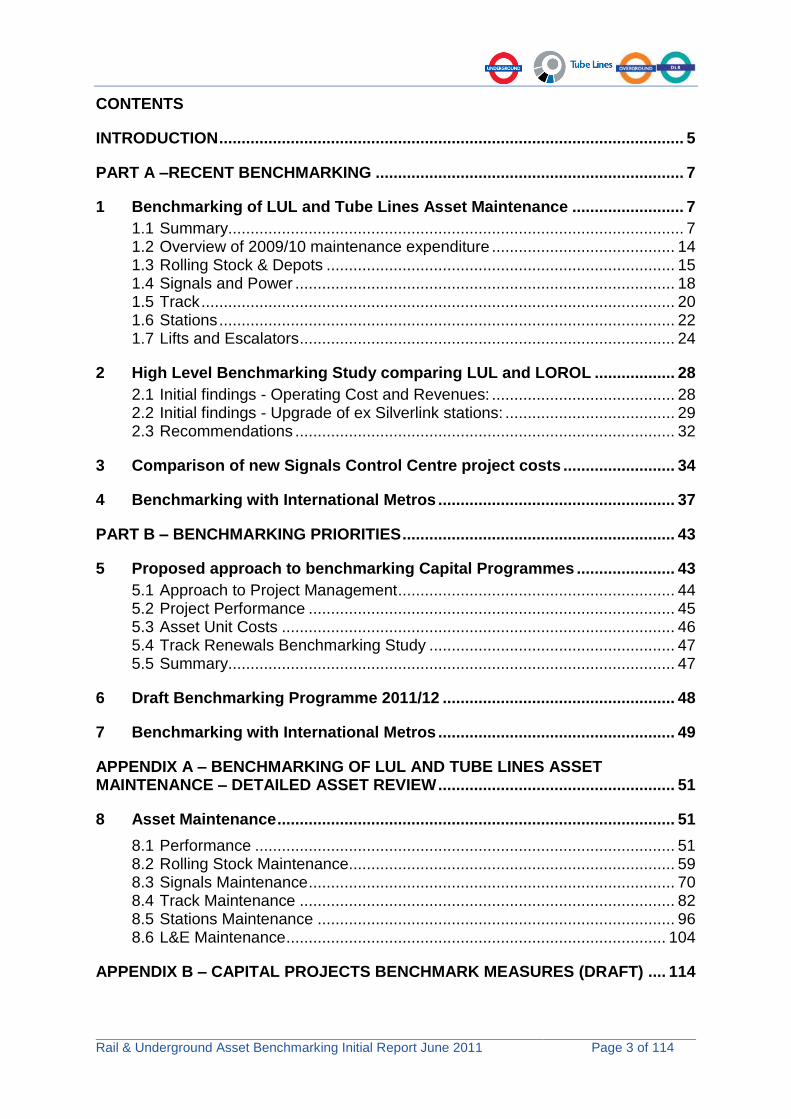
3.3 Asset availability and performance has improved significantly over the past eight years. On average, asset availability has improved by 37 per cent over that period (as measured in Lost Customer Hours, LCH).
Table 1 – Improvement in availability since 2003/04
LCH
2003/04 2010/11 Improvement
since 2003/04
BCV 700,174 474,650 32% SSL 619,238 374,172 40% JNP 984,868 591,457 40% Total 2,304,280 1,440,279 37%
i International Benchmarking of the Costs and Performance of Maintaining and Renewing Metro Systems (March 2010). ii CoMET is the Community of Metros international benchmarking forum, managed by Imperial College London. iii UITP is the International Association of Public Transport, an international network for public transport authorities and operators, policy decision-makers, scientific institutes and the public transport supply and service industry.

3
3.4 This reflects the significant improvements in asset reliability, for all asset areas, described in the following table:
Table 2 – Improvement in reliability since 2003/04
Asset Reliability Measure
BCV SSL Tube Lines
% improvement 2003/04 to 2010/11 Fleet MDBFiv 157% 173% 216% Signals No. Failures
>2 minutes per million car KM
20% 9% (25)%v
Track 38% 61% 53%
Lifts MTBFvi 30% 37% Escalators MTBF 20% 48%
3.5 The current business plan includes around £1bn of maintenance efficiency initiatives. (a) LU’s current Business Plan to 2017/18 reflects maintenance efficiency
targets of £0.9bn (outturn). These efficiencies reduce the long run annual maintenance expenditure by £123m (in real terms) compared to the 2009/10 level of £401m.
(b) The Tube Lines Business Plan to 2017/18 includes maintenance efficiencies amounting to £130m (outturn). These efficiencies reduce the long run annual maintenance expenditure by £17m (in real terms) compared to the 2009/10 level of £226m.
3.6 The planned efficiencies reflect the continuous improvement of maintenance regimes as well as opportunities resulting from the introduction of new, more reliable trains and signals and improved asset condition following capital renewal (for example, track) as well as increased mechanisation and improved contractual arrangements with maintenance suppliers.
3.7 These planned reductions reflect efficiency initiatives, net of any increases (for example, increased contract costs, increased asset usage or an increased density of assets resulting from capital investment) and are to be achieved while also delivering major upgrades and improving day-to-day asset performance.
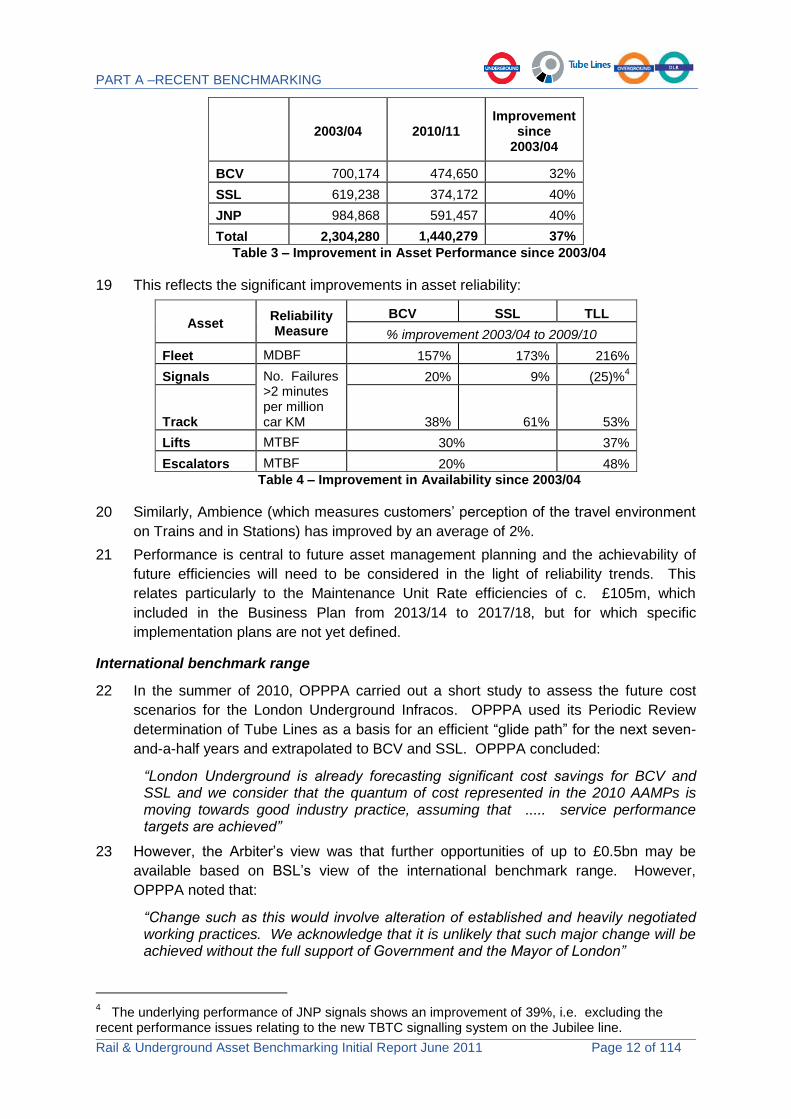
3.8 The benchmarking analysis shows that, even after the planned efficiencies, gaps remain between the lines and also between London and international metros. The report sets out a programme of planned “drill-down studies” for each asset area, to investigate the differences in unit costs between LU and Tube Lines. The studies will consider underlying cost drivers (for example LU standards, maintenance regimes, resourcing levels) and identify opportunities for further improvements in cost and performance, where maintenance practices and culture are transferable from one line to another.
3.9 The acquisition of Tube Lines provides the first opportunity for detailed collaboration, free of the limitations imposed by the commercial arrangements
iv MDBF is the Mean Distance between Failures. v The underlying performance of JNP signals shows an improvement of 39 per cent, excluding the recent performance issues relating to the new Train Based Transmission Control (TBTC) signalling system on the Jubilee line. vi MTBF is the Mean Time between Failures.

4
of the PPP Contracts. LU and Tube Lines have already begun to work closely and to explore openly the possible reasons for differences in unit costs between lines and to identify possible further efficiency initiatives.
4 CONSULTATION WITH IIPAG
4.1 This report is also the basis for providing benchmarking information to TfL’s Independent Investment Programme Advisory Group (IIPAG).
4.2 The terms of reference for IIPAG has been revised in line with TfL’s Spending Review 2010 funding settlement and includes the requirement to:
“direct a team undertaking benchmarking of the costs of maintenance and project delivery on the London Underground network, using data provided by London Underground and such other materials as the Group considers appropriate, including international benchmarking.”
4.3 IIPAG has made a preliminary proposal for the organisation of benchmarking within TfL. These proposals were provided for the meeting of the Finance and Policy Committee on 25 May 2011. IIPAG has also recruited a new part-time Adviser to direct benchmarking across TfL, together with a part-time specialist dedicated to benchmarking activities. TfL management will work with IIPAG to finalise these proposals and to develop an implementation plan.
4.4 As part of a series of consultations on benchmarking, a copy of the report has been provided to IIPAGvii. IIPAG’s comments were provided for the meeting of the Finance and Policy Committee on 25 May 2011. IIPAG has requested that further discussions take place within the business to agree the future direction and strategy for benchmarking across TfL.
4.5 The significant issues arising from the benchmarking analysis will be considered by the Rail and Underground Panel and regular summary reports will be provided to the Panel and the Finance and Policy Committee going forward.
4.6 Future reports will reflect the direction set by IIPAG.
5 RECOMMENDATIONS
5.1 The Board is asked to: (a) NOTE the Rail and Underground Asset Benchmarking Initial Report,
prepared by London Underground and Tube Lines; and (b) NOTE that further discussions will be held with the Independent Investment
Programme Advisory Group to agree the future direction of benchmarking across TfL.
6 CONTACT
6.1 Contact: Richard Parry, Strategy and Commercial Director, London Underground Number: 020 7918 4664 Email: [email protected]
vii IIPAG’s detailed comments relate to version 1.5 of the report, issued on 24 February 2011.

5
APPENDIX 1
RAIL AND UNDERGROUND ASSET BENCHMARKING, INITIAL REPORT

RAIL AND UNDERGROUND ASSET BENCHMARKING
INITIAL REPORT
JUNE 2011

Rail & Underground Asset Benchmarking Initial Report June 2011 Page 2 of 114
Rail & Underground Asset Benchmarking Initial Report June 2011 Page 3 of 114
CONTENTS
INTRODUCTION ........................................................................................................ 5
PART A –RECENT BENCHMARKING ..................................................................... 7
1 Benchmarking of LUL and Tube Lines Asset Maintenance ......................... 7
1.1 Summary...................................................................................................... 7 1.2 Overview of 2009/10 maintenance expenditure ......................................... 14 1.3 Rolling Stock & Depots .............................................................................. 15 1.4 Signals and Power ..................................................................................... 18 1.5 Track .......................................................................................................... 20 1.6 Stations ...................................................................................................... 22 1.7 Lifts and Escalators .................................................................................... 24
2 High Level Benchmarking Study comparing LUL and LOROL .................. 28
2.1 Initial findings - Operating Cost and Revenues: ......................................... 28 2.2 Initial findings - Upgrade of ex Silverlink stations: ...................................... 29 2.3 Recommendations ..................................................................................... 32
3 Comparison of new Signals Control Centre project costs ......................... 34
4 Benchmarking with International Metros ..................................................... 37
PART B – BENCHMARKING PRIORITIES ............................................................. 43
5 Proposed approach to benchmarking Capital Programmes ...................... 43
5.1 Approach to Project Management .............................................................. 44 5.2 Project Performance .................................................................................. 45 5.3 Asset Unit Costs ........................................................................................ 46 5.4 Track Renewals Benchmarking Study ....................................................... 47 5.5 Summary.................................................................................................... 47
6 Draft Benchmarking Programme 2011/12 .................................................... 48
7 Benchmarking with International Metros ..................................................... 49
APPENDIX A – BENCHMARKING OF LUL AND TUBE LINES ASSET MAINTENANCE – DETAILED ASSET REVIEW ..................................................... 51
8 Asset Maintenance ......................................................................................... 51
8.1 Performance .............................................................................................. 51 8.2 Rolling Stock Maintenance......................................................................... 59 8.3 Signals Maintenance .................................................................................. 70 8.4 Track Maintenance .................................................................................... 82 8.5 Stations Maintenance ................................................................................ 96 8.6 L&E Maintenance ..................................................................................... 104
APPENDIX B – CAPITAL PROJECTS BENCHMARK MEASURES (DRAFT) .... 114

Rail & Underground Asset Benchmarking Initial Report June 2011 Page 4 of 114

Rail & Underground Asset Benchmarking Initial Report June 2011 Page 5 of 114
INTRODUCTION
1 This is the first report prepared by the Rail and Underground benchmarking group. It
is intended as a starting point for the provision of benchmarking information to support
The Independent Investment Programme Advisory Group‟s (IIPAG) benchmarking
work.
2 The report is presented in two parts:
Part A – a summary of recent benchmarking; and
Part B – proposed benchmarking priorities.
3 Part A describes recent benchmarking studies, including:
The Sixth Asset Maintenance benchmarking report
This continues work previously carried out under the ambit of the PPP Arbiter (as
the Joint Benchmarking Exercise). The report compares the costs of maintaining
each category of assets across each of the London Underground lines over the
seven years to 2009/10. This year, the report has been extended to include
projected unit costs to 2017/18, which reflect planned efficiencies. The high level
objectives for further investigation over the next year are described for each asset
area;
High Level Benchmarking Study comparing LUL and London Rail (LOROL);
A short study into the cost of new signalling control centres; and
Benchmarking with international metros through the industry organisations
CoMET and Nova, including studies commissioned by LUL into fleet reliability,
escalator management and maintenance management and practice.
4 Part B sets out the priority areas work during the coming year. These proposals have
been developed within the Rail and Underground benchmarking group and reflect
current understanding. The proposals include:
The development of a suite of benchmark measures to be used for Capital
Programme Delivery, together with identification of key data sources and
appropriate external peers (e.g. Crossrail, Network Rail). With the exception of
the costs of new signalling systems and a piece of inconclusive analysis of track
renewals, the benchmarking previously carried out by the PPP Arbiter did not
encompass capital projects. This proposal addresses this gap and provides a
basis for benchmarking both the management of capital projects and the
underlying unit rates related to renewal and upgrade activities. A study into the
unit costs of track renewals has already commenced.
A programme of “drill-down” studies in each area of asset maintenance, extending
the datasets to include London Rail. The priority for the coming year will be to
gain more in-depth understanding of the unit costs, productivity (resource
utilisation) and related drivers (standards, working methods) within London. The
aim of the studies is to identify opportunities for efficiencies which can be readily
adopted within TfL; and
The on-going involvement in benchmarking with international peers through
CoMET and NOVA.

Rail & Underground Asset Benchmarking Initial Report June 2011 Page 6 of 114
5 Note: All values stated in this report are in constant 2009/10 price base unless
otherwise stated.

PART A –RECENT BENCHMARKING
Rail & Underground Asset Benchmarking Initial Report June 2011 Page 7 of 114
PART A –RECENT BENCHMARKING
1 Benchmarking of LUL and Tube Lines Asset Maintenance
1.1 Summary
6 LUL and Tube Lines have participated in benchmarking of asset maintenance, working
in conjunction with the Office of the PPP Arbiter (OPPPA) for the past five years.
There have been two main strands of work:
The Joint Benchmarking Exercise, which compares the costs of maintaining each
of the Underground lines; and
International benchmarking, which compared the London Underground costs
(BCV/SSL and Tube Lines) with a group of peer metros. This was carried out for
OPPPA by external consultants BSL (Management Consultants of the Lloyd‟s
Register Group)1.
7 This benchmarking work has assisted LUL and Tube Lines to improve understanding
of the drivers of maintenance costs and to develop and implement future cost
reductions. For Tube Lines, this process occurred in conjunction with Periodic Review.
LUL has addressed efficiencies for the BCV and SSL network areas largely through its
asset management planning process. The efficiencies in the current Business Plans
reflect the continuous improvement of maintenance regimes as well as opportunities
resulting from the introduction of new, more reliable trains and signals and improved
asset condition following capital renewal (e.g. track) as well as increased
mechanisation and improved contractual arrangements with maintenance suppliers.
These planned efficiencies are to be achieved whilst also delivering major upgrades
and improving day-to-day asset performance.
8 In 2009/10, LUL spent £401m on asset maintenance and plans to spend £3,168m over
the period up to and including 2017/182. Efficiencies amounting to £753m for
BCV/SSL are included in the current BCV/SSL business plans for 2010/11 to 2017/18;
of this total, £640m (85%) are attributable to cost categories included in the asset
maintenance benchmarking and a further £113m is attributed to costs outside the
benchmarking categories, including Civils, Fleet Overhauls and overheads.
1 International Benchmarking of the Costs and Performance of Maintaining and Renewing Metro
Systems (March 2010). 2 Note, all costs are shown in 2009/10 constant prices unless stated otherwise. The planned
efficiencies total £0.9bn outturn.

PART A –RECENT BENCHMARKING
Rail & Underground Asset Benchmarking Initial Report June 2011 Page 8 of 114
9 The composition of the planned efficiencies is shown in the following table:
£m, constant 2009/10 prices
Maintenance Capability
and Support Services Review
Unit Rate reductions and other
Total Package Services contract
Maintenance Optimisation
Automated Track
Measurement System
Total
Fleet & Trains 117.1 60.7 0.0 13.1 0.0 190.9
Track & Signals 205.9 30.6 23.9 0.0 22.8 283.3
Stations 76.3 26.8 63.0 0.0 0.0 166.1
Sub-total 399.3 118.1 87.0 13.1 22.8 640.3
Other maintenance efficiencies in Business Plan but allocated to non-Benchmarked cost categories 112.7
Total efficiencies 753.1
Table 1 – planned efficiencies 2010/11 and 2017/18 – BCV/SSL asset maintenance
10 The long-run sustainable cost reduction is targeted at £123m p.a. of which 60% is
planned to be achieved by the end of 2012/13. Delivery against these targets is
already being achieved. For example, the Maintenance Capability Programme (MCP)
had, by P09 2010/11, delivered cost reductions of £24m p.a. This represents 40% of
the targeted saving of £64m p.a. which is planned to be achieved from MCP by
2012/13. The phasing of the cost reductions is shown in the following graph:
0
10
20
30
40
50
60
70
80
90
100
110
120
130
2010-11 2011-12 2012-13 2013-14 2014-15 2015-16 2016-17 2017-18
Eff
icie
nci
es £
M (2
009/
10 c
onst
ant p
rices
)
Total Efficiencies for plan period £756M (constant prices)
MCP & SSR Total Purchase Services Other Agreed Efficiencies Maintenance Unit Rates
Figure 1 – planned efficiencies 2010/11 to 2017/18 – BCV/SSL asset maintenance

PART A –RECENT BENCHMARKING
Rail & Underground Asset Benchmarking Initial Report June 2011 Page 9 of 114
11 In 2009/10, Tube Lines spent £226m on asset maintenance and plans to spend
£2,055m over the period up to and including 2017/183. Tube Lines current plan for
2010/11 to 2017/18 includes efficiencies of £125m, made up as follows:
£m, constant 2009/10 prices Maintenance Efficiencies
Fleet and Depots 47.7
Track 12.5
Signals (Operations) 29.7
Power 0.3
Stations 20.2
L&E 5.8
Civils 8.9
Total 125.1
Table 2 – planned efficiencies 2010/11 and 2017/18 – Tube Lines
12 Tube Lines‟ long-run sustainable cost reduction is targeted at £17m p.a. compared to
the original budget (i.e. including civils, PEDs, Signalling mini capex and Station
Services) of which approximately £14m p.a. are captured within the benchmarked
costs. 100% of these cost reductions are planned to be achieved by the end of
2012/2013. Additional savings of approximately £14m over seven years are expected
as a result of the recently announced decision to bring in-house the maintenance of
the Jubilee line fleet.
13 The following graphs summarise the changes in the unit costs between 2009/10 and
2017/18 for track, fleet and signals maintenance. Together, these three areas
represent c70% of benchmarked costs and c50% of total maintenance expenditure.
The unit costs are shown in constant 2009/10 prices, are consistent with the data
protocols for asset maintenance benchmarking and are after normalisation. The
planned changes in unit cost are shown net of any increases resulting from, e.g.
increased contract costs, increased asset usage or an increased density of assets
resulting from capital investment.
3 Note, all costs are shown in 2009/10 constant prices unless stated otherwise. The planned
efficiencies amount to £130m outturn.

PART A –RECENT BENCHMARKING
Rail & Underground Asset Benchmarking Initial Report June 2011 Page 10 of 114
44
29
37
25
34
37
0
5
10
15
20
25
30
35
40
45
50
BCV (2009/10) BCV (2017/18) SSL (2009/10) SSL (2017/18) TLL (2009/10) TLL (2017/18)
£k
pe
r c
ar
Rolling Stock Maintenance
(Excluding Heavy Overhauls and Programme Lifts)
£k per car - normalised JL In-house Mtce Savings
Arbiter's Peer Average Arbiter's Benchmark (upper bound)
-34%
-31% +9%
Note: Tube Lines‟ costs include heavy maintenance element of Northern Line Train Services Contract and also include planned reductions of c£3.7m per annum from taking Jubilee line maintenance in-house; BCV/SSL costs exclude estimate of costs relating to heavy maintenance included within the price contracted with Bombardier for the new fleets (TSSSA)
Figure 2 - planned change in fleet maintenance unit rates between 2009/10 and 2017/18
85
67 64
54
-
10
20
30
40
50
60
70
80
90
BCV/SSL (2009/10) BCV/SSL (2017/18) TLL (2009/10) TLL (2017/18)
£k
pe
r tr
ac
k K
M
Signalling Maintenance
£k per track KM - normalised Post upgrade savings (preliminary estimate)
Arbiter's Peer Average Arbiter's Benchmark (upper bound)
-21%
-15%
Figure 3 - planned change in signals maintenance unit rates between 2009/10 and 2017/18

PART A –RECENT BENCHMARKING
Rail & Underground Asset Benchmarking Initial Report June 2011 Page 11 of 114
Figure 4 - planned change in track maintenance unit rates between 2009/10 and 2017/18
14 These graphs show that planned unit costs reduce significantly compared to 2009/10.
Tube Lines fleet costs show small increases, mainly as a result of increased mileage,
when new timetables are introduced following the signalling upgrades on the Jubilee
and Northern lines. Evaluation of the possible post-upgrade savings in BCV/SSL
signals maintenance costs is underway. Preliminary estimates indicate that a further
c.£19m efficiencies may be achievable to 2017/18, amounting to an annual saving of
approximately £8m in 2017/2018. This preliminary estimate is shown in Figure 3
above. The efficiencies described above and elsewhere in this report exclude the 10%
stretch-target recently requested by TfL.
15 The development of future costs and planned efficiencies is described for each asset
in remainder of this report.
16 While the unit costs included in BCV and SSL‟s current Business Plan reduce
significantly, it is clear that variations between the three network areas remain,
particularly for Track and Signals. Further investigation will be undertaken over the
coming year to improve understanding of cost drivers and to identify opportunities for
further cost reductions. This investigation will be carried out by the Benchmarking
Analysis and Reviews team working in conjunction with the Maintenance Sponsors,
LUL‟s Asset Performance Directorate (APD) and Tube Lines.
17 Two key factors will be taken into account when assessing the capacity for further
efficiencies, and these are discussed below.
Performance
18 Asset availability and performance has improved significantly over the past eight
years. Availability is a measure of day-to-day reliability based on whether Assets are
available for service. On average, availability has improved by 37% over the past
eight years (as measured in Lost Customer Hours).
PART A –RECENT BENCHMARKING
Rail & Underground Asset Benchmarking Initial Report June 2011 Page 12 of 114
2003/04 2010/11 Improvement
since 2003/04
BCV 700,174 474,650 32%
SSL 619,238 374,172 40%
JNP 984,868 591,457 40%
Total 2,304,280 1,440,279 37%
Table 3 – Improvement in Asset Performance since 2003/04
19 This reflects the significant improvements in asset reliability:
Asset Reliability Measure
BCV SSL TLL
% improvement 2003/04 to 2009/10
Fleet MDBF 157% 173% 216%
Signals No. Failures >2 minutes per million car KM
20% 9% (25)%4
Track 38% 61% 53%
Lifts MTBF 30% 37%
Escalators MTBF 20% 48%
Table 4 – Improvement in Availability since 2003/04
20 Similarly, Ambience (which measures customers‟ perception of the travel environment
on Trains and in Stations) has improved by an average of 2%.
21 Performance is central to future asset management planning and the achievability of
future efficiencies will need to be considered in the light of reliability trends. This
relates particularly to the Maintenance Unit Rate efficiencies of c. £105m, which
included in the Business Plan from 2013/14 to 2017/18, but for which specific
implementation plans are not yet defined.
International benchmark range
22 In the summer of 2010, OPPPA carried out a short study to assess the future cost
scenarios for the London Underground Infracos. OPPPA used its Periodic Review
determination of Tube Lines as a basis for an efficient “glide path” for the next seven-
and-a-half years and extrapolated to BCV and SSL. OPPPA concluded:
“London Underground is already forecasting significant cost savings for BCV and SSL and we consider that the quantum of cost represented in the 2010 AAMPs is moving towards good industry practice, assuming that ..... service performance targets are achieved”
23 However, the Arbiter‟s view was that further opportunities of up to £0.5bn may be
available based on BSL‟s view of the international benchmark range. However,
OPPPA noted that:
“Change such as this would involve alteration of established and heavily negotiated working practices. We acknowledge that it is unlikely that such major change will be achieved without the full support of Government and the Mayor of London”
4 The underlying performance of JNP signals shows an improvement of 39%, i.e. excluding the
recent performance issues relating to the new TBTC signalling system on the Jubilee line.

PART A –RECENT BENCHMARKING
Rail & Underground Asset Benchmarking Initial Report June 2011 Page 13 of 114
24 LUL had already recognised the scope for further efficiencies and has increased its
maintenance efficiency targets by £0.2bn (outturn).
25 While BSL‟s work provides a useful starting point, significant further work is required to
better understand the benchmark range, and to assess a reasonable and robust long
term cost level to which LUL and Tube Lines should be aspiring, taking into account
the constraints within which they operate (i.e. geographical, historical, technological,
societal and financial).
26 LUL has three specific observations. First, BSL developed its own view of an
international benchmark range, but did not form an opinion of the level of unit cost that
it believed LUL or TLL should achieve at any point in time. As such, these unit rates
may not be achievable within the constraints of the London Underground infrastructure
and organisation, or there may be an insufficiently strong business case to do so.
BSL‟s benchmark range was not adopted by the Arbiter in setting future costs at
Periodic Review.
27 Second, BSL was not able to explain fully the variation between the London Infracos
and the international peer group. For example, BSL was unable to explain with
confidence 60% of the difference between the upper bound of the Track benchmark
range and TLL‟s unit costs and 52% of the equivalent difference for BCV/SSL. In the
absence of fuller understanding, it is not appropriate for LUL to adopt the BSL
benchmark range as a target.
28 Third, the delta from the 2017/18 unit rate to the Arbiter‟s benchmark range is likely to
comprise both additional structural factors which may make costs in London higher
than other metros in the short to medium, and possibly the long, term.
29 This Section presents the key findings and analysis from Phase 6 of the Asset
Maintenance Benchmarking, which compares maintenance costs and performance
across the nine lines maintained by LUL and Tube Lines for each category of assets
across over the seven years to 2009/10. More detailed analysis is set out in Appendix
A.
30 Benchmarking is presented for each of the main assets: rolling stock & depots,
signalling, track, stations, and lifts & escalators. As in previous years, civils assets
have not been included, as the preparation of meaningful comparisons continues to
prove difficult. However, this is an area for future development.
31 Each asset section presents the standard unit rate comparison, with an explanation of
some of the differences between the lines and where there has been a significant
change in the level of unit cost in the latest year of data. This is a continuation of the
benchmarking previously carried out under the ambit of the PPP Arbiter (and known as
the Joint Benchmarking Exercise) and uses the same protocols for costs and
denominators. The Phase 6 report also adopts a consistent approach to assessing
structural factors and normalisation of the data.
32 As well as presenting historical comparisons, each asset section shows a forecast of
cost unit rates to 2017/18 and provides a commentary on the development of future
costs and planned efficiencies5.
33 The acquisition of Tube Lines provides the first opportunity for detailed collaboration,
free of the limitations imposed by the commercial arrangements of the PPP Contracts.
5 Future costs and planned efficiencies as included in the P09 Forecast submitted in December 2010.

PART A –RECENT BENCHMARKING
Rail & Underground Asset Benchmarking Initial Report June 2011 Page 14 of 114
LUL and Tube Lines have already begun to work more closely and to explore openly
the possible reasons for differences in unit costs between lines. However, this
analysis is at a very early stage and significant further investigation required. For each
asset this report contains proposals to validate benchmark data and to understand
whether the cost level and maintenance practices and culture is transferable from one
line to another.
34 Based on the analysis carried out in Phase 6 of the Asset Maintenance Benchmarking
a number of specific areas have been identified for further investigation through a
series of drill down studies. These studies cover the broad range of assets maintained
by LUL and Tube Lines, and for each asset area focus on an aspect of maintenance
for which the analysis has identified the clear potential for improvement or efficiency
savings. For asset areas which have been included in previous benchmarking studies
(e.g. rolling stock, signalling, track), the drill down studies focus on key issues which
have already been identified; for other asset areas the analysis is at an exploratory
stage (e.g. stations, lifts). The proposals for the drill down studies have been
reviewed by the Rail and Underground benchmarking group. However IIPAG has
requested a further review of study prioritisation.
35 There are three main categories of investigation:
improving data comparability and consistency;
investigating costs, productivity measure and related drivers and explaining the
variations between lines; and
commissioning and using external benchmarking (e.g. from CoMET) where this
will readily complement internal benchmarking information.
36 Readers of this report should bear in mind that all observations and assertions related
to the BCV and SSL lines are the current understanding of the LUL Asset Performance
Directorate (APD) and the LUL asset sponsors, and those related to JNP are the
current understanding of Tube Lines, unless otherwise stated. All costs are in
constant 2009/10 prices, unless otherwise stated.
1.2 Overview of 2009/10 maintenance expenditure
37 For 2009/10, the benchmarked data on BCV and SSL accounts for 76% of the total
APD spend in 2009, the remaining 24% of costs is outside the scope of the
benchmarking exercise. For Tube Lines, 68% of the total maintenance costs are
captured in the benchmarks and 32% fall outside the scope of the benchmarking
exercise. This is described by asset category in the following.

PART A –RECENT BENCHMARKING
Rail & Underground Asset Benchmarking Initial Report June 2011 Page 15 of 114
£m 2009/10 prices BCV SSL TLL Total
Fleet & Depots 59.8 40.3 54.6 154.7
Signals 17.7 26.7 22.1 66.5
Track 33.3 50.8 22.7 106.8
Stations 29.0 28.2 39.6 96.8
L&E 12.5 6.1 15.3 33.9
Sub Total 152.3 152.0 154.3 458.6
Civils 6.9 15.8 4.6 27.3
Fleet Maintenance levels 4-7 19.9 6.4 3.6 29.9
NL lease n/a 36.5 36.5
All other Un-benchmarked 47.4 27.2 74.6
Total 400.8 226.2 627.0
Table 5 – Asset Maintenance Costs 2009/10
38 The split of activities varies by network area and is illustrated below.
Figure 5 - Proportion of asset maintenance costs included in benchmark analysis
39 The costs related to Civils maintenance and certain heavy maintenance of fleet are not
in the scope of the Phase 6 benchmarking exercise. Central overheads are also
excluded.
1.3 Rolling Stock & Depots
40 LUL and Tube Lines are planning to spend £1.2bn on the maintenance of the Rolling
Stock and Depots assets between 2010/11 and 2017/18, which accounts for 35% of all

PART A –RECENT BENCHMARKING
Rail & Underground Asset Benchmarking Initial Report June 2011 Page 16 of 114
benchmarked asset maintenance spend. This cost includes the cleaning and
maintenance (levels 1, 2 and 3) of trains and the depot equipment used to maintain
trains. It does not include periodic heavy maintenance such as programme lift or
heavy overhaul or project works such as the installation of signalling related
communications equipment, or Northern line lease payments.
41 The graphs below show for each of BCV, SSL and Tube Lines the change in rolling
stock and depot unit rates (maintenance cost per car) between 2009/10 and 2017/18,
summarising the total efficiency initiatives which are being implemented over this
period and the total of any cost increases.

PART A –RECENT BENCHMARKING
Rail & Underground Asset Benchmarking Initial Report June 2011 Page 17 of 114
0
10,000
20,000
30,000
40,000
Unit cost 2009/10 Efficiency initiatives Net cost increase e.g contract costs
Unit cost 2017/18
Tube Lines Rolling Stock & Depots maintenance cost per car (£ 2009/10)
Figure 6 – Waterfall comparison (Rolling stock maintenance costs per car)
42 There is an overall reduction in unit rate of £15,800 per car on BCV and £10,600 per
car on SSL over this period. This comprises reductions due to existing and planned
efficiency initiatives (i.e. Maintenance Capability Plan, Maintenance Unit Rates,
Maintenance Optimisation, Support Services Review) offset by a cost increase for
SSL, which is currently understood to relate largely to the introduction of the Technical
Support and Spares Supply Arrangement (TSSSA).

PART A –RECENT BENCHMARKING
Rail & Underground Asset Benchmarking Initial Report June 2011 Page 18 of 114
43 For Tube Lines there is an increase in unit cost of c. £3,000 per car. This is due to an
increase in contract costs on both the Northern and Jubilee lines as a result of
additional maintenance of TBTC equipment, extra mileage and new train declarations,
offset by efficiencies as a result of savings from the optimisation of level 1 and 2
maintenance, improved use of the Maximo asset management system, and planned
reductions from taking Jubilee line maintenance in-house (c. £2,400 per car).
44 Three specific areas have been identified for further work, to provide a better
understanding of the differences in unit rates and to identify further efficiency
opportunities:
45 The comparison of maintenance activities within the benchmarking unit rate has
revealed significant variations between lines. Further work is required to understand
whether these are issues relating to data capture, or whether certain fleets have lower
unit rates for certain maintenance activities, and in particular labour arrangements for
the in-house maintenance of different fleets.
46 The unit cost levels and reliability performance of the Piccadilly line fleet is „best in
class‟ in London. A drill down study is examining the maintenance practices and
culture on the Piccadilly line to understand what opportunities exist to introduce good
practices into other fleets and depots.
1.4 Signals and Power
47 LUL and Tube Lines are planning to spend c. £0.5bn on the maintenance of the
Signals assets between 2010/11 and 2017/18, which accounts for c. 15% of all
benchmarked asset maintenance spend. This cost includes inspection, preventative
and corrective maintenance, routine change (i.e. component renewal), power
maintenance and all related direct supervision and management costs. It does not
include mid-life refurbishments, training costs, central overheads and project works
such as the installation of signalling related communications equipment.
48 The graphs below show the change in signals unit rates (maintenance cost per km)
between 2009/10 and 2017/18, summarising the total efficiency initiatives and the total
cost increase for BCV/SSL and for Tube Lines.
PART A –RECENT BENCHMARKING
Rail & Underground Asset Benchmarking Initial Report June 2011 Page 19 of 114
Figure 7 – Waterfall comparison (Signalling maintenance costs per track km)
49 There is a net reduction in the signals maintenance unit rate of £3,000 per track km for
BCV/SSL over this period. This comprises a reduction due to planned efficiency
initiatives (i.e. Maintenance Capability Plan, Maintenance Unit Rates and Support
Services Review), which are offset by a cost increase which current understanding
suggests relates largely to an increase in headcount in the ATC and C&I teams and
the Central line workforce and additional spares for maintenance. However, the
business plan does not yet reflect savings as a result of the delivery of the Signalling

PART A –RECENT BENCHMARKING
Rail & Underground Asset Benchmarking Initial Report June 2011 Page 20 of 114
Upgrade on the Victoria line (in 2013) and on the Sub-Surface Railway (in 2014).
Evaluation of the possible savings is underway and preliminary estimates indicate that
a further c.£19m efficiencies may be in the current business plan, amounting to an
annual saving of approximately £8m in 2017/2018.
50 For Tube Lines there will be a reduction in unit cost of £10,000 per km over this period.
This is due to a change from a line to an asset based maintenance structure; a
reduction in grades due to technological requirements; changes to the signalling
maintenance regime; and an alternative approach to ACATS wheel rail management.
51 A joint LUL-Tube Lines signalling maintenance study is already underway, to address
some of the issues identified in this report, with the following objectives:
Phase 1: Incident Response Time. This will examine the cost of response teams
required vs. the cost of passenger disruption;
Phase 2: Signal maintenance pre-upgrade: This phase will review existing working
practices of Technical Officers across all London Underground lines in order to
share best practices, identify areas for improvement and explain any remaining
differences with peers;
Phase 3: Post-Upgrade Organisation. This phase will focus on the organisation of
signal maintenance post upgrades.
52 This study will focus, in particular, on achieving data comparability and consistency,
and will make an internal comparison of costs, productivity measures and cost drivers.
53 Once the internal comparisons have been made, and understood, the study will
compare the organisation of signal maintenance with other metros around the world,
through the CoMET group, and suggest a good practice post-upgrade signalling
organisation.
1.5 Track
54 LUL and Tube Lines are planning to spend £0.7bn on the maintenance of the Track
assets between 2010/11 and 2017/18, which accounts for 20% of all benchmarked
asset maintenance spend. This cost includes: direct and sub-contract labour,
protection services, materials and track workshop costs, plant hire, track recording
vehicle, ultrasonic testing, grinding and tamping costs, and engineering train costs.
The activities include: track cleaning, vegetation control, compliance work, track
lubrication and depot maintenance. It does not include fencing, emergency response,
overheads, and costs that are considered „one-off‟ or not part of planned maintenance
cycles. It also does not include capital expenditure on full or partial track renewals.
55 The graphs below show the change in track unit rates: maintenance cost per
(passenger service) track km from 2009/10 to 2017/18.
PART A –RECENT BENCHMARKING
Rail & Underground Asset Benchmarking Initial Report June 2011 Page 21 of 114
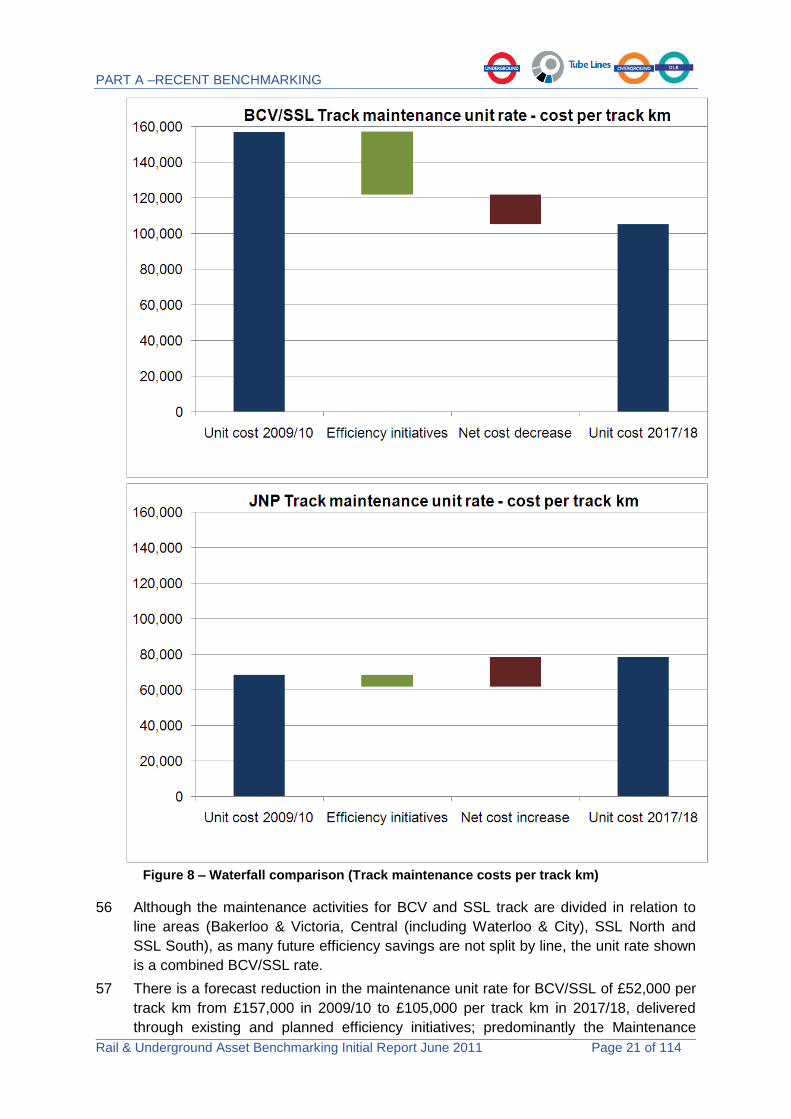
Figure 8 – Waterfall comparison (Track maintenance costs per track km)
56 Although the maintenance activities for BCV and SSL track are divided in relation to
line areas (Bakerloo & Victoria, Central (including Waterloo & City), SSL North and
SSL South), as many future efficiency savings are not split by line, the unit rate shown
is a combined BCV/SSL rate.
57 There is a forecast reduction in the maintenance unit rate for BCV/SSL of £52,000 per
track km from £157,000 in 2009/10 to £105,000 per track km in 2017/18, delivered
through existing and planned efficiency initiatives; predominantly the Maintenance

PART A –RECENT BENCHMARKING
Rail & Underground Asset Benchmarking Initial Report June 2011 Page 22 of 114
Capability Plan, Automated Track Monitoring System (ATMS), as well as other
initiatives such as achieving lower Maintenance Unit Rates and savings from contract
re-negotiation (TPS).
58 There is an overall forecast increase in the maintenance unit rate for Tube Lines of
£9,900 per track km from £68,500 per track km in 2010/11 to £78,400 per track km in
2017/18. This predominantly relates to significantly increased volumes of grinding and
tamping because of the increased rolling stock tonnage following the upgrades, and to
other initiatives to improve track geometry and reduce track degradation.
59 The increases for Tube Lines are partially offset by planned efficiencies which include
a move from a “Find-and-Fix” to a “Predict-and-Prevent” strategy for track faults using
output from the Asset Inspection Train (AIT), and an improved approach to ultrasonic
rail testing. Additionally, Tube Lines plan to use a risk based approach to increase the
interval between inspections.
60 To provide a better understanding of the differences in unit rates and to identify further
efficiency opportunities, LUL and Tube Lines plan to carry out two detailed
investigations:
61 A drill-down study into track maintenance costs which will focus on determining the
exact scope of works for discrete repetitive activities, e.g. manual inspections and
servicing type activities that are being carried out by each maintenance organisation.
In addition, this study will identify the asset regime, the treatment of overheads, and
the risk strategies being employed by each maintenance organisations, and how these
strategies interface with WLAM principles and the renewals programme.
62 A further exercise will be carried out to determine standard activities within track
maintenance costs for accurate data collection and comparability. Analysis will also be
undertaken on overhead costs (currently excluded from the asset maintenance
benchmarking) to ensure comparable treatment is being made.
1.6 Stations
63 LUL and Tube Lines are planning to spend £0.8bn on the maintenance of the Stations
assets between 2010/11 and 2017/18, which accounts for 22% of all benchmarked
asset maintenance spend. This figure includes the maintenance costs for station
services (communication, fire, electrical and mechanical (E&M) assets) and station
premises including cleaning costs.
64 The graphs below show the change in station unit rates (average cost per station)
between 2009/10 and 2017/18.
PART A –RECENT BENCHMARKING
Rail & Underground Asset Benchmarking Initial Report June 2011 Page 23 of 114
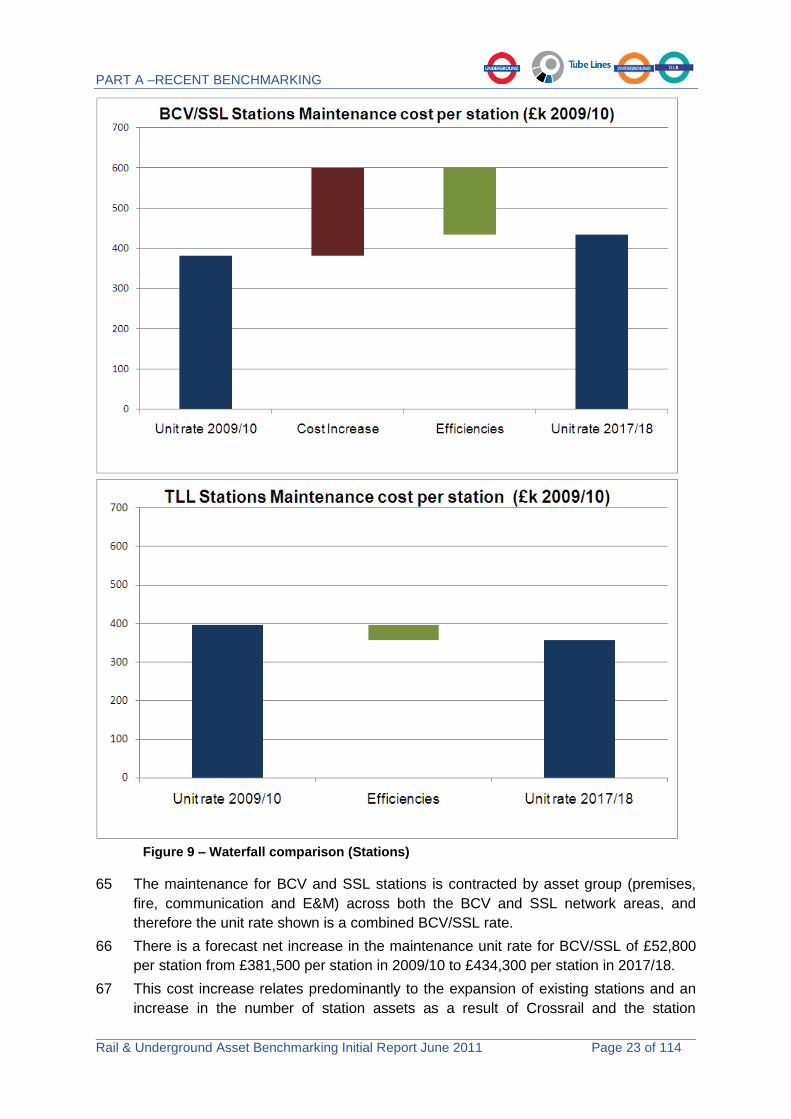
Figure 9 – Waterfall comparison (Stations)
65 The maintenance for BCV and SSL stations is contracted by asset group (premises,
fire, communication and E&M) across both the BCV and SSL network areas, and
therefore the unit rate shown is a combined BCV/SSL rate.
66 There is a forecast net increase in the maintenance unit rate for BCV/SSL of £52,800
per station from £381,500 per station in 2009/10 to £434,300 per station in 2017/18.
67 This cost increase relates predominantly to the expansion of existing stations and an
increase in the number of station assets as a result of Crossrail and the station

PART A –RECENT BENCHMARKING
Rail & Underground Asset Benchmarking Initial Report June 2011 Page 24 of 114
congestion relief projects. There is also a forecast increase in unit cost as a result of
the renegotiation of the BCV/SSL maintenance contracts in 2013-15.
68 These increases for BCV/SSL are partially offset by planned efficiencies which include
those in the Maintenance Capability Plan (MCP), together with the realisation of
savings included within the current maintenance contracts.
69 There is a forecast decrease in the maintenance unit rate for Tube Lines which is to be
delivered by combining the contracts for ambience and security, and the introduction of
the Maximo asset management system to the management of premises assets, so
that contractor involvement can be targeted more accurately.
70 To provide a better understanding of the differences in unit rates and to identify further
efficiency opportunities the stations maintenance drill down study will be progressed in
two phases.
71 The first phase will identify and analyse cost data at asset group level for the SSL,
BCV and TLL station assets. The objective of the first phase will be to identify the
optimum maintenance costs for each asset group with a subsequent analysis to
identify efficiency opportunities which could be applied to the maintenance of all similar
assets across the LUL network.
72 The second phase will focus on extending this analysis within the TfL group, including
London Rail, and to external organisations, including international metros via the
CoMET and Nova groups, maintaining similar assets for comparison and subsequent
identification of efficiency opportunities. The second phase will also consider the
relationship between asset performance and the cost of maintaining the assets.
1.7 Lifts and Escalators
73 LUL and Tube Lines are planning to spend £0.2bn on the maintenance of the
Escalator assets between 2010/11 and 2017/18, this accounts for 6% of all
benchmarked asset maintenance spend, and £53m on the maintenance of the Lift
assets over the same period, which accounts for 1% of all benchmarked asset
maintenance spend.
74 The graphs below show the change in unit rates (average cost per machine) between
2009/10 and 2017/18 for lifts and escalators respectively.

PART A –RECENT BENCHMARKING
Rail & Underground Asset Benchmarking Initial Report June 2011 Page 25 of 114
Figure 10 – Waterfall comparison (Lifts)

PART A –RECENT BENCHMARKING
Rail & Underground Asset Benchmarking Initial Report June 2011 Page 26 of 114
Figure 11 – Waterfall comparison (Escalators)
75 The graphs for SSL and BCV combine the maintenance costs of lifts and escalators on
SSL and BCV to reflect the maintenance arrangements for the assets which are
combined and not split by network area.
76 There is a net decrease in the forecast maintenance unit rate for BCV/SSL for
escalators of £300 per escalator and a net increase for lifts of £1,000 per lift.
77 For escalators the unit cost increase is due to transferring maintenance materials costs
from other budget areas, plus an element of payroll inflation. For lifts the unit cost

PART A –RECENT BENCHMARKING
Rail & Underground Asset Benchmarking Initial Report June 2011 Page 27 of 114
increase relates mainly to payroll increases (pensions/NI), and to a lesser degree
heavy maintenance requirements and the poor condition of assets taken over from the
Otis Contract.
78 The increase in lift and escalator costs for BCV/SSL is partially offset by the current
and planned efficiencies contained within the Maintenance Capability Plan. These
include efficiency initiatives identified during the previous escalator benchmarking
study undertaken as part of the preparations for PPP Periodic Review.
79 There is a forecast decrease in the maintenance unit rates for Tube Lines‟ lifts and
escalators, with Tube Lines planning to achieve these savings by reducing the
frequency at which maintenance interventions are carried out and through the
introduction of extended engineering hours for lifts and escalators maintenance.
80 The escalators installed on the Jubilee Line Extension (JLE) are understood to be
cheaper to maintain compared to the non-JLE type escalators installed across the rest
of the LUL network, and this is believed to be one of the factors affecting the lower
cost per escalator shown for Tube Lines above. Further analysis of this will be
undertaken.
81 A drill down study is being undertaken to provide a better understanding of the
differences in unit rates and to identify further efficiency opportunities for lift
maintenance. This study is looking to understand the differences between BCV/SSL
and Tube Lines‟ actual and forecast unit rates, and to identify best practice on the
LUL/TLL network and recommend efficiency opportunities for implementation.
82 The study includes a review of maintenance activity costs, volumes and headcount,
including overheads and management costs, and the split between maintenance and
projects, to ensure that costs are treated in a similar way for comparison. The review
also analyses the costs for planned maintenance, reactive maintenance and
inspections and will identify the key differences for each and subsequent efficiency
opportunities, as well as a review of access arrangements and how these compare
across the three network areas in terms of usage, productivity and relationship to
costs.
83 The study will also attempt to identify and understand the relationship between asset
performance and maintenance costs and how asset performance is affected by asset
condition.
84 The lift drill down study also includes a comparison with other metros, through the
CoMET group, to identify good practices in maintenance and procurement as well as
further opportunities for efficiencies. So far six other metros have agreed to
participate.

PART A –RECENT BENCHMARKING
Rail & Underground Asset Benchmarking Initial Report June 2011 Page 28 of 114
2 High Level Benchmarking Study comparing LUL and LOROL
85 A high level benchmarking study has been conducted between London Rail (LR) and
London Underground (LUL). The study comprises two main elements: (i) a high level
operating model review by looking at total operating cost and revenues for LUL and
LR, and (ii) a review of capital project costs and scope of the recent upgrade of ex-
Silverlink stations - Kenton (project led by LUL) and Headstone Lane (project led by
LOROL).
2.1 Initial findings - Operating Cost and Revenues:
86 Operating cost per Passenger Kilometre is marginally lower for LR than LUL, with both
parties showing reductions over the plan period. For LR this reduction is primarily due
to increased passenger projections whilst for LUL it reflects a predicted increase in
passenger numbers combined with a cost reduction over the plan period.
0.10
0.15
0.20
0.25
0.30
0.35
09/10 10/11 11/12 12/13 13/14 14/15 15/16 16/17 17/18
£
Total LU v London Rail (Constant Prices 10/11)
Operating cost per Passenger Kilometre
LU Operating Cost per Passenger Kilometre (£) LR Operating cost per Passenger Kilometre (£)
0.00
0.05
0.10
0.15
0.20
0.25
0.30
0.35
0.40
0.45
09/10 10/11 11/12 12/13 13/14 14/15 15/16 16/17 17/18
£
Operating cost per Passenger Kilometre
SSL Operating cost per Passenger Kilometre (£) LO Operating cost per Passenger Kilomtre (£)
DLR Operating cost per Passenger Kilomtre (£) Figure 12 – Comparison of operating costs per passenger KM
Percentage change 2009/10 to 2017/18
LUL London Rail
Operating Cost -24% 10%
Passenger Kilometres 18% 30%
Passenger Journeys 16% 86%
Table 6 – Planned change in costs, passenger KM and number of journeys 2009/10 to 2017/18
87 Operating cost per train kilometre for LR is lower than LUL, whereas the operating cost
per car kilometre for LUL is lower than LR. Both parties show reductions over the plan
period. For LUL this is due to a projected increase in kilometres combined with a
reduction in cost, whereas for LR it is due to a projected increase in kilometres
combined with a smaller increase in operating cost over the plan period.

PART A –RECENT BENCHMARKING
Rail & Underground Asset Benchmarking Initial Report June 2011 Page 29 of 114
0.00
5.00
10.00
15.00
20.00
25.00
30.00
35.00
40.00
45.00
09
/10
10
/11
11
/12
12
/13
13
/14
14
/15
15
/16
16
/17
£ p
er
Trai
n K
MTotal LU v London Rail (Constant Prices 10/11)
Operating cost per Train Kilometre
LU Operating cost per trains operated (£) LR Operating cost per trains operated (£)
0.00
2.00
4.00
6.00
8.00
10.00
12.00
09
/10
10
/11
11
/12
12
/13
13
/14
14
/15
15
/16
16
/17
17
/18
£
Total LU v London Rail (Constant Prices 10/11)
Operating cost per Car Kilometre
LU Operating cost per Car Kilometre LR Operating Cost (excluding depreciation) / Revenue Car Kilometre
Figure 13 – Comparison of operating costs per train and car KM
Percentage change 2009/10 to 2017/18
LUL London Rail
Operating Cost -24% 10%
Train Kilometres 18% 30%
Car Kilometres 18% 61%
Table 7 – Planned change in costs, train and car KM
88 Fare revenue per Passenger Journey / Kilometre for LUL is significantly higher than
the same for LR, with both show increasing trends over the plan period.
89 London Rail does not have the detailed level costs available from their
concessionaires so it is not possible to fully evaluate the cost drivers for their
expenditure.
2.2 Initial findings - Upgrade of ex Silverlink stations:
90 The refurbishment and upgrade of Kenton6 and Headstone Lane stations were chosen
for this study as they are a similar size and layout and were in a comparable state of
disrepair at point of handover from Silverlink. The Kenton station upgrade was
delivered through a traditional design & construction management approach using
three different delivery contractors and procured through four main contracts for 13 ex
Silverlink stations, whilst the Headstone Lane upgrade was part of a single fixed price
design and build contract to do 44 ex Silverlink stations to a specified output.
91 At face value it would appear that the upgrade of Headstone Lane was delivered more
cheaply than that at Kenton. However, there are differences in the scope delivered
and the method of contracting and delivery. Also given that the analysis has been
undertaken using the original cost estimates7 for Headstone Lane compared to actual
spend at Kenton, the unit rates should be viewed with caution, particularly at the
detailed level. This makes it difficult to compare the unit rates at the aggregated level
6 Kenton station upgrade works are not typical of the station refurbishment and upgrade works carried
out under the PPP during the first contract review period, or of the station asset stabilisation approach going forward for LU stations. 7 Detailed actual costs for each LOROL station are not available to LR so the upfront estimates for
each station provided by the contractor as part of the fixed contract price for all 44 stations were used.
PART A –RECENT BENCHMARKING
Rail & Underground Asset Benchmarking Initial Report June 2011 Page 30 of 114
but still highlights some key differences in approach which resulted in cost differences
between the two projects and which warrant consideration for future projects.
92 The key deliverable for both stations was the installation of communication systems
(PA, CCTV, Customer Information Systems and Help Points), with 81% of the project
spend being for communication systems at Kenton, and 52% at Headstone Lane.
There are material differences in the scope and approach to station systems in terms
of CER rooms, Cable Management Systems, CCTV, PA as well as station control
points.
LOROL, adopted group control of the communication systems with a degree of
local control available 24 hours a day. As the LOROL group control room and the
communication backbone to it were already in place, the costs for these8 are not
reflected in the Headstone Lane station costs used in the study.
At the outset LUL considered group control as an option for Kenton but this was
deemed not to be justified due to the additional staffing requirements and there
not being an existing communications backbone (e.g. Connect). Kenton therefore
has a fully functional local Station Control Point, together with a local station staff
intervention facility. This required more equipment to be installed at the station in
comparison to Headstone Lane, and the provision of space to house it.
LU refurbished and enlarged an existing dilapidated radio room, installing three
communication equipment racks, air conditioning and a fire door meeting 60
minutes fire compliance. At Headstone Lane, only one equipment rack needed to
be installed and this was done in a refurbished back room. No specific works
were undertaken by LOROL on fire compliance with 30 minutes resistance
assumed based on the existing structure, and no air conditioning was required
due to the thermal footprint of the equipment9.
LU installed structured cabling at Kenton whilst point to point cabling was installed
at Headstone lane. Structured cabling is more expensive than point to point
cabling upfront but more flexible and therefore potentially more efficient over the
longer term. The main reason for installing structured cabling was the benefit of
being able to proceed with the installation before finalising the communication
systems design. However, Kenton was the first station where structured cabling
was installed and it took the brunt of the learning curve of the contractors.
There are also material differences in the CMS installed at each station, with LU
installing bespoke GRP (Glass Reinforced Plastic) trunking whilst LOROL used
galvanised trunking, which has both lower capital cost and minimal ongoing
maintenance cost.
93 Whilst both projects focussed on customer aspects such as lighting, electronic train
information displays & help points, and the provision of upgraded CCTV and PA
systems, there was a material difference in the premises works undertaken.
The Headstone Lane project refurbished customer facing aspects throughout the
station such as seating, walls and ceilings, handrails for stairs, tactile flooring and
repainting platform canopies. Due to budget cuts implemented during the latter
8 These were delivered by a separate project with costs not allocated to individual stations.
9 Less equipment required than at Kenton due to the group station control centre and the use of
energy dissipating cabinets.

PART A –RECENT BENCHMARKING
Rail & Underground Asset Benchmarking Initial Report June 2011 Page 31 of 114
stages of the Kenton refurbishment works, and additional costs arising through
poor contractor performance in the early stages of the project, works to refurbish
customer areas were descoped to only include the ticket hall area.
There was a differing view taken by the two projects on spending upgrade money
on landlord (Network Rail) assets, i.e. work on the platform canopies. LU made a
decision not to spend money on these assets whereas LOROL spent money
upgrading platform canopies where these were deemed to be in poor condition.
The costs for this work was not part of the original business case, and is not
included in the declared costs, and London Rail intends to recover an element of
this cost from Network Rail.
The approach to staff accommodation also differed between the projects resulting
in material differences in both quality and quantity of staff accommodation and
facilities. LOROL only undertook minor repairs to existing staff accommodation,
whereas LUL provided new staff mess facilities to reflect the provisions at other
LUL stations and the “Dignity at Work” guidelines. This required the renovation of
severely dilapidated rooms on the platforms to provide space for the new facilities.
94 Both stations are measured by MSS but the absolute level of performance may not be
comparable due to differences in MSS methodology. However both projects show
notable performance improvements post refurbishment, with a slightly greater increase
of 18% at Kenton against 13% for Headstone Lane.
40.0
45.0
50.0
55.0
60.0
65.0
70.0
75.0
80.0
85.0
90.0
Qtr 109/10
Apr-Jun
Qtr 209/10
Jul-Sep
Qtr 309/10
Oct-Dec
Qtr 409/10
Jan-Mar
Qtr 110/11
Apr-Jun
Qtr 210/11
Jul-Sep
Qtr 310/11
Oct-Dec
MSS
sco
re
Survey Quarter
MSS Scores - Kenton and Headstone Lane
Headstone Lane Kenton
Figure 14 – MSS Scores
95 It can be seen that both stations deliver ambience benefits as a result of the projects,
the quantum of benefit is greater at Kenton due to its larger improvement and higher
number of users.
96 The approach to access for the two projects was generally consistent with both
stations remaining open during traffic hours. At Headstone Lane works were
undertaken through either segregated working during traffic hours, or working in
engineering hours. For Kenton works were largely done in engineering hours but the
PART A –RECENT BENCHMARKING
Rail & Underground Asset Benchmarking Initial Report June 2011 Page 32 of 114
project team were able to undertake segregated working on platforms and rooms
during the daytime following extensive demonstrations and agreement with operations
staff and health and safety representatives.
97 The project deadline for Kenton was driven by the timeline for handover to
maintenance of communication systems for all 13 ex-Silverlink stations within an
agreed two year period from the date of transfer from Network Rail, this created a
deadline of November 2009, and accordingly this date was identified as a TfL PAM. In
retrospect, the imperative to meet this date resulted in the contracts being let before
specifications and scope had been finalised. With subsequent poor contractor
performance, both design work and on-site delivery, additional costs were incurred
through the need for re-work and programme recovery. Although planned to take one
year, the stop/start nature of the work, due to the design and on-site issues, extended
the elapsed time on site at Kenton to approximately two years.
98 For Headstone Lane the handover date was a contractual date with liquidated
damages. The handover of maintenance is due to happen when all 44 LOROL
stations have been completed. The elapsed time on site at Headstone Lane for the
station works was approximately one year.
99 The contract arrangements also differed between the two projects. The Headstone
Lane upgrade was part of a fixed price design and build contract to a specified output.
There is a single contract with LOROL to undertake works at 44 stations for a fixed
price with emerging risk transferred to the contractor.
100 The Kenton station upgrade was delivered through a traditional design & construction
management approach with three different delivery contractors managed by LU
project, design & interface management. Four main contracts, each for all 13 stations,
were let namely, one for design; one for advanced cabling and CMS; one for electrical
and telecoms and one for premises.
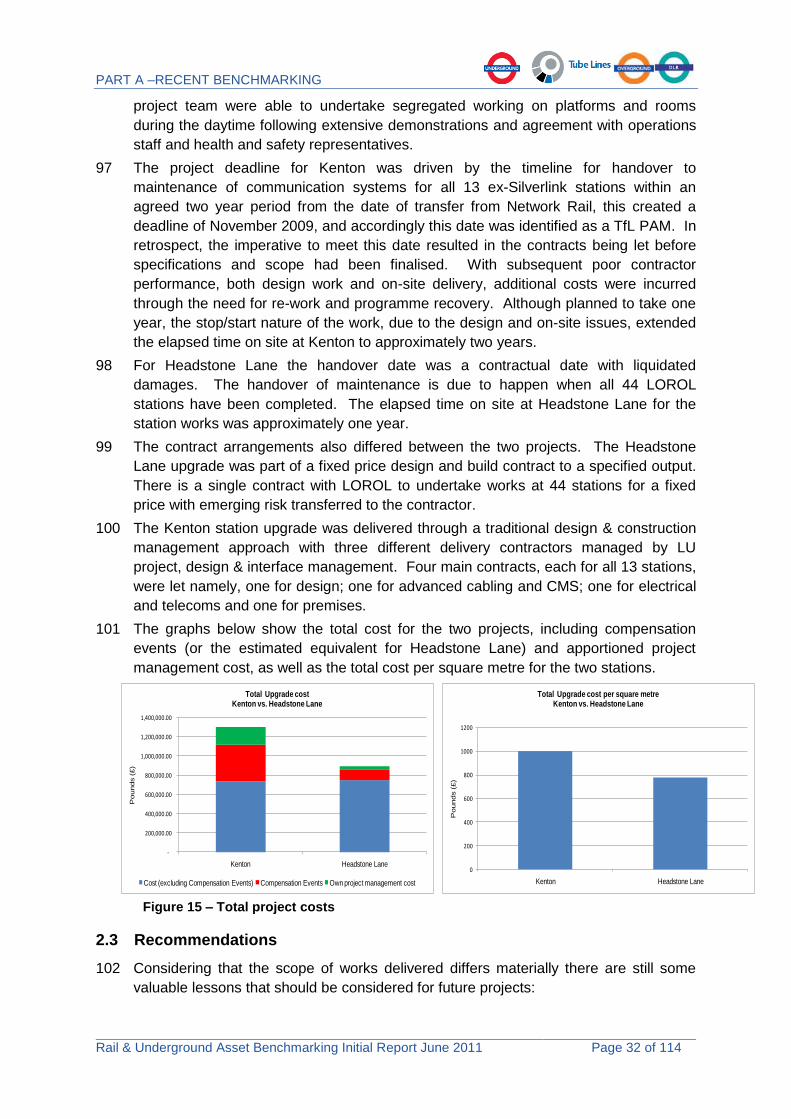
101 The graphs below show the total cost for the two projects, including compensation
events (or the estimated equivalent for Headstone Lane) and apportioned project
management cost, as well as the total cost per square metre for the two stations.
-
200,000.00
400,000.00
600,000.00
800,000.00
1,000,000.00
1,200,000.00
1,400,000.00
Kenton Headstone Lane
Pounds (
£)
Total Upgrade cost Kenton vs. Headstone Lane
Cost (excluding Compensation Events) Compensation Events Own project management cost
0
200
400
600
800
1000
1200
Kenton Headstone Lane
Pounds (
£)
Total Upgrade cost per square metreKenton vs. Headstone Lane
Figure 15 – Total project costs
2.3 Recommendations
102 Considering that the scope of works delivered differs materially there are still some
valuable lessons that should be considered for future projects:
PART A –RECENT BENCHMARKING
Rail & Underground Asset Benchmarking Initial Report June 2011 Page 33 of 114
LU should more actively consider the potential benefits of challenging LU
operational, service delivery and technical standards;
Following success on this project LU should pursue future opportunities to deliver
station works during traffic hours;
There should be more flexibility when decisions are made to meet agreed
milestones when additional cost is required, when failing to do so would not
compromise safety or service performance;
There should be continued and more structured sharing, comparison and
„benchmarking‟ of scope, delivery etc. of similar projects in modes across the TfL
group;
Information on detailed costs to be provided by contractors and concessionaires
needs to be clearly set out when contracts or concessions are let.

PART A –RECENT BENCHMARKING
Rail & Underground Asset Benchmarking Initial Report June 2011 Page 34 of 114
3 Comparison of new Signals Control Centre project costs
103 This section presents the findings of the benchmarking study on projected costs for the
design and build of Hammersmith (Sub Surface Lines) Service Control Centre (SCC),
including associated project management costs, compared to other SCCs recently
constructed or currently under construction in TfL.
104 The other SCCs chosen for the study were Beckton (DLR), Highgate (Northern) and
Osborne House (Victoria). In addition, a further scenario has been considered for
Hammersmith including Piccadilly Line control.
105 The scope of this study is for the design and construction of the SCC and does not
include any costs associated with signalling & control equipment in the SCC, cable
management systems or the cost of purchasing the land.
106 Below is a table that summarises the results of the study. All costs are shown in
2009/10 constant prices unless otherwise stated:
Beckton Highgate Osborne Hammersmith Ham (inc Picc)
Construction Costs (£000) 4,400 9,622 7,238 6,952 6,952
Total Cost of building (£000) 7,856 15,542 8,060 13,333 13,333
Area (Square metres) 1,707 2,125 1,344 2,658 2,658
Number of control desks 8 8 7 22 27
Number of staff 22 21 15 38 43
Total Cost per Square metre (£000/m2) 4.6 7.3 6.0 5.0 5.0
Total cost per member of staff (£000) 357 740 537 351 310
Total cost per control desk (£000) 982 1,943 1,151 606 494
Construction cost per m2 (£000/m
2) 2.6 4.5 5.4 2.6 2.6
Construction costs per member of staff (£000) 200 458 483 183 162
Construction cost per control desk (£000) 550 1203 1034 316 257
Table 8 – Summary of SCC total cost benchmarking study
107 In order to provide a meaningful comparison of control centre costs a set of indicators,
shown in the table above, have been developed. The key points are as follows:
Total/Construction cost per m2 – Beckton has the lowest unit cost at total cost
level. The same is true at construction cost level, although Hammersmith is
almost identical at around £2.6m per m2. Highgate has the highest total cost unit
rate at £7.3m per m2, around 60% higher than Beckton;
Total/Construction cost per staff member accommodated – Hammersmith, the
largest SCC accommodating the highest number of people has the lowest unit
cost, particularly at construction level with the next cheapest (Beckton) around 9%
higher. Hammersmith is even lower when including the additional staff for the
Piccadilly Line, making it almost £500k per staff member lower than Highgate;.
and
PART A –RECENT BENCHMARKING
Rail & Underground Asset Benchmarking Initial Report June 2011 Page 35 of 114
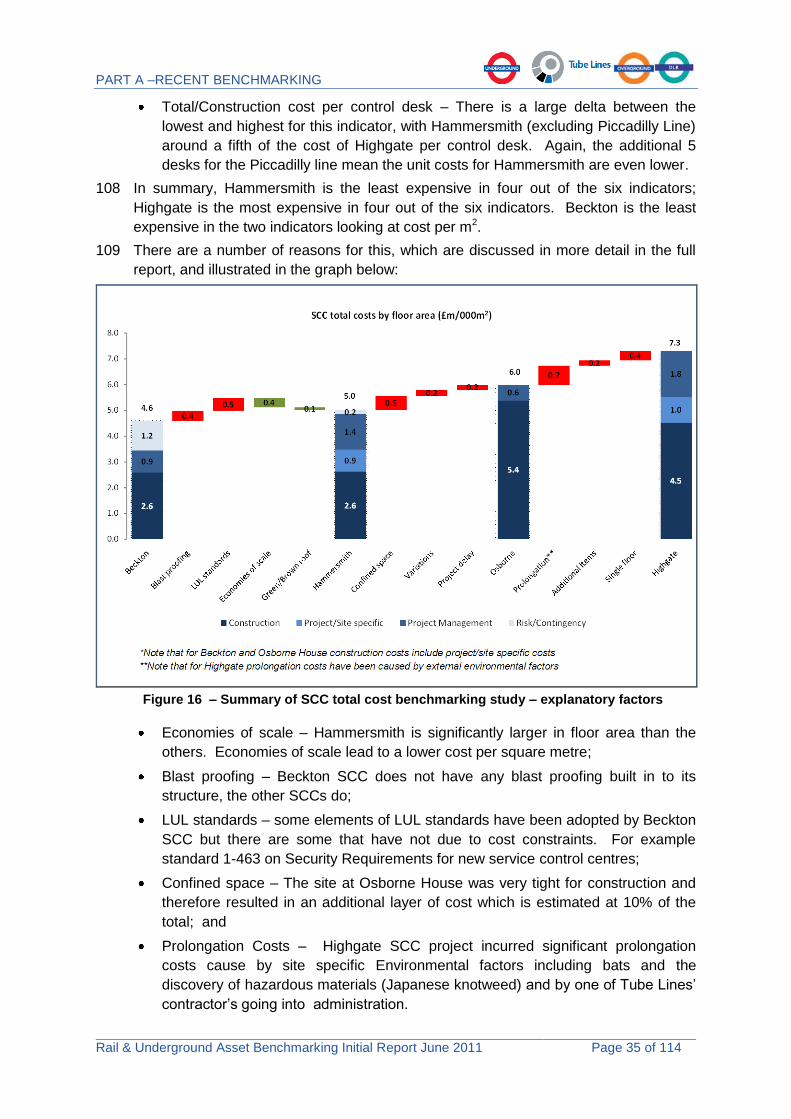
Total/Construction cost per control desk – There is a large delta between the
lowest and highest for this indicator, with Hammersmith (excluding Piccadilly Line)
around a fifth of the cost of Highgate per control desk. Again, the additional 5
desks for the Piccadilly line mean the unit costs for Hammersmith are even lower.
108 In summary, Hammersmith is the least expensive in four out of the six indicators;
Highgate is the most expensive in four out of the six indicators. Beckton is the least
expensive in the two indicators looking at cost per m2.
109 There are a number of reasons for this, which are discussed in more detail in the full
report, and illustrated in the graph below:
Figure 16 – Summary of SCC total cost benchmarking study – explanatory factors
Economies of scale – Hammersmith is significantly larger in floor area than the
others. Economies of scale lead to a lower cost per square metre;
Blast proofing – Beckton SCC does not have any blast proofing built in to its
structure, the other SCCs do;
LUL standards – some elements of LUL standards have been adopted by Beckton
SCC but there are some that have not due to cost constraints. For example
standard 1-463 on Security Requirements for new service control centres;
Confined space – The site at Osborne House was very tight for construction and
therefore resulted in an additional layer of cost which is estimated at 10% of the
total; and
Prolongation Costs – Highgate SCC project incurred significant prolongation
costs cause by site specific Environmental factors including bats and the
discovery of hazardous materials (Japanese knotweed) and by one of Tube Lines‟
contractor‟s going into administration.

PART A –RECENT BENCHMARKING
Rail & Underground Asset Benchmarking Initial Report June 2011 Page 36 of 114
110 Overall, the conclusion of this short study is that the budgeted costs for the
construction of Hammersmith SCC reflect competitively tendered market rates and the
average unit cost is consistent with Beckton. However, the size of the control centre
appears generous and the business will need to exercise control to ensure that scope
changes do not lead to increases in total cost.
111 There does not appear to be any consistency across the projects on what proportion of
control centre space is actually utilised for the control room however there is a clear
positive correlation between line length and complexity and the number of controllers
required.
112 A follow-up review will be conducted when the construction phase of the Hammersmith
SCC project has been completed, which is scheduled to be 30 June 2011. If available
further, more detailed data would help to isolate the effect of explanatory factors on the
costs.

PART A –RECENT BENCHMARKING
Rail & Underground Asset Benchmarking Initial Report June 2011 Page 37 of 114
4 Benchmarking with International Metros
113 The Community of Metros (CoMET) is a programme of international metropolitan
railway (metro) benchmarking. It comprises 12 of the world's largest metros, each with
more than 500 million passenger journeys per year, including: Beijing, Berlin, Hong
Kong, London Underground, Madrid, Mexico City, Moscow, New York, Paris Metro &
RER, Santiago, Sao Paulo and Shanghai.
114 A sister group, Nova, comprises 15 smaller metros, including: Bangkok, Barcelona,
Buenos Aires, Chicago, Delhi, Lisbon, Milan, Montreal, Naples, Newcastle, Rio de
Janeiro, Singapore, Sydney, Taipei and Toronto.
115 Although CoMET and Nova set their own objectives and agenda, they work closely
together, participating in each other's work and increasing the pool of knowledge.
116 The four main objectives of CoMET are to:
build measures to establish metro best practice;
provide comparative information both for the metro board and the government;
introduce a system of measures for management; and
prioritise areas for improvement.
117 CoMET is a key avenue for enabling LUL to define its vision to be world-class. by
providing:
Examples of what other metros do to solve the problems we face - 'Learning from
each others' challenges';
New ideas and suggestions;
Ability to check proposed courses of action; and
Opportunities to work collaboratively with other metros to look for solutions to
challenges faced by members.
118 LUL is an active participant in CoMET and each year supports a number of case
studies carried out by Imperial College London on behalf of the CoMET metros. In
relation to asset management, LUL recently lead two CoMET case studies (rolling
stock reliability and escalator management). LUL also participated in a Nova study
into signalling system upgrade and replacement and is participating in the study on
maintenance management practice.
Rolling stock reliability
119 Following on from a 2006 study, this study over two years covered new and ageing
fleets, sub-systems and doors. The study objectives were to:
focus on the actions metros have taken to improve the reliability of ageing and
new fleets;
investigate the possibility to pursue development of common standards at sub-
system level across metros as an aid to getting the best quality and price from the
supply market;
develop further the statistical analysis of rolling stock reliability undertaken in the
2006 study, possibly including comparison of incidents at different delay
thresholds, and of the factors relating to maintenance management and staff
productivity;

PART A –RECENT BENCHMARKING
Rail & Underground Asset Benchmarking Initial Report June 2011 Page 38 of 114
undertake further analysis of the reliability of sub-systems shown from the 2006
study to have high failure levels (e.g. doors, brakes and traction) to provide a
greater understanding of the factors influencing reliability of these systems; and
continue exchange of experiences between rolling stock experts.
Escalators management
120 The objectives of this study, which was jointly sponsored by LUL and Metro de Madrid,
were to:
provide an overview of escalators, their operations, characteristics, specifications
and statistics within the metros, to understand how transferable strategies and
models are between metros;
understand escalator incident data reported by metros, the definitions applied and
to standardise and benchmark reliability and availability statistics across metros as
far as possible;
develop indicators (and share any related condition monitoring practices) that
could give early warning of incipient reliability issues;
understand the factors that lead to escalator unreliability or reliability and
availability;
understand what needs to be done to improve escalator RAM (reliability,
availability and maintainability);
benchmark metros‟ escalator corrective and preventative maintenance costs, cost
of major overhauls, energy consumption and its cost, identifying any best
practices which have led to a reduction in costs or improvement in RAM;
collect and review any readily available whole-life models for escalators (including
energy costs) currently used by metros, and explore their applicability for adaption
by other metros; and
validate or modify the whole life model proposed in conceptual form in the 1999
report and investigate potential reductions in the whole life cost of escalators.
121 The report showed that LUL was considerable more expensive than other metros in
both Capex and Opex expenditure and was followed by a drill-down study in 2009,
commissioned by LUL, which included visits to a number of metros to validate
questionnaire responses and to see first-hand the practices applied.
122 The outputs of the studies were instrumental in shaping the LUL escalator strategy
which envisages LUL adopting similar escalators of a similar standard to other metros,
changed overhaul periodicity and work content and changed maintenance practices
leading to savings in LUL and Tube Lines estimated at c.£100m over 20 years.
Maintenance management and practice
123 The general aim of the study, which was initiated by MTR, was to consolidate previous
relevant studies and look into holistic maintenance processes. Two phases of work
will be undertaken. Phase 1 was carried out in 2010 (with the report due to be issued
in May 2011) and covered:
understanding and developing strategies on obsolescence and new technology
and the opportunities for collaboration between metros e.g. information sharing,
development of industry standards, technology selection, etc.;

PART A –RECENT BENCHMARKING
Rail & Underground Asset Benchmarking Initial Report June 2011 Page 39 of 114
reviewing maintenance organisation and strategies and the effects of different
levels of outsourcing; and
identifying new KPIs for maintenance benchmarking, especially to measure
maintenance effectiveness.
124 Phase 2 will be carried out in 2011 and will develop Phase 1 to look at metros‟
maintenance strategies and practices in more detail and to address the following
questions:
How is maintenance organised in a modern technologically advanced metro (i.e.
post-Upgrade)?
What are the key measures of maintenance effectiveness and efficiency used
by other metros and reported at a senior management level?
Signalling system upgrades
125 This brief study was commissioned by Metro Rio and provided some qualitative
commentary, but no quantification or cost analysis, on:
the major drivers for signalling systems replacement and the factors taken into
account when replacing a signalling system;
the aspects that should be evaluated in order to define whether to keep an
existing signalling system, develop it to include new sections of line, or to move to
a replacement of the system for the whole network (in the context of network
expansion);
other metros‟ experience in changing signalling systems (e.g. how to deal with
network expansion, the technological leaps and risks in this kind of project); and
a better understanding on how best to define the system to be used (e.g. moving
block, CBTC and other technologies).
126 LUL also commissioned Imperial College London to undertake two Clearinghouse
Studies pertinent to asset management:
Budgeting, planning, costing and reporting - 2010
127 This study was commissioned by LUL Finance who sought to understand how other
metros budget, plan, cost and report maintenance activities. The overall level of
response was disappointing (9 of 26 CoMET & Nova metros) and while there were
some points of interest, no significant insights were, in this case, gained. The study
outputs will be further considered as part of the exercise to determine LUL‟s way
forward in this area.
Large Station Reconstruction - 2009
128 This study was undertaken to address concerns over the cost of the Tottenham Court
Road station reconstruction works. Comparison was made with large station
reconstruction works on selected metros. The benefits to LUL were:
A useful database and good to establish contacts and share knowledge;
A useful understanding of major project issues on other systems and to see how
objectives and issues are common; and
Reassurance that LUL‟s costs were well within the international range; it would be
useful to understand final costs to validate LUL‟s approach on contingency.

PART A –RECENT BENCHMARKING
Rail & Underground Asset Benchmarking Initial Report June 2011 Page 40 of 114
129 In addition, LUL has commissioned and participated in other CoMET and Nova studies
relating to service delivery:
CoMET – Competitiveness and CO2 (led by LUL), information during disruption,
safety precursors and PTI, attendance, staff errors and performance development
for front-line staff; and
Nova - Train service reliability and Fares, Funding and Financing of metros.

PART A –RECENT BENCHMARKING
Rail & Underground Asset Benchmarking Initial Report June 2011 Page 41 of 114
PART A –RECENT BENCHMARKING
Rail & Underground Asset Benchmarking Initial Report June 2011 Page 42 of 114

Rail & Underground Asset Benchmarking Initial Report June 2011 Page 43 of 114
PART B – BENCHMARKING PRIORITIES
130 This section sets out the proposed programme of future studies. These proposals
have been developed within the Rail and Underground benchmarking group and
reflect current understanding. The proposals include:
The proposed approach to benchmarking Capital Projects;
Drill-down studies into the unit costs and related cost drivers of the major areas of
future expenditure, including Track Renewals, maintenance activities across all
asset areas and international benchmarking with other metros.
5 Proposed approach to benchmarking Capital Programmes
131 Under the PPP, benchmarking was led by the OPPPA. Primarily, OPPPA
concentrated on operational and maintenance activities, with limited work on Capital
Programmes. However, OPPPA commissioned BSL to assess the international
benchmarks for signalling upgrades. Following TfL‟s acquisition of Tube Lines,
OPPPA was closed.
132 In September 2010, IIPAG presented its first report to the TfL Board., which noted:
“...... Project stage-gate reviews and discussions with senior TfL staff have provided IPAG with some insight into methods, durations and costs of work that have been undertaken/incurred in the recent past. However, it is more difficult to understand whether or not these practices and costs represent typical market outcomes, industry best practice or poor practice because there are few (if any) established routinely measured norms, and reliance is routinely placed on the personal experiences, preferences or expectations of the generally senior personnel involved.
This prevents any effective transfer of historic trends and best practices, or setting of stretch targets or use of peer pressure to drive change, safety and efficiency across the business. Intuitively, there must be unexploited opportunity to improve the business performance through some transparent and effective benchmarking, coupled to the practice of good leadership and collaborative teamwork.”
133 The overall aim of Capital Programmes benchmarking is to support the Capital
Programmes Directorate (CPD) in LUL to become a “World Class Project Delivery
Organisation”. The proposals that follow have been prepared by the CPD Programme
Management Office and have been confirmed with the Rail and Underground
benchmarking group.
134 This aim is supported by three primary objectives:
Creating a contextually aligned organisational structure;
Achieving optimal project delivery performance; and
Focusing on target driven asset unit costs.
135 These primary objectives are supported by five secondary objectives:
providing assurance to IIPAG on the benchmarking of Capital Programmes;
Ensuring that a consistent approach to Capital Programmes benchmarking is
established and managed efficiently;
identifying key cost, process and performance drivers of projects, individual assets
or activity types;

PART B –BENCHMARKING PRIORITIES
Rail & Underground Asset Benchmarking Initial Report June 2011 Page 44 of 114
Interrogating and establishing asset unit cost targets against which efficiencies
can be measured; and
Defining individual efficiency work streams.
136 A framework expressing these aims and objectives is shown below.
APPROACH TO
PROJECT
MANAGEMENT
PROJECT
PERFORMANCE
ASSET UNIT
COST DATA
Creating a contextually
aligned organisational
structure
Achieving optimal
project delivery
performance
Focusing on target
driven asset unit costs
WORLD CLASS
PROJECT
DELIVERY
A FRAMEWORK FOR BENCHMARKING CAPITAL PROGRAMMES
DATA SET OBJECTIVES AIMS
Figure 17 – Framework for benchmarking capital programmes
137 The CPD benchmarking data set consists of three categories of metrics. These have
been developed through consultation with stakeholders and a review of project
management literature. The three categories are:
Approach to Project Management;
Project Performance; and
Asset Unit Cost Data.
5.1 Approach to Project Management
138 The purpose of the Approach to Project Management (AtPM) data set is to enable
CPD to effectively measure itself as a programme/project management organisation
against other like Capital Programme delivery organisations.
139 The metrics will concentrate on the “how” we do projects. They will facilitate the
analysis of LUL‟s programme/project organisation structure, size, processes, and
governance.
140 The data set will be made up of both quantitative and qualitative metrics, but
qualitative metrics will dominate this data set. At its highest level, the Core Level 1
metrics will enable CPD to identify the key contextual drivers that influence its delivery

PART B –BENCHMARKING PRIORITIES
Rail & Underground Asset Benchmarking Initial Report June 2011 Page 45 of 114
behaviour and costs. A table showing the data set categories and their meta data can
be found in Appendix B.
NR Client Forum
141 A Client Forum has been established by Network Rail. Members include Network Rail,
London Underground, National Grid, Thames Water and BAE Systems.
142 An initial set of metrics was shared with the group in January 2010 as the basis for
further joint working.
143 A similar data set of metrics has been used by the CPD Stations & Accommodation
Programme team to benchmark itself against similar property infrastructure
organisations. This will add to the analysis when available.
144 It is intended to roll out these metrics amongst the TfL family of organisations and
other external organisations (such as the Highways Agency) who are willing to share
data.
OGC P3M3 Maturity
145 The achievement of OGC P3M3 Level 3 maturity is a CPD target, to be achieved by
mid 2011. The OGC maturity assessment is being undertaken by independent
assessors Outperform, who will benchmark CPD against other organisations in its
database.
146 Once achieved, the proposal is to then move to maturity Level 4 to support the aim of
world class delivery. This level demands that an organisation quantitatively measures
its project management process. Level 2, 3 and 4 metrics will be established that
enable this measurement and benchmarking of process.
147 Work has commenced within CPD PMO to identify the early opportunities for process
benchmarking.
The Cost of Project Management
148 A study will be carried out to assess the costs of project management within CPD and
the scope of this study is currently being developed.
Beyond the NR Client Forum
149 Proposals are being developed to work with other private external organisations who
specialise in benchmarking project organisations, to benchmark CPD as an
organisation and the performance of their projects against non-metro organisations.
No specific details have been finalised but an initial target plans to undertake a study
in late 2011/2012. No study will commence without the confirmation of the Rail and
Underground benchmarking group. Further investigations and research will be done to
identify other external bodies or groups (Universities, Professional bodies etc.) that
hold, share or have knowledge in benchmarking Capital Programme organisations.
5.2 Project Performance
150 The Project Performance data set metrics will closely align with the LUL CPD
Scorecard KPIs, with the aim of measuring overall and individual programme or project
performance against across CPD and against other TfL and external organisations
(e.g. via the NR Client Forum).

PART B –BENCHMARKING PRIORITIES
Rail & Underground Asset Benchmarking Initial Report June 2011 Page 46 of 114
151 These Level 1 metrics will include rail specific measures, for example the use of
engineering hours and closures. Collaboration with Metro de Madrid10 has formed the
basis of LUL‟s strategy for the use of closures when delivering the Line Upgrades.
152 The AtPM and Project Performance metrics combined offer a very strong analysis of
our project management approach and its performance, but they do not provide all the
analysis needed to continually improve the cost of replacing old or installing new
assets. Work has already started with early discussions with the SSR Programme
team.
5.3 Asset Unit Costs
153 The purpose of the Asset Unit Cost data set is to provide reliable and credible unit cost
data for the replacement or renewal of an asset. It will enable sponsors to effectively
estimate project budgets and set future targets for efficiencies.
154 The basis for the data set is the LUL Cost Estimating System, supplied by RIB. This
system is now implemented in LUL to capture estimates, tender prices and final costs.
155 Analysis is underway to see where there are gaps in data capture. These analyses
together will enable efforts to focus on:
areas where the largest spend falls, and;
collecting additional data where gaps exist.
Infrastructure UK
156 LUL has participated in the recent study by Infrastructure UK, which reported on 21
December 2010. The report included assessment construction costs of railway
stations in the UK compared to overseas and included detailed information for ten
underground metro stations in London. The report11 concluded:
“6.24 The data has shown that the UK stations studied are more expensive than the international stations studied, yet there may be mitigating factors which demonstrate better value for this capital cost (e.g. higher area/volume/passenger flow).
and
F.7 Taking the spatial and passenger flows into account, the UK stations are better value for money. Spatially, the UK clients are paying 8 percent £/m2 and 10 percent £/m3 less than the average internationally benchmarked stations. Also the UK clients are paying 54 percent less per peak-time traveller.”
Crossrail, Thameslink and Network Rail
157 The RIB system is used by Network Rail and Crossrail. Discussions have been held
with the NR Forum partners, LUL Crossrail team and Crossrail Delivery partner
commercial teams.
10
Collaboration with Metro de Madrid was initiated by David Waboso in the summer of 2008, during his presidency of CoMET. A series of senior level technical visits followed during the autumn of 2008 which led to the signing of a formal memorandum of understanding in July2009. Metro de Madrid presented to the London Assembly‟s Transport Committee on 3
rd September 2009.
11 HMT Infrastructure Cost Review, Technical Report
http://www.hm-treasury.gov.uk/d/cost_study_technicalnote211210.pdf

PART B –BENCHMARKING PRIORITIES
Rail & Underground Asset Benchmarking Initial Report June 2011 Page 47 of 114
158 TfL and Network Rail have agreed to share certain benchmarking information and a
formal agreement is being put in place to manage the exchange of data in a controlled
manner and compliant with competition law constraints.
5.4 Track Renewals Benchmarking Study
159 A drill-down study has already started looking at the historic and projected costs of
track renewal for different types of intervention. The purpose of this study is to provide
an objective comparison between the whole-of-intervention track renewal intervention
costs between Tube Lines and BCV/SSL.
160 The renewal interventions included within the scope of the study include: BTR, re-
sleeper, Full Recon/Pit Blocks, Sleeper Popping, re-railing and full P&C renewal.
Definitions for each intervention have also been developed to compare and contrast
the activities undertaken within each intervention. The parties will also use a common
template that splits costs been activities (management, pre-intervention, intervention,
and post-intervention) and cost areas (labour, plant, materials, and trains), which will
enable the parties to better understand cost differences.
161 Tube Lines and LUL each have varying delivery structures for the interventions. For
example, LUL use an external contract (Balfour Beatty) for BTR and P&C, and an
internal contract for tube based activities (Track Delivery Unit or TDU). In contrast,
Tube Lines deliver all interventions though its internal projects unit, which heavily relies
on external labour contracts. The resourcing and cost implications of these varying
delivery structures will be assessed with a view to identifying efficiency opportunities.
5.5 Summary
162 The benchmarking of Capital Programmes is at an early stage but is developing fast.
The next two months will see the growth of the team and the formal agreement to the
two main terms of reference for the studies into the “Cost of Project Management” and
the “Asset Unit Cost Targets”.
163 Interaction with existing and developing new contacts will carry on at a pace, as will
the continuing work with the NR Client Forum where reports will be issued following
each event.

PART B –BENCHMARKING PRIORITIES
Rail & Underground Asset Benchmarking Initial Report June 2011 Page 48 of 114
6 Draft Benchmarking Programme 2011/12
164 A series of drill-down studies on each asset area have been reviewed and confirmed
by the Rail and Underground benchmarking group, with particular emphasis on
identifying opportunities to develop further cost efficiencies by:
Improving data comparability and consistency;
Investigating costs, productivity measures and related drivers and explaining the
variations between lines. These studies will focus on comparing working
practices, activity levels and resource utilisation to identify opportunities to make
further efficiencies; and
Commissioning and using external benchmarking where this will readily
complement internal benchmarking information.
Improving data comparability and consistency
165 The work to prepare the Phase 6 Asset Benchmarking report highlighted a number of
issues relating to the definition of the benchmark measures, the interpretation of the
protocols and the capture of data required. These have come to light partly due to
more open discussion and review with Tube Lines and partly as a result of internal
validation.
166 An immediate exercise is to be carried out prior to the end of March 2011 to ensure
alignment between LUL and Tube Lines and to ensure that data is captured so
benchmark information can be readily and robustly prepared.
Investigating costs, productivity measures and related drivers
167 The benchmarking priority list for the next period incorporates the areas for further
investigation identified for each asset area covered in Section 1 above.
168 In addition, benchmark measures will be defined for the major interventions and
activities to enable comparison of elements of civils maintenance activity across TfL‟s
Rail and Underground network.
169 The findings from these studies will be presented in the next report alongside a revised
list of priorities.

PART B –BENCHMARKING PRIORITIES
Rail & Underground Asset Benchmarking Initial Report June 2011 Page 49 of 114
7 Benchmarking with International Metros
170 The following studies are planned or ongoing in relation to asset management:
Maintenance Management and Practices. This is Phase 2 of a two year
CoMET study and is supported by LUL, Hong Kong MTR and Metro de Santiago.
Phase 2 will be carried out in 2011 and will develop Phase 1 to look at metros‟
maintenance strategies and practices in more detail and to address the following
questions:
How is maintenance organised in a modern technologically advanced metro (i.e.
post-Upgrade)?
What are the key measures of maintenance effectiveness and efficiency used
by other metros and reported at a senior management level?
Track Possession Planning & Management. The objectives of the study, which
builds on the 2003 Nova Infrastructure Maintenance Possession Management
study, are to:
understand different ways track possessions are planned and managed;
understand the constraints that are on operators when undertaking track possessions;
learn how operators assess the cost-benefit of track possessions (efficiency [cost, time] vs.
impact to operations/customers); and to
learn how different metros bundle elements of the work and then how they are resourced.
171 In addition, LUL is also participating in the following studies relating to service delivery
and other activities:
CoMET 2010 Case studies
Workshop for metros installing and operating CBTC systems
Information in emergency situations (lead metro: Shanghai SMOC)
Capitalising on CoMET & Nova Knowledge - Operations Management
Station platform/train interface safety promotion (lead metro: Hong Kong MTR)
with Accident Precursors Phase VIII
Nova 2011 Case Studies
Delivering Front End Customer Services
Passenger Flow (drill down of 2006 study)
Measurement of Metro Efficiency using Stochastic Frontier Techniques
International Suburban Rail Benchmarking Group
172 A third rail benchmarking group for suburban rail operations was established by
Imperial College London in 2010, along similar lines to CoMET and Nova, and London
Rail is participating in this group. This group will produce its first results in 2011.

PART B –BENCHMARKING PRIORITIES
Rail & Underground Asset Benchmarking Initial Report June 2011 Page 50 of 114

APPENDIX A
Rail & Underground Asset Benchmarking Initial Report June 2011 Page 51 of 114
APPENDIX A – BENCHMARKING OF LUL AND TUBE LINES ASSET
MAINTENANCE – DETAILED ASSET REVIEW
8 Asset Maintenance
8.1 Performance
173 It is not meaningful to look at the cost of providing and maintaining infrastructure
without considering performance. This is because there is, or should be, a
recognisable correlation between cost and performance. Whilst this relationship is not
always well understood or clearly transparent it should inform the business proposition,
particularly with regards to „what level of performance, or performance improvement‟
are you actually seeking to attain. This will impact on the related cost (assuming a
given level of efficiency).
174 First, performance is looked at against the key Service Output performance
measures12. The principal contractual measures considered are:
Availability: a day-to-day measure based on whether Assets are available for
service.
Ambience: a measure of the quality of the travelling environment.
Service Points: a measure of the reliability and fix times for Facilities (station
systems such as DMIs, CCTV, PA, Help Points etc.) and Fault Rectification being
the fix times for all other faults and defects reported on stations.
175 Second, performance is looked at against the relevant asset performance indicators.
In this section at the network area level (e.g. BCV, SSL and Tube Lines) but at line
level in the maintenance cost section.
Service Output Performance
Availability
176 The definition of Availability used in the Underground is rooted in the Performance
Regime developed for the PPP. The measure counts all service disruptions lasting
more than two minutes and takes into account the duration, location and time of day of
the disruption, as well as expected passenger numbers affected, to estimate the total
loss in terms of customer time This is expressed as „Lost Customer Hours‟ (LCHs)13
and as such is an incentive on reliability – particularly of fleet and signals and to a
lesser extent track.
177 The graph and table below show the average LCH per Infraco per Period (excluding
the impacts of industrial action) over the past eight years, also highlighting the
performance improvement for BCV / SSL post Metronet Administration.
12
These three measures are included in the PPP contract and continue to inform business performance measurement. These measures continue to be included commercial agreement between TLL and Amey for maintenance of the Jubilee, Northern and Piccadilly lines and form part of the pain/gain arrangement under that contract. 13
The NACHs values changed from Period 4 2010/11 to reflect NACHs 2014. Prior year LCH performance (based on NACHs 2006 values) has been recalibrated to make it comparable

APPENDIX A
Rail & Underground Asset Benchmarking Initial Report June 2011 Page 52 of 114
0
200,000
400,000
600,000
800,000
1,000,000
1,200,000
03/04 04/05 05/06 06/07 07/08 08/09 09/10 10/11
Lo
st
Cu
sto
mer
Ho
urs
Year
Lost Customer Hours by Infraco - Moving Annual AverageExcluding Industrial Action
BCV JNP SSL
Figure 18 – Average LCH per Infraco per Period
2003/04 2010/11 Better / (worse)
BCV 700,174 474,650 32%
SSL 619,238 374,172 40%
JNP 984,868 591,457 40%
Table 9 – Average LCH per Infraco per Period
Ambience
178 The Ambience measure is intended to reflect the customers‟ perception of the travel
environment on Trains and in Stations. A quarterly Mystery Shopping Survey (MSS)
conducted by an independent accredited survey organisation assesses various
aspects of the service, including: the condition of train seats, cleanliness of surfaces
and train exteriors, levels of litter and graffiti, public address audibility, ride quality and
in-car noise; lighting, train heating and ventilation, quality of signage, and condition of
toilets and waiting rooms. Ambience is an incentive primarily on cleaning and work
required to maintain customer facing assets in good order.
179 The graph and table below show the Ambience performance for each network area
over the past eight years.14
14
The Ambience regime has changed from Period 4 2010/11 to increase the weighting of Station Ambience. Prior year Ambience performance has been recalibrated to take account of this. This will change the incentive structure for spend on ambience.

APPENDIX A
Rail & Underground Asset Benchmarking Initial Report June 2011 Page 53 of 114
68.00
69.00
70.00
71.00
72.00
73.00
74.00
75.00
76.00
03/04 04/05 05/06 06/07 07/08 08/09 09/10 10/11
MS
S S
co
re
Year
Aggregate Ambience by Infraco - Moving Annual Average
BCV JNP SSL
Figure 19 – Aggregate Ambience by Infraco
2003/04 2010/11 Better / (worse)
BCV 72.31 70.08 (3%)
SSL 71.24 70.49 (1%)
JNP 71.17 71.75 1%
Table 10 – Aggregate Ambience by Infraco
Service Points
180 Service Points are levied for certain failures including:
Facilities Faults: failure of customer-facing Assets such as CCTV, public address
systems, train arrival indicators or help points. Each Infraco accrues Service
Points for each Facilities Fault - based on the fact that it failed and the length of
time it takes Infraco to rectify the failure.
Fault Rectification Faults: failure to fix certain problems such as litter and
spillages, cleaning faults, broken tiles, failed light bulbs etc. Each Infraco accrues
Service Points for Fault Rectification failures where they take longer than the
contractual standard clearance time to rectify any failure.
181 The graph and table below show the Facilities and Fault Rectification Service Points
per station performance for each network area over the past eight years.

APPENDIX A
Rail & Underground Asset Benchmarking Initial Report June 2011 Page 54 of 114
-
20
40
60
80
100
120
140
03/04 04/05 05/06 06/07 07/08 08/09 09/10 10/11
Nu
mb
er
of
Serv
ice P
oin
ts
Year
Facilities Service Points per Station - Moving Annual Average
BCV JNP SSL
Figure 20 – Facility Service Points per Station
2003/04 2010/11 Better / (worse)
BCV 92.3 57.5 38%
SSL 66.5 46.1 31%
JNP 117.4 86.1 27%
Table 11 – Facility Service Points per Station
-
50
100
150
200
250
300
350
400
03/04 04/05 05/06 06/07 07/08 08/09 09/10 10/11
Nu
mb
er
of
Serv
ice P
oin
ts
Year
Fault Rectification Service Points per Station - Moving Annual Average
BCV JNP SSL
Figure 21 – Fault Rectification Service Points per Station
2003/04 2010/11 Better / (worse)
BCV 226.4 118.6 48%
SSL 201.4 130.3 35%
JNP 240.2 156.5 35%
Table 12 – Fault Rectification Service Points per Station
Asset performance
182 The maintenance activity will directly impact asset performance and this section
reviews performance across four key asset groups (rolling stock, signalling and control

APPENDIX A
Rail & Underground Asset Benchmarking Initial Report June 2011 Page 55 of 114
systems, track, and lifts and escalators) to provide an insight into maintenance
performance.
Rolling stock
183 Rolling stock reliability, expressed in terms of „Mean Distance between Failures‟
(MDBF), has improved significantly for all three network areas over the past eight
years: BCV - 157%, SSL - 173% and Tube Lines - 216%. This is described in the
graph and table below.
-
20,000
40,000
60,000
80,000
100,000
120,000
140,000
03/04 04/05 05/06 06/07 07/08 08/09 09/10 10/11
Mean
kil
om
ete
rs b
etw
een
fail
ure
Year
Rolling Stock MDBF - Moving Annual Average
BCV JNP SSL
Figure 22 – Rolling Stock Car MDBF
2003/04 2010/11 Better / (worse)
BCV 32,084 82,415 157%
SSL 35,325 96,603 173%
JNP 41,741 131,848 216%
Table 13 – Rolling Stock Car MDBF
Signalling and Control Systems
184 Signalling and Control Systems reliability, expressed in terms of „Number of Train
Control Failures per million car kilometres‟ (resulting in service disruption longer than 2
minutes), has improved for all three network areas over the past eight years, as shown
in the graph and table below. The improvements achieved are BCV - 20%, SSL - 9%
and TLL – (negative) 25%.

APPENDIX A
Rail & Underground Asset Benchmarking Initial Report June 2011 Page 56 of 114
-
1
2
3
4
5
6
7
8
9
10
03/04 04/05 05/06 06/07 07/08 08/09 09/10 10/11
Nu
mb
er
of
Fail
ure
s
Year
Train Control Failures per 1m Car KMs - Moving Annual Average
BCV JNP SSL JNP excluding TBTC
Figure 23 – Train Control Failures per m Car km
2003/04 2010/11 Better / (worse)
BCV 6.7 5.4 20%
SSL 7.4 6.7 9%
JNP 5.3 6.7 (25%)
Table 14 – Train Control Failures per million car km
185 The figures for JNP include the recent performance issues relating to the new TBTC
signalling system on the Jubilee line. Excluding these incidents, the average number
of train control failures per million car kilometres in 2010/11 was 3.2, representing an
improvement in underlying performance of 39% since 2003/04.
Track
186 Track reliability, expressed in terms of „Number of Track Failures per million car
kilometres‟ (resulting in service disruption longer than 2 minutes), has improved for all
three network areas over the past eight years. The improvements achieved for the
three areas are BCV - 38%, SSL - 61% and TLL - 53%. The lower rate of
improvement for the BCV area reflects the better starting level, as set out in the graph
and table below

APPENDIX A
Rail & Underground Asset Benchmarking Initial Report June 2011 Page 57 of 114
-
1
2
3
4
03/04 04/05 05/06 06/07 07/08 08/09 09/10 10/11
Nu
mb
er
of
Fail
ure
s
Year
Track Failures per 1m Car KMs - Moving Annual AverageExcluding SSL De-stressing Failure TSRs
BCV JNP SSL
Figure 24 – Track Failures per million car km
2003/04 2010/11 Better / (worse)
BCV 1.7 1.0 38%
SSL 3.2 1.3 61%
JNP 2.5 1.2 53%
Table 15 – Track Failures per million car km
Lifts and Escalators
187 Lift and Escalator reliability, expressed in terms of „Mean Time between Failures‟
(MTBF), has improved for all three network areas over the past eight years. The
improvements achieved for the network areas for Lifts are BCV/SSL - 30%, and TLL -
37%, and for Escalators are BCV/SSL - 20%, and TLL - 48%. These trends are shown
in the graphs and tables below.
-
2
4
6
8
10
12
14
16
18
20
03/04 04/05 05/06 06/07 07/08 08/09 09/10 10/11
Days
Year
Lift MTBF- Moving Annual Average
BCV/SSL JNP
Figure 25 – Lift MDBF

APPENDIX A
Rail & Underground Asset Benchmarking Initial Report June 2011 Page 58 of 114
2003/04 2010/11 Better / (worse)
BCV/SSL 8.1 10.5 30%
JNP 9.5 13.1 37%
Table 16 – Lift MDBF
-
10
20
30
40
50
60
70
80
03/04 04/05 05/06 06/07 07/08 08/09 09/10 10/11
Days
Year
Escalator MTBF- Moving Annual Average
BCV/SSL JNP
Figure 26 – Escalator MDBF
2003/04 2010/11 Better / (worse)
BCV/SSL 48.4 58.2 20%
JNP 41.6 61.5 48%
Table 17 – Escalator MDBF

APPENDIX A
Rail & Underground Asset Benchmarking Initial Report June 2011 Page 59 of 114
8.2 Rolling Stock Maintenance
188 LUL and Tube Lines are planning to spend circa £1.2bn on the maintenance of the
Rolling Stock and Depots assets between 2010/11 and 2017/18, which accounts for
35% of all benchmarked asset maintenance spend.
189 Phase 6 of the asset maintenance benchmarking shows that in 2009/10 the unit cost
per car of Rolling Stock and Depots varies from £25,700 on the Piccadilly line to
£52,700 on the Central line, a range of £27,000 per car, before normalisation; and
from £25,500 on the Piccadilly line to £48,100 on the Bakerloo line, a range of £22,600
per car after normalisation for statistically significant structural factors.
190 This section sets out the preliminary understanding of the reasons for this range of unit
rates; provides LUL‟s and Tube Lines‟ forecasts of the maintenance cost unit rates to
2017/18, together with a summary of the ongoing efficiency initiatives which have been
identified and are being implemented over this period; and identifies the key priorities
for further investigation.
Rolling Stock Asset Base
191 The following table shows the number of trains operated on each line, both in 2009/10
and post the introduction of the new Victoria line trains, which are expected to have
been introduced into service by November 2011, and the new trains on the Sub-
Surface Railway, with all S8s accepted for service by August 2012 and all S7s
accepted for service by January 2016.
192
Bakerloo Central Victoria Met Circle/H&C District Jubilee Northern Piccadilly
2009/10
Stock 72TS 92TS 67TS A-stock C-stock D-stock 96TS 95TS 73TS
# cars 252 700 344 452 276 450 441 636 519
2017/18
Stock 72TS 92TS 09TS S8 S7 S7 96TS 95TS 73TS
# cars 252 700 376 464 371 560 441 636 519
Table 18 – Rolling Stock fleets – number of cars
Asset Maintenance Benchmarking Cost Comparisons
193 The graph below is a comparison of rolling stock and depot maintenance costs for the
different lines maintained by LUL and Tube Lines, showing the variation in base unit
rates for seven years of data from 2003/4 to 2009/10.

APPENDIX A
Rail & Underground Asset Benchmarking Initial Report June 2011 Page 60 of 114
£-
£10,000
£20,000
£30,000
£40,000
£50,000
£60,000
Bakerloo Central Victoria A Stock C Stock D Stock Jubilee Northern Piccadilly
Rolling Stock & Depots maintenance cost per car (£)
03/04 04/05 05/06 06/07 07/08 08/09 09/10
Figure 27 – Rolling Stock & Depots Unit Rate Comparison
15
194 These costs are for the asset benchmarking fleet unit rate: rolling stock maintenance
cost per car. This cost includes the cleaning and maintenance (levels 1, 2 and 3) of
trains and the depot equipment used to maintain trains. It does not include periodic
heavy maintenance such as programme lift (level 4) or heavy overhauls (levels 5, 6
and 7) or project works such as the installation of signalling related communications
equipment, as these activities occur periodically and are not appropriate for year-on-
year comparisons; however the impact of such interventions still needs to be
understood.
195 Costs related to the maintenance of the new fleet of trains on the Victoria line are
excluded as maintenance costs incurred relate to payments for the Technical Support
and Spares Supply Arrangement (TSSSA) with Bombardier Transportation rather than
for actual maintenance activities undertaken. Costs relating to the new Victoria line
fleet will be included in future years of the asset benchmarking.
196 It has also not been possible to separate out the costs of heavy maintenance for the
Northern line, and for some activities for the Jubilee line, which both have outsourced
maintenance contracts with Alstom. The Northern line costs include an annualised
proportion of programme lift and heavy overhaul costs as well as track and signal
maintenance in the depots; and since 2007 there has been a performance bonus
incentive scheme, aligned with the PPP Contract.
197 The graph above shows that there is a wide range of unit rates from £25,700 per car
on the Piccadilly line to £52,700 per car on the Central line in 2009/10. Some of the
possible reasons for this range are set out below, but further work is required to
quantify these.
15
Rolling stock maintenance unit cost is currently reported on a „per car‟ basis in the rail asset benchmarking, although the data is collected to allow comparisons to be made on a „per car km‟ or „per train‟ basis. It is proposed to revisit the issue of how best to present this analysis in Phase 7.

APPENDIX A
Rail & Underground Asset Benchmarking Initial Report June 2011 Page 61 of 114
198 For the BCV/SSL fleets it is the current understanding of APD and the LUL asset
sponsors that:
The Bakerloo line fleet has higher than average costs due in part to fatigue
cracking, largely due to the high level of track curvature on the line. It also has a
higher than average proportion of its fleet outstabled, which results in a higher
degree of unproductive time for train preparation.
The cost reduction on the Victoria line in 2009/10 is as result of a reduction in
reconditioning work by the REW. With the start of the introduction of new trains,
four 67TS trains have been removed from service, and are being cannibalised for
parts, requiring less work by the REW.
There are multiple, well documented issues relating to the Central line fleet,
including problems with water ingress, corrosion and traction issues. Three years
ago, LUL opted not to carry out a major motor replacement and accepted that, as
a result, there would be additional annual labour and materials costs for the life of
the fleet to maintain availability and performance. The Central line also includes
costs for the Waterloo & City line fleet.
The lines with smaller fleets, such as the Bakerloo, Hammersmith & City and
Waterloo & City, also tend to have higher unit costs, as fixed costs such as depots
are spread over a smaller number of cars.
199 The Piccadilly line fleet has the lowest unit rate on the network. Further work is
required to understand the exact reasons, but Tube Lines‟ current understanding is
that it is due in part to the design of the train and a maintenance regime that is based
on hours operated and not calendar days.
200 It is proposed that further investigation is undertaken to identify if there are other
learning points.
Performance
201 When considering comparisons of unit costs it is necessary to be aware of the relative
performance of the fleets. The graph below shows the comparative performance of
the different fleets, using the metric rolling stock service disruption incidents per car
from the asset benchmarking.
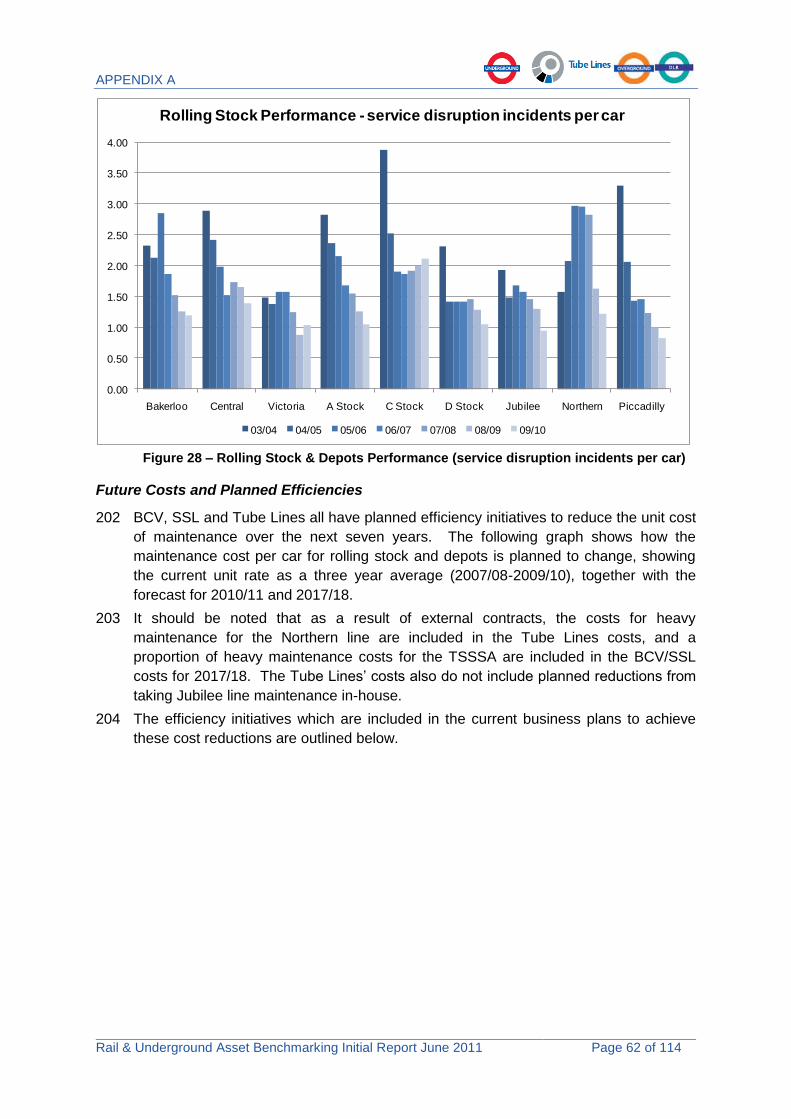
APPENDIX A
Rail & Underground Asset Benchmarking Initial Report June 2011 Page 62 of 114
0.00
0.50
1.00
1.50
2.00
2.50
3.00
3.50
4.00
Bakerloo Central Victoria A Stock C Stock D Stock Jubilee Northern Piccadilly
Rolling Stock Performance - service disruption incidents per car
03/04 04/05 05/06 06/07 07/08 08/09 09/10
Figure 28 – Rolling Stock & Depots Performance (service disruption incidents per car)
Future Costs and Planned Efficiencies
202 BCV, SSL and Tube Lines all have planned efficiency initiatives to reduce the unit cost
of maintenance over the next seven years. The following graph shows how the
maintenance cost per car for rolling stock and depots is planned to change, showing
the current unit rate as a three year average (2007/08-2009/10), together with the
forecast for 2010/11 and 2017/18.
203 It should be noted that as a result of external contracts, the costs for heavy
maintenance for the Northern line are included in the Tube Lines costs, and a
proportion of heavy maintenance costs for the TSSSA are included in the BCV/SSL
costs for 2017/18. The Tube Lines‟ costs also do not include planned reductions from
taking Jubilee line maintenance in-house.
204 The efficiency initiatives which are included in the current business plans to achieve
these cost reductions are outlined below.

APPENDIX A
Rail & Underground Asset Benchmarking Initial Report June 2011 Page 63 of 114
Note: Heavy maintenance in Tube Lines costs for NLTSC in all years and in BCV/SSL costs for TSSSA in 2017/18
Figure 29 – Comparison of current and future fleet unit rates
205 The following graphs show the „waterfall‟ from the current asset benchmarking unit rate
in 2009/10 to that post planned efficiencies in 2017/18, for BCV, SSL and Tube Lines.
The figures then show the adjustment for structural factors and the normalised unit
rate for 2017/18. This is then shown in the context of the upper bound of the
benchmark range determined by BSL in its international benchmarking report for the
Arbiter.
BCV / SSL Efficiency Initiatives
206 The unit rate impact of efficiency initiatives for BCV and SSL are shown for the
Maintenance Capability Plan, Maintenance Optimisation, Maintenance Unit Rates, the
Support Services Review and other planned efficiencies.
207 Over the same period there are also cost increases relating to changes to activities as
a result of the introduction of the new fleets with new maintenance regimes on the
Victoria line and the Sub-Surface Railway, most notably the TSSSA with Bombardier.
208 As the TSSSA includes materials and support for heavy maintenance, which is
excluded from the benchmarking unit rates, the waterfalls include an estimate of the
proportion of the 2017/18 cost which equates to heavy maintenance under the TSSSA.
This estimate is based on LUL‟s current train maintenance regimes, and may
underestimate the proportion of costs attributable to heavy maintenance.

APPENDIX A
Rail & Underground Asset Benchmarking Initial Report June 2011 Page 64 of 114
Figure 30 – Waterfall comparing BCV 2009/10 unit rate to 2017/18 and Arbiter ‘benchmark range’
Figure 31 – Waterfall comparing SSL 2009/10 unit rate to 2017/18 and Arbiter ‘benchmark range’
Estimate of heavy maintenance element of TSSSA
Estimate of heavy maintenance element of TSSSA

APPENDIX A
Rail & Underground Asset Benchmarking Initial Report June 2011 Page 65 of 114
Maintenance Capability Plan (MCP)
209 LUL started to implement efficiency initiatives related to fleet and depots through the
MCP in 2009/10, and achieved savings of £2.2m in that year and a further £3.5m by
P9 of 2010/11. MCP is expected to deliver rolling stock and depots related savings of
£18.9m p.a. by March 2013. These savings can be categorised as follows:
Further maintenance optimisation (£0.7m) – changes to maintenance intervals to
reflect the actual condition and performance of each fleet;
Staff efficiencies (£3.7m) through reductions in vacancies and reductions in the
use of agency staff;
Depot rationalisation (£3.1m) – changes to Hammersmith as part of the Sub-
Surface Railway maintenance strategy; Central line depot rationalisation;
Maintenance reorganisation (£3.0m) – changes to maintenance rosters to „best in
class‟; ending of service delivery teams; consolidation and multi-skilling of call
point staff;
Materials management (£2.8m) – in-sourcing of materials management on the
Central line; 8% reduction in materials costs across all fleets through cost controls
and challenging standards; rationalisation of road vehicle fleet;
Introduction of new fleets (£2.3m) provides the opportunity to implement new
maintenance regimes (S-stock and 09TS) and reduce maintenance on old fleets
prior to decommissioning.
Maintenance Optimisation
210 LUL is currently undertaking a programme of train maintenance regime optimisation,
which is reviewing the prescribed intervention intervals for train preparation (level 1)
and examination (level 2) maintenance and implementing changes as appropriate.
Train preparation is being reduced by seven minutes per train, and level 2
maintenance activities are being moved, where practicable, from 14 to 28 days. Once
this has been achieved, rosters can be changed to increase the savings from these
changes. The 2011/12 rolling stock and depots AMP included savings of £1.4m-2.9m
p.a., £13.1m by 2017/18, (£15.1m outturn) as a result of the fleet maintenance
optimisation programme.
Maintenance Unit Rates and Support Services Review
211 The unit rates in 2017/18 also contain efficiency savings relating to Maintenance Unit
Rate (MUR) initiatives and the Support Services Review.
212 Maintenance costs were reviewed as part of the strategic assessment of costs in April
2010, and the LUL Board agreed that further initiatives were required to reduce unit
costs after MCP had been fully implemented. These savings have been included as
the MUR.
213 The Support Services Review reviewed the delivery of back office functions across the
whole LUL. The review resulted in a reduction in the numbers of support staff and
these are reflected in the efficiencies shown here. These efficiencies are well defined,
and are close to being fully embedded.
Net cost increase and other efficiencies
214 By 2017/18 the TSSSA will be in place for both the new Victoria line fleet and the new
Sub-Surface Railway fleets. The „Net cost increase‟ bar for SSL in Figure 5 is largely
attributable to the net increase in cost resulting from the implementation of the TSSSA.

APPENDIX A
Rail & Underground Asset Benchmarking Initial Report June 2011 Page 66 of 114
It should be noted that the 2009/10 and 2017/18 unit rates are not directly comparable,
as the 2009/10 unit rate does not include any TSSSA costs, although some of the
activities undertaken in 2017/18 by Bombardier will be included in the unit rate in
2009/10.
215 LUL has concerns over the scope and cost of the TSSSA and is looking at the
opportunities to achieve savings from these contracts.
Tube Lines‟ Efficiencies
216 Tube Lines‟ average maintenance cost per car in 2017/18 is forecast to increase by
approximately £6,500 per car from the 2009/10 rate. This is due to an increase in
contract costs on both the Northern and Jubilee Lines as a result of additional
maintenance of TBTC equipment, extra mileage and new train declarations. The
change in unit rate also includes provision for a bonus paid to Alstom (approximately
£1m per year) which was part of the contract change in 2007, in which performance for
both Tube Lines and Alstom was aligned.
0
10,000
20,000
30,000
40,000
50,000
Unit rate 2009/10
Increased JL and NL
contract costs and PL
casualty
Efficiencies 2017/18 unit rate
Structural factors
adjustment
2017/18 Normalised
unit rate
Delta to Arbiter's
'benchmark range'
Upper bound of Arbiter
'benchmark range'
Tube Lines Rolling Stock & Depots maintenance cost per car (£)
Figure 32 – Waterfall comparing Tube Lines’ 2009/10 unit rate to 2017/18 and Arbiter ‘benchmark range’
217 This increase in unit costs is partially offset by planned savings resulting from the
optimisation of level 1 and 2 maintenance, implementation and improved use of the
asset management system (Maximo) and the decision to bring in-house the
maintenance of the Jubilee line fleet.
218 This system provides transparency throughout the fleet, and enables equipment based
maintenance, which provides efficiencies in planned maintenance. This level of
detailed monitoring brings about a proactive approach to recognise and measure key
performance indicators prior to failure, again driving efficiencies in cost and

APPENDIX A
Rail & Underground Asset Benchmarking Initial Report June 2011 Page 67 of 114
performance. This enables Tube Lines to undertake optimised decision making in
achieving efficient and economic whole life asset management of equipment levels,
fleet planning, work management, inventory, stores management and procurement. It
also allows for the planning and scheduling of work, managing inventory and
resources, and the analysis of cost and performance.
219 Further work is required to understand what effect the implementation of Maximo has
had on the cost and performance of the Piccadilly line fleet.
Normalisation
220 The 2017/18 unit rate has been normalised to take account of the structural factors
that were found to be significant in the Phase 6 asset maintenance benchmarking
analysis, although it is recognised that these structural factors may change in the
future.
Arbiter‟s Benchmark Range
221 The waterfall graphs show the upper bound of the benchmark range of £25,600 per
car, which was determined by BSL in its international benchmarking study for the
Arbiter, broadly based on the normalised unit cost levels of the international peer
metros.
Normalisation and Structural Factors
222 The Phase 6 Joint Benchmarking analysis identified two structural factors which are
statistically significant and therefore could be used to normalise the unit rates: number
of traction motors per car and number of door leaves per car (both measures of train
complexity). The graph below shows the unit maintenance cost normalised for these
two structural factors.
£-
£10,000
£20,000
£30,000
£40,000
£50,000
£60,000
Bakerloo Central Victoria A Stock C Stock D Stock Jubilee Northern Piccadilly
Normalised Rolling Stock & Depots maintenance cost per car
03/04 04/05 05/06 06/07 07/08 08/09 09/10
Figure 33 – Rolling Stock & Depots Normalised Unit Rate Comparison
223 The asset maintenance benchmarking analysis also examined a number of other
structural factors but none of these were found to be statistically significant. Although
in Phase 5, the proportion of the fleet used for peak service (a measure of availability

APPENDIX A
Rail & Underground Asset Benchmarking Initial Report June 2011 Page 68 of 114
for maintenance), was also found to be statistically significant. However, a larger
dataset (i.e. with additional years) might identify other structural factors as significant.
It should also be noted that BSL, in its international benchmarking report for the
Arbiter, identified the average distance between stations (a proxy for the duty
undertaken by a train on a particular line) as the only significant structural factor.
224 After normalisation for structural factors, the size of this range is reduced by £4,400 to
£22,600; a range from £25,500 per car on the Piccadilly line to £48,100 per car on the
Bakerloo line.
Additional structural factors
225 The asset maintenance benchmarking analysis has normalised the unit rate to take
account of a number of structural factors which have been determined to be
statistically significant. However, there may well be other structural factors, which
have not been identified, or more likely which cannot be shown to be statistically
significant which make costs in London higher than other metros in the short to
medium, and possibly long, term.
226 In its international benchmarking report for the Arbiter, BSL tested for a number of
structural factors including vehicle complexity, distance operated and age of fleet, but
the only factor it identified as significant was the average distance between station
stops, which is a proxy for the duty cycle, as at this time many of the systems and sub-
systems will have to operate; e.g. brakes, acceleration, door systems etc.
227 The current normalisation is based on vehicle complexity, but additional structural
factors may be identified as significant as the size of the dataset increases and
becomes more robust.
Areas for further investigation
228 Based on the benchmarking analysis, this section looks at what additional
opportunities may exist which are not currently included in the business plans which
deliver the level of unit cost shown by 2017/18, and makes recommendations for
further drill-down studies and analysis to identify these opportunities.
Analysis of maintenance activities
229 The BSL report looked at a number of explanatory factors, and determined that it could
explain c. 50% of the cost gap to its benchmark level by relative levels of labour cost
(c. 30%) and by differences in maintenance inspection regimes (frequency of
intervention) (c. 20%). The maintenance optimisation programme is addressing the
issue of frequency of inspection, but further work is required to address the issue of
labour cost.
230 The analysis presented so far in this report is based on the unit rate (maintenance cost
per car) used in the asset benchmarking exercise. However this unit rate comprises a
number of different activities, and it would be instructive to look at the cost of each of
these activities e.g. Level 1-3 maintenance, casualty maintenance, cleaning, depot
costs, overheads.
231 Future benchmarking analysis will look in detail at the collection and capture of data at
the appropriate level of detail across all lines to better understand the differences in
the unit rates between rolling stock fleets and the reasons for these.
London ‘Best in Class’ benchmarking
APPENDIX A
Rail & Underground Asset Benchmarking Initial Report June 2011 Page 69 of 114
232 The asset maintenance benchmarking has shown that the unit cost levels and
reliability performance of the Piccadilly line fleet is „best in class‟ in London. Following
TfL‟s purchase of Tube Lines, there is now a real opportunity to examine in detail the
maintenance practices and culture on the Piccadilly line to understand what
opportunities exist to introduce good practices into other fleets and depots.
233 A very limited exercise was undertaken in 2007 to investigate this16, which presented
three conclusions: “(1) changing the maintenance from time to condition/usage based
would appear to be better practice which all the fleets could adopt; (2) maximising the
scope of works each time a train is taken out of service for a programmed lift might be
best practice; (3) a rolling heavy overhaul programme might be best practice
compared to say a two year programme every nine years”.
234 Further work is required to identify and share possible good practice from the
Piccadilly line with other fleets, and this is being pursued as an immediate opportunity
through a drill down study.
235 This drill down study is being carried out to look at rolling stock maintenance
approaches, practices and culture, to understand the reasons why the Piccadilly line
fleet has the lowest maintenance cost and the highest reliability of all the fleets
maintained by LUL and Tube Lines, and to identify the opportunities and possible
barriers for the transfer of initiatives to other fleets and depots.
16
Joint Benchmarking Phase 3 - Piccadilly line Rolling Stock investigation, 2007

APPENDIX A
Rail & Underground Asset Benchmarking Initial Report June 2011 Page 70 of 114
8.3 Signals Maintenance
236 LUL and Tube Lines are planning to spend c. £0.5bn on the maintenance of the
Signals assets between 2010/11 and 2017/18, which accounts for c. 15% of all
benchmarked asset maintenance spend.
237 Phase 6 of the asset maintenance benchmarking shows that in 2009/10 the unit cost
of Signals per main track km varies from £62,000 on the Piccadilly line to £95,000 on
SSL South a range of £33,000, before normalisation; and from £59,000 on the
Piccadilly line to £88,000 on SSL South, a range of £29,000 after normalisation for
statistically significant structural factors.
238 This section sets out the preliminary understanding of the reasons for this range of unit
rates; provides LUL‟s and Tube Lines‟ forecasts of the maintenance cost unit rates to
2017/18, together with a summary of the ongoing efficiency initiatives which have been
identified, and are being implemented over this period; and identifies the key priorities
for further investigation.
Asset Base
239 For clarity, the signalling infrastructure equipment has been split into five categories to
provide an overview of the assets, before the delivery of the Upgrades, as shown in
Table 19 below17.
Signalling (number of)
Signals
Signs and
Indicators
Trainstops Points Track CircuitsInterlocking
SystemsTotal
Assets per
KM (Main
Line)
Density of
Signals &
Points
Bakerloo 633 121 20 154 8 936 39 27
Central & W&C 1,414 23 142 1,171 183 2,933 18 10
Victoria 284 1 32 500 8 825 17 7
SSL South 1,852 628 241 1,233 32 3,986 30 14
SSL North 1,611 571 213 1,201 24 3,620 21 12
Jubilee (Pre-TBTC Asset Base) 755 396 177 780 19 2,127 22 10
Northern (Pre-TBTC Asset Base) 1,233 641 171 1043 16 3,104 26 12
Piccadilly 1,013 567 177 1156 18 2,931 27 11
BCV/SSL 5,794.0 1,344.0 648.0 4,259.0 255.0 12,300 23 12
TLL 3,001.0 1,604.0 525.0 2,979.0 53.0 8,162 25 11 Table 19 - Signalling Asset Counts, Pre-Upgrade, without depots and sidings
Asset Maintenance Benchmarking Cost Comparisons
240 The asset maintenance benchmarking provides a comparison of maintenance unit
rates, by line, across the LUL network for seven years of data from 2003/04 to
2009/10.
241 The following graph provides a comparison of Signalling & Power maintenance unit
costs for the different lines maintained by LUL and Tube Lines.
242 This unit rate includes inspections, preventative and corrective maintenance for
Signalling, routine change (i.e. component renewal), Power maintenance and all
related direct supervision and management costs. It also includes the cost of the
BCV/SSL Communication and Information team. It does not include mid life
refurbishments, training costs, central overheads and project works such as the
installation of signalling related communications equipment.
17
The higher density of assets on the Bakerloo line is due to a greater number of Signals, Signs and Indicators as a result of a high proportion of curved track.

APPENDIX A
Rail & Underground Asset Benchmarking Initial Report June 2011 Page 71 of 114
243 It should be noted that the Central line costs include the Waterloo & City line costs.
Also, the Bakerloo and Victoria line costs are combined as the two lines share the
same signalling maintenance teams.
£-
£20,000
£40,000
£60,000
£80,000
£100,000
£120,000
£140,000
Bak & Vic Central SSL North SSL South Jubilee Northern Piccadilly
Signalling Costs per Main Track km
03/04 04/05 05/06 06/07 07/08 08/09 09/10
Note: Costs shown per km of running track, excluding depot track and sidings.
Figure 34 - Signalling unit rate: maintenance cost per main track km
Main variations between 2008/09 and 2009/10 unit rates
244 The Central line and SSL South unit rates have decreased by almost 20% over the last
year. LUL attributes the decrease in unit rates to:
The clearing of the backlog of inspections and preventative maintenance
accumulated over the past years. This means that fewer resources are needed to
perform the on-going maintenance;
The allocation of more signalling resource to capital projects to support the
delivery of the Upgrades.
245 Over the last four years, Tube Lines has consistently decreased its unit cost on the
Jubilee line. It is Tube Lines‟ view that this has been achieved through the
optimisation of travel times and the implementation of risk based maintenance which
has reduced overtime.
246 The change in cost unit rate for the Piccadilly line between 2008/09 and 2009/10 is
due to the fact that LUL paid Tube Lines to provide its existing signalling response
team to cover for incidents between Acton Town and Barons Court in 2008/09 and
stopped doing this in 2009/10.
Comparison of LUL and Tube Lines’ unit rates
247 The asset maintenance benchmarking shows a wide range of unit rates from £62,000
on the Piccadilly line to £95,000 on SSL South.
248 LUL‟s current understanding is that this is due to differences in resource levels
between BCV/SSL and Tube Lines.

APPENDIX A
Rail & Underground Asset Benchmarking Initial Report June 2011 Page 72 of 114
249 Table 20 below summarises the initial analysis of the number of labour FTEs by work
area.
BCV SSL BCV/SSL JNP
Main track km 230km 305km 536km 331km
TO depots (incl. Maintenance depots) 13 14 27 16
Main track km per TO depot 17.7 21.8 19.8 20.7
TOs 53 95 148 102
SOMs 14 13 27 29
Support staff 64 93 157 44
TO depot staff 131 201 332 175
Main track km per TO depot staff 1.8 1.5 1.6 1.9
Average staff per TO depot 10.1 14.4 12.3 10.9
S&E Team (Central Team) 82 31
Communication and Information 36 -
Incident Team 22 In TO depot
ATC Team Central Line 35 -
Other 3 6
Staff not allocated to TO depot 178 37
Main track km per staff not allocated to TO
depot3.0 8.9
Total staff 510 212
Main track km per staff 1.1 1.6 Table 20 – Comparison of FTE staff numbers
250 The Technical Officer (TO) depot density (i.e. km of track managed, on average, by
each TO depot) is comparable across BCV and Tube Lines.
251 The average headcount of each TO depot is similar for Tube Lines and BCV, but
higher for SSL.
252 However, the key observation is that the ratio of track km to signalling FTEs is 1.1 km
for BCV/SSL compared to 1.6 km on Tube Lines, a difference of 45%.
253 LUL‟s current understanding of the reasons for this is described in the following
paragraphs, and will be investigated in detail in the ongoing signalling maintenance
drill down study.
Centralised Incident Team
254 BCV and SSL have a centralised incident team which means a larger proportion of the
signalling resources are not allocated to a specific TO depot.
ATC team
255 The Central line is organised differently to the other lines. A dedicated Automatic Train
Control (ATC) team located at Ruislip, deals with the train-borne and track side ATC
Signalling equipment, in addition to the Central line TO depot organisation. Further
work is required, and ongoing, to understand the rationale for having a different
organisation.
256 On the Victoria line, currently the only other fully automated line, TOs cover all aspects
of the Signalling trackside equipment including ATC; fleet maintainers deal with train
borne signalling equipment; and repairs are undertaken by the REW.
257 In 2009/10 Tube Lines did not have ATC in operation on any of its lines and currently it
has no plans to create an additional dedicated team to maintain Jubilee or Northern
lines following the introduction of TBTC.

APPENDIX A
Rail & Underground Asset Benchmarking Initial Report June 2011 Page 73 of 114
258 The cost of the ATC team represents £26,100 per track km on the Central line (or c.
32% of the Central line Signalling Maintenance costs). The cost of this team, for
2009/10, is £4.2m.
Communication & Information team
259 The LUL Communication & Information team is a technical specialist resource which
provides first and second line maintenance for passenger information transmission and
display. The LUL C&I team also provides second line support to Tube Lines. First line
maintenance for the JNP lines is carried out within Tube Lines by its TO depot
organisation, rather than a dedicated team. The costs and proportion of costs of the
C&I team related to BCV/SSL and Tube Lines are summarised in Table 21 below.
2009/10 Joint Benchmarking
2009/10 Constant Prices
BCV/SSL JNP
CostsC&I Team 2,192,314 176,188
Total 93% 7%
Table 21 – C&I Team
Routine change
260 Routine change is included in the BCV, SSL and Tube Lines costs. A much higher
proportion of components are changed on SSL than on any of the other lines. A large
part of routine change on SSL is the quantity of life-expired relays that require
replacement. The volumes of these are greater on SSL than BCV, directly related to
the type and age of the technology and the relays‟ life expectancy: over the same time
period c. 9000 relays will require changing on SSL compared to c. 80 relays on BCV.
The cost of routine changes for BCV and SSL are detailed in Table 22.
2009/10 Joint Benchmarking
2009/10 Constant Prices
BCV SSL
Costs
Routine Change 710,817 3,813,789
Unit Rates (signalling cost per main track km)
Routine Change 3,086 12,496 Table 22 – Routine Change
Performance
261 When considering comparisons of unit costs it is necessary to be aware of the relative
performance of the lines. Figure 2 below shows the comparative performance of the
different lines, using the metric number of service affecting failures per km of running
track.

APPENDIX A
Rail & Underground Asset Benchmarking Initial Report June 2011 Page 74 of 114
-
1
2
3
4
5
6
7
8
Bak & Vic Central SSL North SSL South Jubilee Northern Piccadilly
Number of Failures per km
03/04 04/05 05/06 06/07 07/08 08/09 09/10
Figure 35 – Signalling Performance – Number of service affecting failures per track km
Future Costs and Planned Efficiencies
262 The following graph shows how the maintenance cost per km of running track is
planned to change over the next seven years for each of BCV, SSL and Tube Lines.
The reasons for the efficiency initiatives and cost increases which are included in the
current LUL and Tube Lines Business Plans are outlined below.
Note: BCV and SSL costs for 2017/18 are before deduction of estimated post-Upgrade efficiency
Figure 36 – Comparison of current and future signalling unit rates

APPENDIX A
Rail & Underground Asset Benchmarking Initial Report June 2011 Page 75 of 114
BCV/SSL Future Costs and Planned Efficiencies
263 The following waterfall graph shows, for BCV /SSL, the current asset benchmarking
unit rate, the unit rate in 2009/10 and the normalised unit rate for 2017/18. The unit
rate impact of efficiency initiatives for BCV and SSL are shown for the Maintenance
Capability Plan (MCP), Maintenance Unit Rates and other efficiencies as well as the
impact of cost increases.
0
20,000
40,000
60,000
80,000
100,000
2009/10 unit rate
Incremental MCP
efficiencies
MUR efficiencies
Short term net cost increase
2017/18 unit rate
Structural factors
adjustment
2017/18 normalised
unit rate
Post upgrades estimated savings
Delta to upper bound of Arbiter's Benchmark
Range
Upper bound of Arbiter's Benchmark
Range
BCV/SSL Signals Maintenance Unit Rate per Track Km (£) (2009/10 prices)
Figure 37 - BCV and SSL Maintenance cost per track km (£ 2009/10)
Maintenance Capability Plan (MCP)
264 The saving initiatives for the Signalling Asset Groups fall into three categories, listed
below:
Change of maintenance regime;
Use of new technologies; and
Change of working practices.
265 MCP savings initiatives are planned to deliver annual savings of c. £13.1m by March
2013 (all savings are over the next three years). Of these savings £3.7m were
achieved in 2009/10.
Change of maintenance regime (£6.2m of savings)
266 Various saving initiatives look to optimise maintenance regimes and modify historic
Category 2 Standards, such as MR-S-SIG-E7060 (Routine Change). Such initiatives
include adopting Risk Based Maintenance (RBM) and rescheduling Signal
maintenance to 80% of its current regime without affecting critical assets. Similarly, a
review of Power standards is currently under way to reduce maintenance frequency on
existing assets.
Use of new technologies (£1.1m)

APPENDIX A
Rail & Underground Asset Benchmarking Initial Report June 2011 Page 76 of 114
267 The implementation of a new generation of technology (Victoria line Upgrade,
Automated Track Monitoring System – ATMS) creates an opportunity for a substantial
re-evaluation of the approach to signals maintenance. This is because:
There will be significant reduction in the volume of line-side equipment, especially
mechanical equipment;
Both line-side and on-train equipment will become more standardised;
The remote diagnostic capabilities of modern signalling systems should enable
better preventative and corrective intervention, with the need for fewer locally
based call staff, other than at critical locations.
Change of Working Practices (£5.8m)
268 Better utilisation of the on-duty staff is planned to deliver significant savings, through
multi-skilling. Rosters will also be reorganised to increase staff utilisation and limit
overtime. The focus is on improved resource planning that will optimise the use of
staff without impacting on performance. Support teams will be merged to achieve a
leaner organisation of Track & Signal Maintenance.
AMP Savings
269 The Asset Management Plans include savings related to the Maintenance Capability
Plan and the Maintenance Unit Rates (MUR) initiatives, which mainly include a review
of the standard times and Category 2 standards to study the feasibility of a reduction of
the inspection cycles.
Cost increases
270 Further work is required to understand the cost increase between 2009/10 and
2017/18. Current understanding is that a proportion of this cost increase is due to an
increase in headcount in the ATC and C&I teams and the Central line workforce and
additional spares for maintenance. Other increases relate to the S-stock cab
simulators.
271 Furthermore, Signalling assets such as the AC main, air main and train stops will
become life expired and are scheduled to be changed, and although some
concessions may be granted to move towards a risk based replacement programme,
LUL‟s current plan, and costs are for a full replacement. Routine change programmes
are included in LUL costs, and will be refined once the SSL upgrade starts.
272 The benchmarking unit rates include costs to maintain the legacy and the new
signalling system in parallel on SSL from 2014 until 2018.
Further savings
273 The business has not yet factored in the savings as a result of the delivery of the
Signalling Upgrade on the Victoria line (in 2013) and on the Sub-Surface Railway (in
2014). Evaluation of the possible savings is underway and preliminary estimates
indicate that a further c.£19m efficiencies may be in the current business plan,
amounting to an annual saving of approximately £8m in 2017/2018. This preliminary
assessment includes the possibility of delaying routine change of assets that are to be
removed under the SSL Upgrade.

APPENDIX A
Rail & Underground Asset Benchmarking Initial Report June 2011 Page 77 of 114
Tube Lines‟ Signals Efficiency Plan
0
20,000
40,000
60,000
80,000
100,000
2009/10 unit rate Efficiencies 2017/18 unit rate Structural factors adjustment
2017/18 normalised unit
rate
Delta to upper bound of Arbiter's Benchmark Range
Upper bound of Arbiter's
Benchmark Range
JNP Signals Maintenance Unit Rate per Track Km (£) (2009/10 prices)
Figure 38 - Tube Lines’ Signals Maintenance cost per track km (£ 2009/10)
274 The changes in cost profile in JNP over RP2 will be driven by the following major
factors:
Change of maintenance structure from Line Based to Asset Based.
Reduction in grades due to technological requirements.
Change of Maintenance Regime.
Alternative approach to ACATS wheel rail management.
Change of maintenance structure from Line Based to Asset Based
275 The maintenance and response activities have been re-organised into separate
departments within the signal team. This has allowed staff levels in maintenance to be
determined from bottom up. This has identified areas where staff can be reduced.
Reduction in grades due to Technological requirements
276 The new TBTC systems have made redundant specific grades of staff. This in
combination with a full complement of Technical Officers in the maintenance
department has identified areas where a grade can be removed. This grade is Senior
Technician (signals).
Change of Maintenance Regime
277 A review of Cat 1 and 2 standards has been conducted. This is going to move by
stages from 12 week cycles to 16 week cycles to 24 week cycles for specific traditional
assets. A similar study of the TBTC suppliers recommended maintenance activities is
underway to seek to reduce where appropriate maintenance activities. Reduction in
Routine Change activities are also being considered on assets that are due to be
decommissioned due to the NL upgrade.

APPENDIX A
Rail & Underground Asset Benchmarking Initial Report June 2011 Page 78 of 114
Alternative approach to ACATS wheel rail management
278 The original advice from projects for the management of the NL and JL ACATS
systems has been reviewed in the light of the Signals Team organisational changes
and a better understanding of the TBTC systems operational parameters. This has
allowed a new approach to the management of the system releasing resource.
Normalisation
279 The 2017/18 unit rate has been normalised to take account of the structural factors
that were found to be significant in the Phase 6 Asset Maintenance Benchmarking
analysis, although it is recognised that these structural factors may change in the
future, especially with the delivery of the Upgrades.
Arbiter‟s Benchmark Range
280 The waterfall graphs show the upper bound of the Benchmark Range for signalling
maintenance cost, as determined by BSL in its international benchmarking study for
the Arbiter, to be £46,000 per track km, broadly based on the normalised unit cost
levels of the international peer metros.
281 However based on this analysis, there remains a considerable delta between the
planned unit rate in 2017/18 and the benchmark range determined by BSL in its
international benchmarking report for the Arbiter. Further work is required to
understand to what extent this is because the Arbiter‟s benchmark range is based on
more modern signalling systems compared to the LUL and TLL signalling assets in
2017/18.
Other Efficiency opportunities
282 There are likely to be a number of efficiency opportunities which are not currently
included in the LUL Business Plan which delivers the level of unit cost shown by
2017/18. For BCV and SSL for example, further analysis is required to understand the
potential for headcount reductions following the delivery of the Upgrades.
283 The analysis presented so far in this report is based on the unit rate (maintenance cost
per km of track) used in the asset benchmarking exercise. However, as shown in the
following graph, this unit rate comprises a number of different activities, and it is
instructive to look at the built up of these unit rates. The unit rate (maintenance cost
per km of track) for each line, can split into five cost categories: Preventative
maintenance and Inspections, Corrective maintenance, Power Maintenance, Routine
Changes and Overheads.
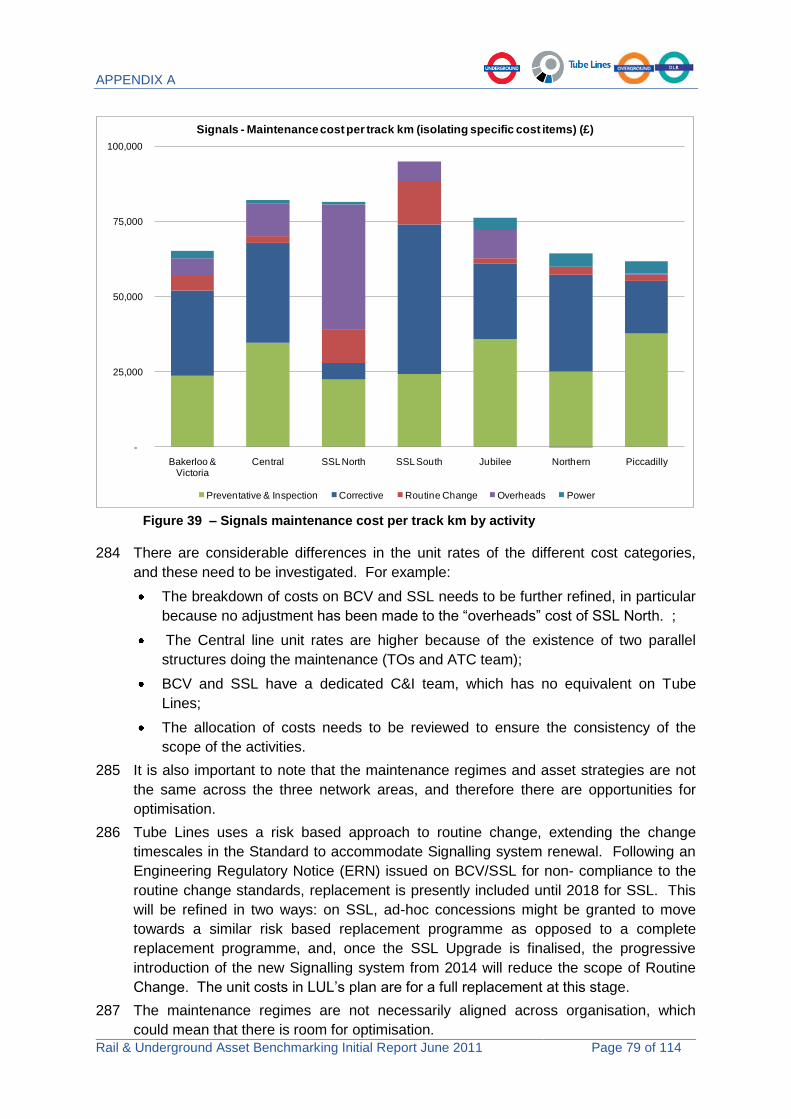
APPENDIX A
Rail & Underground Asset Benchmarking Initial Report June 2011 Page 79 of 114
-
25,000
50,000
75,000
100,000
Bakerloo & Victoria
Central SSL North SSL South Jubilee Northern Piccadilly
Signals - Maintenance cost per track km (isolating specific cost items) (£)
Preventative & Inspection Corrective Routine Change Overheads Power
Figure 39 – Signals maintenance cost per track km by activity
284 There are considerable differences in the unit rates of the different cost categories,
and these need to be investigated. For example:
The breakdown of costs on BCV and SSL needs to be further refined, in particular
because no adjustment has been made to the “overheads” cost of SSL North. ;
The Central line unit rates are higher because of the existence of two parallel
structures doing the maintenance (TOs and ATC team);
BCV and SSL have a dedicated C&I team, which has no equivalent on Tube
Lines;
The allocation of costs needs to be reviewed to ensure the consistency of the
scope of the activities.
285 It is also important to note that the maintenance regimes and asset strategies are not
the same across the three network areas, and therefore there are opportunities for
optimisation.
286 Tube Lines uses a risk based approach to routine change, extending the change
timescales in the Standard to accommodate Signalling system renewal. Following an
Engineering Regulatory Notice (ERN) issued on BCV/SSL for non- compliance to the
routine change standards, replacement is presently included until 2018 for SSL. This
will be refined in two ways: on SSL, ad-hoc concessions might be granted to move
towards a similar risk based replacement programme as opposed to a complete
replacement programme, and, once the SSL Upgrade is finalised, the progressive
introduction of the new Signalling system from 2014 will reduce the scope of Routine
Change. The unit costs in LUL‟s plan are for a full replacement at this stage.
287 The maintenance regimes are not necessarily aligned across organisation, which
could mean that there is room for optimisation.

APPENDIX A
Rail & Underground Asset Benchmarking Initial Report June 2011 Page 80 of 114
288 Tube Lines and LUL consider that there may be opportunities to reduce the current
number of TO depots following the upgrade of the signalling systems. Further analysis
is needed to understand how the number of TO depots and their location could be
optimised. This will be carried out as part of the Signalling drill-down study.
Normalisation and Structural Factors
289 The Phase 6 asset maintenance Benchmarking identified one structural factor, which
was statistically significant: the density of point ends, and the following graph shows
the normalised signalling maintenance unit rates adjusted to take account of this
structural factor.
£-
£20,000
£40,000
£60,000
£80,000
£100,000
£120,000
Bak & Vic Central SSL North SSL South Jubilee Northern Piccadilly
Signalling Normalised Costs per Main Track km
03/04 04/05 05/06 06/07 07/08 08/09 09/10
Figure 40 – Signals normalised maintenance cost per track km
290 The impact of the normalisation is mainly to increase BCV costs, because of a lower
density of point ends on BCV. The data still shows a wide range of unit rates from
£59,000 on the Piccadilly line to £88,000 on SSL South.
Structural factors
291 The following potential structural cost drivers were tested by BSL in 2009 to assess
their impact on Signalling Maintenance costs but none of these emerged as having a
significant correlation with total Signalling maintenance costs:
Signal density;
Train stops density;
Point density;
Track circuit density;
Track utilisation.
292 The use of Signalling Equivalent Units (SEU) was mentioned as a potential cost driver
in BSL benchmarking report dated 2010 for Signalling Maintenance. It should be

APPENDIX A
Rail & Underground Asset Benchmarking Initial Report June 2011 Page 81 of 114
noted that this was at odds with BSL‟s conclusion in 2009. BSL subsequently
normalised the maintenance costs for the density of SEUs.
293 The interface with Network Rail further adds to the complexity of BCV and SSL. The
quantification of this factor needs to be explored.
294 The Arbiter did not recognise any correlation between the maintenance costs and the
performance regime. However, Phase 5 of the asset maintenance benchmarking,
raises the possibility that signalling preventative maintenance and response times are
driven by the level of LCH and hence penalties incurred, i.e. that contract behaviour is
a greater driver of cost than asset performance, despite the fact that there is no
obvious correlation between the Signalling maintenance cost per track km and the Lost
Customer hours per track km.
Areas for further investigation
295 A joint LUL-Tube Lines signalling maintenance study is already underway, to address
some of the issues identified in this report, with the following objectives:
Phase 1: Incident Response Time. This will examine the cost of response teams
required vs. the cost of passenger disruption;
Phase 2: Signal maintenance pre-upgrade: This phase will review existing working
practices of Technical Officers (TOs) across all London Underground lines in order
to share best practices, identify areas for improvement and explain any remaining
differences with peers;
Phase 3: Post-Upgrade Organisation. This phase will focus on the organisation
of signal maintenance post upgrades.
296 Particular focus will be on achieving the following:
Data comparability and consistency: a review of the signalling maintenance
activities will be undertaken to ensure that comparison is made on a like for like
basis. For example, inclusion/exclusion of power and routine maintenance
activities;
Internal comparison of costs, productivity measure and related drivers. This will
encompass: an analysis of organisational size and structure between BCV/SSL
and Tube Lines, particularly number and distribution of TOs; and a comparison of
unit rates across the network.
297 Once the internal comparisons have been made, and understood, the study will
compare the organisation of signal maintenance with other metros around the world,
through the CoMET group, and suggest a good practice post-upgrade signalling
organisation.

APPENDIX A
Rail & Underground Asset Benchmarking Initial Report June 2011 Page 82 of 114
8.4 Track Maintenance
298 LUL and Tube Lines are planning to spend circa £0.7bn on the maintenance of the
Track assets between 2010/11 and 2017/18, which accounts for 20% of all
benchmarked asset maintenance spend.
299 The asset maintenance benchmarking shows that in 2009/10 the unit cost of Track
varies from £62,400 per track km on the Piccadilly line to £205,700 per track km on the
SSL South lines. This is a range of maintenance costs of £143,300 per track km,
before normalisation; and from £63,400 per track km on the Northern line to £204,800
per track km on SSL South lines, a range of £141,400 per track km after normalisation.
300 This section sets out the preliminary understanding of the reasons for this range of unit
rates; provides LUL‟s and Tube Lines‟ forecasts of the maintenance cost unit rates to
2017/18, together with a summary of the ongoing efficiency initiatives which have been
identified and are being implemented over this period; and identifies the key priorities
for further investigation.
301 Efficiency savings plans developed by BCV/SSL significantly reduce but do not
eliminate this gap. The BCV/SSL unit rate is forecast to decrease by £52,000 per
track km from £157,000 per track km in 2009/10 to £105,000 per track km in 2017/18.
The Tube Lines‟ unit rate is forecast to increase by £9,900 per track km from £68,500
per track km in 2009/10 to £78,400 per track km in 2017/18.
302 BCV/SSL and Tube Lines have different asset strategies, and during the development
of this report, it has become increasingly apparent that the boundary between
maintenance and renewals is different. Without understanding and explaining
differences in asset strategy, scope and volume of maintenance, the backlog of
maintenance and renewals work (and associated risk), and structural factors (i.e.,
curvature, asset residual life) it is not possible to determine relative levels of
efficiencies of each line.
303 Further work is required, and ongoing, to understand the maintenance components;
particularly for track refurbishment and heavy maintenance.
Track Asset Base
304 The following table sets out the passenger service track km and the percentage of
curved track with check rail.

APPENDIX A
Rail & Underground Asset Benchmarking Initial Report June 2011 Page 83 of 114
Track Assets 2009/10
Passenger Service Track Km
% of Curved Track with Check rail
Bakerloo & Victoria 72 9%
Central (incl. W&C)* 159 2%
BCV 230
SSL North 172 2%
SSL South * 133 3%
SSL 305
Jubilee † 96 0%
Northern 122 6%
Piccadilly 114 3%
JNP 331
Table 23 –Track Asset Base (as at 1st
April 2009) * Central Line includes the Waterloo & City Line; SSL South includes District, and parts of the Piccadilly Line maintained by SSL. † Jubilee Line includes the parts of the Metropolitan Line maintained by Tube Lines.
Track Asset Maintenance Benchmarking Cost Comparisons
305 The Phase 6 Asset Maintenance Benchmarking Report provides a comparison of track
maintenance unit rates, by line, across the LUL network for seven years of data from
2003/4 to 2009/10.
306 The Asset Maintenance Benchmarking protocols for track maintenance resource costs
include: direct and sub-contract labour, protection services, materials and track
workshop costs, plant hire, track recording vehicle, ultrasonic testing, grinding and
tamping costs, and engineering train costs.
307 The scope of the track maintenance activities include: track cleaning, vegetation
control, compliance work, track lubrication and depot maintenance. The scope of the
activities that are excluded are fencing, emergency response, overheads, and costs
that are considered „one-off‟ or not part of planned maintenance cycles.
308 The maintenance cost protocols also exclude capital expenditure for track
refurbishment, e.g. re-rail, track lift or re-ballast for improved track geometry, and spot
re-sleeper.18
309 The following graph shows the track maintenance unit costs per track km (excluding
depots and sidings) across the lines maintained by LUL (BCV/SSL) and Tube Lines
(JNP).
18
Pages 86 and 91 of Phase 5 Report.
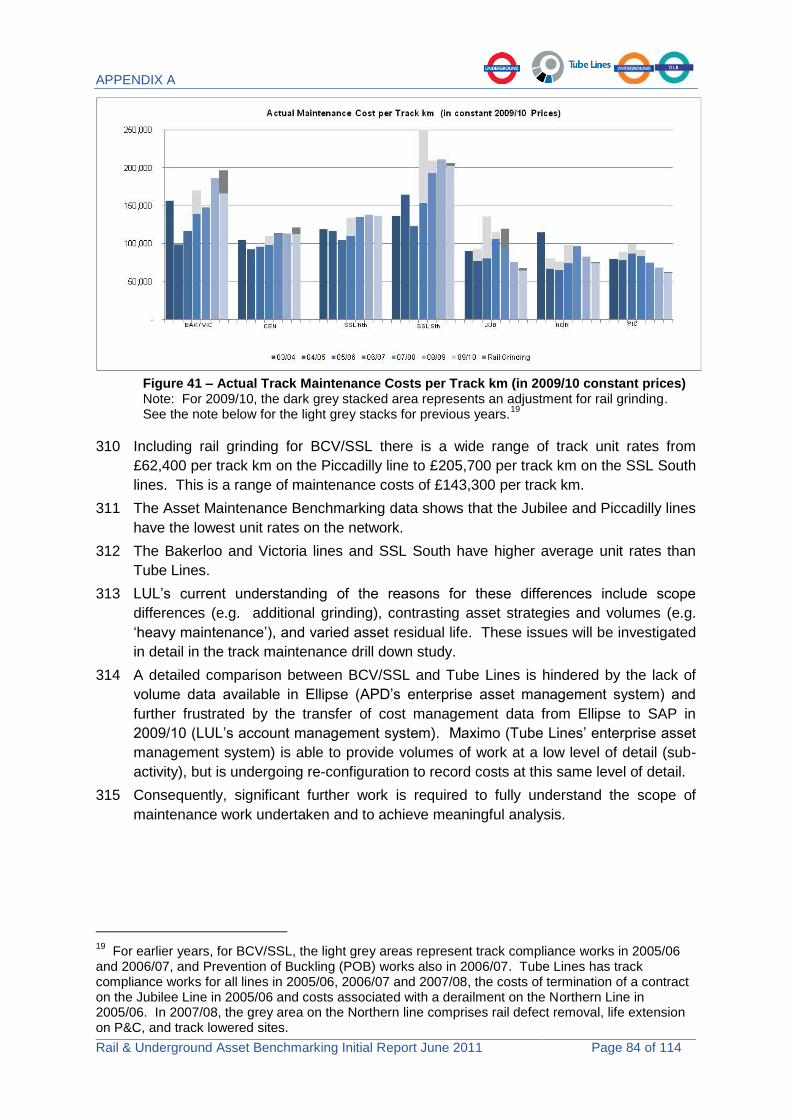
APPENDIX A
Rail & Underground Asset Benchmarking Initial Report June 2011 Page 84 of 114
Figure 41 – Actual Track Maintenance Costs per Track km (in 2009/10 constant prices) Note: For 2009/10, the dark grey stacked area represents an adjustment for rail grinding. See the note below for the light grey stacks for previous years.
19
310 Including rail grinding for BCV/SSL there is a wide range of track unit rates from
£62,400 per track km on the Piccadilly line to £205,700 per track km on the SSL South
lines. This is a range of maintenance costs of £143,300 per track km.
311 The Asset Maintenance Benchmarking data shows that the Jubilee and Piccadilly lines
have the lowest unit rates on the network.
312 The Bakerloo and Victoria lines and SSL South have higher average unit rates than
Tube Lines.
313 LUL‟s current understanding of the reasons for these differences include scope
differences (e.g. additional grinding), contrasting asset strategies and volumes (e.g.
„heavy maintenance‟), and varied asset residual life. These issues will be investigated
in detail in the track maintenance drill down study.
314 A detailed comparison between BCV/SSL and Tube Lines is hindered by the lack of
volume data available in Ellipse (APD‟s enterprise asset management system) and
further frustrated by the transfer of cost management data from Ellipse to SAP in
2009/10 (LUL‟s account management system). Maximo (Tube Lines‟ enterprise asset
management system) is able to provide volumes of work at a low level of detail (sub-
activity), but is undergoing re-configuration to record costs at this same level of detail.
315 Consequently, significant further work is required to fully understand the scope of
maintenance work undertaken and to achieve meaningful analysis.
19
For earlier years, for BCV/SSL, the light grey areas represent track compliance works in 2005/06 and 2006/07, and Prevention of Buckling (POB) works also in 2006/07. Tube Lines has track compliance works for all lines in 2005/06, 2006/07 and 2007/08, the costs of termination of a contract on the Jubilee Line in 2005/06 and costs associated with a derailment on the Northern Line in 2005/06. In 2007/08, the grey area on the Northern line comprises rail defect removal, life extension on P&C, and track lowered sites.
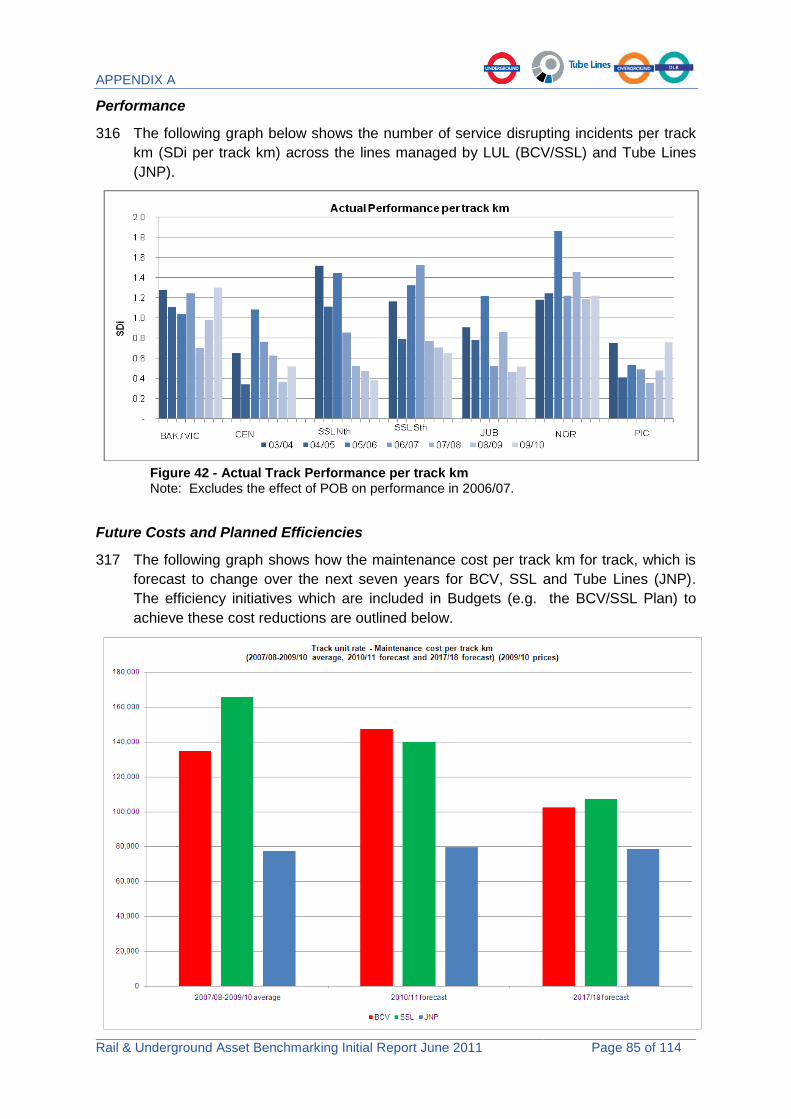
APPENDIX A
Rail & Underground Asset Benchmarking Initial Report June 2011 Page 85 of 114
Performance
316 The following graph below shows the number of service disrupting incidents per track
km (SDi per track km) across the lines managed by LUL (BCV/SSL) and Tube Lines
(JNP).
Figure 42 - Actual Track Performance per track km Note: Excludes the effect of POB on performance in 2006/07.
Future Costs and Planned Efficiencies
317 The following graph shows how the maintenance cost per track km for track, which is
forecast to change over the next seven years for BCV, SSL and Tube Lines (JNP).
The efficiency initiatives which are included in Budgets (e.g. the BCV/SSL Plan) to
achieve these cost reductions are outlined below.

APPENDIX A
Rail & Underground Asset Benchmarking Initial Report June 2011 Page 86 of 114
Figure 43 – Actual Maintenance Costs per Track km to 2017/18 (in 2009/10 constant prices) Note: Tube Lines is forecasting 2010/11 rate to be the same as the 2011/12 rate, and 2017/18 to be the same rate as 2016/17.
318 The following graph also sets out the parties‟ forecast unit rates in 2010/11 and in
2017/18, and splits out costs for various activities that are included in Asset
Maintenance Benchmarking: inspections, grinding, preventative maintenance,
reactive/corrective maintenance (and direct overheads in the case of BCV/SSL).

APPENDIX A
Rail & Underground Asset Benchmarking Initial Report June 2011 Page 87 of 114
319 The BCV/SSL unit rate for track is forecast to decrease by £52,000 per track km from
£157,000 per track km in 2009/10 to £105,000 per track km in 2017/18.
320 For BCV only, the unit rate for track is forecast to decrease by £42,300 per track km
from £144,500 per track km in 2009/10 to £102,200 per track km in 2017/18. For SSL
only, the unit rate for track is forecast to decrease by £59,300 per track km from
£166,500 per track km in 2009/10 to £107,200 per track km in 2017/18.
BCV/SSL Efficiency Initiatives
321 The unit rate impact of efficiency initiatives for BCV/SSL (combined as some savings
apply to both organisations) is shown for the Maintenance Capability Plan (MCP)
efficiencies and from increased scope of renewals, Automated Track Monitoring
System (ATMS), initiatives such as achieving lower maintenance unit rates (MUR),
and savings from contract re-negotiation (Total Purchase Services or TPS). It also
shows an adjustment for structural factors (based on those identified in 2009/1020) and
the normalised unit rate for 2017/18.
20
The asset base will change over time (i.e. renewals and further asset residual life degradation); therefore it is likely that the structural factors will also change by 2017/18. Nevertheless, our current estimate is to normalise for the percentage of track with check rail only.
Figure 44 – Forecast Maintenance Costs per Track km (2010/11 and 2017/18) (in 2009/10 constant prices) Note: Tube Lines is forecasting its 2017/18 unit rate to be the same rate as the 2016/17 unit rate.

APPENDIX A
Rail & Underground Asset Benchmarking Initial Report June 2011 Page 88 of 114
Figure 45 – Waterfall comparing BCV/SSL 2009/10 unit rate to 2017/18 and the Arbiter’s ‘Benchmark range’ (in 2009/10 constant prices) * See the footnote below explaining the Adjustment.
21
Increased Capital Renewals and MCP Efficiencies
322 LUL started to implement efficiencies and achieve savings through the MCP in
2009/10, and along with the benefits from a continuing programme of capital renewals,
is forecast to deliver savings of £14.5m (£27,100 per track km) p.a. in 2017/18. Of
these savings £5.9m (41%) were achieved in 2009/10.
323 These initiatives can be summarised as follows:
Capital renewals – track asset residual life will improve as a result of the continued
programme of capital renewals. This in turn will result in a reduction in the levels
of corrective maintenance and improved performance;
Maintenance regime optimisation – various saving initiatives will optimise the
existing maintenance regimes, and further reduce inspection frequencies (e.g.
reducing the frequency of manual patrols or less litter picking). This will include
getting better at sharing ideas and successful ways of working (e.g. adopting
practices already used on other underground lines or used by Network Rail). This
may result in the need to challenge or amend some LUL Standards;
Staffing efficiencies and improved working practices – initiatives will be introduced
to reduce staff numbers by removing already existing staff vacancies, and also
21
This Adjustment captures the efficiencies not specifically listed in this paper, and the effect of changes in volumes or the actual timing of when efficiencies are implemented during each financial year. It allows the reconciliation between the 2009/10 unit rate, the listed efficiencies, and the forecast 2017/18 unit rate.

APPENDIX A
Rail & Underground Asset Benchmarking Initial Report June 2011 Page 89 of 114
reducing contract labour/agency staff (e.g. developing the competence of existing
staff through multi-skilling);
Reduced overhead costs – within track and signals asset areas, savings will be
achieved by removing of duplication and streamlining of requirements (e.g.
integration of projects and combining maintenance support functions within the
joint asset management team);
Improving the utilisation of equipment (including approved under LUL Standards)
– increased mechanisation of inspections, and using a DISAB machine (plant
which replaces ballast) to remove wet beds more frequently to reduce
maintenance costs. Furthermore, a greater reliance on the Connect Radio
network will also reduce mobile phone and other communication costs; and
Improving materials management and storage, and better transport logistics –
better use of local storage areas, and transport and fleet utilisation improvements.
Automated Track Monitoring System (ATMS)
324 The installation of ATMS equipment to passenger trains will allow daily high frequency
track geometry inspections, including measuring track geometry and the location of
faults. This will enable early identification of defects, establish degradation rates,
enable better planning of works prior to fault, and enable the monitoring of the impact
following interventions. The introduction of ATMS will lead to a reduction in manual
inspections and, through improved planning, a corresponding reduction in corrective
maintenance. ATMS equipment is planned to commence operation in late 2011.
325 ATMS is expected to deliver savings of £3.5m (£6,600 per track km) p.a. in 2017/18.
Other Initiatives (MUR and TPS)
326 Lower maintenance unit rates (MUR) for activities are assumed, which involves,
paying less for materials and lower unit rates for current activities.
327 Total Purchase Services (TPS) involves efficiencies from consolidating and reducing
the number of external suppliers. In addition, it involves re-negotiating labour supply
contracts (i.e., achieving lower schedules of rates).
328 Adjusting for these MUR and TPS initiatives delivers savings of £6.7m (or £12,500 per
track km) p.a. in 2017/18.
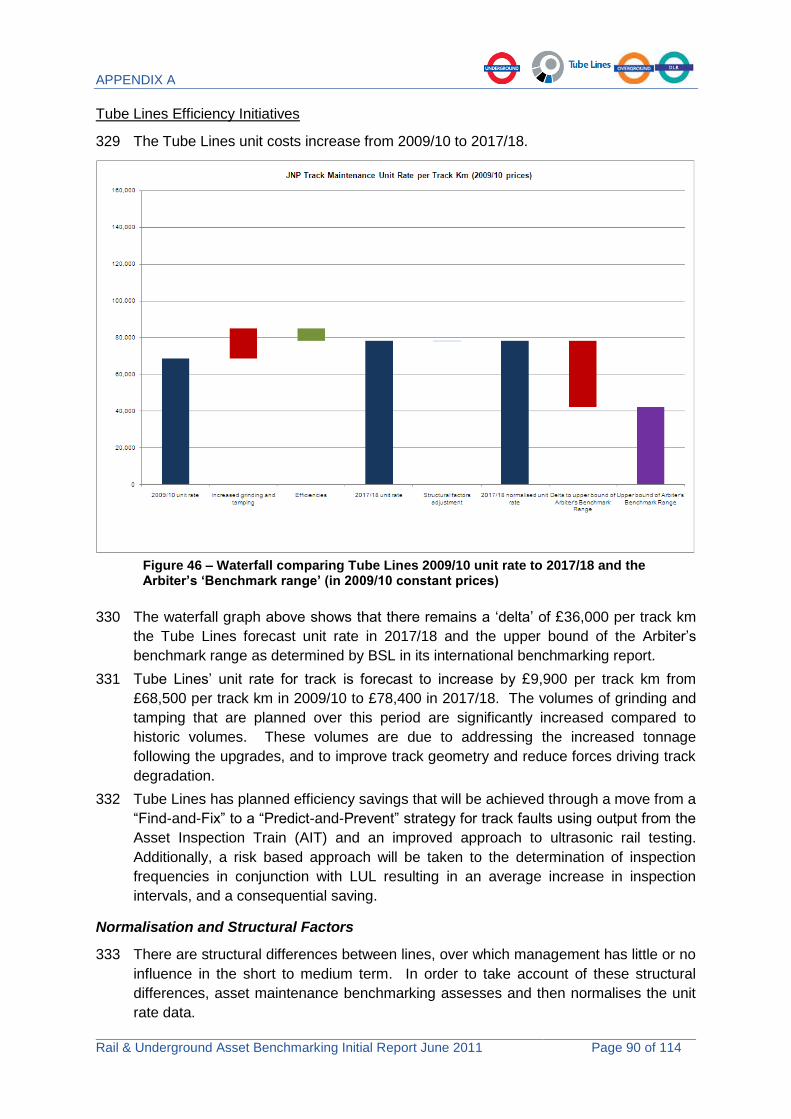
APPENDIX A
Rail & Underground Asset Benchmarking Initial Report June 2011 Page 90 of 114
Tube Lines Efficiency Initiatives
329 The Tube Lines unit costs increase from 2009/10 to 2017/18.
Figure 46 – Waterfall comparing Tube Lines 2009/10 unit rate to 2017/18 and the Arbiter’s ‘Benchmark range’ (in 2009/10 constant prices)
330 The waterfall graph above shows that there remains a „delta‟ of £36,000 per track km
the Tube Lines forecast unit rate in 2017/18 and the upper bound of the Arbiter‟s
benchmark range as determined by BSL in its international benchmarking report.
331 Tube Lines‟ unit rate for track is forecast to increase by £9,900 per track km from
£68,500 per track km in 2009/10 to £78,400 in 2017/18. The volumes of grinding and
tamping that are planned over this period are significantly increased compared to
historic volumes. These volumes are due to addressing the increased tonnage
following the upgrades, and to improve track geometry and reduce forces driving track
degradation.
332 Tube Lines has planned efficiency savings that will be achieved through a move from a
“Find-and-Fix” to a “Predict-and-Prevent” strategy for track faults using output from the
Asset Inspection Train (AIT) and an improved approach to ultrasonic rail testing.
Additionally, a risk based approach will be taken to the determination of inspection
frequencies in conjunction with LUL resulting in an average increase in inspection
intervals, and a consequential saving.
Normalisation and Structural Factors
333 There are structural differences between lines, over which management has little or no
influence in the short to medium term. In order to take account of these structural
differences, asset maintenance benchmarking assesses and then normalises the unit
rate data.

APPENDIX A
Rail & Underground Asset Benchmarking Initial Report June 2011 Page 91 of 114
Figure 47 – Normalised Track Maintenance Costs per Track km (£/km) across the lines managed by LUL (BCV/SSL) and Tube Lines (JNP) (in 2009/10 constant prices) Note: For 2009/10, the (non-normalised) dark grey area represents an adjustment for rail grinding.
22
334 The Phase 6 Asset Maintenance Benchmarking data has been normalised to reflect
the percentage of the passenger service track that has check rail installed in curved
areas. This is the only structural factor which is considered statistically significant,
based on current understanding of the available cost and volume data.
335 In previous years, normalisation adjustments have also been applied for the
percentage of the passenger service track that is sub-surface (as opposed to open or
tube). While it is accepted by the parties that sub-surface track suffers many of the
disadvantages of ballasted track in the open, and few of the access advantages due to
being in a partly-enclosed environment, there are concerns that the impact is
overstated due to the small sample size (i.e., only two lines with sub-surface track),
and therefore this structural factor has not been used in the Phase 6 normalisation.
336 After normalisation for structural factors and including rail grinding, the size of this
range is £141,400 per track km; from £63,400 per track km on the Northern Line to
£204,800 per track km on the SSL South Lines. Excluding rail grinding, after
normalisation for structural factors, the size of this range is £139,100 per track km;
from £62,300 per track km on the Northern Line to £201,400 per track km on the SSL
South Lines. This is a decrease in the range and change in the lowest cost line: the
lowest was the Piccadilly Line, but now it is the Northern Line.
22
For earlier years, for BCV/SSL, the (non-normalised) light grey areas represent track compliance works in 2005/06 and 2006/07, and prevention of buckling works also in 2006/07. Tube Lines has track compliance works for all lines in 2005/06, 2006/07 and 2007/08, the costs of termination of a contract on the Jubilee Line in 2005/06 and costs associated with a derailment on the Northern Line in 2005/06. In 2007/08, the grey area on the Northern line comprises rail defect removal, life extension on P&C, and track lowered sites.

APPENDIX A
Rail & Underground Asset Benchmarking Initial Report June 2011 Page 92 of 114
Additional Structural Factors
337 There may be other structural factors, which have not been identified, or more likely,
cannot be shown to be statistically significant. As the parties provide increasingly
disaggregated data by cost activity, new structural factors may emerge.
338 Moreover, as the asset residual life profile of the track changes with increased levels of
renewals (including updating WLAM models with revised residual life data) this may
affect the statistical significances of the structural and explanatory factors. Going
forward, all aspects of the data book (track km, asset age and residual life, percentage
tube, open or sub-surface, percentage bull-head or flat-bottom rail etc) will be fully
reviewed to re-assess and validate as to whether there other structural factors that
should be taken into account for normalisation.
339 BSL, in its International Benchmarking Report for the Arbiter (16th March 2010, pp 37-
53) identified track utilisation was the only significant structural factor.23 This is similar
(but not identical) to „passenger kilometres by line‟, which was tested during Asset
Maintenance Benchmarking, but not identified as a significant structural factor.
340 Other structural factors that were tested by BSL, but not proven to be significant,
included density of point ends. This analysis may change once only the various
discrete repetitive maintenance activities are compared across lines, and scope
differences due to track refurbishment or heavy maintenance activities are isolated.
Arbiter‟s Benchmark Range
341 The waterfall graphs above show the upper bound of the benchmark range of £42,300
per track km, which was determined by BSL in its international benchmarking study for
the Arbiter, broadly on the normalised unit cost levels of the international peer metros.
Further Analysis of Maintenance Activities
342 There are likely to be a number of efficiency opportunities which are not currently
included in the BCV/SSL plan to 2017/18. Based on the benchmarking analysis, this
section looks at what these opportunities might include, and makes recommendations
as to further studies and analysis to identify these opportunities.
343 The BSL Report (16th March 2010) also looked at a number of explanatory factors,
which may explain the difference between BCV/SSL and Tube Lines‟ and the Arbiter‟s
„Benchmark range‟. BSL determined that it could explain c. 48% of the cost gap for
BCV/SSL to the upper bound of the Arbiter‟s „Benchmark range‟ by relative levels of
labour rates/productivity, inspection regime, asset residual life, and finally, access and
tube tunnels and other.
344 As outlined above, BCV/SSL are tackling many of these suggested savings from BSL
via maintenance regime optimisation (i.e., changes to maintenance
intervals/frequency) and reducing staffing (including sub-contract or agency), however,
further investigation is required to ensure that all of BSL‟s recommendations have
been fully explored. BSL did accept, however, that such adjustments would take a
long time to implement and those changes would require co-operation with
stakeholders.
23
Track utilisation which represents the intensity of the usage of the track asset: the more car-km travelled along a particular route length, the higher the wear on track.

APPENDIX A
Rail & Underground Asset Benchmarking Initial Report June 2011 Page 93 of 114
345 BSL also suggested a range of other factors that may explain the cost difference
between the London lines and the Benchmark range e.g. the proportion of ballast
track, and the larger proportion of track with tight radius curves (i.e. check rail);
methods for transport of materials to site; the length of track that is maintained or
renewed at a time; organisation of staff gangs; rail grinding strategy; tunnel water
ingress; use of machinery and mechanisation; and finally, the use of maintenance sub-
contracting.
Areas for further investigation
346 The parties recognise that further work is needed to ensure comparisons of unit rates
for a similar scope of works can be made; to identify further structural factors; and to
consider the range of factors identified by BSL to drive costs lower. Regardless of the
level of efficiency the Arbiter and BSL concluded may be possible, many lines on the
London Underground network are currently above the level of the range of the lower
cost lines. Therefore further work needs to be completed to understand these cost
differences.
347 To facilitate this analysis, two separate initiatives to improve track maintenance data
comparability will be undertaken.
348 First, a joint exercise will be completed to establish standard activities with suitable
scale limits applied to define inclusion or exclusion from the underlying cost of
maintenance (i.e. re-railing > 90m is heavy maintenance or spot re-railing < 90m is
maintenance). These definitions can be included in the AGS and also used to revise
the standard activities recorded in Ellipse/Maximo.24 Analysis will also be undertaken
on overhead costs (excluded from Asset Maintenance Benchmarking) to ensure
comparable treatment is being made by both parties.
349 Second, a drill down study into track maintenance costs will be undertaken which will
focus in particular on determining the exact scope of works or discrete repetitive
activities (e.g. manual inspections and servicing type activities e.g. track cleaning)
that are being carried out by each maintenance organisation. In addition, this study
will identify the asset regime, the treatment of overheads, and the risk strategies being
employed by each maintenance organisations, and how these strategies interface with
WLAM principles and the renewals programme. This drill-down study should make it
possible to determine the scope of all the various discrete repetitive maintenance
activities, and how unit rates for these similar activities vary across all lines. Once a
clear and comparative scope is determined, analysis of labour costs (i.e., FTE staff
costs per track km) will be carried out, which will assist with the understanding of the
most efficient lines for certain activities (e.g. manual patrols and inspection costs per
km).
350 In parallel, a greater focus will be placed by APD on ensuring that all work orders are
processed within the asset fault and enterprise asset management system alongside
the costs incurred during completed and closed work orders. This will also include a
greater emphasis on the booking of time to work orders or work areas/activities (e.g.
costs being fully attributable to heavy maintenance, or any inspections/maintenance
24
The most cost effective time to implement changes to Ellipse/Maximo is likely to be at the point of the software upgrade.

APPENDIX A
Rail & Underground Asset Benchmarking Initial Report June 2011 Page 94 of 114
carried out within depots) with monitoring through metrics incorporated into the
Balanced Scorecard.
351 Ellipse is likely to have its software upgraded in the near future with improved
functionality, which will ensure the system can provide data that is more „user friendly‟
for analysis (e.g. discrete repetitive activity cost comparisons from a benchmarking
perspective). Steps will also be taken to separate out cost data for each line. For
illustration, combining data for the Bakerloo and the Victoria lines masks the Victoria
line‟s better performance, as there is no check rail on the Victoria line, and 28% on the
Bakerloo.
352 LUL and Tube Lines are currently completing a track renewals unit rate study, which
compares the unit rates for different track interventions. The parties will also identify
which delivery organisation (projects or maintenance) completes which particular
activities or interventions.

Rail & Underground Asset Benchmarking Initial Report June 2011 Page 95 of 114
Annex 1 – Track Asset Base
353 The following table includes details of the aspects of the asset base that have been identified as structural factors (i.e. the percentage curved
track with check rail) and other key aspects (i.e. track in tunnel (either sub-surface or tube) and the length of track (both passenger
service/running and for the depots and sidings). The density of P&C units is also included as it is understood that this may impact on
maintenance costs. Going forward, during Asset Maintenance Benchmarking, greater focus will be placed on the asset age and residual life,
which is not included in the Table below.
Track Asset Base
Passenger Service/Running Track Depot & Sidings Total
Km Rail type
(BH) % Curve -
Check % Sub-surface
Density of P&C
Km % of Track
Km Km
Bakerloo & Victoria 72 65% 9%
0.76 21 23% 92
Central* 159 64% 2%
1.07 51 24% 210
BCV 230
72 24% 302
SSL North 172 49% 2% 19% 1.24 34 17% 207
SSL South* 133 66% 3% 31% 1.81 20 13% 153
SSL 305
55 15% 360
Jubilee † 96 31% 0%
1.85 13 12% 109
Northern 122 62% 6%
1.41 32 21% 153
Piccadilly 114 62% 3%
1.55 27 19% 141
JNP 331
72 18% 403
Table 24 – Key Aspects of Track Asset Base 2009/10 (excluding Asset Condition) * Central Line includes the Waterloo & City Line; SSL South includes District and the parts of the Piccadilly Line maintained by SSL. † Jubilee Line includes the parts of the Metropolitan Line maintained by Tube Lines.

APPENDIX A
Rail & Underground Asset Benchmarking Initial Report June 2011 Page 96 of 114
8.5 Stations Maintenance
354 LUL and Tube Lines are planning to spend circa £0.8bn on the maintenance of the
Stations assets between 2010/11 and 2017/18, which accounts for 22% of all
benchmarked asset maintenance spend.
355 Phase 6 of the asset maintenance benchmarking shows that in 2009/10 the unit cost
per Station varies from £332,000 to £440,000, a range of £108,000 before
normalisation; and from £366,000 to £423,000, a range of £57,000 after normalisation.
356 This section sets out the preliminary understanding of the reasons for this range of unit
rates; provides LUL‟s and Tube Lines‟ forecasts of the maintenance cost unit rates to
2017/18, together with a summary of the ongoing efficiency initiatives which have been
identified and are being implemented over this period; and identifies the key priorities
for further investigation.
Stations Asset Base
357 The current stations maintenance expenditure relates to maintenance for 250 stations
and covers assets relating to premises, fire protection systems, communication
systems, electrical systems and mechanical systems.
Line No. Stations Notes
Bakerloo 11 Oxford Circus included
Central & W&C 44 Victoria 10 District 41 Metropolitan 44 Wood Lane included
Jubilee 24 Northern 40 Piccadilly 36 TOTAL 250
Table 25 – Number of stations by line
Stations Asset Maintenance Benchmarking Cost Comparisons
358 The Phase 6 asset maintenance benchmarking provides a comparison of maintenance
rates, by Infraco grouping, across the LUL network for six years of data from 2004/5 to
2009/10.
359 The following graph below shows a comparison of the average maintenance costs per
station for each of the six years based on actual costs. This figure includes the
maintenance costs for station services (communication, fire, mechanical and electrical
assets) and premises, including cleaning costs.

APPENDIX A
Rail & Underground Asset Benchmarking Initial Report June 2011 Page 97 of 114
£0
£50,000
£100,000
£150,000
£200,000
£250,000
£300,000
£350,000
£400,000
£450,000
£500,000
BCV SSL JNP
£ /
Sta
tio
nActual Maintenance Cost per Station in 09/10 prices
03/04 04/05 05/06 06/07 07/08 08/09 09/10
Figure 48 – Station Maintenance Costs per Station (09/10 prices)
360 The data shows a range between the average station maintenance cost for 2009/10 of
£332,000 to £440,000, a variance of £108,000. This variance can partly be explained
by structural differences between the Infraco groups, the key factor being the varying
station sizes, in particular the Jubilee Line Extension stations. The Phase 6 asset
maintenance benchmarking takes this into account as a structural factor used to
normalise the data, which is explained later in this report.
361 It is noted that there is some inconsistency in cost allocation for station maintenance
costs across BCV/SSL and Tube Lines, e.g. the inclusion of costs for assets such as
line side buildings, depots, tunnel telephones and OPO CCTV differs between
BCV/SSL and Tube Lines. This is an area which requires further work.
Future Costs and Planned Efficiencies
362 The graph below shows the average station maintenance cost for the last three years
(2007/08-2009/10), the 2010/11 forecast and the forecast cost for station maintenance
in 2017/18. These are expressed as the average maintenance cost per station.

APPENDIX A
Rail & Underground Asset Benchmarking Initial Report June 2011 Page 98 of 114
Note: Tube Lines advise that JNP maintenance costs forecast for 2010/11 are the same as 2009/10 costs.
Figure 49 – Station unit rate: maintenance costs per station (09/10 prices)
BCV/SSL Future Costs and Planned Efficiencies
363 The following graph shows the change in the station unit rates between 2009/10 and
2017/18 for BCV/SSL. The cost increases and efficiencies shown are explained
below.
Figure 50 – BCV/SSL Stations Maintenance Unit Rate – cost per station (09/10 prices)

APPENDIX A
Rail & Underground Asset Benchmarking Initial Report June 2011 Page 99 of 114
Future contract prices
364 The BCV and SSL maintenance costs primarily relate to the four maintenance
contracts (the Total Packaged Services (TPS) contracts) which have been introduced
for maintaining premises, fire systems, communication systems and electrical &
mechanical (E&M) systems. Each of the four contracts cover assets across both BCV
and SSL rather than being Infraco or line based and therefore, the waterfall graph
above combines the stations unit rate cost of BCV and SSL.
365 In addition, the maintenance unit rate for BCV and SSL is forecast to increase by
£52,800k per station, from £381,500 per station in 2009/10 to £434,300k in 2017/18.
This predominantly relates to the increased number of station assets being delivered
by Crossrail and the congestion relief projects, giving an increase of £17m over the
period. This increase is due to the expansion of the existing stations and the
corresponding provision of additional assets which impacts the unit rate used of
maintenance cost per station. Additional forecast increases in station maintenance
costs relate to the renegotiation of the BCV/SSL TPS maintenance contracts in 2013-
15, an increase of £8m over the period. The current TPS contract prices are set at
fixed prices, which are not indexed for the duration of the contracts. Therefore it is
expected that the cost of the renegotiated contracts will reflect the impact of inflation
over the period of the existing contracts.
366 The increase in unit rate is also attributable to transferring some costs for depot
maintenance to the stations budget to align with the TPS contracts giving an increase
of £2m over the period; and for works relating to asbestos management, an increase
of £1m over the period. There is also a cost phasing adjustment which has been
applied in the 2017/18 financial year.
Maintenance Capability Plan (MCP) and other efficiencies
367 The increased contract prices are partially offset by planned efficiencies which are
being delivered through the Maintenance Capability Plan (MCP) and further
efficiencies as outlined below.
368 The Maintenance Capability Plan includes savings for stations maintenance which
started to be achieved in 2009/10 and will total £9.5m for the year 2017/18. The
savings primarily relate to improving organisational efficiency and utilising cost
reduction mechanisms within existing contracts. Other savings consider changes to
strategy, revising current contractual arrangements to reduce contractual costs and
reducing overhead costs.
369 £1.8m of the identified savings relate to achieving greater organisational efficiency
within the Asset Performance Directorate (APD). Changes to realise £0.6m of these
savings have already been implemented with no adverse impact on performance.
370 A saving of £3.5m is expected to be achieved through utilising cost reduction clauses
within existing contracts. Changes to existing contracts, including moving to
performance based contracts, is expected to realise a saving of £0.3m.
371 A review of team on-costs such as those for stationery and IT is expected to achieve a
saving of £1.4m. The remainder of the identified savings relate to changes to ways of
working, such as more automated and remote working and use of extended
engineering hours; savings as a result of the reductions in the minor works budget and
a further review of all non committed funds. This is expected to realise a saving of
£2.2m.

APPENDIX A
Rail & Underground Asset Benchmarking Initial Report June 2011 Page 100 of 114
372 Further efficiencies over and above MCP are also forecast to be delivered. These
include the realisation of efficiencies being delivered as part of the current TPS
contracts (£7.9m); reductions in the APD maintenance unit rates (£7.2m); and
efficiencies being realised through the Support Services Review (£0.6m).
Tube Lines‟ Efficiencies
373 The following graph shows the same graph for JNP with information provided by Tube
Lines. The efficiencies shown relate to combining the contracts for ambience and
security, and the introduction of Maximo on premises assets so contractor involvement
can be targeted more accurately.
0
50
100
150
200
250
300
350
400
450
Unit rate 2009/10 Efficiencies Unit rate 2017/18
TLL Stations Maintenance cost per station (£k 2009/10)
Figure 51 – Tube Lines Stations Maintenance Unit Rate – cost per station – JNP (09/10 prices)
374 Unlike some other asset areas the international benchmarking undertaken by the PPP
Arbiter did not include an analysis of good practice and associated costs for stations
assets therefore at this time there is no external comparator with which to compare
LUL and Tube Lines costs.
Normalisation and Structural Factors
375 The Phase 6 asset benchmarking analysis identified one structural factor which is
statistically significant and therefore could be used to normalise the data, this being
station size (measured in square metres).
376 The following graph shows the normalised maintenance costs per station when
adjusted for size.

APPENDIX A
Rail & Underground Asset Benchmarking Initial Report June 2011 Page 101 of 114
£0
£50,000
£100,000
£150,000
£200,000
£250,000
£300,000
£350,000
£400,000
£450,000
£500,000
BCV SSL JNP
£ /
Sta
tio
nNormalised Maintenance Cost per Station in 09/10 prices
03/04 04/05 05/06 06/07 07/08 08/09 09/10
Figure 52 – Normalised Maintenance Costs per station (09/10 prices)
377 By taking into account the differing sizes of stations the normalised data shows that
the range of costs per station for 2009/10 becomes £366,000 to £423,000, a reduced
variance of £57,000.
378 The Phase 6 asset benchmarking analysis also examined a number of other structural
factors, including whether the station is in the open or sub-surface, and whether the
station has listed status. None of these other factors were found to be statistically
significant at this level of analysis.
379 As previously noted there are some differences attributable to the fact that cost
allocation for station maintenance costs across BCV/SSL and Tube Lines is not
consistent, e.g. costs for line side buildings, tunnel telephones, OPO CCTV, etc.
380 To better understand the cost drivers for station maintenance costs it will be necessary
to compare the costs at asset group level, i.e. premises, electrical, mechanical,
communication and fire protection systems. This level of analysis will also reflect the
maintenance contract arrangements which are let on an asset group basis.
381 The following graph shows the maintenance costs per station split out into these asset
areas, with cleaning costs shown separately. The “Average” data column shows the
mean cost per asset group for the four years shown.

APPENDIX A
Rail & Underground Asset Benchmarking Initial Report June 2011 Page 102 of 114
Figure 53 – Stations Maintenance Costs at asset group level
382 This shows that the cleaning costs across the three Infracos are broadly comparable;
premises maintenance costs and E&M maintenance costs are lowest for Tube Lines,
with communication and fire asset maintenance costs being lowest for BCV/SSL.
383 Further analysis will be carried out to separately identify other material elements of
cost; for example, tunnel telephone, tunnel lighting systems and OPO CCTV
equipment. Also, future benchmarking studies will separately identify the costs relating
to the maintenance of the Silverlink stations.
384 The costs are shown as cost per square metre as this is believed to provide a better
representation of the costs at the asset group level rather than cost per station. It is
recognised however that further analysis will be required to understand the best level
of comparison for each of the asset groups, i.e. cost per area is expected to be most
relevant for premises and cleaning costs, but other factors such as being a sub-
surface station will affect the cost of maintaining communication and fire assets.
Areas for further investigation
385 It is proposed to review the cost differences identified above for the station asset
groups for each of the Infraco areas. This will provide an understanding of the reasons
for the variances and identify best in group for each of the asset areas. It is proposed
that from this the potential for suitable further efficiencies can be considered.
386 The level of detail in the current data will be reviewed to ensure the viability of
benchmarking at the asset group level, e.g. E&M, communication systems, fire
systems, premises, etc, rather than at Infraco group level or by line. This will enable
comparison and benchmarking at a unit rate commensurate with the contractual

APPENDIX A
Rail & Underground Asset Benchmarking Initial Report June 2011 Page 103 of 114
arrangements in place for maintaining the assets and lead to the identification of cost
drivers at the asset group level.
387 Subsequent to this review it is intended that the analysis is expanded to capture data
for similar maintenance expenditure from within the TfL group, e.g. Overground, DLR,
and to identify suitable comparators externally to TfL, e.g. Network Rail.
388 To ensure that the comparison of station maintenance costs is reliable a review will be
undertaken of the allocation of stations maintenance costs across the three Infraco
areas to provide for consistency of capturing and allocating cost data. This will ensure
that the asset bases are comparable and that the maintenance costs, including
overheads and management costs are allocated in a consistent way.
389 The relationship between asset performance and maintenance costs needs to be
understood at asset group level, particularly in relation to services assets, e.g. CCTV
and other communication equipment. Therefore, one work stream will involve an
investigation to better understand and to review the relationship between varying
station maintenance costs and the associated impacts on, and risk to, asset
performance.
390 The stations maintenance drill-down study will be progressed in two phases. The first
phase will identify and analyse cost data at asset group level for the SSL, BCV and
TLL station assets. The objective of the first phase will be to identify the optimum
maintenance costs for each asset group with a subsequent analysis to identify
efficiency opportunities which could be applied to the maintenance of all similar assets
across the LUL network.
391 The second phase will focus on extending this analysis within the TfL group, including
London Rail, and to external organisations, including international metros through the
CoMET and Nova groups, maintaining similar assets for comparison and subsequent
identification of efficiency opportunities. The second phase will also consider the
relationship between asset performance and the cost of maintaining the assets.

APPENDIX A
Rail & Underground Asset Benchmarking Initial Report June 2011 Page 104 of 114
8.6 L&E Maintenance
392 LUL and Tube Lines are planning to spend £0.2bn on the maintenance of the
Escalator assets between 2010/11 and 2017/18, which accounts for 6% of all
benchmarked asset maintenance spend, and £53m on the maintenance of the lift
assets over the same period, which accounts for 1% of all benchmarked asset
maintenance spend.
393 Phase 6 of the asset maintenance benchmarking shows that in 2009/10 the unit cost
of Escalators varies from £55,000 to £86,000, a range of £31,000 per escalator before
normalisation; and from £59,000 to £78,000, a range of £19,000 per escalator after
normalisation.
394 The asset benchmarking also shows that in 2009/10 the unit cost of Lifts varies from
£36,000 to £57,000, a range of £21,000 per lift before normalisation; and from £33,000
to £51,000, a range of £18,000 per lift after normalisation.
395 This section sets out the preliminary understanding of the reasons for this range of unit
rates; provides LUL‟s and Tube Lines‟ forecasts of the maintenance cost unit rates to
2017/18, together with a summary of the ongoing efficiency initiatives which have been
identified and are being implemented over this period; and identifies the key priorities
for further investigation.
L&E Asset Base
396 The lifts and escalators asset base currently consists of 408 escalators and 140 lifts.
Number of escalators
Number of lifts
Bakerloo 24 11
Central & W&C 72 13
Victoria 33 5
District 21 12
Metropolitan & H&C* 32 12
Jubilee 127 38
Northern 56 28
Piccadilly 43 21
TOTAL 408 140
*Note: including Wood Lane
Table 26 – Number of Escalators and Lifts
L&E Asset Maintenance Benchmarking Cost Comparisons
397 Phase 6 of the asset benchmarking provides a comparison of maintenance rates, by
Infraco grouping, across the LUL network for six years of data from 2004/5 to 2009/10.
398 The following graphs show a comparison of the actual maintenance costs per
machine.

APPENDIX A
Rail & Underground Asset Benchmarking Initial Report June 2011 Page 105 of 114
£0
£10,000
£20,000
£30,000
£40,000
£50,000
£60,000
£70,000
£80,000
£90,000
BCV SSL JNP
£ /
Mac
hin
e
Actual Maintenance Cost per Escalator in 09/10 prices
03/04 04/05 05/06 06/07 07/08 08/09 09/10
Figure 54 – Escalators Actual Maintenance Costs in 09/10 prices
£0
£10,000
£20,000
£30,000
£40,000
£50,000
£60,000
BCV SSL JNP
£ /
Mac
hin
e
Actual Maintenance Cost per Lift in 09/10 prices
03/04 04/05 05/06 06/07 07/08 08/09 09/10
Figure 55 – Lifts Actual Maintenance Costs in 09/10 prices
399 For 2009/10 the maintenance cost per escalator ranges from £55,000 to £86,000, a
variance of £31,000 per escalator, with the maintenance cost per for lift ranging from
£29,000 to £57,000, a variance of £28,000 per lift. This variance can partly be
explained by structural differences between the assets across the network areas,
these are outlined later in this report.
Performance
400 The following graph compares the performance of the escalators across the network.
The metric is the same as used for previous phases of the asset maintenance
benchmarking, being the number of service disrupting incidents per escalator. The
graphs show an improving trend for all three network areas.

APPENDIX A
Rail & Underground Asset Benchmarking Initial Report June 2011 Page 106 of 114
Figure 56 – Escalator Performance – incidents per escalator
401 The following graph shows the service disrupting incidents per lift. There is a generally
improving performance trend across all three network areas, although for all three
areas performance in 2009/10 worsened.
Figure 57 – Lift Performance – incidents per lift
Future Costs and Planned Efficiencies
402 The following graphs show for lifts and escalators respectively the average
maintenance costs for the last three years, the 2010/11 forecast and the forecast cost
for lifts and escalators maintenance in 2017/18.

APPENDIX A
Rail & Underground Asset Benchmarking Initial Report June 2011 Page 107 of 114
Note: Tube Lines advise that JNP maintenance costs forecast for 2010/11 are the same as 2009/10 costs.
Figure 58 – Escalator unit rate: maintenance costs per machine (09/10 prices)
Note: Tube Lines advise that JNP maintenance costs forecast for 2010/11 are the same as 2009/10 costs.
Figure 59 – Lift unit rate: maintenance costs per machine (09/10 prices)
403 The analysis combines the maintenance costs of SSL and BCV lifts and escalators to
reflect the maintenance arrangements of the assets which are not split by Infraco.
404 There is a forecast increased cost in the maintenance unit rate for SSL and BCV for
lifts and a slight decrease for escalators. For escalators the MCP efficiencies are
almost completely offset by an increase due to a transfer of maintenance materials
purchases from other budget areas, plus an element of payroll inflation, which equates
to £2.0m in 2017/18, or £9,000 per escalator. For lifts the increase relates to payroll
increases (pensions/NI), in part to heavy maintenance and in part due to poor
condition of assets taken over from the Otis contract. Given the relatively small asset
base, these increases have a disproportionate effect on the unit rate in comparison to
other asset areas with greater numbers of assets. This increase equates to £0.7m in
2017/18, or £8,000 per machine.

APPENDIX A
Rail & Underground Asset Benchmarking Initial Report June 2011 Page 108 of 114
405 The following graphs show for the escalator and lift assets, for BCV/SSL and Tube
Lines, the unit rate in 2009/10 and in 2017/18. The costs and efficiencies which
explain the difference between these unit rates are described below.
Figure 60 – BCV/SSL Escalator Maintenance unit rate–cost per escalator (09/10 prices)
Figure 61 – Tube Lines Escalator Maintenance unit rate–cost per escalator (09/10 prices)

APPENDIX A
Rail & Underground Asset Benchmarking Initial Report June 2011 Page 109 of 114
Figure 62 – SSL/BCV Lift Maintenance unit rate–cost per lift (09/10 prices)
Figure 63 –Tube Lines Lift Maintenance unit rate–cost per lift (09/10 prices)
BCV/SSL Maintenance Capability Plan (MCP) and other efficiencies
406 The increase in lift and escalator costs is partially offset by the planned efficiencies
which will be delivered through the Maintenance Capability Plan (MCP). MCP includes
efficiencies for Lifts and Escalators maintenance which started to be achieved in
2009/10 and will total £2.4m for the year 2017/18. The savings primarily relate to
amending the current contractual arrangements with other savings relating to
achieving greater organisational efficiency within the APD and changes to the
maintenance strategy (e.g. reduction in frequency of escalator inspections and dust
tray cleaning and use of extended L&E closures to optimise productivity).
407 £1.3m (54%) of the identified savings relate to amending current contractual
arrangements including bringing work in-house and renegotiating existing contracts.

APPENDIX A
Rail & Underground Asset Benchmarking Initial Report June 2011 Page 110 of 114
408 A further saving of £1.0m (44%) is expected to be achieved through organisational
efficiencies and changes to strategy relating to activities such as dust tray cleaning.
Tube Lines’ Efficiencies
409 The Tube Lines efficiencies as shown in the figures above will be achieved through the
following:
DUST TRAYS: Reduction in the frequency of Escalator Dust Tray cleaning across
applicable sites on the JLE and Non-JLE assets, previously specified in the Cat1
Standard as twice weekly.
STEP INSPECTIONS: Reduction in frequency of NDT on escalators, moving to a
more risk based approach.
SHAFT INSPECTIONS: Reduction in frequency of shaft inspection on escalators,
moving to a more risk based approach.
L&E Extended Closures (LEEC), extends the engineering hours from 01:00-05.30
to 23.30-0630 across applicable escalator assets.
TWICE WEEKLY INSPECTIONS: Reduction in the TLES twice weekly inspection
visits.
410 Unlike some other asset areas the international benchmarking undertaken by the PPP
Arbiter did not include an analysis of good practice and associated costs for lifts or
escalators therefore at this time there is no comparator with which to evaluate LUL and
Tube Lines costs.
Normalisation and Structural Factors
411 Phase 6 of the asset maintenance benchmarking analysis identified one structural
factor for escalators and one structural factor for lifts which are statistically significant
and therefore could be used to normalise the data. For escalators this factor relates to
the age of the machine, and for lifts it is the loading proxy which relates to the
passenger usage.
£0
£10,000
£20,000
£30,000
£40,000
£50,000
£60,000
£70,000
£80,000
£90,000
BCV SSL JNP
£ /
Mac
hin
e
Normalised Maintenance Cost per Escalator in 09/10 prices
03/04 04/05 05/06 06/07 07/08 08/09 09/10
Figure 64 – Normalised Maintenance Costs for escalators in 09/10 prices

APPENDIX A
Rail & Underground Asset Benchmarking Initial Report June 2011 Page 111 of 114
£0
£10,000
£20,000
£30,000
£40,000
£50,000
£60,000
BCV SSL JNP
£ /
Mac
hin
e
Normalised Maintenance Cost per Lift in 09/10 prices
03/04 04/05 05/06 06/07 07/08 08/09 09/10
Figure 65 – Normalised Maintenance Costs for lifts in 09/10 prices
412 The graphs above show the normalised maintenance costs per machine when
adjusted for the structural factors outlined above.
413 With the data normalised by taking into account the above factors it can be seen that
the range of costs for escalators for 2009/10 per machine is £59,000 to £84,000, a
reduced variance of £25,000. The normalised range of costs for lifts becomes £33,000
to £51,000, giving a reduced variance of £18,000. The JLE escalators are understood
to be cheaper to maintain compared to the non-JLE type escalators installed across
the LUL system, so this is likely to be one of the factors affecting the lower cost per
machine shown in the graph above. The impact of this will be evaluated as part of the
future drill down study.
414 The asset benchmarking analysis also examined a number of other structural factors,
including vertical rise, passenger flow and number of steps for escalators; and for lifts
age, vertical rise and the ratio of SMVT (Secondary Means of Vertical Transportation)
and PMVT (Primary Means of Vertical Transportation) machines. None of these other
factors were found to be statistically significant.
Areas for further investigation
415 The escalators across the LUL network vary in type, the most significant difference
being JLE type and non-JLE type machines. Similarly for lifts a number of different
types exist across the network, examples being traction lifts, hydraulic lifts and stair
lifts.
416 The maintenance costs for lifts and escalators consist of costs for preventative
maintenance, planned maintenance and inspections.
417 It is proposed to review the cost differences for lifts and escalator maintenance through
comparing costs across SSL, BCV and JNP. A review will be undertaken to
understand the best level of detail to compare the maintenance costs of lifts and
escalators, taking into account the different types of machines, and the costs of
planned and reactive maintenance for each. This review will also consider the
necessary level of granularity required in cost data to facilitate comparison at the
required level and the ability and benefits of collecting this data if not already available.
It is proposed that from this review the potential for suitable further efficiencies can be
considered.
APPENDIX A
Rail & Underground Asset Benchmarking Initial Report June 2011 Page 112 of 114
418 As part of preparations for the PPP Periodic Review a study was undertaken
comparing LUL‟s escalator strategy with other national and international metros. The
findings of this work will be used to further analyse and benchmark the maintenance
costs for escalators across LUL.
419 Subsequent to this review it is proposed to expand the analysis to capture data from
similar operational expenditure from within the TfL group, where appropriate, and to
identify suitable comparators externally to TfL, e.g. Network Rail. In line with this a
review is being initiated to benchmark lift costs by way of sharing data with the CoMET
and Nova metros to identify differences in costs and strategies.
420 The relationship between asset performance and maintenance costs needs to be
understood for lifts and escalators. Therefore one work stream will involve an
investigation to better understand and to review the relationship between varying
maintenance costs and the associated impacts on, and risk to, asset performance.
421 A drill down study is being undertaken to provide a better understanding of the
differences in unit rates and to identify further efficiency opportunities for lift
maintenance. This study is looking to understand the differences between BCV/SSL
and Tube Lines‟ actual and forecast unit rates, and to identify best practice on the
LUL/TLL network and recommend efficiency opportunities for implementation.
422 The study includes a review of maintenance activity costs, volumes and headcount,
including overheads and management costs, and the split between maintenance and
projects, to ensure that costs are treated in a similar way for comparison. The review
also analyses the costs for planned maintenance, reactive maintenance and
inspections and will identify the key differences for each and subsequent efficiency
opportunities, as well as a review of access arrangements and how these compare
across the three network areas in terms of usage, productivity and relationship to
costs.
423 The study will also attempt to identify and understand the relationship between asset
performance and maintenance costs and how asset performance is affected by asset
condition.
424 The lift drill down study also includes a comparison with other metros, through the
CoMET group, to identify good practices in maintenance and procurement as well as
further opportunities for efficiencies. So far six other metros have agreed to
participate.

APPENDIX A
Rail & Underground Asset Benchmarking Initial Report June 2011 Page 113 of 114

Rail & Underground Asset Benchmarking Initial Report June 2011 Page 114 of 114
APPENDIX B – CAPITAL PROJECTS BENCHMARK MEASURES (DRAFT)

Metric Name & LevelMetric
UoM
Metric
Data
Source
Metric Description Metric Purpose LU ComparatorLocal
Comparator
National
Comparator -
Rail
National
Comparator -
Infrastructure
Global Metro
Comparator
Core Level 1 Metrics: Internal
benchmark
Tube Lines,
DLR, London
Overground
Network RailBAA, Utilities,
etc
CoMET
Organisations
APPROACH TO PROJECT MANAGEMENT
Scale and Complexity of Project Delivery
Number of Personnel in Infrastructure Projects & Track
[Asset Mgmt] - P8nr PMO
provides the total count of internal personnel
(total nr from staff composition below) within
an organisation that are booking their costs
to projectsAnnual Investment Spend - P8 FYF (IP & Track Only) £ FINANCE Total forecast spend on the "live" projects
Gross OPEX Costs - P8 FYF (IP & Track only) £ PMO what it costs to emply the people in item 1
Administration of Projects (as a % of overall project
delivery cost)% PMO what this is a % of the overal cost
Current number of 'Live' projects (IP & Track Only) nr PMO total number of projects currently funded
Total Anticipated Final Cost of 'live' projects - 'Order
Book' (IP & Track Only)£ FINANCE estimated final cost of those projects
Number of Current Major Projects (>100m) nr FINANCE those projects that exceed £100m
Funding Arrangements n/a FINANCE an explanation of how projects are funded.
Approach to Project Management
Organisation Structure n/a PMO
Number of Management levels from CEO to Project
Manager (Band 3)n/a PMO
What is the most senior Project post in the
organisation, and how does this relate to the CEO?n/a PMO
Budget Responsibility n/a PMO
Project Methodology n/a PMO
Project Life Cycle n/a PMO
Authority Review Points (Stage Gates) n/a PMO
Project Control Cycle n/a PMO
Do you measure Project Maturity? If so, which model
do you use?n/a PMO
What is your current project maturity? n/a PMO
Workload Definition n/a PMO
Management of Change n/a PMO
Project Delivery Organisations formally recognised n/a PMO
Project Management Role formally recognised n/a PMO
Project Management Career path n/a PMO
Do you operate a Talent Management Programme? n/a PMO
Performance Incentivisation? n/a PMO
Competence Assessment n/a PMO
Corporate Affiliation with Project Management
Professional Bodyn/a PMO
Sponsor competence Assessed n/a PMO
Schedule Adherence (Index) n/a PMO
Project Management Systems
Finance n/a PMO
Risk n/a PMO
Planning n/a PMO
Project Performance Reporting n/a PMO
Change Management n/a PMO
Estimating n/a PMO
Staff Composition in Investment Projects Delivery
Teams & Asset Mgmt Delivery Teams (Track Only) -
(number in brackets refers to number of staff
associated with Track)
Admin & Support (incl. Legal) nrSAP /
PMO
Includes all staff working on projects involved
in adnministration, document control,
secretarial, PA etc.Commercial nr
SAP /
PMO
includes all commercial procurement staff
including commercial managers, cost
manager, quantity surveyorsConstruction & Site Management nr
SAP /
PMO
includes all staff managing the constructuion
works themselves from night supervisors to
construction managersHSEA nr
SAP /
PMOall HSE staff
Planning & Programme Controls nrSAP /
PMO
includes all planners, reporting and all other
PMO staff (excvl. PA's, secretaries, and doc
controllers)Project Engineering nr
SAP /
PMO
includes all those engineers suopervising or
managing engineering, including, Discipline
Engineers, senior management, Independent Project Management nr
SAP /
PMO
includes all grades of project management
from APM to programme manager.
Design Engineering nrSAP /
PMO
includes those engineers actually
undertaking design
Displaced nrSAP /
PMO
includes those currently in a pool, waiting to
be reassigned
Risk & Value nrSAP /
PMO
includes all risk management & value
management
Graduates nrSAP /
PMO
includes those graduates on the PM
Graduate Scheme
Geographical spread of PM staff - No of IP Locations nr PMOshows the geographical sprwead of staff if
greater than one city
Quality Index - % of projects against which Technical
Non-Compliances have been raised% ? ?
PROJECT PERFORMANCE
Functional Area - Project Controls & Finance
Annual Capital Investment forecast Accuracy % SAPP1 forecast Annual spend v's P13 Actual
spend
Shows our ability to accurately estimate our work
rate and its cost, thereby improving cashflow
forecasts
Average Annual CPI Nr MPD The average score over the yearExplains how good we are are forecasting what
our work will cost in a given period of time
Average Annual SPI Nr MPD The average score over the yearExplains how good we are are forecasting how
long our work will take for a given amount of cost
Average variance EFC v Original Authority % SAP
The % variance between the actual final
costs and original EFC for those projects
completed within the financial year
Explains our ability to accurately estimate the total
costs of projects
Annual Risk Utilisation as a % of Forecast % SAP
The % of risk we used in the year (P13
actual) based on the total we forcast to need
in P1
Explains our ability to accurately forecasts the
amount of risk money required and our ability to
mitigate risks
Annual Contingency Utilisation as a % of Forecast % SAP
The % of contingency we used in the year
(P13 actual) based on the total we forcast to
need in P1
Explains our ability to forecast prime costs and the
amount of change we have on a project
To obtain a broad view of the size and scale of
comparable organisations. The data is part of a
Client Forum established by Network Rails and
includes 5 large infrastructure companies who all
undertake their own in-house project management
and have a desire/need to learn, benchmark and
understand what each other does. it is not the
intention to make direct quantitative comparisons
with the data but more to lead to further
investigation and study around the "Approach to
Project Management" that each organisation
takes.
Which computer systems are used to
support the project management oprocess
across the business
To obtain a broad view of the size and scale of
comparable organisations. The data is part of a
Client Forum established by Network Rails and
includes 5 large infrastructure companies who all
undertake their own in-house project management
and have a desire/need to learn, benchmark and
understand what each other does. it is not the
intention to make direct quantitative comparisons
with the data but more to lead to further
investigation and study around the "Approach to
Project Management" that each organisation
takes.
A selection of questions that explore how an
organisation structures itself, in terms of
people and processes, to deliver the work
described in the scale and complexity section

Metric Name & LevelMetric
UoM
Metric
Data
Source
Metric Description Metric Purpose LU ComparatorLocal
Comparator
National
Comparator -
Rail
National
Comparator -
Infrastructure
Global Metro
Comparator
Core Level 1 Metrics: Internal
benchmark
Tube Lines,
DLR, London
Overground
Network RailBAA, Utilities,
etc
CoMET
Organisations
Milestones Achieved v Milestones forecast Nr MPDA % of completed milestones against
forecast to be complete between P1 and P13
Explains our ability to accurately forecast and
manage delivery of our workload
Functional Area - Commercial Procurement
Total Number of Contracts Awarded on time Nr S&CTotal number of contracts actually awarded
by P13 aganist forecast at P1
A measure of our ability to manage the
procurement process, the clarity of our documents
and supply chains ability to meet our bid
timescales
Total No and value of notified disputes Nr S&C Taken as an annual average
Its a measure of clarity and cohesion of our
contract documentation (including terms, scopes,
specifications and standards)
Total value of Variations as a % of total contract let
value% S&C
the value of variations as a percentage of the
value of contracts let.
The amount of change that goes on during a
project, not necessarily client scope change
Functional Area - HSE
RIDDOR Lost Time Injury (LTI) Frequency Rate (Over-
3-day Lost Time Injuries)Nr SQE Total LTIs in year at end of period 13
Major Injury Frequency Rate Nr SQE Total Major Injuries in year at end of period
13Fatality Frequency Rate Nr SQE Total Fatalities in year at end of period 13
ASSET UNIT COST DATA
Asset Specific Costs - TRACK
Ballast Track Renewal m RIB See RIB for detail Asset Unit Cost data for project budget estimating
Ballast + Formation Renewal m RIB See RIB for detail Asset Unit Cost data for project budget estimating
Re-rail + Ballast + Formation Renewal m RIB See RIB for detail Asset Unit Cost data for project budget estimating
Re-Railing m RIB See RIB for detail Asset Unit Cost data for project budget estimating
Re-Railing + Re-sleeper m RIB See RIB for detail Asset Unit Cost data for project budget estimating
Re-Railing + Re-ballast m RIB See RIB for detail Asset Unit Cost data for project budget estimating
Re-ballast m RIB See RIB for detail Asset Unit Cost data for project budget estimating
Deep Track Renewal - Rail, sleeper, slab m RIB See RIB for detail Asset Unit Cost data for project budget estimating
DTR - Rail & Sleeper Pop m RIB See RIB for detail Asset Unit Cost data for project budget estimating
Check Rail m RIB See RIB for detail Asset Unit Cost data for project budget estimating
Pit Block m RIB See RIB for detail Asset Unit Cost data for project budget estimating
Track Drainage m RIB See RIB for detail Asset Unit Cost data for project budget estimating
Conductor Rail m RIB See RIB for detail Asset Unit Cost data for project budget estimating
Points & Crossings Nr RIB See RIB for detail Asset Unit Cost data for project budget estimating
Asset Specific Costs - PROPERTY
Station Enhancement m2 RIB See RIB for detail Asset Unit Cost data for project budget estimating
Station Refurbishment m2 RIB See RIB for detail Asset Unit Cost data for project budget estimating
Depot m2 RIB See RIB for detail Asset Unit Cost data for project budget estimating
Commercial Property m2 RIB See RIB for detail Asset Unit Cost data for project budget estimating
Train Crew Accommodation m2 RIB See RIB for detail Asset Unit Cost data for project budget estimating
Lifts & Escalators £/nr RIB See RIB for detail Asset Unit Cost data for project budget estimating
Fire Systems m2 RIB See RIB for detail Asset Unit Cost data for project budget estimating
Fare Collection nr RIB See RIB for detail Asset Unit Cost data for project budget estimating
Lineside Buildings m2 RIB See RIB for detail Asset Unit Cost data for project budget estimating
Control Centre m2 RIB See RIB for detail Asset Unit Cost data for project budget estimating
Asset Specific Costs - POWER
11kV Substation nr RIB See RIB for detail Asset Unit Cost data for project budget estimating
22kV Substation nr RIB See RIB for detail Asset Unit Cost data for project budget estimating
11kV AC Switchboard nr RIB See RIB for detail Asset Unit Cost data for project budget estimating
22kV AC Switchboard nr RIB See RIB for detail Asset Unit Cost data for project budget estimating
2.5 MW Transformer Rectifier nr RIB See RIB for detail Asset Unit Cost data for project budget estimating
Earthing / Auxiliary Transformer nr RIB See RIB for detail Asset Unit Cost data for project budget estimating
LVAC Switchboard nr RIB See RIB for detail Asset Unit Cost data for project budget estimating
750 DC Switchboard nr RIB See RIB for detail Asset Unit Cost data for project budget estimating
11 KVa Feeder Cable m RIB See RIB for detail Asset Unit Cost data for project budget estimating
22 KVa Feeder Cable m RIB See RIB for detail Asset Unit Cost data for project budget estimating
Signalling Supply Point nr RIB See RIB for detail Asset Unit Cost data for project budget estimating
Asset Specific Costs - CIVILS & STRUCTURE
Foot Bridge m2 deckRIB See RIB for detail Asset Unit Cost data for project budget estimating
Overbridge m2 deckRIB See RIB for detail Asset Unit Cost data for project budget estimating
Covered Way m2 deckRIB See RIB for detail Asset Unit Cost data for project budget estimating
Underbridge m2 deckRIB See RIB for detail Asset Unit Cost data for project budget estimating
Viaduct m2 deckRIB See RIB for detail Asset Unit Cost data for project budget estimating
Cutting m RIB See RIB for detail Asset Unit Cost data for project budget estimating
Embankment m RIB See RIB for detail Asset Unit Cost data for project budget estimating
Retaining Wall m RIB See RIB for detail Asset Unit Cost data for project budget estimating
Drainage m RIB See RIB for detail Asset Unit Cost data for project budget estimating
Station Drainage nr RIB See RIB for detail Asset Unit Cost data for project budget estimating
Miscellaneous Structures nr RIB See RIB for detail Asset Unit Cost data for project budget estimating
Fencing / Barriers m RIB See RIB for detail Asset Unit Cost data for project budget estimating
Spiral Staircases nr RIB See RIB for detail Asset Unit Cost data for project budget estimating
Tunnels & Shafts - new build m RIB See RIB for detail Asset Unit Cost data for project budget estimating
Tunnels & Shafts - refurbishment m RIB See RIB for detail Asset Unit Cost data for project budget estimating
Asset Specific Costs - SIGNALLING
Conventional Resignalling SEU RIB See RIB for detail Asset Unit Cost data for project budget estimating
ATC Resignalling SEU RIB See RIB for detail Asset Unit Cost data for project budget estimating
Controls SEU RIB See RIB for detail Asset Unit Cost data for project budget estimating
Interlockings SEU RIB See RIB for detail Asset Unit Cost data for project budget estimating
Trackside Equipment SEU RIB See RIB for detail Asset Unit Cost data for project budget estimating
Minor Works SEU RIB See RIB for detail Asset Unit Cost data for project budget estimating
Asset Specific Costs - COMMUNICATIONS
CCTV Systems RIB See RIB for detail Asset Unit Cost data for project budget estimating
PA Systems RIB See RIB for detail Asset Unit Cost data for project budget estimating
Security Systems RIB See RIB for detail Asset Unit Cost data for project budget estimating
Op Information Systems RIB See RIB for detail Asset Unit Cost data for project budget estimating
Telecommunications RIB See RIB for detail Asset Unit Cost data for project budget estimating
Asset Specific Costs - ROLLING STOCK
Passenger Rolling Stock RIB See RIB for detail Asset Unit Cost data for project budget estimating
Engineering Rolling Stock RIB See RIB for detail Asset Unit Cost data for project budget estimating
To measure accident and injury frequency rates