2844 lst report (rev4)
TRANSCRIPT

APPENDIX B-2LST ANALYSIS

This page intentionally left blank.
Tesoro Refining & Marketing Company LLC Los Angeles Refinery Integration and Compliance Project Revised SCAQMD Localized Significance Threshold Analysis February 5, 2016 Prepared for: Tesoro Refining & Marketing Company LLC
By: Environmental Audit, Inc. 1000-A Ortega Way Placentia, CA 92870 714-632-8521
Appendix B-2
B-2-1

This page intentionally left blank.
Appendix B-2
B-2-2

Tesoro Refining & Marketing Company LLC Los Angeles Refinery Integration and Compliance Project Revised SCAQMD Localized Significance Threshold Analysis
1
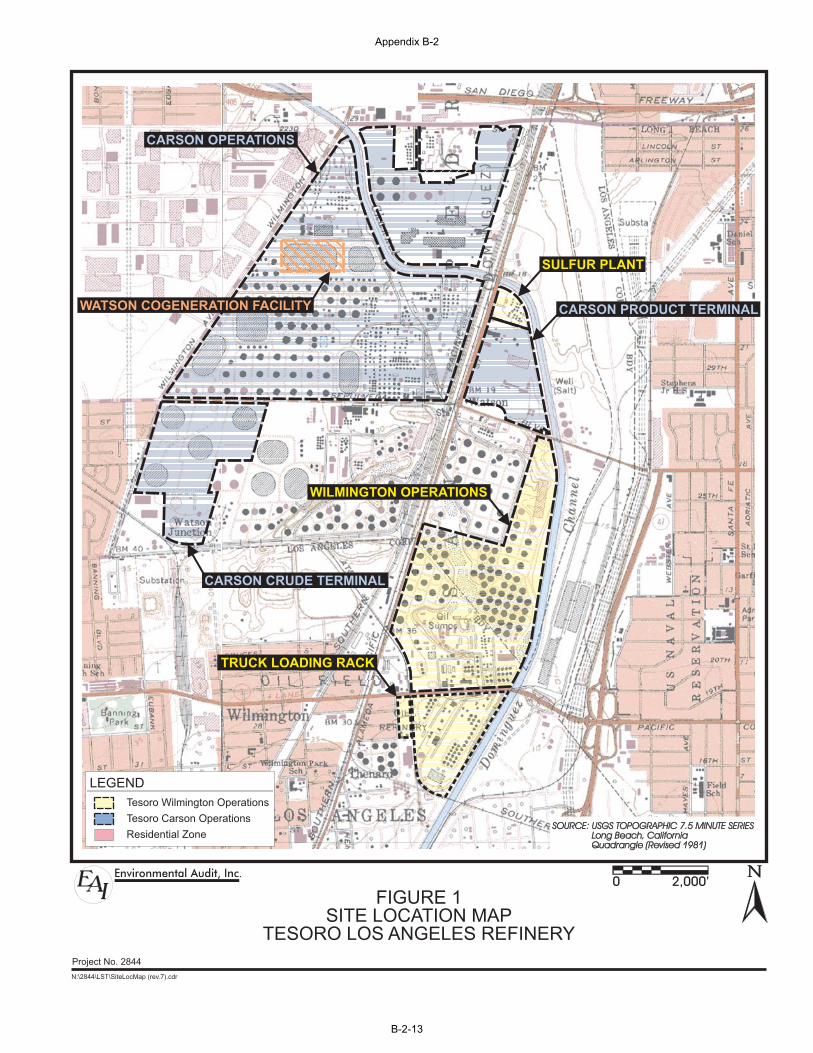
INTRODUCTION This Localized Significance Threshold (LST) analysis has been prepared to evaluate the potential impacts of the criteria pollutants carbon monoxide (CO), nitrogen dioxide (NO2), particulate matter less than 10 microns in diameter (PM10), and particulate matter less than 2.5 microns in diameter (PM2.5) emitted by the construction activities associated with the proposed Tesoro Refining & Marketing Company LLC Los Angeles Refinery (Refinery) Integration and Compliance (I&C) Project. In June 2013, Tesoro purchased the adjacent BP West Coast Products LLC (BP) Carson Refinery, which, as part of the proposed project will be more fully integrated with the Tesoro Los Angeles Refinery – Wilmington Operations to form the Tesoro Los Angeles Refinery (Refinery). The proposed project will be designed to better integrate the Wilmington Operations and Carson Operations. In addition to further Refinery integration, the proposed project will be designed to comply with the federally mandated Tier 3 gasoline specifications and with State and local regulations mandating emission reductions. The Refinery I&C Project is expected to shut down the Fluid Catalytic Cracking Unit (FCCU) at the Wilmington Operations and reconfigure the combined Refinery complex. Additionally, heat recovery will be optimized by installing new heat exchangers and modifying specified units to further minimize GHG and other emissions. Facilities will be added to remove impurities such as sulfur, nitrogen compounds, and organic acids from distillates. The modifications will be designed so that the combined Refinery operates within the existing capacity of the Sulfur Recovery Plants (SRPs). There will be no modifications at any of the marine terminals associated with the Tesoro Los Angeles Refinery. As part of the proposed project, Environmental Audit, Inc. (EAI) has calculated construction emissions to evaluate the potential impacts from construction activities associated with the proposed project. Based on information provided by Tesoro, the LST analysis includes a a modeled analysis of the criteria pollutants for the peak daily emissions from the I&C Project. The results of this analysis are provided below. FACILITY LOCATION The proposed project will occur at both the Wilmington and Carson Operations of the Tesoro Los Angeles Refinery (see Figure 1). Tesoro will more fully integrate the recently purchased adjacent BP Carson Refinery (referred to as the Carson Operations) with the existing Wilmington Operations, to become a more efficient single entity owned and operated by Tesoro. The Refinery will be comprised of approximately 950 contiguous acres in size and operate within the Cities of Los Angeles (Wilmington District) and Carson, California. The Wilmington Operations are located within Wilmington, a community under the jurisdiction of the City of Los Angeles, at 2101 East Pacific Coast Highway, Wilmington, Los Angeles County, California 90744. The Carson Operations are located at 2350 East 223rd Street, Carson, California, 90745. Both new and modified equipment, as well as connecting piping, will be located within
Appendix B-2
B-2-3

Tesoro Refining & Marketing Company LLC Los Angeles Refinery Integration and Compliance Project SCAQMD Localized Significance Threshold Analysis
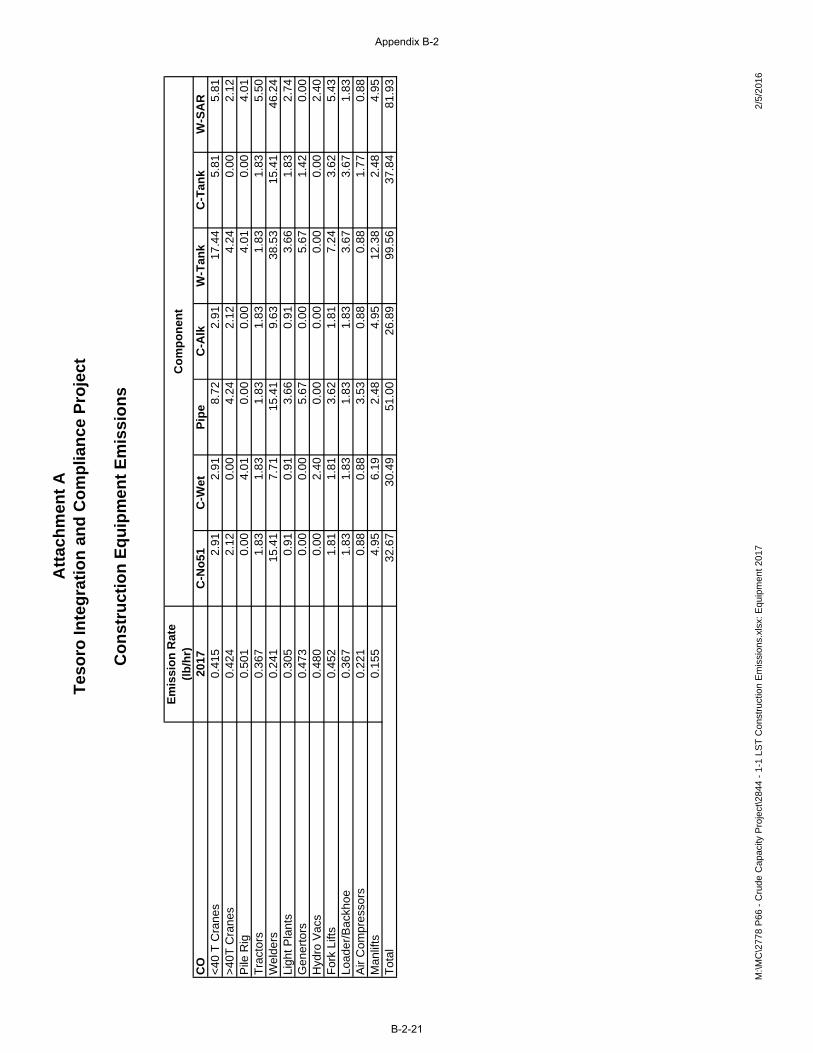
portions of the Refinery under both the City of Carson jurisdiction and the City of Los Angeles jurisdiction. The Wilmington Operations are bounded to the north by Sepulveda Boulevard (as well as other tank farms and refinery activities), to the west by Alameda Street (as well as the Alameda Corridor and other tank farms), to the south by railroad tracks (as well as tank farms and metal recycling/scrap yards), and to the east by the Dominguez Channel (as well as other tank farms and rail yard activities). The Wilmington Operations are bisected by Pacific Coast Highway, with the larger portion of the Wilmington Operations to the north of Pacific Coast Highway and the smaller portion to the south. The closest residential area to the Wilmington Operations is about 200 feet southwest of the Truck Loading Rack. The Carson Operations are bounded by Wilmington Avenue to the west, 223rd Avenue to the north, Alameda Street to the east, and Sepulveda Boulevard to the south. The Dominguez Channel flows through the Carson Operations, dividing the property into two sections: Northeastern and Southern. Several industrial/commercial facilities and the 405 Freeway border the Carson Operations to the north. The Alameda Corridor and other industrial facilities, including the Tesoro Coke Barn, the Air Products Hydrogen Plant, and the Tesoro Sulfur Recovery Plant, are located to the east of the Carson Operations. Commercial and residential areas are located to the west of the Carson Operations. The Phillips 66 Refinery and tank farms occupy the area located to the south of the Carson Operations. The Carson Operations and all adjacent facilities and properties are zoned manufacturing heavy (MH) according to the City of Carson’s Land Use element of its General Plan. The closest residential area to the Carson Operations is approximately 250 feet southwest of the Refinery on the southwest corner of the Sepulveda Boulevard/Wilmington Avenue intersection. Additionally, the SRP (considered to be a portion of the Wilmington Operations) is located at 23208 South Alameda Street in the City of Carson (see Figure 1). The SRP is zoned MH according to the City of Carson’s Land Use element of its General Plan. Adjacent land uses to the SRP also are heavy industrial and include other refineries, a hydrogen plant, undeveloped lots, and container storage areas. EMISSION ESTIMATES Construction emission estimates for the peak day are calculated by each project component that will be under construction during that peak period for the proposed project. A summary of construction emissions is found on Table 1. More detailed construction emissions can be found in Attachment 1. Construction emissions vary based on activities and the worst-case scenario has been evaluated. It is expected that the calculated peak day emissions estimates will occur infrequently during the proposed project construction activities and, most of the time, construction emissions will be less.
Appendix B-2
B-2-4

Tesoro Refining & Marketing Company LLC Los Angeles Refinery Integration and Compliance Project SCAQMD Localized Significance Threshold Analysis
Based on information provided by Tesoro, construction activities by month for the proposed project are calculated to determine the peak construction day. Only on-site emissions sources are included, and though equipment (such as cranes) would be shared between project components, no equipment sharing was assumed for this LST analysis. The peak on-site construction day for most project components is spread over 12 hours and is expected to occur during Month 20. Project components that would be in turnaround (hydrotreating unit) are based on two shifts which cover 24 hours of construction. Construction activities included in this evaluation are the use of construction equipment and fugitive dust emissions from earth moving activities. CRITERIA POLLUTANT IMPACT MODELING In order to determine the groundlevel concentrations, the U.S. EPA AERMOD air dispersion model was used to model the peak day construction emissions (see Table 1) and calculate the annual average and maximum 1-hour, 8-hour, and 24-hour concentrations. NO2 emissions were estimated using the U.S. EPA recommended ambient ratio method (ARM), which converts NOx to NO2 based on a fixed ratio (U.S EPA, 2014). The location of the source is identified based on data provided by Tesoro and the Long Beach USGS Quadrangle (see Figure 2). The model is run using the Long Beach meteorological data available from the SCAQMD. The dispersion model was run using regulatory defaults. The model is not set to include algorithms to model the effects of building downwash on emissions since area sources are not influenced by building downwash. Terrain elevations are taken into account even though the facility and the vicinity are in a relatively flat area. The AERMOD model is run using a coarse receptor grid of 500 meters, that extends at least 1,000 meters in every cardinal direction from the boundaries of the Refinery, and a fine receptor grid of 100 meters in the residential area most affected by the construction emissions (see Figure 2). The maximum impact location is determined for the applicable averaging periods from the AERMOD model output. The maximum groundlevel concentration and the Universal Tranverse Mercator (NAD 83) coordinates for each maximum impact point at a sensitive receptor are presented in Table 2. MODELED CRITERIA POLLUTANT IMPACT ANALYSIS The proposed project maximum groundlevel concentrations are compared to the localized significance thresholds to demonstrate that if the project would cause or contribute to a violation of any state ambient air quality standard. The ambient air quality data for South Coastal Los Angeles County (Station No. 033 and 077) is used to establish background levels of the pollutants. Table 3 identifies the ambient air quality data for CO, NO2, PM10, and PM2.5 published by the SCAQMD in the last three years (2012, 2013, and 2014), as well as federal NO2 ambient background concentration data published by SCAQMD.
Appendix B-2
B-2-5

Tesoro Refining & Marketing Company LLC Los Angeles Refinery Integration and Compliance Project SCAQMD Localized Significance Threshold Analysis
The CO and NO2 concentrations are combined with the ambient background concentrations and compared to the Most Stringent Air Quality Standard. The PM10 and PM2.5 24-hour, and PM10 and PM2.5 annual average concentrations are compared to the Significant Change in Air Quality Concentration thresholds. Impacts from other criteria pollutants are regional in nature or in attainment and, therefore, are not included as part of the localized air quality analysis. The maximum impact locations are shown in Figure 2. State Standards The maximum CO impact concentrations for 1-hour and 8-hour averages are 8,221.1 and 4,967.4 micrograms per cubic meter (μg/m3), respectively. The maximum NO2 impact concentrations for 1-hour and annual averages are 455.9 and 52.7 μg/m3, respectively. The maximum PM10 impact concentrations for 24-hour and annual averages are 3.5 and 0.9 μg/m3, respectively. The maximum PM2.5 impact concentrations for 24-hour and annual averages are 3.5 and 0.9 μg/m3, respectively. Therefore, the proposed project modeling results only exceed State criteria pollutant significance thresholds for 1-hour NO2. The results are presented in Table 4. Federal Standards The maximum CO impact concentrations for 1-hour and 8-hour averages are 8,221.1 and 4,967.4 μg/m3, respectively. The maximum NO2 impact concentrations for 1-hour and annual averages are 302.8 and 52.7 μg/m3, respectively. The maximum PM10 impact concentrations for 24-hour and annual averages are 3.5 and 0.9 μg/m3, respectively. The maximum PM2.5 impact concentrations for 24-hour and annual averages are 3.5 and 0.9 μg/m3, respectively. Therefore, the proposed project modeling results only exceed Federal criteria pollutant significance thresholds for 1-hour NO2. The results are presented in Table 4. CONCLUSIONS The emissions for the proposed project results in a significant change air quality and exceedances of both state and federal air quality standards for 1-hour NO2 during the peak on-site construction. The emissions for the proposed project do not results in a significant change air quality for CO, annual NO2, or PM emission during the construction phase. M:\MC\2844 Tesoro - Synergy\Construction\LST\2844 LST Report (rev4).doc
Appendix B-2
B-2-6

TABLES
Appendix B-2
B-2-7

This page intentionally left blank.
Appendix B-2
B-2-8

Tabl
e 1.
Ons
ite C
onst
ruct
ion
Emis
sion
Sum
mar
y
33.8
430
.81
30.4
430
.44
29.3
111
2.84
38.4
279
.11
155.
19P
M10
(lb/
day)
2.12
1.76
1.86
1.86
1.72
6.68
2.54
5.38
8.44
2.07
1.73
1.82
1.82
1.68
6.55
2.49
5.27
8.27
Emis
sion
from
Trip
s - O
nsite
C-N
o51
C-W
etPi
pe1
Pipe
2C
-Al k
W-T
ank
C-T
ank
W-S
AR
TAR
-WH
TUC
O (l
b/da
y)0.
100.
100.
160.
160.
080.
090.
120.
180.
12N
Ox
(lb/d
ay)
0.11
0.11
0.09
0.09
0.11
0.11
0.11
0.14
0.13
PM
10 (l
b/da
y)0.
040.
040.
040.
040.
040.
040.
040.
060.
05
Exh
uast
PM
(lb/
day)
0.01
0.01
0.01
0.01
0.01
0.01
0.01
0.01
0.01
F
ugiti
ve P
M (l
b/da
y)0.
030.
030.
030.
030.
030.
030.
030.
050.
040.
010.
010.
010.
010.
010.
010.
010.
020.
02
Exh
uast
PM
(lb/
day)
0.01
0.01
0.01
0.01
0.01
0.01
0.01
0.01
0.01
F
ugiti
ve P
M (l
b/da
y)0.
010.
010.
010.
010.
010.
010.
010.
010.
01
Fugi
tive
Eart
hmov
ing
PM -
Peak
C-N
o51
C-W
etPi
pe1
Pipe
2C
-Alk
W-T
ank
C-T
ank
W-S
AR
TAR
-WH
TU0.
002.
362.
362.
360.
002.
362.
360.
000.
000.
001.
371.
371.
370.
001.
371.
370.
000.
00
Offr
oad
Fugi
tive
PM -
Peak
C-N
o51
C-W
etPi
pe1
Pipe
2C
-Al k
W-T
ank
C-T
ank
W-S
AR
TAR
-WH
TU0.
000.
000.
370.
370.
000.
000.
000.
740.
000.
000.
000.
080.
080.
000.
000.
000.
160.
00
Tota
l Em
issi
ons
Thre
shol
dsC
-No5
1C
-Wet
Pipe
1Pi
pe2
C-A
l kW
-Tan
kC
-Tan
kW
-SA
RTA
R-W
HTU
CO
(lb/
day)
550
32.7
730
.59
25.6
725
.67
26.9
799
.65
37.9
582
.11
114.
37N
Ox
(lb/d
ay)
100
33.9
530
.92
30.5
330
.53
29.4
211
2.95
38.5
379
.25
155.
32P
M10
(lb/
day)
(2)
150
2.16
4.17
4.63
4.63
1.76
9.08
4.94
6.17
8.49
PM
2.5
(lb/d
ay)(1
)(2)
552.
093.
113.
293.
291.
707.
933.
875.
448.
29C
O (l
b/hr
)N
A3.
283.
062.
572.
572.
709.
963.
808.
215.
72N
Ox
(lb/h
r)N
A3.
393.
093.
053.
052.
9411
.29
3.85
7.93
7.77
PM
10 (l
b/hr
)(2)
NA
0.22
0.42
0.46
0.46
0.18
0.91
0.49
0.62
0.42
PM
2.5
(lb/h
r)(1)(
2)N
A0.
210.
310.
330.
330.
170.
790.
390.
540.
41(1
) http
s://w
ww
.aqm
d.go
v/ce
qa/h
andb
ook/
PM
2_5/
pm2_
5rat
io.x
ls(2
) Miti
gate
d P
M.
2017
- M
onth
20
Teso
ro In
tegr
atio
n an
d C
ompl
ianc
e Pr
ojec
tLo
caliz
ed S
igni
fican
ce T
hres
hold
Ana
lysi
s
PM
2.5
(lb/d
ay)(1
)
2017
- M
onth
20
PM
2.5
(lb/d
ay)(1
)
2017
- M
onth
20
PM
10 (l
b/da
y)(2
)
PM
2.5
(lb/d
ay)(1
)(2)
2017
- M
onth
20
PM
10 (l
b/da
y)(2
)
PM
2.5
(lb/d
ay)(1
)(2)
2017
- M
onth
20
M:\MC\28
44 Tesoro ‐ Synergy\Con
struction\LST\28
44 ‐ LST Re
port Tables (rev4).xlsx
: Peak Em
issions
Appendix B-2
B-2-9

Table 2. Modeling ResultsCriteria Pollutant
Averaging Period
Max (μg/m3)
UTME UTMN
1‐hr 291.38 385250 37395038‐hr 58.46 385250 37395031‐hr 200.43 385250 3739503
1‐hr (98%) 156.51 385250 3739503Annual 4.99 385250 373950324‐hr 3.46 385250 3739503Annual 0.86 384900 374000024‐hr 3.46 385250 3739503Annual 0.86 384900 3740000
Model results based on the last 5 years of available meterological data from SCAQMD for Long Beach.
Assumes PM2.5 is 100% of PM10.
Table 3. Ambient Concentrations
2012 2013 2014 (ppm) (μg/m3)CO 1‐hr 4.2 4.1 3.7 4.2 7929.8
8‐hr 2.6 2.6 2.6 2.6 4908.9
NO2 1‐hr 0.0978 0.0813 0.1359 0.1359 255.51‐hr (98%) 0.0774 0.0713 0.0848 0.0778 146.3
AAM 0.0253 0.0215 0.0207 0.0253 47.7
PM10 24‐hr 54 54 59 59.0AAM 25.5 27.3 26.6 27.3
PM2.5 24‐hr 46.7 42.9 59 59.0AAM 10.57 10.97 26.6 26.6
Data from South Coastal LA County Station number 33 and 77. Missing PM2.5 substituted with PM10.
AAM = Annual Arithmetic Mean
Table 4. Localized Significance Threshold Summary
Criteria Pollutant
Averaging Period
Max Modeled GLC Conc. (μg/m3)
Background GLC Conc. (μg/m3)
Total GLC Conc. (μg/m3)
Most Stringent Air
Quality Standard (μg/m3)
Significant
1‐hour 291.38 7929.8 8221.1 23000 NO8‐hour 58.46 4908.9 4967.4 10000 NO1‐hour 200.43 255.5 455.9 339 YES1‐hour (Federal)
156.51 146.30 302.8 188 YES
Annual 4.99 47.7 52.7 57 NO24‐hour 3.46 ‐‐ ‐‐ 10.4 NOAnnual 0.86 ‐‐ ‐‐ 1 NO24‐hour 3.46 ‐‐ ‐‐ 10.4 NOAnnual 0.86 ‐‐ ‐‐ 1 NO
PM2.5
Tesoro Integration and Compliance ProjectLocalized Significance Threshold Analysis
NO2
PM10
Criteria Pollutant
Averaging Period
PM2.5
NO2
PM10
Concentration (ppm) Max Conc.
Concentration (μg/m3)
CO
CO
Appendix B-2
B-2-10

FIGURE
Appendix B-2
B-2-11

This page intentionally left blank.
Appendix B-2
B-2-12
Project No. 2844
N:\2844\LST\SiteLocMap (rev.7).cdr
0 2,000’
SOURCE: USGS TOPOGRAPHIC 7.5 MINUTE SERIESLong Beach, CaliforniaQuadrangle (Revised 1981)
SOURCE: USGS TOPOGRAPHIC 7.5 MINUTE SERIESLong Beach, CaliforniaQuadrangle (Revised 1981)
FIGURE 1SITE LOCATION MAP
TESORO LOS ANGELES REFINERY
Residential Zone
LEGEND
WILMINGTON OPERATIONS
SULFUR PLANT
CARSON OPERATIONS
Tesoro Wilmington Operations
Tesoro Carson Operations
CARSON CRUDE TERMINAL
CARSON PRODUCT TERMINAL
TRUCK LOADING RACK
WATSON COGENERATION FACILITY
Appendix B-2
B-2-13

Project No. 2844
N:\2844\LST\Max Impacts (rev.1).cdr
FIGURE 2LST MAXIMUM IMPACT LOCATION MAP
TESORO LOS ANGELES REFINERY
EXPLANATIONSOURCES
MAXIMUM IMPACT LOCATIONSOURCE: Google (03/23/15)
1-hr, 8-hr CO1-hr, 1-hr (98%), Annual NO2
24-hr PM1024-hr PM2.5
Annual PM10Annual PM2.5
MODELED RECEPTORS
Appendix B-2
B-2-14

ATTACHMENT APEAK EMISSION CALCULATIONS
Appendix B-2
B-2-15

This page intentionally left blank.
Appendix B-2
B-2-16

Emis
sion
s fr
om E
quip
men
tC
-No5
1C
-Wet
Pipe
1Pi
pe2
C-A
lkW
-Tan
kC
-Tan
kW
-SA
RTA
R-W
HTU
VO
C (l
b/da
y)3.
933.
003.
223.
223.
0711
.83
4.54
10.1
813
.93
CO
(lb/
day)
32.6
730
.49
25.5
025
.50
26.8
999
.56
37.8
481
.93
114.
25N
Ox
(lb/d
ay)
33.8
430
.81
30.4
430
.44
29.3
111
2.84
38.4
279
.11
155.
19S
Ox
(lb/d
ay)
0.07
0.08
0.06
0.06
0.06
0.24
0.08
0.18
0.31
PM
10 (l
b/da
y)2.
121.
761.
861.
861.
726.
682.
545.
388.
442.
071.
731.
821.
821.
686.
552.
495.
278.
27C
O2 (
lb/d
ay)
1.79
1.88
1.43
1.43
1.56
5.82
1.91
4.22
7.41
Emis
sion
from
Trip
s - O
nsite
C-N
o51
C-W
etPi
pe1
Pipe
2C
-Alk
W-T
ank
C-T
ank
W-S
AR
TAR
-WH
TUC
O (l
b/da
y)0.
100.
100.
160.
160.
080.
090.
120.
180.
12N
Ox
(lb/d
ay)
0.11
0.11
0.09
0.09
0.11
0.11
0.11
0.14
0.13
SO
x (lb
/day
)0.
000.
000.
000.
000.
000.
000.
000.
000.
00P
M10
(lb/
day)
0.04
0.04
0.04
0.04
0.04
0.04
0.04
0.06
0.05
E
xhua
st P
M (l
b/da
y)0.
010.
010.
010.
010.
010.
010.
010.
010.
01
Fug
itive
PM
(lb/
day)
0.03
0.03
0.03
0.03
0.03
0.03
0.03
0.05
0.04
0.01
0.01
0.01
0.01
0.01
0.01
0.01
0.02
0.02
E
xhua
st P
M (l
b/da
y)0.
010.
010.
010.
010.
010.
010.
010.
010.
01
Fug
itive
PM
(lb/
day)
0.01
0.01
0.01
0.01
0.01
0.01
0.01
0.01
0.01
Fugi
tive
Eart
hmov
ing
PM -
Peak
C-N
o51
C-W
etPi
pe1
Pipe
2C
-Al k
W-T
ank
C-T
ank
W-S
AR
TAR
-WH
TU2.
362.
362.
362.
362.
361.
371.
371.
371.
371.
37
Offr
oad
Fugi
tive
PM -
Peak
C-N
o51
C-W
etPi
pe1
Pipe
2C
-Al k
W-T
ank
C-T
ank
W-S
AR
TAR
-WH
TU0.
370.
370.
740.
080.
080.
16
Tota
l Em
issi
ons
Thre
shol
dsC
-No5
1C
-Wet
Pipe
1Pi
pe2
C-A
l kW
-Tan
kC
-Tan
kW
-SA
RTA
R-W
HTU
CO
(lb/
day)
550
32.7
730
.59
25.6
725
.67
26.9
799
.65
37.9
582
.11
114.
37N
Ox
(lb/d
ay)
100
33.9
530
.92
30.5
330
.53
29.4
211
2.95
38.5
379
.25
155.
32S
Ox
(lb/d
ay)
150
0.07
0.08
0.06
0.06
0.07
0.24
0.08
0.18
0.31
PM
10 (l
b/da
y)(2
)15
02.
164.
174.
634.
631.
769.
084.
946.
178.
49P
M2.
5 (lb
/day
)(1)(
2)55
2.09
3.11
3.29
3.29
1.70
7.93
3.87
5.44
8.29
CO
(lb/
hr)
NA
3.28
3.06
2.57
2.57
2.70
9.96
3.80
8.21
5.72
NO
x (lb
/hr)
NA
3.39
3.09
3.05
3.05
2.94
11.2
93.
857.
937.
77S
Ox
(lb/h
r)N
A0.
010.
010.
010.
010.
010.
020.
010.
020.
02P
M10
(lb/
hr)(2
)N
A0.
220.
420.
460.
460.
180.
910.
490.
620.
42P
M2.
5 (lb
/hr)(1
)(2)
NA
0.21
0.31
0.33
0.33
0.17
0.79
0.39
0.54
0.41
(1) h
ttps:
//ww
w.a
qmd.
gov/
ceqa
/han
dboo
k/P
M2_
5/pm
2_5r
atio
.xls
(2) M
itiga
ted
PM
.
Atta
chm
ent A
Teso
ro In
tegr
atio
n an
d C
ompl
ianc
e Pr
ojec
tPe
ak P
roje
ct C
ompo
nent
Con
stru
ctio
n Em
issi
on S
umm
ary
PM
10 (l
b/da
y)(2
)
PM
2.5
(lb/d
ay)(1
)(2)
Com
pone
nt
Com
pone
nt
PM
2.5
(lb/d
ay)(1
)(2)
PM
10 (l
b/da
y)(2
)
Com
pone
nt
Com
pone
nt
Com
pone
nt
PM
2.5
(lb/d
ay)(1
)
PM
2.5
(lb/d
ay)(1
)
M:\M
C\2
778
P66
- C
rude
Cap
acity
Pro
ject
\284
4 - 1
-1 L
ST
Con
stru
ctio
n E
mis
sion
s.xl
sx: T
otal
Em
issi
ons
2/5/
2016
Appendix B-2
B-2-17

Equi
pmen
tC
-No5
1C
-Wet
Pipe
C-A
lkW
-Tan
kC
-Tan
kW
-SA
RTA
R-W
HTU
<40
T C
rane
s1
13
0.75
62
22
>40T
Cra
nes
12
0.75
21
2P
ile R
ig0.
10.
51
Trac
tors
0.5
0.5
10.
21
13
0.5
Wel
ders
84
85
208
243
Ligh
t Pla
nts
0.5
14
14
23
1G
ener
tors
04
41
1H
ydro
Vac
s0.
250.
5Fo
rk L
ifts
0.75
12
14
23
0.5
Load
er/B
ackh
oe0.
10.
21
0.2
22
10.
2A
ir C
ompr
esso
rs0.
10.
14
0.3
12
0.75
0.1
Man
lifts
45
24
102
43
Cra
wle
r Tra
ctor
sS
crap
ers
Rub
ber T
ired
Load
ers
Gra
ders
Rol
lers
Exc
avat
ors
Atta
chm
ent A
Teso
ro In
tegr
atio
n an
d C
ompl
ianc
e Pr
ojec
t
Con
stru
ctio
n Eq
uipm
ent -
Pea
k C
O
M:\M
C\2
778
P66
- C
rude
Cap
acity
Pro
ject
\284
4 - 1
-1 L
ST
Con
stru
ctio
n E
mis
sion
s.xl
sx: A
ctua
l Equ
ipm
ent
2/5/
2016
Appendix B-2
B-2-18

Equi
pmen
tH
ours
(hr/d
ay)
C-N
o51
C-W
etPi
peC
-Alk
W-T
ank
C-T
ank
W-S
AR
<40
T C
rane
s7
11
31
62
2>4
0T C
rane
s5
10
21
20
1P
ile R
ig8
01
00
10
1Tr
acto
rs5
11
11
11
3W
elde
rs8
84
85
208
24Li
ght P
lant
s3
11
41
42
3G
ener
tors
30
04
04
10
Hyd
ro V
acs
50
10
00
01
Fork
Lift
s4
11
21
42
3Lo
ader
/Bac
khoe
51
11
12
21
Air
Com
pres
sors
41
14
11
21
Man
lifts
84
52
410
24
Atta
chm
ent A
Teso
ro In
tegr
atio
n an
d C
ompl
ianc
e Pr
ojec
t
Con
stru
ctio
n Eq
uipm
ent E
mis
sion
s
Com
pone
nt
M:\M
C\2
778
P66
- C
rude
Cap
acity
Pro
ject
\284
4 - 1
-1 L
ST
Con
stru
ctio
n E
mis
sion
s.xl
sx: E
quip
men
t 201
72/
5/20
16
Appendix B-2
B-2-19

Emis
sion
Rat
e (lb
/hr)
VOC
2017
C-N
o51
C-W
etPi
peC
-Alk
W-T
ank
C-T
ank
W-S
AR
<40
T C
rane
s0.
065
0.46
0.46
1.37
0.46
2.75
0.92
0.92
>40T
Cra
nes
0.07
20.
360.
000.
720.
360.
720.
000.
36P
ile R
ig0.
040
0.00
0.32
0.00
0.00
0.32
0.00
0.32
Trac
tors
0.03
00.
150.
150.
150.
150.
150.
150.
46W
elde
rs0.
036
2.29
1.15
2.29
1.43
5.73
2.29
6.87
Ligh
t Pla
nts
0.03
60.
110.
110.
430.
110.
430.
210.
32G
ener
tors
0.04
20.
000.
000.
500.
000.
500.
130.
00H
ydro
Vac
s0.
042
0.00
0.21
0.00
0.00
0.00
0.00
0.21
Fork
Lift
s0.
019
0.08
0.08
0.16
0.08
0.31
0.16
0.23
Load
er/B
ackh
oe0.
030
0.15
0.15
0.15
0.15
0.30
0.30
0.15
Air
Com
pres
sors
0.03
60.
140.
140.
570.
140.
140.
290.
14M
anlif
ts0.
006
0.19
0.23
0.09
0.19
0.47
0.09
0.19
3.93
3.00
6.44
3.07
11.8
34.
5410
.18
Atta
chm
ent A
Teso
ro In
tegr
atio
n an
d C
ompl
ianc
e Pr
ojec
t
Con
stru
ctio
n Eq
uipm
ent E
mis
sion
s
Com
pone
nt
Tota
l
Appendix B-2
B-2-20
Emis
sion
Rat
e (lb
/hr)
CO
2017
C-N
o51
C-W
etPi
peC
-Alk
W-T
ank
C-T
ank
W-S
AR
<40
T C
rane
s0.
415
2.91
2.91
8.72
2.91
17.4
45.
815.
81>4
0T C
rane
s0.
424
2.12
0.00
4.24
2.12
4.24
0.00
2.12
Pile
Rig
0.50
10.
004.
010.
000.
004.
010.
004.
01Tr
acto
rs0.
367
1.83
1.83
1.83
1.83
1.83
1.83
5.50
Wel
ders
0.24
115
.41
7.71
15.4
19.
6338
.53
15.4
146
.24
Ligh
t Pla
nts
0.30
50.
910.
913.
660.
913.
661.
832.
74G
ener
tors
0.47
30.
000.
005.
670.
005.
671.
420.
00H
ydro
Vac
s0.
480
0.00
2.40
0.00
0.00
0.00
0.00
2.40
Fork
Lift
s0.
452
1.81
1.81
3.62
1.81
7.24
3.62
5.43
Load
er/B
ackh
oe0.
367
1.83
1.83
1.83
1.83
3.67
3.67
1.83
Air
Com
pres
sors
0.22
10.
880.
883.
530.
880.
881.
770.
88M
anlif
ts0.
155
4.95
6.19
2.48
4.95
12.3
82.
484.
9532
.67
30.4
951
.00
26.8
999
.56
37.8
481
.93
Teso
ro In
tegr
atio
n an
d C
ompl
ianc
e Pr
ojec
t
Con
stru
ctio
n Eq
uipm
ent E
mis
sion
s
Com
pone
nt
Tota
l
Atta
chm
ent A
M:\M
C\2
778
P66
- C
rude
Cap
acity
Pro
ject
\284
4 - 1
-1 L
ST
Con
stru
ctio
n E
mis
sion
s.xl
sx: E
quip
men
t 201
72/
5/20
16
Appendix B-2
B-2-21

Emis
sion
Rat
e (lb
/hr)
NO
X20
17C
-No5
1C
-Wet
Pipe
C-A
lkW
-Tan
kC
-Tan
kW
-SA
R<4
0 T
Cra
nes
0.90
96.
366.
3619
.09
6.36
38.1
912
.73
12.7
3>4
0T C
rane
s1.
117
5.58
0.00
11.1
75.
5811
.17
0.00
5.58
Pile
Rig
0.67
50.
005.
400.
000.
005.
400.
005.
40Tr
acto
rs0.
358
1.79
1.79
1.79
1.79
1.79
1.79
5.37
Wel
ders
0.18
912
.08
6.04
12.0
87.
5530
.19
12.0
836
.23
Ligh
t Pla
nts
0.18
90.
570.
572.
260.
572.
261.
131.
70G
ener
tors
0.45
30.
000.
005.
440.
005.
441.
360.
00H
ydro
Vac
s0.
453
0.00
2.27
0.00
0.00
0.00
0.00
2.27
Fork
Lift
s0.
297
1.19
1.19
2.38
1.19
4.76
2.38
3.57
Load
er/B
ackh
oe0.
358
1.79
1.79
1.79
1.79
3.58
3.58
1.79
Air
Com
pres
sors
0.18
90.
750.
753.
020.
750.
751.
510.
75M
anlif
ts0.
116
3.72
4.65
1.86
3.72
9.31
1.86
3.72
33.8
430
.81
60.8
829
.31
112.
8438
.42
79.1
1
Atta
chm
ent A
Teso
ro In
tegr
atio
n an
d C
ompl
ianc
e Pr
ojec
t
Con
stru
ctio
n Eq
uipm
ent E
mis
sion
s
Com
pone
nt
Tota
l
M:\M
C\2
778
P66
- C
rude
Cap
acity
Pro
ject
\284
4 - 1
-1 L
ST
Con
stru
ctio
n E
mis
sion
s.xl
sx: E
quip
men
t 201
72/
5/20
16
Appendix B-2
B-2-22

Emis
sion
Rat
e (lb
/hr)
SOx
2017
C-N
o51
C-W
etPi
peC
-Alk
W-T
ank
C-T
ank
W-S
AR
<40
T C
rane
s0.
001
0.01
0.01
0.03
0.01
0.06
0.02
0.02
>40T
Cra
nes
0.00
20.
010.
000.
020.
010.
020.
000.
01P
ile R
ig0.
002
0.00
0.02
0.00
0.00
0.02
0.00
0.02
Trac
tors
0.00
10.
000.
000.
000.
000.
000.
000.
01W
elde
rs0.
000
0.02
0.01
0.02
0.02
0.06
0.02
0.07
Ligh
t Pla
nts
0.00
00.
000.
000.
000.
000.
000.
000.
00G
ener
tors
0.00
10.
000.
000.
010.
000.
010.
000.
00H
ydro
Vac
s0.
001
0.00
0.00
0.00
0.00
0.00
0.00
0.00
Fork
Lift
s0.
001
0.00
0.00
0.01
0.00
0.01
0.01
0.01
Load
er/B
ackh
oe0.
001
0.00
0.00
0.00
0.00
0.01
0.01
0.00
Air
Com
pres
sors
0.00
00.
000.
000.
010.
000.
000.
000.
00M
anlif
ts0.
000
0.01
0.02
0.01
0.01
0.04
0.01
0.01
0.07
0.08
0.12
0.06
0.24
0.08
0.18
Teso
ro In
tegr
atio
n an
d C
ompl
ianc
e Pr
ojec
t
Con
stru
ctio
n Eq
uipm
ent E
mis
sion
s
Com
pone
nt
Tota
l
Atta
chm
ent A
M:\M
C\2
778
P66
- C
rude
Cap
acity
Pro
ject
\284
4 - 1
-1 L
ST
Con
stru
ctio
n E
mis
sion
s.xl
sx: E
quip
men
t 201
72/
5/20
16
Appendix B-2
B-2-23

Emis
sion
Rat
e (lb
/hr)
PM10
2017
C-N
o51
C-W
etPi
peC
-Alk
W-T
ank
C-T
ank
W-S
AR
<40
T C
rane
s0.
043
0.30
0.30
0.90
0.30
1.80
0.60
0.60
>40T
Cra
nes
0.04
50.
230.
000.
450.
230.
450.
000.
23P
ile R
ig0.
025
0.00
0.20
0.00
0.00
0.20
0.00
0.20
Trac
tors
0.02
40.
120.
120.
120.
120.
120.
120.
35W
elde
rs0.
017
1.06
0.53
1.06
0.66
2.66
1.06
3.19
Ligh
t Pla
nts
0.01
70.
050.
050.
200.
050.
200.
100.
15G
ener
tors
0.03
50.
000.
000.
430.
000.
430.
110.
00H
ydro
Vac
s0.
035
0.00
0.18
0.00
0.00
0.00
0.00
0.18
Fork
Lift
s0.
015
0.06
0.06
0.12
0.06
0.24
0.12
0.18
Load
er/B
ackh
oe0.
024
0.12
0.12
0.12
0.12
0.24
0.24
0.12
Air
Com
pres
sors
0.01
70.
070.
070.
270.
070.
070.
130.
07M
anlif
ts0.
004
0.11
0.14
0.06
0.11
0.28
0.06
0.11
2.12
1.76
3.72
1.72
6.68
2.54
5.38
Atta
chm
ent A
Teso
ro In
tegr
atio
n an
d C
ompl
ianc
e Pr
ojec
t
Con
stru
ctio
n Eq
uipm
ent E
mis
sion
s
Com
pone
nt
Tota
l
M:\M
C\2
778
P66
- C
rude
Cap
acity
Pro
ject
\284
4 - 1
-1 L
ST
Con
stru
ctio
n E
mis
sion
s.xl
sx: E
quip
men
t 201
72/
5/20
16
Appendix B-2
B-2-24

Emis
sion
Rat
e (M
T/hr
)C
O2E
Q20
17C
-No5
1C
-Wet
Pipe
C-A
lkW
-Tan
kC
-Tan
kW
-SA
R<4
0 T
Cra
nes
0.03
50.
250.
250.
740.
251.
480.
490.
49>4
0T C
rane
s0.
051
0.26
0.00
0.51
0.26
0.51
0.00
0.26
Pile
Rig
0.05
90.
000.
470.
000.
000.
470.
000.
47Tr
acto
rs0.
019
0.10
0.10
0.10
0.10
0.10
0.10
0.29
Wel
ders
0.00
90.
600.
300.
600.
381.
500.
601.
80Li
ght P
lant
s0.
009
0.03
0.03
0.11
0.03
0.11
0.06
0.08
Gen
erto
rs0.
018
0.00
0.00
0.22
0.00
0.22
0.05
0.00
Hyd
ro V
acs
0.01
80.
000.
090.
000.
000.
000.
000.
09Fo
rk L
ifts
0.02
10.
090.
090.
170.
090.
340.
170.
26Lo
ader
/Bac
khoe
0.01
90.
100.
100.
100.
100.
190.
190.
10A
ir C
ompr
esso
rs0.
009
0.04
0.04
0.15
0.04
0.04
0.08
0.04
Man
lifts
0.01
10.
340.
430.
170.
340.
850.
170.
341.
791.
882.
871.
565.
821.
914.
22
Teso
ro In
tegr
atio
n an
d C
ompl
ianc
e Pr
ojec
t
Con
stru
ctio
n Eq
uipm
ent E
mis
sion
s
Com
pone
nt
Tota
l
Atta
chm
ent A
M:\M
C\2
778
P66
- C
rude
Cap
acity
Pro
ject
\284
4 - 1
-1 L
ST
Con
stru
ctio
n E
mis
sion
s.xl
sx: E
quip
men
t 201
72/
5/20
16
Appendix B-2
B-2-25

Vehicle Miles per Day C-No51 C-Wet Pipe C-Alk W-Tank C-Tank W-SARCars 2Pickup Trucks 2 10 10 42 7 8 12 21Total Light Vehicle Miles 20 20 84 14 16 24 42
Water Truck 10 1 1 1 1 1 1 1Delivery Truck 21 Ton Truck 2 1 1 3 1 1 1 2Misc. MD Truck 5Total Medium Truck Miles 12 12 16 12 12 12 14
Truck, Dump Ford LT8000 2 0 0 0 0 0 0Concrete Truck 2 0 0 0 0 0 0Semi-Tractor, Diesel 20 Ton 2 0 0 0 0 0 0Misc. HD Truck 2 0 0 0 0 0 0Total Heavy Truck Miles 0 0 0 0 0 0 0
Emission Rate (lb/mi)(1)
VOC 2017 C-No51 CNHDS Pipe C-Alk W-Tank W-PST W-SARLight Duty 0.0001035 0.00 0.00 0.01 0.00 0.00 0.00 0.00Medium Duty 0.0003717 0.00 0.00 0.01 0.00 0.00 0.00 0.01Heavy Duty 0.0006131 0.00 0.00 0.00 0.00 0.00 0.00 0.00
0.01 0.01 0.01 0.01 0.01 0.01 0.01
CO 2017 C-No51 CNHDS Pipe C-Alk W-Tank W-PST W-SARLight Duty 0.0033327 0.07 0.07 0.28 0.05 0.05 0.08 0.14Medium Duty 0.0030301 0.04 0.04 0.05 0.04 0.04 0.04 0.04Heavy Duty 0.0043046 0.00 0.00 0.00 0.00 0.00 0.00 0.00
0.10 0.10 0.33 0.08 0.09 0.12 0.18
NOx 2017 C-No51 CNHDS Pipe C-Alk W-Tank W-PST W-SARLight Duty 0.0005080 0.01 0.01 0.04 0.01 0.01 0.01 0.02Medium Duty 0.0082326 0.10 0.10 0.13 0.10 0.10 0.10 0.12Heavy Duty 0.0154328 0.00 0.00 0.00 0.00 0.00 0.00 0.00
0.11 0.11 0.17 0.11 0.11 0.11 0.14
SOx 2017 C-No51 CNHDS Pipe C-Alk W-Tank W-PST W-SARLight Duty 0.0000090 0.00 0.00 0.00 0.00 0.00 0.00 0.00Medium Duty 0.0000217 0.00 0.00 0.00 0.00 0.00 0.00 0.00Heavy Duty 0.0000359 0.00 0.00 0.00 0.00 0.00 0.00 0.00
0.00 0.00 0.00 0.00 0.00 0.00 0.00
PM10 2017 C-No51 CNHDS Pipe C-Alk W-Tank W-PST W-SARLight Duty Exhaust 0.0001064 0.00 0.00 0.01 0.00 0.00 0.00 0.00Medium Duty Exhaust 0.0004787 0.01 0.01 0.01 0.01 0.01 0.01 0.01Heavy Duty Exhaust 0.0004727 0.00 0.00 0.00 0.00 0.00 0.00 0.00
0.01 0.01 0.02 0.01 0.01 0.01 0.01Light Duty Fugitive(2) 0.000386 0.01 0.01 0.03 0.01 0.01 0.01 0.02Medium Duty Fugitve(2) 0.002104 0.03 0.03 0.03 0.03 0.03 0.03 0.03Heavy Duty Fugitive(2) 0.020119 0.00 0.00 0.00 0.00 0.00 0.00 0.00
0.03 0.03 0.07 0.03 0.03 0.03 0.050.04 0.04 0.08 0.04 0.04 0.04 0.06
CO2EQ 2017 C-No51 CNHDS Pipe C-Alk W-Tank W-PST W-SARLight Duty 0.907 18.14 18.14 76.19 12.70 14.51 21.77 38.10Medium Duty 2.261 27.13 27.13 36.18 27.13 27.13 27.13 31.65Heavy Duty 3.768 0.00 0.00 0.00 0.00 0.00 0.00 0.00
45.27 45.27 112.37 39.83 41.64 48.90 69.75(1) Emfac2011 emission factors for the South Coast Air District.(2) Emission Calculations for travel on paved roads from EPA AP-42 Section 13.2.1, December 2003 E = k(sL/2)0.65 x (W/3)1.5 - C Where: k = 0.016 lb/VMT for PM10, sL = road silt loading (gms/m2) from CARB Methodology 7.9 for paved roads (0.240 for local roads and 0.037 for major/collector roads), W = weight of vehicles (2.4 tons for light; 5 for medium trucks, and 20 for heavy trucks), and C = emission factor for 1980's vehicle fleet exhaust, brake wear and tire wear (0.00047 lbs/VMT).(3) Carbon Dioxide Equivalence (COE) = CO2 + CH4 * 21 + N2O*310 where CO2 emissions factors are from Emfac2011. CH4 and N2O emissions factors are from Direct Emissions from Mobile Combustion Sources, EPA 2008. where light vehicle are gasoline light duty trucks. where medium/heavy duty vehicle are diesel heavy duty trucks.
Light Medium HeavyCO2 (lb/mi) 0.8956 2.2575 3.7642CH4 (g/mi) 0.0148 0.0051 0.0051N2O (g/mi) 0.0157 0.0048 0.0048CO2e (lb/mi) 0.907 2.261 3.768
Total
Total
Chemical2017
Total
Total
Total
Total
Total Exhaust PM
Total Fugitive PM
Component (lb/day)
Attachment ATesoro Integration and Compliance Project
Onsite Construction Vehicle Trip Emissions
Component (Vehicles per day)
M:\MC\2778 P66 - Crude Capacity Project\2844 - 1-1 LST Construction Emissions.xlsx: Onsite Trips 2017 2/5/2016
Appendix B-2
B-2-26

Equi
pmen
tH
ours
(hr/d
ay)
<40
T C
rane
s14
4>4
0T C
rane
s10
4P
ile R
ig16
0Tr
acto
rs10
1W
elde
rs16
6Li
ght P
lant
s15
2G
ener
tors
152
Hyd
ro V
acs
100
Fork
Lift
s8
1Lo
ader
/Bac
khoe
101
Air
Com
pres
sors
81
Man
lifts
166
Atta
chm
ent A
Teso
ro In
tegr
atio
n an
d C
ompl
ianc
e Pr
ojec
t
Con
stru
ctio
n Eq
uipm
ent E
mis
sion
s Wilm
ingt
on H
TU
Turn
arou
nd
M:\M
C\2
778
P66
- C
rude
Cap
acity
Pro
ject
\284
4 - 1
-1 L
ST
Con
stru
ctio
n E
mis
sion
s.xl
sx: T
AR
Equ
ipm
ent 2
017
2/5/
2016
Appendix B-2
B-2-27

Emis
sion
Rat
e (lb
/hr)
VOC
2017
<40
T C
rane
s0.
065
3.66
>40T
Cra
nes
0.07
22.
89P
ile R
ig0.
040
0.00
Trac
tors
0.03
00.
30W
elde
rs0.
036
3.44
Ligh
t Pla
nts
0.03
61.
07G
ener
tors
0.04
21.
25H
ydro
Vac
s0.
042
0.00
Fork
Lift
s0.
019
0.16
Load
er/B
ackh
oe0.
030
0.30
Air
Com
pres
sors
0.03
60.
29M
anlif
ts0.
006
0.56
13.9
3
Atta
chm
ent A
Teso
ro In
tegr
atio
n an
d C
ompl
ianc
e Pr
ojec
t
Con
stru
ctio
n Eq
uipm
ent E
mis
sion
s
Tota
l
Wilm
ingt
on H
TU
Turn
arou
nd
Appendix B-2
B-2-28

Emis
sion
Rat
e (lb
/hr)
CO
2017
<40
T C
rane
s0.
415
23.2
5>4
0T C
rane
s0.
424
16.9
7P
ile R
ig0.
501
0.00
Trac
tors
0.36
73.
67W
elde
rs0.
241
23.1
2Li
ght P
lant
s0.
305
9.14
Gen
erto
rs0.
473
14.1
9H
ydro
Vac
s0.
480
0.00
Fork
Lift
s0.
452
3.62
Load
er/B
ackh
oe0.
367
3.67
Air
Com
pres
sors
0.22
11.
77M
anlif
ts0.
155
14.8
611
4.25
Atta
chm
ent A
Wilm
ingt
on H
TU
Turn
arou
nd
Teso
ro In
tegr
atio
n an
d C
ompl
ianc
e Pr
ojec
t
Con
stru
ctio
n Eq
uipm
ent E
mis
sion
s
Tota
l
M:\M
C\2
778
P66
- C
rude
Cap
acity
Pro
ject
\284
4 - 1
-1 L
ST
Con
stru
ctio
n E
mis
sion
s.xl
sx: T
AR
Equ
ipm
ent 2
017
2/5/
2016
Appendix B-2
B-2-29

Emis
sion
Rat
e (lb
/hr)
NO
X20
17<4
0 T
Cra
nes
0.90
950
.92
>40T
Cra
nes
1.11
744
.68
Pile
Rig
0.67
50.
00Tr
acto
rs0.
358
3.58
Wel
ders
0.18
918
.11
Ligh
t Pla
nts
0.18
95.
66G
ener
tors
0.45
313
.60
Hyd
ro V
acs
0.45
30.
00Fo
rk L
ifts
0.29
72.
38Lo
ader
/Bac
khoe
0.35
83.
58A
ir C
ompr
esso
rs0.
189
1.51
Man
lifts
0.11
611
.17
155.
19
Teso
ro In
tegr
atio
n an
d C
ompl
ianc
e Pr
ojec
t
Con
stru
ctio
n Eq
uipm
ent E
mis
sion
s
Tota
l
Wilm
ingt
on H
TU
Turn
arou
nd
Atta
chm
ent A
M:\M
C\2
778
P66
- C
rude
Cap
acity
Pro
ject
\284
4 - 1
-1 L
ST
Con
stru
ctio
n E
mis
sion
s.xl
sx: T
AR
Equ
ipm
ent 2
017
2/5/
2016
Appendix B-2
B-2-30

Emis
sion
Rat
e (lb
/hr)
SOx
2017
<40
T C
rane
s0.
001
0.08
>40T
Cra
nes
0.00
20.
09P
ile R
ig0.
002
0.00
Trac
tors
0.00
10.
01W
elde
rs0.
000
0.04
Ligh
t Pla
nts
0.00
00.
01G
ener
tors
0.00
10.
02H
ydro
Vac
s0.
001
0.00
Fork
Lift
s0.
001
0.01
Load
er/B
ackh
oe0.
001
0.01
Air
Com
pres
sors
0.00
00.
00M
anlif
ts0.
000
0.04
0.31
Atta
chm
ent A
Wilm
ingt
on H
TU
Turn
arou
nd
Teso
ro In
tegr
atio
n an
d C
ompl
ianc
e Pr
ojec
t
Con
stru
ctio
n Eq
uipm
ent E
mis
sion
s
Tota
l
M:\M
C\2
778
P66
- C
rude
Cap
acity
Pro
ject
\284
4 - 1
-1 L
ST
Con
stru
ctio
n E
mis
sion
s.xl
sx: T
AR
Equ
ipm
ent 2
017
2/5/
2016
Appendix B-2
B-2-31

Emis
sion
Rat
e (lb
/hr)
PM10
2017
<40
T C
rane
s0.
043
2.40
>40T
Cra
nes
0.04
51.
81P
ile R
ig0.
025
0.00
Trac
tors
0.02
40.
24W
elde
rs0.
017
1.60
Ligh
t Pla
nts
0.01
70.
50G
ener
tors
0.03
51.
06H
ydro
Vac
s0.
035
0.00
Fork
Lift
s0.
015
0.12
Load
er/B
ackh
oe0.
024
0.24
Air
Com
pres
sors
0.01
70.
13M
anlif
ts0.
004
0.34
8.44
Teso
ro In
tegr
atio
n an
d C
ompl
ianc
e Pr
ojec
t
Con
stru
ctio
n Eq
uipm
ent E
mis
sion
s
Tota
l
Wilm
ingt
on H
TU
Turn
arou
nd
Atta
chm
ent A
M:\M
C\2
778
P66
- C
rude
Cap
acity
Pro
ject
\284
4 - 1
-1 L
ST
Con
stru
ctio
n E
mis
sion
s.xl
sx: T
AR
Equ
ipm
ent 2
017
2/5/
2016
Appendix B-2
B-2-32

Emis
sion
Rat
e (M
T/hr
)C
O2E
Q20
17<4
0 T
Cra
nes
0.03
51.
98>4
0T C
rane
s0.
051
2.06
Pile
Rig
0.05
90.
00Tr
acto
rs0.
019
0.19
Wel
ders
0.00
90.
90Li
ght P
lant
s0.
009
0.28
Gen
erto
rs0.
018
0.54
Hyd
ro V
acs
0.01
80.
00Fo
rk L
ifts
0.02
10.
17Lo
ader
/Bac
khoe
0.01
90.
19A
ir C
ompr
esso
rs0.
009
0.08
Man
lifts
0.01
11.
027.
41
Teso
ro In
tegr
atio
n an
d C
ompl
ianc
e Pr
ojec
t
Con
stru
ctio
n Eq
uipm
ent E
mis
sion
s
Tota
l
Atta
chm
ent A
Wilm
ingt
on H
TU
Turn
arou
nd
M:\M
C\2
778
P66
- C
rude
Cap
acity
Pro
ject
\284
4 - 1
-1 L
ST
Con
stru
ctio
n E
mis
sion
s.xl
sx: T
AR
Equ
ipm
ent 2
017
2/5/
2016
Appendix B-2
B-2-33

VehiclesVehicle Miles per Day W-HTU
Cars 2Pickup Trucks 2 12Total Light Vehicle Miles 24
Water Truck 10 1Delivery Truck 21 Ton Truck 2 2Misc. MD Truck 5Total Medium Truck Miles 14
Truck, Dump Ford LT8000 2 0Concrete Truck 2 0Semi-Tractor, Diesel 20 Ton 2 0Misc. HD Truck 2 0Total Heavy Truck Miles 0
Emission Rate (lb/mi)(1) W-HCU
VOC 2017 (lb/day)Light Duty 0.0001035 0.00Medium Duty 0.0003717 0.01Heavy Duty 0.0006131 0.00
0.01
CO 2017 W-HCULight Duty 0.0033327 0.08Medium Duty 0.0030301 0.04Heavy Duty 0.0043046 0.00
0.12
NOx 2017 W-HCULight Duty 0.0005080 0.01Medium Duty 0.0082326 0.12Heavy Duty 0.0154328 0.00
0.13
SOx 2017 W-HCULight Duty 0.0000090 0.00Medium Duty 0.0000217 0.00Heavy Duty 0.0000359 0.00
0.00
PM10 2017 W-HCULight Duty Exhaust 0.0001064 0.00Medium Duty Exhaust 0.0004787 0.01Heavy Duty Exhaust 0.0004727 0.00
0.01Light Duty Fugitive(2) 0.000386 0.01Medium Duty Fugitve(2) 0.002104 0.03Heavy Duty Fugitive(2) 0.020119 0.00
0.040.05
CO2EQ 2017 W-HCULight Duty 0.907 21.77Medium Duty 2.261 31.65Heavy Duty 3.768 0.00
53.42(1) Emfac2011 emission factors for the South Coast Air District.(2) Emission Calculations for travel on paved roads from EPA AP-42 Section 13.2.1, December 2003 E = k(sL/2)0.65 x (W/3)1.5 - C Where: k = 0.016 lb/VMT for PM10, sL = road silt loading (gms/m2) from CARB Methodology 7.9 for paved roads (0.240 for local roads and 0.037 for major/collector roads), W = weight of vehicles (2.4 tons for light; 5 for medium trucks, and 20 for heavy trucks), and C = emission factor for 1980's vehicle fleet exhaust, brake wear and tire wear (0.00047 lbs/VMT).(3) Carbon Dioxide Equivalence (COE) = CO2 + CH4 * 21 + N2O*310 where CO2 emissions factors are from Emfac2011. CH4 and N2O emissions factors are from Direct Emissions from Mobile Combustion Sources, EPA 2008. where light vehicle are gasoline light duty trucks. where medium/heavy duty vehicle are diesel heavy duty trucks.
Light Medium HeavyCO2 (lb/mi) 0.8956 2.2575 3.7642CH4 (g/mi) 0.0148 0.0051 0.0051N2O (g/mi) 0.0157 0.0048 0.0048CO2e (lb/mi) 0.907 2.261 3.768
Total
Chemical
Total
Total
Total
Total
Total Exhaust PM
Total Fugitive PM
2017
Attachment ATesoro Integration and Compliance Project
Onsite Construction Vehicle Trip Emissions
Total
M:\MC\2778 P66 - Crude Capacity Project\2844 - 1-1 LST Construction Emissions.xlsx: TAR Onsite Trips 2017 2/5/2016
Appendix B-2
B-2-34

Vehicle Miles/Trip Trips/DayLight Vehicles 0.05 1Total Light Vehicle Miles 0.05
Delivey Trucks 0.05 0Water Trucks 0.1 1Total Medium Truck Miles 0.1
Concrete Truck 0.05 0Dump Trucks 0.05 10Total Heavy Truck Miles 0.5
Tractors 0.05 1Fork Lifts 0.05 2Loader/Backhoe 0.05 2Total Heavy-Heavy Duty Miles 0.25
PM10Emission Rate
(lb/mi)(1) Emissions (lb/day)Light Duty 0.9021196 0.05Medium Duty 1.2863357 0.13Heavy Duty 2.1931267 1.10Heavy Heavy Duty 2.4962390 0.62
1.890.74
(1) Based on Section 13.2.2 of EPA’s Compilation of Air Pollutant Emission Factors (AP-42). Emission Rate = 1.5((s/12)^.9)*((W/3)^.45) s = silt content = 8.5% W = Vehicle Weight (ton) =2.5 for light, 5.5 for medium, 15 for heavy, and 24 for heavy heavy (EMFAC2007).(2) Controlled Emissions assume that watering 3 times per day reduces emissions by 61 percent (Uncontrolled Emissions x 0.39)
Controlled Total(2)
Attachment ATesoro Integration and Compliance Project
Offroad Construction Vehicle Dust Emissions
Uncontrolled Total
M:\MC\2778 P66 - Crude Capacity Project\2844 - 1-1 LST Construction Emissions.xlsx: Offroad Vehicle Dust - Peak 2/5/2016
Appendix B-2
B-2-35

Con
stru
ctio
n A
ctiv
ities
(1)
22
80.
348
0.39
2.17
2.17
5.56
2184
355.
5621
8435
Tabl
e A
9-9-
F
Sto
ckpi
les
Ave
rage
Ton
s of
Mat
eria
ls
Han
dled
Per
D
ay
Pea
k
Tons
of
Mat
eria
ls
Han
dled
P
er D
ay
PM
10
Em
issi
on
Fact
or
(lb/to
n)W
ater
Con
trol
Fact
or(5
)
Ave
rage
P
M10
E
mis
sion
s P
ound
s/da
y
Pea
k
PM
10
Em
issi
ons
Pou
nds/
day
Ave
rage
P
M10
E
mis
sion
s P
ound
s/da
y
Pea
k
PM
10
Em
issi
ons
Pou
nds/
day
Con
stru
ctio
n A
ctiv
ities
(2)
1200
1200
0.00
005
0.39
0.02
4117
710.
0241
1771
0.06
1840
290.
0618
4029
Tabl
e A
9-9-
GA
ssum
ptio
ns: 1
cubi
c ya
rd tr
ench
spo
ils =
1 to
n
WIN
D E
RO
SIO
N D
istu
rbed
A
rea
and
Tem
pora
ry
Sto
ckpi
les
Day
s of
C
onst
ruct
ion
Ave
rage
A
crea
ge
Dis
turb
ed
Per
Day
Pea
k A
crea
ge
Dis
turb
ed
Per
Day
PM
10
Em
issi
on
Fact
or
(lb/d
ay/a
cre)
Ave
rage
P
M10
E
mis
sion
s P
ound
s/da
y
Pea
k
PM
10
Em
issi
ons
Pou
nds/
day
Ave
rage
P
M10
E
mis
sion
s To
ns/Y
ear
Pea
k
PM
10
Em
issi
ons
Tons
/Yea
r
SC
AQ
MD
E
mis
sion
Fac
tor
Sou
rce
Con
stru
ctio
n A
ctiv
ities
(3)
200.
251
0.12
00.
030
0.12
00.
000
0.00
1Ta
ble
A9-
9-E
Filli
ng a
nd D
umpi
ng
Est
imat
ed
Mat
eria
ls
Han
dled
Per
D
ay (t
ons)
Pea
k
Tons
of
Mat
eria
ls
Han
dled
P
er D
ay
PM
10
Em
issi
on
Fact
or
(lb/to
n)W
ater
Con
trol
Fact
or(5
)
Ave
rage
P
M10
E
mis
sion
s P
ound
s/da
y
Pea
k
PM
10
Em
issi
ons
Pou
nds/
day
Ave
rage
P
M10
E
mis
sion
s P
ound
s/da
y
Pea
k
PM
10
Em
issi
ons
Pou
nds/
day
Truc
k Fi
lling
(4)
1200
.012
00.0
5.15
3E-0
50.
390.
0241
1771
0.02
4117
710.
0618
4029
0.06
1840
29Ta
ble
A9-
9Tr
uck
Dum
ping
1200
.012
00.0
5.15
3E-0
50.
390.
0241
1771
0.02
4117
710.
0618
4029
0.06
1840
29Ta
ble
A9-
9
TOTA
L P
M10
Pou
nds/
day
Ave
rage
Pea
k(C
ontro
lled
Em
issi
ons)
2.27
152.
3613
3(U
ncon
trolle
d E
mis
sion
s)5.
748
5.74
9
(1)
Em
issi
ons
(lbs/
hr) =
[0.7
5 x
(G1.
5 )/(H
1.4 ) x
J
w
here
G =
silt
con
tent
(7.5
%),
H =
moi
stur
e co
nten
t (15
.0%
) and
J =
hrs
of o
pera
tion
(EP
A A
P-4
2 Ta
ble
11.9
-1 fo
r bul
ldoz
ing
over
burd
en).
(2)
Em
issi
ons
(lbs/
ton)
= 0
.001
12 x
[(G
/5)1.
3 /(H/2
)1.4 ] x
I/J
whe
re G
=mea
n w
ind
spee
d (4
.1 m
ph),
H=m
oist
ure
cont
ent o
f sur
face
mat
eria
l (15
%);
I=lb
s of
dirt
han
dled
per
day
; and
J=2
,000
lbs/
ton.
Win
d sp
eed
data
acq
uire
d fro
m L
ong
Bea
ch 2
005-
2007
SC
AQ
MD
met
eoro
logi
cal f
ile.
(3)
Em
issi
ons
(lbs/
day/
acre
) = 1
.7 x
[(G
/1.5
)*(3
65-H
)/235
] x I/
15 x
J
w
here
G =
silt
con
tent
(7.5
%);
H =
day
s w
ith >
0.01
inch
of r
ain
(34)
; I =
per
cent
age
of ti
me
win
d sp
eed
exce
eds
12 m
ph (0
.3%
) and
J=
fract
ion
of T
SP
(0.5
). W
ind
spee
d da
ta a
cqui
red
from
Lon
g B
each
200
5-20
07
S
CA
QM
D m
eteo
rolo
gica
l file
.(4
) U
sed
SC
AQ
MD
Tab
le 9
-9 D
efau
lt em
issi
on fa
ctor
s.(5
) M
itiga
ted
Em
issi
ons
assu
me
that
wat
erin
g 3
times
per
day
con
trols
em
issi
ons
by 6
1 pe
rcen
t (U
ncon
trolle
d E
mis
sion
s x
0.39
). w
ww
.AQ
MD
.gov
/CE
QA
/han
dboo
k/m
itiga
tion/
fugi
tive/
Tabl
e X
I-A.d
oc
Con
trolle
d E
mis
sion
sU
ncon
trolle
d E
mis
sion
s
SC
AQ
MD
E
mis
sion
Fac
tor
Sou
rce
Pea
k P
M10
E
mis
sion
s (lb
s/da
y)
Ave
rage
P
M10
E
mis
sion
s (lb
s/da
y)
Pea
k P
M10
E
mis
sion
s (lb
s/da
y)
SC
AQ
MD
E
mis
sion
Fac
tor
Sou
rce
Gra
ding
Ope
ratio
ns
Con
trolle
d E
mis
sion
sU
ncon
trolle
d E
mis
sion
s
SC
AQ
MD
E
mis
sion
Fac
tor
Sou
rce
Ave
rage
P
iece
s of
E
quip
men
t O
pera
ting
Pea
k P
iece
s of
Equ
ipm
ent
Ope
ratin
gH
ours
of
Ope
ratio
n
PM
10
Em
issi
on
Fact
or
(lb/h
our)
Wat
er C
ontro
l Fa
ctor
(5)
Ave
rage
P
M10
E
mis
sion
s (lb
s/da
y)
Atta
chm
ent A
Teso
ro In
tegr
atio
n an
d C
ompl
ianc
e Pr
ojec
t
Peak
Mon
thly
Fug
itive
PM
Con
stru
ctio
n Em
issi
ons
Con
trolle
d E
mis
sion
sU
ncon
trolle
d E
mis
sion
s
M:\M
C\2
778
P66
- C
rude
Cap
acity
Pro
ject
\284
4 - 1
-1 L
ST
Con
stru
ctio
n E
mis
sion
s.xl
sx: F
ugiti
veC
onst
EF
- Pea
k2/
5/20
16
Appendix B-2
B-2-36