280 the exchange of dissolved substances … the exchange of dissolved substances between mud and...
TRANSCRIPT

280
THE EXCHANGE OF DISSOLVED SUBSTANCES BETWEEN MUD AND WATER IN LAKES
BY CLIFFORD H. MORTIMER Freshwater Biological Association, Wray Castle, Ambleside
(With forty-six Figures in the Text)
CONTENTS PAGE
Introductior. 280 I. The distribution of some physlcal variables and concentratiOns of dissolved
substances in Esthwalte Water, April 1939-February 1940 . 283 Methods .. . 283 Results .. 287 Discussion .. .297
(a) Deductions from the distribution of temperature and dissolved substances in the hypolimnion . . .297
(b) Seasonal variations in rate of exchange of dissolved substances between mud and water. . .301
(c) Events under ice ..309 II. Changes in redox potential and m concentrations of dissolved substances in
artificial mud-water systems, subjected to varying degrees of aeration 312 Methods and experimental procedure . . . .312 Results .. .318 Discusslon.. . 324
III. The relation of seasonal variations ini redox conditions in the mud to the distribution of dissolved substances in Esthwalte Water and Windermere, North basin
Samplng technique and other methods Results
(a) Esthwaite Water, 1940-41 (b) Windermere, North basin, 1940-4
Discussion IV. General discussion
Summary References
Note. Sections III and IV, Summary and References, will appear in the following number of this Journal.
INTRODUCTION
GENERAL conclusions of research on the physics and chemistry of lakes during the past forty years have been reviewed by Welch (1935). Water movements induced by wind and the turbulence associated with them are the main agents transporting heat and dissolved substances in lake water. Until density (thermal) stratification is set up by surface warming in the spring, the dis- tribution of heat and dissolved substances, including oxygen absorbed from the atmosphere, is practically uniform from top to bottom. In typical lakes thermal stratification develops during summer, and the zone in free circulation with the atmosphere is confined to a surface layer or epilimnion. Below this a
This content downloaded on Tue, 5 Mar 2013 12:33:17 PMAll use subject to JSTOR Terms and Conditions

CLIFFORD H. MORTIMER 281
narrow zone exists with large temperature gradient (thermocline), which offers considerable resistance to wind mixing and separates the epilimnion from the hypolimnion. The latter is almost entirely isolated from the atmosphere, and water movement is very much reduced. Thermal stratification is destroyed as a result of surface cooling in the autumn. Decomposition of organic matter, largely derived from dead plankton, depletes the store of oxygen available in the hypolimnion during the development of thermal stratification and at the same time liberates inorganic materials which accumulate in the hypoliminion during the period of stratification. Concurrently plants extract dissolved sub- stances from solution in the epilimnion, which cannot receive much replenish- ment from below. This depletion of plant nutrients may limit organic pro- duction. Circulation between epilimnion and hypolimnion may come too late in the year to revive plant growth; thus the seasonal cycle of thermal and chemical stratification often imposes a seasonal cycle on plant production.
It may be concluded further that the factors controlling organic production in lakes are divisible into two groups, namely, climatic factors, affecting circu- lation and exchange, and geochemical factors, which include processes both in the lake and its drainage area, controlling the rate 6f supply of essential nutrients. To complete the causal description of the physico-chemical aspect of organic production in lakes two categories of knowledge are required: first, of the physical and chemical variables which limit plant growth in any specified set of conditions, and second, of the factors controlling the rate of supply of nutrient elements to surface illuminated waters. This paper seeks to supply information on the second category.
Recently, Muller (1938), Einsele & Vetter (1938), and Pearsall & Mortimer (1939) have shown that exhaustion of dissolved oxygen in the hypolimnion during thermal stratification is attended by reduction processes as well as by considerable increases in the concentrations of dissolved substances, including some, e.g. bases, silica and phosphate, which could not be regarded as primary products of reduction. Hence it appears that oxidation-reduction conditions may exercise a profound influence on organic production, not only in deter- mining the free energy of the environment, but also in affecting the rate of supply of nutrients. The work described in this paper is an attempt to gain information on the mechanisms involved in the apparent release of plant nutrients to the water under reducing conditions, by a study of the distribution of physical properties and dissolved substances in lakes which are subject to wide seasonal fluctuations between oxidized and reduced conditions. In base- poor regions, such as the English Lake District, only relatively shallow lakes show complete reduction of oxygen in the hypolimnion. Therefore most of the work was carried out on Esthwaite Water and Blelham Tarn, maximum depth 16 and 15 m. respectively. Observations on mud-water systems in the laboratory and on other lakes in the-Lake District are included in ?? II-IV for comparison.
This content downloaded on Tue, 5 Mar 2013 12:33:17 PMAll use subject to JSTOR Terms and Conditions
282 Exchange of dissolved substances in lakes
The results have led to the presentation, in outline, of a theory of chemical exchange between mud and water. Deductions from this theory have, as far as possible, been tested on the findings of previous workers. Early in this work, the importance of conditions at the mud surface and in the mud itself was recognized and methods devised for their investigation. The first essential was a sampling device capable of raising an undisturbed sample of the mud surface and the water overlying it. This has been achieved by Mr B. M. Jenkin, whose help I gratefully acknowledge. His apparatus, described in ? III, represents an important addition to hydrobiological equipment.
Attention was drawn in a previous communication (Pearsall & Mortimer, 1939) to the correlation of potentials measurable at bright platinum electrodes with chemical evidence of oxidation or reduction in soil and mud-water systems. It was suggested that, although these potentials are not, thermo- dynamically reversible and their interpretation is difficult, they represent oxidation-reduction (redox) potentials and are related to ecologically reversible systems. Their practical value lies in the fact that by their measurement it may be determined whether a naturals soil or mud-water system is capable- of oxidation or reduction. It has been possible to study in detail the redox gradient, which may be confined within the dimensions of a few millimetres near the mud surface. The results go further than the confirmation of the practical value of redox potential measurements; they suggest that the potential itself controls many physical-chemical processes and that the con- centration of oxygen, or any other oxidant or reductant, exerts its influence on the system largely through its effect on the potential.
Attention was also directed early in the investigation to the importance of water movements in the transport of physical properties and dissolved sub- stances within the lake system (water and mud), and to the value of the con- cept 'eddy diffusion', originally applied to problems of meteorology (Schmidt, 1925; G. I. Taylor, 1915), and more recently to oceanography (literature in Defant, 1929). These authors have shown that the laws of diffusion and heat conduction, which have been the subject of detailed mathematical analysis (Carslaw, 1921), also apply to problems of turbulent mixing in fluids. The application to limnology was first attempted by Schmidt (1925). Ln a future communication (Mortimer, in prep. I) is is hoped to explain more fully the application of certain diffusion integrals to limnological problems.
It was found convenient to present the results of this investigation in three sections, each with a separate description of methods and some discussion. A fourth section-general discussion-follows. For reasons of space, publication of ?? III and IV with summary and references is deferred until the next number of this Journal.
I wish to acknowledge the help of Miss W. Pennington with chemical analysis and other measurements on occasions of my absence, and the
This content downloaded on Tue, 5 Mar 2013 12:33:17 PMAll use subject to JSTOR Terms and Conditions

CLIFFORD H. MORTIMER 283
painstaking work of G. Thompson and the laboratory staff at Wray Castle in collecting samples. I am indebted to Dr C. B. Taylor for permission to publish the temperature and dissolved oxygen data obtained in connexion with a bacteriological investigation on Esthwaite Water, 1939, and to K. Lee for these determinations.
I. THE DISTRIBUTION OF SOME PHYSICAL VARIABLES AND CONCEN- TRATIONS OF DISSOLVED SUBSTANCES IN ESTHWAITE WATER,
AP-RIL 1939-FEBRUARY 1940
METHODS A vertical series of samples was obtained at approximately weekly intervals
at a fixed station near the deepest point in the lake (see map, Fig. 1). A Friedinger water sampler was employed and portions of the sample were run off into two 100 c.c. stoppered bottles, taking the usual precautions to exclude air. A third portion of the sample was transferred to screw-cap rectangular bottles of 350 c.c. capacity, of convenient size and shape for packing. Samples were obtained at the following depths: 1, 5, 6, 7, 8, 9, 10, 11, 12 and 13 m.; the last depth was 1 m. above the mud. On each sampling occasion the depth of all samples below 6 m. was adjusted for variations in lake level so that they were at whole-metre intervals above the mud surface. The temperature of the water at these depths was determined at the same time with a reversing thermometer. On some occasions a sample was taken just over the mud surface with an apparatus described in ? III. The mud temperatures obtained during 1940 were measured by allowing the thermometer to sink into the soft mud surface, withdrawing it slightly and at the same time reversing it. Evidence from the temperature gradient in the mud investigated by other means indicates that these measurements represent the temperature at approximately 10 cm. below the mud surface.
On return to the laboratory, one of each set of 100 c.c. bottles was used for dissolved oxygen determination (unmodified Winkler), the reagents having been added in the field. The other 100 c.c. bottle was used for the determination of redox potential by the potentiometric method described by Pearsall & Mortimer (1939) and outlined in ?? II and III. A spade-type bright platinum electrode 1 sq. cm. in area was introduced into each bottle, the neck of which was then sealed from the atmosphere by a little medicinal paraffin. The potential was measured 2 hr. after the insertion of the electrodes, which were then cleaned in dichromate-sulphuric acid and well rinsed.
In order to make this chemical survey as extensive as possible, a plan for a selected number of determinations by rapid methods on a large number of samples was adopted in preference to a more complete analysis of a smaller number of samples. Attention was confined to the determination of (a) the general characters of the water: electrical conductivity, alkalinity (titration with N 100 HCl to pH 4 with benzene-azo-oc-naphthylamine), pH, colour and
This content downloaded on Tue, 5 Mar 2013 12:33:17 PMAll use subject to JSTOR Terms and Conditions

284 Exchange of dissolved substances in lakes
0~~~~~~~~~~~~~~~~~~~ A dl~~~~1
oO
This content downloaded on Tue, 5 Mar 2013 12:33:17 PMAll use subject to JSTOR Terms and Conditions
CLIFFORD H. 'MORTIMER 285
turbidity; (b) estimations, on filtered samples, of those substances likely to be involved in redox reactions: ammonia (direct Nesslerization), nitrite (Greiss- Ilsovay), nitrate (phenoldisulphonic acid), manganese (potassium periodate), ferric, ferrous and total iron, sulphide and sulphate;. (c) other plant nutrients: silicate (ammonium molybdate), phosphate (Denige's method). Brackets in- dicate standard methods which are described in American Public Health Association (1936). For the following determinations the Lovibond Nesslerizer with coloured glass standards was used and effected a considerable saving in time-ammonia, nitrite, silicate, phosphate and pH. The silicate disk was calibrated for nitrate estimation, as the yellow tint produced in both deter- minations is identical. Difficulty was experienced in nitrate estimation in waters containing considerable dissolved organic matter, due to disturbing brown colourations produced with the acid. This disturbance was minimized when ammonia was employed for neutralization and in most cases the brown tint could be distinguished from the picric acid yellow, especially as the latter developed more rapidly after neutralization.
Fuller descriptions of non-standard methods will be given elsewhere. Colour was determined in arbitrary units using the ammonia standard disk of the Lovibond Nesslerizer, the tint being very similar to water colour. 'Tur- bidity' or 'transparency' was determined by means of a photo-electric photo- meter designed for the purpose (Mortimer, in prep. II). The total transmission of white light through a column of the sample (350 c.c.) was measured and expressed as a percentage of transmission through distilled water, measured under identical conditions. This result included absorption due to turbidity and colour. A correction for the latter may be made by a transparency deter- mination on a filtered sample.
An instrument has been designed (Mortimer, in prep. III) to determine the electrical conductivity of water and mud samples with a d.c. galvanometer and to,correct the readings to 180 C. Before passing to the electrodes the d.c. was converted into a.c. by means of a commutator driven by a gramophone motor. The electrodes, which consisted of two sheets of bright platinum, total area approximately 1 sq. cm. wrapped round and fused to a glass tube (Fig. 16), were sufficiently robust to be lowered into mud cores without damage. This instrument, which may also be used in the field, possesses certain advan- tages for the rapid evaluation of conductivity and the study of its distribution in undisturbed mud-water systems. Expressed as reciprocal megohms at 180 C. (K18 x 10-6), the conductivity value may be taken to be almost exactly 1 6 times the total concentration of dissolved salts in waters in which bicar- bonate is the main anion (Kitto, 1938).
Tests for free ferric iron with potassium thiocyanate were invariably negative, although ferric ions appeared in many cases after treatment with acid, which probably released them from a ferric-organic or similar complex. 'Ferrous iron' was estimated by the increase in colour with potassium thio-
This content downloaded on Tue, 5 Mar 2013 12:33:17 PMAll use subject to JSTOR Terms and Conditions

286 Exchange of dissolved substances in lakes
cyanate after oxidation of the sample with hydrogen peroxide (one drop of Perhydrol, Merck). 'Ferrous iron' was also detected with oc-oc'-dipyridyl. From the conclusions of Cooper (1937) and the findings of Coolidge (1932) it is clear that much of the ferrous iron must have been in complex form at the pH of the Esthwaite samples. Total iron was estimated with potassium thiocyanate after preliminary digestion of 50 c.c. sample (less in samples with high iron concentration) with 0 5 c.c. concentrated nitric acid, A.R.
Perhaps the most sensitive test for hydrogen sulphide is smell. Although traces of 112S were detected in this way in some samples, no sulphide could be detected with cadmium sulphate by the method described by Ohle (1936a). It is probable that in the presence of free ferrous ions at the pH of the water concerned almost all sulphide was precipitated as ferrous sulphide.
Hitherto the determination of sulphate in waters with low concentration of this ion has been a tedious matter. Nevertheless, estimation of sulphate is necessary for a study of redox reactions in natural waters. During the course of this investigation a conductimetric method was developed (Mortimer, in prep. IV). 25 c.c. of sample, to which an equal volume of ethyl alcohol had been added, was titrated against standard barium chloride. The rate of change of conductivity, measured during the titration by means of the instrument already described, exhibited a sharp discontinuity at the end-point. By this maiethod the low concentrations of sulphate encountered in the waters in- vestigated (0-10 mg./l. S04) could be estimated to within 02 mg./I. S04. A single determination took about 5 min.
Note on the presentation of results. The usual practice of representing thermal or chemical stratification by a series of vertical distribution graphs becomes impracticable when detailed results for frequent time and depth intervals are presented. One method, adopted by Birge & Juday (1911), is to plot the value of the physical variable or concentration on the ordinate, and time along the axis, and then to join the plotted valufes for each depth by a single line labelled for that depth. Another method employed here (cf. Yoshimura, 1936 a), offers certain advantages. As before, time is plotted along the axis, but the ordinate is depth in metres. The diagram thus represents a depth-time chart, and a separate one is prepared for each investigated property of the water. The value of this property in each sample is written on the diagram at the appropriate depth and time. Isotherms or isopleths (lines of equal con- centration) are then drawn freehand by inspection. In this way tables have been eliminated and the diagram provides a picture of the development of vertical distribution with time. With practice, detailed interpretation of the diagram becomes easy. Thus isotherms or isopleths bunched together at one depth indicate marked vertical stratification at that depth; changes in slope of the lines may indicate mixingr from above or below, and vertical lines show uniform distribution throughout the water column.
This content downloaded on Tue, 5 Mar 2013 12:33:17 PMAll use subject to JSTOR Terms and Conditions

CLIFFORD H. MORTIMER 287
RESULTS
Only a selection of the results can be presented here and only some of the conclusions can be indicated in the text. Further interpretation of the depth-
Tempera-Lure 4-20-
2 Mm temp at mght was - 210C
+10-
Rainfall
2-0
I1-0
Conditions on Windermere O= Flat calm. I =Calm, 2=Moderate. 3=Choppy, 4=Rough, 5=Very rough
I Apr I May. I June I July I Aug I Sept I Oct I Nov, I Dec I Jan F Feb I
Fig. 2. Meteorological records, 1939-40; air temperature (9 a.m. Ambleside), rainfall (daily totals Ambleside) and observations on Windermere (estimate of mean daily condition).
0. 19 0 16 8 18 5 20 0 Ice -
822
4 39 319 38
6~~~~~~~~~~~~~
P_( O 10
12 7 108 42~~~~~~~~~~~~~~~~~~~~~~~ 44
Mud 14117 4 -9- - I
1 1 i71 A I 16 rl681'5222 63 h 7J39 172i5 ,14 2i22 2q5 12 19 I 8 12I'171 2j 2I Apr May June July Aug. Sept Oct. Nov. Dec Jan. Feb.
Sampling dates.
Fig. 3. Esthwaite Water, 1939-40. Depth-time diagram of the distribution of temperature (' C.).
time diagrams is left to the reader. The full data may be inspected at Wray Castle.
Weather, lake temperature and dissolved oxygen. The influence of weather on lake temperature is clear from a comparison of Figs. 2 and 3. Data for
This content downloaded on Tue, 5 Mar 2013 12:33:17 PMAll use subject to JSTOR Terms and Conditions

288 Exchange of dissolved substances in lakes
wind are clearly inadequate. Daily observations of conditions on Windermere do not necessarily hold for Esthwaite Water 3 miles away, but the major oscillations in wind force may be considered to apply equally to both lakes.
The main features of the temperature cycle were as follows: Isothermal conditions continued into April. Thermal stratification commenced at the beginning of May, was destroyed by a gale in the middle of that month, but was re-established during the calm warm spell that followed. The epilimnion was deepened by rough weather at the end of June, the thermocline was pushed down to about 8 m. and throughout the summer was not very narrowly defined. Stability, i.e. thermal resistance to wind mixing, was highest between 8 and 12 m. As a result of surface cooling during September the epilimnion was progressively deepened until gales in the beginning of October re-established complete circulation.
11 9 10 1 2
4
~~Io ~ 1
0 12 / /
Samplmg dates in this and subsequent figures are the same as those shown in Fig 3
Apr I May Junel July I Aug I Sept I Oct. I Nov. i Dec I lan. IFeb.
Note. Deternmnations by Winkler procedure with no preliminary oxidation of reducmg substances.
Fig. 4. Esthwaite Water, 1939-40. Depth-time diagram of the dcstribution of dissolved oxygen (mg./l.).
As soon as thermal stratification was established the concentration of dis- solved oxygen below the thermocline began to fall (Fig. 4). The rate of fall at each level was progressively greater as depth increased. By methods illustrated in a later communication (Mortimer, in prep. I) it has been deduced that most of the oxygen absorption took place at the mud surface. Oxygen was completely consumed (unmodified Winkler determinations) in the lowest sample by the end of July. After this the de-oxygenated zone increased in height to above the 11 m. level in September, but was progressively destroyed by mixing with oxygenated water from above at the end of that month, finally disappearing at the overturn on 5 October. The high concentrations found at the surface during the summer represented percentage saturation values of over 100 at the temperatures concerned, produced in part at least by the photosynthetic activity of phytoplankton.
This content downloaded on Tue, 5 Mar 2013 12:33:17 PMAll use subject to JSTOR Terms and Conditions
CLIFFORD H. MORTIMER 289
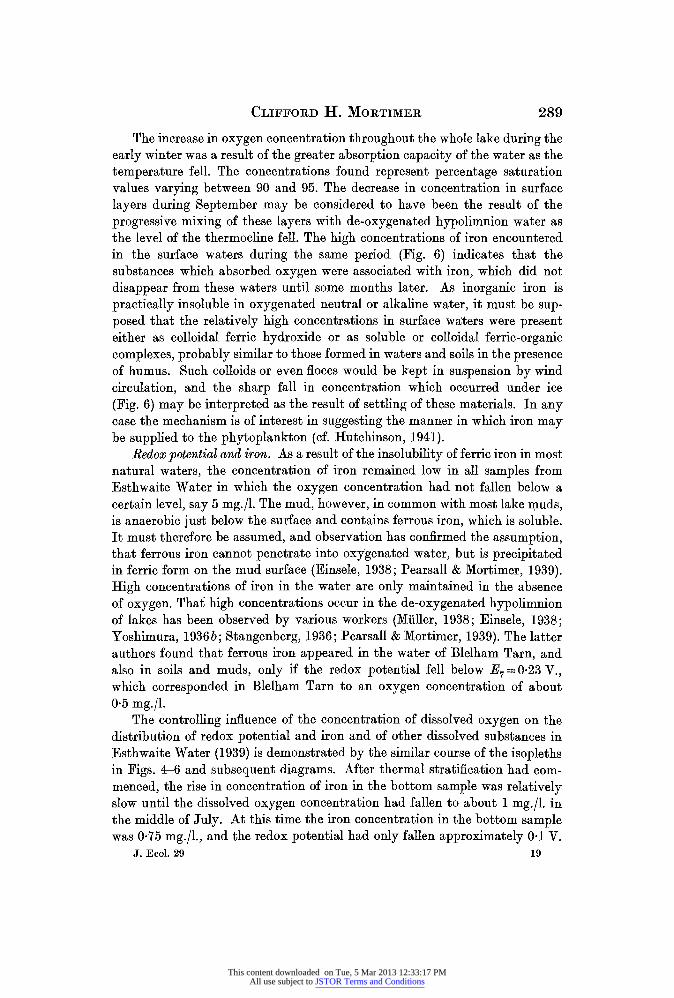
The increase in oxygen concentration throughout the whole lake during the early winter was a result of the greater absorption capacity of the water as the temperature fell. The concentrations found represent percentage saturation values varying between 90 and 95. The decrease in concentration in surface layers during September may be considered to have been the result of the progressive mixing of these layers with de-oxygenated hypolimnion water as the level of the thermocline fell. The high concentrations of iron encountered in the surface waters during the same period (Fig. 6) indicates that the substances which absorbed oxygen were associated with iron, which did not disappear from these waters until some months later. As inorganic iron is practically insoluble in oxygenated neutral or alkaline water, it must be sup- posed that the relatively high concentrations in surface waters were present either as colloidal ferric hydroxide or as soluble or colloidal ferric-organic complexes, probably similar to those formed in waters and soils in the presence of humus. Such colloids or even floces would be kept in suspension by wind circulation, and the sharp fall in concentration which occurred under ice (Fig. 6) may be interpreted as the result of settling of these materials. In any case the mechanism is of interest in suggesting the manner in which iron may be supplied to the phytoplankton (cf. Hutchinson, 1941).
Redox potential and iron. As a result of the insolubility of ferric iron in most natural waters, the concentration of iron remained low in all samples from Esthwaite Water in which the oxygen concentration had not fallen below a certain level, say 5 mg./l. The mud, however, in common with most lake muds, is anaerobic just below the surface and contains ferrous iron, which is soluble. It must therefore be assumed, and observation has confirmed the assumption, that ferrous iron cannot penetrate into oxygenated water, but is precipitated in ferric form on the mud surface (Einsele, 1938; Pearsall & Mortimer, 1939). High concentrations of iron in the water are only maintained in the absence of oxygen. Thaf high concentrations occur in the de-oxygenated hypolimnion of lakes has been observed by various workers (Muller, 1938; Einsele, 1938; Yoshimura, 1936 b; Stangenberg, 1936; Pearsall & Mortimer, 1939). The latter authors found that ferrous iron appeared in the water of Blelham Tarn, and also in soils and muds, only if the redox potential fell below E7= 0-23 V., which corresponded in Blelham Tarn to an oxygen concentration of about 0 5 mg./l.
The controlling influence of the concentration of dissolved oxygen on the distribution of redox potential and iron and of other dissolved substances in Esthwaite Water (1939) is demonstrated by the similar course of the isopleths in Figs. 4-6 and subsequent diagrams. After thermal stratification had com- menced, the rise in concentration of iron in the bottom sample was relatively slow until the dissolved oxygen concentration had fallen to about 1 mg./l. in the middle of July. At this time the iron concentration in the bottom sample was 0 75 mg./l., and the redox potential had only fallen approximately 0.1 V.
J. Ecol. 29 19
This content downloaded on Tue, 5 Mar 2013 12:33:17 PMAll use subject to JSTOR Terms and Conditions
290 Exchange of dissolved substances in lakes
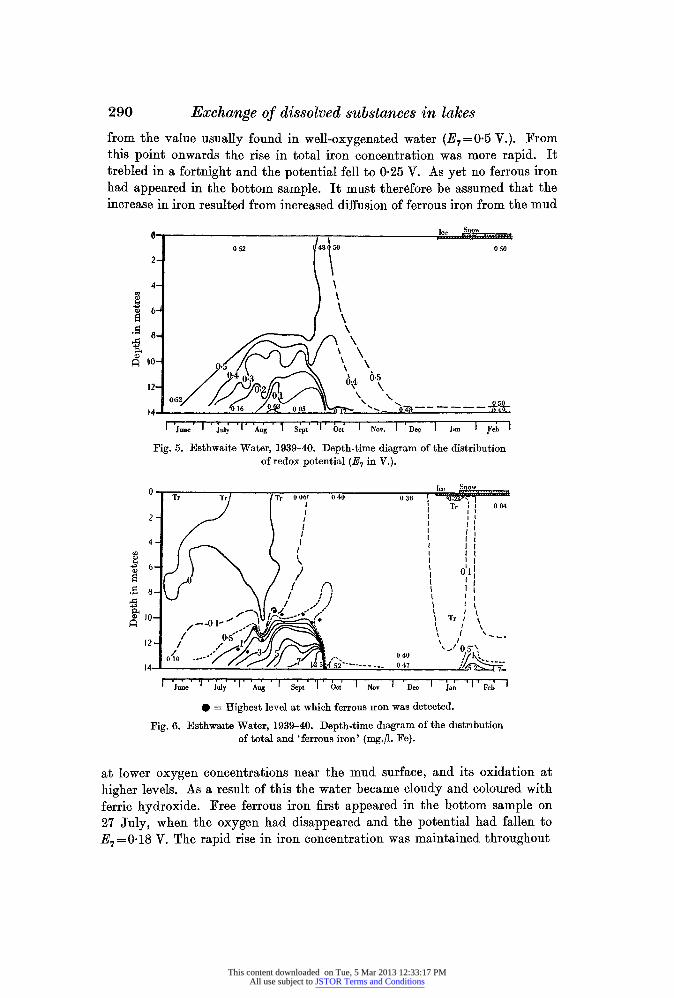
from the value usually found in well-oxygenated water (E7=0 5 V.). From this point onwards the rise in total iron concentration was more rapid. It trebled in a fortnight and the potential fell to 0-25 V. As yet no ferrous iron had appeared in the bottom sample. It must therefore be assumed that the increase in iron resulted from increased diffusion of ferrous iron from the mud
d_~~~~~~~~~~~~~~~~~~~~~~-c ..L I ....
052 148\50 050
4
06
10
0*4 4 0 05 12 o. ' \k
06~~~~~~~~~~~ 5 Q~~~~~~52 0 \ \~~~~~~~~~~~~~~ 2 016 ~ ,,,T ,~ , , 0
IJune juIy I Aug. Sept IOct Nov. I
Dee I Jan I FebI
Fig. 5. Esthwaite Water, 1939-40. Depth-time diagram of the distribution of redox potential (E7 in V.).
fee Snow
I 0.. . , . . . .......... . , , ......... , . .H 6
0 r Tr Tr 0 061 0 40 0 38 [CC Snow
* = Highest level at which ferrous lronTr 'aI 0d04
4 I
P-4 ea.~~~~~~~ I I
Fig. Tr Wo
of tota an ' eru io mg/.F)
~~I0 * I Tn 1
12 o~~~~~~~~~~~~~~ 4- 010 - 4
15 ~~~0 47
'June' 1ul; 'Aug Sept! Oct Nov 'Dec an Feb
0= Highest level at which ferrous iron was detected.
Fig. 6. Estliwaite Water, 1939-40. Depth-time diagram of the distribution of total and 'ferrous iron' (mg./I. Fe).
at lower oxygen concentrations near the mud surface, and its oxidation at higher levels. As a result of this the water became cloudy and coloured with ferric hydroxide. Free ferrous iron first appeared in the bottom sample on 27 July, when the oxygen had disappeared and the potential had fallen to E7 =0418 V. The rapid rise in iron concentration was maintained throughout
This content downloaded on Tue, 5 Mar 2013 12:33:17 PMAll use subject to JSTOR Terms and Conditions
CLIFFORD H. MORTIMER 291
the summer, reaching a maximum value in the bottom sample of 12-5 mg./l. on 28 September, by which date the potential had fallen to E7 = 005 V.
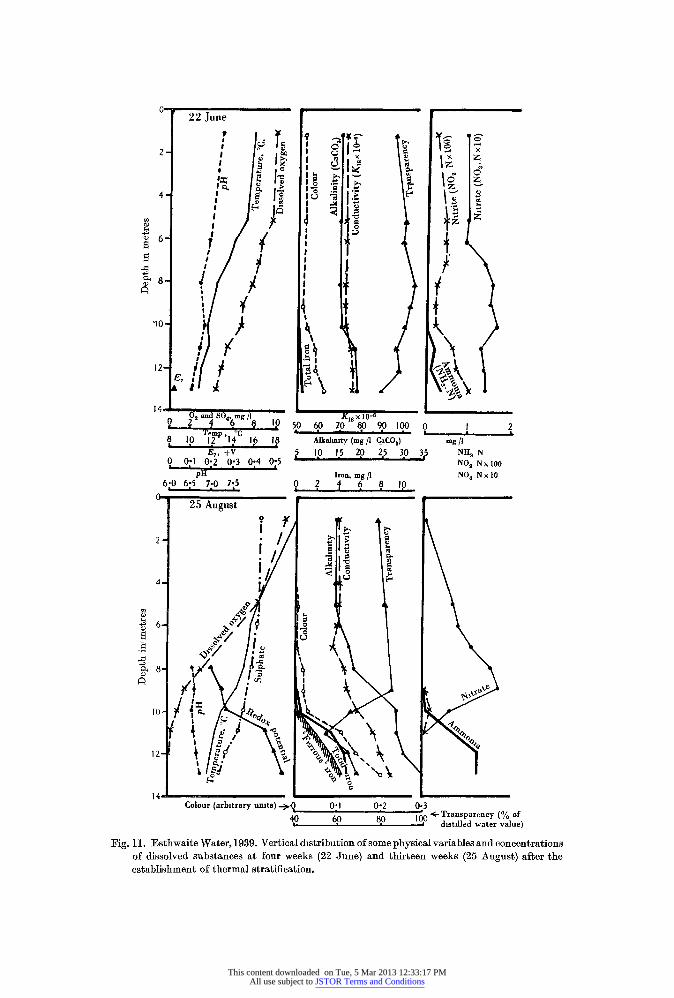
For reasons of space, data for ferrous iron are included on the total iron diagram (Fig. 6). As the summer proceeded it made up a progressively increasing part of the total iron in the hypolimnion (see Fig. 11) until on 28 September all the iron in the bottom sample was in the ferrous or ferrous complex state. The persistence at other levels of the de-oxygenated zone of some iron not in 'ferrous' form may have resulted from the presence of unionized ferrous complexes or from the slow rate of reduction of ferric complexes produced from the large-scale oxidation of ferrous iron during July and from the continuous oxidation and precipitation of iron, which may be expected to occur at the thermocline level. A turbidity maximum (cf. Fig. 11) indicated that oxidation of iron was in fact proceeding in the upper layers of the hypolimnion. These layers were considerably more turbid than the bottom water, which became clearer but more coloured as the summer proceeded. Possible accumulation of plankton at the thermocline level should also be borne in mind. The upper limits of occurrence of ferrous iron coincided with an oxygen concentration of approximately 0-5 mg./l. and a potential of approximately E7 = 0-25 V. An exception to this rule occurred during unstable conditions resulting from active mixing in the 10-13 m. layer on 28 September, a few days before the overturn. Ferrous iron was detected at 10 m. at a potential of 0 37 V. and oxygen concentration of 8-4 mg./I.
The restoration of dissolved oxygen to the mud surface at the overturn effected a rapid oxidation and precipitation of the iron, most1 of which was deposited on the mud surface (see Fig. 12). Nevertheless, as was pointed out earlier, the iron concentration in the whole lake remained relatively high during the early part of the winter. A sharp rise in redox potential was observed at the time of oxidation and precipitation of the iron, although the high spring values were not equalled until about 2 months later. These values are com- parable with those obtained in oxygenated sea water (Cooper, 1938) and oxygenated distilled water (Richards, 1928) if corrections are made for pH value. The fact that these potentials were not attained until December may be considered as further evidence that reducing materials were present in the water during the preceding months.
Colour. The time-depth distribution of colour is not figured. Colour was negligible in surface waters. In the hypolimnion it was partly due on some occasions to the presence of colloidal ferric hydroxide and partly to coloured soluble organic substances diffusing out of the mud. Colour due to this latter cause increased in the hypolimnion to a maximum just above the mud at the end of the stagnation period. After the overturn it was decreased to less than one-tenth of this value. A typical vertical distribution of colour during summer stratification is shown in Fig. 11, and a graph showing the seasonal variation of the 'total colour' in the water column is included in Fig. 13.'
19-2
This content downloaded on Tue, 5 Mar 2013 12:33:17 PMAll use subject to JSTOR Terms and Conditions

292 Exchange of dissolved substances in lakes
From the sharp fall in total colour at the overturn it is apparent that much of the soluble organic matter is removed at the same time as iron.
Silica (Fig. 10) also showed a progressive increase in concentration from 1 to over 3 mg./l. SiO2 in the hypolimnion during the course of the summer. The mean concentration after the overturn was 2-0 mg./l. This represents a
4 66 66 67 Ie So
75 68- 7O ., 2 70
4 65 69
6~~~~~~
-4~
105
May June
July Aug' Sept 'Oct' Nov 1 Dec Jan
Fig. 7. Esthwalte Water, 1939-40. Depth-time diagram of the distribution of electrical conductiviity (K18 x 10-6).
Ie Snow
oz0 '0l ? ? o-i 003 0 ; d 001
4 1 L 0oW ,0 j 05 ~~~0 02 0 2 5 002 0 05 1
6 8. 2 oq0J W i
81 0 i
28 N1 01 T JueJul; 4'Spt0 Nov Dec J.. Fe
Fig. 8. Esthwaite Water, 1939-40. Depth-time diagram of the distribution of ammonia (mg./I. NH,. N).
slight decrease in mean concentration of silica in the whole water column of 0-1 mg. as a result of the overturn. The corresponding decrease during 1940 was greater (Fig. 12). This point is discussed later.
Electrical conductivity ( x 0-63 = total dissolved salts; cf. Kitto 1938) rose at the mud surface from about '70 at the beginning of June to 109 on 28 September. This corresponds to an increase in total dissolved salts of
This content downloaded on Tue, 5 Mar 2013 12:33:17 PMAll use subject to JSTOR Terms and Conditions

CLIFFORD H. MORTIMER 293 approximately 60 mg./l. It is shown in later discussion that this increase can be accounted for by the observed increases in iron, ammonia and other bases. At the overturn there was a sharp fall in the mean conductivity of the whole water column from 76 to 67, a decrease of 12 %. It is suggested in later dis- cussion that this amount must have been absorbed by the mud, as the period
fe -S.now 28 0 of t, 0 I J N 07/ 36
025 0.0 I \JI I .2%
10 ~ ~ ~ 0 6o 8 1 0 3N)k a
{\/~ :-
0I2
Fig 10. Esha.t Watr3990 et-ledi.r ftedsrbto
Q 0/ 12 ~ ~ ~ ~ .
O3~~~~~~~~~~~~~ ~ ~ ~ N0 26
14- _________ 11*
between 28 SeptemberI Snd5Octobert wasnoct Nov Dec Jan Febi
---=Limit of detectable nitrite, * > 0 0005 mg /1 JNO2 N, & > 0 005 mg/i NO2 N
Fig. 9. Esthwaite Water, 1939-40. Depth-time diagram of the distribution of nitrate (NO03.N) and nitrite (N0m.N).
045 0 15k6/' 1 32 2/ 4/ 6 I 8 0 -
beg0 1s5 err rm5
12 2
Ma; I Jne 1 JI '1 Ag I Sept.'' c' Nov. I Dec
Fig. 10. Esthwaite Water, 1939-40. Depth-time diagram of the distribution of silicate (SiO2).
between 28 September and 5 October was not long enough for any change in the conductivity of the inflow water to have caused this decrease.
Ammonia, nitrite and nitrate (Figs. 8, 9, 11). The rise in ammonia concen- tration in the hypolimnion followed a similar course to that of iron, although it began somewhat earlier, reaching a maximum of 2-6 mg./I. Nil3. N just above thie mud surface on 22 September. In the epilimnion, and in the whole lake
This content downloaded on Tue, 5 Mar 2013 12:33:17 PMAll use subject to JSTOR Terms and Conditions
22 June
2 b' 0 2 0 x
pH Iron mg /1 N x1 ho 6- 70 75 ?, ? , 6 .
14
12.
02ou (abtandS0 Kms X0 0 1 0-62
0 6~~~~0 70 80 0 -10 0 1 rnprnc ?Oo
F 1 t eWater, 1639. V i I me pi
612 7: #50 2 8
6o5 disle usacsa or ek 2 ue n hren ek 2 uut feh
14 e
0 ?281 54, ig /1K18 iO T6 ~ P0008910
10
12
141
di ~ ~ ~ ~ ~ ~ & isildwtrvle
F ig .EtwieWtr199Vetclcsrbtoofsmphsclvralsadcnetain
ofdsole ubtnesa ou eks(2Jne n titenwes 2 ugs)afenh esabihmnto tera sraiictin
This content downloaded on Tue, 5 Mar 2013 12:33:17 PMAll use subject to JSTOR Terms and Conditions

CLIFFORD H. MORTIMER 295
after the overturn, the ammonia concentration was normally about 1/100 of this value. It will be seen that the increase in ammonia was about ten times the equivalent amount of nitrate reduced in the hypolimnion. This point will be discussed later. The nitrate diagram shows that rapid reduction of nitrate occurred in the hypolimnion when the oxygen concentration and the redox potential had fallen below approximately 2 mg./l. and E7= 0-4 V. respectively. Depletion of nitrate also occurred in the epilimnion. This may be mainly due to assimilation by algae. Hence the highest concentrations were found in the
i 8- Overturn
16 0
14 Total iron/
~12 --
>iZ ] Sihcate V|l (I 94O>./
0~~~~~~~~~~~~~~~~~~~~~~ _ t0C concentr2ati/on \ j 004
a 2"-t 13m3'02
t ez NE /? IN L V Tz~~~~~~~~~~~~~~~~06 Ca
6 .60 Ph Ete/
Ca ~~~~~~~~~~~~~~~~~~~~~~~~~~~~~~~~~~0
>, ~June July Aug. Sept. Oct. Nov.-
Fig. 12. Esthwaite Water, 1939 and 1940. Variation in total content of iron and ammonia (1939), silicate and phosphate (1940), in the water column (0-13 in.) above 1 sq. m. of mud surface at the sampling station. This is compared with the oxygen concentration and redox potential in the lowest sample (13 in.).
thermocline region, where a slow increase during August was observed. There was a steady increase in the nitrate content of the whole water column during the early winter, although a lag of about 1 month intervened between the over- turn and the commencement of this increase. Thus on 28 September the mean concentration (NO3. N) throughout the whole water column was O-068 mg./1. and by 19 October it had only risen to O 079.
Data for nitrite have been included on the nitrate diagram. Nitrite was only found in very small concentrations and, as the diagram shows, the greatest
This content downloaded on Tue, 5 Mar 2013 12:33:17 PMAll use subject to JSTOR Terms and Conditions

296 Exchange of dissolved substances in lakes
amounts were found in the thermocline region, usually a metre or so above that level at which nitrate was completely reduced and a rise in ammonia concentration observed. This supports the view, expressed by Pearsall & Mortimer (1939), that the main source of nitrite is nitrate reduction and not ammonia oxidation. Experiments, mentioned later in discussion, have shown that little oxidation of ammonia takes place in the water. Nitrite was absent from the fully reduced hypolimnion, but traces were often found in surface waters. These may have been associated with the activities of the phyto- plankton.
$u7phate and sulphide. The conductometric method of sulphate estimation was not developed until the summer of 1939, and the data presented here for that year are confined to a typical vertical distribution during August (Fig. 11). Sulphate became progressively depleted in the hypolimnion during the course of the summer. The lowest concentration recorded was 2-6 mg./l. S04 just over the mud surface on 28 September. The concentration throughout the whole water column rose almost immediately after the overturn to the winter value of about 9 mg./l. S04. More complete data for sulphate are presented in ? III. In a later communication (Mortimer, in prep. I) it will be demon- strated that depletion of sulphate in the hypolimnion of Esthwaite Water, 1940 can be accounted for by reduction at the mud surface, and that reduction in the water was negligible. Neither during 1939 nor during 1940 was the sul- phate in the hypolimnion completely reduced.
Concentrations of soluble sulphides in the hypolimnion were too small to be estimated by standard methods, although H2S was detected by smell in the lowest samples during August and September, and black cloudiness due to colloidal ferrous sulphide appeared in the lower hypolimnion during the latter month. Production of ferrous sulphide in the water was not observed during 1940. The pH of the lower hypolimnion during September was about 6-9. As a result of the extremely low solubility coefficient of ferrous sulphide at this pH, almost complete removal of sulphide ions from solution occurs in the presence of ferrous ions (cf. Einsele, 1937). This probably explains why no soluble sulphide could be detected.
Alkalinity and pH. A progressive rise in alkalinity occurred in the hypo- limnion during stagnation. The course of this rise and of the corresponding fall after the overturn was, similar in almost every detail to that already described for conductivity. Hence a time-depth diagram for alkalinity is omitted. The relation of alkalinity and conductivity is discussed later. In the absence of free mineral or organic acids, pH depends on the relative concentrations of free carbon dioxide and alkalinity. In fact, if any two members of this triple relation are known, the third may be computed (convenient graphs in Moore, 1939). Thus it would be possible to compute the concentration of dissolved C02 in Esthwaite Water from the pH and alkalinity values found. This has not been done, as the results of direct CO2 determinations are described in
This content downloaded on Tue, 5 Mar 2013 12:33:17 PMAll use subject to JSTOR Terms and Conditions

CLIFFORD H. MORTIMER 297
? III. 'It will be shown there that the rate of CO2 production in the hypolimnion was high while the dissolved 02 was being reduced, but that little anaerobic CO2 production took place subsequently. This explains why, during 1939, the pH at 13 m. was observed to fall from 6-9 to 6-5 during June, as a result of C02 accumulation in the hypolimnion. Later, as the alkalinity increased, the pH at 13 m. rose to 6-9 at the end of September. This difference in the vertical distribution of pH at the beginning and towards the end of stagnation is illustrated in Fig. 11.
Phosphate. Estimations of phosphate were only carried out on a few samples from Esthwaite Water during 1939. Distribution of phosphate was studied in more detail during 1940 and discussion is deferred until ? III. During both years the phosphate concentration in the hypolimnion rose from the extremely low values prevalent in oxygenated water (about 0001 mg./l. P) to over a hundred times this concentration in de-oxygenated layers. This agrees with previous findings (Pearsall & Mortimer, 1939) and with the explanation advanced by Einsele (1938). He showed that under oxidizing conditions phosphate is precipitated in the presence of iron as insoluble ferric phosphate on the mud surface. When this is reduced, soluble phosphate is liberated.
Manganese. Discussion of the distribution of manganese is postponed until ? III.
DISCUSSION
(a) Deductions from the distribution of temperature and dissolved substances in the hypolimnion
The course of the isopleths in Figs. 4-10, and indeed the fact that vertical chemical stratification is maintained in the water column, suggests that the main agents of production or depletion of dissolved substances are located at the lower boundary of the column, at the mud surface. If the water were completely stagnant, i.e. in the absence of motion of water masses, transport of dissolved substances to and from the mud surface would be the result of molecular diffusion, the laws of which can be deduced from consideration of the random movements of molecules (Mortimer, in prep. I). In lakes this mode of transport is confined to the water within the interstices of the mud. In the water above the mud some motion of water masses occurs under almost all natural conditions, and it may be demonstrated that even the slowest of these movements, e.g. convection currents under ice, produces turbulent eddies which are instrumental in spreading heat, dissolved substances or other pro- perties in the water. In a water column, of sufficient magnitude compared with the mean diameter of the eddies, the spread of a property by 'turbulent' or ' eddy diffusion', considered over a period sufficiently long to average out short- term fluctuations, approximates, to that produced by random motion. In other words the laws of diffusion and heat conduction may be directly applied (Schmidt, 1925). The fundamental assumption, verified by experiment, at the
This content downloaded on Tue, 5 Mar 2013 12:33:17 PMAll use subject to JSTOR Terms and Conditions

298 Exchange of dissolved substances in lakes basis of these laws is that the amount (F) of substance or heat, etc., passing across a boundary of unit area in unit time is the product of the appropriate coefficient of conduction or diffusion (K) and the gradient of temperature, con- centration, etc., existing at the boundary along anc axis normal to it. Thus considering diffusion of a dissolved substance and employing c.g.s. notation:
Amount in grams diffusing across 1 sq. cm. =Ft=Kt (gradient, g./cm.), (1) where t is the duration of the period in seconds and K may either be the coefficient of molecular diffusion or the coefficient of turbulent diffusion. Following Schmidt (1925) the letter A is employed for the latter (A= 'Austauschkoeffizient') to distinguish it from K, the coefficient of molecular diffusion.
Changes in the vertical distribution of dissolved substances and tem- perature may, in favourable instances, be used in conjunction with formula (1) to obtain an estimate of A. The method at the basis of all such estimations in this paper is illustrated by the following calculation of a mean value of A at the 12 m. level in Esthwaite Water during the period 27 July to 31 August 1939. Data for total iron were utilized and c.g.s. notation was employed throughout. This period was selected as one during which free exchange of iron between mud and water occurred (see later discussion) and because the increase in the iron content of the water column above 12 m. during the period was considerable. As the mud was the only source of iron, this increase (6.4 x 10⁻⁴ g./sq. cm., obtained by summing the mean iron content of each metre panel above 12 m.) must have been transported up through the 12 m. level by eddy diffusion. The mean concentration gradient at this level may be taken as roughly the mean of the differences in concentration between 11 and 12 m. and 12 and 13 m. on all the sampling dates during the period, and was computed as 0-84 mg./l./m. or 8-4 x 10⁻⁹ g./c.c./cm. Substituting in formula (1), where 86-4 x 10³ is the number of seconds in a day and 34 days the length of the period,
A- 6-4 x 10⁻⁴ 2-6 xlo-2 8-4 x 10-9 x 34 x 86-4x 10³ Similar estimates can be made in all cases in which it is certain that all of
the increase in heat or concentration of dissolved substance on one side of the level investigated has been derived from the other side by diffusion, and as long as the stratification of temperature or concentration in the region of that level is large enough to enable reliable estimates of the gradient to be made. In favourable cases a rough estimate of A can be made more rapidly from the spacing and slope of the isotherms or isopleths on a depth-time diagram. Values of A, or more strictly speaking A + K, at various levels in the hypolimnion of Esthwaite Water, estimated as above from the distribution of various pro- perties, are collected in Table, 1. Values for Schleinsee were estimated from data obtained by inspection of Einsele & Vetter's (1938) diagrams and are ncluded here for comparison.
This content downloaded on Tue, 5 Mar 2013 12:33:17 PMAll use subject to JSTOR Terms and Conditions
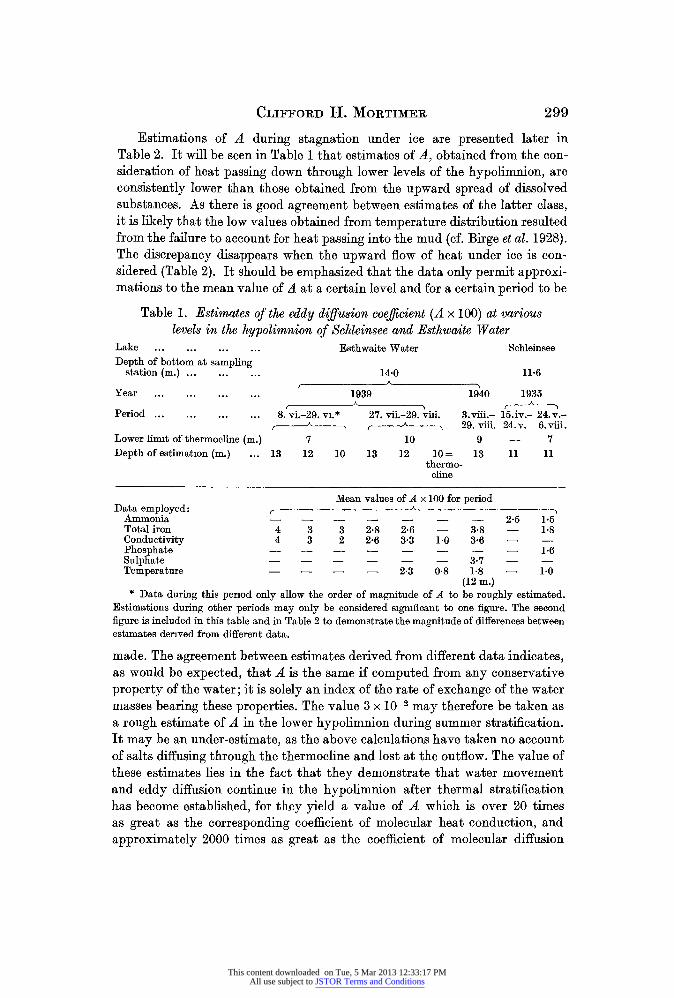
CLIFFORD H. MORTIMER 299 Estimations of A during stagnation under ice are presented later in
Table 2. It will be seen in Table 1 that estimates of A, obtained from the con- sideration of heat passing down through lower levels of the hypolimnion, are consistently lower than those obtained from the upward spread of dissolved substances. As there is good agreement between estimates of the latter class, it is likely that the low values obtained from temperature distribution resulted from the failure to account for heat passing into the mud (cf. Birge et at. 1928). The discrepancy disappears when the upward flow of heat under ice is con- sidered (Table 2). It should be emphasized that the data only permit approxi- mations to the mean value of A at a certain level and for a certain period to be
Table 1. Estimates of the eddy diffusion coefficient (A x 100) at various levels in the hypolimnion of Schleinsee and Esthwaite Water
Lake . ... ... ... Esthwaite Water Schleinsee Depth of bottom at sampling
station (m.) ... ... ... 14-0 11-6
Year ... ... ... ... 1939 1940 1935
Period ... ... ... ... 8. vi.-29. vi.* 27. vii.-29. viiLi. 3.viii.- 15.iv.- 24.v.- f, - , - 29. viii. 24. v. 6.viii.
Lower limit of thermocline (m.) 7 10 9 7 Depth of estimation (n.) ... 13 12 10 13 12 10= 13 11 11
thermo- cine
Mean values of A x 100 for period Data employed:
Ammonia 2-5 1-5 Total iron 4 3 3 2.8 2-6 - 3-8 - 1-8 Conductivity 4 3 2 2-6 3-3 10 3-6 Phosphate - - 1-6 Sulphate - - - - 3-7 Temperature - - - 2-3 0-8 1-8 - 10
(12 m.) * Data during this period only allow the order of magnitude of A to be roughly estimated.
Estimations during other periods may only be considered significant to one figure. The second figure is included in this table and in Table 2 to demonstrate the magnitude of differences between estimates derived from different data.
made. The agreement between estimates derived from different data indicates, as would be expected, that A is the same if computed from any conservative property of the water; it is solely an index of the rate of exchange of the water masses bearing these properties. The value 3 x 10⁻² may therefore be taken as a rough estimate of A in the lower hypolimnion during summer stratification. It may be an under-estimate, as the above calculations have taken no account of salts diffusing through the thermocline and lost at the outflow. The value of these estimates lies in the fact that they demonstrate that water movement and eddy diffusion continue in the hypolimnion after thermal stratification has become established, for they yield a value of A which is over 20 times as great as the corresponding coefficient of molecular heat conduction, and approximately 2000 times as great as the coefficient of molecular diffusion
This content downloaded on Tue, 5 Mar 2013 12:33:17 PMAll use subject to JSTOR Terms and Conditions
300 Exchange of dissolved substances in lakes
of most common solutes. This considerable difference between the rate of transport of substances in the mud, where molecular diffusion alone is operative, and in the water, even under conditions of thermal stratification, explains many of the phenomena described and discussed later.
The above calculations should not, however, give the impression that A, is at all constant in value at any point for the whole of the periods investigated. It will be suggested later in ? IV that water movements in the hypolimnion result from wind-induced instability in the thermocline region. Although there is not space here to demonstrate the relation of weather and the magnitude of A in the hypolimnion, an inspection of the course of the isotherms and isopleths on the depth-time diagrams will show that considerable variations occur and that these are associated with variations in wind force. Examples of this may be found in the increase in slope of the oxygen isopleths indicating increased mixing in the central hypolimnion (11-12 m.) at the end of June 1939, and a similar increase in slope of the isotherms at the end of August 1940, both as a result of rough weather. Neither should it be assumed that A has the samle value at all levels of the hypolimnion. It is to be expected that A is con- siderably reduced in regions of considerable thermal (density) stratification, as turbulent exchange in such regions also involves work against gravity. The results of attempts to determine the magnitude of A in the thermocline region, on somewhat inadequate data, are included in Table L The low values found illustrate the effect of the thermocline in isolating the hypolimnion from the epilimnion. In the epilimnion and in the whole lake during winter circulation A may be several hundred times as great as in the hypolimnion (Schmidt, 1925). It will, of course, fluctuate in value considerably with varying wind force. A direct result of the occurrence of these high A values is the virtual disappear- ance of detectable concentration or temperature gradients in the water. A consideration of formula (1) will show that, if the rate of supply of heat or a solute at a terminal boundary of the water column (i.e. lake surface or mud surface) varies only within fairly narrow limits, the concentration gradient must vary inversely as A, which clearly varies enormously at different levels and seasons. In the mud, on the other hand, where the exchange coefficient is reduced to that of molecular diffusion, steep concentration gradients are found to be compressed into the dimensions of a few millimetres ('micro- stratification', Alsterberg, 1927, 1930), cf. ? III.
The distribution and transport of properties in the lake system will be considered in more detail in a later communication (Mortimer, in prep. I). By means of the application of methods of mathematical physics it is possible to assess the relative influence of reactions in the mud and in the water on changes in the distribution of dissolved substances in the mud-water system. The conclusions reached are that reactions in the mud are largely responsible for changes in distribution in the water; movement of water masses in the hypolimnion is mainly horizontal and this is sufficient to maintain an eddy
This content downloaded on Tue, 5 Mar 2013 12:33:17 PMAll use subject to JSTOR Terms and Conditions

CLIFFORD H. MORTIMER 301
diffusion coefficient and a rate of spread of dissolved substances roughly two thousand times as great as would occur if molecular diffusion alone were operative. How these water movements may be produced is discussed later.
(b) Seasonal variations in the rate of exchange of dissolved substances between mud and water
In Fig. 12 variations in total content of certain dissolved substances in the water column of 1 sq. m. cross-section, extending from 13 m. to the surface, are plotted for Esthwaite Water, 1939. If these are compared with the dis- solved oxygen concentration and redox potential in the lowest sample (13 m.), certain correlations become apparent.
Only the more striking changes may be correlated with redox conditions in the hypolimnion, as the effect of slow changes resulting from variations in composition of inflow water has not been considered. The sequence of events may be described as follows: Removal of oxygen from the hypolimnion (see Fig. 13) commenced as soon as thermal stratification was established. The depletion rate was fairly constant during the initial stage, but became less at the point when the oxygen concentration in the bottom sample had fallen to abo4t 2 mg./l. This reduction in depletion rate may have been the result of a corresponding decrease in the concentration gradient at the mud surface. Up to this time (stage I), alkalinity, iron and colour had increased slightly. The next stage (II), during which the oxygen concentration and redox potential at 13 m. fell to 0 5 mg./l. and E7= 0-25 V. respectively, was marked by an acceleration in oxygen depletion rate (Fig. 13) and the beginning of a sharp rise in the content of iron, and an increased rate of accumulation of 'total salts' (conductivity x 0-63; cf. Kitto, 1938), alkalinity and colour (Figs. 12-14). Turbidity also increased during stage II. From the data for phosphate and silicate for Esthwaite Water, 1940 (included in Fig. 12, because they are more complete than data for 1939) it may be assumed that stage II also marks the beginning of a rise in silicate and a considerable rise in phosphate content.
It is suggested here and proved in later sections that stage II is initiated by a fall in oxygen concentration and redox potential at the mud surface to a level at which oxidized insoluble ferric substances including ferric phosphate are reduced in the mud surface. This liberates soluble ferrous iron and probably other reducing substances into the water. As long as the potential at the mud surface is maintained below this level, i.e. until the autumn overturn, diffusion of ferrous iron, phosphate, etc., from mud into the water continues. It has been shown earlier that the rate of spread of these reducing substances was increased roughly 2000 times as soon as they left the mud and came under the influence of eddy diffusion in the water. The acceleration in the oxygen depletion rate between 6 and 13 July, was probably a direct result of this liberation and accelerated spread of ferrous iron and other reducing substances into the water. The oxygen concentration and redox potential at 13 m. fell
This content downloaded on Tue, 5 Mar 2013 12:33:17 PMAll use subject to JSTOR Terms and Conditions
302 Exchange of dissolved substances in lakes
during this period from 2*5 to 0*5 mg./l. and from 0-42 to 0-25 V. respectively. It is probable that the corresponding values at the mud surface (.14 m.) were lower at this time.
The oxidation of this ferrous iron produced a marked increase in turbidity and colour due to the precipitation of ferric hydroxide in colloidal or finely suspended state. Free ferrous iron was not detected in the water in amounts sufficient for estimation until 27 July. After this date the rate of increase of total iron became even more rapid and an increasing proportion of it consisted
Colour ?\ r A A 30 (tcl 0-13 3 m .
25 ~ ~ "
20C
stage u Stage II Sitage III fr~~~~~~~~~~~~~~~~~~~~~~~~~~~~~~~~~~~~~~~~~~~~~~~~~~~~~~~~~~~~~~~~~~~~~~~~~~~1
andammniaoxygen atthe Ammoniat
I0 C
5 1Nitrate.
June July Aug ~~Sept Oct., Nov
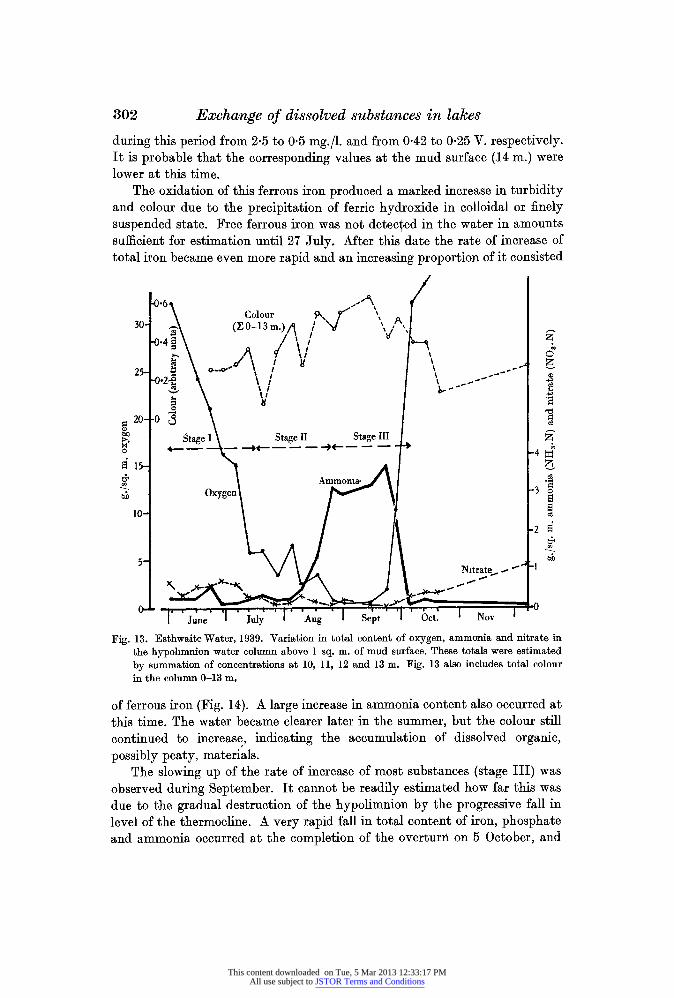
Fig. 13. Esthwaite Water, 1939. Variation in total content of oxygen, ammonia and nitrate in the hypolimnion water column above 1 sq. m. of mud surface. These totals were estimated by summation of concentrations at 10, 11, 12 and 13 m. Fig. 13 also includes total colour in the column 0-13 m.
of ferrous iron (Fig. 14). A large increase in ammonia content also occurred at this time. The water became clearer later in the summer, but the colour still continued to increase, indicating the accumulation of dissolved organic, possibly peaty, materials.
The slowing up of the rate of increase of most substances (stage III) was observed during September. It cannot be readily estimated how far this was due to the gradual destruction of the hypolimnion by the progressive fall in level of the thermocline. A very rapid fall in total content of iron, phosphate and ammonia occurred at the completion of the overturnL on 5 October, and
This content downloaded on Tue, 5 Mar 2013 12:33:17 PMAll use subject to JSTOR Terms and Conditions
CLIFFORD H. MORTIMER 303
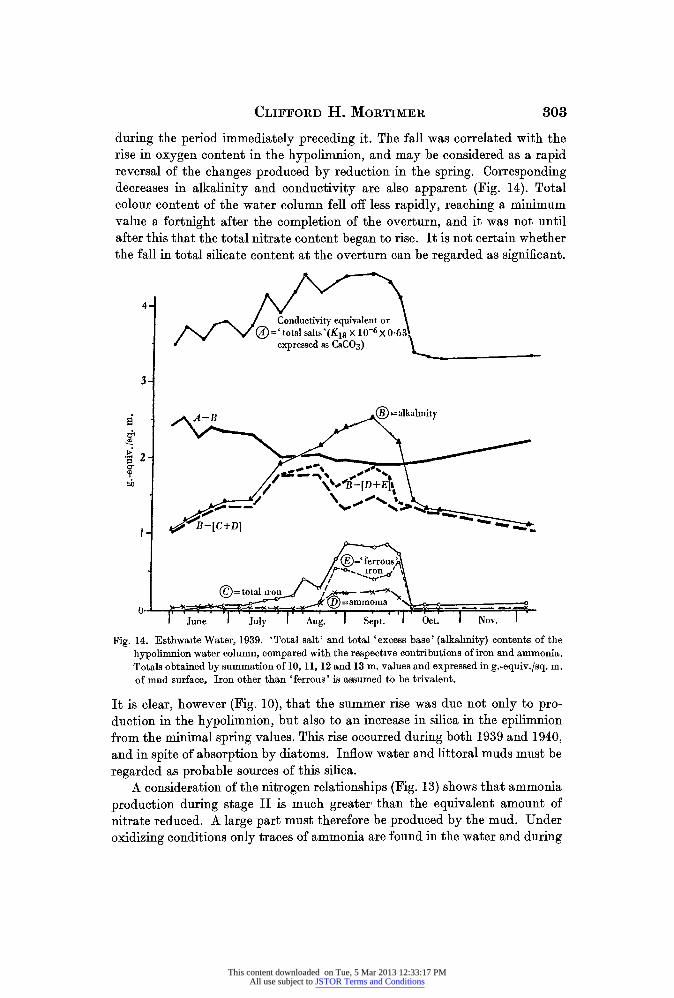
during the period immediately preceding it. The fall was correlated with the rise in oxygen content in the hypolimnion, and may be considered as a rapid reversal of the changes produced by reduction in the spring. Corresponding decreases in alkalinity and conductivity are also apparent (Fig. 14). Total colour content of the water column fell off less rapidly, reaching a minimum value a fortnight after the completion of the overturn, and it was not until after this that the total nitrate content began to rise. It is not certain whether the fall in total silicate content at the overturn can be regarded as significant.
4 Conductivity equivalent or
v ='total salts'(K8 X 10-6XO-63, expressed as CaCO3)
&=Jalkalinity
. 2
> /// \sS'B -[~~~~~~D +El \
ie _ ron
(j= total iron =ammonia __ _
1June 'July IAug. Sept. I Oct. I Nov.
Fig. 14. Esthwalte Water, 1939. 'Total salt' and total 'excess base' (alkalmity) contents of the hypolimnion water column, compared with the respective contributions of iron and ammonia. Totals obtained by summation of 10, 11, 12 and 13 m. values and expressed in g.-equiv./sq. m. of mud surface. Iron other than 'ferrous' is assumed to be trivalent.
It is clear, however (Fig. 10), that the summer rise was due not only to pro- duction in the hypolimnion, but also to an increase in silica in the epilimnion from the minimal spring values. This rise occurred during both 1939 and 1940, and in spite of absorption by diatoms. Inflow water and littoral muds must be regarded as probable sources of this silica.
A consideration of the nitrogen relationships (Fig. 13) shows that ammonia production during stage II is much greater than the equivalent amount of nitrate reduced. A large part must therefore be produced by the mud. Under oxidizing conditions only traces of ammonia are found in the water and during
This content downloaded on Tue, 5 Mar 2013 12:33:17 PMAll use subject to JSTOR Terms and Conditions

304 Exchange of dissolved substances in lakes
thermal stratification no large increase occurred before August when the oxygen concentration had fallen to a low level and ferrous iron had appeared in the water. This suggests that nitrification (ammonia oxidation) occurs mainly at the mud surface, for if it occurred to any great extent in the water during winter circulation, i.e. if ammonia were given off from the mud and oxidized in the water, it would be expected that ammonia would have accumulated in the hypolimnion right from the commencement of thermal stratification, especially as nitrate reduction commenced at this time. The view that the oxidized mud surface is the main seat of nitrification is supported by the results of experiments, not described here, in which it was found that additions of ammonia to natural waters in vitro were not oxidized, but that considerable nitrate production occurred if small amounts of surface mud were added. If the period October to November may be taken as a fair comparison with August, it appears that the rate of supply of saline nitrogen to the water is much greater in the form of ammonia during stagnation (August) than as nitrate during circulation (October-November), and this takes no account of the fact that part of the winter increase must be attributed to an increase in nitrate content of inflow water (Mortimer, 1939). This suggests that, under oxidizing conditions at the mud surface, not all the ammonia diffusing into the miiud surface is oxidized, but that a large part must be adsorbed.
Further information may be derived from an analysis of the increases in conductivity ('total salts') and alkalinity observed during thermal stratification and the corresponding decreases at the overturn (Fig. 14). In most natural waters only a portion of the cations (bases) is balanced by available mineral acid anions (-C1, 3S04, -NO3, TPO4, etc.). This portion with equivalent anions may be termed the 'neutral salt content', bearing in mind that in most waters dissolved salts are almost completely dissociated. Bases in excess of this portion may be considered to be combined with carbonate, or more commonly, bicarbonate. The amount of this 'excess base' is approximately that measured by the alkalinity determination. It is clear that part of the rise in alkalinity in the hypolimnion of Esthwaite Water must have been due to the increase in ferrous iron and ammonia (which may be considered to be in the form of bicar- bonates) and possibly to the presence of ferric hydroxide as well. In order to determine how large this part is, the total content of alkalinity (expressed as CaCO3), total iron, ferrous iron and ammonia, in gram-equivalents per sq. m. for the water column 9-5-13-5 m., have been plotted against time in Fig. 14. Further, it was pointed out by Ruttner (1921) and Niumann (1936) that a part of the electrical conductivity of a water is due to substances producing alkalinity, the other part being attributed to the 'neutral salt content'. By determining the 'conductivity equivalent' of the alkalinity value (assuming it all to be due to calcium bicarbonate), these authors have enabled the relative magnitudes of the alkalinity and neutral salt fractions to be assessed from conductivity and alkalinity determinations. In all waters in which bicarbonate
This content downloaded on Tue, 5 Mar 2013 12:33:17 PMAll use subject to JSTOR Terms and Conditions

CLIFFORD H. MORTIMER 305
is the main anion (most fresh waters) a closely similar result may be aehieved by multiplying the conductivity by Kitto's (1938) factor, 0-63, to convert it into 'total salt', and comparing this with alkalinity, both being expressed as CaCO3. This has been done in Fig. 14 and, as only. a relative comparison is required here, 'total salt (as CaCO3)' has been plotted on the same scale of gram-equivalents per sq. m. as alkalinity, iron, etc.
Comparisons yield the following information. 'Total salt' minus -alkalinity (line A - B) represents the equivalent content of the 'neutral salt fraction'. Bearing in mind the limitation of this comparison, no marked change in the ' neutral salt content' is apparent throughout the whole period under review. The slight decrease observed during the stagnation period may have been partly due to the fact that the alkalinity value may have included some substances, e.g. ferric hydroxide, in precipitated or unionized complex form, not included in the conductivity value, and partly due to sulphate reduction and precipitation as ferrous sulphide.
The line B - (C + D) represents the alkalinity equivalent with the equi- valents of total iron and ammonia subtracted. The marked rise shown by this line after 13 July must have been the result of the addition of bases other than iron and ammonia to the water column. The apparent fall after 17 August might be attributed to one or both of two causes. Either some part of the total iron, e.g. precipitated ferric iron, was not included in the alkalinity value, or bases other than iron and ammonia were removed from the water column. The possibility of adsorption on colloidal ferrous sulphide or humus colloids in water or mud should be borne in mind. No evidence is available to show to what degree the first cause may have been operative. If it is assumed that all the 'ferrous iron' (line E, Fig. 14) is included in the alkalinity value, but that ferric iron is not, then the content of 'excess base' other than ferrous iron and ammonia, line B - (D + E), remained more or less constant until the middle of September, after which a decrease occurred at the overturn to a value which was almost identical with that on 13 July, before the summer increase began. This marked decrease at the overturn is clearly due to re-adsorption of bases, presumably mainly on the re-oxidized mud surface. The slow progressive fall in alkalinity during the early winter reflects a change which occurred through- out the whole of the water column and, as the conductivity remained constant during this period, this fall in alkalinity probably represents further adsorption of bases at the mud surface. As the difference between alkalinity and con- ductivity (A - B) was even greater at the beginning of June, it may be sup- posed that this adsorption of bases proceeds throughout the winter.
The above considerations suggest that the sudden increase of bases other than iron and ammonia which occurred after 13 July represents the liberation of an adsorbed store of bases from the mud at a time when the adsorbing agents, possibly colloidal ferric complexes in the mud surface, were destroyed by reduction. It will be remembered that other evidence (acceleration of
J. Ecol. 29 20
This content downloaded on Tue, 5 Mar 2013 12:33:17 PMAll use subject to JSTOR Terms and Conditions
306 Exchange of dissolved substances in lakes oxygen depletion and iron production) suggested that the mud surface had become completely reduced on this date.
The following description of events in the hypolimnion of Esthwaite Water may be advanced as a working hypothesis applicable to lakes in which de- oxygenation occurs. In the early stage (I) of oxygen depletion, during which the oxygen concentration and the concentration gradient at the mud surface is relatively high, depletion proceeds at a relatively high rate. This rate decreases as the concentration gradient at the mud surface falls. Active nitrate reduction occurs during this stage. The next stage in reduction (II) is initiated when ferric iron is replaced by ferrous at the mud surface, which occurs at a fairly definite redox potential level (about E7= 0-25 V.) and low oxygen concen- tration (about 05 mg./l.). The reduction of ferric iron results in the destruction of insoluble ferric complexes previously existing in the mud surface, and in the liberation to the water of bases, including ammonia, adsorbed on these com- plexes, as well as ferrous iron and other reducing material. The more rapid spread of these reducing substances by eddy diffusion in the water accelerates oxygen depletion. The depletion rate, of course, slows up finally as the avail- able oxygen disappears. The removal of adsorbing complexes in the mud surface allows a more free exchange of ions to take place between mud and water. Rise in ionic concentration is mainly due to rise in alkalinity. The concentration of ions in the water increases rapidly at first (stage II), and then more slowly (stage III), until oxygen is re-introduced into the hypolimnion at the overturn. If the potential falls low enough before this occurs sulphate may become reduced and, if pH is sufficiently high, the sulphide may be precipitated as ferrous sulphide, which may cause a decrease in iron concentration.
A rapid reversal of these changes occurs at the overturn. Iron is pre- cipitated from the water. Insoluble ferric complexes re-form in the mud surface, re-adsorbing much of the base content liberated during stagnation and re- constituting an adsorbent barrier in the sutface mud layer to free exchange of ions between mud and water. Slow adsorption of bases from the water by this layer continues through the winter. At the same time nitrification of a portion of the ammonia supply from the lower mud proceeds at the mud surface.
Work designed to test this hypothesis both in Esthwaite Water and in -artificial mud-water systems is described in succeeding sections. An attempt is made here to ascertain, as far as possible, whether these deductions may be confirmed by the examination of published data for other lakes. In one case only have sufficient physical and chemical data been published for a detailed comparison to be made. This comparison is especially valuable as the lake in question, Schleinsee (Einsele & Vetter, 1938), is in many ways similar to Esthwaite Water, a fact which is not so much a fortunate coincidence as might at first be supposed. The first author has already pointed out the importance of the iron cycle in lakes (Einsele, 1938) and has realized that oxidation-
This content downloaded on Tue, 5 Mar 2013 12:33:17 PMAll use subject to JSTOR Terms and Conditions

CLIFFORD H. MORTIMER 307
reduction processes and their influence on organic production are best dis- played for study in lakes representing a transition between oligotrophic and eutrophic type and shallow enough to produce oxygen depletion in the hypo- limnion.
The seasonal variation in total content of certain dissolved substances in the whole water column (0-11 m.) of Schleinsee, 1935, computed from values derived by inspection of Einsele & Vetter'g figures, has been plotted (Fig. 15)
?_ 18 / 1 \Overturn
Stage I Stage II Stage III
0~~~~~~~~~~~~~/3
1 44 Oxygen Z (~~~E7-1lm.
12 j 0P \_<
Silicate
8 08
Fig 1. chlinee 195.Toalconen o irn,slicae,phspatanammonia i h ae
~~ 6 ~~Oxygen oxygen concentro tion 1
2sg/q .o h a\ cl wt h /xeto Pos phopate )a ta
Ap. ay June Jul Au. Sp. Ot
emlydfrEtwiedt Fig.. 152lise,13.Ttlcotnfio, siliate phopae aeleindo amoniae in thewae yolumnio (0-11 in.) above1sql.ofwmda surflarcoatrte sapln sthatifoun, comparedwithte
oye rontnto ate hyol wderes cnn concentration
isug./sq.,m.uo the sametl scgaie (wihpteexption ofdin phihosphate)da bthatn
24 May and 4 July must have been the result of some addition of oxygen to 20-2
This content downloaded on Tue, 5 Mar 2013 12:33:17 PMAll use subject to JSTOR Terms and Conditions
308 Exchange of dissolved substances in lakes
the hypolimnion by mixing from above or by photosynthesis. As in Esthwaite Water, a marked acceleration of oxygen depletion occurred after the oxygen concentration in the bottom sample (11 m.) had fallen below 0 5 mg./l., and this immediately preceded a rapid rise in iron and phosphate content and the appearance of ferrous iron in the water. The slow spring rise in ammonia content, which occurred in Schleinsee, was not observed in Esthwaite Water, but a marked increase during August, rising to a maximum in September, occurred in both lakes. Total ammonia production was about 50 % higher in Schleinsee. The contents of iron, phosphate, ammonia and also silica exhibited a marked fall at the overturn similar to that observed in Esthwaite Water. Decrease of silica during the spring was attributed by Einsele & Vetter to diatom growth in the epilimnion. The most important difference between Schleinsee and Esthwaite Water consists in the higher calcium content of the former. Alkalinity in Schleinsee is about ten times that in Esthwaite Water. It will als? be noted that phosphate production in Schleinsee is also about ten times, while iron production is only about one quarter of, that in Esthwaite. These differences may be correlated with the higher calcium content of Schleinsee. (For convenience of plotting, phosphate is shown as P205 and on different scales in Figs. 12 and 15. Multiplication by 0 44 reduces these values to P.) Thus the Fe: P ratio in Schleinsee was about 8: 1, while in Esthwaite Water, taking 1939 values not shown in Fig. 12, the ratio was about 200: 1.
A striking increase of alkalinity in the hypolimnion and a simultaneous decrease in the epilimnion occurred during the period of thermal stratification. Einsele & Vetter consider these changes to result from biochemical precipitation of calcium carbonate in the epilimnion and re-solution in the presence of excess C02 in the hypolimnion. The total alkalinity in the whole water column (not figured here) showed little variation except for an unexplained sharp fall at the overturn. Thus a release of adsorbed bases to the hypolimnion as a result of the reduction of ferric adsorbing complexes cannot be demonstrated. The increase in alkalinity due to this cause in Esthwaite Water was approximately 0 5 g.-equiv./sq. m. (Fig. 14). It is possible that this amount is correlated with the total iron production or more closely with the amQunt of ferric adsorbing material present in the mud surface before reduction, so that the equivalent amount liberated in Schleinsee may be less than 0 5 g.-equiv./sq. m. In any case this amount makes up only about 3 % of the total alkalinity in that lake, and this may explain why an effect due to base liberation could not be detected.
From an extensive study of base-poor Japanese lakes, in which the masking effect of high alkalinity observed in Schleinsee is absent, Yoshimura (1932 a, b) has demonstrated that the increases in alkalinity, observed in the hypolimnia of those lakes in which de-oxygenation occurred, could be accounted for by increases in Fe, Mn, Ca and other bases. The increase in Ca was considered not to be due to the precipitation of CaCO3 from higher levels, but to 'some other
This content downloaded on Tue, 5 Mar 2013 12:33:17 PMAll use subject to JSTOR Terms and Conditions

CLIFFORD H. MORTIMER 309
cause'. The description of events in Esthwaite Water suggests that this cause was liberation of adsorbed bases from the reduced mud surface.
Further evidence of similarity in the development of de-oxygenation in the hypollmnia of widely separated lakes is afforded by computations (results not given in detail) of the total oxygen depletion rate in those lakes, for which oxygen data have been published in sufficient detail, e.g. Wisconsin lakes; Mendota, Long Lake, Rainbow Lake (Birge & Juday, 1911), Schleinsee (Einsele & Vetter, 1938) and Waskesiu (Rawson, 1936). These computations, compared with those for Esthwaite Water 1939 and 1940, show that although consider- able variations in the depletion rate occurred, there was in all cases a general tendency for the depletion rate to decrease as the oxygen concentration of the bottom sample (usually 1 m. from the mud) fell from about 5 to about 1 mg./l. This was probably due to the decrease of the oxygen gradient at the mud surface and was equivalent to stage I, already described for Esthwaite Water. This stage was followed in all cases by one of accelerated oxygen depletion (stage II). It has been suggested that this is the result of the liberation of reducing substances from the mud surface, after it has become reduced, and the increase in the rate of spread of these substances under the influence of eddy diffusion.
After completion of this manuscript, an important contribution to the study of stratified lakes has appeared (Hutchinson, 1941). Although a fuller discussion of this paper must be postponed, it is clear that Hutchinson's description of the development of stratification in Linsley Pond is in many ways similar to that given for Esthwaite Water.
(c) Events under ice Conditions under ice provide opportunities for testing some of the de-
ductions arrived at earlier. It was suggested that turbulence in the hypo- limnion was induced chiefly by wind action. As this is absent under ice, it may be expected that the eddy diffusion coefficient A would be lower, that the spread of substances derived from the mud would be slower and that de- oxygenation would be confined to a narrower zone than was the case during the corresponding period of summer stratification. An examination of Figs. 4-9 for Esthwaite Water 1939-40 shows how far these expectations were realized. During 7 weeks under ice, reduction at the mud surface had not proceeded as far, and the spread of iron and ammonia in the water was not as extensive as during the first 7 weeks after the commencement of summer thermal stratification at the end of May. The redox potential at the mud surface fell only to E7=049 V. and nitrate was not appreciably reduced. A comparison of Fig. 7 with other figures suggests that the rise in conductivity was greater3 relatively to other dissolved substances, during the ice period than during June. There is some evidence however (Table 2) that not all this increase could be attributed to the mud. The only explanation that can be offered for the
This content downloaded on Tue, 5 Mar 2013 12:33:17 PMAll use subject to JSTOR Terms and Conditions
310 Exchange of dissolved substances in lakes
fact that the oxygen concentration was apparently lower and concentrations of other dissolved substances were apparently higher on 27 January than on 5 February, in all samples taken between 11 m. and the bottom, is that an error in depth determination occurred on the former date.
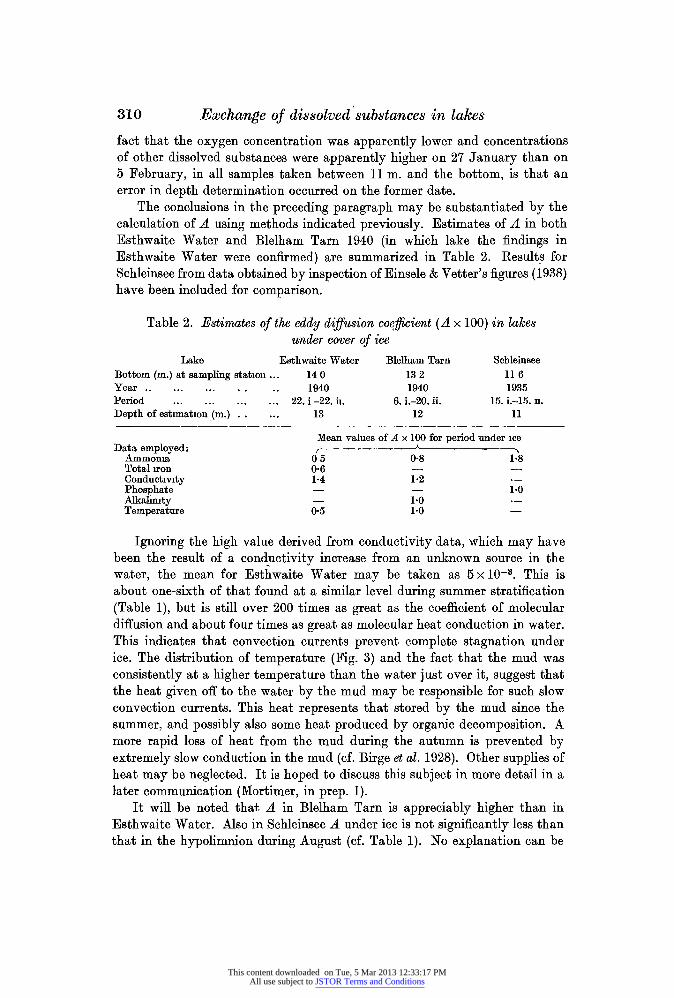
The conclusions in the preceding paragraph may be substantiated by the calculation of A using methods indicated previously. Estimates of A in both Esthwaite Water and Blelham Tarn 1940 (in which lake the findings in Esthwaite Water were confirmed) are summarized in Table 2. Results for Schleinsee from data obtained by inspection of Einsele & Vetter's figures (1938) have been included for comparison.
Table 2. Estimates of the eddy diffusion coefficient (A x 100) in lakes under cover of ice
Lake Esthwaite Water Blelham Tarn Schleinsee Bottom (m.) at sampling station ... 14 0 13 2 11 6 Year. ... ... 1940 1940 1935 Period . .. ... ... 22. i -22. ih. 6. i.-20. ii. 15. i.-15. nI. Depth of estimation ((m.) ... 13 12 11
Mean values of A x 100 for period under ice Data employed: , I
Ammoma 0 5 0-8 1-8 Total iron 0-6 Conductivity 1-4 1-2 Phosphate 1.0 Alkalinty 1.0 Temperature 0 5 1.0
Ignoring the high value derived from conductivity data, which may have been the result of a conductivity increase from an unknown source in the water, the mean for Esthwaite Water may be taken as 5 x 10⁻³. This is about one-sixth of that found at a similar level during summer stratification (Table 1), but is still over 200 times as great as the coefficient of molecular diffusion and about four times as great as molecular heat conduction in water. This indicates that convection currents prevent complete stagnation under ice. The distribution of temperature (Fig. 3) and the fact that the mud was consistently at a higher temperature than the water just over it, suggest that the heat given off to the water by the mud may be responsible for such slow convection currents. This heat represents that stored by the mud since the summer, and possibly also some heat produced by organic decomposition. A more rapid loss of heat from the mud during the autumn is prevented by extremely slow conduction in the mud (cf. Birge et al. 1928). Other supplies of heat may be neglected. It is hoped to discuss this subject in more detail in a later communication (Mortimer, in prep. I).
It will be noted that A in Blelham Tarn is appreciably higher than in Esthwaite Water. Also in Schleinsee A under ice is not significantly less than that in the hypolimnion during August (cf. Table 1). No explanation can be
This content downloaded on Tue, 5 Mar 2013 12:33:17 PMAll use subject to JSTOR Terms and Conditions
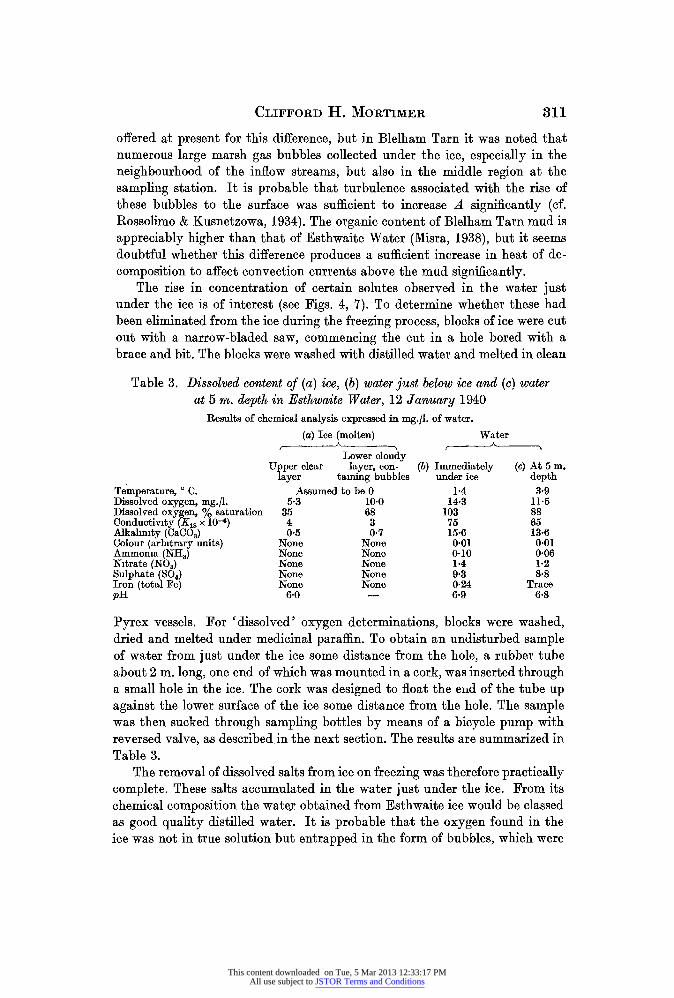
CLIFFORD H. MORTIMER 311
offered at present for this difference, but in Blelham Tarn it was noted that numerous large marsh gas bubbles collected under the ice, especially in the neighbourhood of the inflow streams, but also in the middle region at the sampling station. It is probable that turbulence associated with the rise of these bubbles to the surface was sufficient to increase A significantly (cf. Rossolimo & Kusnetzowa, 1934). The organic content of Blelham Tarn mud is appreciably higher than that of Esthwaite Water (Misra, 1938), but it seems doubtful whether this difference produces a sufficient increase in heat of de- composition to affect convection currents above the mud significantly.
The rise in concentration of certain solutes observed in the water just under the ice is of interest (see Figs. 4, 7). To determine whether these had been eliminated from the ice during the freezing process, blocks of ice were cut out with a narrow-bladed saw, commencing the cut in a hole bored with a brace and bit. The blocks were washed with distilled water and melted in clean
Table 3. Dissolved content of (a) ice, (b) water just below ice and (c) water at 5 m. depth in Esthwaite Water, 12 January 1940
Results of chemical analysis expressed in mg./l. of water. (a) Ice (molten) Water
41 A A _ Lower cloudy
Upper clear layer, con- (b) Immediately (c) At 5 m. layer taming bubbles under ice depth
Temperature, ? C. Assumed to be 0 1*4 3-9 Dissolved oxygen, mg./l. 5.3 10 0 14*3 11.5 Dissolved oxygen, % saturation 35 68 103 88 Conductivity (K18 x 10-8) 4 3 75 65 Alkalmity (CaCO3) 05 0*7 15-6 13-6 Colour (arbitrary units) None None 0.01 0 01 Ammonia (NH3) None None 0.10 0-06 Nitrate (NO3) None None 1*4 1-2 Sulphate (SO4) None None 9-3 8-8 Iron (total Fe) None None 0*24 Trace pH 6*0 6.9 6-8
Pyrex vessels. For 'dissolved' oxygen determinations, blocks were washed, dried and melted under medicinal paraffin. To obtain an undisturbed sample of water from just under the ice some distance from the hole, a rubber tube about 2 m. long, one end of which was mounted in a cork, was inserted through a small hole in the ice. The cork was designed to float the end of the tube up against the lower surface of the ice some distance from the hole. The sample was then sucked through sampling bottles by means of a bicycle pump with reversed valve, as described, in the next section. The results are summarized in Table 3.
The removal of dissolved salts from ice on freezing was therefore practically complete. These salts accumulated in the water just under the ice. From its chemical composition the watex obtained from Esthwaite ice would be classed as good quality distilled water. It is probable that the oxygen found in the ice was not in true solution but entrapped in the form of bubbles, which were
This content downloaded on Tue, 5 Mar 2013 12:33:17 PMAll use subject to JSTOR Terms and Conditions

312 Exchange of dissolved substances in lakes
seen to have accumulated in the lower cloudy layer. The pH (6.0) in water derived from ice melted under paraffin suggests that some CO2 was also retained.
II. CHANGES IN REDOX POTENTIAL AND IN CONCENTRATIONS OF DISSOLVED SUBSTANCES IN ARTIFICIAL MUD-WATER SYSTEMS,
SUBJECTED TO VARYING DEGREES OF AERATION
It was suggested in the preceding section that changes in redox conditions dccurring at or near the mud surface during de-oxygenation of the hypolimnion in lakes are associated with and probably control marked changes in the rate of exchange of ions between mud and water. The following experiment was designed to study these changes more closely in 'artificial lake systems' under laboratory control.
METHODS AND EXPERIMENTAL PROCEDURE
Several Petersen grab samples of typical Windermere mud were taken from about 30 m. depth off Wray Castle Boat House. The surface brown layer containing ferric iron was scraped off and kept separately from the lower reduced dark grey mud, which was stirred to obtain a uniform sample and then poured into three glass tanks (rectangular battery jars, 15 x 20 cm., 25 cm. deep) to a depth of about 3 cm. The tanks were then slowly filled with tap water without disturbing the mud. The surface scrapings were also stirred, mixed with a little tap water and divided into three approximately equal portions, one of which was added to the water of each tank in such a way that an even layer was deposited on the mud surface. In this way an attempt was made to imitate a natural mud. The water in the tanks was siphoned off and the mud allowed to stand exposed to the air for several days. After this, but not before, it was found possible to run lake water into the tanks very slowly to a depth of 20 cm. (6 1. in all) so that it remained clear. The tanks were kept in the laboratory, exposed to light, but shielded from dust. The temperature of the water in the tanks rose gradually, with slight variations, from 14 to 20? C. during the course of the experiment. After standing for a week to attain approximately stable conditions, the surface brown 'oxidized layer', viewed through the glass sides, was about 7 mm. deep in all tanks. The mud surface showed a tendency to crumble and become detached in small cakes when measuring instruments were inserted and removed, and was not as flocculent as the natural mud surface in the lake.
At this stage a series of determinations were carried out on all three tanks. The results (zero on the time scale, Figs. 18-20) showed that conditions in each tank were sufficiently comparable for the purposes of the experiment. Each tank was then subjected to a different treatment, described below, and the following determinations repeated on all three tanks at intervals.
This content downloaded on Tue, 5 Mar 2013 12:33:17 PMAll use subject to JSTOR Terms and Conditions

CLIFFORD H. MORTIMER 313
Electrical conductivity. With the instrument and electrodes previously described, measurements were made at various points in each tank, in the water and at three depths in the mud (0.5, 1P5 and 2-5 cm.). It was found that horizontal variation was negligible in the water and small in the mud. Values given in Fig. 18 are mean values for each level. The electrodes, which were of robust pattern, are shown in Fig. 16 C.
Redox potential. Following the potentiometric technique employed by Pearsall & Mortimer (1939), using a saturated KCl-calomel half-cell and saturated KCl agar bridges, redox potential was measured at small depth intervals above and below the mud surface with a series of bright platinum electrodes, the arrangement of which is shown diagrammatically in Fig. 16,
A hB | CX
Hg
a C
1cm.
Fig. 16. Electrodes for the measurement of redox potential and electrical conductivity. a = frame of s.w.g. Pt. wire; b = copper lead enclosed in glass tube; c = glass seal around 42 s.w.g. Pt. wire.
and in Fig. 24, ? III. Each electrode consisted of a strip of platinum foil 10 x 2 mm., welded on to a frame of stout platinum wire of the same dimensions for support. An efficient weld was achieved by hammering the red hot pieces of metal together on a carbon block. The electrode was mounted as shown in Fig. 16B by fusing the wire into the end of a narrow glass tube (75 cm. long for use with the surface mud sampler described in the following section), and internal connection was made with a drop of mercury and copper wire in the normal way. Twelve such electrodes were arranged around cork centres in such a manner that the metal blades radiating from the centre came to lie at fixed depth intervals on a descending spiral, as shown in Fig. 16A and Fig. 24, ? III. Thus, when this 'compound electrode' was lowered vertically into the mud, the electrode at each level cut edge-on into mud,
This content downloaded on Tue, 5 Mar 2013 12:33:17 PMAll use subject to JSTOR Terms and Conditions
314 Exchange of dissolved substances in lakes which was undisturbed by the passage of lower electrodes. Each electrode may be considered to register the mean potential of a panel 2 mm. deep at the depth to which it is lowered. The depths usually chosen for measurement were 50, 10 and 1 mm. above and 1, 2, 3, 5, 7, 10, 13, 16, 19 mm. below the mud surface. For measurements described in the next section on lake muds in situ in the sampling tube of the surface mud sampler, four similar electrodes, which could be readily adjusted at different levels, were added to the system for measurements at greater depths below the mud surface. These were arranged to slide up and down in holes in the cork centres. The arrangement of the electrodes for these measurements is shown in Fig. 24, ? III. The copper lead from each electrode was fixed in order of electrode depth on a celluloid strip, and could be selected for connection with the potentiometer terminal by means of a clip lead.
Both in natural muds (see next section) and in muds in the tanks the electrode potentials fell rapidly during the first hour after insertion. Usually a fairly steady state was reached after 1-2 hr. A slow negative drift was observed over a period of days. Potential values given in this and the next section refer to measurements made 2 hr. after insertion. Eh and, where possible, pH were recorded and all potentials were reduced to a comparative basis of E7, i.e. Eh at pH 7*00, assuming a rise in one pH unit to be equivalent to a decrease of 58 mV. (cf. Pearsall & Mortimer, 1939). E7, expressed in volts, was chosen in preference to E5 (cf. Pearsall & Mortimer, 1939) as 7 00 was nearer the actual pH of the media investigated. After every few determinations the electrodes, were tested by immersing them in a well mixed sample of reducing mud of sufficient volume to cover them all. Usually readings on all electrodes agreed to within + 10 mV. Occasional anomalous behaviour of single electrodes will be discussed in a future communication (Mortimer, in prep. V), in which the measurement and interpretation of redox potentials and pH in lake muds will be dealt with more fully. If agreement of the above order was not obtained the electrodes were cleaned with dichromate-sulphuric acid and rinsed well. Between determinations the electrodes were kept immersed in distilled water.
pH determination. It is probable that the most satisfactory method of measuring pH at small depth intervals above and below the mud surface would be with a glass electrode of suitable 'micro' pattern. In the absence of the necessary equipment, a modification of the quinhydrone method used for soils was employed. A critical study of the application of this method to muds showed that, owing to the reducing and unbuffered characters of most of the muds investigated, it was necessary to maintain the mud/quinhydrone ratio within narrow limits to obtain reproducible results. Even so, the following technique produced results which were normally only reproducible on the same mud sample to within 041 pH unit. To approximately 5 c.c. of mud roughly an equal volume of distilled water and from 30 to 50 mg. quinhydrone was added in a glass dipper. The mixture was shaken and the potential
This content downloaded on Tue, 5 Mar 2013 12:33:17 PMAll use subject to JSTOR Terms and Conditions
CLIFFORD H. MORTIMER 315 measured in the usual manner after 2-5 min. Difficulty in the measurement of pH in lake muds by the quinhydrone method was also experienced by Karsin- kin & Kusnetzow (1931). However no advantage was discovered, in the present work, in employing the technique suggested by them, namely the measurement of the potential in the supernatant liquid after the quinhydrone-mud mixture has been allowed to settle.
Extremely high apparent pH values (between 8 and 9) were found with the quinhydrone electrode at the oxidized surface of some muds. These were almost certainly anomalous and probably due to the presence of manganic compounds. Such compounds in soils (Wright, 1939) are reduced by quin- hydrone to manganous hydroxide which raises the pH. In these cases the pH of the mud was either assumed to be the same as that of the water just over it, or colorimetric determinations were made with indicators in 0 5 % agar. This method will be described later (Mortimer, in prep. V).
In the work on cores of natural muds described in the next section, pH was determined on samples obtained by slicing the core up into layers, usually approximately at centimetre depth intervals. The sample from each layer was well mixed and its pH value was taken to be the mean value for the depth panel concerned. From this data, the probable pH at the depths at which Eh measurements had been made was determined -by graphical interpolation. The probable E7 value was then computed and the result expressed to two figures. A consideration of the reproducibility of Eh and pH values shows that in many cases it is doubtful if the second figure is significant. Even so the results are sufficiently accurate for the purposes of this paper, as the range of Eh values encountered was large. pH in the water was determined colorimetrically. During the experiment described in this section it was not possible to remove samples of the mud for pH determination. Determinations made with the quinhydrone electrode at the end of the experiment showed that the mean value of the surface and lower mud in the aerated tanks was 6-3 and 6-4 respectively, while in the anaerobic tank the equivalent values were 6-6 and 6-7. These pH values were employed to calculate a probable E7 value at different depths in the mud throughout the course of the experiment.
Chemical analysis was carried out on samples of water removed from the tanks immediately after determinations of redox potential and conductivity had been made. The sampling arrangement employed consisted of a glass tube supported with one end an inch or so above the mud surface. This lower end was turned up to avoid disturbance of the mud during the sampling operation. The tube was connected by rubber tubing through a tap to (1) a 125 c.c. bottle of the type used for oxygen determination, (2) a 50 c.c. flask for C02 deter- mination (described below) and (3) a bottle of 400 c.c. capacity, in that order in such a manner that, when the system was partially evacuated by means of a bicycle pump with reversed washer, water was sucked first through the oxygen bottle and then through the C02 flask, expelling the air in both of
This content downloaded on Tue, 5 Mar 2013 12:33:17 PMAll use subject to JSTOR Terms and Conditions

316 Exchange of dissolved substances in lakes
these in the process. The tap was kept closed until a slight vacuum had been created in the system by a few strokes of the pump. Otherwise there was danger of disturbing the mud surface. Water was sucked through until 400 c.c. had arrived in the last bottle. The tap was then closed and the apparatus disconnected. In this way an adequate flushing of the oxygen bottle and C02 flask was ensured. Samples for oxygen determination were treated in the usual way, those from the anaerobic tank being pre-oxidized with bromine, according to Alsterberg's modified procedure (Ohle, 1936b). During the latter stages of the experiment, concentration of solutes in the ahaerobic tank rose sufficiently to enable all determinations to be carried out on smaller samples.
The estimations made on the sample in the larger bottle are listed in Figs. 19 and 20. The methods employed were either standard methods or those described in the preceding section, with the exception of 'oxygen absorbed from permanganate' which was determined on a 50 c.c. sample, to which 5 c.c. N/80 KMnO4 and 5 c.c. 25 % H2SO4 had been added, and which was incubated at 400 C. for 4 hr.
Dissolved carbon dioxide was deterrmined by a modification of standard procedure. Although simple in principle, standard procedure (titration with standard alkali or carbonate using phenolphthalein) involves the difficulty of adequate stirring without introduction of atmospheric C02. In the nmethod adopted here the sampling vessel was also the titration vessel. The standard alkali was weighted with Glauber's salt and the phenolphthalein weighted with glycerine according to the instructions of Maucha (1932). The sampling and titration flask was prepared as follows: Pure molten paraffin wax (p in Fig. 17 A) was allowed to solidify in the bottom of a 100 c.c. volumetric flask and strips of glass, designed to function as baffles (g), were embedded in the wax in the manner indicated. After the sample had been obtained in the manner described above, a portion was removed by pipette for pH determination, leaving 50 c.c. in the flask to which 10 drops of phenolphthalein was added. Titration was carried out with the arrangement shown in Fig. 17 A, with the tip of the burette extension under the surface of the liquid. The bulb (b) on this extension ensured that all the alkali was delivered below the surface of the sample and that none collected on the side of the neck. Due to its greater density the alkali sank to the bottom of the flask. Rotation of the flask with the neck held between the hands ensured a rapid thorough mixing of the heavier reagents and the sample without undue agitation of the small surface exposed to the air in the neck of the flask. It was not considered necessary to cover this surface with medicinal paraffin, although this could be done in cases in which it is required to carry out a titration by similar methods in the com- plete absence of air.
Further treatment of the tanks.I After the preliminary series of determinations had shown that conditions were practically identical in all three tanks, each was subjected to different treatment. One, the 'artificially aerated tank', was
This content downloaded on Tue, 5 Mar 2013 12:33:17 PMAll use subject to JSTOR Terms and Conditions

CLIFFORD H. MORTIMER 317
subjected to continual aeration by means of the apparatus shown in Fig. 17 B. The wide tube (a) was adjusted at such a height that, when suction from a filter pump was applied at b, water was sucked up from the tank through the tube c of 4 mm. bore. This continued until the level of water in the tank had fallen sufficiently to admit air through c. In this way the partial vacuum inside a was destroyed and the water began to flow back to the bottom of the tank through tube d of 2 mm. bore. The water level in the tank of course rose at the same time, but an interval elapsed before stable conditions were re- established at the lower end of c, so that in practice air continued to bubble through the water in a and no water was sucked up until a was practically empty. The rate of this continuous aeration and circulation could be varied by varying the suction of the filter pump.
Fig. 17. Titration flask for carbon dioxide determination Arrangement of 'artificially aerated ' and ' anaerobic' tanks. w =paraffin wax; I = liquid paraffin
A second tank ('aerated tank') was allowed to stand with the water surface exposed to the air. All three tanks were shielded from dust The water surface in the third tank ('anaerobic tank') was covered with medicinal paraffin to a depth of about 2 cm., after a wide glass tube had been fitted as shown in Fig. 17 C to act as a shaft for the insertion of measuring instruments and sampling tube into the tank without bringing them into contact with the liquid paraffin. After measurements, the water level in the shaft was raised by suction until all the air was withdrawn; the tap was then closed. Just before each series of measurements, air was admitted to the shaft and the water level was allowed to fall gradually in order not to disturb the mud surface. The rubber bung was then removed and electrodes inserted. Naturally some air was introduced during measurement, but this did not disturb the course of the experiment. More serious trouble was encountered when it was discovered that the liquid paraffin layer was not an effective barrier to the diffusion of atmospheric oxygen. It was found necessary to employ an additional seal of paraffin wax. This was conveniently done by running molten
This content downloaded on Tue, 5 Mar 2013 12:33:17 PMAll use subject to JSTOR Terms and Conditions
318 Exchange of dissolved'substances in lakes
wax down a wide gently inclined plane of cardboard on to the surface of the liquid paraffin. More violent pouring caused the wax to plunge down into the water and solidify there in lumps. This surface solid crust of wax, which formed an effective barrier to the diffusion of gases, could sometimes be made to follow changes in level occurring during sampling and measurement, but cracks often developed and the wax had to be removed and the crust recast.
RESULTS
Results are presented in Figs. 18-20, in which concentrations of dissolved substances in the water are plotted against time. Redox potential and con- ductivity data are incorporated in depth-time diagramas on the same time scale. The concentrations recorded in the figures are expressed as mg./l. in the actual sample. They have not been corrected for changes in relative volume of water and mud resulting from the removal of samples. It is clear that a part of the increase in some dissolved substances in the anaerobic tank, from which more samples were taken, was due to the decrease in water volume. As the purpose of the experiment was to detect large qualitative differences between aerated and anaerobic tanks, no correction has been made for this. If the results had been corrected for volume, it is by no means certain that the corrected values would bear any relation to natural rates of production, as it is not known whether the concentration of any one ion in the water represents a uniform concentration throughout the whole mud+water volume, or an equilibrium between mud and water, which is maintained irrespective of volume changes in the water. For estimations of the natural ionic production rates of lake muds, similar experiments with larger tanks and with a deeper layer of mud are necessary, in order that the volume of water removed in the sample may be small in comparison to the total volume, and that the pro- duction of ions by the mud shall not be limited by shallow mud depth.
Data from the 'artificially aerated tank' have been omitted here, as they were very similar to those obtained in the tank which was aerated by exposure to the air. The only marked difference was that the changes occurring in both tanks took place more rapidly in the artificially aerated one. It therefore appears that convection currents were sufficient to maintain fully aerated conditions in the standing tank ('aerated tank' in Figs. 18-20).
Redox conditions in (a) the aerated tank. Isovolts are drawn in Fig. 18 for intervals of 0-06 V. The depth of the isovolt (E7=0024 V.)-thick line in the figure-approximately corresponded with the lower limit of the surface chocolate-brown 'oxidized layer', containing ferric hydroxide, as viewed through the side of the tank. This is in agreement with the finding of Pearsall & Mortimer (1939) that ferrous iron replaced ferric if the redox potential fell below this level. The depth of the isovolt E7 = 024 V. below the mud surface may therefore be considered to register the thickness of the oxidized surface
This content downloaded on Tue, 5 Mar 2013 12:33:17 PMAll use subject to JSTOR Terms and Conditions

CLIFFORD HI. MORTIMER 319
~~~~~~~ o~~~~~~~~~c
O a9
o I~~~~~~~~~~~~~~~~~~~c
Ca
o l0 Ca Ca
0 0~~~~~~~~~~~~~~" -c~~~~~~~~~ cc ~ ~ ~ ~ ~ ~ ~ ~ 0~~~~~~
0 ? ~~- = C 0 T II III I I,
0 ~~~~~~~~~~~~~~~~~~~ o uinsptu0ql0 AlVQJM l p0j,JQJ JA, L~~~~~~~~~~~~~~
C) ~ ~ ~ ~ ~ 0C - 0 OCf%'.00% C) 0~~~~~~~~~~~~~~~~~~~~~~~~~~~04..
E-i C-~ ~~~~~~~~~~~~~~~~~.1 C
PA ~ ~ ~ ~ ~ ~ ~ ~ ~ P
C)~ ~~~~~~~~~~~~4 co~~~~~~c
C>~~~~~~~~~~~~~~~~~~~~~~~~~~~~~~~~~c
~~~~~ CI I I4hr I I>(>
This content downloaded on Tue, 5 Mar 2013 12:33:17 PMAll use subject to JSTOR Terms and Conditions
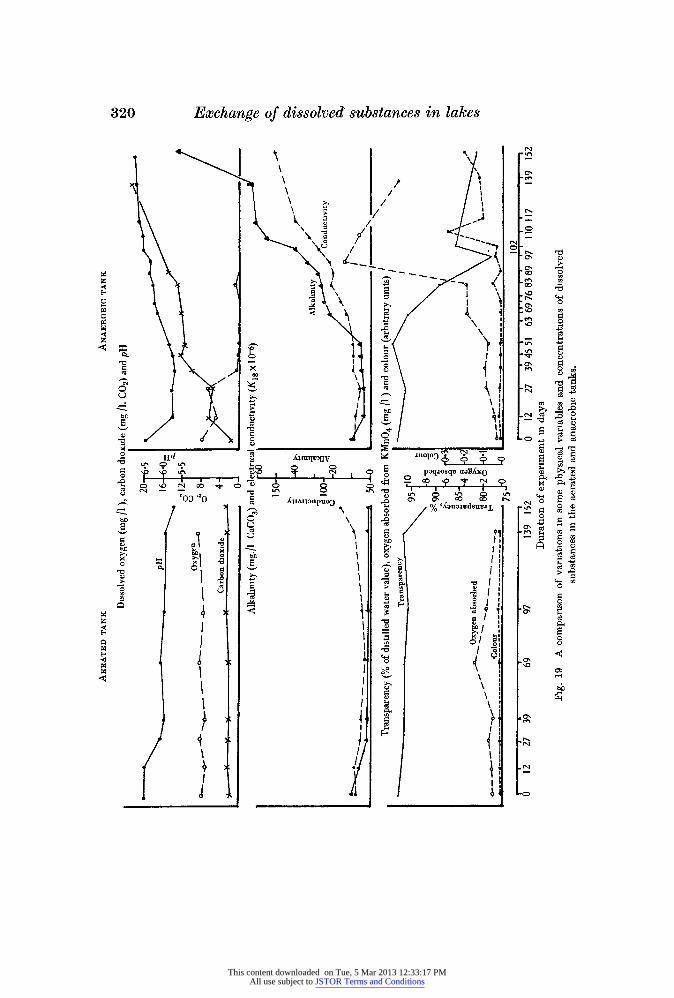
320 Exchange of dissolvect substances in lakes
CN
It
CO) co %
pq 0 4 P4 PA -4 Ca
CN 0 .,Ca Ca
> W) Ca 4 Ca
Ca
Hd anoloo CV Ca paqiosqu uo2f.,xo
P-1 CN I- !i x P-1 Ca CN C) CN 0) C) co Ca
A,:tTATjonpuo3 0 O/ CN C uoavd9uvjL 0 .0 0
W) E.
W)
bD W) Ca Ca 2
> cn cn
Ca P-1
0
Pr4
cn
CN
This content downloaded on Tue, 5 Mar 2013 12:33:17 PMAll use subject to JSTOR Terms and Conditions

CLIFFOR.DH. MORTIMER 321
bi)~~~~~~~
0'
1 0~~~~~~~~~~~~~~~~~~~~~~~~~~~~~~~~~~~~~~~~~~~~C1 0( ~~~~~~~~~~~~~~~~~~0~~~( \ N~~~~~~~~~~ 2' * i~~~~~~~~~~~~~~~~~~~~~(
0
Cu~~~~~~~~~~~~~~~~~~C1
Cu~~~~~~~~~~~~~~~~~~~~~~~~~~~~~~~~~~~~~~~~~~Nc
ci c'c C u 0 e Cul I I I ~~~~~~~~~~~~~~~~~~~~~~~~~~~~~~~~~~~~~~~~~~~~c
0% Cu~~~~~~~~~~~~~~~~~~~~~~
CZ~~~~~~~~~~~~~~~~~~~~~~~~~~~~~~~~~~~~~~~~~~~~~~C o 1 Cu~~~~~~~C> -0 4 C
cn 0 0~~~~~~~~0C 1 ~~~~~~~~~~~~~~~~~~~~0
CZ ~ ~ ~ C
0
aq
'C'~~~~~~~~~~~~~~~~~~1
J. Ecol. 29 21
This content downloaded on Tue, 5 Mar 2013 12:33:17 PMAll use subject to JSTOR Terms and Conditions
322 Exchange of dissolved substances in lakes layer. In the aerated tanks this gradually increased during the course of the experiment.
(b) The anaerobic tank. From the time when the tank was effectively sealed from the atmosphere by paraffin wax (27 days), the isovolt E7 =0-24 V. began to rise to the mud surface, reaching it at 70 days, at which time the mud surface had considerably darkened in colour and the dissolved oxygen in the water had disappeared. Previously to this, nitrate had become completely reduced in the water (51 days) and the ammonia concentration had begun to rise (Fig. 20); at this time the potential in the water was approximately E7-036 V. The difference between the marked vertical stratification of redox potential in the mud and the lack of such stratification in the water is striking. The potential values at 50 mm. above the mud surface have been omitted from the figure as they were almost invariably the same as those found at + 10 mm. This difference may be considered to be due to the fact that much of the reducing material is in immobile form in the mud and that transport of dissolved substances within the mud by molecular diffusion is slow in com- parison with convection currents and associated eddy diffusion in the water.
Changes tn the water of the anaerobic tank. The mQst striking result obtained during the experiment was the rapid rise in concentration of iron, ammonia, silicate, phosphate, alkalimty, conductivity and substances reducing per- manganate observed in the water of the anaerobic tank, after the potential at the mud surface had fallen below E7=024 V., i.e. after the oxidized surface layer had disappeared. This rise in concentration was maintained, although for most substances at a slower rate, during the subsequent course of the experi- ment. As stated earlier, a part of the considerable rise in concentration observed in some cases toward the end of the experiment must be attributed to a con- siderable decrease in water volume resulting from the removal of samples.
A more detailed examination of events after the destruction of the surface oxidized layer shows other points of interest. These events also exhibit a marked parallelism with those found to occur during reduction in the hypo- limnion in Esthwalte Water during 1939. The rise in ammonia-nitrogen far exceeded the equivalent amount produced by nitrate reduction, and must therefore have originated from the mud. Nitrite appeared in small quantities during the period of nitrate reduction, but had disappeared by the time the potential in the water had fallen below 0 30 V. The rate of increase of iron, silicate and phosphate, as well as of substances reducing permanganate was greatest while the potential in the water fell from 0-18 to 0-12 V. Iron, phos- phate and manganese continued to increase in concentration after this, whereas silicate showed no further rise and substances reducing permanganate showed a decrease All the iron was in ferrous form after the potential had fallen below 0-12 V.
During the imtlal stages of the experiment, the rate of increase of C02 in the anaerobic tank was approximately proportional to the decrease in oxygen
This content downloaded on Tue, 5 Mar 2013 12:33:17 PMAll use subject to JSTOR Terms and Conditions
CLIFFORD H. MORTIMER 323
concentration. This result might be expected if it is assumed that most of the oxygen was absorbed in the oxidation of organic material and in such reactions as the production of ferric hydroxide from ferrous bicarbonate. The slow rise in C02 concentration after the disappearance of the oxygen cannot be taken as evidence of anaerobic C02 production, as it is probable that this increase is due to the accumulation of C02 produced as a result of the introduction of a little oxygen at each series of measurements.
A crack which developed in the wax seal just before 83 days had an inter- esting effect on conditions in the water. The isovolt E7 = 024 V. was pushed down to the mud surface, a small amount of oxygen was detected in the water, and traces of mtrite and nitrate were found. The introduction of oxygen also resulted in the oxidation of a large amount of iron, which was found in sus- pension in ferric form, resulting in a decrease in transparency of the water. A decrease in silicate concentration also occurred at the same time.
The sulphate concentration began to fall slowly after the tank had been effectively sealed from the atmosphere. This fall may have been due to the diffusion of sulphate into the mud and its reduction there in regions of lower potential. After the potential in the water had fallen below 0410 V., reduction of sulphate proceeded more rapidly. It had disappeared when the potential in the water had fallen to 0-06 V. The sharp fall in iron (mainly ferrous) con- centration, which occurred at the same time may be considered to have resulted fromn the precipitation of ferrous sulphide. This was associated with a fall in conductivity and transparency, and with a sharp rise in ammonia and alkalinity. During thls period the mud surface became black, presumably as a result of accumulation of ferrous sulphide.
Electrical conductivity of the mud tn the anaerobic tank rose steadily during the period of reduction of the mud surface, later rising rapidly to over 200 at the mud surface. This rise may have been partly due to the liberation of adsorbed ions as adsorbing complexes were destroyed by reduction. The sharp fall in conductivity which occurred after the maximum at 117 days may have been the result of the precipitation of ferrous and sulphide ions as ferrous sulphide. It is also possible that some adsorption of ions on colloidal ferrous sulphide took place.
Conditions in the aerated tank. None of the changes described above were observed in the aerated tank, in which the oxygen concentration in the water remained high and the isovolt E7=0024 remained well below the mud surface. Apart from a slight initial fall in conductivity, a more rapid initial fall in pH, alkalinity, nitrate and ammonia and a subsequent slow rise in sulphate and conductivity, little change occurred in the concentrations of dissolved sub- stances in the water.
21-2
This content downloaded on Tue, 5 Mar 2013 12:33:17 PMAll use subject to JSTOR Terms and Conditions
324 Exchange of dissolved substances in lakes
DIsCUSSION
Changes in the 'aerated tank' may be interpreted as follows: The imtial fall in alkalinity was considerably more rapid than the corresponding fall in conductivity. This indicates adsorption of bases, of which ammonia formed a large proportion. This resulted in a fall in pH, as the CO2 concentration remained fairly constant. The strongly adsorbent properties of lacustrine muds, especially in the surface layers, have long been recognized in commercial fish- pond practice. Inorganic fertilizers added to ponds are strongly adsorbed on thke mud and released to the water at a slow rate For instance, the beneficial effect on the fish crop of liming or phosphate manuring in one year can be detected in subsequent years (Demoll, 1925). From the experiment described here and also from observations during the winter of 1939 in Esthwaite Water, there is reason to suppose that-this adsorbing influence is exercised by the oxidized mud surface. It is clear that continuous adsorptiona must have occurred in the mud surface of the aerated tank, for there is no reason to suppose that organic decomposition in the mud had stopped, and there is no other explanation of the lack of rise of conductivity in the whole system, including the mud.
The decrease in nitrate in the aerated tank may, at first sight, appear surprising, as it has been shown in experiments mentioned in the preceding section that nitrification occurs at the oxidized mud surface. A similar obser- vation of the disappearance of nitrate above pond muds with oxidized surface was made by Lind (1940). Some of the mtrate produced at the mud surface must diffuse down into the lower mud and become reduced there. It may be suggested that both in this and in Lind's experiment, in which the water volume was comparatively small, the rate of nitrification was not sufficient to make good the loss of nitrate from diffusion into and reduction in the mud.
The results obtained in the anaerobic tank show that, when the connection between the mud surface and the atmosphere through the water as inter- mediary is interrupted, the adsorbing influence of the mud surface (observed in the aerated tank) is removed. As events, which may be described as the rapid release of adsorbed materials, occurred at the time when the isovolt E7= 024 V. had reached the mud surface and when all the ferric iron in the mud had become reduced, it may be suggested that the adsorbent properties of the oxidized mud surface are largely due to the presence of colloidal ferric complexes. The removal of these complexes on reduction of the mud surface, may be considered to result, not only in the liberation of adsorbed ions, but also in a much less impeded exchange of ions between mud and water, as shown by the continued rise in most dissolved constituents following the initial rapid rise just after the mud surface had become reduced. This continuous production during the latter part of the experiment was of course slower, expressed per unit area of mud, than that indicated in Figs. 19 and 20. If corrections had
This content downloaded on Tue, 5 Mar 2013 12:33:17 PMAll use subject to JSTOR Terms and Conditions
CLIFFORD H. MORTIMER 325
been made for change in water volume, this would demonstrate more clearly the contrast between the initial rapid rise and the following slow increase in concentration
While a more detailed description of the adsorbing agents in the mud surface must be left to future work, some speculation as to their nature is permissible. Mattson (1935) has suggested that the adsorbent complex which is transported and precipitated in peaty podsols is a ferri-silico-humate. It is possible that a similar complex exists in the oxidized mud surface. If this is so, the rise in silica concentration during the period of reduction of the mud -surface might be considered to result from the destruction of this complex. The fall in silica concentration associated with considerable precipitation of ferric iron after the introduction of oxygen through a crack in the wax at 83 days, may have resulted from the re-formation of this complex, and the subsequent rapid rise in silica may have been produced when the complex was again reduced No marked increase of silica occurred after 110 days The source of silica, whatever it may have been, appears to have become exhausted. Mention should also be made of the existence of ferric hydroxide and ferric phosphate in the oxidized mud surface (cf. Einsele, 1938) Ferric hydroxide is probably largely in colloidal form and may exert a considerable adsorbing influence The sharp rise in phosphate concentration at the same time as disappearance of ferric iron in the water (97-102 days) is in agreement with Einsele's (1938) observation that large amounts of phosphate are bound as insoluble ferric phosphate in the surface of oxidized muds, and liberated in soluble form on reduction The possibility that an organic constituent, possibly of the humus type, forms a part of the adsorbing complex in oxidized muds, is suggested by the rise in colour and in the concentration of substances reducing permanganate which occurred in the water after the mud surface had been reduced. The increase in permanganate reduction was considerably greater than the equivalent reduction due to ferrous iron content alone.
The similarity of events in the water of the anaerobic tank and in the hypolimnion of Esthwalte Water has been pointed out before. There are, however, important differences. In Fig 21 a comparison is made between the increase in conductivity ('total salts'), alkalinity and other bases (ammonia, iron and manganese) The assumptions involved and the method of con- struction of the figure are the same as those for the construction of a similar figure for Esthwalte Water (see ? I, Fig 14 and relevant discussion). Con- centrations of the substances concerned are plotted for comparison on a common scale of mg.-equiv./l. The differences between the equivalents of conductivity, alkalinity, iron etc. are not plotted in Fig. 21 as was done in Fig. 14, as relative changes are sufficiently striking without this. As in Esthwaite Water, the difference between 'total salts' and alkalinity decreased after reduction of the mud surface, and the same explanation for this decrease may be suggested, namely, that it may be partly due to the reduction of
This content downloaded on Tue, 5 Mar 2013 12:33:17 PMAll use subject to JSTOR Terms and Conditions
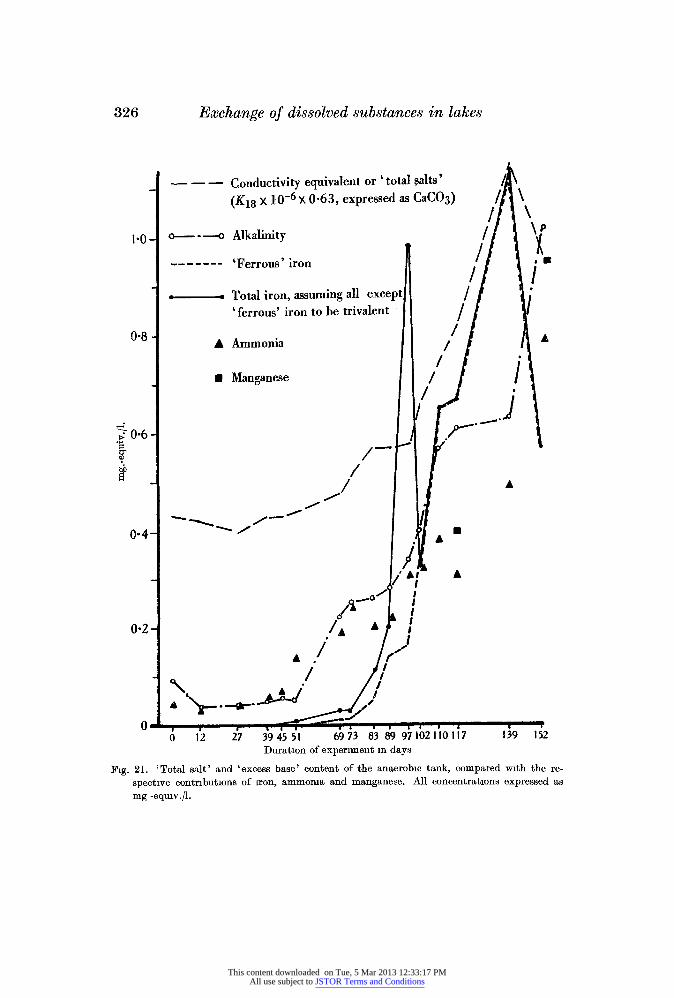
326 Exchange of dissolved substances in lakes
- - Conductivity equivalent or 'total salts' / (K18 x 10-6 x 063, expressed as CaCO3) / \
1*0 - i- o Alkalinity I
- 'Ferrous' iron / I3
Total iron, assuming all except / 'ferrous' iron to be trivalent - /
0*8 *A Ammonia /
* Manganese /
o -4
_ /
A~~~~~~~
A~~~~~~~~~
I'12 2'7 394i55 6973 83 9970101 3 Duration of experiment in days
Fig. 21. 'Total salt' and 'excess base' content of the anaerobic tank, compared with the re- spective contributions of iron, ammoma and manganese. All concentrations expressed as mg -equiv./l.
This content downloaded on Tue, 5 Mar 2013 12:33:17 PMAll use subject to JSTOR Terms and Conditions

CLIFFORD H. MORTIMER 327
sulphate or partly to the inclusion of some un-ionized basic material (e.g. ferric hydroxide) in the alkalinity value.
It is in the comparison of the equivalents of total alkalinity and the other bases that the main difference between Esthwaite Water and the anaerobic tank appears. In the former case (Fig. 14), total iron (even when considered to be trivalent and wholly active in the alkalinity titration) plus ammonia only made up a portion of the total alkalinity, the residue being attributed to other bases. In the anaerobic tank (Fig. 21) ammonia alone was almost equivalent to total alkalinity, leaving iron, manganese and possibly other bases un- accounted for. This considerable discrepancy cannot be explained satisfactorily without further research. It may, however, be suggested that a large part of the iron may be in complex form and not included in the alkalinity value. The same may also be true of manganese. Even so, if it is assumed that ammonia is fully ionized, this does not leave much residual alkalinity as evidence for the presence of other bases. It is possible that, in confined, base-poor systems of this kind with no outside source of supply of monovalent and divalent bases, the available bases are bound by bacteria or in other ways. Another difficulty lies in the way of the assumption that the iron is in complex form. This is the strong positive colour reaction which was obtained with oc-oc'- dipyridyl, which is usually considered to be a specific indicator of Fe++. It is of interest in this connexion that Coolidge (1932), during the study of iron complexes of the iron-protein type in yeast, found that ferrous iron existed in un-lonized form, but gave a positive reaction with oc-oc'-dipyridyl. It is also of interest that the Eo value (potential at which equal quantities of oxidized and reduced phase exist in equilibrium) of these complexes and also of artificial iron-albumin complexes was found to be about 02 V. at pH 7. This E0 value, which is approximately the same as that observed for the iron systems in natural waters, muds and soils (Pearsall & Mortimer, 1939), is much higher than the E0 of most better known iron complexes (e.g. iron pyrophosphate, Eo-0 - 6 V. at pH 7) and much lower than the E0 of the inorganic Fe+++ Fe++ system (0.75 V. at pH 4). Recent work on the chemistry of humus (Waksman, 1936) recognizes a lignin-protein complex as the essential constituent. The similar behaviour of iron-protein complexes (Coolidge, 1932) and iron complexes in natural muds, suggests that the latter may be essentially iron-humus com- plexes.
The behaviour of samples taken from the anaerobic tank during the latter part of the experiment provides further evidence of the difference between the state of the iron in these samples and in samples from the reduced hypolimnion in Esthwaite Water. On exposure to the air, the iron in lake samples was almost all precipitated as ferric hydroxide with a corresponding fall in con- ductivity and alkalinity. During a similar period of exposure to the air, precipitation did not occur in a reduced sample taken from the anaerobic tank at 110 days, but the colour was trebled and the alkalinity and conductivity
This content downloaded on Tue, 5 Mar 2013 12:33:17 PMAll use subject to JSTOR Terms and Conditions
328 Exchange of dissolved substances in lakes
fell slightly. Although this difference in behaviour cannot be explained, it may have been due to the 'protective' action on the ferric colloids of a higher concentration of organic matter in the water of the tank. A fuller explanation of the way in which the ferric iron was kept in 'sol-ation' may throw light on problems of transport of iron in peaty waters and soils.
In a stimulating paper, Ohle (1937) has described phenomena associated with the colloidal properties of mud constituents, and has emphasized the importance of these properties in the control of the exchange of plant nutrients in lakes. In particular he has demonstrated the 'ampholytic' nature of the ferric hydroxide gel, which is electro-positive in acid and electro-negative in alkaline solution. Thus in the presence of CO2 at pH 4, negatively charged phosphate ions added to ferric hydroxide gel were strongly adsorbed, although some of the iron went into solution. After raising the pH to 9 by the qddition of calcium bicarbonate, a large part of the phosphate was liberated. This may in part explain the fundamental influence of the presence or absence of bases (calcium) on the degree of productivity in fresh water. In the water of base- poor humus lakes phosphate and other plant nutrients are adsorbed on iron gels which are themselves attached to electro-negative humus colloids. Hence productivity is low. It is possible that an essentially similar process occurs in the oxidized mud surface of other lake types, producing the adsorption effect described in the present paper. Ohle has also shown that in higher pII ranges, manganic ions, which begin to precipitate as hydroxide at pH 8, also exercise an adsorptive influence. In many cases the phosphorus cycle may be more closely coupled with the manganese cycle than with iron, especially if sufficient organic colloids are not present to 'protect' the iron from rapid precipitation and removal. Ohle's results and those in the present paper are sufficient to indicate the important part which colloid chemistry is destined to play in the study of lake 'metabolism'.
As a result of observations on the anaerobic tank it is now possible to define more closely the potential ranges within which the following reductions may be expected to occur in mud-water systems. These ranges in E7 V. units are given below in brackets. The first potential given is that below which active reduction may be considered to have occurred in the water, i.e. where the fall in concentration was too rapid to be explained by diffusion into the mud. The second potential is that below which none of the oxidized phase could be detected in the water. Nitrate to nitrite (0.45-0.40 V.); mtrite to ammonia (0.40-0.35 V.); ferric complex to ferrous complex or Fe++ (0X30-0X20 V.); sulphate to sulphide (0X10-0X06 V.). The oxygen concentrations associated with these potential ranges in the anaerobic tank were approximately 4, 04, 0X1 and zero mg./l. respectively. In Esthwaite Water 1939 (see preceding section) it was observed that the first appearance of ferrous iron at 13 m. (1 m. above the mud) occurred at a potential between E7=0-3-0-2 V. and was associated with an oxygen concentration of approximately 1 mg./l., a much higher con-
This content downloaded on Tue, 5 Mar 2013 12:33:17 PMAll use subject to JSTOR Terms and Conditions

CLIFFORD H. MORTIMER 329 centration than that observed at the same stage in the anaerobic tank. It is possible that the conditions found in Esthwaite represent an unstable state due to mixing by eddy diffusion of water containing ferrous iron, and at a low redox potential near the mud surface, with water containing more oxygen from higher levels. This presupposes that ferrous iron is not oxidized in- stantaneously, a supposition which was justified by conditions found during mixing preceding the overturn, at which time ferrous iron was detected in water containing 8&4 mg./l. of oxygen.
(To be conttnued)
This content downloaded on Tue, 5 Mar 2013 12:33:17 PMAll use subject to JSTOR Terms and Conditions

147
THE EXCHANGE OF DISSOLVED SUBSTANCES BETWEEN MUD AND WATER IN LAKES1
BY CLIFFORD H. MORTIMER Freshwater Biological Association, Wray Castle, Ambleside
?? III AND IV, SUMMARY AND REFERENCES
III. THE RELATION OF SEASONAL VARIATIONS IN REDOX CONDITIONS IN THE MUD TO THE DISTRIBUTION OF DISSOLVED SUBSTANCES IN
THE WATER OF ESTHWAITE WATER AND WINDERMERE
THE interdependence, demonstrated in ? II, between changes in concentration of dissolved substances in the water and redox conditions in the mud, and also the similarity of these changes to those observed in the hypolimnion of Esthwaite Water and other lakes (? I), suggests that redox conditions in the mud also control the distribution of dissolved substances in natural lake systems. The work described in this section was designed to obtain informa- tion on this point. A chemical survey on Esthwaite Water, similar to that carried out during 1939, was repeated during 1940, and at the same time the distribution of redox potential and other variables was investigated in un- disturbed short cores of the surface mud and overlying water, obtained with sampling apparatus designed for this purpose. Esthwaite Water and lakes of similar type (e.g. Blelham Tarn) were chosen for detailed study, because the range of variation of redox conditions and distribution of dissolved substances is sufficiently wide to allow significant correlations to be recognized. It is, however, of equal importance to attempt to discover the reasons for the small seasonal amplitude of physical-chemical variation observed in lakes of oligo- trophic type. Accordingly, the investigation of seasonal changes in the mud and water, by methods described in this section, has been extended to lakes in which de-oxygenation of the hypolimnion, and the changes associated with it, does not occur. 'Results of investigation on Windermere (northern basin)- a representative of this type of lake-have been selected here for comparison with Esthwaite Water. A chemical survey extending over the years 1936-40 has been carried out on Windermere in connexion with bacteriological and algological investigations. The full results of this survey will be published later. Some data for temperature, dissolved oxygen and distribution of bac- teria have already been published by Taylor (1940). In addition, P. M. Jenkin (unpublished results) studied the distribution of temperature and dissolved oxygen in Windermere, north and south basins, during 1931-2.
1 Continued from the previous number of this Journal (Aug. 1941). 10-2
This content downloaded on Tue, 5 Mar 2013 12:30:57 PMAll use subject to JSTOR Terms and Conditions
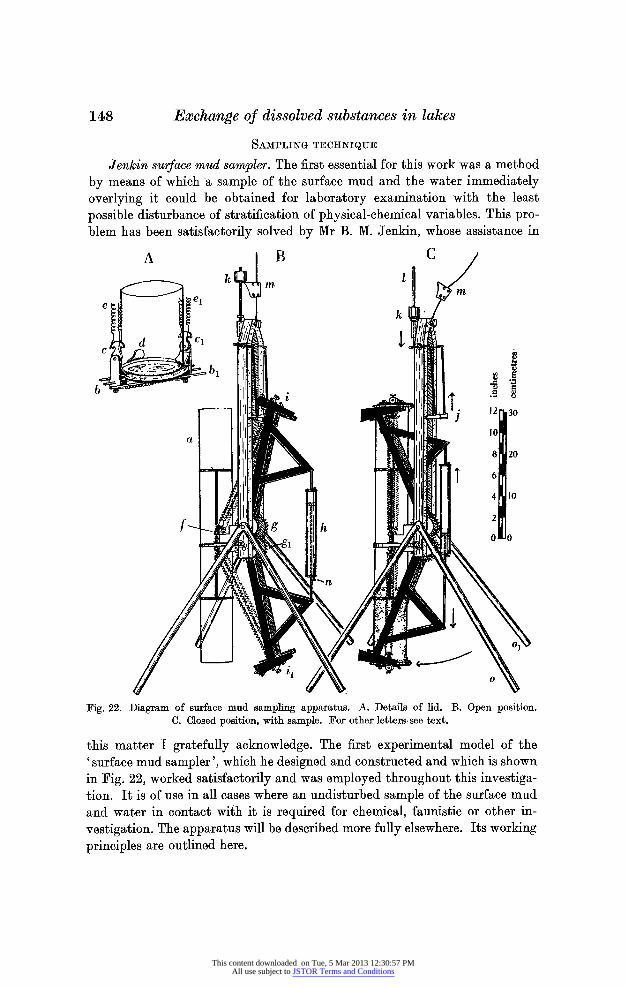
148 Exchange of dissolved substances in lakes
SAMPLING TECHNIQUE
Jenkin surface mud sampler. The first essential for this work was a method by means of which a sample of the surface mud and the water immediately overlying it could be obtained for laboratory examination with the least possible disturbance of stratification of physical-chemical variables. This pro- blem has been satisfactorily solved by Mr B. M. Jenkin, whose assistance in
A B C k ml
k
d Cl ILI'
~~~ ~b,
Fig. 22. Diagram of surface mud sampling apparatus. A. Details of lid. B. Open position. C. Closed position, with sample. For other letters see text.
this matter I gratefully acknowledge. The first experimental model of the ' surface mud sampler ', which he designed and constructed and which is shown in Fig. 22, worked satisfactorily and was employed throughout this investiga- tion. It is of use in all cases where an undisturbed sample of the surface mud and water in contact with it is required for chemical, faunistic or other in- vestigation. The apparatus will be described more fully elsewhere. Its working principles are outlined here.
This content downloaded on Tue, 5 Mar 2013 12:30:57 PMAll use subject to JSTOR Terms and Conditions

CLIFFORD H. MORTIMER 149
The sample is taken in a glass tube (Fig. 22, a), 2 ft. long and 3 in. diameter. Each end is ground flat and provided with a lid (Fig. 22 A) which consists of a glass disk over which a wide rubber band is slipped to give the lid a facing of rubber. This lid forms a watertight seal with the end of the tube, and is backed by a metal disk, which carries cross-bars (b, b,) projecting beyond the rim of the lid, attachments (c, cl) for springs, and a metal heel (d), the purpose of which is explained later. Each lid is held tightly pressed against the end of the tube by a pair of steel springs (e, el) on either side, stretching between the lid attachments (c, cl) and attachments (f) at the middle of the tube on a strip-metal harness, in which the tube is enclosed (Fig. 22 B). The tube with its lids and attachments forms a container in which the sample may be transported without loss.
The tabe is mounted in a framework to which four legs (o, ol) are rigidly fixed in such a manner that the framework and tube are supported vertically during manipulation andtransport. This framework carries an upper and a lower pair of arms, pivoted at (g, gl), each pair being connected together by cross-struts. In addition, the upper pair is geared to the lower pair by gear wheels at (g, gl); the two pairs are also linked by a dashpot (h) (consisting of the barrel and piston of a cycle pump). At its distal extremity each arm carries a plate (i, i1) arranged in such a manner that, when the arms are rotated in the direction away from the tube (clockwise as Fig. 22) the plates first make contact with the cross-bars (b, bl) on either side of the lids. As described above, the arms are geared to move together, and further rotation of the arms in the same direction lifts the lids away from the tube, against the tension of the springs to the 'open' position (Fig. 22 B). The arms are held in this position by a trip-catch (j).
In this position, with the sampling tube completely open, the apparatus is lowered to the mud surface. As long as the winch cable remains taut, a weight (k), which slides on a vertical rod (1), is held in a raised position by a metal bracket (in) attached to the winch cable. The framework legs are so weighted with lead wrappings that, when the apparatus.reaches the mud surface, its momentum carries the sampling tube to about one-quarter of its length into the soft mud. The winch cable goes slack and the weight (k) falls and releases the trip-catch (j). The tension of the springs (e, el) then pulls the arms carrying the lids counter-clockwise, thus closing the tube (Fig. 22 C, arrows indicate direction of motion). To avoid disturbance of the sample, the dashpot, which is at this stage full of water, ensures that this closing operation shall proceed slowly. The rate may be regulated by a valve (n) on the outlet of the dashpot barrel. The springs are sufficiently powerful to cause the bottom lid to slice through the soft surface mud and close the bottom of the tube. The heel (d, Fig. 22 A) prevents the lids from passing beyond the ends of the tube. Operated by a separate pair of springs (not shown in figure), the arms pass on and leave the lids to close down on the ends of the tube an4 to keep it
This content downloaded on Tue, 5 Mar 2013 12:30:57 PMAll use subject to JSTOR Terms and Conditions
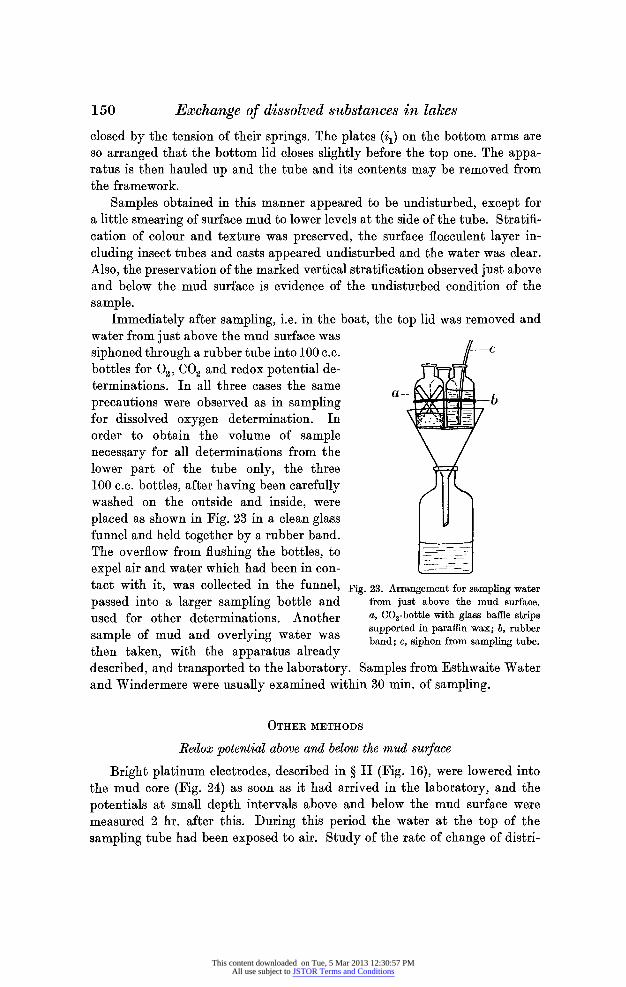
150 Exchange of dissolved substances in lakes
closed by the tension of their springs. The plates (i1) on the bottom arms are so arranged that the bottom lid closes slightly before the top one. The appa- ratus is then hauled up and the tube and its contents may be removed from the framework.
Samples obtained in this manner appeared to be undisturbed, except for a little smearing of surface mud to lower levels at the side of the tube. Stratifi- cation of colour and texture was preserved, the surface flocculent layer in- cluding insect tubes and casts appeared undisturbed and the water was clear. Also, the preservation of the marked vertical stratification observed just above and below the mud surface is evidence of the undisturbed condition of the sample.
Immediately after sampling, i.e. in the boat, the top lid was removed and water from just above the mud surface was siphoned through a rubber tube into 100 c.c. / bottles for 02, C02 and redox potential de- terminations. In all three cases the same a - - precautions were observed as in sampling
a _ b-
for dissolved oxygen determination. In - -=
order to obtain the volume of sample necessary for all determinations from the lower part of the tube only, the three 100 c.c. bottles, after having been carefully washed on the outside and inside, were placed as shown in Fig. 23 in a clean glass funnel and held together by a rubber band. The overflow from flushing the bottles, to s, expel air and water which had been in con- - _ tact with it, was collected in the funnel, Fig. 23. Arrangement for sampling water passed into a larger sampling bottle and from just above the mud surface.
used for other determinations. Another a, C02-bottle with glass baffle strips
sample of mud and overlying water was supported in paraffin wax; b, rubber sample ofmud and verlylng ater was band; c, siphon fromn samnpling tube. then taken, with the apparatus already described, and transported to the laboratory. Samples from Esthwaite Water and Windermere were usually examined within 30 min. of sampling.
OTHER METHODS
Redox potential above and below the mud surface
Bright platinum electrodes, described in ? II (Fig. 16), were lowered into the mud core (Fig. 24) as soon as it had arrived in the laboratory, and the potentials at small depth intervals above and below the mud surface were measured 2 hr. after this. During this period the water at the top of the sampling tube had been exposed to air. Study of the rate of change of distri-
This content downloaded on Tue, 5 Mar 2013 12:30:57 PMAll use subject to JSTOR Terms and Conditions

CLIFFORD H. MORTIMER 151
bution of redox potential and conductivity in samples examined at varying time intervals after sampling, showed that conditions in the mud and in the water a centimetre or so above it, after transport and the 2 hr. interval necessary for the electrode potentials to attain a relatively steady value, re- presented field conditions sufficiently closely for the purposes of this investi- gation. This conclusion is consistent with the slow rate of diffusion of solutes in the mud and with the slow rate of oxidation or reduction of the mud surface (cf. Fig. 28 and later discussion). The above measuring technique, however, caused considerable change in the distribution of redox potential and con- ductivity at higher levels in the water. Consequently, only those samples siphoned off in the field were relied upon to supply information on conditions in the water just over the mud. The values indicated for water above the mud surface in Figs. 28, 30, 32 and 33 were obtained from these samples, using methods described in ? I.
Electrical conductivity above and below the mud surface Before inserting the redox-potential electrodes, the conductivity at each
centimetre level in the mud core was determined with the apparatus and electrodes described earlier (Fig. 16). It was arranged that the electrodes should penetrate the core at points removed from the region in which the redox electrodes were subsequently inserted. Usually the mean of two or three vertical series was taken. Measurements at the same level normally showed close agreement. The conductivity values entered in Figs. 30, 33, 34, 35 and 45 represent the apparent conductivity of the mud, assuming that the temperature of the whole core is the same as at the surface. This value is not necessarily the same as the conductivity of the interstitial water in the mud, as the masking effect of the mud solids on the electrodes has not been con- sidered. However, the results are reproducible, comparable and adequate for the study of seasonal and regional variation.
pH of mud core After the measurements of redox potential and removal of the electrodes,
the water was siphoned out of the sampling tube as completely as possible and the mud core was pushed up to the top of the tube by means of a piston. This operation apparently caused little disturbance of the core except at the sides. The core was then sliced with a thin metal plate into approximately -centimetre layers, or other convenient thicknesses, as it emerged from the tube. pH estimation was carried out with a quinhydrone electrode. The procedure and the calculation of E7 values for different mud levels was described in ? II.
Estimation of dissolved substances in the water The methods and extent of the chemical survey in the water, carried out
at the same time as the investigation of the mud, in Esthwaite Water were closely similar to those described for 1939 in ? I. Many of the results obtained
This content downloaded on Tue, 5 Mar 2013 12:30:57 PMAll use subject to JSTOR Terms and Conditions
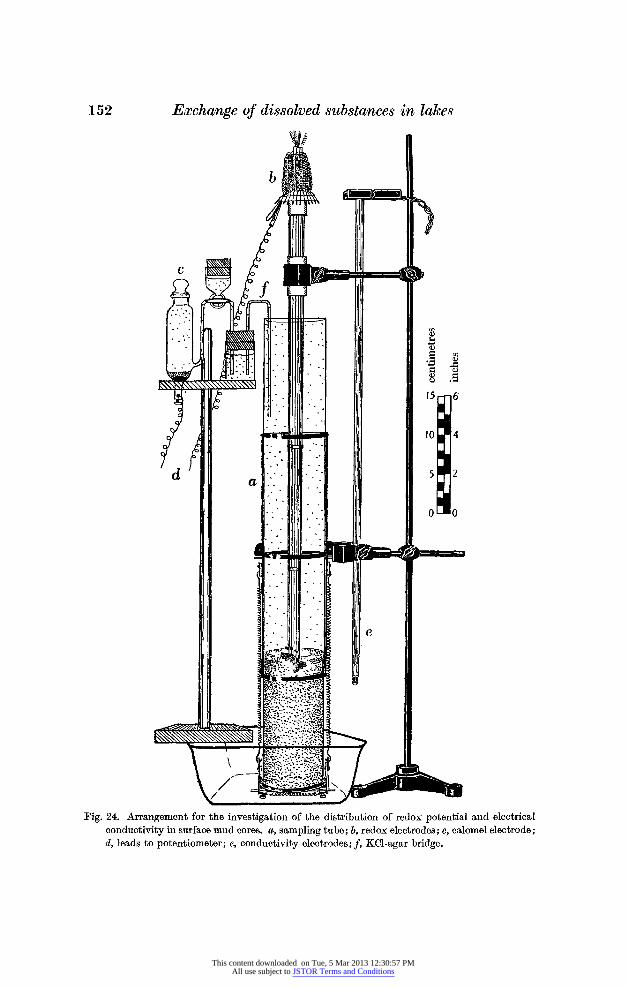
152 Exchange of dissolved substances in lakes
526 aX =;a
Fig. 24. Arrangement for the investigation of the distribution of redox potential and electrical conductivity in surface mud cores. a, sampling tube; b, redox electrodes; c, calomel electrode; d, leads to potentiometer; e, conductivity electrodes; f, KCl-agar bridge.
This content downloaded on Tue, 5 Mar 2013 12:30:57 PMAll use subject to JSTOR Terms and Conditions
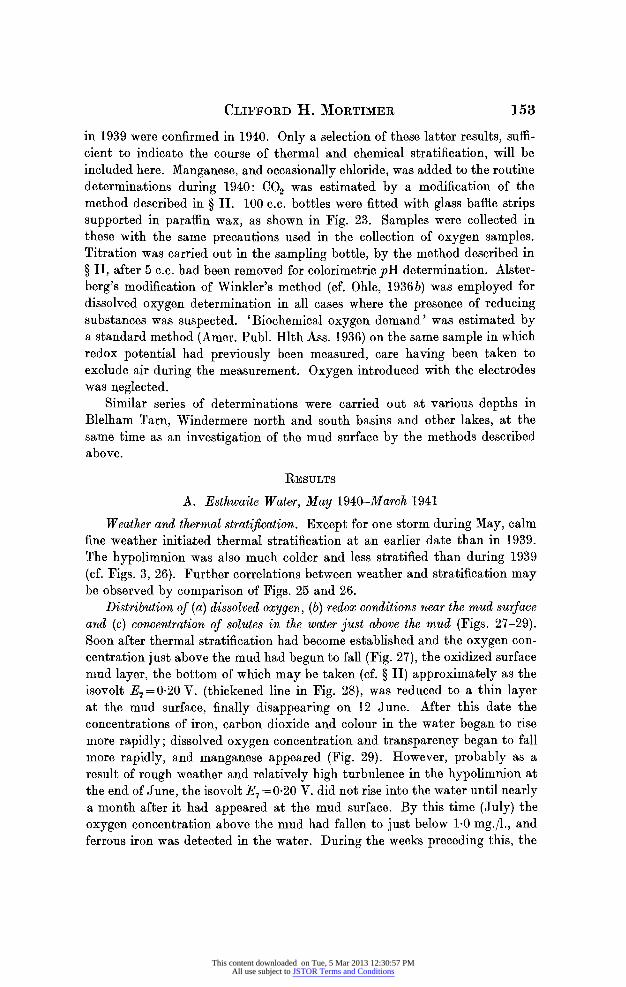
CLIFFORD H. MORTIMER 153
in 1939 were confirmed in 1940. Only a selection of these latter results, suffi- cient to indicate the course of thermal and chemical stratification, will be included here. Manganese, and occasionally chloride, was added to the routine determinations during 1940: CO2 was estimated by a modification of the method described in ? II. 100 c.c. bottles were fitted with glass baffle strips supported in paraffin wax, as shown in Fig. 23. Samples were collected in these with the same precautions used in the collection of oxygen samples. Titration was carried out in the sampling bottle, by the method described in ? II, after 5 c.c. had been removed for colorimetric pH determination. Alster- berg's modification of Winkler's method (cf. Ohle, 1936b) was employed for dissolved oxygen determination in all cases where the presence of reducing substances was suspected. 'Biochemical oxygen demand' was estimated by a standard method (Amer. Publ. Hlth Ass. 1936) on the same sample in which redox potential had previously been measured, care having been taken to exclude air during the measurement. Oxygen introduced with the electrodes was neglected.
Similar series of determinations were carried out at various depths in Blelham Tarn, Windermere north and south basins and other lakes, at the same time as an investigation of the mud surface by the methods described above.
RESULTS
A. Esthwaite Water, May 1940-March 1941
Weather and thermal stratification. Except for one storm during May, calm fine weather initiated thermal stratification at an earlier date than in 1939. The hypolimnion was also much colder and less stratified than during 1939 (cf. Figs. 3, 26). Further correlations between weather and stratification may be observed by comparison of Figs. 25 and 26.
Distribution of (a) dissolved oxygen, (b) redox conditions near the mud surface and (c) concentration of solutes in the water just above the mud (Figs. 27-29). Soon after thermal stratification had become established and the oxygen con- centration just above the mud had begun to fall (Fig. 27), the oxidized surface mud layer, the bottom of which may be taken (cf. ? II) approximately as the isovolt E7= 0.20 V. (thickened line in Fig. 28), was reduced to a thin layer at the mud surface, finally disappearing on 12 June. After this date the concentrations of iron, carbon dioxide and colour in the water began to rise more rapidly; dissolved oxygen concentration and transparency began to fall more rapidly, and manganese appeared (Fig. 29). However, probably as a result of rough weather and relatively high turbulence in the hypolimnion at the end of June, the isovolt E7 = 0-20 V. did not rise into the water until nearly a month after it had appeared at the mud surface. By this time (July) the oxygen concentration above the mud had fallen to just below 1-0 mg./l., and ferrous iron was detected in the water. During the weeks preceding this, the
This content downloaded on Tue, 5 Mar 2013 12:30:57 PMAll use subject to JSTOR Terms and Conditions
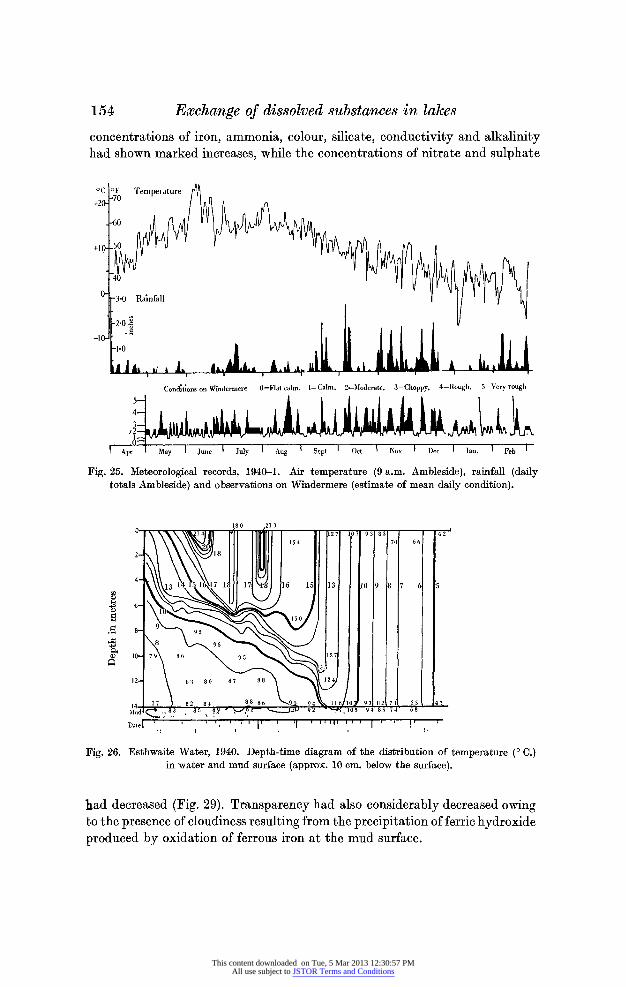
154 Exchange of dissolved substances in lakes
concentrations of iron, ammonia, colour, silicate, conductivity and alkalinity had shown marked increases, while the concentrations of nitrate and sulphate
OC OF Tempei ature
+20- 7
0- 3-0 Rainfall
Conditions on Windermere 0=Flat calm, I1'Calm, 2='Moderate, 3=Choppy, 4=Rough, 5=Very rough
Apr May June July Aug Sept Oct INov I Dc lan Feb
Fig. 25. Meteorological records, 1940-1. Air temperature (9 a.m. Ambleside), ramfall (daily totals Ambleside) and observations on Windermere (estimate of mean daily condition).
18 0 21 3 4?0X ;: t^1Sl 1:^12 7 19 383 6 42
t5 4 7t1 6 6
4- 13 l7s 17 16 15 13 0 9 87 6 5
6)
14. 77 )2 ii _ i 886 993 94 tt16 tO; 93 82l 71l 65 _43 od o5 7 8 6 9 2 7 7 69
Date ' 2 i 4 1 1 0 9 1 8 2I 7 X1 6 5 4
Fig. 26. Esthwaite Water, 1940. Depth-time diagram of the distribution of temperature (0 C.) m water and mud surface (approx. 10 cm. below the surface).
had decreased (Fig. 29). Transparency had also considerably decreased owing to the presence of cloudiness resulting from the precipitation of ferric hydroxide produced by oxidation of ferrous iron at the mud surface.
This content downloaded on Tue, 5 Mar 2013 12:30:57 PMAll use subject to JSTOR Terms and Conditions

CLIFFORD H. MORTIMER 155
Apart from the sudden increases in concentration of ferrous iron, phosphate and reducing substances (oxygen demand), which occurred during subsequent weeks, the initial rate of increase, at the beginning of July, in concentration
1101 10 98 1 8 1
9 4 Overtrl 10 2 113 124 2 Partial Conplete
10 9 10 jl j 11 12
r . , 97 1 94 6- CD 1 0 )
14~~~abv and 74 o h u ufc, 4m E ot)
010
Fig.m27. Esthwite Wter, 1940.d Dept-tier diagreame of ithe dstribu ututionso,sole oxyge
anrrd submseqet figues asuntFig. 26.vrtrFi.2)
+5 +0061111 ~~~~~~~/OS81 40
00632 1 0703 05 0 in ~ 0
May ue luy Aug S-ept t -
Nov Dee~ a eb Mr1
Fig. 27. Esthwaite Water, 1940. Depth-time diagram of the distribution of rhsledo potyenta
sumer./. During Althibrgs periiodatslowe oWinclreasme,wtho) some. fluctugatios, oc-hi currd inumseqet casues us ntFigth ovrur6 Fg.2)
This content downloaded on Tue, 5 Mar 2013 12:30:57 PMAll use subject to JSTOR Terms and Conditions

156 Exchange of dissolved substances in lakes
Overttirt 1 2 Pai tial Cotiiplete
30 Alaiit CCO)7
10- ~~~~Carboti dioxidle '
82- Conductivit (K1s_L0_6 ______________________
? 4 | _
\O~~xygen
_30 8 =
-7 Alaint ACaCs3 8- Iron Total iron
Manganese ,-#Ferrous iron
= 20 Colour /
8 Sulhate (S(14) \_ \\= .; il0 Transpareny (S0)% v ' | - 08 4
60
24- 6H0.
Ot _ ~~~~~~~~~~~~~ f /_\ \
~~~~~~~~~~~~~~~~~~-0-
0 0
0~~~~~~~~~~~~~~~~~~~~~~~~~~*8'
41-5 ~~Ammoniia 0 zNH3 N 5 | Amm?nia/ < | \Nitrate (NO3 N) 015
t;0-5 5 - J Nitrite (NO2 N) -005
0 ~~~~~~~~~~~~~~~~~~~~~~~~~~0 16 Oxygen absorbed B 0 D (5 days 200C) / \
1l2 12 R From KMnO4 (4 hr 400C) /
C Chloride(Cl)
1? ' ' 'I'' gmulg sufc, 11 m.(m./l.. 4. 1. 1 - 0 May June July Aug Sept Oct Nov Dec
Fig. 29. Esthwalte Water, 1940. Concentrations of dissolved substances in water Just over the mud surface, 14 m. (mg./I.).
This content downloaded on Tue, 5 Mar 2013 12:30:57 PMAll use subject to JSTOR Terms and Conditions

CLIFFORD H. MORTIMER 157
Changes in total content of phosphate and silicate in the whole water column are shown in Fig. 12, ? I.
The same series of changes observed at the overturn in Esthwaite Water 1939 were repeated during 1940. A partial overturn occurred as the result of a gale on 17 September, followed by a calm spell (see Figs. 25-27). Circulation was not complete until the stormy weather after 5 October. The effect of these weather oscillations on the redox potential and concentration of solutes at the mud surface may be seen in P-igs. 28 and 29. A change in the ratio of alkalinity to conductivity was observed after the overturn (1940), indicating, as in 1939, the adsorptive removal of bases from the water by the oxidized mud surface. The fall in ammonia concentration at the partial overturn was followed by a nitrite maximum, itself followed by a comparatively high nitrate maximum 3 weeks later. Ferrous iron disappeared at the partial overturn, but manganese did not disappear until a fortnight later. A fall in transparency at the end of September was associated with the oxidation of ferrous iron. Phosphate concentration fell to minimal values after the overturn, and the concentrations of silicate, colour and reducing substances (oxygen demand) also decreased. Sulphate, which had only been reduced to half its original spring concentration, approximately doubled in concentration after the over- turn.
Redox conditions after the overturn (Fig. 28). It was some weeks after the overturn before the oxidized layer became fully developed at the mud surface, and the isovolt E7= 0- 20 V. remained at a relatively steady 'winter' level below the mud surface, comparable with that observed during May. The thickness of the oxidized layer was subject to considerable fluctuations. During a calm spell in December it consisted only of a surface scum containing ferric hydroxide, and it was again almost destroyed during stagnation under ice from 3 January to 15 February 1941. Samples were taken on the latter date while the ice was still breaking up and before circulation of the lower water had begun. The last sample on 12 March completed the investigation of an annual cycle, as it may be assumed that the oxidized layer remained at approximately the same thickness from March until thermal stratification and de-oxygenation recommenced in the spring.
Conductivity of the mud (Fig. 30) increased at all the levels investigated after thermal stratification had been established and rose to a maximum at the mud surface on 24 July. Possible reasons for this considerable increase and for the subsequent fall in the conductivity of surface layers will be dis- cussed later. Some considerable oscillations in conductivity values were ob- served at the period of the overturn, followed by a fall in conductivity at all levels to low values comparable with those found at the beginning of May. Another marked rise in conductivity at all levels was observed after the period of stagnation under ice. This was followed by a decrease in conductivity similar to that observed after the overturn.
This content downloaded on Tue, 5 Mar 2013 12:30:57 PMAll use subject to JSTOR Terms and Conditions

158 Exchange of dissolved substances in lakes
Overturn Ice cover Partial Complete 65 69
B l ffi ~~~ ~ ~~~304 1 ~lMud-surfaee
May June 'July Aug'Sept'Oct'INov Dec. Jan Feb 'Mar
Fig. 30. Esthwaite Water, 1940-1. Depth-time diagram of the distribution of electrical con- ductivity above and below the mud surface, 14 m. (l x 10-6).
0 679Overturn Assumed partial complete
2 B 91%
f93% sat. Oxygen _ / sat.
8 Alkalinity (CaCO3) ~ _ _ _ = __4
_ -_ _ _ _ .^ ~~~~~Sulphate
(SO4) 52
4 C ductivity (K280 x 106) 48 Silicate (SiO2) Carbon dioxide L46 R _ Nitrate (NO3) e, _>=
0-~~~~1 0 255 9 8 511 1 A 75
Sept. Oct. Nov. Dec. Jan. Feb).
Fig. 31. Windermere, North Basin, 1940-1. A. Weather observations (estimate of mean daily condition). B. Concentrations of dissolved substances n water Just over the mud surface, 65 m. (mg./A.).
This content downloaded on Tue, 5 Mar 2013 12:30:57 PMAll use subject to JSTOR Terms and Conditions
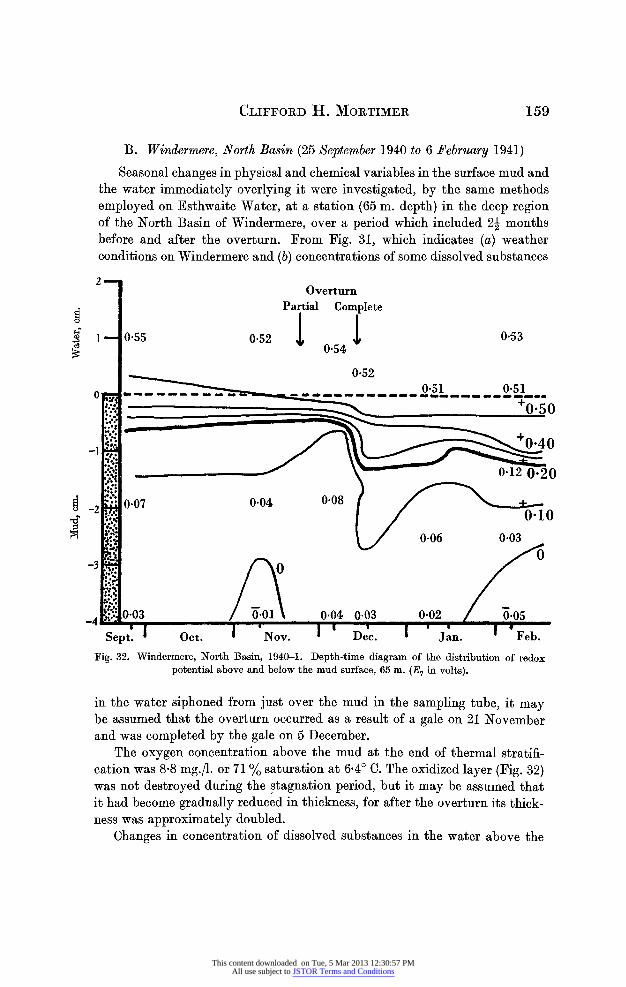
CLIFFORD H. MORTIMER 159
B. Windermere, North Basin (25 September 1940 to 6 February 1941)
Seasonal changes in physical and chemical variables in the surface mud and the water immediately overlying it were investigated, by the same methods employed on Esthwaite Water, at a station (65 m. depth) in the deep region of the North Basin of Windermere, over a period which included 21 months before and after the overturn. From Fig. 31, which indicates (a) weather conditions on Windermere and (b) concentrations of some dissolved substances
2 Overturn
Partial Complete 0 1 I
I 055 052 4, 04 053 0*54
_ ~~~~~~~~~0-52 07 =~ _ O=_______8051 0*50
0-40
0~~~~~~~~02 02i07 0.04 0-08 =
43 0 |''/
-4 0-03 T~o*0 0*04 0*03 0.02 O*05
Spt. 1 Oct. Nov. D. Jn.Feb.
Fig. 32. Windermere, North Basm, 1940-1. Depth-time diagram of the distribution of redox potential above and below the mud surface, 65 m. (E7 in volts).
in the water siphoned from just over the mud in the sampling tube, it may be assumed that the overturn occurred as a result of a gale on 21 November and was completed by the gale on 5 December.
The oxygen concentration above the mud at the end of thermal stratifi- cation was 8-8 mg./l. or 71 % saturation at 6.40 C. The oxidized layer (Fig. 32) was not destroyed during the stagnation period, but it may be assumed that it had become gradually reduced in thickness, for after the overturn its thick- ness was approximately doubled.
Changes in concentration of dissolved substances in the water above the
This content downloaded on Tue, 5 Mar 2013 12:30:57 PMAll use subject to JSTOR Terms and Conditions
160 Exchange of dissolved substances in lakes
mud, which occurred at the overturn, were definite but extremely small com- pared with those which occurred during the overturn in Esthwaite Water. A fall in the concentration of carbon dioxide and iron, and slight decreases in the concentrations of silicate, alkalinity and conductivity were observed. Calculation shows that the fall in conductivity can be accounted for by the decrease in concentration of substances producing alkalinity. This suggests that the adsorption of bases, observed in Esthwaite Water after the overturn and attributed to adsorption at the mud surface, also occurs in Windermere, although the effect is much less marked in the latter case. During the 2 months after the overturn, alkalinity fell slowly, while the conductivity remained constant. Data from analyses of inflow waters are not available to decide whether this change is due to continued adsorption of bases and liberation of anions other than bicarbonate (note increase in sulphate during the same period), or whether it must be attributed to changes in composition of inflow water. Sulphate and nitrate rose in concentration slightly after the overturn. Ammonia, nitrite and phosphate were only present in traces before and after the overturn. The concentration of oxygen during the period after the overturn represented percentage saturation values of about 92 at the temperatures concerned.
Although the conductivity of the mud core showed some fluctuations (Fig. 33), there was clear evidence of a fall in conductivity in all but the surface layers during the month following the overturn. A rise was noted at the end of January. Further evidence of seasonal change in conductivity in the mud is afforded by the comparison (Figs. 34, 35) of the vertical distribution of conductivity in a number of surface mud cores from the deep region of the North Basin of Windermere before and after the overturn. All the samples were taken at points, fixed by sextant bearings, within the 50 m. contour, i.e. within an area of approximately 1 km.2 Fig. 34 indicates the degree of local variation which was found, but shows that, in spite of this variation, there is little overlapping between the group of cores taken (A) at the end of summer stagnation (autumn 1939) and (B) at the end df winter circulation (spring 1940). Mean curves for these two groups are presented in Fig. 35. Useful data on the rate of production of ions at different levels in the mud may be obtained by mathematical analysis of such curves (see ? IV).
DISCUSSION
The occurrence of relatively slight changes similar to those just described for Windermere, North Basin, was confirmed by a similar study in the ~South Basin of Windermere over the same period. Investigation of single samples taken on other lakes (Thirlmere, Crummock Water, Ennerdale, Derwentwater) at different times of the year, suggests that similar changes occur in all lakes where de-oxygenation of the hypolimnion does not take place. On the other
This content downloaded on Tue, 5 Mar 2013 12:30:57 PMAll use subject to JSTOR Terms and Conditions
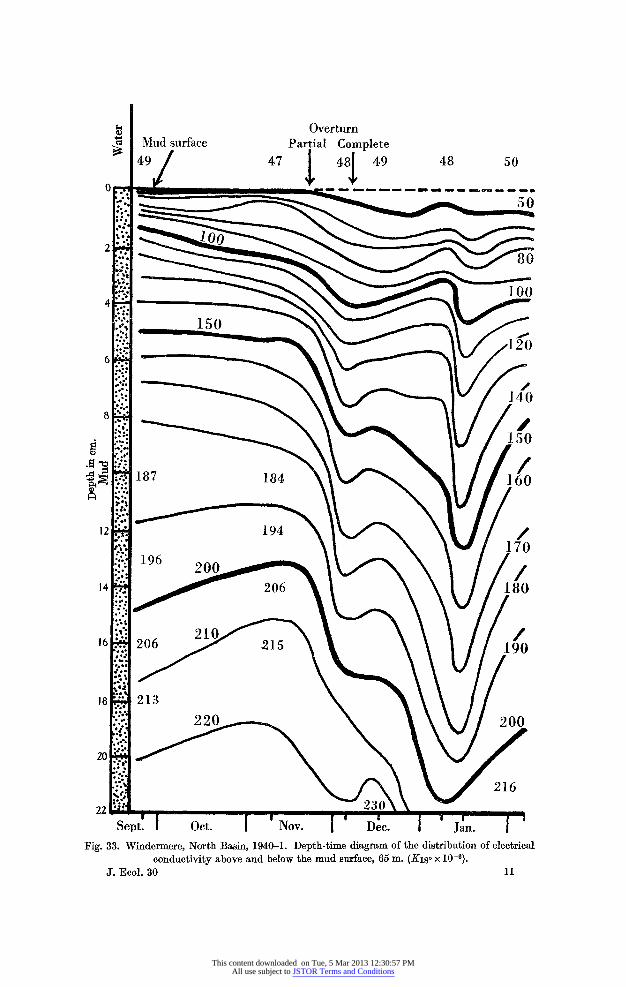
Overturn coMud surface Partial Complete ~~1:
49' 47 1 481 49 48 50 0
11" - - - - - n-~ ~ - -
50
2~~~~~~~~~~~~~8
100 4
120 6
140 8:
150
187 18460
12. 19 170
196 ~ ~ ~ ~ ~ ~ ~ ~ ~ ~ 9
200 ~ ~ ~ ~ ~ ~ ~ ~ 0
2020 8
2 1 ~ ~ ~ ~ ~ ~ ~ ~~1
22 230~~2020
Sept. Oct. NOV. Dec. Jan. I Fig. 33. Windermere, North Basin, 1940-1. Depth-time dliagram of the clistribution of electrical
conductivity above and below the mud surface, 65 m. (Ki8' X 1-)
J. Ecol. 30 11
This content downloaded on Tue, 5 Mar 2013 12:30:57 PMAll use subject to JSTOR Terms and Conditions
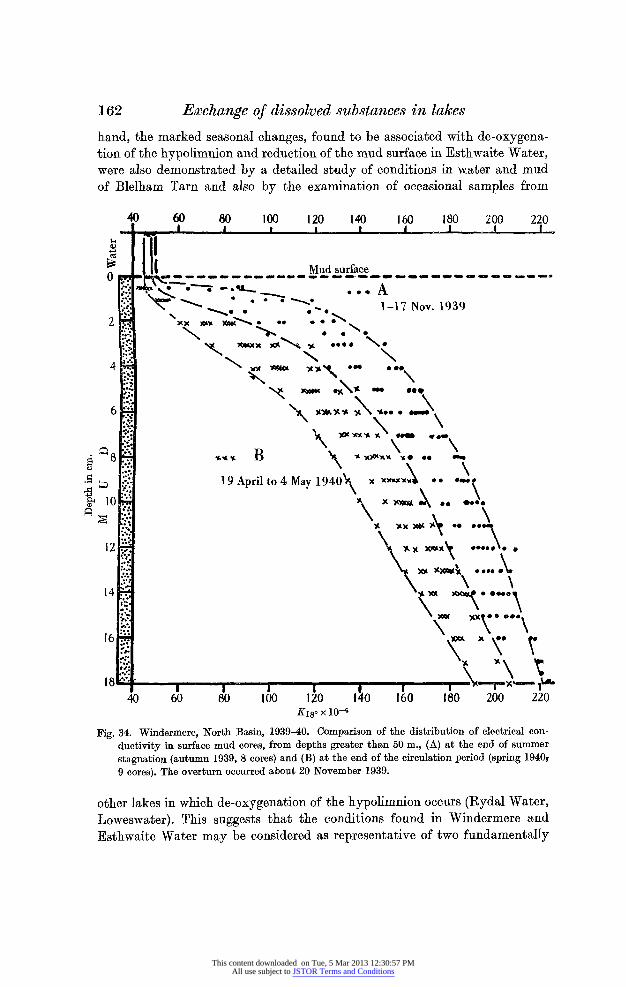
162 Exchange of dissolved substances in lakes
hand, the marked seasonal changes, found to be associated with de-oxygena- tion of the hypolimnion and reduction of the mud surface in Esthwaite Water, were also demonstrated by a detailed study of conditions in water and mud of Blelham Tarn and also by the examination of occasional samples from
40 60 80 100 120 140 160 180 200 220
_II.
0::.:. - Mud surface
**W A .1-17 Nov. 1939 2 x XRIA A_^ o .\11-
XV *A 0O 00
E B xxxxx uo \ 0
19 Apri to 4May 1940 x 6 X80 2
KA8? x 1*00
14 $'
40 60 80 100 120 140 160 180 200 220 K1-X 10-6
Fig. 34. Windermere, North Basin, 1939-40. Comparison of the distribution of electrical con- ductivity in surface mud cores, from depths greater than 50 m., (A) at the end of summer stagnation (autumn 1939, 8 cores) and (B) at the end of the circulation period (spring 1940s 9 cores). The overturn occurred about 20 November 1939.
other lakes in which de-oxygenation of the hypolimnion occurs (Rydal Water, Loweswater). This suggests that the conditions found in Windermere and Esthwaite Water may be considered as representative of two fundamentally
This content downloaded on Tue, 5 Mar 2013 12:30:57 PMAll use subject to JSTOR Terms and Conditions

CLIFFORD H. MORTIMER 163
different lake types. The causes of these differences and their relation to organic production will be discussed in ? IV.
Discussion of the results from Esthwabte Water. The considerable increase in the concentration of certain solutes in the water over the mud, which
40 60 80 100 120 140 160 180 200 220
E 1 ~~~~~~Mud surface
18 0 I I I I I I I
40 60 80 100 120 140 160 180 200 220 x 10-6 (subtract 40 in case of A-B)
Fig. 35. Wmndermere, North Basin, 1939-40. Mean distribution of electrical conductivity- computed from Fig. 34-n surface mud cores, from depths greater than 50 in., (A) at the end of summer stagnation (autumn 1939) and (B) at the end of the circulation period (spring 1940).
occurred after the mud surface had become reducekd-or, more precisely, after the isovolt E7= O*20 V. had risen to the mud surface-is in close agreement with the findings in the anaerobic tank experimentX (? II), and substantiates
11-2
This content downloaded on Tue, 5 Mar 2013 12:30:57 PMAll use subject to JSTOR Terms and Conditions

164 Exchange of dissolved substances in lakes the suggestion, made in ? I, that similar increases observed in 1939 resulted from the reduction of adsorbing ferric complexes in the mud surface. In short, results from all three sections are consistent with the view that com- paratively large amounts of material are liberated during the destruction of the oxidized surface mud layer. The rate of increase in concentration of many substances in the water during the later summer was usually much slower. This may be taken to represent the steady rate of supply from continuous processes in the mud, the products of which were free to diffuse into the water unhampered by the strongly adsorptive effect of the oxidized mud surface.
In contrast to this, conditions (a) in Esthwaite Water after the overturn when the surface oxidized layer had re-formed, and (b) in Windermere, where the oxidized layer was never completely destroyed throughout the year, were similar to those observed in the aerated tank (? II). Although continuous production of ions must have been taking place, concentration in the water was little affected, as precipitation and adsorption in the oxidized mud surface had immobilized a large part of these products. This process, and its reversal after the onset of thermal stratification, also appears to have affected ionic concentration in the mud itself. Thus the general rise in conductivity of the mud in Esthwaite Water during May and June (Fig. 30) may be attributed to the decrease in thickness of the oxidized layer, resulting in the liberation of adsorbed ions and to a corresponding decrease in capacity of the surface layer to adsorb products of continuous mud processes. A converse explana- tion may apply to the general fall in conductivity after the overturn. It appears unlikely that these changes can be explained by changes in tem- perature at the mud surface, as this was fairly constant throughout spring and early summer, rising to a maximum at the overturn. This rise in tem- perature might be expected to increase ionic production in the mud; but in fact a decrease in conductivity occurs at this time. Similar seasonal changes in the conductivity of Windermere muds (Fig. 33), although not so marked as in Esthwaite, may be considered to be associated in a similar manner with changes in thickness, and therefore in total effectiveness as an adsorbent blanket, of the surface oxidized layer.
It will be observed that both in Esthwaite Water and Windermere (Figs. 30, 33, 34, 35) the greatest changes in the concentration (conductivity) gradient occurred at and near the mud surface, suggesting that the amplitude of sea- sonal fluctuations is greatest in this region. These fluctuations may be considered to result partly from the physical-chemical changes in the mud surface, described above, and partly from seasonal changes in the eddy diffusion coefficient in the water just above the mud. The rate of removal of ions from the mud depends on the product of this coefficient and the concentration gradient in the water in contact with the mud.
The reason for the rise to the high conductivity maximum observed at
This content downloaded on Tue, 5 Mar 2013 12:30:57 PMAll use subject to JSTOR Terms and Conditions

CLIFFORD H. MORTIMER 165
the mud surface on 24 July (Fig. 30) is obscure. The oxidized layer was destroyed and the ions adsorbed in it presumably released a month earlier. These high values cannot be due to contamination, as they were found on two sampling occasions, and their effect on the mud surface is apparent for some time afterwards. It is possible that a large plankton crop produced during the long calm fine spell in the latter half of July may have settled and decomposed on the mud surface. Unfortunately, no data on the plankton population is available. The fall in conductivity after this period may have been the result of diffusion of the products of this decomposition into the water, in which a marked increase in conductivity was noted at this time, and also partly to the cause, to which a similar fall in conductivity in the anaerobic tank was attributed (? II), namely, precipitation of ferrous sulphide. The fall is greatest in the top few centimetres of the mud, in which most precipitation might be expected to occur, and in which considerable accumu- lations of black ferrous sulphide were observed towards the end of the summer.
Fluctuations in conductivity throughout the whole mud core at the time of the overturn are difficult to explain. The partial overturn (23 September) was associated with a fall in conductivity, another rise occurring during the period before complete circulation of the bottom water had been established (cf. Figs. 27, 30). This was followed by a sharp fall, then a slight rise and a slow fall during the early winter. Without further study it cannot be said how far these variations may be attributed to local variations near the sampling point. Such variation is, however, relatively small in the deep region of Windermere (Fig. 34). If local variation is made responsible for the fluctuation observed during the month ending 21 October, it is difficult to explain why such fluctuations were not observed at other times of the year.
The explanation of the rise in conductivity which occurred in the mud during the period under ice is considered to be the same as that given for the similar rise which occurfred during May and June. Partial reduction of the mud surface and decrease in eddy diffusion in the water over the mud were probably both contributory factors. If the results from one sample (15 February) are considered to be representative, the rise in mud conductivity under ice was greater than during a comparable period. in the spring. This cannot be explained 'by a more rapid reduction of the mud surface under ice (cf. Figs. 28, 30), but must have been the result of the difference in eddy diffusion coefficient in the water just above the mud during the two periods. Under ice this coefficient was certainly considerably lower than during summer thermal stratification (cf. Tables 1 and 2, ? I).
Other points of interest arising from changes in the distribution of redox potential and concentrations of dissolved substances are briefly dealt with below. The lag (Fig. 28) in the formation, after the overturn, of a surface- oxidized layer, comparable in thickness to that found at the end of the winter, may be considered to be the result of the slowness of diffusion in the mud
This content downloaded on Tue, 5 Mar 2013 12:30:57 PMAll use subject to JSTOR Terms and Conditions
166 Exchange of dissolved substances in lakes and of the slowness of oxidation of the accumulated products of summer reduction. Of these, ferrous sulphide probably forms an important part. Similarly, the lag in reduction processes during the initial stages Qf summer stagnation (Figs. 12, 28) may be largely due to the slowness of reduction of ferric hydroxide and other ferric complexes under natural conditions. A similar observation was made by Pearsall & Mortimer (1939, p. 493).
No explanation can be offered for the large fluctuations in concentration of some substances, notably phosphorus, iron and reducing substances ('oxygen demand') in the water above the mud during summer. Such large fluctua- tions were not observed during 1939. It is probable that, compared with 1939, conditions in the hypolimnion were unstable as a result of poorly de- veloped stratification (cf. Figs. 3, 26). August was also exceptionally stormy. However, estimhtes of the eddy diffusion coefficient for that month at 13 m., obtained by methods described in ? I, are not considerably greater than esti- mates for a similar period in 1939 (see Table 1, ? I). The mean estimates of [A] for August 1940 and 1939 may be taken as 4 x 10⁻² and 3 x 10⁻² respectively.
A comparison of the graphs of 02 and C02 concentrations (Fig. 29) suggests that little, if any, anaerobic C02 production occurred.
In most natural waters manganese, like iron, is practically insoluble in trivalent (oxidized) form, but is soluble in manganous (reduced) form. The appearance of manganese in the water at an earlier date than ferrous iron, and its persistence for some time after ferrous iron had disappeared at the overturn, suggests that insoluble manganic compounds in the oxidized mud surface are reduced more readily, i.e. at a higher redox potential, than the ferric complexes. It is of interest to note that sulphate, although considerably depleted, was not completely reduced in the water above the mud during summer stagnation. It may also be noted that the redox potential in the water did not reach the potential, E7 =0-06 V., at which sulphate completely disappeared in the anaerobic tank experiment (? II), until just before the overturn.
Chloride showed little seasonal change in concentration (Fig. 29). This agrees with the findings of Ohle (1933-4). The chloride ion is apparently not concerned in seasonal redox and associated changes.
The results obtained on Esthwaite Water 1940 have confirmed the descrip- tion of events in the hypolimnion, suggested by the study of the distribution of redox potential and dissolved substances in the water during 1939 (? I). Seasonal changes in the mud are correlated with and largely control seasonal changes in the water. In particular, variations in concentrations of solutes in the hypolimnion, detected during 1939 and confirmed during 1940, were found to be dependent on redox conditions at the mud surface. Almost all the phenomena in mud and water, described during the development of anaerobic conditions in an artificial mud-water system (? II), were found to
This content downloaded on Tue, 5 Mar 2013 12:30:57 PMAll use subject to JSTOR Terms and Conditions

CLIFFORD H. MORTIMER 167
be repeated in the same order in Esthwaite Water during the development of de-oxygenation in the hypolimnion. One exception was that the complete reduction of sulphate with precipitation of ferrolus sulphide in the water, observed in the experimental tank, did not occur in Esthwaite Water during 1940, although there is some evidence that it occurred during September 1939. This may be explained by the higher mean potential in the lower hypolimnion during September 1940. The mean potential at 13 m. during the month pre- ceding the overturn in 1940 and 1939 was approximately E7= 0 17 and 0 09 V. respectively. The latter potential is not far removed from that (E7 = 006 V.) at which sulphate disappeared from the water of the experimental tank. The reason for this difference in behaviour between successive years may have been the conditions under which thermal stratification was set up in the spring. From the outset the hypolimnion was thermally stratified to a far higher degree during 1939 than during 1940 (cf. Figs. 3, 26).
Discussion of results on Windermere. If the explanation of events in Esth- waite Water is a true one, then the fact that the surface oxidized layer of the mud was not reduced in Windermere explains the absence of large seasonal variations in concentrations of dissolved substances in the water. The relatively lhigh concentration of dissolved oxygen, which was maintained at the mud surface during the period of thermal stratification, was responsible for the failure of the lower mud-the reducing intensity of which, as will be shown later, is not far below that of Esthwaite Water-to reduce the ferric complexes in the mud surface. When, under suitable conditions (anaerobic tank experi- ment), reduction of Windermere surface mud did take place, marked changes occurred in the mud-water system similar to those already described for Esthwaite Water. The small seasonal variations which were found to occur under natural conditions in Windermere are probably largely the result of seasonal changes in degree of eddy diffusion and in oxygen concentration gradient at the mud surface.
The thickness of the surface-oxidized mud layer may be taken to represent a balance between (a) the rate of diffusion of oxygen into the mud, which is a function of the concentration gradient at the mud surface, and (b) the re- ducing power of the mud. Seasonal variation of (b) is not known, but probably not large. When the rate of supply of oxygen to the mud surface by eddy diffusion from above is decreased during thermal stratification, the concen- tration gradient at the mud surface decreases to an extent determined by the degree of eddy diffusion in the water and the rate of oxygen absorption by the mud. The thickness of the surface-oxidized layer then decreases, adjusting itself to the new balance between oxygen supply and consumption. It is possible that the slowness with which insoluble ferric compounds are reduced imposes a lag on this adjustment. The decrease in thickness, of course, takes place from below, and may be expected to result in some liberation of soluble ions previously adsorbed or precipitated (Fe, Mn, P04 and bases), and also in
This content downloaded on Tue, 5 Mar 2013 12:30:57 PMAll use subject to JSTOR Terms and Conditions
168 Exchange of dissolzved substances in lakes
some depletion of the total capacity of the oxidized layer to bind the products of continuous processes in the lower mud. One demonstrable result of this is a rise in ionic concentration (conductivity) in the mud and a slight increase in concentrations of certain substances (cf. alkalinity, conductivity, C02) in the water. The bulk of the material liberated in this way, however, is re- absorbed by the surface oxidized layer that remains. The main difference between lakes of the two types, exemplified by Esthwaite Water and Winder- mere, is that in the former the supply of dissolved oxygen to the mud surface is more limited and the oxygen concentration gradient falls sufficiently low for the whole of the surface oxidized layer to become reduced, initiating the marked changes in ionic exchange between mud and water, already described.
At the overturn both lake types exhibit a reversal of the changes which took place in mud and water during thermal stratification. The reversal in the mud appeared to be more rapid in Windermere than in Esthwaite (cf. Figs. 28, 32). This may be because no considerable sulphate reduction and accumulation of insolubIk ferrous sulphide in the mud surface occurred in Windermere.
IV. GENERAL DISCUSSION
Facts and correlations disclosed by the findings in preceding sections, and further data obtained from other lakes in the English Lake District, linked together by hypothesis, help to provide a description in outline and in physico- chemical terms of one aspect of the cycle of organic production in lakes. Roughly speaking this description applies to a reversible system, the chemical cycle in the lake basin, which is inserted into and maintained by a larger relatively irreversible geochemical process, enacted in the whole drainage basin. As a hydro-electric plant transforms and accumulates a portion of potential energy, which would otherwise be (relatively) irreversibly wasted, so a lake traps for organic production a part of the available 'chemical potential' of a drainage system, which would otherwise be more rapidly lost to the sea. Various factors, including the peculiar properties and stability of humus, normally lead to the accumulation of organic material in lake deposits, whichl function as accumulators, defraying a portion of the 'chemical potential' for organic production in the water, and themselves being continually replenished by deposition of organic matter and silt from above. Thus anabolic processes in the water and katabolic processes in the mud constitute a reversible lake system, the importance of which, relative to irreversible maintenance pro- cesses in the drainage area, may be expected to vary with the age of the lake and the ratio of its water volume to inflow. The constitution of the mud- water-atmosphere system, and the fact that katabolic processes involve rp- duction, explains why redox reactions are so intimately linked with the lake cycle. The impact of climate on the system exercises a profound influence through control of the seasonal distribution of redox conditions.
This content downloaded on Tue, 5 Mar 2013 12:30:57 PMAll use subject to JSTOR Terms and Conditions

CLIFFORD H. MORTIMER 169
One general result of this investigation has been to direct attention to the importance of (a) processes in the mud, especially at the mud surface, and (b) water movements, for the 'metabolism' of the lakeas a whole. Both these aspects of the lake cycle have received some special discussion in previous sections. In particular, the importance of the presence or absence of reduction at the mud surface, discussed in terms of colloid chemistry, was emphasized especially in ?? I and II, while the controlling influence of turbulence, asso- ciated with water movements, on the transport of dissolved substances within the lake system was demonstrated in ? I. Apart from some further discussion of water-movements, this section therefore will be confined to a consideration of some general implications of the previous findings.
Biotic influences. It will be noted that the interpretation of the changes observed in both natural and artificial mud-water systems in previous sections has been almost exclusively physico-chemical. Biotic influences must not be ignored, although the closeness with which a relatively simple physico-chemical interpretation fits the facts suggests that these influences express themselves mainly along physico-chemical lines. Among such influences may be included the relation of bacterial population and its activities to redox conditions (see Hewitt 1931 for a review of this subject) and the effect of plankton production on the rate of addition of organic matter to the hypolimnion and mud. The effect of changes in the distribution of physico-chemical variables on organic reactions should also be considered. A beginning has been made by Kusnetzow & Kusnetzowa (1935), who found that the bacterial reduction of formic acid to methane took place most actively in muds at a redox potential of E7 - O12 V., and that the upper potential limit was between E70 and + 0O15 V. Active methane production, however, was not found in all muds below these potential limits. They suggested that C and N supply is the controlling factor.
The relation of seasonal variations in redox conditions at the mud surface to the ecology of the profundal bottom fauna. It appears highly probable, but still remains to be demonstrated, that a close relationship of this kind exists. Since the classical work of Thienemann and collaborators, a relation between the profundal bottom fauna, especially Chironomidae, and degree of productivity (trophic condition) in lakes has been established. Hutchinson et al. (1939) discuss certain inco4sistencies that have been found, suggest that redox poten- tial is an important determining factor, and demonstrate a relation between the Chironomid population in a series of lakes and the redox potential of the bottom water during thermal stratification. In the absence of potential measurements in the muds, they consider the reducing power of the mud only as it affects the open water. It should be noted that the potentials recorded in the presence of ferrous iron (detected by ac-c -dipyridyl) are con- siderably (01-02 V.) higher than those found in the presence of similar Fe++ concentrations in Lake District lakes and artificial mud-water systems (cf.
This content downloaded on Tue, 5 Mar 2013 12:30:57 PMAll use subject to JSTOR Terms and Conditions

170 Exchange of dissolved substances in lakes
previous sections and also the discussion of the determination of Fe++ by this method, Hutchinson 1941). As a result of a quantitative study of the ecology of the profundal bottom fauna in lakes, Eggleton (1931) concludes: 'Emergence and egg laying of insects, variations in sexual activity of other benthic types, and the rate and time of hatching of eggs on the lake floor are all influenced by the physical-chemical seasonal cycle and, in turn, greatly affect the qualitative-quantitative variations of the profundal benthic popu- lation.'
Water movements Before proceeding to a discussion of the factors which determine whether
or not reduction of the mud surface and associated physico-chemical changes take place, present knowledge of water movements in the hypolimnion must be considered. The position is unsatisfactory in so far as all evidence of the nature of these movements is indirect. Technical difficulties have so far prevented actual measurement of their velocity and direction. Although all such indirect evidence from the rate of change of distribution of dissolved substances and temperature agrees in demonstrating that the hypolimnion is not stagnant, the views so far expressed on the cause and nature of the water movements show disagreement.
The predominant effect of wind in distributing heat in regions of lakes removed from the effect of radiation was originally recognized by Murray (1888, refs. in Murray & Pullar, 1910). This theory of wind-distributed heat was amplified by Birge (1916), who, in common with Schmidt (1925, 1928), regarded turbulence associated with wind-generated currents as the main agent in transporting heat and dissolved substances throughout lakes, in- cluding the hypolimnion. McEwen (1929) has attempted to establish a prac- tically complete and therefore complex mathematical theory of the distribution of temperature and dissolved substances in natural waters, taking radiation, conduction, evaporation, convection and wind-generated turbulence into con- sideration. A general result emerging from the application of this theory to the distribution of temperature in Lake Mendota was that the effect of all factors except the last was found to be practically confined to the epilimnion and the thermocline region. This theory is discussed in detail by Hutchinson (1941).
The above authors have little to say on the generating mechanism and magnitude of the water movements producing turbulence in the hypolimnion. One over-simplified view often expressed (cf. Wedderburn, article in Murray & Pullar, 1910; also Whipple, 1927, ref. in Welch, 1935), is that wind produces a surface drift compensated by a return current in the lower part of the epilimnion, which in turn induces a slower circulation in the hypolimnion. Whipple actually demonstrated that a return current may also occur in part below the thermocline. But the marked chemical stratification encountered in the hypolimnion of many lakes (cf. results for Esthwaite Water) is not concordant with the view that this secondary circulation below the thermo-
This content downloaded on Tue, 5 Mar 2013 12:30:57 PMAll use subject to JSTOR Terms and Conditions

CLIFFORD H. MORTIMER 171
cline involves a complete rotational motion (overturn) of the hypolimnion water mass of the type figured by Wedderburn (Murray & Pullar, 1910). This has been emphasized by Alsterberg (1927, 1930), who considers that the primary circulation in the epilimnion induces a secondary circulation in the upper hypolimnion, which in turn induces a tertiary one at a lower level, and so on. He envisages a large number of such circulations moving in thin horizontal laminae, the resultant motion having a negligible vertical component. Al- though this hypothesis explains the preservation of chemical stratification, it is difficult to see how such a complex system of horizontal streaming, the direction of which is reversed at short depth intervals, could be set up and what source of energy is available to maintain it.
A discussion of Hutchinson's (1938b) evidence in favour of Alsterberg's views is relevant here, as he suggests that these views are contradictory to those which lay emphasis on turbulence. In the opinion of the present writer this disagreement is not a real one. First considering Hutchinson's evidence, this is based on a mathematical analysis of the vertical distribution of alka- linity in Linsley Pond (max. depth 14*8 m., area 0 094 km.2), a small eutrophic lake in which the rise in alkalinity in the hypolimnion is mainly due to the supply of ammonia and ferrous iron from the mud. As pointed out by Alsterberg himself, one of the deductions from his hypothesis is that a rela- tionship should exist between the chemical characters of each horizontal layer of water and the area of mud surface to which it is exposed at the edges. This implies the unimportance of vertical turbulent transport relative to horizontal streaming, i.e. change in concentration at any one point in the hypolimnion water-column results, not from transport from above or below, but from the side. Throughout the whole of the summer Hutchinson found that the vertical concentration gradient of alkalinity was considerably less at two levels, usually approximately at 8 and 11 m., than at levels just above and below these. In other words, the concentration increased with depth, not in a smooth curve of the type to be expected if uniformly distributed eddy diffusion was respon- sible for the vertical transport of alkalinity, but in a series of steps. An apparent correlation existed between the form of this latter curve and a curve which represented the depth distribution of the relative areas of mud to which each horizontal layer of water was exposed at its edges. In Hutchinson's view this correlation supported Alsterberg's hypothesis and excluded the possibility of vertical turbulent transport.
This conclusion is open to question on the following general grounds. In order to produce the observed rate of increase in concentration at the (central?) sampling station, horizontal streaming, to be effective in transport over the distance from the side (area of lake is equivalent to a circle of radius 173 m.), would almost certainly have been sufficiently rapid to involve turbulence. This argument would apply more forcibly to a larger lake. It is also shown later in actual examples (Figs. 37, 38, 39 and 41) that isotherms and isopleths
This content downloaded on Tue, 5 Mar 2013 12:30:57 PMAll use subject to JSTOR Terms and Conditions

172 Exchange of dissolved substances in lakes
may be forced out of their normal horizontal position. Such displacement would disturb purely horizontal laminary flow. Hydrodynamical theory (Schmidt, 1925; Defant, 1929) postulates that water movements under open unstratified conditions are associated with turbulence even at extremely slow velocities. Pure laminary flow may be expected hardly ever to occur. This being so, the apparent disagreement between Alsterberg's hypothesis and the 'turbulence hypothesis' disappears. Both views stress different aspects of the same phenomenon. It is clear that, as Alsterberg and Hutchinson emphasize, movements of water masses in the hypolimnion must be mainly horizontal; nevertheless the turbulence necessarily associated with these movements would be sufficient to account for the vertical transport of solutes (which Alsterberg has demonstrated is more rapid than would be the case if molecular diffusion alone were operative), and also for the maintenance of chemical stratification, as long as the dimensions of the turbulent eddies are small in comparison with the hypolimnion.
Discussing hypolimnion water movements in more detail, Hutchinson (1941) modifies his former extreme view (1938b), admits the presence of tur- bulent mixing, but considers it inadequate in accounting for the observed distribution of temperature and alkalinity in the lower hypolimnion of Linsley Pond, Lake Quassapaug and Lake Mendota. Data for Lake Mendota (area 39 km.2, max. depth 23 5 m.) was obtained from Birge's computed mean weekly temperature distribution for 1895-1915, as used by McEwen (1929). Much of Hutchinson's subject-matter, especially that describing the phos- phorus cycle and development of chemical stratification in Linsley Pond, has considerable bearing on matters discussed here. A more detailed considera- tion, however, must be deferred, apart from an outline of the argument with regard to water movements, which follows.
If it be assumed that (i) the distribution of heat in the water column during spring and summer is effected wholly by turbulent transport from above, and that (ii) a constant eddy diffusion coefficient (A) is maintained throughout the column, then the rate of change of temperature (d6/dt) in the column falls exponentially with increasing depth (z). In the above lakes such a region of exponential fall of d6/dt is confined to the upper part of the hypolimnion, termed clinolimnion, which may include part of the thermocline. Departure from the exponential fall in the epilimnion forms the basis of McEwen's (1929) theory of convectional cooling, and cannot be discussed here. Departure in the lower hypolimnion-or bathylimnion, in which d6/dt tends to become con- stant at all depths-is the subject of present discussion. This departure implies that, in part of the bathylimnion at least, either (a) the eddy diffusion coeffi- cient increases with depth, or (b) some other non-turbulent heating mechanism is operative. Hutchinson accepts the latter alternative on the following grounds.
Mathematical analysis of temperature distribution by McEwen's (1929)
This content downloaded on Tue, 5 Mar 2013 12:30:57 PMAll use subject to JSTOR Terms and Conditions

CLIFFORD H. MORTIMER 173
method (i.e. fitting the observed vertical temperature gradient, d6ldz, to an arbitrary function which can be simply differentiated) yields mean estimates of A for different levels. These estimates vary little in the clinolimnion (4-9 m. in Linsley Pond, 9-16 m. in Mendota) with either depth or 'stability' (i.e. da/dz, where a=density). From this, Hutchinson infers that 'the generaliza- tion that the coefficient of turbulence is minimal in the more stable layers is clearly erroneous as far as the clinolimnion... is concerned., Moreover, if as seems probable, the coefficient is essentially constant throughout the whole hypolimnion, the generalization is essentially false for all depths below the thermocline.' In other words, he does not expect turbulence to increase in the lower hypolimnion as a result of the decreased stability there. However, assuming alternative (a) and the exclusion of (b), and using methods similar to those used to obtain estimates of A in ? I, Hutchinson does in fact arrive at values which, in the case of Lake Mendota, increase from 3 x lo-2 c.g.s. units in the clinolimnion to double this value at 20 m. depth. Nevertheless, he concludes: 'Since, at least in [his] Figure 4, the criterion of validity [applied by McEwen 1929, demonstrating constant A in the clinolimnion] is so clearly satisfied, it is certain that these increasing values are erroneous.' (Brackets and italics inserted in above quotations by present writer.)
Clarification of this point is important, for, if Hutchinson's view is correct and of general application, the estimates presented in Tables 1 and 2, ? I, may not represent true coefficients of eddy diffusion. The following considera- tions, however, prevent the ready acceptance of Hutchinson's views and their general application without further evidence. The 'criterion of validity' in the figure referred to above only applies to a depth of about 15 m., i.e. to the clinolimnion. There is not sufficient evidence for the assumption that, because A varies little with stability or depth in the clinolimnion, there is no variation in the bathylimnion and no correlation with stability. Hutchinson did in fact observe a marked decrease in A with increasing stability as the season ad- vanced. It appears to the present writer that, pending further evidence, the decision between alternatives (a) and (b) is still open, and that, in view of the difficulties in the way of (b), discussed below, (a) is the more probable.
As a non-turbulent heating mechanism in the bathylimnion, Hutchinson suggests 'profile-bound chemical density currents', combined with horizontal streaming presumably of the type postulated previously (1938 b). He supposes that water in contact with the mud, as a result of its increased dissolved content (1 mg./l. 'HCO3 was equivalent to a density increase of 1-8 x 10⁻⁶ in Linsley Pond), flows down the mud slope to its new density level, carrying heat with it. This mechanism has been suggested (Birge et al. 1928) to explain the warming of the bottom water of lakes under ice to temperatures above 40 C. In discussing the possible effectiveness of such a mechanism it should be remembered that in most lakes the mud slope in the deep regions is very slight. It is therefore open to question whether the small density increase
This content downloaded on Tue, 5 Mar 2013 12:30:57 PMAll use subject to JSTOR Terms and Conditions

174 Exchange of dissolved substances in lakes
produced in the water in contact with the mud is sufficient to overcome the friction offered by the mud surface. Hutchinson does not discuss the location of the compensation flow necessarily resulting from such 'chemical density currents', but, as horizontal streaming is held responsible for transport from the mud slope to the lake centre, it is possible that he envisages a central upward compensation flow of the type suggested by Alsterberg. Difficulties in the way of conception of a purely horizontal laminary flow were discussed earlier.
In ? I a method of computing exchange coefficients at certain levels in the hypolimnion water column, from the transport of heat downward and of solutes upward through these levels, was applied. Examination of this method and its preliminary assumptions shows that the estimates obtained were of 'virtual' exchange coefficients and yielded no information on the exchange mechanism. Now if this mechanism is mainly turbulence, estimates obtained from the transport of any conservative property through the level, i.e. trans- port of heat downwards and of various solutes upwards, should be identical. On the other hand, one result of Hutchinson's non-turbulent exchange me- chanism, whether operative alone or superimposed on turbulence, is a flow of heat and solutes down the mud slope and from there, by horizontal streaming, to corresponding levels of the central water column. It follows that the 'virtual' exchange coefficient at any level in this column, computed, as in ? I, from the downward transport of heat, will be greater than those estimates computed from the upward transport of solutes. In Esthwaite Water and Schleinsee (Table 1) the reverse was found to be the case, although the esti- mates can only be regarded as first approximations using inadequate data. Agreement between estimates from upward transport of various solutes was satisfactory; lower values computed from the downward transport of heat may possibly be explained by failure to account for flow qf heat into the mud. This discrepancy disappeared when the upward transport of heat and solutes in lakes under ice cover was considered (Esthwaite Water, Blelham Tarn, Table 2).
If, in view of these results, and in the absence of more detailed evidence, alternative (a), i.e. vertical variation in the eddy diffusion coefficient, is ac- cepted as an explanation of the distribution of heat and solutes in the hypo- limnion, then the 'stepwise' increase in alkalinity with depth in Linsley Pond (Hutchinson, 1938 b;- cf. also Esthwaite Water, Figs. 7, 11) is primarily deter- mined, not by any apparent correlation with the depth distribution of mud area, but by depth variation of A. Another factor which influences the depth distribution of alkalinity, and also limits its application as a 'conservative' property in turbulence computations, is the oxidation of ferrous iron at the top of the hypolimnion, the re-solution of the precipitated ferric hydroxide at lower levels, and adsorption phenomena associated with this. It is of interest that Hutchinson et al. (1939) found the thermocline in Linsley Pond at 7 m.
This content downloaded on Tue, 5 Mar 2013 12:30:57 PMAll use subject to JSTOR Terms and Conditions
CLIFFORD H. MORTIMER 175 depth on 16 September 1938, i.e. 1 m. above the upper 'step' in the alkalinity depth distribution curve (Hutchinson, 1938b).
To summarize this discussion: results to date demonstrate that water flow in the hypolimnion is largely horizontal, permit the expectation that turbulence associated with this flow is the main mechanism of heat and chemical ex- change in larger lakes, and suggest that non-turbulent exchange mechanisms may become increasingly significant in smaller bodies of water. A probable cause of the horizontal flow is described below.
Suggested mechanism of induction of horizontal water movements in the hypolimnion. Murray (1888, refs. in Murray & Pullar, 1910) was the first to demonstrate, from the study of vertical distribution of temperature at various points along an axis of a lake, that a wind blowing in one direction for some time across a thermally stratified lake may transport warm surface water to the lee side, resulting in a deepening of the epilimnion on that side and a corresponding tilt of the isotherms in the thermocline region. When the wind drops, this tilt is clearly unstable. The isotherms swing back to horizontal. They may swing past the horizontal level of equilibrium and set up a series of oscillations or 'temperature seiches'. Wedderburn (1911) has shown that the theoretical frequency of such oscillations may be estimated from a considera- tion of ideal lake systems in which the discontinuity layer between two fluids of different density oscillates in a similar manner. The theory has also been applied to a stratified liquid of varying density in basins of different shapes. Close agreement was obtained between the frequency computed from theory and that observed in Loch Earn and in experimental tanks (Wedderburn, 1912). The appearance of temperature seiches in Loch Earn and in other lakes was found to be related to wind and other meteorological conditions. Corre- lation between wind and temperature oscillations was close in most cases, but not so complete in others. 'Examples of the effects of winds, both in starting and in damping oscillations already in progress, have been given, with the indication that even a wind of very moderate strength will start oscilla- tions, and examples of oscillations forced by wind have also been obtained' (my italics).
It is clear from the observations of Wedderburn and others that a tilt of the thermocline, i.e. displacement of the 'isosteres' (surfaces of equal density) from the position of horizontal equilibrium, is a common occurrence which must result in some displacement of the hypolimnion water mass. The extent and path of the resultant motion is at present largely unknown, but it may be suggested from theory (Defant, 1925, pp. 24-5, Figs. 4, 5) and from tatik experiments (Wedderburn, 1911, Pt. I; Wedderburn & Williams, 1911; Hut- chinson, 1938b) that an oscillatory motion is induced in phase with changes in declination of the isosteres, and that in the central region of the lake basin this motion is mainly horizontal or parallel to the contours of the bottom. In direct attempts to measure flow in the hypolimnion of Loch Earn it was
This content downloaded on Tue, 5 Mar 2013 12:30:57 PMAll use subject to JSTOR Terms and Conditions

176 Exchange of dissolved substances in lakes
found that the currents were too slow to be detected with an Ekman current meter, i.e. they were less than 1 cm. per sec., below 20 m.
If, as seems probable, the flow induced in the hypolimnion by wind-gene- rated displacements of isosteres has the character of discontinuous, damped, horizontal oscillations, and is not a unidirectional laminary streaming of the Alsterberg type, then this is an additional reason for the expectation that distribution of properties in a central hypolimnion water column is controlled mainly by vertical transport due to turbulence resulting from these oscilla- tions, and not by lateral transport from the mud slope to which, if projected horizontally, each sliee of the water column is exposed at its edges (cf. Hutchinson, 1938b). Further, there is nothing inherent in the mechanics of isostere displacement to suggest that the coefficient of turbulence is constant at all depths, in fact the contrary may be expected.
Evidence of the effect of wind in tilting isotherms and isopleths is pre- sented in Figs. 37, 38, 39 and 41, but the direct demonstration of horizontal oscillatory flow in the hypolimnion and of turbulence associated with it has still to be achieved. As the movements are wind-generated, the rate of spread of properties in the water column may be expected to depend on the work done by the wind, i.e. on such factors as wind velocity, length of 'fetch' and degree of exposure of the lake. Murray (cf. Wedderburn's article in Murray & Pullar, 1910) noted that the temperature in the abyssal regions of deep lakes increased during the summer in 'fits and starts', depending on the occurrence of windy spells.
It can be shown that a relation exists between (a) the dimensions of the lake basin, and its exposure to wind, and (b) the mean eddy diffusion coeffi- cient in the hypolimnion. A wind can exert a greater total force on a larger area, and the damping effect of friction with sides and bottom is less in a deeper lake. Rough estimates of a mean value of A, for periods of summer thermal stratification at certain levels in the hypolimnion, have been made for a variety of lakes, from temperature data by the method outlined in ? I. These are presented, with morphometric constants for the lakes, in Table 4. The flow of heat into the deposits has been neglected. This involves an error which will be greatest for shallow lakes. Estimates of mean A for Esthwaite Water, obtained from other data (cf. Table 1), have been included for com- parison. It may be concluded (Fig. 36) that the mean value of A in the hypolimnion during summer thermal stratification is roughly proportional to the magnitude of the lake. It cannot be stated whether either area, depth, or volume, is the controlling factor. However, correlation of A is closest with 'depth at the measuring station' (Fig. 36 B). Degree of exposure to wind is also clearly of primary importance. The low value in Lunzer Untersee in spite of its depth, for instance, may be a result of shelter in a steep-sided valley.
Chemical evidence of water movements associated with wind-induced iso- stere oscillations. In the few studies that have been made of the horizontal
This content downloaded on Tue, 5 Mar 2013 12:30:57 PMAll use subject to JSTOR Terms and Conditions

CLIFFORD H. MORTIMER 177
Table 4. Comparison of (i) rough estimates of the mean value of the eddy diffusion coefficient (A) in the hypolimnion of various lakes. during periods of summer thermal stratification with (ii) the dimensions of those lakes
Depth at Rough estimate of measur- . A
Key Max. Mean ing At letter Area depth depth station For depth
Lake Fig. 36 km.2 m. m. m. A x100 period m. Sources of data Holsfjord H 121 295 114 295 310 26. vi -26. ix. 100 Strom, 1932
1930 Geneva G 503 303 152 285 190 21. vi -23. x. 100 Forel, 1880, 1892 (large basin) 1879
Lomond L 71 195 37 185 53 22 ix.-14. xi. 56 Buchanan, 1886; (Inversnaid) 1885 Murray & Pullar, 1910
Windermere, N 8 2 67 26 55 39 14 vi.-13. ix. 30 Taylor, 1940 North Basin 1939 1
Wmdermere, S 67 44 18 30 9 6. vi.-20. ix 15f Mortimer (in prep. VI) South Basin 1939 J
Mendota M 39 25 6 12 1 23.5 7 15. vi.-15. viii. 12 Birge et al. 1928; mean 1900-16 Juday, 1914
Maxinkuckee Ma 7 5 27 - 26 7 17 vii -28. ix 185 Evermann & Clark, 1900 1920
Kizakiko K 14 29 - 25 5 June-Aug. 15 Yoshimura, 1936 1926-9*
Lunz, Untersee Lu 0 68 34 20 32 5 29. iv.-29. vi. 20 Muller, 1938; Gotzinger, 19-12
Esthwaite Wafer E 10 16 ca. 5 14 3 Cf. Table 1 12 This paper, also Mortimer (inprep VI)
Schleinsee Sc 015 116 6 4 116 2 Cf. Table 1 11 Einsele & Vetter, 1938
* By inspection of isotherms in Fig. 6.
A B
2 SG eG
I 05 0- \~~~~~~~~~~~~f .2N *N
0 [Al 0 0 g 02-
o01 . s 0.1 es * M M*eMa
LU. Ma 0 &05 * K Ko *Lu
0*03 *EE .E 002 Sc *Sc
0-1 1 10 100 1000 10 20 30 50 100 200 300 Area, km.2 Depth at measuring station, m.
Fig. 36. A comparison of (1) the estimated mean values of the eddy diffusion coefficient A ia the hypolimma of various lakes with (ii) the dimensions of those lakes.
J. Ecol. 30 12
This content downloaded on Tue, 5 Mar 2013 12:30:57 PMAll use subject to JSTOR Terms and Conditions

178 Exchange of dissolved substances in lakes
distribution of chemical variables in thermally and chemically stratified lakes (e.g. Rossolimo, 1931), a displacement of the isopleths from the horizontal, at the same time as a similar displacement of the isotherms due to wind action, has been frequently noted. Some observations in the Lake District have shown that this phenomenon may be produced by quite moderate winds. This is illustrated for a longitudinal section on Esthwaite Water in Figs. 37-39. Results for cross-sections on this lake were similar. It will he noted that the isopleths and isotherms exhibit a definite tilt as a result of a moderate wind blowing at the time. In addition, the oxygen isopleths in the hypolimnion were found to be depressed at the edges. This may have been the result of more intense mixing (due to friction with the bottom) on these slopes than at the same levels in open water, caused by the see-saw motion of the isopleths with changes in wind force and direction. The reducing power of the mud on the slopes may also be less than in the centre of the lake, as the adsorbent oxidized surface layer would be given a chance to form again if the surface was exposed to oxygenated water by a more pronounced or prolonged isopleth tilt than usual.
An example of such a tilt, and its readjustment to horizontal equilibrium after the wind has dropped, is illustrated by changes observed at two stations on Blelham Tarn (Figs. 40, 41), and was confirmed by observations at inter- mediate stations. After temperature measurements with a reversing thermo- meter, samples were taken at 01 m. intervals in the thermocline region by the following method. The surface mud sampler, described in ? III, was lowered carefully to a selected depth in the thermocline region and closed. After raising, the top lid was removed and some liquid paraffin poured on to the water surface. By means of a special device samples were then siphoned simultaneously from each 10 cm. depth in the tube (discarding the top 10 cm.) into 50 c.c. bottles containing liquid paraffin to prevent the sample from coming into contact with air. Repetition of this technique at various levels, after moving the boat a small distance away from the disturbance caused by previous sampling, enabled the oscillation of the large concentration gra- dient to be demonstrated (Fig. 41). The final level of the thermocline (Fig. 41 B) was a little lower than the mean level during the rough spell. This represents work done by the wind, appearing as turbulence induced by the shearing of the epilimnion water mass over the hypolimnion, which must have occurred during the formation and subsequent decay of the tilt.
The oxidized surface mud layer. Factors which control its thickness. Its relation to organic production, classification of lakes and lake evolution
In a book, too comprehensive in scope for detailed consideration here, Grote (1934) raised manypoints of interest bearing onthe work described inthis paper. He deduces from theoretical considerations that, if the coefficient of diffusion of dissolved oxygen in the mud is assumed to be a constant, then the oxygen
This content downloaded on Tue, 5 Mar 2013 12:30:57 PMAll use subject to JSTOR Terms and Conditions

CLIFFORD H. MORTIMER 179
Direction of wmd -0. .
t | | ~~~Samplmng stations' ,_ 1 ,v
4-~~~~~~~~~~ 6_ t1 15 33 15 3 15 / 48 .5
100 200 319 400 500 600 700 800 900 Distance in metres
Fig. 37. Estliwaite Water. Distribution of temperature (0 0.) on a longitudinal section, 19 September 1939. Sampling stations on this section aIe shown on the map, Fig. 1, ? I.
Direction of wmnd - >
100 200 300 400 500 600 700 800 900 Distance in metres
Fig. 38. Esthwaite Water. Distribution of disledprtr . oxyen(ma/ un odifitudWinkle mecthod) 19 Setembe 19 on Samlongisttuional sechsetion n1 S reptme 1939. hemp,Fg.1 I
Direction of wmnd -.-------
0~~ 72 71 70 \ ~ ~69 69 - _
2_ \ ~~~ ~~~~~~~~~~~~~~~~~~~68- _.
m 43 Level below which 1 2 ' o XTotdl ron concentration> 1 mg/I = 75 =
84 32 83 82 -8* I 0 95~~~~~~~~~8 82
14-1 12 Samplmng stationls a
6 X// 1
6 7~~~~~~~~~~
100N 200 300 400} 500 600) 70() 800 900 'Distance m metres
Fig. 39. Esthwaite Water. Distribution of electrical conductivity (K18o x 10-6) on a longitu- dinal section, 19 September 1939. Also some data for iron.
12-2
This content downloaded on Tue, 5 Mar 2013 12:30:57 PMAll use subject to JSTOR Terms and Conditions
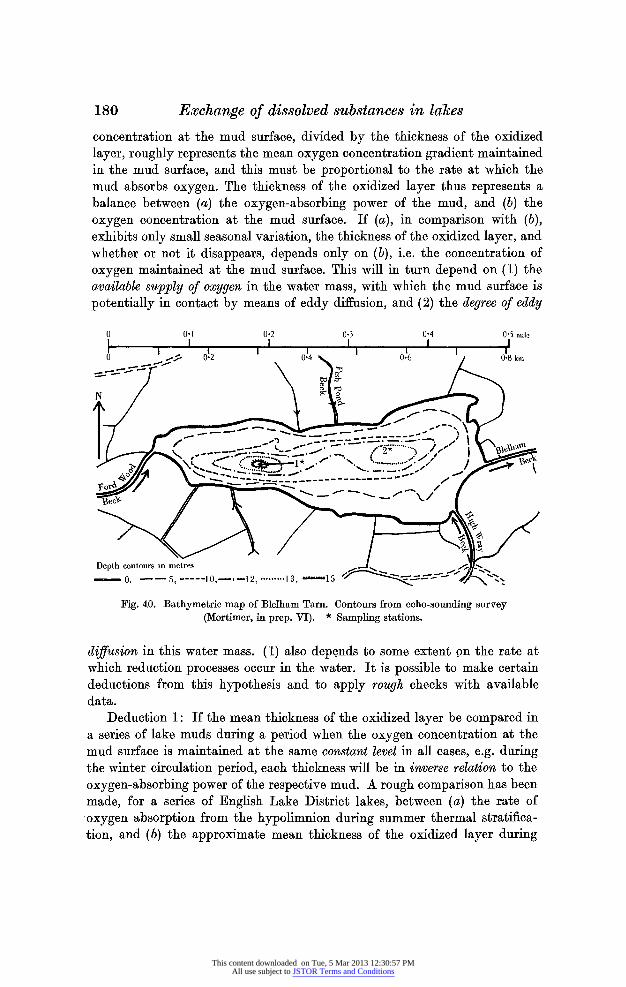
180 Exchange of dissolved substances in lakes
concentration at the mud surface, divided by the thickness of the oxidized layer, roughly represents the mean oxygen concentration gradient maintained in the mud surface, and this must be proportional to the rate at which the mud absorbs oxygen. The thickness of the oxidized layer thus represents a balance between (a) the oxygen-absorbing power of the mud, and (b) the oxygen concentration at the mud surface. If (a), in comparison with (b), exhibits only small seasonal variation, the thickness of the oxidized layer, and whether or not it disappears, depends only on (b), i.e. the concentration of oxygen maintained at the mud surface. This will in turn depend on (1) the available supply of oxygen in the water mass, with which the mud surface is potentially in contact by means of eddy diffusion, and (2) the degree of eddy
0 0.1 0-2 0 3 0 4 05 mile _ _ I . I .
I
O - 5, 10,~~~~~~~/ -2-2 13 15 eXX'
Fig. 40. Bathymetric map of Bleiham Tarn. Contours from echo-soundng survey (Mortimer, in prep. VI). * Sampling stations.
diffuxsion in this water mass. (1) also depends to somne extent pn the rate at which reduction processes occur in the water. It is possible to mnake certain deductions from this hypothesis and to apply rough checks with available data.
Deduction 1: If the mean thickness of the oxidized layer be compared in a series of lake muds during a period when the oxygen concentration at the mud surface is maintained at the same constant level in all cases, e.g. during the winter circulation period, each thickness will be in tnverse relation to the oxygen-absorbing power of the respective mud. A rough comparison has been made, for a series of English Lake District lakes, between (a) the rate of oxygen absorption from the hypolimnion during summer thermal stratifica- tion, and (b) the approximate mean thickness of the oxidized layer during
This content downloaded on Tue, 5 Mar 2013 12:30:57 PMAll use subject to JSTOR Terms and Conditions

CLIFFORD H. MORTIMER 181
~~ 44 ~~~~~~ 0 ...........o........
;
-0
_. 0 X r 0 0
o o ~ ~ ~~~~~~~~~~~~~~~~~~~~~~~~~~~~~o .M)
P-0
o o = 00c 0
09l}oW QdC)
-~~~~~~~~~~~~~~~~~~4
0) -~~~~~~~~~~~~~~~~~
0 Co
bO~~~~~~~~~~~~~~~~~~~~~~~C
0) H
00 0 00
This content downloaded on Tue, 5 Mar 2013 12:30:57 PMAll use subject to JSTOR Terms and Conditions

182 Exchange of dissolved substances in lakes
the period of winter circulation. This comparison is of value, not because the data can claim to be complete or more than approximately representative, but because it discloses interesting general relationships and indicates a possibly useful method in regional limnology.
(a) The approximate oxygen absorption rate of Esthwaite mud may be estimated by inspection of Fig. 13, ? I. An approximation to the rate in four other Lake District lakes has been obtained from a knowledge of the extent of oxygen depletion in the hypolimnion at the end of the summer stagnation period. In Fig. 42 the observed oxygen concentration at each depth is plotted, as well as at that concentration which represents 93 % saturation under the same temperature conditions, this being the usual degree of saturation ob- served in these lakes during winter. No correction was made for the height of the lakes above sea-level. The difference between the observed and the 93 % saturation values represents the 'actual deficit' (see discussion in Hutchinson, 1938a), and has been employed in preference to Alsterberg's ' absolute deficit' (i.e. difference between observed concentration and the 100 % saturation value at 40 C.), as the use of the latter is theoretically unsound (Grote, 1936), although its employment may possess certain practical ad- vantages (Hutchinson, 1938a). The total 'actual deficit' in the hypolimnion of each lake was determined planimetrically from Fig. 42. This, divided by the number of days between the date of observation and 1 May, on which date thermal stratification was assumed to have begun, yields a mean daily oxygen decrement for the whole water column, expressed as grams per sq. m. of mud surface per day in Table 5. This value is higher than the ' areal hypo- limnetic oxygen deficit' of Hutchinson (1938a), but is not far removed from it. The values given in Table 5 are simpler to compute and are sufficient for this rough comparison of muds of widely differing oxygen-absorbing power. Values comparable to those of Hutchinson have been computed for Winder- mere, North and South Basins 1932, by P. M. Jenkin (unpublished data). Increments in 'areal hypolimnetic deficit' in both basins was found to vary about 0 4 g./m.2/day (personal communication). These values are not far different from those found in 1938-40.
(b) Estimates of the mean winter thickness of the oxidized layer, i.e. depth of the isovolt E7= 0-20 V. below the mud surface, were obtained by inspection of Fig. 43, which illustrates representative winter distribution of potential in cores from deep regions of five lakes in the English Lake District. These estimates are entered in Table 5. That given for Crummock Water is probably too low, as only a summer observation was available. However, this lake has been included as it occupies an intermediate position between oligotrophic Ennerdale and mesotrophic Windermere (definitions later).
Stating deduction (1) more precisely: If it is assumed (i) that, in any one lake, the summer and winter oxygen absorption rates are roughly propor- tional, and (ii) that in all lakes the winter oxygen concentration (C.) at the
This content downloaded on Tue, 5 Mar 2013 12:30:57 PMAll use subject to JSTOR Terms and Conditions
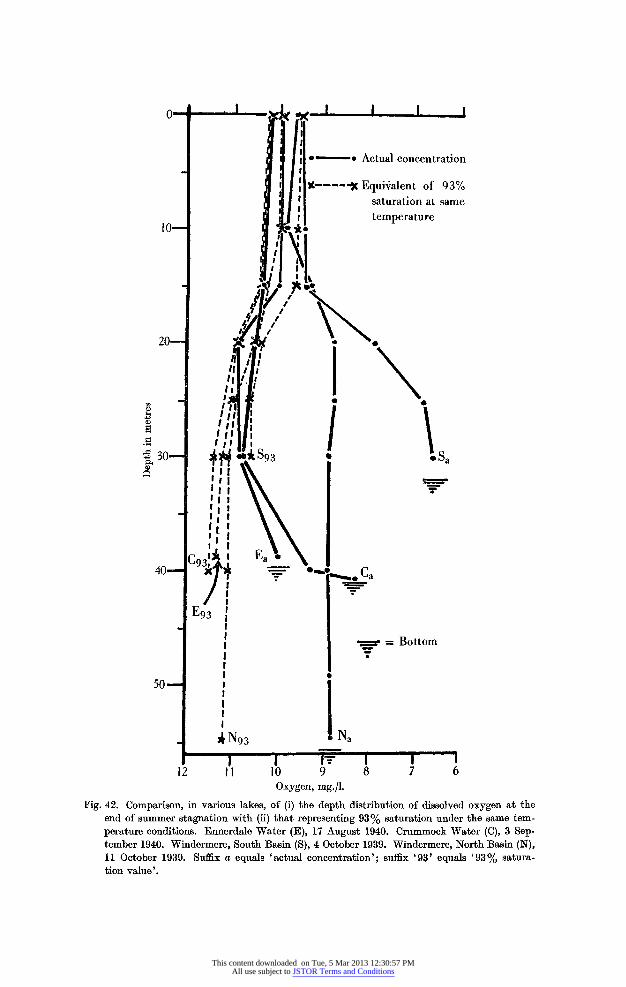
*e7 --* Actual concentration
.-X ---et Equivalent of 93% saturation at same
temperature
ti7'1~/ 11\t 20 J$"?
Ig E
a)~ ~ ~~~~~
E93
l = = ~~~~Bottom
Ig o
50~
E93 N93 Na
_ I
1 2 11 1 0 9 8 7 6 Oxygen, mg./l.
Fig. 42. Comnparison, in various lakes, of (i) the depth distribution of dissolved oxygen at the end of summer stagnation with (ii) that representing 93% saturation under the samne tem- perature conditions. Ennerdale Water (E), 17 August 1940. Crummrock Water (C), 3 Sep- tember 1940. Windermaere, South Basi-n (S), 4 October 1939. Wmdermere, North Basi-n (N), 11 October 1939. Suffix a equals 'actual concentration'; suffix '93' equals '93%/ satura- tion value'.
This content downloaded on Tue, 5 Mar 2013 12:30:57 PMAll use subject to JSTOR Terms and Conditions

E7 in volts
0*10 - 0 + 0*10 0-20 0*30 0*40 i 0'50 0'60
4 l l
Reducing Oxidizing 1;
Mud surface -- -\
10 .: X j - -x--- -
0~~~~~~~~~~0
2 W X | , -@ *- Es~~~~~X.- Wd.
0
2.. ~ ~~~~~~~~~loo ......<.
4,. L v 16 ~ 1
0610 ? + 0.10 0. 0 030 0-40 0150 0.60
]Fig. 43-. Typical winter distribution of redox potential (E7 m volts) in the surface mud cores frorn
the deep regions of various lakes. Ennerdale Water (E), 40 m., 15 March 1941. Crummnock
Water (C), 40-8 m., 3 September 1940 (N.B. single sumrmer observation). Windermere, South Basin (S), 31 m., 11 February 1941. Windermere, North Basin (N), 65 ni. 6 February
1941. Esthwaite Water (Es), 14 m., 12 March 1941.
This content downloaded on Tue, 5 Mar 2013 12:30:57 PMAll use subject to JSTOR Terms and Conditions

CLIFFORD H. MORTIMER 185
mud surface, and also the coefficient of diffusion (k) in the mud is of the same order, then the following relationship should be found:
Summer oxygen absorption rate (0) oc z e (w thickness oxidized layer (T1') Thus if (0) is plotted against (T), the points should lie on a rectangular hyper- bola, i.e. if log (0) is plotted against log (T), the points should lie on a straight line. For the data given in Table 5 this is found to be approximately the case (Fig. 44 A).
Table 5. Comparison of (a) estimates of the oxygen absorption with (b), winter thickness of the oxidized layer, (c) redox potential at 5 cm. depth, and (d) organic content of muds from the deep regions of various lakes
Windermere Ennerdale Crummock , Esthwaite
Lake . ... Water Water South Basin North Basin Water (E) (C) (S) (N) (Es)
Max. depth, m.* 43.9 43.9 44 67 16
I. Estimate of (a) mean daily increment (0) of 'actual oxygen deficit', in hypolimnion water column (g./sq. m. mud surface)
Date of observation 17. viii. 40 3. ix. 40 4. x. 39 11. x. 39 Mean May-July cf. Fig. 13
Off Lowood Limits of Water 15-39-8 15-40-8 15-31 15-55 9-14 column, m.
0, g./m.2/day 009 0-16 0-31 0-52 0-65
II. Estimate of (b) winter thickness (T) of oxidized surface mud layer and (c) mean winter redox potential (E7) at 5 cm. depth
Date of collection 5. iii. 41 3. ix. 40t 11. ii. 41 6. ii. 41 12. iii. 41 Water depth, m. 40 40-8 31 65: 14 T,cm. 4*0 2-2 1-7 1.1 07 E7at 5 cm. (V.) +0-14 +006 +0-02? -0-05 -007
III. (d) Organic content of Petersen grab samples (Misra, 1938) Water depth, m. 40 50 12 Loss on ignition, 12-84 16-84 21-34 % dry wt.
Total N, % dry wt. 0-4506 0-5384 0-8539 * Other morphometric data in Mill (1898). t N.B. summer value. $ Only case in this series in which mud samples taken at a point removed from that at
which 02 depletion was estimated. ? Mean of 24 cores; higher value than indicated in Fig. 43.
Hutchinson (1938a) has demonstrated that, in a series of geographically separated and morphologically different lakes, the increment of 'areal hypo- limnetic deficit' is proportional to plankton production in each lake. He has suggested the limits H-H (Fig. 44 A) for mesotrophic lakes. All lakes with increments above or below these limits are classed as eutrophic or oligotrophic respectively. Thus, even allowing for the difference between Hutchinson's
This content downloaded on Tue, 5 Mar 2013 12:30:57 PMAll use subject to JSTOR Terms and Conditions

186 Exchange of dissolved substances in lakes
'areal deficit' and (0) (Table 5), Hutchinson would class Windermere, North Basin and Esthwaite Water as eutrophic and Windermere, South Basin, and Crummock Water as mesotrophic. It may be suggested, as a matter of opinion, that the limits L-L (Fig. 44 A) fit the observed conditions in the English Lake District better. Thus Ennerdale Water and Crummock Water are con- sidered to be oligotrophic and Esthwaite Water to be eutrophic.
Fig. 43 illustrates differences in the distribution and general level of redox potential in the muds of the lakes. These differences are expressed, not only in the thickness of the oxidized layer, but also in the value of the minimum redox potential in the core, usually to be found at about 5 cm. below the surface. This minimum, and the gradual rise in potential with increasing depth below 5 cm., may indicate more intense anaerobic organic, decomposition at
4 0- s Oligo- Meso- Eutrophic L 1 .0 3.0- L L
0v5< ~~~ _ Cvo
2-~~~~~~% +
vlatlons as in Fig. 43. ~ ~ ~ ~ 0 a
XEs
in5 He Es 0-5 ~ ~ I I 101610 111-4 05 -
0 (2 0-4 060810 O3 0 ~ ~ . ~ o (g./M.2/day) oVO Fig. 44. Correlations (A) between the rate of oxygen absorption 0 and the wnter thickness of
the oxidized surface mud layer T, and (B) between the witer redox potential (E7 in volts) at 5 cm. depth m the mud and oO m muds from deepest regions of various lakes. Abbre- viations as in Fig. 43.
the 5 cm. level, i.e. just below the oxidized layer, and a decrease in intensity in older and lower deposit. ZoBell (1937) recognizes that the oxygen-absorbing power (0) of muds is the product of an intensity (I) and a capacity factor (K), i.e. 0 = I x K. If redox potential is equated to I, it is possible to envisage a mud of low potential, i.e. high intensity (I), but with low oxygen-absorbing capacity (K), and vice versa. If, on the other hand, I is proportional to K, I will be proportional to the square root of the oxygen-absorbing power. This holds (Fig. 44 B) roughly for the muds investigated.
A similar, although less detailed, observation of a redox potential minimum just below the mud surface was made by Karsinkin et al. (1930). These workers were the first to publish resultg of measurements of potentials in muds and to point out their relation to redox conditions in the water. Since then other measurements have been mnade by the same authors (1931), by lwlew (1937)
This content downloaded on Tue, 5 Mar 2013 12:30:57 PMAll use subject to JSTOR Terms and Conditions

CLIFFORD H. MORTIMER 187
in connexion with a detailed study of season changes in distribution of various forms of iron in mud and water, and by Misra (1938).
In non-peaty muds it might be expected that organic content is the most important factor determining the level of redox potential. Unfortunately, data for Lake District muds are insufficient to test this. However, if loss on ignition and total N values of muds from the same localities (Misra, 1938) are compared with E7 at 5 cm. (Table 5), the muds are seen to fall into the same order if arranged according to organic content or potential.
Typical winter distribution of electrical conductivity in the surface mud in the deepest regions of the same five lakes is illustrated in Fig. 45. Com- parison of this with Figs. 42 and 43 demonstrates another correlation, namely, that between oxygen-absorbing power and electrical conductivity. The highest conductivity and also the most rapid increase of conductivity with depth is found in the muds with the highest rate of oxygen absorption and lowest potential. The depth distributioih of conductivity is approximately expo- nential. Thus, if the log of the slope of the conductivity curves in Fig. 45 is plotted against depth, the points over a large part of the curve lie approxi- mately on straight lines (Fig. 46 A). Deviations from this line at the mud surface indicate adsorption of ions in the oxidized layer. Other deviations, usually found at about 12 cm. depth, may indicate changes in the rate of production of ions at these levels. A mathematical analysis of these and similar curves will be attempted in a later publication (Mortimer, in prep. I). The following empirical relation, however, may be noted here. The squares of the slopes (S) of the lines in Fig. 46 A are roughly proportional to (0) (see Fig. 46 B). If we assume with Grote (1934, p. 33) that the rate at which oxygen is utilized in decomposition is a measure of the rate at which mineral substances are liberated, and of the rate of lake 'metabolism' as a whole, the above empirical relation suggests a formula of the following general type, which gives the conductivity (K) at depth (z) in the mud:
K KL + (KO-KL) e-ZV(rIc),
where r is the rate of production of ions in the mud, c is a constant which includes the coefficient of diffusion in the mud, KO equals the conductivity at the mud surface, and KL is the limiting value of K which is approached with increasing depth. Deviations from this theoretical distribution may indi- cate variation in c or (more likely) in r. The above formula is of the same general type as that which expresses the distribution of the -steady state of temperature along a long bar, heated at one end and losing heat by radiation and conduction all along its surface (Carslaw, 1921).
A second deduction may be made from the original hypothesis (p. 180). Assuming the oxygen-absorbing power of the mud to remain constant, and neglecting any lag due to the slowness of reduction of oxidized compounds (.e.g. ferric hydroxide), the thickness of the oxidized layer in any one mud
This content downloaded on Tue, 5 Mar 2013 12:30:57 PMAll use subject to JSTOR Terms and Conditions
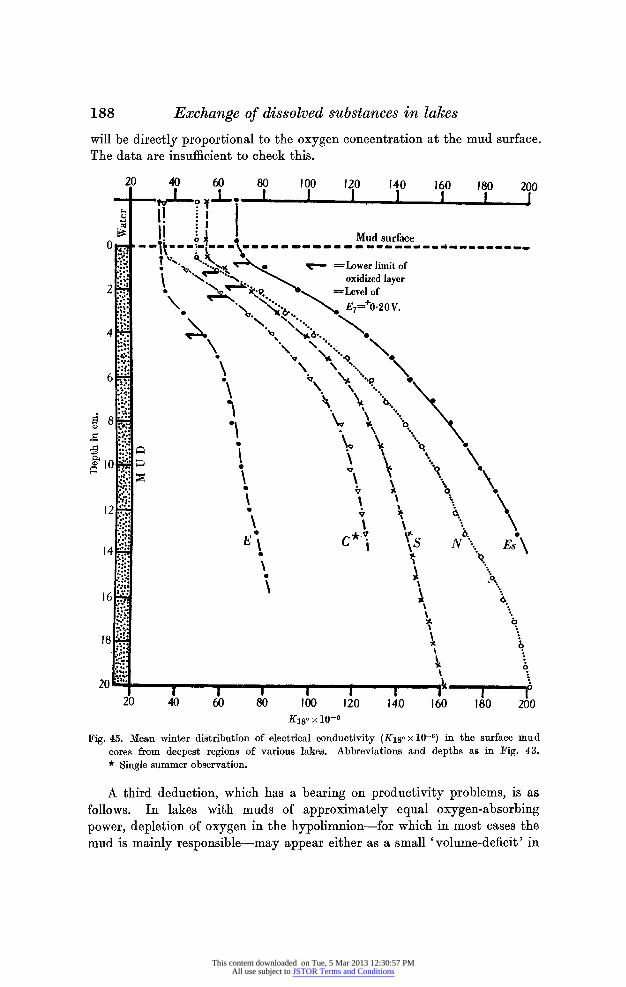
188 Exchange of dissolved substances in lakes
will be directly proportional to the oxyTgen concentration at the mud surface. The data are insufficient to check this.
20 40 60 80 00 120 140 160 180 200 W- 1 1 |
!. og I Mud surface o t: tV m m m\m-mm- minn- m--- -- - m _min
,:.. t =.v?, ;; ? _Lower ]umit of oxidizedlae
2.. qLevel oflae
N~E7=+020V.
6 \ \,\:6..
20 8 "I "O1tI
Kl8? x 10-
12.
14:EcN E
Fig. 45. Mean winter distribution of electriLcal conductivity (K:L8. x 10-6) in the surface mud cores fromn deepest regions of various lakes. Abbreviations atnd depths as in Fig. 4 3. * S1gle summer observation.
A third deduction, which has a bearing on productivity problems, is as follows. In lakes with muds of approximately equal oxygen-absorbing power, depletion of oxygen in the hypolimnion-for which in most cases the mud is mainly responsible-may appear either as a small 'volume-deficit' in
This content downloaded on Tue, 5 Mar 2013 12:30:57 PMAll use subject to JSTOR Terms and Conditions

CLIFFORD H. MORTIMER 189
a deep lake or as a large 'volume-deficit' in a shallow lake (cf. Hutchinson, 1938 a and refs. there). The mud surface will only become reduced and exhibit the accelerated liberation of ions from the mud associated with this, in lakes sufficiently shallow to produce a large enough 'volume-deficit' at the mud surface. In shallow lakes the volume of the hypolimnion is probably the main controlling factor, for, as this must be considered as a partially closed system, the total available supply of oxygen is limited. In lakes of medium and greater
Gradient (dKldz) from Fig. 45 (conductivity units per cm.) 1 2 3 4 5 6 8 10 1520
O I s~~ I I 1 I Im I Ii1 itilnimill
A XV00
2 v/ 0 0
/1'7
.6
07
. NY~j0/ 3 N*
10 S2/
17 s~~~~~~~ (.i.2dy
0 C~~~ *2 4 0
Fig. 46. A. Logarithms of the gradients of curves in Fig. 45 (i.e. log dK/dz) plotted against depth (z). B. Comparison of the slopes (S) m Fig. 46 A with the rate of oxygen absorption (0) of the mud. Abbreviations as in Fig. 43. * Single summer observation.
depths the volume of the hypolimnion becomes of less importance relative to the degree of eddy diffusion, which apparently increases with depth and other morphometric factors (Table 4). If this were not so-i.e. if the degree of eddy diffusion were to remain the same in all lakes, both deep and shallow, with muds of the same oxygen absorbing power-the vertical distribution of oxygen relative to the mud surface would be identical in all lakes of more than a certain depth. No mechanism would exist whereby a greater depth of hypo- limnion could exert its influence. A study of chemical stratification in deep
This content downloaded on Tue, 5 Mar 2013 12:30:57 PMAll use subject to JSTOR Terms and Conditions

190 Exchange of dissolved substances in lakes
lakes during summer thermal stra-tification and comparison of this with strati- fication developed under ice, where eddy diffusion may be expected to be low, should yield data to check the above conclusions.
Classification of lakes. Before proceeding to discuss the possible effect of redox conditions at the mud surface on productivity, it is necessary to outline certain ambiguities which have arisen in the classification of lakes on a pro- ductivity basis. The original and perhaps the clearest definition (refs. in Naumann, 1932) depended entirely on the degree of plant production and the edaphic (geochemical) factors which control this. Subsequently, other fea- tures, often but not necessarily associated with oligotrophic or eutrophic conditions, have been employed to class lakes into oligotrophic, eutrophic or intermediate (mesotrophic) categories. Thus a high or low degree of de-oxy- genation in the hypolimnion has been termed a eutrophic or oligotrophic condition respectively (Thienemann, 1928), because in the majority of cases these features have been found to be associated with a high or low degree of organic production. Emphasis is thus laid more upon the oxygen conditions- possibly of greater interest to the zoologist-than upon the degree of plant production, although unfortunately the same terminology is employed. Re- cognizing the influence of the shape and size of the basin on the distribution of oxygen, Thienemann (1928) has included the morphometric factor as one of the most important in determining the trophic condition of lakes, regarding it as inseparable from other factors (cf. p. 146). Lundbeck (1934), however, distinguishes between primary, edcphic oligotrophy on the one hand and se- condary morphometric oligotrophy (great depth) on the other. The logical con- clusion from this view has been stated by Hutchinson (1938a), who considers that the edaphic and morphometric determinants 'in great measure vary independently' (my italics), and that the influence of the latter may be eliminated in a comparison of the productivities of morphologically different lakes by the employment of the concept 'areal hypolimnetic oxygen deficit'.
The limitations of the latter concept, especially when applied to shallow lakes (cf. Riley, 1939, cit. Deevey, 1940), should hiot be ignored. With these limitations in mnind, the concept may be applied with profit to the study of regional limnology in areas from which plankton data are not available. Hutchinson has pointed out that the close relation between 'areal deficit' and plankton production breaks down when considerable quantities of allo- chthonous organic matter are present. This suggests that a more general relation is one between (a) areal deficit and (b) reducing power of the mud. This may explain a discrepancy observed between the North and South Basins of Windermere. A study of plankton production in these two basins over a period of years has shown that phytoplankton production in the South Basin is at least double that in the North Basin; zooplankton production is also significantly higher in the former. The mud in the South Basin, however, is less reducing than in the North Basin (Fig. 43), and the oxygen deficit in the
This content downloaded on Tue, 5 Mar 2013 12:30:57 PMAll use subject to JSTOR Terms and Conditions

CLIFFORD H. MORTIMER 191
hypolimnion (Fig. 42) in these two basins is correlated, not with the amount of plankton produced in the epilimnion, but with the reducing intensity of the mud. This is possibly controlled by the distribution of decomposing leaf fragments, which are found in considerable quantities in the mud of the North Basin, especially in regions near the larger inflows, but are relatively infre- quent in the muds of the South Basin, which receives most of its inflow from the North Basin.
It is of interest to speculate what light is thrown on the above confusing, if not conflicting, views of lake classification by the demonstration, in previous sections-, of the acceleration in liberation of ions, including many plant nutrients, during reduction of the mud surface. As the resulting increase in concentration of solutes in the water is large, this event may be considered to have a profound influence on the degree of organic production in the water. It has been shown that, in all but exceptionally reducing muds, this event can only occur in relatively shallow lakes. Extreme oligotrophy, on the other hand (primary oligotrophy in Lundbeck's sense), will not be associated with oxygen exhaustion, even in lakes with the small hypolimnia. A causal con- nexion may therefore be expected, in the higher ranges of productivity only, between degree of organic production and depth of lake. If this connexion can be demonfstrated by extended studies of regional limnology, it lends support to the general observation at the basis of Thienemann's views that high production is more often than not associated with a high degree of oxygen depletion in relatively shallow lakes, and that morphometric and edaphic determinants of production are not entirely independent. It was emphasized earlier that the morphometric determinant includes not only dimensional factors, but also the influence of these on water movements and the degree of eddy diffusion, which clearly also depends on climate. These speculations can only be tested by future work. The present position has been summed up by Rawson (1939, cit. Deevey, 1940): 'while the edaphic factors determine the kinds and amounts of primary nutritive materials, the morphology of the basin and the climate may to a large extent determine the utilization of these materials'.
Lake evolution. It. is also of interest to suggest briefly how the above speculations may apply to the concept of lake evolution. Any change in the productivity of the water may be expected to produce a change in the organic content and reducing power of the mud. If an increase in productivity, not necessarily uniform or continuous, is an evolutionary tendency, and the lake is sufficiently shallow, a point in time will be reached at which the mud surface becomes reduced. This will have the effect, noted in Esthwaite Water, of accelerating (a) oxygen depletion in the hypolimnion, and (b) the release of ions from mud to water. Thus a primary phase (I) of slow increase in pro- ductivity may be expected to be followed by a secondary phase (II) of accele- rated increase, in which, under reducing conditioits, the adsorbing influence
This content downloaded on Tue, 5 Mar 2013 12:30:57 PMAll use subject to JSTOR Terms and Conditions
192 Exchange of dissolved substances in lakes
of oxidized ferric complexes is destroyed, resulting in liberation and a more complete utilization of plant nutrients. Further reduction, resulting from this accelerated increase in production of organic matter, may induce a tertiary highly reduced sterile phase (III), in which in many cases the iron is again precipitated as sulphide. The rate at which these changes take place will be determined by geochemical and morphometric factors. Very deep lakes and all geochemically oligotrophic lakes may never pass out of the phase I, before they become silted up. Shallow and highly eutrophic lakes may pass through all three stages in a very short time after their formation, or they may become arrested in phases I or II (cf. 'trophic equilibrium' in Linsley Pond, Hutchinson & Wollack, 1940), because the 'sterility' of the mud, associated with the phase III, has not sufficient depressing influence on production as long as ample nutrient supplies are continuously available from the drainage area. Further change will be caused only by variation (e.g. cultural) in this rate of supply. This suggests that changes or lack of change in lakes is determined mainly by the individual characters of lake basin and drainage area, as well as climate. The greatest rate of change is probably at the end of phase I, and we may expect to observe this at the present day in mesotrophic lakes of moderate depths, or in lakes in which edaphic determinants are being changed by cultural influences. Examples of the former class are those lakes investi- gated by Ohle (1933-4), in the course of an extensive chemical survey of north German lakes; in which oxygen depletion in the hypolimnion has considerably increased in recent years ('Eutrophierung'). The best example of the latter class is afforded by Lake Zurich (Minder, 1938), in which the sudden accelera- tion of oxygen depletion and plankton productivity, as a result of sewage pollution, is recorded in detail in the deposits.
SUMMARY
This study of physical-chemical aspects of organic production in lakes is concerned (a), in general, with investigation of factors operating in the lake system (water + deposits) to control the rate of supply of nutrients to the phytoplankton, and (b), in particular, with seasonal changes in the hypo- limnion and bottom mud, and with mechanisms controlling the release of nutrients to the water. The investigation developed in three stages: (1) study of distribution of physical properties and solutes in a lake subject to wide seasonal fluctuations in redox conditions; (2) laboratory experiments on mud- water systems; (3) correlation, in oligo- and eutrophic lake types, of seasonal changes in water and mud. A fourth section, 'General Discussion', is added, in which a hypothesis of chemical exchange between mud and water is out- lined, and its application to limnological theory discussed.
? I. Samples were obtained at approximately weekly intervals from April 1939 to February 1940 at 1, 5, 6, 7, 8, 9, 10, 11, 12 and 13 m. depth at a sampling station (14 m. depth) in the deepest region of Esthwaite Water. The
This content downloaded on Tue, 5 Mar 2013 12:30:57 PMAll use subject to JSTOR Terms and Conditions

CLIFFORD II. MORTIMER 193
following determinations were made on these samples by standard methods: temperature, 02, alkalihity, pll, NH4+, NO2-, NO3-, Si, P, Fe+++, Fe++, total Fe, and S-- New methods are described fot the estimation of con- ductivity, redox potential (corrected to E7, i.e. Eh at pH 7.00), SO4--, tur- bidity and colour.
Seasonal variation in stratification of each property is illustrated in a series of 'depth-time diagrams' (Figs. 3-10), which demonstrate correlations between weather (Fig. 2) and thermal and chemical stratification.
Events-in the hypolimnion after the onset of thermal stratification were as follows:
Stage I (June to mid-July). The rate of oxygen depletion was greater with increasirrg depth; the mean rate in the whole hypolimnion was at first fairly constant, but was retarded, later when the concentration in the bottom sample had fallen to 2 mg./l. Increases in alkalinity, conductivity, colour and iron content were observed.
Stage II (mid-July to mid-August) was initiated by a rapid fall in redox potential and oxygen concentration in the bottom sample to E7 0x25 V. and 05 mg./l. respectively. This was followed (Fig. 12) by a rapid rise (greater with increasing depth) of alkalinity, conductivity, Fe, Si, P, colour and tur- bidity, accompanied by decrease of NO3- and the appearance of relatively large amounts of NO2- at certain levels. Increase in-turbidity and colour resulted mainly from the oxidation and precipitation as Fe(OHl)3 of consider- able quantities of Fe++- appearing at the mud surface at this stage. This accounte-d for an accelerated decrease in 02 concentration, which at lower levels became zero (unmodified Winkler estimation), by which time Fe++ was detected in the water and the potential had fallen to E7 0-15 V. From this point onwards the Fe content of the hypolimnion increased rapidly and an increasing proportion consisted of Fe++.
Rapid ammonia production, at this stage, was of greater magnitude than the equivalent of nitrate reduction, which by then was complete at lower levels (Fig. 13). Nitrogen relationships indicate that, under oxidizing con- ditions, nitrification occurs imost actively in the oxidized mud surface, and that, under reducing conditions, the mud is the main source of amfmonia.
Stage III (mid-August and September) exhibited a continued but slower rate of rise in concentration of solutes. The hypolimnion became less turbid, but colour due to organic matter persisted.
The overturn (5 October), preceded by an encroachment into the hypolimnion by a progressive fall in level of the thermocline, resulted in rapid reversal of the above reduction changes. An immediate rise in 02 content was followed by a rapid fall in alkalinity conductivity, Fe, Si, P and NH4+. Colour fell off less rapidly, and NO3- began to increase some weeks later.
From comhputations of the total amount of certain solutes, assumed to have been derived wholly from the mud, which passed upwards through
J. Ecol. 30 13
This content downloaded on Tue, 5 Mar 2013 12:30:57 PMAll use subject to JSTOR Terms and Conditions

194 Exchange of dissolved substances in lakes
selected levels in the hypolimnion water column, and from the respective concentration gradients at those levels, it was possible to estimate' roughly the mean eddy diffusion coefficient for selected periods. The estimates (3 x 10⁻² c.g.s. units, Table 1) are approximately 20 and 2000 times the respective molecular coefficients of heat conduction and chemical diffusion.
During 7 weeks under ice cover, changes were observed in Esthwaite Water and Blelham Tarn similar to, but slower than, those described for stage I. The eddy diffusion coefficient (Table 2) was estimated at one-sixth of that during stage I. Even so, it was more than 200 times the molecular coefficient, indicating that convection currents prevent complete stagnation under ice. 94 % of dissolved salt content, all humus colouring matter and a large part of dissolved gas content were removed from the water on freezing (Table 3). This led to increases in concentration in the water immediately under the ice.
Large-scale seasonal changes in dissolved salt content of the hypolimnion were confined to the group of solutes producing alkalinity (Fig. 14). Only part of the alkalinity increase could be accounted for by increase in NH4+ and Fe. That portion due to other bases exhibited a slow increase during stage I, a rapid increase during stage II, remained at a constant level during stage III (although NH4+ and Fe continued to increase), and fell gradually after the overturn.
Until stage II, a surface-oxidized mud layer of a few millimetres depth could be recognized by the presence of precipitates of Fe(OH)3 and associated complexes. Much of this material was in colloidal form and possessed ad- sorbent properties. Fe below this layer was in soluble ferrous state. Changes observed at the beginning of stage II suggest that, below a limiting 02 con- centration and redox potential, colloidal ferric precipitates in the mud surface were reduced, resulting in the liberation of (i) adsorbed bases, and (ii) Fe++. The rate of spread of the latter was considerably increased by the transition from molecular diffusion in the mud to turbulent diffusion in the water, ac- counting for the accelerated rate of oxygen depletion. With the removal of the adsorbent barrier constituted by the oxidized mud surface, exchange of solutes between mud and water was relatively unimpeded (stage III). The process was reversed at the overturn. Gradual fall in alkalinity during subse- quent months may be attributed to, selective adsorption of bases by the reconstituted oxidized mud surface.
Many of the e'vents described in Esthwaite Water were demonstrated in Schleinsee (Fig. 15) using published data of Einsele & Vetter (1938).
? II. In laboratory experiments designed to test the above hypothesis, artificial mud-water systems were subjected to the following treatments: (1) artificial aeration, (2) water surface exposed to air, (3) water surface sealed from air by liquid and solid paraffin. Equipment is described for sampling, CO2 estimation, pH and conductivity determinations in mud, and measurement of redox potential at 2 mm. depth intervals above -and below
This content downloaded on Tue, 5 Mar 2013 12:30:57 PMAll use subject to JSTOR Terms and Conditions
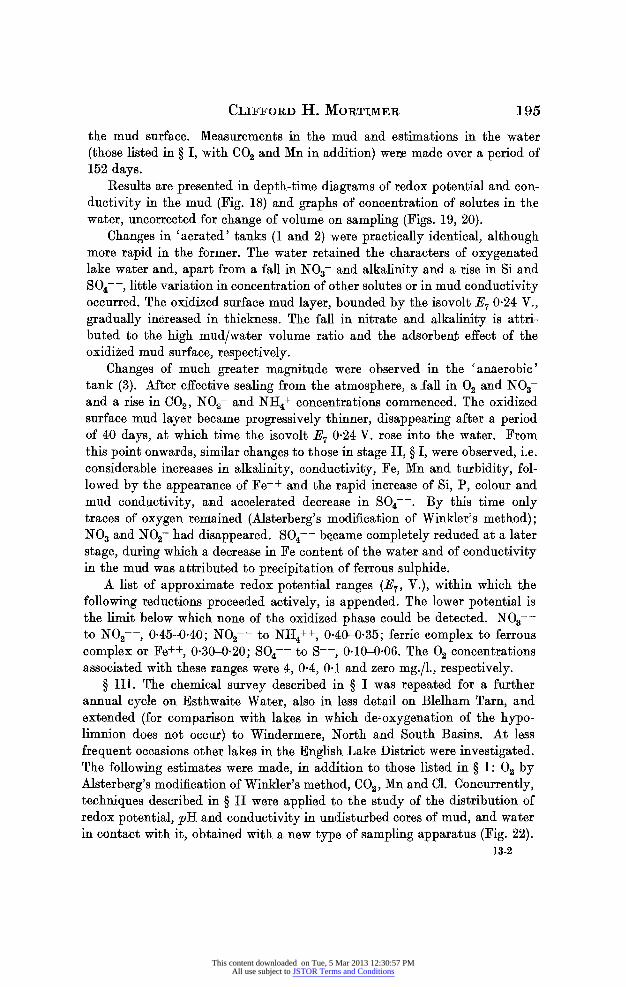
CLIFFORD H. MORTIMER 195
the mud surface. Measurements in the mud and estimations in the water (those listed in ? I, with CO2 and Mn in addition) wer.e made over a period of 152 days.
Results are presented in depth-time diagrams of redox potential and con- ductivity in the mud (Fig. 18) and graphs of concentration of solutes in the water, uncorrected for change of volume on sampling (Figs. 19, 20).
Changes in 'aerated' tanks (1 and 2) were practically identical, although more rapid in the former. The water retained the characters of oxygenated lake water and, apart from a fall in NO3- and alkalinity and a rise in Si and S04--, little variation in concentration of other solutes or in mud conductivity occurred. The oxidized surface mud layer, bounded by the isovolt E7 0-24 V., gradually increased in thickness. The fall in nitrate and alkalinity is attri- buted to the high mud/water volume ratio and the adsorbenj effect of the oxidized mud surface, respectively.
Changes of much greater magnitude were observed in the 'anaerobic' tank (3). After effective sealing from the atmosphere, a fall in 02 and NO3- and a rise in 002, NO2- and NH4+ concentrations commenced. The oxidized surface mud layer became progressively thinner, disappearing after a period of 40 days, at which time the isovolt E7 0O24 V. rose into the water. From this point onwards, similar changes to those in stage II, ? I, were observed, i.e. considerable increases in alkalinity, conductivity, Fe, Mn and turbidity, fol- lowed by the appearance of Fe++ and the rapid increase of Si, P, colour and mud conductivity, and accelerated decrease in S04 -. By this time only traces of oxygen remained (Alsterberg's modification of Winkler's method); NO3 and NO2- had disappeared. SO4-- became completely reduced at a later stage, during which a decrease in Fe content of the water and of conductivity in the mud was attributed to precipitation of ferrous sulphide.
A list of approximate redox potential ranges (E7, V.), within which the fQllowing reductions proceeded actively, is appended. The lower potential is the limit below which none of the oxidized phase could be detected. N03-- to NO2--, 045-040; NO2-- to NH4++, 040-035; ferric complex to ferrous complex or Fe++, 030-020; SO47- to S--, 0 10-0 06. The 02 concentrations associated with these ranges were 4, 0 4, 01 and zero mg./l., respectively.
? III. The chemical survey described in ? I was repeated for a further annual cycle on Esthwaite Water, also in less detail on Blelham Tarn, and extended (for comparison with lakes in which de-oxygenation of the hypo- limnion does not occur) to Windermere, North and South Basins. At less frequent occasions other lakes in the English Lake District were investigated. The following estimates-were made, in addition to those listed in ? I: 02 by Alsterberg's modification of Winkler's method, C02, Mn and Cl. Concurrently, techniques described in ? II were applied to the study of the distribution of redox potential, p H and conductivity in undisturbed cores of mud, and water in contact with it, obtained with a new type of sampling apparatus (Fig. 22).
13-2
This content downloaded on Tue, 5 Mar 2013 12:30:57 PMAll use subject to JSTOR Terms and Conditions

196 Exchange of dissolved substances in lakes
Results from (A) Esthwaite Water and (B) Windermere, North Basin, have been selected as representative of two fundamentally different lake types.
(A) Events in the hypolimnion were almost identical with those described in ? I, while concurrent changes in the mud and their correlation with changes in the water closely resembled those observed in the 'anaerobic' tank, ? II. The oxidized surface mud layer, bounded by the isovolt E7 0-20 V., was pro- gressively reduced in thickness from 7 mm. on 9 May to zero on 12 Jume (Fig. 28).
This initiated stage JJwith accelerated rates of oxygendepletion and increase of alkalinity, conductivity, Fe, NH4++, Si and turbidity in the water (Fig. 29), and rise in conductivity in the mud (Fig. 30). After the 02 concentration at the mud surface had fallen below 1P0 mg./l.(18 July), the isovolt E7 0-20 V and Fe++ began to rise into the water. An explanation of the high conduc- tivity below the mud surface at this time is not appareiat. Presence of soluble Mn++ salts in-the water prior to the appearance of Fe++ indicates that manganic precipitates in the oxidized mud surface are reduced at a higher potential than the ferric compounds,
Stage III exhibited, as in ? I, a continued increase in concentration of certain solutes, and a steady decrease in potential in the mud surface and in the water just above, also a steady decrease in conductivity in the mud -surface, probably due to ferrous sulphide precipitation. In the water S04- was only reduced to half its original concentration; the potential only fell below that value (E7 010 V.), at which active S04-- reduction was observed in. ? II, for 2 weeks preceding the overturi.
There was no evidence of any considerable anaerobic production of C02. Changes observed in the water at and after the overturn in ? I were re-
peated. The oxidized surface mud layer was not re-established to spring thickness until over a month after the overturn, and was thereafter subject to considerable fluctuations, becoming thinner during the period under ice cover. This suggests that accumulated products of reduction in the mud surface (e.g. ferrous sulphide) were only slowly oxidized. Mud conductivity fell after the overturn, exhibiting some fluctuations and an increase under ice.
(B) The investigation of Windermere, North Basin, covered 3 months before and after the overturn. Changes in concentration of solutes above the mud- (Fig. 31) at the overturn were definite but slight compared with those observed in (A). The thickness of the oxidized surface mud layer, i.e. depth of isovolt E7 020 V., was increased from 6 to 12 mm. (Fig. 32), and a decrease in mud conductivity was also observed (Fig. 33). This was confirmed by com- parison (Figs. 34, 35) of conductivity in a number of mud cores from the deep region, examined before and after the overturn. Seasonal change in mud conductivity was greatest at 1P5 cm. below the surface, and was probably regulated by turbulence in the water just over the mud, and the thickness and adsorbent capacity of the surface oxidized layer.
This content downloaded on Tue, 5 Mar 2013 12:30:57 PMAll use subject to JSTOR Terms and Conditions
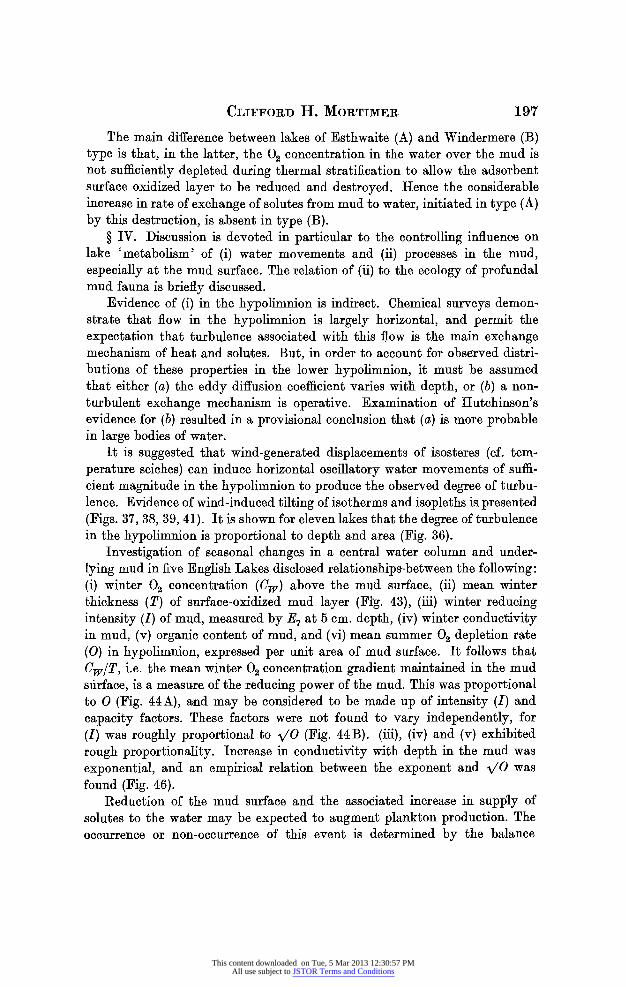
CLIFFORD H. MORTIMER 197 The main difference between lakes of Esthwaite (A) and Windermere (B)
type is that, in the latter, the 02 concentration in the water over the mud is not sufficiently depleted during thermal stratification to allow the adsorbent surface oxidized layer to be reduced and destroyed. Hence the considerable increase in rate of exchange of solutes from mud to water, initiated in type (A) by this destruction, is absent in type (B).
? IV. Discussion is devoted in particular to the controlling influence on lake 'metabolism' of (i) water movements and (ii) processes in the mud, especially at the mud surface. The relation of (ii) to the ecology of profundal mud fauna is briefly discussed.
Evidence of (i) in-the hypolimnion is indirect. Chemical surveys demon- strate that flow in the hypolimnion is largely horizontal, and permit the expectation that turbujlence associated with this flow is the main exchange mechanismn of heat and solutes. But, in order to account for observed distri- butions of these properties in the lower hypolimnion, it must be assumed that either (a) the eddy diffusion coefficient varies with depth, or (b) a non- turbulent exchange mechanism is operative. Examination of Hutchinson's evidence for (b) resulted in a provisional conclusion that (a) is more probable in large bodjes of water.
It is suggested that wind-generated displacements of isosteres (cf. tem- perature seiches) can induce horizontal oscillatory water movements of suffi- cient magnitude in the hypolimnion to produce the observed degree of turbu- lence. Evidence of wind-induced tilting of isotherms and isopleths is presented (Figs. 37, 38, 39, 41). It is shown for eleven lakes that the degree of turbulence in the hypolimnion is proportional to depth and area (Fig. 36).
Investigatioi of seasonal changes in a central water column and under- lying mud in five English Lakes disclosed relationships-between the following: (i) winter 02 concentration (0w) above the mud surface, (ii) mean winter thickness (T) of surface-oxidized mud layer (Fg. 43), (iii) wiater reducing intensity (I) of mud, measured by E7 at 5 cm. depth, (iv) winter conductivity in mud, (v) organic content of mud, and (vi) mean summer 02 depletion rate (0) in hypolimnion, expressed per unit area of mud surface. It follows that CWIT, i.e. the mean winter 02 concentration gradient maintained in the mud surface, is a measure of the toducing power of the mud. This was proportional to 0 (Fig. 44A), and may be considered to be made up of intensity (I) and capacity factors. These factors were not found to vary independently, for (I) was roughly proportional to -V/O (Fig. 44B). (iii), (iv) and (v) exhibited rough proportionality. Increase in conductivity' with depth in the mud was exponential, and an empirical relation between the exponent and VO was fo6und (Fig. 46).
Reduction of the mud surface and the associated increase in supply of solutes to the water may be expected to augment plankton production. The occurrence or non-occurrence of this event is determined by the balance
This content downloaded on Tue, 5 Mar 2013 12:30:57 PMAll use subject to JSTOR Terms and Conditions
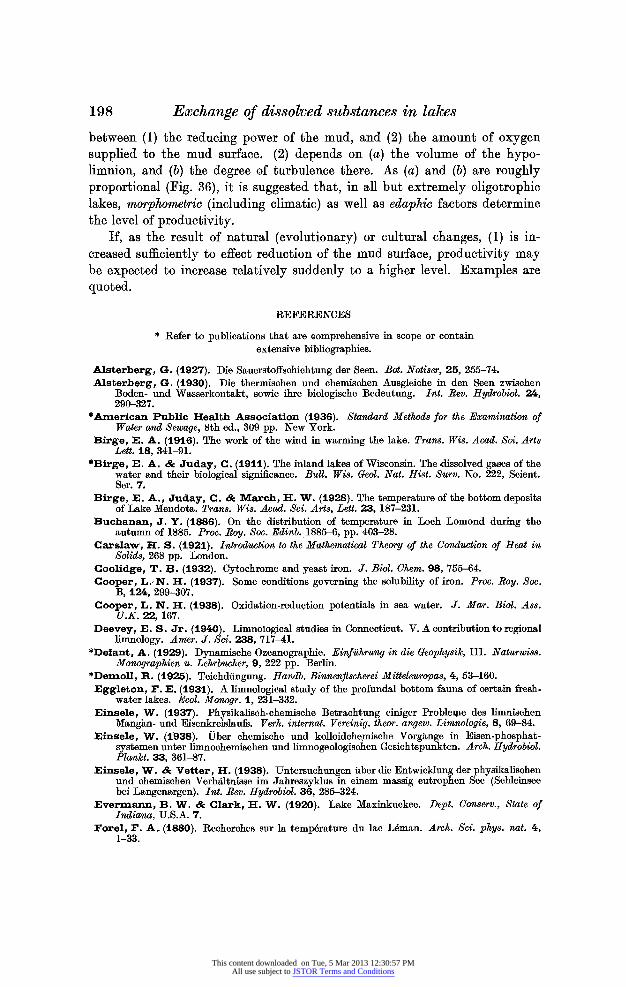
198 Exchange of dissolved substances in lakes between (1) the reducing power of the mud, and (2) the amount of oxygen supplied to the mud surface. (2) depends on (a) the volume of the hypo- limnion, and (b) the degree of turbulence there. As (a) and (b) are roughly proportional (Fig. 36), it is suggested that, in all but extremely oligotrophic lakes; morphometric (including climatic) as well as edaphic factors determine the level of productivity.
If, as the result of natural (evolutionary) or cultural changes, (1) is in- creased sufficiently to effect reduction of the mud surface, productivity may be expected to increase relatively suddenly to a higher level. Examples are quoted.
REFERENCES
* Refer to publications that are comprehensive in scope or contain extensive bibliographies.
Alsterberg, G. (1927). Die Sauerstoffichichtung der Seen. Bot. Notiser, 25, 255-74. Alsterberg, G. (1930). Die thermischen und chemischen Ausgleiche in den Seen zwischen
Boden- und Wasserkontakt, sowie ihre biologische Bedeutung. Int. Rev. Hydrobiol. 24, 290-327.
*American Public Health Association (1936). Standard Methods for the Examination of Water and Sewage, 8th ed., 309 pp. New York.
Birge, E. A. (1916). The work of the wind in warming the lake. Trans. Wis. Acad. Sci. Arts Lett. 18, 341-91.
*Birge, E. A. & Juday, C. (1911). The inland laTkes of Wisconsin. The dissolved gases of the water and their biological significance. Bull. Wis. Geol. Nat. Hist. Surv. No. 222, Scient. Ser. 7,
Birge, E. A., Juday, C. & March, H. W. (1928). The temperature of the bottom deposits of Lake Mendota. Trans. Wis. Acad. Sci. Arts, Lett. 23, 187-231.
Buchanan, J. Y. (1886). On the distribution of temperature in Loch Lomond during the autumn of 1885. Proc. Roy. Soc. Edinb. 1885-6, pp. 403-28.
Carslaw, H. S. (1921). Introduction to the Mathematical Theory of the Conduction of Beat in Solids, 268 pp. London.
Coolidge, T. B. (1932). Cytochrome and yeast iron. J. Biol. Chem. 98, 755-64. Cooper, L.-N. H. (1937). Some conditions governing the solubility of iron. Proc. Roy. Soc.
B, 124, 299-307. Cooper, L. N. H. (1938). Qxiaation-reduction potentials in sea water. J. Mar. Biol. Ass.
U.K. 22, 167. Deevey, E. S. Jr. (1940). Limnological studies nm Connecticut. V. A contribution to regional
limnology. Am'er. J. Sci. 238, 717-41. *Defant, A. (1929). Dynamische Ozeanographie. Ernfuhrung in die Geophysik, III. Naturwiss.
Monograiphien u. Lehrbucher, 9, 222 pp. Berlin. *Demoll, R. (1925). Teichdungung. Handb. Binnenftscherei Mitteleuropas, 4, 53-160. Eggletong F. E. (1931). A limnologioal study of the profundal bottom fauna of certain fresh-
water lakes. Ecol. Monogr. 1, 231-332. Einsele, W. (1937). Physikalisch-chemische Betrachtung einiger Problele des limnischen
Mangan- und Eisenkreislaufs. Verh. internat. Vereinig. theor. angew. Lmnologie, 8, 69-84. Einsele, W. (1f938). -Uber chemische und kolloidchemische Vorgange in Eisen-phosphat-
systemen unter hmnochemischen und limnogeologischen Gesichtspunkten. Arch. Hydrobiol. Plarnkt. 33, 361-87.
Einsele, W. & Vetter, H. (1938). Untersuchungen uber die EntwiLcklung der physikahschen und chemischen Verhaltnisse im Jahreszykluas in einem massig eutrophen See (Schlemsee bei Langenargen). Int. Rev. Hpdrobwl. 36, 285-324.
Evermann, B. W. & Clark, H. W. (1920). Lake Maxinkuckee. Dept. Conserv., State of Indiana, U.S.A. 7.
Forel, F. A. (1880). Recherches sur la temperature du lac Leman. Arch. Sc?. phys. nat. 4, 1-33.
This content downloaded on Tue, 5 Mar 2013 12:30:57 PMAll use subject to JSTOR Terms and Conditions
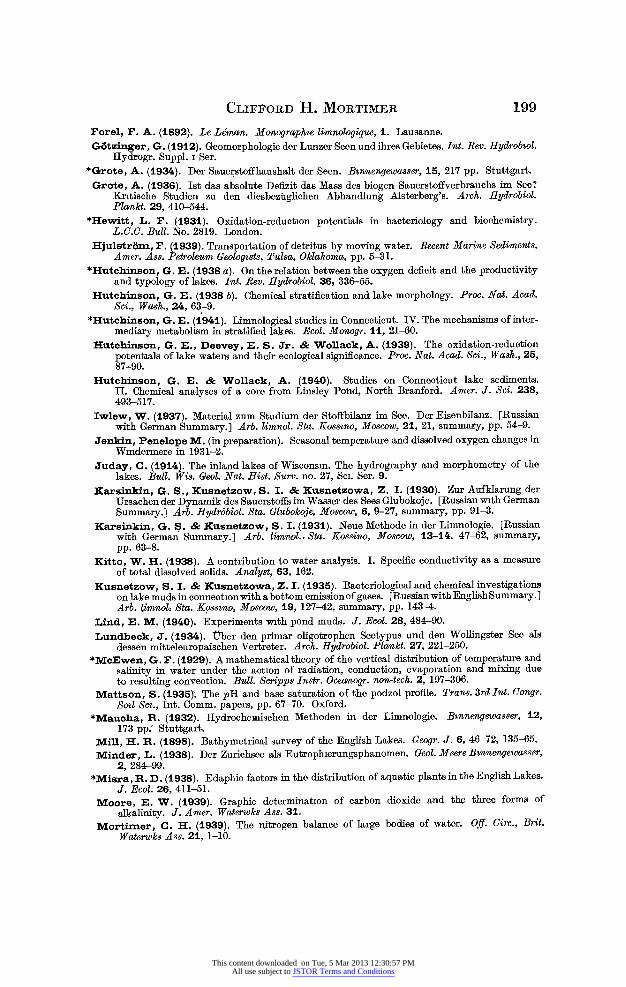
CLIFPORD H. MORTIMER 199
Forel, F. A. (1892). Le Le'man. Monographze limnologique, 1. Lausanne. G6tzinger, G. (1912). Geomorphologie der Lunzer Seen und ihres Gebietes. Int. Rev. Hydrobiol.
Hydrogr. Suppl. i Ser. *Grote, A. (1934). Der Sauerstoffhaushalt der Seen. Bmnnengewasser, 15, 217 pp. Stuttgart. Grote, A. (1936). Ist das absolute Defizit das Mass des biogen Sauerstoffverbrauchs im See?
Kritische Studien zu den diesbeztglichen Abhandlung Alsterberg's. Arch. Hydrobiol. Plankt. 29, 410-544.
*Hewitt, L. F. (1931). Oxidation-reduction potentials in bacteriology and biochemistry. L.C.C. Bull. No. 2819. London.
Hju1strOlm, F. (1939). Transportation of detritus by moving water. Recent Marine Sediments. Amner. Ass. Petroleum Geologists, TuMla, Oklahoma, pp. 5-31.
*Hutchinson, G. E. (1938 a). On the relation between the oxygen deficit and the productivity and typology of lakes. Int. Rev. Hydrobiol. 36, 336-55.
Hutchinson, G. E. (1938 b). Chemical stratification and lake morphology. Proc. Nat. Acad. Sci., Wash., 24, 63-9.
*Hutchinson, G. E. (1941). Limnological studies in Connecticut. IV. The mechanisms of inter- mediary metabolism in stratified lakes. Ecol. Monogr. 11, 21-60.
Hutchinson, G. E., Deevey, E. S. Jr. & Wollack, A. (1939). The oxidation-reduction potentials of lake waters and their ecological significance. Proc. Nat. Acad. Sci., Wash., 25, 87-90.
Hutchinson, G. E. & Wollack, A. (1940). Studies on Connecticut lake sediments. II. Chemical analyses of a core from Linsley Pond, North Branford. Amer. J. Sci. 238, 493-517.
Iwlew, W. (1937). Material zum Studium der Stoffbilanz im See. Der Eisenbilanz. [Russian with German Summary.] Arb. limnol. Sta. Kossi&no, Moscow, 21, 21, summary, pp. 54-9.
Jenkin, Penelope M. (in preparation). Seasonal temperature and dissolved oxygen changes in Windermere in 1931-2.
Juday, C. (1914). The inland lakes of Wisconsm. The hydrography and morphometry of the lakes. Bull. Wis. Geol. Nat. Hist. Surv. no. 27, Sci. Ser. 9.
Karsinkin, G. S., Kusnetzow, S. I. & Kusnetzowa, Z. I. (1930). Zur Aufklarung der Ursachen der Dynamik des Sauerstoffs im Wasser des Sees Glubokoje. [Russian with German Summary.] Arb. Hydrobiol. Sta. Glubokoje, Moscow, 6, 9-27, summary, pp. 91-3.
Karsinkin, G. S. & Kusnetzow, S. I. (1931). Neue Methode in der Limnologie. [Russian with German Summary.] Arb. limnol.. Sta. Kossino, Moscow, 13-14, 47-62, summary, pp. 63-8.
Kitto, W. H. (1938). A contribution to water analysis. I. Specific conductivity as a measure of total dissolved solids. Analyst, 63, 162.
Kusnetzow, S. I. & Kusnetzowa, Z. I. (1935). Bacteriological and chemical investigations on lake muds in connectionwith abottom emissionof gases. [RussianwithEnglishSummary.] Arb. I,imnol, Sta. Kosstno, Moscow, 19, 127-42, summary, pp. 1434.
Lind, E. M. (1940). Experiments with pond muds. J. Ecol. 28, 484-90. Lundbeck, J. (1934). tber den primar oligotrophen Seetypus und den Wollingster See als
dessen mitteleuropaischen Vertreter. Arch. Hydrobiol. Plankt. 27, 221-250. *McEwen, G. F. (1929). A mathematical theory of the vertical distribution of temperature and
salinity in water under the action of radiation, conduction, evaporation and mixing due to resulting convection. Bull. Scripps Instr. Oceanogr. non-tech. 2, 197-306.
Mattson, S. (1935). The pH and base saturation of the podzol profile. Trans. 3rd Int. C(ongr. Soil ScI., Jnt. Comm. papers, pp. 67-70. Oxford.
*Maucha, R. (1932). Hydrochemischen Methoden in der Limnologie. Binnengewasser, 12, 173 pp.' Stuttgart,
Mill, H. R. (1898). Bathymetrical survey of the English Lakes. Geogr. J. 6, 46-72, 135-65. Minder, L. (1938). Der Zurichsee als Eutrophierungsphanomen. Geol. Meere Binnengewasser,
2, 284-99. *Misra, R. D. (1938). Edaphic factors in the distribution of aquatic plants in the English Lakes.
J. Ecol. 26, 411-51. Moore, E. W. (1939). Graphic determination of carbon dioxide and the three forms of
alkalinity. J. Amer. Waterwks Ass. 31. Mortimer, C. H. (1939). The nitrogen balance of large bodies of water. Off. Circ., Brit.
Waterwks Ass. 21, 1-10.
This content downloaded on Tue, 5 Mar 2013 12:30:57 PMAll use subject to JSTOR Terms and Conditions

200 Exchange Qf dissolved substances in lakes Mortimer, C. H. (in preparation). I. Diffusion and eddy diffusion in lakes. II. Photo-electric
determination of the transparency of water samples. III. A portable, direct-reading elec- trical conductivity meter. IV. Conductometric estimation of sulphate in natural waters. V. Measurement and interpretation of oxidation-reduction potentials in lake waters and muds. VI. Bathymetric surveys of the English Lakes with echo-sounding apparatus. Survey results.
*Miiller, H. (1938). Beitrage zur Frage der biochemischen Schichtung im Lunzer Ober- und Untersee. Int. Rev. Hydrobiol. 36, 433-500.
Murray, J. & Pullar, L. (1908). Bathymetrical survey of the freshwater lochs of Scotland. Roy; Geogr. Soc.
Murray, J. & Pullar, L. (1910). Bathymetrical Survey of the Scottish' Freshwater Lochs. Vol. 1. Report on the Scientific Results. Challenger Office, Edinburgh, 785 pp.
*Naumann, E. (1932). Grundzuige der regionalen Limnologie. Binnengewasser, 11, 176 pp. Stuttgart.
Niumann, W. (1936). Dier Leitfahigkeit des Calciumbikarbonates und die lestimmung der SulpLate und Gesamtharte in naturlichen Gewasser mit Hilfe der elektrischen Leitfahigkeit. Naturwissenschaften, 24, 693.
*Ohl, W. (1933-4). Chemische und physikatische Untersuchungen norddeutscher Seen. Arch. IHydrobwol. Plankt. 26, 386-464, 584-658.
Ohle, W. ((1936 a). Zur Vervollkommnung der hydrochemischen Analyse. I. Schwefelwasser- stoffbestimmung. Angew. Chem. 49, 206-8.
Ohle, W. (1936 b). Zur Vervollkommnung der hydrochemischen Analyse. II. Bestimmung des im Wasser gelosten Sauerstoffes. Angew. Chem. 49, 778.
Ohle, W. (1937). Kolloidgele als Nahrstoffregulatoren der Gewa,sser. NaturwWssenschaften, 25, 471-4.
Pearsall, W. H. & Mortimer, C. H. (1939). Oxidation-reduction potentials in water- logged soils, natural waters and muds. J. Ecol. 27, 483-501.
Rawson, D. S. (1936). Physical and chemical studies in lakes of the Prince Albert Park, Saskatchewan. J. Biol. Bd. Canada, 2, 227-84.
Rawson, D. S. (1939). Some physical and chemical factors in the metabolism of lakes. Problems of Lake Biology (Amer. Ass. Adv. Sci., Publ. 10), pp. 9-26.
Richards, W. T. (1928). The oxygen electrode as a quasi-quantitative instrument. J. Phys. Chem. 32, 990-10Q5.
Riley, G. A. (1939). Limnological studies in Connecticut. I. General limnological survey. Ecol. Monogr. 9, 53-66.
Roberts, C. H., Grindley, J. & Williams, E. H. (1940). Chemical methods for the study of river pollution. Ministr. Agric. Fish., Fish. Invest., Series I, IV, no. 2.
Rossolimno, L. (1931). Hydrographische Studien am Pereslawskoje See. [Russian with Germa.n Summary.] Arb. limnol. Sta. Kossino, Moscow, 13-14, 69-131, summary, p. 119.
Rossolimo, L. & Kusnetzowa, S. I. (1934). DielBoden-Gasauscheidung als Faktor des Sauer- stoffhaushaltes. [Russian with German Summary.] Arb. limnol. Sta. Kossino, Moscow. 17, 87-112, summary, pp. 113-18.
Ruttner, F. (1921). Das elektrolytische Leitvermogen verdunnter L6sungep unter dem Einflusse subnierser Gewachse. I. BB. Akad. Wiss. Wien, Math. Naturw. KI. 130, 71.
*Schmidt, W. (1925). Der Massenaustausch in freier Luft und verwandte Erscheinungen. Probleme der kosmischen Physik, no. 7. Hamburg.
Schmidt, W. (1928). ITber die Temperatur- und Stabilithtsverhaltnisse von Seen. Geogr. Ann., Stockholm, 10, 143-77.
Stangenberg, M. (1936). Eisenverteilung in den Seen des Sulwalki-Gebietes wahrend des Sommers. Arch. Hydrobiol. Rybact., Warsaw, f0, 48-75.
Str0m, K. M. (1932). Tyrifjord. A limnological study. Skr. Norsk. Vidensk. Akad., Oslo, I, Math. Naturv. Ki. pp. 1-84.
Taylor, C. 1B. (1940). Bacteriology of fresh water. I. Distribution of bacteria in English Lakes. J. Hyg., Camb., 40, 616-40.
Taylor, G. I. (1915). Eddy motion in the atmosphere. Phtlos. Trans. A, 215, 1-26. *Thienemann, A. (1928). Der Sauerstoff im eutropen und oligotropheii See. Eim Beitrag zur
Seentypenlehre. Binnengewdsser, 4. Stuttgart. *Waksman, S. A. (1936). IThmus. Baltimore.
This content downloaded on Tue, 5 Mar 2013 12:30:57 PMAll use subject to JSTOR Terms and Conditions
CLIFFORD H. MORTIMER 201 Wedderburn, E. M. (1911). The temperatuie seiche. I. Temperature observations in the
Madusee, Pomerania. II. Hydrodynamical theory of temperature oscillations iin lakes. III. Calculation of the period of the temperature seiche in the Madusee. Trans. Roy. Soc. Edinb. 47, 619-36.
Wedderburn, E. M. (1912). Temperature observations in Loch Earn, with a further contri- bution to the hydrodynamical theory of the temperature seiche. Trans. Roy. Soc. Edinb. 48, 629-95.
Wedderburn, E. M. & Williams, A. M. (1911). The temperature seiche,. IV. Experimental verification of the hydrodynamical theory of temperature seiches. Trans. Roy. Soc. Edinb. 47, 636-42.
4Welchi P. S. (1935). Limnology, lst ed., 471 pp. New York. *Wright, C. H. (1939). Soil Analysis; A Handbook of Physical and Cheqmical Methods. 276 pp.
London. Yoshimura, S. (1932 a). On the dichotomous stratification of hydrogen ion concentration of
some Japanese lake waters. Jap. J. Geol. Geogr. 9, 155-85. Yoshimura, S. (1932 b). Calcium in solution in the lake waters of Japan. Jap. J. Geol. Geogr.
10, 33-60. Yoshimura, S. (1933). Rapid eutrophication within recent years of Lake Haruna, Gunma,
Japan. Jap. J. Geol. Geogr. 11, 3-41. Yoshimura, S. (1936 a). A contribution to the knowledge of deep water temperatures of
Japanese Lakes. Part I. Summer temperature. Jap. J. A8tron. Geophy8. 13, 61-120. Y6shimuxra, S. (1936 b). Contribution to the knowledge of iron dissolved in the lake waters
of Japan. Second Report. Jap. J. Geol. Geogr. 13, 39-56. ZoBell, C. E. (1937). Oxidation-reduction conditions in marine sediments, with particular
reference to O/R potentials oxygen deficit and bacteria. A88. Oceanogr. phy8., Proc-verb. no, 2, 159-60.
ZoBell, C. E. (1939). Occurrence and activity of bacteria in marine sediments. Recent Marine Sediments. Amer. A88. Petroleusm Geologists, Tulsa, Oklahoma, pp. 416-27.
This content downloaded on Tue, 5 Mar 2013 12:30:57 PMAll use subject to JSTOR Terms and Conditions