28 january 2015 - asx · asx release / 28 january 2015 investor relations mr rowan cole company...
TRANSCRIPT

ASX Release / 28 January 2015
Investor Relations Mr Rowan Cole Company Secretary +61 3 8660 1900
Media Relations Ms Nerida Mossop Hinton & Associates +61 3 9600 1979
St Barbara Limited Level 10, 432 St Kilda Road, Melbourne VIC 3004 T +61 3 8660 1900 F +61 3 8660 1999 ACN 009 165 066 Locked Bag 9, Collins Street East, Melbourne VIC 8003 W www.stbarbara.com.au
Presentation on the December 2014 Quarterly Report and audio webcast
Bob Vassie, Managing Director & CEO, will brief analysts and institutional investors on the December 2014 Quarterly Report at 10.00 am Australian Eastern Daylight Time (UTC + 11 hours) today, Wednesday 28 January 2015. Participation on the conference call is by personal invitation only. A live audio webcast of the briefing will be available on St Barbara’s website at www.stbarbara.com.au/investors/webcast/ or by clicking here. The audio webcast is ‘listen only’ and does not enable questions. The audio webcast will subsequently be made available on the website.
For
per
sona
l use
onl
y

Q2 December 2014 Quarterly Presentation
BOB VASSIE, MANAGING DIRECTOR & CEO / 28 January 2015
For
per
sona
l use
onl
y

Q2 December 2014 Quarterly Presentation 2 /
Disclaimer
This presentation has been prepared by St Barbara Limited (“Company”). The material contained in this presentation is for information purposes only. This presentation is not an offer or invitation for subscription or purchase of, or a recommendation in relation to, securities in the Company and neither this presentation nor anything contained in it shall form the basis of any contract or commitment.
This presentation may contain forward-looking statements that are subject to risk factors associated with exploring for, developing, mining, processing and sale of gold. Forward-looking statements include those containing such words as anticipate, estimates, forecasts, should, will, expects, plans or similar expressions. Such forward-looking statements are not guarantees of future performance and involve known and unknown risks, uncertainties, assumptions and other important factors, many of which are beyond the control of the Company, and which could cause actual results or trends to differ materially from those expressed in this presentation. Actual results may vary from the information in this presentation. The Company does not make, and this presentation should not be relied upon as, any representation or warranty as to the accuracy, or reasonableness, of such statements or assumptions. Investors are cautioned not to place undue reliance on such statements.
This presentation has been prepared by the Company based on information available to it, including information from third parties, and has not been independently verified. No representation or warranty, express or implied, is made as to the fairness, accuracy or completeness of the information or opinions contained in this presentation.
The Company estimates its reserves and resources in accordance with the Australasian Code for Reporting of Identified Mineral Resources and Ore Reserves 2012 Edition (“JORC Code”), which governs such disclosures by companies listed on the Australian Securities Exchange.
Financial figures are in Australian dollars unless otherwise noted. Financial year is 1 July to 30 June.
For
per
sona
l use
onl
y
Q2 December 2014 Quarterly Presentation 3 /
Contents
˃ Key Points
˃ Safety
˃ Operations Results
˃ Exploration
˃ Finance
˃ Conclusion
˃ Appendices
For
per
sona
l use
onl
y

Q2 December 2014 Quarterly Presentation 4 /
Key Points Q2 December 2014
˃ Record quarterly production of 80,623 ounces at Leonora
˃ Leonora FY15 guidance revised from 240,000 – 270,000 ounces to 250,000 – 265,000 ounces
˃ King of the Hills currently anticipated to cease production in Q4 June 2015, investigating alternatives inc. increased production from Gwalia and Kailis open-pit mine
˃ Record quarterly production at Simberi of 17,294 ounces1
˃ Month of December 2014 net cash flow positive2
˃ Cash at bank improved during the quarter from A$56 to A$70 M3
˃ Increase in cash after A$15 million interest payments on Notes and Red Kite
˃ Total debt at end December A$390 million2
˃ Safety: TRIFR4 of 4.7 1. Under St Barbara ownership
2. Unaudited
3. Unaudited, inc. $2 million restricted cash
4. Total Recordable Injury Frequency Rate (12 month avg)
For
per
sona
l use
onl
y

Q2 December 2014 Quarterly Presentation 5 /
Start safe, stay safe
Safety performance
˃ TRIFR1 of 4.7 at 31 Dec 2014
˃ Continued good results for mixed jurisdiction underground / open pit combination
˃ Simberi 857 days LTI2 free
˃ TRIFR includes Pacific Operations from September 2012
Total Recordable Injury Frequency Rate
12.5
9.0
6.0
4.1
4.9 4.7
FY 11 FY 12 FY 13 FY 14 Q1FY15
Q2FY15
1. Total Recordable Injury Frequency Rate (12 month avg)
2. Lost time injury – an injury that results in time off work
For
per
sona
l use
onl
y

Q2 December 2014 Quarterly Presentation 6 /
Consolidated Gold Production
˃ December Quarter:
˃ Record production at Gwalia and Simberi
˃ Simberi production improved within the quarter
˃ Q2 consolidated AISC 1 A$1,042 per ounce (Q1: A$1,344 / oz)
˃ Q2 realised gold price A$1,423 per ounce (Q1: 1,388 / oz)
53 49 59
45
69
17 17
19
11
12 9 11
13
13
17 15 16
94 93 92
69
98
FY 14Q2 Dec
FY 14Q3 Mar
FY 14Q4 Jun
FY 15Q1 Sep
FY 15Q2 Dec
Gwalia King of the Hills Simberi Gold Ridge S
koz
Figures displayed to nearest koz. Reported ounces in Quarterly Report.
1. All-In Sustaining Cost, Non IFRS measure, refer slide 23
For
per
sona
l use
onl
y

Q2 December 2014 Quarterly Presentation 7 /
Gwalia: St Barbara’s cornerstone mine
˃ Record 231 kt ore mined
˃ 259 kt of ore milled included stockpiles built during September maintenance shutdown
˃ Estimated 2,900 oz contained in stockpiled ore at end of quarter (Q1: 6,500 oz)
˃ All-In Sustaining Cost1 for quarter was A$883 per ounce (Q1: 1,086 /oz)
˃ Near mine resource extension deep drilling - initial hole near completion
˃ FY15 guidance increased to 200-210 koz (previously 180-200 koz)
Gold Production
52.6 49.1
59.4
45.4
68.6
FY 14Q2 Dec
FY 14Q3 Mar
FY 14Q4 Jun
FY 15Q1 Sep
FY 15Q2 Dec
koz
1. Non IFRS measure, refer slide 23
For
per
sona
l use
onl
y
Q2 December 2014 Quarterly Presentation 8 /
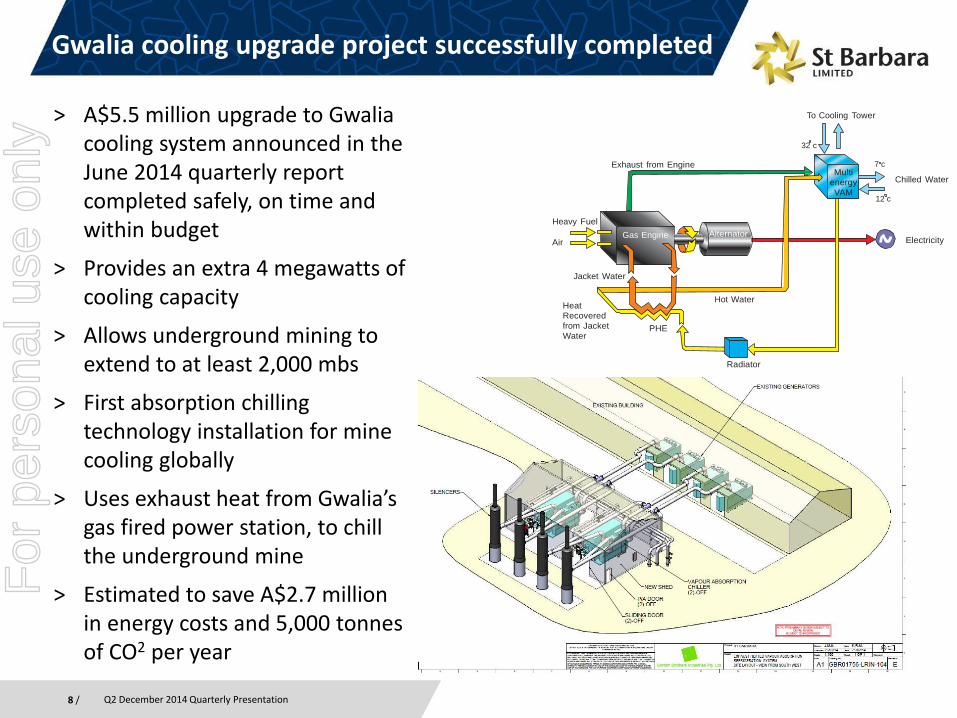
Gwalia cooling upgrade project successfully completed
Trigenration (New Concept) To Cooling Tower
32 c
Exhaust from Engine
Multi energy
VAM
7 c
12 c
Chilled Water
Heavy Fuel
Air
Gas Engine Alternator
Electricity
Jacket Water
Heat Recovered
from Jacket Water
PHE
Hot Water
Radiator
˃ A$5.5 million upgrade to Gwalia cooling system announced in the June 2014 quarterly report completed safely, on time and within budget
˃ Provides an extra 4 megawatts of cooling capacity
˃ Allows underground mining to extend to at least 2,000 mbs
˃ First absorption chilling technology installation for mine cooling globally
˃ Uses exhaust heat from Gwalia’s gas fired power station, to chill the underground mine
˃ Estimated to save A$2.7 million in energy costs and 5,000 tonnes of CO2 per year
For
per
sona
l use
onl
y

Q2 December 2014 Quarterly Presentation 9 /
Gwalia cooling upgrade project successfully completed
Chiller unit (1 of 2) being installed
Completed absorption chiller plant
For
per
sona
l use
onl
y

Q2 December 2014 Quarterly Presentation 10 /
Future Gwalia – Drilling Plan (Cross Section View)
2,200mbs
1,800mbs
Target
Surface
Potential shaft location
New parent hole - GWDD16
West East
For
per
sona
l use
onl
y
Q2 December 2014 Quarterly Presentation 11 /
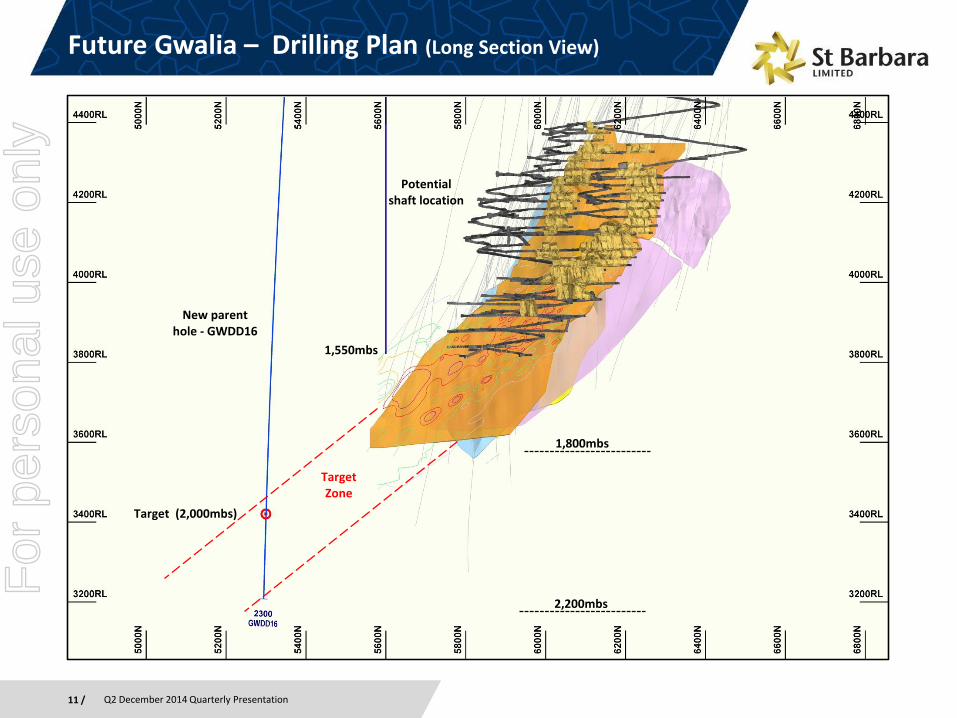
Future Gwalia – Drilling Plan (Long Section View)
Potential shaft location
New parent hole - GWDD16
Target (2,000mbs)
2,200mbs
1,800mbs
1,550mbs
Target Zone
For
per
sona
l use
onl
y
Q2 December 2014 Quarterly Presentation 12 /
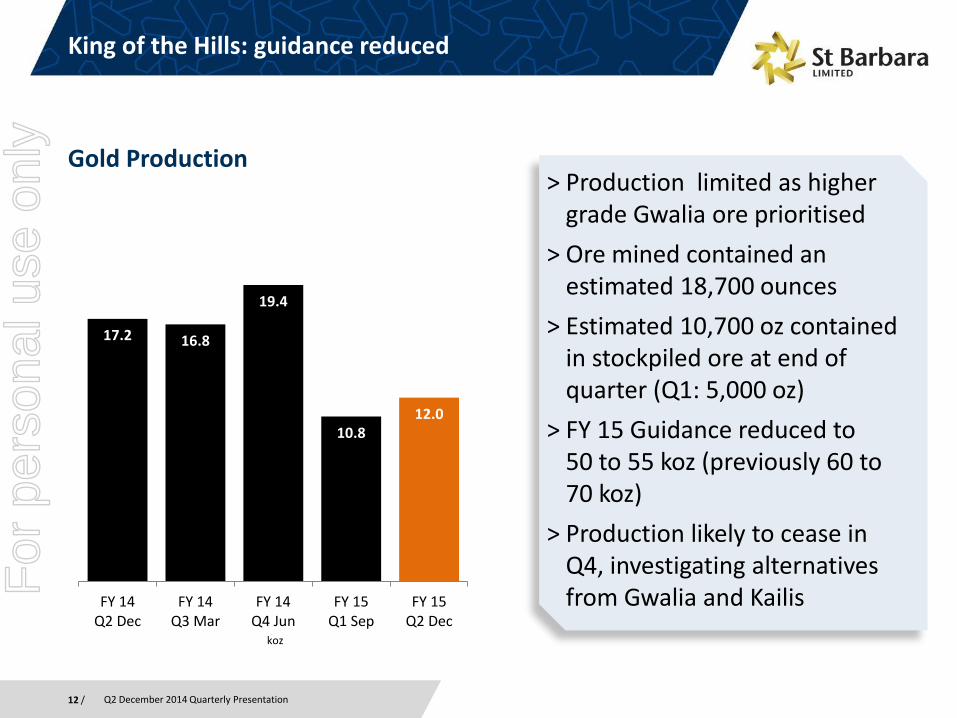
King of the Hills: guidance reduced
˃ Production limited as higher grade Gwalia ore prioritised
˃ Ore mined contained an estimated 18,700 ounces
˃ Estimated 10,700 oz contained in stockpiled ore at end of quarter (Q1: 5,000 oz)
˃ FY 15 Guidance reduced to 50 to 55 koz (previously 60 to 70 koz)
˃ Production likely to cease in Q4, investigating alternatives from Gwalia and Kailis
Gold Production
17.2 16.8
19.4
10.8 12.0
FY 14Q2 Dec
FY 14Q3 Mar
FY 14Q4 Jun
FY 15Q1 Sep
FY 15Q2 Dec
koz
For
per
sona
l use
onl
y

Q2 December 2014 Quarterly Presentation 13 /
King of the Hills – mine likely to cease production in Q4
˃ Current mine plan anticipates production to end early in the June 2015 quarter, with processing of ore to continue to the end of the quarter
˃ Results from recent drilling do not support mine development to extend mine life beyond FY15 using current methods
˃ Strategic options being evaluated, including alternative mining methods and divestment, due to be completed in March quarter
˃ Kailis open-pit mine being evaluated as a potential replacement for King of the Hills. At 30 June 2014, Kailis had a mineral resource of 1.1 Mt @ 3.3 g/t Au for 114 koz contained ounces of gold
˃ Gwalia has commenced change of mining method seeking to increase production rate
For
per
sona
l use
onl
y
Q2 December 2014 Quarterly Presentation 14 /
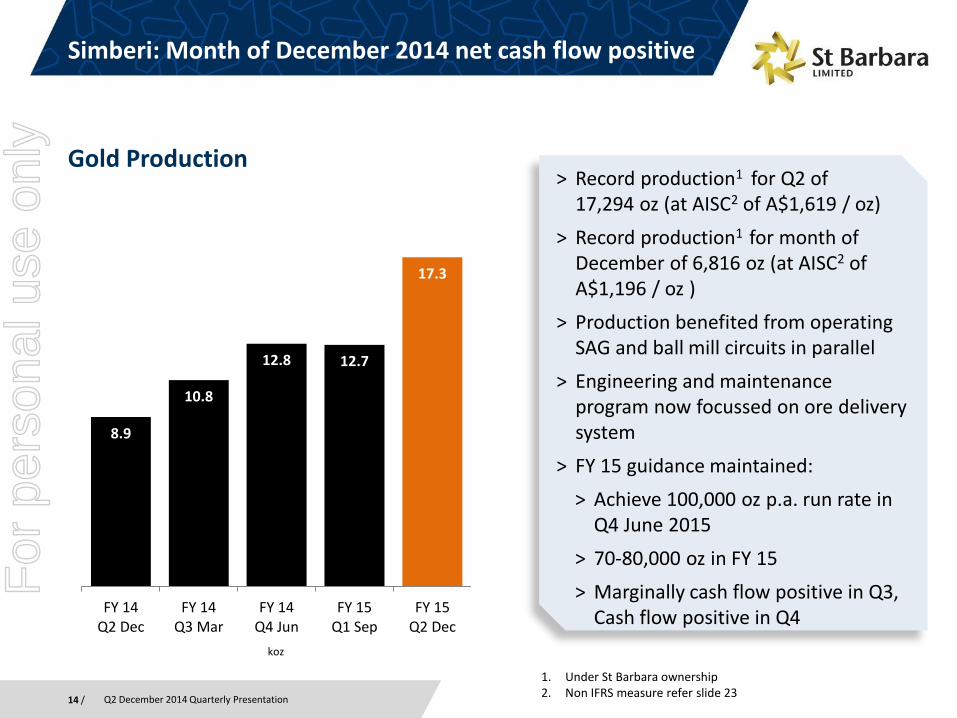
Simberi: Month of December 2014 net cash flow positive
˃ Record production1 for Q2 of 17,294 oz (at AISC2 of A$1,619 / oz)
˃ Record production1 for month of December of 6,816 oz (at AISC2 of A$1,196 / oz )
˃ Production benefited from operating SAG and ball mill circuits in parallel
˃ Engineering and maintenance program now focussed on ore delivery system
˃ FY 15 guidance maintained:
˃ Achieve 100,000 oz p.a. run rate in Q4 June 2015
˃ 70-80,000 oz in FY 15
˃ Marginally cash flow positive in Q3, Cash flow positive in Q4
Gold Production
8.9
10.8
12.8 12.7
17.3
FY 14Q2 Dec
FY 14Q3 Mar
FY 14Q4 Jun
FY 15Q1 Sep
FY 15Q2 Dec
koz
1. Under St Barbara ownership 2. Non IFRS measure refer slide 23
For
per
sona
l use
onl
y

Q2 December 2014 Quarterly Presentation
463
536
620
FY14Q4 Jun
FY15Q1 Sep
FY15Q2 Dec
kt
Gold production
15 /
Simberi: Continued improvement in ore milled
2.7
4.9 5.0 5.0 5.5
6.8
Jul 14 Aug 14 Sep 14 Oct 14 Nov 14 Dec 14
koz
Ore milled last 3 quarters last 6 months
For
per
sona
l use
onl
y

Q2 December 2014 Quarterly Presentation 16 /
Gold Ridge – Operations suspended
˃ Negotiations with the Government regarding the potential transfer of Gold Ridge to the Government have made little progress during the quarter
˃ No agreement has been reached with the Government on the critically necessary de-watering of the tailings storage facility, despite Gold Ridge Mining Limited (GRML) installing pumping infrastructure in anticipation of such approval
˃ The Company and GRML are reviewing their respective strategic and legal options in relation to these matters
˃ Expenditure at Gold Ridge minimal since December quarter
For
per
sona
l use
onl
y

Q2 December 2014 Quarterly Presentation 17 /
Exploration – focus on near mine targets at Simberi
Figure 1.0 1. For full explanation and results refer to ASX release 28 January 2014 ‘Quarterly Report December 2014’
Results for drilling completed at Monun Creek (SRCH001 to SRCH004 and SDH324 to SDH334) were received, including 1
Results included:
SRCH002: 16m @ 3.5 g/t Au from 6m, including 6m @ 7.2 g/t Au from 10m SDH327: 41m @ 1.2 g/t Au from 0m, and 26m @ 1.4 g/t Au from 47m SDH328: 24m @ 3.3 g/t Au from 11m, including 1m @ 45.6 g/t Au from 28m SDH331: 80m @ 1.4 g/t Au from 30m to
EOH (end of hole)
For
per
sona
l use
onl
y

Q2 December 2014 Quarterly Presentation 18 /
Finance - At 31 December 2014
˃ A$70 million cash (inc. $2 million restricted cash) 1
Increase of A$14M due to record production at Leonora, reduced funding to Pacific Operations, and favourable working capital movements
Increase after A$15M interest on Notes and Red Kite paid during quarter
˃ Red Kite loan facility restructured
Amortisation commencement delayed 6 months (now start Sep. 2015, previously March 2015), then amortise over eight quarters
˃ A$390 million interest bearing liabilities1
Increase since September quarter due to decline in AUD vs USD
˃ Gold forward contracts:
102,000 ounces to be delivered between January and June 2015 at A$1,415/oz
1. Unaudited
For
per
sona
l use
onl
y

Q2 December 2014 Quarterly Presentation 19 /
Conclusion
˃ St Barbara turnaround is evident
˃ Leonora record quarterly production
˃ Simberi record quarterly and monthly (December) production1
˃ Cash flow positive in December
˃ Encouraging near mine drill results on Simberi
˃ Deep drilling at Gwalia – initial results expected in Q3 March
2015
˃ Leonora FY15 guidance amended, now 250 - 265 koz
(previously 240 to 270 koz)
1. During St Barbara ownership
For
per
sona
l use
onl
y

Q2 December 2014 Quarterly Presentation
Appendices
20 /
For
per
sona
l use
onl
y

Q2 December 2014 Quarterly Presentation 21 /
Consolidated Production Summary
Q1 Sep FY15
Q2 Dec FY15
Guidance FY153
Pro
du
ctio
n Gwalia oz 45,391 68,589 200 - 210,000
King of the Hills oz 10,793 12,034 50 - 55,000
Simberi oz 12,639 17,294 70 - 80,000
Consolidated oz 68,823 97,917 320 - 345,000
Min
ed
G
rad
e Gwalia g/t 7.9 9.0
King of the Hills g/t 4.1 4.2
Simberi g/t 1.1 1.1
Tota
l Cas
h
Op
era
tin
g C
ost
1
,2
Gwalia A$/oz 767 611 710 -740
King of the Hills A$/oz 1,085 1,093 1,230 -1,280
Simberi A$/oz 2,032 1,489 1,200 -1,300
Consolidated A$/oz 1,048 825 890 - 940
1. Non IFRS measure, refer slide 23
2. Unaudited
3. Guidance revised in December 2014 Quarterly Report
For
per
sona
l use
onl
y

Q2 December 2014 Quarterly Presentation 22 /
Competent Persons Statement
Exploration Results The information in this report that relates to Exploration Results is based on information compiled by Dr Roger Mustard, who is a Member of The Australasian Institute of Mining and Metallurgy. Dr Mustard is a full-time employee of St Barbara Ltd and has sufficient experience relevant to the style of mineralisation and type of deposit under consideration and to the activity which he is undertaking to qualify as a Competent Person as defined in the 2012 Edition of the ‘Australasian Code for Reporting of Exploration Results, Mineral Resources and Ore Reserves’. Dr Mustard consents to the inclusion in the report of the matters based on his information in the form and context in which it appears. Mineral Resource and Ore Reserve Estimates The information in this report that relates to Mineral Resources or Ore Reserves is extracted from the report titled ‘Ore Reserves and Mineral Resources Statements 30 June 2014’ released to the Australian Securities Exchange (ASX) on 27 August 2014 and available to view at www.stbarbara.com.au and for which Competent Person’s consents were obtained. The Competent Person’s consents remain in place for subsequent releases by the Company of the same information in the same form and context, until the consent is withdrawn or replaced by a subsequent report and accompanying consent. The Company confirms that it is not aware of any new information or data that materially affects the information included in the original ASX announcement released on 27 August 2014 and, in the case of estimates of Mineral Resources or Ore Reserves, that all material assumptions and technical parameters underpinning the estimates in the original ASX announcement continue to apply and have not materially changed. The Company confirms that the form and context in which the Competent Person's findings are presented have not been materially modified from the original ASX announcement. Competent Persons Dr Mustard and Mr de Vries are entitled to participate in St Barbara’s long term incentive plan, details of which are included in the 2014 Annual Report and Notice of 2014 Annual General Meeting released to the ASX on 17 October 2014. In 2012 and 2013 increase in Ore Reserves was one of the performance measures under that plan. Full details are contained in the ASX release dated 27 August 2014 ‘Ore Reserves and Mineral Resources Statements 30 June 2014’ available at www.stbarbara.com.au.
For
per
sona
l use
onl
y

Q2 December 2014 Quarterly Presentation 23 /
Non-IFRS Measures
We supplement our financial information reporting determined under International Financial Reporting Standards (IFRS) with certain non-IFRS financial measures, including cash operating costs. We believe that these measures provide meaningful information to assist management, investors and analysts in understanding our financial results and assessing our prospects for future performance.
Cash operating costs ˃ Calculated according to common mining industry practice using The Gold Institute (USA) Production Cost Standard (1999 revision).
All-In Sustaining Cost ˃ All-In Sustaining Cost is based on Cash Operating Costs, and adds items relevant to sustaining production. It includes some, but not all, of the components identified in World Gold Council’s Guidance Note on Non-GAAP Metrics - All-In Sustaining Costs and All-In Costs (June 2013).
˃ AISC is calculated on gold production in the quarter.
˃ For underground mines, amortisation of operating development is adjusted from “Total Cash Operating Costs” in order to avoid duplication with cash expended on operating development in the period contained within the “Mine & Operating Development” line item.
˃ Rehabilitation is calculated as the amortisation of the rehabilitation provision on a straight-line basis over the estimated life of mine.
For
per
sona
l use
onl
y

Q2 December 2014 Quarterly Presentation 24 /
Investor Relations Enquiries
Rowan Cole Company Secretary
Garth Campbell-Cowan Chief Financial Officer
T: +61 3 8660 1900 E: [email protected]
For
per
sona
l use
onl
y