28, 889 (1999); https:// doi.org/10.1063/1.556040
TRANSCRIPT

Journal of Physical and Chemical Reference Data 28, 889 (1999); https://doi.org/10.1063/1.556040 28, 889
© 1999 American Institute of Physics and American Chemical Society.
Phase Diagrams and ThermodynamicProperties of Binary Systems of DrugsCite as: Journal of Physical and Chemical Reference Data 28, 889 (1999); https://doi.org/10.1063/1.556040Submitted: 01 December 1998 . Published Online: 03 December 1999
James Sangster
ARTICLES YOU MAY BE INTERESTED IN
Phase Diagrams and Thermodynamic Properties of Binary Organic Systems Based on 1,2-, 1,3-,1,4-Diaminobenzene or BenzidineJournal of Physical and Chemical Reference Data 23, 295 (1994); https://doi.org/10.1063/1.555959
Phase Diagrams and Thermodynamic Properties of Binary and Ternary Systems Based onNitroaromatic CompoundsJournal of Physical and Chemical Reference Data 26, 351 (1997); https://doi.org/10.1063/1.556009
Phase Transition Enthalpy Measurements of Organic and Organometallic Compounds.Sublimation, Vaporization and Fusion Enthalpies From 1880 to 2015. Part 1. C1 − C10Journal of Physical and Chemical Reference Data 45, 033101 (2016); https://doi.org/10.1063/1.4948363

Phase Diagrams and Thermodynamic Propertiesof Binary Systems
of Drugs
James Sangster a…
Sangster Research Laboratories, Suite 402, 3475 de la Montagne, Montreal, Quebec H3G 2A4, Canada
Received December 1, 1998; revised manuscript received February 19, 1999
The phase diagram data of 60 binary systems of drugs were evaluated with the aid ofa computer-coupled phase diagram/thermodynamic analysis. Data for this analysis wereobtained by an exhaustive literature search~110 references!. Among the results of thisanalysis are the excess Gibbs energy of liquid and solid solution phases, and the thermo-dynamic properties of intermediate compounds. For each system a phase diagram wascalculated; such calculated diagrams are thermodynamically consistent and are offered asthe best constructions which can be deduced from available data. ©1999 AmericanInstitute of Physics and American Chemical Society.@S0047-2689~99!00303-7#
Key words: phase diagrams; thermodynamic properties.
Contents1. Introduction. . . . . . . . . . . . . . . . . . . . . . . . . . . . . . . . 8912. Thermodynamic Analysis of Phase Diagrams. . . . 8913. Computer-Coupled Phase Diagram/
Thermodynamic Analysis. . . . . . . . . . . . . . . . . . . . . 8914. Solid Solutions of Limited Solubility. .. . . . . . . . . 8915. Experimental Methods of Measurement. . . . . . . . . 8926. Polymorphism and Metastable States. . . . . . . . . . . 8927. Retrieval and Treatment of Data. .. . . . . . . . . . . . . 8928. Properties of the Pure Substances. . . . . . . . . . . . . . 8929. Estimation of Enthalpy of Fusion. .. . . . . . . . . . . . 89510. Temperature Dependence of Enthalpy of
Fusion. . . . . . . . . . . . . . . . . . . . . . . . . . . . . . . . . . . . 89511. Thermodynamic Analysis and Presentation of
Results. . . . . . . . . . . . . . . . . . . . . . . . . . . . . . . . . . . . 89612. Analysis of Phase Diagrams. . . . . . . . . . . . . . . . . . 897
12.1. Phenazone~A!1Phenylbutazone~B!. . . . . . 89712.2. Phenazone~A!1Phenacetin~B!. . . . . . . . . . 89712.3. Phenazone~A!1Urea ~B!. . . . . . . . . . . . . . . 89812.4. Paracetamol~A!1Phenazone~B!. . . . . . . . . 89812.5. Sulfadiazine~A!1Trimethoprim~B!. . . . . . 89912.6. Sulfamethoxazole~A!1Trimethoprim
~B!. . . . . . . . . . . . . . . . . . . . . . . . . . . . . . . . . 89912.7. Benzoic Acid~A!1Trimethoprim~B!. . . . . 90012.8. Sulfamethoxypyridazine
~A!1Trimethoprim~B!. . . . . . . . . . . . . . . . . 90012.9. Aminophenazone~A!14-Aminophenazone
~B!. . . . . . . . . . . . . . . . . . . . . . . . . . . . . . . . . 90112.10. Aminophenazone~A!1Phenacetin~B!. . . . 90112.11. Aminophenazone~A!1Phenylbutazone
~B!. . . . . . . . . . . . . . . . . . . . . . . . . . . . . . . . . 90212.12. Aminophenazone~A!1Phenazone~B!. . . . . 90212.13. Thiourea~A!1Aminophenazone~B!. . . . . . 90212.14. Urea~A!1Aminophenazone~B!. . . . . . . . . 90312.15. Aminophenazone~A!1Allobarbital ~B!. . . . 90412.16. Aminophenazone~A!1Barbital ~B!. . . . . . . 90512.17. Aminophenazone~A!1Sulfisoxazole~B!. . 90512.18. 3-Methoxybenzoic Acid~A!1Etofylline
~B!. . . . . . . . . . . . . . . . . . . . . . . . . . . . . . . . . 90512.19. Benzoic Acid~A!1Etofylline ~B!. . . . . . . . 90612.20. Aminophenazone~A!1Etofylline ~B!. . . . . 90612.21. 4-Nitroaniline~A!1Etofylline ~B!. . . . . . . . 90712.22. Benzidine~A!1Etofylline ~B!. . . . . . . . . . . 90812.23. Hydroquinone~A!1Etofylline ~B!. . . . . . . . 90812.24. 4-Nitrophenol~A!1Etofylline ~B!. . . . . . . . 90912.25. Phenacetin~A!1Urea ~B!. . . . . . . . . . . . . . . 91012.26. Acetanilide~A!1Phenacetin~B!. . . . . . . . . 91012.27. Phenacetin~A!1Phenobarbital~B!. . . . . . . 91112.28. Paracetamol~A!1Phenobarbital~B!. . . . . . 91112.29. Urea~A!1Phenobarbital~B!. . . . . . . . . . . . 91212.30. Theophylline~A!1Phenobarbital~B!. . . . . . 91312.31. Quinine~A!1Phenobarbital~B!. . . . . . . . . . 91312.32. Caffeine~A!1Phenobarbital~B!. . . . . . . . . 91412.33. Aspirin~A!1Phenobarbital~B!. . . . . . . . . . 91412.34. Sulfanilamide~A!1Phenylbutazone~B!. . . 91512.35. Khellin~A!1Sulfanilamide~B!. . . . . . . . . . 91512.36. Sulfanilamide~A!1Benzocaine~B!. . . . . . . 91612.37. Sulfanilamide~A!14-Aminobenzoic
Acid ~B!. . . . . . . . . . . . . . . . . . . . . . . . . . . . . 91612.38. Caffeine~A!1Sulfathiazole~B!. . . . . . . . . . 91712.39. Sulfathiazole~A!1Phenylbutazone~B!. . . . 91712.40. Phenazone~A!1Sulfathiazole~B!. . . . . . . . 91812.41. Sulfathiazole~A!1Benzocaine~B!. . . . . . . 91912.42. Sulfathiazole~A!14-Aminobenzoic Acid
~B!. . . . . . . . . . . . . . . . . . . . . . . . . . . . . . . . . 91912.43. Nicotinamide~A!1Theophylline~B!. . . . . . 920
a!Electronic mail: [email protected]
©1999 by the U.S. Secretary of Commerce on behalf of the United States.All rights reserved. This copyright is assigned to the American Institute ofPhysics and the American Chemical Society.Reprints available from ACS; see Reprints List at back of issue.
0047-2689/99/28„4…/889/42/$33.00 J. Phys. Chem. Ref. Data, Vol. 28, No. 4, 1999889

12.44. Nicotinamide~A!1Indomethacin~B!. . . . . 92012.45. Nicotinamide~A!1Sulfamerazine~B!. . . . . 92112.46. Khellin~A!1Sulfapyridine~B!. . . . . . . . . . 92212.47. Khellin~A!1Nicotinic Acid ~B!. . . . . . . . . 92312.48. Urea~A!1Khellin ~B!. . . . . . . . . . . . . . . . . 92312.49. Khellin~A!1Caffeine~B!. . . . . . . . . . . . . . 92312.50. Khellin~A!1Nicotinamide~B!. . . . . . . . . . 92312.51. Khellin~A!1Sulfacetamide~B!. . . . . . . . . . 92412.52. Theophylline~A!1Paracetamol~B!. . . . . . . 92512.53. Caffeine~A!1Paracetamol~B!. . . . . . . . . . . 92512.54. 4-Aminobenzoic Acid~A!1Caffeine~B!. . 92612.55. Anthranilic Acid~A!1Caffeine~B!. . . . . . . 92612.56. Benzoic Acid~A!1Isonicotinamide~B!. . . 92712.57. 2-Nitroaniline~A!14-Aminobenzoic
Acid ~B!. . . . . . . . . . . . . . . . . . . . . . . . . . . . . 92812.58. Succinimide~A!1Urea ~B!. . . . . . . . . . . . . 92812.59. Chlormadinone Acetate~A!1Ethinyl
Estradiol~B!. . . . . . . . . . . . . . . . . . . . . . . . . 92912.60. Estradiol Benzoate~A!1Estradiol
Phenylpropionate~B!. . . . . . . . . . . . . . . . . . 92913. Acknowledgments. . . . . . . . . . . . . . . . . . . . . . . . . . 92914. References. . . . . . . . . . . . . . . . . . . . . . . . . . . . . . . . . 929
List of Tables1. Melting points and fusion properties of the pure
components. . . . . . . . . . . . . . . . . . . . . . . . . . . . . . . . 8932. The temperature dependence of the enthalpy and
entropy of fusion of benzocaine. . . . . . . . . . . . . . . 896
List of Figures1. The system phenazone~A!1phenylbutazone
~B!. . . . . . . . . . . . . . . . . . . . . . . . . . . . . . . . . . . . . . . 8962. The system phenazone~A!1phenacetin~B!. . . . . . 8973. The system phenazone~A!1urea~B!. . . . . . . . . . . 8974. The system paracetamol~A!1phenazone~B!. . . . . 8985. The system sulfadiazine~A!1trimethoprim
~B!. . . . . . . . . . . . . . . . . . . . . . . . . . . . . . . . . . . . . . . 8986. The system sulfamethoxazole~A!1trimethoprim
~B!. . . . . . . . . . . . . . . . . . . . . . . . . . . . . . . . . . . . . . . 8997. The system benzoic acid~A!1trimethoprim~B!. . 8998. The system sulfamethoxypyridazine
~A!1trimethoprim~B!. . . . . . . . . . . . . . . . . . . . . . . 9009. The system aminophenazone
~A!14-aminophenazone~B!. . . . . . . . . . . . . . . . . . 90110. The system aminophenazone~A!1phenacetin
~B!. . . . . . . . . . . . . . . . . . . . . . . . . . . . . . . . . . . . . . . 90111. The system aminophenazone
~A!1phenylbutazone A~B!. . . . . . . . . . . . . . . . . . . . 90212. The system aminophenazone~A!1phenazone
~B!. . . . . . . . . . . . . . . . . . . . . . . . . . . . . . . . . . . . . . . 90213. The system thiourea~A!1aminophenazone~B!. . . 90314. The system urea~A!1aminophenazone~B!. Part
of the diagram is conjectural. . . . . . . . . . . . . . . . . . 90315. The system aminophenazone~A!1allobarbital
~B!. . . . . . . . . . . . . . . . . . . . . . . . . . . . . . . . . . . . . . . 90416. The system aminophenazone~A!1barbital ~B!. . . 90417. The system aminophenazone~A!1sulfisoxazole
~B!. . . . . . . . . . . . . . . . . . . . . . . . . . . . . . . . . . . . . . . 905
18. The system 3-methoxybenzoic acid~A!1etofylline ~B!. . . . . . . . . . . . . . . . . . . . . . . . . . 906
19. The system benzoic acid~A!1etofylline ~B!. . . . . 90620. The system aminophenazone~A!1etofylline
~B!. . . . . . . . . . . . . . . . . . . . . . . . . . . . . . . . . . . . . . . 90721. The system 4-nitroaniline~A!1etofylline ~B!. . . . 90722. The system benzidine~A!1etofylline ~B!. . . . . . . . 90823. The system hydroquinone~A!1etofylline ~B!. . . . 90824. The system 4-nitroenol~A!1etofylline ~B!. . . . . . 90925. The system phenacetin~A!1urea~B!. The
calculated immiscibility envelope isconjectural. . . . . . . . . . . . . . . . . . . . . . . . . . . . . . . . . 909
26. ~a! The system acetanilide~A!1phenacetin~B!.possible interpretation of the data.~b!. Thesystem acetanilide~A!1phenacetin~B!. Anotherpossible interpretation of the data... . . . . . . . . . . . 910
27. The system phenacetin~A!1phenobarbital~B!. . . 91128. The system paracetamol~A!1phenobarbital~B!. . 91129. The system urea~A!1phenobarbital~B!. The
diagram is conjectural.. . . . . . . . . . . . . . . . . . . . . . . 91230. The system theophylline~A!1phenobarbital~B!.. 91231. The system quinine~A!1phenobarbital~B!. . . . . . 91332. The system caffeine~A!1phenobarbital~B!. . . . . . 91433. The system aspirin~A!1phenobarbital~B!. . . . . . . 91434. The system sulfanilamide~A!1phenylbutazone
~B!. . . . . . . . . . . . . . . . . . . . . . . . . . . . . . . . . . . . . . . 91535. The system khellin~A!1sulfanilamide~B!. . . . . . . 91536. The system sulfanilamide~A!1benzocaine~B!. . . 91637. The system sulfanilamide~A!14-aminobenzoic
acid ~B!. . . . . . . . . . . . . . . . . . . . . . . . . . . . . . . . . . . 91638. The system caffeine~A!1sulfathiazole~B!. . . . . . 91739. The system sulfathiazole~A!1phenylbutazone
~B!. . . . . . . . . . . . . . . . . . . . . . . . . . . . . . . . . . . . . . . 91740. The system phenazone~A!1sulfathiazole~B!. . . . 91841. The system sulfathiazole~A!1benzocaine~B!. . . . 91842. The system sulfathiazole~A!14-aminobenzoic
acid ~B!. . . . . . . . . . . . . . . . . . . . . . . . . . . . . . . . . . . 91943. The system nicotinamide~A!1theophylline
~B!. . . . . . . . . . . . . . . . . . . . . . . . . . . . . . . . . . . . . . . 91944. The system nicotinamide~A!1indomethacin~B!.
Most of the diagram is conjectural.. . . . . . . . . . . . . 92045. The system nicotinamide~A!1sulfamerazine~B!.. 92046. The system khellin~A!1sulfapyridine~B!. . . . . . . 92147. The system khellin~A!1nicotinic acid~B!. . . . . . 92148. The system urea~A!1khellin ~B!. . . . . . . . . . . . . . 92249. The system khellin~A!1caffeine~B!. . . . . . . . . . . 92250. The system khellin~A!1nicotinamide~B!. . . . . . . 92351. The system khellin~A!1sulfacetamide~B!. . . . . . 92452. The system theophylline~A!1paracetamol~B!. . . 92453. The system caffeine~A!1paracetamol~B!. . . . . . . 92554. The system 4-aminobenzoic acid~A!1caffeine
~B!. . . . . . . . . . . . . . . . . . . . . . . . . . . . . . . . . . . . . . . 92555. The system anthranilic acid~A!1caffeine~B!. . . . 92656. The system benzoic acid~A!1isonicotinamide
~B!. The existence of the 2:1 compound isdebatable.. . . . . . . . . . . . . . . . . . . . . . . . . . . . . . . . . 926
57. The system 2-nitroaniline~A!14-aminobenzoic
890890 JAMES SANGSTER
J. Phys. Chem. Ref. Data, Vol. 28, No. 4, 1999

acid ~B!. . . . . . . . . . . . . . . . . . . . . . . . . . . . . . . . . . . 92758. The system succinimide~A!1urea~B!. . . . . . . . . . 92759. The system chlormadinone acetate~A!1ethinyl
estradiol~B!. . . . . . . . . . . . . . . . . . . . . . . . . . . . . . . 92860. The system estradiol benzoate~A!1estradiol
phenylpropionate~B!. . . . . . . . . . . . . . . . . . . . . . . . 928
1. Introduction
The biological activity of medicinal chemicals is a properconcern of health professionals and the pharmaceutical in-dustry. This includes interactions between different sub-stances simultaneously present in vivo. Many drugs aremanufactured in solid tablet form, in which case crystalstructure can influence tableting ability1
and dissolution behavior.2
Since many drugs can persist in one or more metastable solid modifications
~polymorphism3!, the properties of these metastable forms also are impor-
tant for predicting stability in storage. When two compounds are combined
in solid form it is prudent to be aware of interactions in the solid state which
may affect the final efficacy of the preparation.4
In the tableting operation, pressure is applied to the solidmass, whose temperature may rise to a variable degree. If thetwo compounds form a simple eutectic, the physical mixtureof eutectic composition may have properties different fromthose of a fused mass.5 If an intermediate compound isformed, its stability must be ascertained.6 The complex, uponingestion, may or may not decompose to give the originalcomponents7 and the complex itself may have pharmaceuti-cal properties different from its component drugs.8–10 Theformation of a solid solution between a difficultly solublesubstance and another drug may ameliorate the dissolutionproperties of the difficultly soluble compound.11,12
A number of methods have been used to investigate inter-actions between drug molecules in the solid state. Amongthem are: x-ray diffraction, absorption spectrophotometry@ultraviolet ~UV!, infrared~IR!#, thermogravimetric analysis,refractive index and differential thermal analysis3,13 ~DTA!.When applied to a binary drug system, DTA and differentialscanning calorimetry~DSC! enable the phase diagram of thesystem to be obtained, including the following properties:
~i! melting points and enthalpy of fusion of pure sub-stances, eutectics and intermediate compounds
~ii ! determination of drug purity,14
~iii ! polymorphism,~iv! thermal stability,~v! glass transitions, and~vi! solid solubility.
2. Thermodynamic Analysis of PhaseDiagrams
Although a number of binary phase diagrams of pharma-ceutical substances have been measured and reported, boththe quantity and quality of the data are highly variable. Theexperimental methods used have different strengths andweaknesses, and the reported phase diagrams are not always
consistent with thermodynamic constraints arising from thecondition of equilibrium. In the present work, a computer-coupled phase diagram/thermodynamic analysis was used tocalculate a phase diagram for each of 60 systems examined.This type of analysis uses available phase diagram and ther-modynamic constraints and effects a correct thermodynamicsmoothing of experimental data. Other results of this analysisinclude the deduction of excess Gibbs energies of solutionphases and thermodynamic properties of intermediate com-pounds. The procedure has been applied with equal successto systems of molten salts,15 organic compounds,16,17 metaloxides18 and liquid crystals.19
3. Computer-Coupled Phase Diagram/Thermodynamic Analysis
The thermodynamic basis of phase diagrams is wellknown.20,21 The analysis used here has been describedpreviously;15,17the principal features are summarized in whatfollows. The given data are those of the pure componentsand the liquidus, solidus, eutectic and peritectic temperaturearrests. The computer program performs a simultaneousleast-squares optimization of the thermodynamic and phasediagram data, resulting in expressions for the excess Gibbsenergies of liquid and solid solution phases and thermody-namic properties of intermediate compounds~if any!. Withthese data, a phase diagram is calculated and the invariantpoints of the system are deduced. The computer programsare available on-line22 and also on microcomputer diskette~details available from the author!.
4. Solid Solutions of Limited Solubility
As a general rule, systems of organic compounds do notexhibit solid solubility, principally because the crystallinestructures of the components are usually incompatible. Whenthere is no solid solution, the limiting liquidus slope near apure component~say A! is given by15,17
~dxA /dT! liq5D fusHA /RTfus2 , ~1!
whereTfus is the melting point of component A andD fusHA
is the enthalpy of fusion. The expression on the right handside~RHS! is simply the reciprocal of the well-known freez-ing point depression constant and depends only on propertiesof the solvent. A similar expression holds for the other com-ponent. Equation~1! is useful in preliminary analysis ofphase diagram data in suggesting the presence or absence ofsolid solubility or in the critical evaluation of experimentalliquidus data.17 Equation~1! is a necessary thermodynamicrequirement for equilibrium phase diagrams, and all phasediagrams shown in the present work adhere to this constraint.
In a few cases, solid solubility was included in the phasediagram in order to reproduce the experimental liquidus. Thesolid solution was assumed to be Henrian, i.e., the activity ofthe solvent was assumed to be unity and the solute was rep-
891891THERMODYNAMIC PROPERTIES OF BINARY SYSTEMS OF DRUGS
J. Phys. Chem. Ref. Data, Vol. 28, No. 4, 1999

resented by a temperature-independent activitycoefficient.15,17 In actuality, of course, these are approxima-tions, but suffice for the purposes at hand.
5. Experimental Methods of Measurement
Various techniques were used to determine phase dia-grams for the systems studied:
~1! thermal analysis~cooling curves!,~2! thaw-melt method,~3! DTA, DSC,~4! Kofler’s contact~microthermal! method,~5! hot-stage microscope, and~6! light transmission.
All these are methods for detecting the solid–liquid phasechange as a function of temperature and composition. Meth-ods 1–5 have been described and evaluated.4,17,21In method6, the phase change is registered automatically by the re-sponse of a photocell to transmitted light.
In the evaluation of phase diagram data from these meth-ods, several considerations are pertinent:
~i! supercooling,~ii ! use of heating or cooling mode,~iii ! visual or instrumental detection, and~iv! preparation of mixtures.
The same system, studied by different methods, may yieldrather different results.4 In the present work, experimentalmethods are stated in the discussion of every system andmention of experimental peculiarities is made and accountedfor. Other supplementary experimental methods were: x-raydiffraction, microphotographic analysis and IR spectroscopy.Their purpose was generally to confirm features of the solidstate~solid solutions, presence of compounds, etc.!.
6. Polymorphism and Metastable States
Drugs, being organic compounds, may exist in one ormore metastable solid states, in addition to the thermody-namically stable one.3,23 These states require a change ofcrystal structure in the solid in order to be transformed and inpractice can persist for appreciable periods. Their meltingpoints are often quite close to that of the stable form; theseproperties are potentially complicating factors in the inter-pretation of the results of thermal methods. Since their ap-pearance and persistence are reproducible, experimental con-ditions can be established to minimize their effects. Thephase diagrams considered in the present work deal onlywith thermodynamically stable states.
The method of preparation of samples for analysis by ther-mal methods has been found to be important for the estab-lishment of an equilibrium phase diagram. For example,physical mixtures—however finely divided—showed meta-stable eutectics in thermal analytical methods. Prefused mix-tures prepared by solvent evaporation were found to givemore reproducible results. In the present work, only stable
features are reproduced in phase diagrams, but experimentalmetastable ones are mentioned whenever they were reported.
It should be emphasized here that the effects of polymor-phism in drug compounds are of great importance to phar-maceutical chemists, for evident practical reasons. Thepresent analysis is limited to thermodynamically stable statesbecause inclusion of metastable states would greatly enlargethe article and obscure the application of fundamental ther-modynamic relationships.
7. Retrieval and Treatment of Data
Apart from Chemical Abstracts, some compilations13,23,24
were useful in locating phase diagram data. Where the datawere not tabulated, they were read off the published phasediagrams. Both liquidus and solidus data were retrieved, andare shown on the calculated phase diagrams. In general, eu-tectic data and congruent melting points of compounds weregiven somewhat more weight than other liquidus data in theoptimization step, for stated reasons.17 Where the data weresparse or contradictory, some prior decisions were made con-cerning the general shape or features of the phase diagram.These preliminary steps are explained in the evaluations ofindividual systems.
It is pertinent to add that the choice of systems examinedwas governed principally by the existence of phase diagramdata amenable to a thermodynamic analysis of the presenttype. The phase diagrams are illustrative but not meant to be‘‘representative’’ of any particular area of inquiry in phar-maceutical chemistry.
8. Properties of the Pure Substances
Evaluations of the present type require reliable data formelting points and enthalpies of fusion of the pure compo-nents. There are standard handbooks of melting points;3,25–29
information from these will be referred to henceforth as‘‘handbook data.’’ For ethalpies of fusion, two sources weregenerally useful.30,31 In addition to these sources, meltingpoint and enthalpy of fusion data were retrieved from indi-vidual articles; these are mentioned below for each substanceconsidered.
Table 1 presents the data adopted in the present work.Temperatures are quoted to the nearest 0.1 °C, irrespectiveof source, since the precision of experimental phase diagramdata does not warrant citation of hundredths of a degree. Forsimilar reasons, only three significant figures were retainedfor enthalpies of fusion. The larger number of significantfigures given for the entropy of fusion were used for accuratereproduction of adopted melting points; they have no furthersignificance. In what follows, the given name of the drug isaccompanied, in square brackets, by other information: for-mula, Chemical Abstracts Registry Number and other infor-mal names~if any!.
Acetanilide @C8H9NO; 103-84-4; Acetamide, N-phenyl-#.The enthalpy of fusion was reported to be32 20.5 or30,33,34
892892 JAMES SANGSTER
J. Phys. Chem. Ref. Data, Vol. 28, No. 4, 1999

21.7 kJ mol21. The melting point, from handbooks, is113– 115 °C; individual determinations30,33–37 are close to114 °C.
Allobarbital @C10H12N2O3; 52-43-7; 2,4,6~1H,3H,5H! Py-rimidinetrione, 5,5-di~2-propenyl-!; Diadol, Dial#. Handbookdata for the melting point lie in the range 171– 174 °C. Thetrue melting point is probably35 close to 173 °C. The en-thalpy of fusion is38 24.9 or39 32.3 kJ mol21.
4-Aminobenzoic acid@C7H7NO2; 150-13-0; PABA#. Themelting range from handbooks is 187– 189 °C; a value
closer to 188 °C was chosen.30,40The enthalpy of fusion wasreported30,40 as 20.9 or41 24.0 kJ mol21.
Aminophenazone@C13H17N3O; 58-15-1; Pyrazole-3-one,4-~dimethylamino!-1,2-dihydro-1,5-dimethyl-2-phenyl-;aminopyrine, amidopyrine#. The handbook melting point is107– 109 °C, and a value37,42–44 between 107 and 108 °Cwas chosen. There is one value for the enthalpy of fusion.45
4-Aminophenazone@C11H13N3O; 83-07-8; 3H-Pyrazol-3-one, 4-amino-1,2-dihydro-1,5-dimethyl-2-phenyl-#. Hand-books give 109 °C as the melting point, but individualreports35,42,45,46 indicate a temperature closer to 108 °C.There is one value for the enthalpy of fusion.45
Anthranilic acid @C7H7NO2; 118-92-3; Benzoic acid,2-amino-#. The handbook melting range is 144– 148 °C. Amelting point in the lower range30,40 was chosen. The en-thalpy of fusion is the mean of two values.30,40
Aspirin @C9H8O4; 50-78-2; Benzoic acid, 2-~acetyloxy!-;Acetylsalicyclic acid#. The handbook melting point is135 °C, although the freezing point is often quoted to bemuch lower. This was taken to be the correct value.4,47 Thereis no experimental value for the enthalpy of fusion, and so itwas estimated~next section!.
Barbital @C8H12N2O3; 57-44-3; 2,4,6~1H,3H,5H-Pyrimidinetrione, 5,5-diethyl-; Veronal, Barbitone#. Thehandbook melting range is 188– 192 °C, and the adoptedvalue3,5,48is close to 190 °C. The enthalpy of fusion is38 24.4or39 25.0 kJ mol21.
Benzidine @C12H12N2; 92-87-5; @1,18-Biphenyl#-4,48-diamine#. The handbook melting point is 128 °C, and theadopted value is from a phase diagram study.49 The enthalpyof fusion, from the same source, is 19.1 kJ mol21.
Benzocaine@C9H11O2; 94-09-7; Benzoic acid, 4-amino-,ethyl ester; Parathesin#. The melting range from handbooksources is 88– 92 °C. A more accurate value is close32,40,50to90 °C. The enthalpy of fusion lies in the range32,40,50
22.0– 23.6 kJ mol21.Benzoic acid @C7H6O2; 65-85-0#. The chosen melting
point30,40,51is close to the handbook value. The enthalpy offusion is the mean of several determinations.30,40,51,52
Caffeine@C8H10N4O2; 58-08-2; 1H-Purine-2,6-dione, 3,7-dihydro-1,3,7-trimethyl-#. Handbook data for the meltingpoint lie in the range 235– 238 °C. A temperature near236 °C was adopted.30,35The enthalpy of fusion30,32,53valuesare 21.0– 27.7 kJ mol21.
Chlormadinone acetate@C23H29ClO4; 302-22-7; Pregna-4,6-diene-3,20-dione, 17~acetyloxy!-6-chloro-#. Handbooksindicate 212– 214 °C as the melting point. The adopted valuewas taken from a recent phase diagram study.54 Since thereis no experimental value for the enthalpy of fusion it wasestimated~next section!.
Estradiol benzoate@C25H28O3; 50-50-0; Estra-1,3,5~10!-triene-3,7-diol ~17b!, 3-benzoate; Benztrone#. Handbookmelting point data indicate 188– 196 °C, and a value close to192 °C was adopted.55,56The enthalpy of fusion is32 35.9 or55
41.8 kJ mol21.Estradiol phenylpropionate@C27H32O3; 28572-75-0; Estra-
1,3,5~10!-triene-3,7-diol ~17b!, 3-~3-phenylpropionate!#.
TABLE 1. Melting points and fusion properties of the pure compoundsa
Name Tfus , °CD fusH,
kJ mol21D fusS,
J mol21 K21
Acetanilide 114.3 21.3 54.968Allobarbital 173.0 32.3 72.3894-Aminobenzoic acid 188.2 22.5 48.765Aminophenazone 107.5 27.6 72.4984-Aminophenazone 108.3 24.9 65.269Anthranilic acid 145.4 20.5 48.973Aspirin 135.0 ~27.2! ~66.634!Barbital 189.6 24.7 53.371Benzidine 127.0 19.1 47.726Benzocaine 89.7 22.3 61.449Benzoic acid 122.4 17.6 44.489Caffeine 236.3 22.0 43.180Chlormadinone acetate 211.7 ~27.3! ~56.300!Estradiol benzoate 192.4 41.8 89.777Estradiol phenylpropionate 127.2 33.0 82.418Ethinyl estradiol 183.5 27.9 61.090Etofylline 160.6 ~29.6! ~68.234!Hydroquinone 172.3 27.1 60.831Indomethacin 160.3 36.9 85.121Isonicotinamide 157.2 ~24.8! ~57.628!Khellin 153.4 32.3 75.7153-Methoxybenzoic acid 110.5 ~23.8! ~62.028!Nicotinamide 129.3 23.2 57.640Nicotinic acid 237.3 ~27.9! ~54.652!2-Nitroaniline 72.0 16.1 46.6404-Nitroaniline 147.5 21.1 50.1554-Nitrophenol 113.8 18.3 47.287Paracetamol 169.3 30.5 68.927Phenacetin 134.2 33.0 81.001Phenazone 110.6 27.3 71.131Phenobarbital 175.0 27.8 62.026Phenylbutazone 105.6 27.7 73.126Quinine 176.3 ~22.9! ~50.945!Succinimide 123.2 ~25.1! ~63.320!Sulfacetamide 183.9 22.4 49.005Sulfadiazine 257.8 42.6 80.226Sulfamerazine 236.3 38.7 75.957Sulfamethoxazole 169.8 32.2 72.686Sulfamethoxypyridazine 180.9 31.3 68.928Sulfanilamide 165.0 ~26.5! ~60.475!Sulfapyridine 191.3 34.4 74.058Sulfathiazole 201.0 26.4 55.673Sulfisoxazole 195.7 30.2 64.406Theophylline 274.0 29.5 53.911Thiourea 177.0 14.4 31.986Trimethoprim 199.3 49.4 104.550Urea 132.6 14.3 35.239
aData in parentheses were estimated.
893893THERMODYNAMIC PROPERTIES OF BINARY SYSTEMS OF DRUGS
J. Phys. Chem. Ref. Data, Vol. 28, No. 4, 1999

Handbook melting point data give 126– 128 °C, and theadopted value is a mean from two sources.55,56 There is onevalue55 for the enthalpy of fusion.
Ethinyl estradiol @C20H24O2; 57-63-6; 19-Norpregna-1,3,5~10!-trien-20-yne-3,17-diol,~17a!-#. The melting pointdata according to handbooks are not consistent: 145– 146 °Cor 182– 184 °C. The higher temperature is preferred.54 Theenthalpy of fusion was reported to be32,54
22.4– 28.1 kJ mol21.Etofylline @C9H12N4O3; 519-37-9; 1H-Purine-2,6-dione,
3,7-dihydro-7-~2-hydroxyethyl!-1,3-dimethyl-; Oxytheonyl#.The handbook melting point is 158 °C, but the value adoptedis that from a phase diagram study.57 There is no experimen-tal value for the enthalpy of fusion, so it was estimated~nextsection!.
Hydroquinone @C6H6O2; 123-31-9; Benzene, 1,4-dihydroxy-#. The melting range is 172– 179 °C according tohandbooks; a more accurate value was chosen from studieson the pure compound.30,58,59The enthalpy of fusion lies inthe range30,58,6021.1– 27.1 kJ mol21.
Indomethacin@C19H16ClNO4; 53-86-1; 1H-Indole-3-aceticacid, 1-~4-chlorophenyl!-5-methoxy-2-methyl-#. The hand-book melting range is 156– 162 °C and the adopted value61,62
is close to 160 °C. The enthalpy of fusion is63 36.1 or32
37.7 kJ mol21.Isonicotinamide@C6H6N2O; 1453-82-3; 4-Pyridinecarbox-
amide#. The handbook melting point is 155– 156 °C, and theadopted value was taken from a phase diagram study.5 Thereis no experimental value for the enthalpy of fusion, so it wasestimated~next section!.
Khellin @C14H12O5; 82-02-0; 5H-Furo@3,2-g#@1#benzo-pyran-5-one, 4,9-dimethoxy-7-methyl-; Amicardine#. Thehandbook melting range is 153– 155 °C, and the true meltingpoint is probably the lower value.64–66 There is one value65
for the enthalpy of fusion.3-Methoxybenzoic acid@C8H8O3; 586-38-9#. The hand-
book melting point is 110.5 °C, but the chosen value wastaken from a phase diagram study.57 The enthalpy of fusionis not known experimentally, and so it was estimated~nextsection!.
Nicotinamide @C6H6N2O; 98-92-0; 3-Pyridinecarbox-amide; Niacinamide#. Handbooks indicate a melting range of128– 131 °C. The chosen value5,35,67,68 is close to 129 °C.The enthalpy of fusion was reported32 22.8 or14
23.6 kJ mol21. A value68 of 26.1 J mol21 is probably a mis-print.
Nicotinic acid @C6H5NO2; 59-67-6; 3-Pyridinecarboxylicacid#. The melting range from handbooks is 236– 237 °C;the chosen value was adopted from a phase diagram study.67
The enthalpy of fusion, being unknown, was estimated~nextsection!.
2-Nitroaniline @C6H6N2O2; 88-74-4; Benzenamine,2-nitro-#. The experimental melting point range30,40,57 is69– 73 °C and the enthalpy of fusion30,40 is 16.1 kJ mol21.
4-Nitroaniline @C6H6N2O2; 100-01-6; Benzenamine,4-nitro-#. The experimental30,40,57,69 melting range is146– 148 °C. The enthalpy of fusion30 21.1 kJ mol21.
4-Nitrophenol@C6H5NO3; 100-02-7;#. The experimental30
melting range is 112– 114 °C. The enthalpy offusion30,40,70,71lies in the range 17.3– 30.1 kJ mol21.
Paracetamol @C8H9NO2; 103-90-2; Acetamide, N-~4-hydroxyphenyl!-; Acetaminophen#. Handbook data for themelting point indicate 167– 171 °C. The adopted value isfrom careful studies on the pure substance.35,62,72 There isone datum for the enthalpy of fusion.14
Phenacetin @C10H13NO2; 62-44-2: Acetamide, N-~4-ethoxyphenyl!-#. Handbook data for the melting point are134– 138 °C. The lower limit is probably correct.35–37,62,73
The enthalpy of fusion is32,74,7521.8– 34.7 kJ mol21.Phenazone@C11H12N2O; 60-80-0; 3H-Pyrazol-3-one, 1,2-
dihydro-1,5-dimethyl-2-phenyl-; Antipyrine#. According tohandbooks, the melting range is 111– 114 °C. A lower tem-perature was adopted.35,42,46 The enthalpy of fusion is themean of two experimental values.32,45
Phenobarbital@C12H12N2O3; 50-06-6; 2,4,6~1H,3H,5H!-Pyrimidinetrione, 5-ethyl-5-phenyl-; Luminal#. The meltingrange is given as 174– 178 °C in handbooks. The is onevalue38 for their enthalpy of fusion.
Phenylbutazone @C1920N2O2; 50-33-9; 3,5-Pyrazolidinedione, 4-butyl-1,2-diphenyl-; Butadione#. Thehandbook melting range is 105– 107 °C. A low value isindicated.76–78 The enthalpy of fusion lies in therange32,44,77,7826.2– 29.7 kJ mol21.
Quinine @C20H24N2O2; 130-95-0; Cinchonan-9-ol,68-methoxy-, ~8a,9R!-#. The melting range is 176– 177 °C~with some decomposition!, according to handbooks. Thereis no experimental value for the enthalpy of fusion, and so itwas estimated~next section!.
Succinimide@C4H5NO2; 123-56-8; 2,5-Pyrrolidinedione#.The handbook data for melting indicate 125– 127 °C, but alower value was adopted on the basis of more careful workon the pure substance.79,80There is no experimental value forthe enthalpy of fusion, and so it was estimated~next section!.
Sulfacetamide @C8H10N2O3S; 144-80-9; Acetamide,N-@~4-aminophenyl!sulfonyl#-#. Handbook melting point dataindicate 181– 184 °C, and the higher temperature wasadopted.81,82 There is one value81 for the enthalpy of fusion.
Sulfadiazine @C10H10N4O2S; 68-35-9; Benzenesulfona-mide, 4-amino-N-2-pyrimidinyl-#. The melting range accord-ing to handbooks is 252– 262 °C. A value close to 258 °Cwas adopted.10,75,83 The reported enthalpy offusion10,75,81,83,84is 31.2– 43.7 kJ mol21.
Sulfamerazine@C11H12N4O2S; 127-79-7; Benzenesulfona-mide, 4-amino-N-~4-methyl-2-pyrimidinyl!-#. The handbookmelting range range is 234– 238 °C, with some decomposi-tion. A value near 236 °C was adopted.81,85 The enthalpy offusion75,81,84,85is 31.6– 45.8 kJ mol21.
Sulfamethoxazole@C10H11N3O3S; 723-46-6; Benzene-sulfonamide, 4-amino-N-~5-methyl-3-isoxazolyl!-#. Themelting range according to handbooks is 167– 173 °C. Thechosen value10,83,86 is near 170 °C. The enthalpy of fusionis84 28.7 or10,86 32.2 kJ mol21.
Sulfamethoxypyridazine@C11H12N4O3S; 80-35-3; Ben-zenesulfonamide, 4-amino-N-~6-methoxy-3-pyridazinyl!-#.
894894 JAMES SANGSTER
J. Phys. Chem. Ref. Data, Vol. 28, No. 4, 1999

Handbook data for the melting point indicate 180– 183 °C,and a value near the lower is probably accurate.10,81,83,87Theenthalpy of fusion10,81,83,87,88 lies in the range29.0– 32.6 kJ mol21.
Sulfanilamide @C6H8N2O2S; 63-74-1; Benzenesulfona-mide, 4-amino-#. The handbook data indicate 164– 167 °C asthe melting range, and 165 °C was adopted.76,82 Since thereis no experimental value for the enthalpy of fusion, it wasestimated~next section!.
Sulfapyridine @C11H11N3O2S; 144-83-2; Benzenesulfona-mide, 4-amino-N-2-pyridinyl-#. The handbook melting rangeis 191– 193 °C. The adopted value35,64 is close to 191 °C.The enthalpy of fusion is the mean of two measurements.32,81
Sulfathiazole @C9H9N3O2S2; 72-14-0; Benzenesulfona-mide, 4-amino-N-2-thiazolyl-#. The melting range accordingto handbooks is 200– 204 °C. A value close to the lowerlimit was adopted.23,75,76,84The enthalpy of fusion lies in therange23,75,8424.1– 28.9 kJ mol21.
Sulfisoxazole@C11H13N3O3S; 127-69-5; Benzenesulfona-mide, 4-amino-N-~3,4-dimethyl-5-isoxazolyl!-#. Handbookdata indicate 194– 198 °C for the melting range. The adoptedvalue was taken from experimental results.81,84 The enthalpyof fusion is the mean of two measurements.81,84
Theophylline @C7H8N4O2; 58-55-9; 1H-Purine-2,6-dione,3,7-dihydro-1,3-dimethyl-#. The melting range is268– 274 °C according to handbooks. The adopted value41,72
is the upper limit. There is one datum41 for the enthalpy offusion.
Thiourea@CH4N2S; 62-56-6#. The handbook data indicate175– 182 °C as the melting range. An otherwise reliablecompilation40 states 172.4 °C. The adopted value was takenfrom a phase diagram measurement.43 There is one datum40
for the enthalpy of fusion.Trimethoprim @C14H18N4O3; 738-70-5; 2,4-
Pyrimidinediamine, 5-@~3,4,5-trimethoxyphenyl!methyl#-#.Handbook data for the melting point are 199– 203 °C. Theadopted value is close to the lower limit.10,83,86There is onevalue for the enthalpy of fusion.10
Urea @CH4N2O; 57-13-6#. The handbook melting point is132.6 °C, while a survey of phase diagram measurementsgave a range of 130– 134 °C, perhaps with somedecomposition.89 The enthalpy of fusion foundexperimentally30,90–93lies in the range 13.0– 15.5 kJ mol21.
It should be mentioned that no claim is made concerningthe ultimate accuracy of the data in Table 1. The aim was toobtain reasonably accurate data for the purpose of calculatingphase diagrams.
9. Estimation of Enthalpy of Fusion
For some compounds in Table 1, experimental enthalpiesof fusion were unavailable and so they were estimated byone of several methods, described here.
For chemically simpler molecules, a group-contributionmethod94 is useful. The enthalpy of fusion of aspirin wasestimated by this method.
In Sec. 4, Eq.~1! relates the limiting liquidus slope in aphase diagram to the enthalpy of fusion of a pure component.Thus a phase diagram can be a source of experimental datafor the enthalpy of fusion. In choosing phase diagram datafor this purpose, attention was paid to the overall quality ofthe phase diagram data and to the possibility that the initialslope was obscured by deviations caused by large nonideali-ties of the liquid phase. The enthalpies of fusion of the fol-lowing substances were found in this way~the reference in-dicates the source of the phase diagram data!: succinimide,80
nicotinic acid,95,96 sulfanilamide,97 quinine98 and chlormadi-none acetate.54
It is a commonly observed fact that the entropies of fusionof chemically and structurally similar organic compounds arealso similar. This approximation was exploited in the estima-tion of the enthalpy of fusion of three substances. Thus, forisonicotinamide, the experimental entropy of fusion of the3-isomer~nicotinamide! is 57.64 J mol21 K21. Using the re-lation D fusH5TfusD fusS, one obtains (430.4)(57.64)524.8 kJ mol21. For 3-methoxybenzoic acid, the entropy offusion of the 4-isomer40 is 62.04 J mol21 K21, where the re-quired datum is 23.8 kJ mol21. For etofylline, the availableentropy of fusion99 was that for 8-ethyltheophylline,68.23 J mol21 K21, where the required datum is29.6 kJ mol21.
The uncertainty in these estimated data is about620%.This is greater than experimental error in, for example, DSCmeasurements. The effect of this uncertainty in the calcula-tion of phase diagrams~Figs. 1–60! is to add incrementallyto the uncertainty in deduced excess Gibbs energy of theliquid and thermodynamic properties of intermediate com-pounds. The main features of the diagram are not affected. Inthe binary systems sulfanilamide-benzocaine, sulfanilamide-4-aminobenzoic acid and chlormadinone acetate-ethinyl es-tradiol, the enthalpy of fusion of one component was derivedfrom the phase diagram under thermodynamic analysis. Inthese cases there is a slight circularity in the thermodynamicargument, which, however, had little practical effect.
10. Temperature Dependence of Enthalpyof Fusion
In the present work, phase diagrams are calculated on theassumption that the enthalpies of fusion of pure componentsare independent of temperature. This is equivalent to assum-ing that the heat capacities of solid and liquid are the same atall temperatures. This is, of course, not strictly true. Themagnitude of the error in consequence of this assumptionmay be seen from a specific example. The heat capacities ofliquid and solid benzocaine have been measured near themelting point.50 At the melting point, the given data are50
Tfus589.7 °C ~362.9 K!, ~2!
D fusH522 300 J mol21, ~3!
D fusS561.449 J mol21 K21, ~4!
895895THERMODYNAMIC PROPERTIES OF BINARY SYSTEMS OF DRUGS
J. Phys. Chem. Ref. Data, Vol. 28, No. 4, 1999

and the heat capacity data are:for the solid
Cp518.9510.724T J mol21 K21 ~T<Tfus!, ~5!
Cp5134.410.406T J mol21 K21 ~T>Tfus!, ~6!
for the liquid
Cp568.410.724T J mol21 K21 ~T<Tfus!, ~7!
Cp5183.810.906T J mol21 K21 ~T>Tfus!, ~8!
whereT is in Kelvin. In Eqs.~5!–~8! it has been assumedthat the heat capacity curve of a phase beyond its normalrange of existence is parallel to that of the other phase.50 Theenthalpy and entropy of fusion at different temperatures canbe calculated from thermodynamic first principles, using thegiven data of Eqs.~2!–~8!. The behavior is summarized inTable 2, which shows that both enthalpy and entropy of fu-sion vary with temperature in a well-behaved fashion. Thepractical consequence of assuming temperature indepen-dence will manifest itself as an incremental error in the de-rived excess Gibbs energy of the liquid and thermodynamicproperties of intermediate compounds. The main features ofthe phase diagram will remain unaffected.
11. Thermodynamic Analysis andPresentation of Results
For each binary system, the source and identity of the dataare indicated, together with any stated information on eutec-
tic, peritectic or transition points. If there are intermediatecompounds, stoichiometry, enthalpy of fusion, meltingpoints or other information are mentioned, according tosources. The reported phase diagram data points are includedin the calculated phase diagram; metastable transitions, ifany, are mentioned but do not appear on the diagram. Thegeneral aspect of the phase diagram is noted, along with anoverall assessment of data quality~scatter, adherence to ther-modynamic constraints, etc.!. Preliminary calculations andassumptions made prior to optimization, if any, are stated.The results of the calculation, in addition to the phase dia-gram, are given as calculated eutectic and peritectic tempera-tures and compositions, or melting points of congruent com-pounds. Calculated thermodynamic data are also presented:these include the Gibbs energy of fusion and of formation~from the pure liquids! of any intermediate compounds, aswell as the excess Gibbs energy of the liquid. These quanti-ties are designatedD fusG
o, D fGo and GE( l ), respectively.
When the given data are sparse or contradictory, the probablenature of the phase diagram is discussed in the light of gen-eral thermodynamic principles and behavior of similar sys-tems. Finally, an estimate of the uncertainty in the calculateddiagram is made, indicating the degree of confidence appro-priate to the calculations in each case.
Where there are more than one eutectic in a system, theymay be referred to asE1 , E2 , etc., in the discussion forindividual systems; peritectics are indicated byP.
In the present article, no far-reaching claims are made con-cerning the ultimate correctness of the calculated phase dia-
FIG. 1. The system phenazone~A!1phenylbutazone~B!.
TABLE 2. The temperature dependence of the enthalpy and entropy of fusion of benzocainea
Tfus250 Tfus220 Tfus Tfus120 Tfus150
D fusH, J mol21 19 832 21 315 22 300 23 293 24 774D fusS, J mol21 K21 54.135 58.661 61.449 64.113 67.837
aSee Ref. 50.
896896 JAMES SANGSTER
J. Phys. Chem. Ref. Data, Vol. 28, No. 4, 1999
grams presented. This contribution represents the applicationof necessary thermodynamic constraints and consequentphase diagram interpretation which are pertinent for theanalysis of solid–liquid equilibria generally.
12. Analysis of Phase Diagrams
12.1. Phenazone „A…1Phenylbutazone „B…
Data were obtained by DTA.100 No eutectic informationwas stated. In the optimization, the eutectic data were pref-erentially weighted, as the liquidus data by themselves en-tailed a higher eutectic temperature than that observed. Thephase diagram, Fig. 1, was calculated with the use of Eq.~9!
GE~ l !5xAxB~12782810xB! J mol21 ~9!
and the calculated eutectic is 82.5 °C,xB50.550. An uncer-tainty of 64° may be assigned to the diagram.
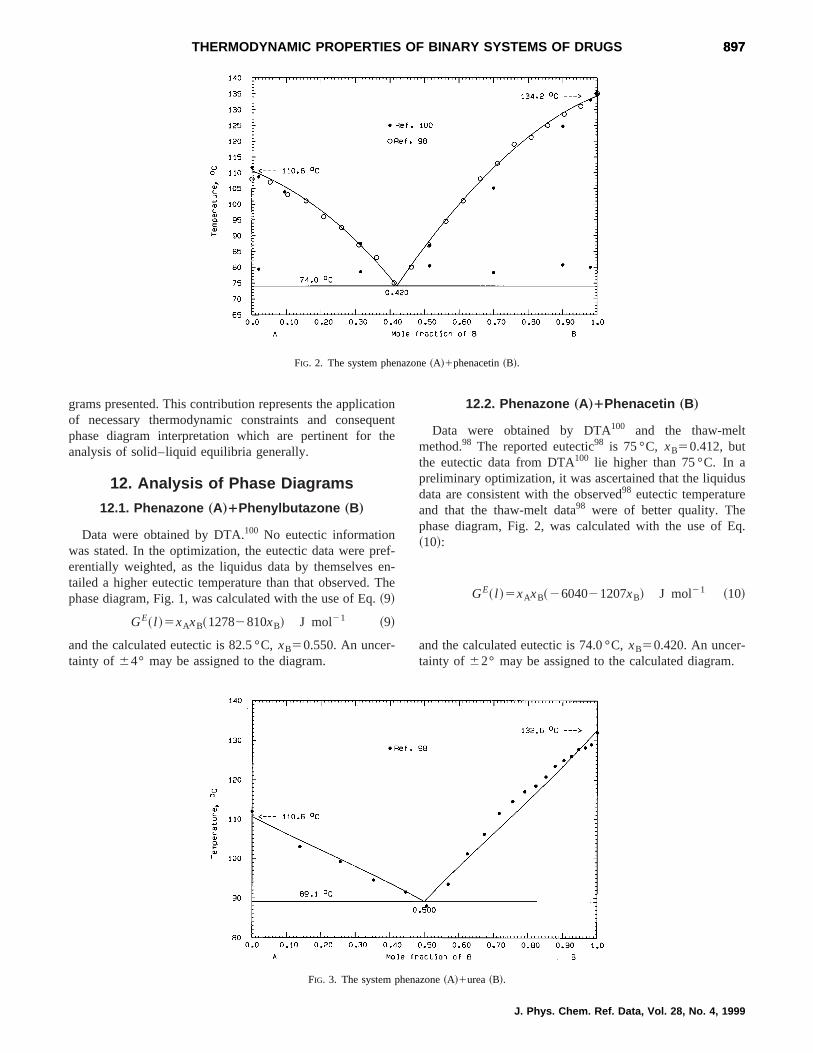
12.2. Phenazone „A…1Phenacetin „B…
Data were obtained by DTA100 and the thaw-meltmethod.98 The reported eutectic98 is 75 °C, xB50.412, butthe eutectic data from DTA100 lie higher than 75 °C. In apreliminary optimization, it was ascertained that the liquidusdata are consistent with the observed98 eutectic temperatureand that the thaw-melt data98 were of better quality. Thephase diagram, Fig. 2, was calculated with the use of Eq.~10!:
GE~ l !5xAxB~2604021207xB! J mol21 ~10!
and the calculated eutectic is 74.0 °C,xB50.420. An uncer-tainty of 62° may be assigned to the calculated diagram.
FIG. 2. The system phenazone~A!1phenacetin~B!.
FIG. 3. The system phenazone~A!1urea~B!.
897897THERMODYNAMIC PROPERTIES OF BINARY SYSTEMS OF DRUGS
J. Phys. Chem. Ref. Data, Vol. 28, No. 4, 1999

12.3. Phenazone „A…1Urea „B…
Data were obtained by the thaw-melt method.98 The re-ported eutectic is 87 °C,xB50.533. All the liquidus datawere optimized to give
GE~ l !52215xAxB J mol21 ~11!
and the calculated phase diagram is given in Fig. 3. Thecalculated eutectic is 89.1 °C,xB50.500. An uncertainty of62° may be assigned to the calculated diagram.
12.4. Paracetamol „A…1Phenazone „B…
Data for the phase diagram were obtained by DTA usingfused and physical mixtures.8 Only the data from fused mix-tures are considered here and are shown in the calculatedphase diagram. These data consisted of a number of thermo-
gram traces and a phase diagram with smoothed phaseboundaries~no data points!. The reported eutectic8 is 83 °C,xB50.76; the existence of a 1:1 congruently melting com-pound melting at 107 °C was considered possible. For thecalculated phase diagram, the thermogram data were con-verted to liquidus, eutectic and peritectic data points and areshown on the phase diagram. An optimization was per-formed under the assumption of a eutectic temperature of83 °C and the existence of a 1:1 compound. The phase dia-gram, Fig. 4, was calculated with the use of Eq.~12!
GE~ l !5xAxB~213 122824000xB! J mol21, ~12!
and the thermodynamic properties of the compound AB/2are
D fusGo523 091260.3926T J mol21, ~13!
FIG. 4. The system paracetamol~A!1phenazone~B!.
FIG. 5. The system sulfadiazine~A!1trimethoprim~B!.
898898 JAMES SANGSTER
J. Phys. Chem. Ref. Data, Vol. 28, No. 4, 1999

D fGo5226 872154.6314T J mol21. ~14!
The calculated eutectics are 107.8 °C,xB50.438 and83.6 °C,xB50.756. The 1:1 compound melts congruently at109.2 °C. An uncertainty of63° may be assigned to thecalculated diagram.
12.5. Sulfadiazine „A…1Trimethoprim „B…
Data were obtained by DSC83 ~the same data also appearin another publication10!. The reported eutectic10,83 is189.5 °C, xB50.75, although the plotted data10,83 show aeutectic temperature of 185.6 °C. The phase diagram, Fig. 5,was calculated with the use of Eq.~15!
GE~ l !5xAxB~28522546xB! J mol21, ~15!
and the calculated eutectic is 185.7 °C,xB50.737. An un-certainty of62° may be assigned to the calculated diagram.
12.6. Sulfamethoxazole „A…1Trimethoprim „B…
Phase diagram data were obtained by DSC.86 The reportedeutectics are 157.3 °C,xB50.17 and 177.9 °C,xB50.61.The 1:1 compound melted congruently at 180.2 °C. Thecompound was synthesized by mixing equimolar amounts ofthe components in water; the enthalpy of fusion of the drycompound was measured as 41.4 kJ mol21. The isolatedcompound was examined by photomicroscopy, x-ray diffrac-tion and IR spectroscopy. The 1:1 compound101 is ortho-rhombic, a51.2055 nm, b52.4476 nm, c51.7423 nm,space group Pbca,Z58. All liquidus data were optimized,with the result
FIG. 6. The system sulfamethoxazole~A!1trimethoprim~B!.
FIG. 7. The system benzoic acid~A!1trimethoprim~B!.
899899THERMODYNAMIC PROPERTIES OF BINARY SYSTEMS OF DRUGS
J. Phys. Chem. Ref. Data, Vol. 28, No. 4, 1999

GE~ l !5xAxB~228001450xB! J mol21 ~16!
for the liquid, and for the compound AB/2
D fusGo521 124246.5950T J mol21, ~17!
D fGo5221 768140.8322T J mol21. ~18!
The calculated eutectics are 157.3 °C,xB50.199 and177.9 °C,xB50.604. The compound melts at 180.2 °C; thecalculated phase diagram is shown in Fig. 6. Some of theexperimental liquidus data lie too high for thermodynamicconsistency. An uncertainty of61° may be assigned to thecalculated diagram.
12.7. Benzoic Acid „A…1Trimethoprim „B…
Phase diagram data were obtained by DSC.51 The reportedeutectics areE15106.8 °C, xB50.14; E25132.5 °C, xB
50.37; E35145.0 °C,xB50.52. There are two intermediatecompounds, 2:1 and 1:1 melting congruently at 134.2 and145.9 °C, respectively. The 1:1 compound was prepared bymixing stoichiometric amounts of components in water ormethanol or ethyl acetate. The 2:1 compound was also syn-thesized in the same way in water or diethyleneglycol solu-tion. The 2:1 compound also has a metastable melting pointof 126.5 °C. The enthalpies of fusion of the compounds weremeasured as 52.3 and 56.1 kJ mol21, respectively. X-ray andIR spectra were obtained for both compounds. The 1:1 com-pound is monoclinic, a51.1295 nm, b52.8266 nm, c50.6543 nm,b5100.97°, space groupP21 /N, Z54. Thestable form of the 2:1 compound is triclinic,a51.4595 nm,b51.0195 nm, c50.9455 nm, a589.67°, b597.37°, g5104.6°, space groupP1 or PT , Z52. A thermal event,observed at 120.2 °C, was possibly a metastable eutectic be-tween the 2:1 compound and trimethoprim.51
All liquidus data were optimized, with the result
GE~ l !5xAxB~21800214 527xB123 746xB2 ! J mol21
~19!
for the liquid. For the compound AB/2,
D fusGo515 422236.8663T J mol21, ~20!
D fGo5220 254131.1035T J mol21, ~21!
and for A2B/3
D fusGo518 450245.2920T J mol21, ~22!
D fGo5222 940140.0000T J mol21. ~23!
The calculated eutectics~Fig. 7! are E15107.2 °C, xB
50.134; E25132.5 °C, xB50.382; E35145.0 °C, xB
50.513. The calculated melting points of compounds are134.2 °C and 145.2 °C. Most of the experimental liquidusdata are shown to be consistent except for a few in themiddle range. An uncertainty of61° may be assigned to thecalculated diagram.
12.8. Sulfamethoxypyridazine „A…
1Trimethoprim „B…
Data were obtained by DSC83 ~the same data also appearin another publication10!. The reported eutectics are162.0 °C, xB50.29 and 168.8 °C,xB50.51. A metastableeutectic 148.4 °C was observed. The 1:1 compound meltscongruently at 169.5 °C, and its enthalpy of fusion is72.3 kJ mol21. It was synthesized10 from equimolar mixturesin 95% ethanol, methanol or water. X-ray and IR spectrawere also taken.10 All liquidus data were optimized, and theexperimental eutectic temperatures were weighted preferen-tially. For the liquid, the result is
GE~ l !522555xAxB J mol21 ~24!
and for the compound AB/2
D fusGo530 234268.3507T J mol21, ~25!
D fGo5230 873162.5896T J mol21. ~26!
The calculated phase diagram is shown in Fig. 8. The calcu-
FIG. 8. The system sulfamethoxypyridazine~A!1trimethoprim~B!.
900900 JAMES SANGSTER
J. Phys. Chem. Ref. Data, Vol. 28, No. 4, 1999

lated data areE5161.3 °C, xB50.275 andP5169.2 °C,xB50.494. Within experimental uncertainty, the compoundcould be either congruently or incongruently melting. Theexperimental liquidus data are well reproduced. An uncer-tainty of 61° may be assigned to the calculated diagram.
12.9. Aminophenazone „A…14-Aminophenazone „B…
Phase diagram data were obtained by DSC, DTA and themicrothermal methods.46 The reported eutectic is 79 °C,xB
50.50. The eutectic mixture was examined by photomicros-copy. The liquidus data from the three methods are in verygood agreement, and not all are shown on the phase diagram.From the optimization, the result is
GE~ l !5xAxB~24821657xB! J mol21, ~27!
and the calculated phase diagram appears in Fig. 9. The li-
quidus data are consistent with a slightly lower calculatedeutectic, 78.0 °C,xB50.500. An uncertainty of62° may beassigned to the phase diagram.
12.10. Aminophenazone „A…1Phenacetin „B…
Data were obtained by DTA100 and no eutectic data werestated. All liquidus data were optimized, with preferentialweighting for the observed eutectic temperature. For the liq-uid,
GE~ l !5xAxB~2511215066xB! J mol21 ~28!
and the calculated phase diagram is shown in Fig. 10. Thecalculated eutectic is 82.0 °C,xB50.320. An uncertainty of63° may be assigned to the calculated diagram.
FIG. 9. The system aminophenazone~A!14-aminophenazone.
FIG. 10. The system aminophenazone~A!1phenacetin~B!.
901901THERMODYNAMIC PROPERTIES OF BINARY SYSTEMS OF DRUGS
J. Phys. Chem. Ref. Data, Vol. 28, No. 4, 1999

12.11. Aminophenazone „A…1Phenylbutazone „B…
Data were obtained by DTA,100 and no eutectic data werestated. There is scatter in the observed eutectic arrests. Allthe liquidus data were optimized, with preferential weightingof a eutectic temperature given by data near the eutecticcomposition. For the liquid,
GE~ l !5xAxB~4151489xB! J mol21 ~29!
and the calculated phase diagram is shown in Fig. 11. Thecalculated eutectic is 80.8 °C,xB50.500. An uncertainty of64° may be assigned to the calculated diagram.
12.12. Aminophenazone „A…1Phenazone „B…
Liquidus data were obtained by DSC46, DTA46,100and hot-stage microscopy.46 Data obtained by the three methods werein good agreement. The observed eutectic46 is 81.2 °C, xB
50.48. The eutectic mixture was examined byphotomicroscopy.46 In the optimization, all liquidus datawere weighted equally, and the result is
GE~ l !5xAxB~21681950xB! J mol21. ~30!
The calculated phase diagram is shown in Fig. 12, with acalculated eutectic of 81.6 °C,xB50.463. It is apparent thatthe older data46 are of better quality than the other. An un-certainty of61° may be assigned to the calculated diagram.
12.13. Thiourea „A… and Aminophenazone „B…
Data were obtained by DSC and light transmission43 andare in good agreement. The reported eutectic is 92 °C,xB
50.73 and peritectic 138 °C,xB50.27. From x-ray diffrac-tion spectra, the stoichiometry of the compound was found tobe 3:1. Optimization of liquidus data resulted in Eq.~31!
FIG. 11. The system aminophenazone~A!1phenylbutazone A~B!.
FIG. 12. The system aminophenazone~A!1phenazone~B!.
902902 JAMES SANGSTER
J. Phys. Chem. Ref. Data, Vol. 28, No. 4, 1999

GE~ l !5xAxB~1342150xB! J mol21. ~31!
For the liquid, and for the compound A3B/4
D fusGo512 198229.5956T, ~32!
D fGo5212 180124.9217T. ~33!
The calculated diagram appears in Fig. 13 and the calculatedinvariant points are
E593.0 °C, xB50.310.
The experimental data are well reproduced and an uncer-tainty of 61° may be assigned to the calculated diagram.
12.14. Urea „A…1Aminophenazone „B…
Data were obtained by DSC and light transmission43 andare in good agreement. The reported eutectics areE1
5125 °C,xB50.21 andE2597.5 °C,xB50.80. A 3:1 com-pound melts congruently at 125 °C. The limiting liquidusslope at the left hand side~LHS! definitely suggests somesolid solubility there, although none was mentioned by theinvestigators.43 Some liquidus data atxB.0.5 proved to begrossly inaccurate. TheE1 and compound melting tempera-tures were evidently very close. In these circumstances, itwas decided to construct a phase diagram using Eq.~34!
GE~ l !50, ~34!
and a solid solution with properties such that the calculatedE1 temperature would be near the observed datum. The ther-modynamic properties of the compounds could not be ob-tained from optimization, and hence reasonable values wereassigned for A3B/4:
D fusGo528 000270.0000T J mol21, ~35!
FIG. 13. The system thiourea~A!1aminophenazone~B!.
FIG. 14. The system urea~A!1aminophenazone~B!. Part of the diagram is conjectural.
903903THERMODYNAMIC PROPERTIES OF BINARY SYSTEMS OF DRUGS
J. Phys. Chem. Ref. Data, Vol. 28, No. 4, 1999

D fGo5228 000165.3248T J mol21. ~36!
The solid solution based on urea was represented by a Hen-rian activity coefficient independent of temperature given by
RT ln gB550 J mol21. ~37!
The calculated phase diagram is given in Fig. 14, and thecalculated eutectics areE15126.8 °C, xB50.176; E2
597.5 °C,xB50.790. The compound melts at 126.8 °C andthe solid solution extends to 11.5 mole % at the eutectic tem-perature. The entire phase diagram is suggestive only.
12.15. Aminophenazone „A…1Allobarbital „B…
Data were obtained by the thaw-melt method from physi-cal and fused mixtures57 ~only data from fused mixtures areshown in the phase diagram!. No invariant points werestated, but the presence of an incongruently melting 1:1 com-
pound was postulated. The compound was synthesized fromstoichiometric quantities of components in water solution.There was a metastable eutectic57 at about 80 °C. All liqui-dus data were used in the optimization, with preferentialweighting for observed eutectic and peritectic temperatures.For the liquid, the result was
GE~ l !5xAxB~2422725722xB18323xB2 ! J mol21,
~38!
and for the compound AB/2
D fusGo516 563243.7452T J mol21, ~39!
D fGo5217 815137.9840T J mol21. ~40!
The calculated phase diagram is shown in Fig. 15. The cal-
FIG. 15. The system aminophenazone~A!1allobarbital~B!.
FIG. 16. The system aminophenazone~A!1barbital ~B!.
904904 JAMES SANGSTER
J. Phys. Chem. Ref. Data, Vol. 28, No. 4, 1999

culated invariant points areE589.6 °C, xB50.275 andP598.6 °C, xB50.352. An uncertainty of62° may be as-signed to the calculated diagram.
12.16. Aminophenazone „A…1Barbital „B…
Data were obtained by the thaw-melt method with bothfused and solvent-evaporated mixtures.5 The results from thetwo series are in good agreement. No invariant points werestated, but a metastable eutectic at about 88 °C was ob-served. A 1:1 compound, which was synthesized fromequimolar amounts of components in water solution, meltedincongruently. All liquidus data were optimized, with theresult
GE~ l !5xAxB~245831636xB14905xB2 ! J mol21
~41!
for the liquid and
D fusGo525 170264.6175T J mol21, ~42!
D fGo5225 930158.8563T J mol21 ~43!
for the compound AB/2. The calculated phase diagram ap-pears in Fig. 16, and the calculated invariant points areE595.5 °C, xB50.190 andP5113.0 °C, xB50.366. The li-quidus data are well reproduced. An uncertainty of62° maybe assigned to the calculated diagram.
12.17. Aminophenazone „A…1Sulfisoxazole „B…
Data were obtained by the thaw-melt method on both usedand solvent-evaporated mixtures.5 The data from the two se-ries are in good agreement. No invariant points were statedby the authors, but a metastable eutectic at about 82 °C wasmentioned. The 1:1 compound was synthesized fromequimolar amounts of components in water solution; DTA
on this compound indicated an incongruent melting point of115.6 °C. An optimization was performed on all the liquidusdata, with the results
GE~ l !5xAxB~213 908110 207xB! J mol21 ~44!
for the liquid and
D fusGo532 267282.5133T J mol21, ~45!
D fGo5234 468176.7521T J mol21 ~46!
for the compound AB/2. The calculated phase diagram isshown in Fig. 17 and the calculated eutectic is 89.8 °C,xB
50.183; peritectic 115.5 °C,xB50.393. The experimentalliquidus data are well reproduced and an uncertainty of62°may be assigned to the calculated diagram.
12.18. 3-Methoxybenzoic Acid „A…1Etofylline „B…
Data were obtained by the thaw-melt method57 with bothphysical and fused mixtures~only the results for fused mix-tures are shown on the diagram!. No invariant points werestated, but a metastable eutectic at about 85 °C was ob-served. A 1:1 compound melts incongruently. All liquidusdata were optimized, with the results
GE~ l !5xAxB~2549714288xB! J mol21, ~47!
for the liquid and
D fusGo522 526260.0322T J mol21, ~48!
D fGo5223 364154.2694T J mol21 ~49!
for the compound AB/2. The calculated phase diagram isshown in Fig. 18, and the calculated data areE589.0 °C,xB50.249 andP598.0 °C,xB50.358. The experimental li-quidus data are well reproduced~the experimental meltingpoint of 3-methoxybenzoic acid is 4° too low! and an uncer-tainty of 61° may be assigned to the calculated diagram.
FIG. 17. The system aminophenazone~A!1sulfisoxazole~B!.
905905THERMODYNAMIC PROPERTIES OF BINARY SYSTEMS OF DRUGS
J. Phys. Chem. Ref. Data, Vol. 28, No. 4, 1999

12.19. Benzoic Acid „A…1Etofylline „B…
Data were obtained by the thaw-melt method57 on physi-cal, fused and solvent-evaporated mixtures~only results fromfused and solvent-evaporated mixtures are shown on thephase diagram!. A metastable eutectic at about 94 °C wasobserved, but no other invariant point information was given.A 1:1 compound melts incongruently. All liquidus data wereoptimized. For the liquid,
GE~ l !5xAxB~21891742xB! J mol21, ~50!
and for the compound AB/2
D fusGo518 581248.5705T J mol21, ~51!
D fusGo5218 961142.8093T J mol21 ~52!
were derived. The calculated phase diagram appears in Fig.19 and calculated invariant points areE598.5 °C, xB
50.257; P5106.4 °C, xB50.367. An uncertainty of62°may be assigned to the calculated phase diagram.
12.20. Aminophenazone „A…1Etofylline „B…
Data were obtained by the thaw-melt method57 on bothphysical and fused mixtures~only fused mixture data areshown on the phase diagram!. A metastable eutectic of101 °C was reported, but no other information was offered.The liquidus data could be fit very well by an expression
GE~ l !5xAxB~293421029xB12729xB2 ! J mol21
~53!
and the calculated phase diagram is shown in Fig. 20. Theliquidus data entail a eutectic 101.8 °C,xB50.142; this tem-perature is significantly above the experimental datum
FIG. 18. The system 3-methoxybenzoic acid~A!1etofylline ~B!.
FIG. 19. The system benzoic acid~A!1etofylline ~B!.
906906 JAMES SANGSTER
J. Phys. Chem. Ref. Data, Vol. 28, No. 4, 1999

(98 °C) but the phase boundaries shown in Fig. 20 are ther-modynamically self-consistent. An uncertainty of62° maybe assigned to the calculated diagram.
12.21. 4-Nitroaniline „A…1Etofylline „B…
Data were obtained with the thaw-melt method57 on physi-cal and fused mixtures~only data from fused mixtures areshown in the phase diagram!. No invariant points were re-ported, but a metastable eutectic at 111 °C was observed, aswell as the existence of an incongruently melting 1:1 com-pound. In a preliminary calculation, it was ascertained thatthe liquidus data entail eutectic and peritectic temperaturesconsistently higher than those observed. For constructing thephase diagram, therefore, these temperatures were preferen-
tially weighted and thermodynamic properties of the com-pound were assigned to reproduce the experimental data asclosely as possible. For the liquid,
GE~ l !5xAxB~28001570xB! J mol21 ~54!
and for the compound AB/2
D fusGo510 121225.7628T J mol21, ~55!
D fGo5210 250120.0000T J mol21. ~56!
The calculated phase diagram is shown in Fig. 21 and thecalculated invariant points areE5115.0 °C,xB50.372 andP5118.0 °C, xB50.422. An uncertainty of62° may beassigned to the calculated diagram.
FIG. 20. The system aminophenazone~A!1etofylline ~B!.
FIG. 21. The system 4-nitroaniline~A!1etofylline ~B!.
907907THERMODYNAMIC PROPERTIES OF BINARY SYSTEMS OF DRUGS
J. Phys. Chem. Ref. Data, Vol. 28, No. 4, 1999

12.22. Benzidine „A…1Etofylline „B…
Data were obtained by the thaw-melt method57 on physicaland fused mixtures~only the fused mixture data are shownon the phase diagram!. A metastable eutectic at about 98 °Cand an incongruently melting 1:1 compound were reported,but no other information. All liquidus data were optimizedwith the results
GE~ l !5xAxB~10027981xB18302xB2 ! J mol21,
~57!
for the liquid and
D fusGo518 932249.7207T J mol21, ~58!
D fGo5219 386143.9596T J mol21 ~59!
for the compound AB/2. The calculated phase diagram isshown in Fig. 22, withE5101.6 °C, xB50.326 and P
5105.4 °C,xB50.395. An uncertainty of62° may be as-signed to the calculated diagram.
12.23. Hydroquinone „A…1Etofylline „B…
Data were obtained by the thaw-melt method57 on bothphysical and fused mixtures~only data from fused mixturesare shown in the phase diagram!. Although no invariantpoint data were stated, metastable eutectics at about 121 °Cand 113 °C and the presence of a congruently melting 3:2compound were mentioned. The liquidus data from physicalmixtures coincided with those from fused mixtures~othertemperature arrests did not!. The liquidus data themselvesentailed eutectic temperatures higher than those observed,and so in the optimization greater weight was given to thesetemperatures. For the liquid,
FIG. 22. The system benzidine~A!1etofylline ~B!.
FIG. 23. The system hydroquinone~A!1etofylline ~B!.
908908 JAMES SANGSTER
J. Phys. Chem. Ref. Data, Vol. 28, No. 4, 1999

GE~ l !5xAxB~218 000111 248xB! J mol21,~60!
and for the compound A3B2/5
D fusGo520 635250.8257T J mol21, ~61!
D fGo5223 875145.2319T J mol21. ~62!
The calculated phase diagram is shown in Fig. 23 and calcu-lated invariant points areE15125.2 °C, xB50.279; E2
5121.3 °C, xB50.578. The compound melts at 132.8 °C.An uncertainty of62° may be assigned to the calculateddiagram.
12.24. 4-Nitrophenol „A…1Etofylline „B…
Data were obtained by the thaw-melt method57 on physicaland fused mixtures~only data from fused mixtures are shown
in the diagram!. Although no invariant point data werestated, a metastable eutectic at about 57 °C and the existenceof a 2:1 congruently melting compound were noted. All li-quidus data were optimized, and the calculated phase dia-gram ~Fig. 24! was constructed with the quantities
GE~ l !5xAxB~215 000110 318xB! J mol21,~63!
and
D fusGo510 064227.8834T J mol21, ~64!
D fGo5212 633122.5949T J mol21 ~65!
for the compound A2B/3. Other calculated data are:E1
577.1°C, xB50.223 andE2585.3 °C, xB50.393. An un-certainty of64° may be assigned to the calculated diagram.
FIG. 24. The system 4-nitrophenol~A!1etofylline ~B!.
FIG. 25. The system phenacetin~A!1urea~B!. The calculated immiscibility envelope is conjectural.
909909THERMODYNAMIC PROPERTIES OF BINARY SYSTEMS OF DRUGS
J. Phys. Chem. Ref. Data, Vol. 28, No. 4, 1999

12.25. Phenacetin „A…1Urea „B…
Data were obtained by the thaw-melt method.98 Liquidusand monotectic data were tabulated, but data defining theliquid miscibility gap were available only as points on aphase diagram. The eutectic was reported to be 129.0 °C,xB50.305, and the liquid miscibility gap lay in the range0.342,xB,0.963. The consolute point, read off the phasediagram, was;164 °C, xB;0.78. It was found that a con-solute temperature as low as that experimentally suggested98
was inconsistent with the remaining~better established! dia-gram. The experimental monotectic temperature (128.7 °C)was well reproduced by the quantity
GE~ l !5xAxB~459115898xB! J mol21 ~66!
and the extent of the miscibility gap, Fig. 25, was 0.284<xB<0.946. The calculated eutectic is 123.7 °C,xB
50.252. The calculated two-liquid envelope is suggestiveonly. An uncertainty of62° may be assigned to the remain-der of the diagram.
12.26. Acetanilide „A…1Phenacetin „B…
Data were obtained by DSC.36 Complete solid solutionwas reported, with a minimum temperature of 80 °C,xB
50.337. It was found, in preliminary calculations, that all theobserved liquidus data were consistent with zero solid solu-bility and the quantity
GE~ l !5xAxB~2890023194xB! J mol21 ~67A!
for the liquid. The reason for the thermal event~s! at ;82 °Cis therefore puzzling. A congruently melting compound inthe middle of the diagram could conceivably account for twoeutectic temperatures near 82 °C; its stoichiometry, however,could not be 1:1. The presence of an incongruently melting
FIG. 26. ~a! The system acetanilide~A!1phenacetin~B!. A possible interpretation of the data.~b! The system acetanilide~A!1phenacetin~B!. Anotherpossible interpretation of the data.
910910 JAMES SANGSTER
J. Phys. Chem. Ref. Data, Vol. 28, No. 4, 1999

compound would be equally unlikely. Suggested calculatedliquidus curves@Fig. 26~a!# meet at a conjectured eutectic;60 °C, xB;0.4.
An alternative construction is possible. The reported36
lowest temperature arrests at;82 °C could be construed asindicating a eutectic temperature; the reported36 ‘‘minimum’’composition, its composition. In this case, the calculatedphase diagram would be that in Fig. 26~b! and the liquidwould be described by
GE~ l !5xAxB~2409012635xB! J mol21.~67B!
Without further information, a more definitive constructioncannot be made.
12.27. Phenacetin „A…1Phenobarbital „B…
Data were obtained by DTA4 and the reported eutectic is114 °C,xB50.33. All liquidus data were optimized, with theresult
GE~ l !5xAxB~2160011300xB! J mol21 ~68!
and the calculated phase diagram is shown in Fig. 27. Thecalculated eutectic is 114.6 °C,xB50.340. An uncertainty of62° may be assigned to the calculated diagram.
12.28. Paracetamol „A…1Phenobarbital „B…
Data were obtained by DTA,4 and the reported eutectic is141 °C, xB50.45. Thermal events at about 139 °C in the
FIG. 27. The system phenacetin~A!1phenobarbital~B!.
FIG. 28. The system paracetamol~A!1phenobarbital~B!.
911911THERMODYNAMIC PROPERTIES OF BINARY SYSTEMS OF DRUGS
J. Phys. Chem. Ref. Data, Vol. 28, No. 4, 1999

range 0.15,xB,0.55 were ascribed tentatively4 to a meta-stable form of phenobarbital. The liquidus data, upon opti-mization, proved to be thermodynamically consistent with aeutectic temperature below that observed:
GE~ l !5xAxB~33911722xB! J mol21 ~69!
as shown in the calculated phase diagram~Fig. 28!; calcu-lated eutectic: 140.0 °C,xB50.450. An uncertainty of61°may be assigned to the calculated diagram.
12.29. Urea „A…1Phenobarbital „B…
Data were obtained by DTA12,102 and thermal analysis~cooling curves!.103 Both physical mixtures102 and fusedsamples12,102,103were used~only data for fused mixtures ap-pear in the diagram!. The reported eutectic is102 111 °C, xB
50.3 or103 106 °C, xB50.3 or12 112 °C, xB50.22. Phasediagram data12,102suggested the presence of a solid solutionbased on phenobarbital; refractive index, photomicrographicanalysis and dissolution rate studies12 also suggested thepresence of a solid solution. The limits of the solid solutionwere given12 as 0.51,xB,1 at the eutectic temperature. Onthe contrary, the phase diagram data and photomicrographicanalysis by other investigators103 claimed no solid solution.
In addition, the existence of an incongruently melting 1:2compound was postulated.102
Both the data and their interpretation are confused. Thephase diagram data themselves are of poor quality. In pre-liminary calculations, it was ascertained that the high eutec-tic temperature and lack of eutectic arrests beyondxB50.6were consistent with a solid solution based on phenobarbital;
FIG. 29. The system urea~A!1phenobarbital~B!. The diagram is conjectural.
FIG. 30. The system theophylline~A!1phenobarbital~B!.
912912 JAMES SANGSTER
J. Phys. Chem. Ref. Data, Vol. 28, No. 4, 1999

there is no justification for the presence of compounds. Forconstruction of the phase diagram, Eq.~70! was assumed
GE~ l !50, ~70!
and the solid solution was assumed to be Henrian; the Hen-rian activity coefficient
RT ln gA54500 J mol21 ~71!
independent of temperature was chosen in order to place theeutectic temperature near the observed data points. The cal-culated phase diagram is shown in Fig. 29, and the calculatedeutectic is 110.6 °C,xB50.216. The solid solution extendsto xB50.756 at the eutectic temperature. The diagram is sug-gestive only.
12.30. Theophylline „A…1Phenobarbital „B…
Data were obtained by DTA4 and the microthermalmethod104 ~smooth line diagram, no data points!. The re-ported eutectics4 are E15248 °C, xB50.25 and E2
5169 °C, xB50.96. There is a 2:1 compound melting con-gruently at4 252 °C. The x-ray diffraction spectra ofmixtures4 at xB50.33 and 0.4 support the existence of acompound. The 2:1 compound was synthesized from alcoholsolution105 with a melting point of 250.7– 251.7 °C. Anotherreport104 indicates the existence of 1:1 and 2:1 compoundsmelting at 254 and 244 °C, respectively. Some thermalevents in the range4 159– 164 °C were thought to be due tometastable transitions of phenobarbital.
A preliminary calculation showed that liquidus data4 atxB.0.6 were inaccurate and no compound was thermody-namically stable. The phase diagram, Fig. 30, was calculatedwith the use of Eq.~72!
GE~ l !5xAxB~2466712000xB! J mol21 ~72!
for the liquid and, for the compound A2B/2,
D fusGo526 563250.7801T J mol21, ~73!
D fGo5227 452145.4498T J mol21. ~74!
Other calculated data are:E15247.1 °C, xB50.232 andE25168.5 °C,xB50.898. The compound melts at 250.3 °C.An uncertainty of64° may be assigned to the calculateddiagram.
12.31. Quinine „A…1Phenobarbital „B…
Data were obtained from DTA measurements on bothphysical and fused mixtures.4 The reported eutectics4 ~fusedmixtures! are E15164 °C, xB50.2 and E25158 °C, xB
50.8. A 1:1 compound melts congruently at 185 °C. Theliquidus data from the physical and fused mixtures agreequite well; the two preparative methods give different eutec-tic temperatures, however. There is a metastable eutectic inthe range 120– 130 °C. X-ray diffraction spectra4 on thepowder confirmed the existence of the 1:1 compound. Thecompound was also synthesized from alcohol solution7,106
and melted at106 182– 183 °C or7 184– 185 °C. The eutecticarrests4 were scattered, and preliminary calculations showedthat both eutectic temperatures from fused mixtures couldnot be reproduced simultaneously. In this case, it was de-cided to place more weight on the liquidus data; the optimi-zation yielded
GE~ l !5xAxB~132925010xB! J mol21, ~75!
for the liquid and
D fusGo518 377240.2038T J mol21, ~76!
D fGo5218 671134.4426T J mol21 ~77!
for the compound AB/2. Calculated data from the phase dia-gram, Fig. 31, areE15165.1 °C, xB50.179 and E2
5156.9 °C, xB50.791. The compound melts at 183.9 °C.The experimental liquidus data are fitted well~uncertainty62°), but alarge uncertainty remains for the eutectics.
FIG. 31. The system quinine~A!1phenobarbital~B!.
913913THERMODYNAMIC PROPERTIES OF BINARY SYSTEMS OF DRUGS
J. Phys. Chem. Ref. Data, Vol. 28, No. 4, 1999

12.32. Caffeine „A…1Phenobarbital „B…
Data were obtained by thermal analysis, DTA and thethaw-melt method.4 The 1:1 compound is described as4 ‘‘in-congruently melting’’ but reference is made exclusively totwo ‘‘eutectic’’ temperatures~the higher should be called‘‘peritectic’’ !. Thermal events between 120 and 130 °C wereascribed4 to metastable eutectics. The eutectic4 is 135~or 138! °C, xB50.67 and the peritectic temperature is 140,141 or 143 °C. A 1:2 compound was prepared107 from aque-ous solution~melting point 145– 146 °C) as well as a 1:1compound~not isolated!. Liquidus data from all three meth-ods agree well on the LHS, and, on the RHS, the DTA andthaw-melt data are concordant; in the central region there ismuch scatter. All liquidus data in the intervals 0,xB,0.5and 0.7,xB,1 were optimized, with the result
GE~ l !526377xAxB J mol21 ~78!
for the liquid and
D fusGo525 380261.4325T J mol21, ~79!
D fGo5226 975155.6714T J mol21 ~80!
for the compound AB/2. The phase diagram, calculated withthe use of Eqs.~78! and ~80!, is shown in Fig. 32; othercalculated data areE5136.1 °C, xB50.633 and P5139.9 °C,xB50.515. An uncertainty of64° may be as-signed to the calculated diagram.
12.33. Aspirin „A…1Phenobarbital „B…
Data were obtained from DTA4 and the reported eutecticis 122 °C,xB50.35. The eutectic data are, in fact, scattered,but the liquidus data are not. Optimization of the liquidusdata yielded the quantity
FIG. 32. The system caffeine~A!1phenobarbital~B!.
FIG. 33. The system aspirin~A!1phenobarbital~B!.
914914 JAMES SANGSTER
J. Phys. Chem. Ref. Data, Vol. 28, No. 4, 1999

GE~ l !5xAxB~271422978xB! J mol21 ~81!
and the calculated phase diagram, Fig. 33, shows a eutectic121.5 °C, xB50.327. An uncertainty of61° may be as-signed to the diagram.
12.34. Sulfanilamide „A…1Phenylbutazone „B…
Data were obtained by DSC and light transmission.76 Thereported eutectic is 99 °C,xB50.91. X-ray diffractograms ofmixtures corresponded to the two components only. The li-quidus data by themselves entail a eutectic temperaturesomewhat higher than that observed. Weighting the eutectictemperature preferentially, the optimization yielded
GE~ l !5xAxB~701625500xB! J mol21 ~82!
and the calculated phase diagram, Fig. 34, shows a eutectic
99.0 °C, xB50.867. The rather high-lying liquidus suggestsincipient liquid immiscibility. An uncertainty of62° maybe assigned to the calculated diagram.
12.35. Khellin „A…1Sulfanilamide „B…
Data were obtained by DSC, DTA and the microthermalmethod.82 Data from the three methods were concordant andnot all are shown on the diagram. The reported eutectics areE15141 °C, xB50.23 andE25146.5 °C,xB50.74; the 1:1compound melts congruently at 151.5 °C. The diagram as awhole could be well reproduced with the quantities
GE~ l !5207xAxB J mol21 ~83!
and
D fusGo524 452257.5227T J mol21, ~84!
FIG. 34. The system sulfaniliamide~A!1phenylbutazone~B!.
FIG. 35. The system khellin~A!1sulfanilamide~B!.
915915THERMODYNAMIC PROPERTIES OF BINARY SYSTEMS OF DRUGS
J. Phys. Chem. Ref. Data, Vol. 28, No. 4, 1999

D fGo5224 400151.7615T J mol21 ~85!
for the compound AB/2. The calculated phase diagram isshown in Fig. 35, and other calculated data areE1
5141.7 °C, xB50.229 andE25146.0°C, xB50.714. Thecompound melts at 151.9 °C. A few liquidus data points areseen to be inconsistent with the rest of the diagram. An un-certainty of61° may be assigned to the calculated diagram.
12.36. Sulfanilamide „A…1Benzocaine „B…
Data were obtained by the thaw-melt method.97 The re-ported eutectic is 82.5 °C,xB50.87. The phase diagram, Fig.36, was calculated with the aid of
GE~ l !5xAxB~312822500xB! J mol21 ~86!
and shows a eutectic of 82.5 °C,xB50.867. An uncertaintyof 61° may be assigned to the calculated diagram.
12.37. Sulfanilamide „A…14-Aminobenzoic Acid „B…
Data were obtained by the thaw-melt method97 and thereported eutectic is 138.5 °C,xB50.38. The phase diagram,Fig. 37, was calculated with the use of Eq.~87!
GE~ l !5xAxB~12001885xB! J mol21 ~87!
and shows a eutectic 138.6 °C,xB50.404. Two liquidus datanearxB50.4 are seen to be inconsistent with the remainingdata. An uncertainty of61° may be assigned to the calcu-lated diagram.
FIG. 36. The system sulfanilamide~A!1benzocaine~B!.
FIG. 37. The system sulfanilamide~A!14-aminobenzoic acid~B!.
916916 JAMES SANGSTER
J. Phys. Chem. Ref. Data, Vol. 28, No. 4, 1999

12.38. Caffeine „A…1Sulfathiazole „B…
Data were obtained by DSC and light transmission.108 Thereported eutectic is 165 °C,xB50.6. X-ray diffraction ofmixtures confirmed the fact that the system is a simple eu-tectic.~A stability constant for an associated species in aque-ous solution was derived from solubility measurements107 at30 °C.) All liquidus data were optimized to give Eq.~88!
GE~ l !5xAxB~107321639xB! J mol21 K21 ~88!
with which the phase diagram, Fig. 38, was calculated. Thecalculated eutectic is 165.1 °C,xB50.601. An uncertainty of61° may be assigned to the calculated diagram.
12.39. Sulfathiazole „A…1Phenylbutazone „B…
Data were obtained by DSC and light transmission.76 Thereported eutectic is 103 °C,xB50.98 and peritectic 160 °C,
xB50.49. X-ray diffraction data on the 2:1 compound atroom temperature were indexed according to triclinic sym-metry, with a51.0403 nm, b51.0673 nm, c51.9628 nm,a582.21°, b599.98°, g5102.36°, Z52. The compoundundergoes a transition at 150 °C, and unindexed diffractiondata were obtained for the high temperature form. A meta-stable eutectic was observed at 94 °C. All liquidus data wereoptimized, with the results
GE~ l !5xAxB~69011500xB22500xB2 ! J mol21,
~89!
and
D fusGo516 106236.7147T J mol21, ~90!
D fGo5215 903131.4227T J mol21 ~91!
FIG. 38. The system caffeine~A!1sulfathiazole~B!.
FIG. 39. The system sulfathiazole~A!1phenylbutazone~B!.
917917THERMODYNAMIC PROPERTIES OF BINARY SYSTEMS OF DRUGS
J. Phys. Chem. Ref. Data, Vol. 28, No. 4, 1999

for the compound A2B/3. The calculated enthalpy of transi-tion of the compound is 17 241 J mol21. The calculatedphase diagram is shown in Fig. 39, and calculated dataE5103.0 °C,xB50.943;P5160.0 °C,xB50.520. The calcu-lated transition appears on the liquidus at 150.0 °C,xB
50.641. An uncertainty of61° may be assigned to the cal-culated diagram.
12.40. Phenazone „A…1Sulfathiazole „B…
Data were obtained by DSC and light transmission.108 Thereported eutectics areE1599 °C, xB50.17 and E2
5133 °C,xB50.53. The 1:1 compound melts congruently at135 °C. X-ray diffraction data on the compound were in-dexed according to monoclinic symmetry:a51.2669 nm,b
51.2590 nm, c51.3941 nm, b5105.18°, Z54, spacegroupP21 /c. All liquidus data were optimized with the re-sult
GE~ l !5xAxB~211 34625387xB18769xB2 ! J mol21
~92!
for the liquid and
D fusGo525 155261.6288T J mol21, ~93!
D fGo5228 117155.8677T J mol21 ~94!
for the compound AB/2. The calculated phase diagram isshown in Fig. 40, with eutecticsE1598.0 °C, xB50.174;E25133.8 °C,xB50.559. The compound melts at 135.0 °C.An uncertainty of61° may be assigned to the calculateddiagram.
FIG. 40. The system phenazone~A!1sulfathiazole~B!.
FIG. 41. The system sulfathiazole~A!1benzocaine~B!.
918918 JAMES SANGSTER
J. Phys. Chem. Ref. Data, Vol. 28, No. 4, 1999

12.41. Sulfathiazole „A…1Benzocaine „B…
Data were obtained by the thaw-melt method97 and thereported eutectic is 86 °C,xB50.96. In a preliminary calcu-lation, it was ascertained that the liquidus data were consis-tent with a eutectic temperature slightly above that observed.The phase diagram, Fig. 41, was calculated with the use ofEq. ~95!
GE~ l !5xAxB~220011157xB21477xB2 ! J mol21
~95!
and shows a calculated eutectic of 86.6 °C,xB50.936. Anuncertainty of62° may be assigned to the calculated dia-gram.
12.42. Sulfathiazole „A…14-Aminobenzoic Acid „B…
Data were obtained by the thaw-melt method97 and thereported eutectic is 150 °C,xB50.57. All data were opti-mized to give the expression
GE~ l !5507xAxB J mol21 ~96!
and the calculated phase diagram appears in Fig. 42. Thecalculated eutectic is 150.1 °C,xB50.574. A few experi-mental liquidus points are obviously faulty. An uncertaintyof 61° may be assigned to the calculated diagram.
FIG. 42. The system sulfathiazole~A!14-aminobenzoic acid~B!.
FIG. 43. The system nicotinamide~A!1theophylline~B!.
919919THERMODYNAMIC PROPERTIES OF BINARY SYSTEMS OF DRUGS
J. Phys. Chem. Ref. Data, Vol. 28, No. 4, 1999

12.43. Nicotinamide „A…1Theophylline „B…
Data were obtained by the thaw-melt method on physicaland fused mixtures57 ~only data for fused mixtures are shownon the diagram!. No invariant points were mentioned, butthere is an incongruently melting 2:1 compound. All liquidusdata were optimized and Eq.~97!
GE~ l !521377xAxB J mol21 ~97!
represented the liquid and
D fusGo512 006227.0777T J mol21, ~98!
D fGo5212 350121.7892T J mol21 ~99!
the compound A2B/3. The calculated phase diagram appearsin Fig. 43 and other calculated data areE5125.7 °C, xB
50.060; P5169.9 °C, xB50.266. An uncertainty of63°may be assigned to the calculated diagram.
12.44. Nicotinamide „A…1Indomethacin „B…
Data were obtained by hot-stage microscopy.11 Sampleswere prepared from fused mixtures and two~of 5 and 10wt %! from solvent-evaporated mixtures. A metastable eutec-tic at 83 °C and a stable one at 107 °C were reported. A solidsolution based on nicotinamide was postulated, together withtwo incongruently melting compounds~1:1 and 1:2!. IR
FIG. 44. The system nicotinamide~A!1indomethacin~B!. Most of the diagram is conjectural.
FIG. 45. The system nicotinamide~A!1sulfamerazine~B!.
920920 JAMES SANGSTER
J. Phys. Chem. Ref. Data, Vol. 28, No. 4, 1999

spectra of mixtures and UV spectra of aqueous mixtureswere claimed to yield results confirming the existence ofcomplexes, as did solubility studies.
The liquidus data are sparse and of poor quality. Prelimi-nary calculations showed that a solid solution based on nico-tinamide was not needed. For construction of a phase dia-gram a eutectic temperature near 107 °C was assumed. A 1:1compound proved to be possible thermodynamically, butstable only in a narrow temperature range. For the liquid, Eq.~100! was used
GE~ l !5xAxB~2147511933xB! J mol21 ~100!
and for the compound AB/2
D fusGo59787224.4798T J mol21, ~101!
D fGo529914118.7186T J mol21. ~102!
The calculated phase diagram appears in Fig. 44. The calcu-lated eutectic is 108.9 °C,xB50.271; the two peritectics are113.5 °C,xB50.303 and 117.9 °C,xB50.337. The behaviorof the compound is consistent with the presence of two ob-served peritectic temperatures, but the diagram remains con-jectural.
12.45. Nicotinamide „A…1Sulfamerazine „B…
Data were obtained by the thaw-melt method.5 Physical,fused and solvent-evaporated mixtures were used. Only datafrom fused mixtures are shown in the diagram. No invariantpoints were stated, but a metastable eutectic at 123 °C wasreported and also the presence of an incongruently melting
FIG. 46. The system khellin~A!1sulfapyridine~B!.
FIG. 47. The system khellin~A!1nicotinic acid~B!.
921921THERMODYNAMIC PROPERTIES OF BINARY SYSTEMS OF DRUGS
J. Phys. Chem. Ref. Data, Vol. 28, No. 4, 1999

3:2 compound. The compound was synthesized in and iso-lated from acetone solution. All liquidus data from fusedmixtures were optimized, with the result
GE~ l !5xAxB~26881517xB! J mol21 ~103!
for the liquid and
D fusGo526 955262.9912T J mol21, ~104!
D fGo5227 071157.3974T J mol21 ~105!
for the compound A3B2/5. The calculated phased diagram isshown in Fig. 45. Calculated data areE5125.9 °C, xB
50.056 andP5143.3 °C, xB50.145. An uncertainty of61° may be assigned to the calculated diagram.
12.46. Khellin „A…1Sulfapyridine „B…
Data were obtained by DTA, DSC and lighttransmission;64 results from the three methods were concor-dant. The reported eutectic is 138.5 °C,xB50.32. Sampleswere also examined photomicrographically. Optimization ofthe liquidus data yielded the expression
GE~ l !5461xAxB J mol21, ~106!
and the phase diagram calculated with this quantity is shownin Fig. 46. The calculated eutectic is 138.2 °C,xB50.296.An uncertainty of62° may be assigned to the calculateddiagram.
FIG. 48. The system urea~A!1khellin ~B!.
FIG. 49. The system khellin~A!1caffeine~B!.
922922 JAMES SANGSTER
J. Phys. Chem. Ref. Data, Vol. 28, No. 4, 1999

12.47. Khellin „A…1Nicotinic Acid „B…
Data were obtained by DSC and thermal microscopy67 andresults from both methods are in good agreement. The samedata are reported elsewhere.109 The reported eutectic is142 °C,xB50.18. Samples were also examined photomicro-scopically. Nicotinic acid displayed a solid transformation at184 °C ~not shown on the diagram!. The liquidus data wereoptimized to give
GE~ l !5xAxB~240013000xB! J mol21, ~107!
and the phase diagram calculated with this quantity is shownin Fig. 47. The calculated eutectic is 142.5 °C,xB50.194.The RHS experimental liquidus data show erratic changes ofslope; the calculated liquidus is probably closer to true be-havior. An uncertainty of64° may be assigned to the cal-culated diagram.
12.48. Urea „A…1Khellin „B…
Data were obtained by DTA and the Boetius microheatingtable.109 Two eutectic temperatures were reported: 120 and146 °C; the existence of a congruently melting 1:1 com-pound (163 °C) was also suggested. Although the data arevery scattered, it proved possible to construct a reasonablephase diagram with the use of Eq.~108!
GE~ l !5xAxB~2635014800xB! J mol21 ~108!
for the liquid and
D fusGo529 617267.8994T J mol21, ~109!
D fGo5230 605162.1366T J mol21 ~110!
for the compound AB/2. The calculated phase diagram isshown in Fig. 48. The calculated eutectics areE1
5120.0 °C, xB50.100 andE25146.0 °C, xB50.840. Thecompound melts at 163.0 °C. An uncertainty of610° maybe assigned to the calculated diagram.
12.49. Khellin „A…1Caffeine „B…
Data were obtained by DSC, DTA and thermalmicrocopy.64 The data for the three methods are in goodagreement. The reported eutectic is 146.0 °C,xB50.13 andperitectic 164.5 °C,xB50.48~1:1 compound!. Samples werealso examined by photomicroscopy. The best fit to the datawas obtained with the use of Eq.~111! for the liquid
GE~ l !521784xAxB J mol21, ~111!
and
D fusGo539 554290.3864T J mol21, ~112!
D fGo5240 000184.6252T J mol21 ~113!
for the compound AB/2. The calculated phase diagram isgiven in Fig. 49; other calculated data areE5146.6 °C,xB
50.131 andP5164.4 °C, xB50.483. An uncertainty of62° may be assigned to the calculated diagram.
12.50. Khellin „A…1Nicotinamide „B…
Data were obtained by DSC and thermomicroscopy.67,110
The two methods gave concordant results. The existence of a1:1 compound was demonstrated by x-ray diffraction mea-surements; in the report, it is described as melting incongru-ently (P5133 °C, xB50.5). From the liquidus data them-selves, however, it is difficult, if not impossible, to ascertainwhether the compound melts congruently or incongruently.In preliminary calculations, it became evident that the liqui-dus data were thermodynamically consistent with a congru-ent melting behavior. The excess Gibbs energy of the liquidis given by
GE~ l !5xAxB~250021100xB! J mol21, ~114!
and the compound AB/2 is represented by
D fusGo537 872292.8271T J mol21, ~115!
FIG. 50. The system khellin~A!1nicotinamide~B!.
923923THERMODYNAMIC PROPERTIES OF BINARY SYSTEMS OF DRUGS
J. Phys. Chem. Ref. Data, Vol. 28, No. 4, 1999

D fGo5237 384187.0660T J mol21. ~116!
The calculated phase diagram appears in Fig. 50. The calcu-lated eutectics areE15134.6 °C, xB50.440 and E2
5120.6 °C,xB50.865. The melting point of the compoundis 134.8 °C, almost identical to theE1 temperature. An un-certainty of62° may be assigned to the calculated diagram.
12.51. Khellin „A…1Sulfacetamide „B…
Data were obtained by DSC, DTA and thermalmicroscopy.82 Samples were also examined by photomicros-copy. There is a 1:1 compound melting incongruently (P5149 °C, xB50.45; E5137.5 °C,xB50.21). A metastableeutectic at 124 °C was also reported. As presented, the RHSliquidus data impart a peculiar kinked shape to the curvethere; the RHS data, in fact, suggest strong positive nonide-ality in the liquid. The LHS liquidus is normal. The quantity
GE~ l !5xAxB~24916114758xB28695xB2 ! J mol21
~117!
allowed the RHS liquidus kink to be approximated. For thecompound AB/2,
D fusGo540 772296.5716T J mol21, ~118!
D fGo5240 700190.8104T J mol21. ~119!
The calculated phase diagram is shown in Fig. 51. Calculateddata are E5137.6 °C, xB50.198 and P5149.0 °C, xB
50.472. The true shape of the RHS liquidus may be differ-ent. An uncertainty of63° may be assigned to the calcu-lated diagram.
FIG. 51. The system khellin~A!1sulfacetamide~B!.
FIG. 52. The system theophylline~A!1paracetamol~B!.
924924 JAMES SANGSTER
J. Phys. Chem. Ref. Data, Vol. 28, No. 4, 1999
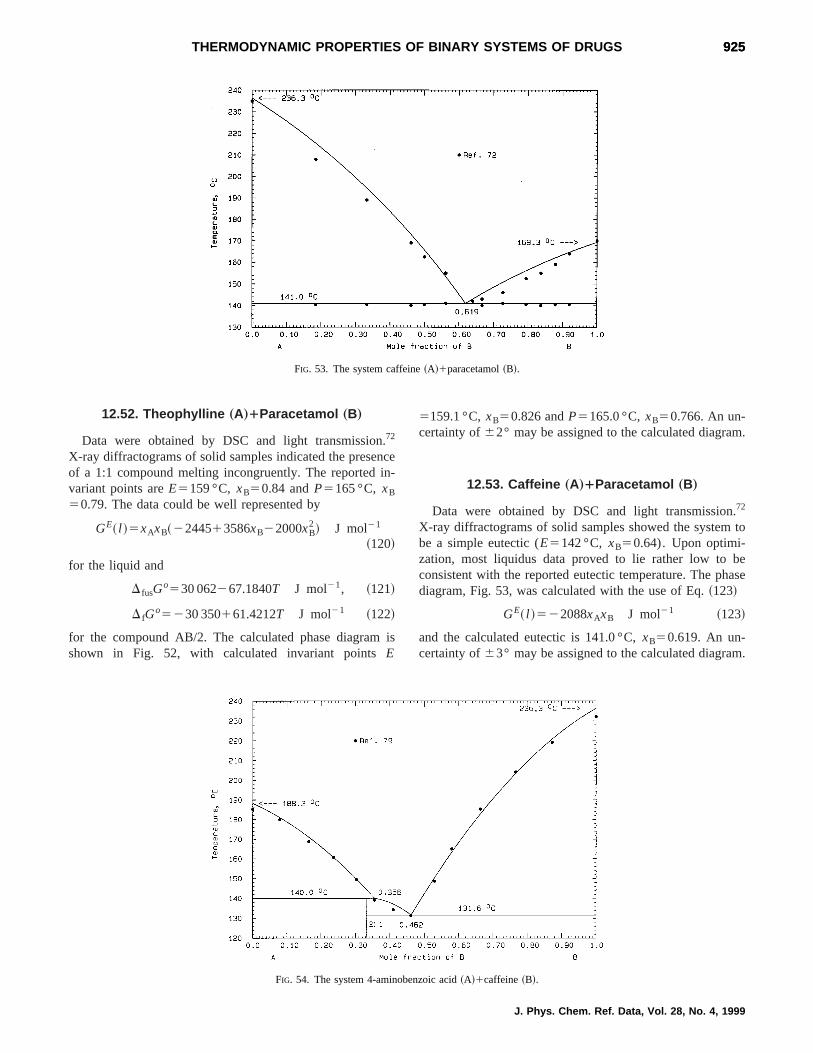
12.52. Theophylline „A…1Paracetamol „B…
Data were obtained by DSC and light transmission.72
X-ray diffractograms of solid samples indicated the presenceof a 1:1 compound melting incongruently. The reported in-variant points areE5159 °C, xB50.84 andP5165 °C, xB
50.79. The data could be well represented by
GE~ l !5xAxB~2244513586xB22000xB2 ! J mol21
~120!
for the liquid and
D fusGo530 062267.1840T J mol21, ~121!
D fGo5230 350161.4212T J mol21 ~122!
for the compound AB/2. The calculated phase diagram isshown in Fig. 52, with calculated invariant pointsE
5159.1 °C,xB50.826 andP5165.0 °C,xB50.766. An un-certainty of62° may be assigned to the calculated diagram.
12.53. Caffeine „A…1Paracetamol „B…
Data were obtained by DSC and light transmission.72
X-ray diffractograms of solid samples showed the system tobe a simple eutectic (E5142 °C, xB50.64). Upon optimi-zation, most liquidus data proved to lie rather low to beconsistent with the reported eutectic temperature. The phasediagram, Fig. 53, was calculated with the use of Eq.~123!
GE~ l !522088xAxB J mol21 ~123!
and the calculated eutectic is 141.0 °C,xB50.619. An un-certainty of63° may be assigned to the calculated diagram.
FIG. 53. The system caffeine~A!1paracetamol~B!.
FIG. 54. The system 4-aminobenzoic acid~A!1caffeine~B!.
925925THERMODYNAMIC PROPERTIES OF BINARY SYSTEMS OF DRUGS
J. Phys. Chem. Ref. Data, Vol. 28, No. 4, 1999

12.54. 4-Aminobenzoic Acid „A…1Caffeine „B…
Data were obtained by DTA79 and the investigators re-ported the presence of an incongruently melting 2:1 com-pound (P5133 °C,E5128 °C). There was a metastable eu-tectic at 116 °C. A 1:1 compound,107 isolated from aqueoussolution, melted at 70– 71 °C. The data could be well repre-sented by
GE~ l !526644xAxB J mol21 ~124!
for the liquid and
D fusGo510 766226.0439T J mol21, ~125!
D fGo5212 242120.7519T J mol21 ~126!
for the compound A2B/3. The calculated phase diagram isshown in Fig. 54 (P5140.0 °C, xB50.356; E5131.6 °C,xB50.462). An uncertainty of63° may be assigned to thecalculated diagram.
12.55. Anthranilic Acid „A…1Caffeine „B…
Data were obtained by the thaw-melt method on physicaland fused mixtures57 ~only data from fused mixtures areshown on the diagram!. There is a 1:1 compound meltingincongruently and a metastable eutectic at;89 °C. All theliquidus data for fused mixtures were optimized to give
GE~ l !5xAxB~2814622330xB14918xB2! J mol21
~127!
FIG. 55. The system anthranilic acid~A!1caffeine~B!.
FIG. 56. The system benzoic acid~A!1isonicotinamide~B!. The existence of the 2:1 compound is debatable.
926926 JAMES SANGSTER
J. Phys. Chem. Ref. Data, Vol. 28, No. 4, 1999

for the liquid and
D fusGo515 544241.0043T J mol21, ~128!
D fGo5217 564135.2415T J mol21 ~129!
for the compound AB/2. The calculated phase diagram isshown in Fig. 55, with calculated dataE596.6 °C, xB
50.346 andP5101.0 °C, xB50.388. An uncertainty of62° may be assigned to the calculated diagram.
12.56. Benzoic Acid „A…1Isonicotinamide „B…
Data were obtained by the thaw-melt method.5 There is acongruently melting 1:1 compound, and a metastable eutec-tic at ;115 °C. Thermal activity in the range 0.25,xB
,0.5 suggested the presence of another compound, possibly
2:1 ~incongruent!. This may be a metastable compound. Inpreliminary calculations, it was ascertained that the expres-sions
GE~ l !521712xAxB J mol21 ~130!
for the liquid and
D fusGo526 822261.5704T J mol21, ~131!
D fGo5227 250155.8092T J mol21 ~132!
for the compound AB/2 could establish the RHS eutectic andthe melting point of the 1:1 compound quite accurately. TheLHS eutectic temperature could be reproduced with the pres-ence of the 2:1 compound, whose assigned~not optimized!properties are
D fusGo527 334265.2920T J mol21, ~133!
FIG. 57. The system 2-nitroaniline~A!14-aminobenzoic acid~B!.
FIG. 58. The system succinimide~A!1urea~B!.
927927THERMODYNAMIC PROPERTIES OF BINARY SYSTEMS OF DRUGS
J. Phys. Chem. Ref. Data, Vol. 28, No. 4, 1999
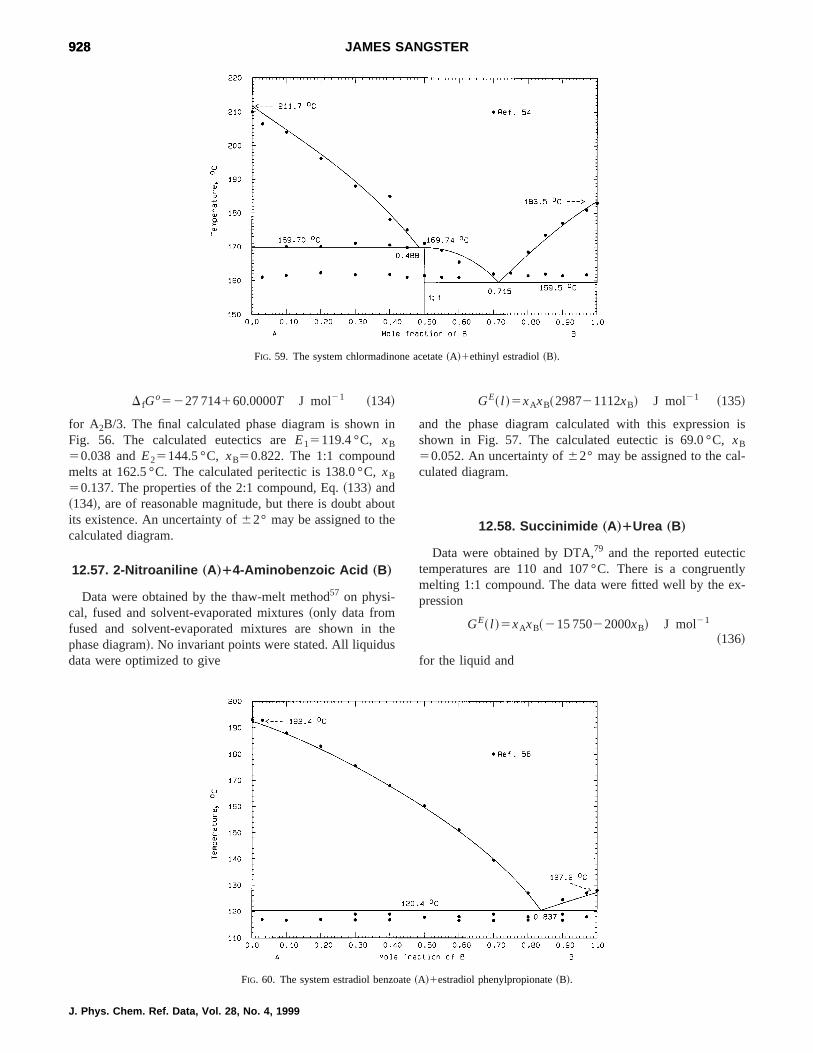
D fGo5227 714160.0000T J mol21 ~134!
for A2B/3. The final calculated phase diagram is shown inFig. 56. The calculated eutectics areE15119.4 °C, xB
50.038 andE25144.5 °C, xB50.822. The 1:1 compoundmelts at 162.5 °C. The calculated peritectic is 138.0 °C,xB
50.137. The properties of the 2:1 compound, Eq.~133! and~134!, are of reasonable magnitude, but there is doubt aboutits existence. An uncertainty of62° may be assigned to thecalculated diagram.
12.57. 2-Nitroaniline „A…14-Aminobenzoic Acid „B…
Data were obtained by the thaw-melt method57 on physi-cal, fused and solvent-evaporated mixtures~only data fromfused and solvent-evaporated mixtures are shown in thephase diagram!. No invariant points were stated. All liquidusdata were optimized to give
GE~ l !5xAxB~298721112xB! J mol21 ~135!
and the phase diagram calculated with this expression isshown in Fig. 57. The calculated eutectic is 69.0 °C,xB
50.052. An uncertainty of62° may be assigned to the cal-culated diagram.
12.58. Succinimide „A…1Urea „B…
Data were obtained by DTA,79 and the reported eutectictemperatures are 110 and 107 °C. There is a congruentlymelting 1:1 compound. The data were fitted well by the ex-pression
GE~ l !5xAxB~215 75022000xB! J mol21
~136!
for the liquid and
FIG. 59. The system chlormadinone acetate~A!1ethinyl estradiol~B!.
FIG. 60. The system estradiol benzoate~A!1estradiol phenylpropionate~B!.
928928 JAMES SANGSTER
J. Phys. Chem. Ref. Data, Vol. 28, No. 4, 1999

D fusGo558 8632145.8652T J mol21, ~137!
D fGo5263 0511140.1040T J mol21 ~138!
for the compound AB/2. The calculated diagram is shown inFig. 58 and calculated data areE15110.0 °C,xB50.149 andE25107.1 °C,xB50.855. The compound melts at 130.4 °C.The excess Gibbs energy of the liquid, Eq.~136!, is verynegative and the entropy of fusion of the compound, Eq.~137!, is rather large compared to other systems examined inthis work. Nevertheless the experimental data are faithfullyreproduced. An uncertainty of61° may be assigned to thecalculated diagram.
12.59. Chlormadinone Acetate „A…1EthinylEstradiol „B…
Data were obtained by DSC, light transmission and ther-mal microscopy.54 The results of of these three methods areconcordant. The presence of a 1:1 compound was confirmedby x-ray diffraction on solid samples, as well as by photo-micrographic examination. A peritectic temperature of170 °C and a eutectic 160 °C,xB50.75 were reported. Ther-mal events near 140 °C were attributed to metastable transi-tions. From the experimental data it is difficult, if not impos-sible, to decide whether the compound melts congruently orincongruently. Optimization of the liquidus data resulted inEq. ~139!
GE~ l !5xAxB~25922426xB! J mol21 ~139!
for the liquid and
D fusGo520 004245.1648T J mol21, ~140!
D fGo5220 292139.4036T J mol21 ~141!
for the compound AB/2. The calculated phase diagram isshown in Fig. 59. The compound is shown to melt congru-ently at 169.74 °C, but theE1 eutectic (169.70 °C,xB
50.488) is so close that the congruency of melting of thecompound is still uncertain. On the RHS,E25159.5 °C,xB
50.715. An uncertainty of62° may be assigned to the cal-culated diagram.
12.60. Estradiol Benzoate „A…1EstradiolPhenylpropionate „B…
Data were obtained by DSC and thermomicroscopy.56 Thereported eutectic is 118 °C,xB50.85. This temperature cor-responds to thermal arrests from DSC; those from thermalmicroscopy were slightly lower. The liquidus data from thetwo methods were generally concordant within 1°. The li-quidus data, when optimized, yielded the quantity
GE~ l !5xAxB~2182511583xB! J mol21 ~142!
and the phase diagram, calculated by means of this equation,is shown in Fig. 60. The liquidus data are fitted well, and thecalculated eutectic is 120.4 °C,xB50.837. The calculatedeutectic temperature is significantly higher than the experi-mental datum, but is thermodynamically consistent with the
liquidus data. In this case, the liquidus data were taken as thedefining data. An uncertainty of62° may be assigned to thecalculated diagram.
13. Acknowledgments
Thanks are due to Professor C. W. Bale and Professor A.D. Pelton, Center for Research in Computational Thermo-chemistry, Ecole Polytechnique de Montre´al, for use of com-puting facilities
14. References
1J. W. Shell, J. Pharm. Sci.52, 100 ~1963!.2A. Watanabe, Y. Yamaoka, and K. Takada, Chem. Pharm. Bull.30, 2958~1982!.
3M. Kuhnert-Brandsta¨tter, Thermomicroscopy in the Analysis of Pharma-ceuticals~Pergamon, Oxford, 1985!.
4J. K. Guillory, S. C. Hwang, and J. L. Lach, J. Pharm. Sci.58, 301~1969!.
5K. Sekiguchi, I. Himuro, I Horikoshi, T. Tsukada, T. Okamoto, and T.Yotsuyanagi, Chem. Pharm. Bull.17, 191 ~1969!.
6C. Caramella, F. Giordano, G. P. Bettinetti, P. Colombo, and U. Corte,Farmaco Ed. Prat.35, 277 ~1980!.
7W. N. French and J. C. Morrison, J. Pharm. Sci.54, 1133~1965!.8D. J. W. Grant, H. Jacobson, J. E. Fairbrother, and C. G. Patel, Int. J.Pharm.5, 109 ~1980!.
9K. Sekiguchi and K. Ito, Chem. Pharm. Bull.13, 405 ~1965!.10G. Bettinetti and F. Giordano, Drug Dev. Ind. Pharm.14, 431 ~1988!.11A. G. Eshra, V. F. Naggar, and N. A. Boraie, Pharm. Ind.48, 1557
~1986!.12H. M. El-Banna, S. Abd-Elfattah, and N. A. Daabis, Pharmazie29, 396
~1974!.13H. Wollmann and V. Braun, Pharmazie38, 5 ~1983!.14E. E. Marti, Thermochimica Acta5, 173 ~1972!.15J. Sangster and A. D. Pelton, J. Phys. Chem. Ref. Data16, 509 ~1987!.16J. Sangster, P. K. Talley, C. W. Bale, and A. D. Pelton, Can. J. Chem.
Eng.66, 881 ~1988!.17J. Sangster, J. Phys. Chem. Ref. Data23, 295 ~1994!.18P. Wu and A. D. Pelton, J. Alloys Comp.179, 259 ~1992!.19J. Sangster, J. Phase Equil.14, 340 ~1993!.20A. D. Pelton, ‘‘Phase Diagrams,’’ Eds.,Physical Metallurgy, Chap. 2,
3rd ed., edited by R. W. Cahn and P. Haasen~North-Holland, New York,1981!.
21J. Jacques, A. Collet, and S. H. Wilen,Enantiomers, Racemates andResolutions~Wiley-Interscience, New York, 1981!.
22W. T. Thompson, C. W. Bale, and A. D. Pelton, F*A*C*T ~Facility forthe Analysis of Chemical Thermodynamics!. ProgramsFITBIN and POT-
COMP ~McGill University, Montreal, 1985!.23E. E. Marti, J. Thermal Anal.33, 37 ~1988!.24J. Wisniak,Phase Diagrams: A Literature Source Book~Elsevier, New
York, 1981/1986!, Vols. I and II.25Dictionary of Organic Compounds, 6th ed., edited by J. Buckingham and
F. MacDonald~Chapman and Hall, London, 1996!.26The Merck Index, 12th ed., edited by S. Budavari~Merck and Company,
Whitehouse Station, 1996!.27J. Elks and C. R. Ganellin,Dictionary of Drugs ~Chapman and Hall,
London, 1990!, Vols. I and II.28Handbook of Chemistry and Physics, 73rd ed., edited by D. R. Lide
~Chemical Rubber Corp., Boca Raton, FL, 1992!.29Heat Capacities and Entropies of Organic Compounds, 2nd ed., edited
by R. C. Weast and J. G. Grasselli~Chemical Rubber Corp., Boca Raton,FL, 1989!.
30E. S. Domalski and E. D. Hearing, J. Phys. Chem. Ref. Data25, 1 ~1996!.31W. E. Acree, in Ref. 28, pp. 5–97.32L. T. Grady, S. E. Hays, R. H. King, H. R. Klein, W. J. Mader, D. K.
Wyatt, and E. O. Zimmerer, J. Pharm. Sci.62, 456 ~1973!.33R. J. L. Andon and J. E. Connett, Thermochim. Acta42, 241 ~1980!.
929929THERMODYNAMIC PROPERTIES OF BINARY SYSTEMS OF DRUGS
J. Phys. Chem. Ref. Data, Vol. 28, No. 4, 1999

34J. E. Connett, J. Calorim. Therm.~Prepr.! 10, E1.1 ~1979!.35D. Giron-Forest, C. Goldbloom, and P. Piechon, J. Pharm. Pharmacol.7,
1421 ~1989!.36M. Macy and M. A. Valerdi, Mater. Chem. Phys.8, 259 ~1983!.37A. A. Van Dooren and B. W. Mu¨ller, Thermochim. Acta66, 161~1983!.38C. Treiner, C. Vaution, and G. N. Cave, J. Pharm. Pharmacol.34, 538
~1986!.39A. Chauvet, G. De Maury, A. Terol, and J. Masse, Thermochim. Acta97,
143 ~1986!.40W. E. Acree, Thermochim. Acta189, 37 ~1991!.41H.-M. Lin and R. A. Nash, J. Pharm. Sci.82, 1018~1993!.42J. Masse and A. Chauvet, J. Thermal Anal.14, 313 ~1978!.43A. Terol, A. Chauvet, and G. De Maury, J. Thermal Anal.32, 1253
~1987!.44A. Chauvet, R. Malaviolle, and J. Masse, Trav. Soc. Pharm. Montpellier
37, 217 ~1977!.45J. Masse and A. Chauvet, Talanta26, 1019~1979!.46J. Masse and A. Chauvet, J. Thermal Anal.14, 299 ~1978!.47E. Fukuoka, M. Makita, and S. Yamamura, Chem. Pharm. Bull.37, 1047
~1989!.48K. Nikolics, S. Gal, J. Sztatisz, and K. Nikolics, Acta Pharm. Hung.46,
205 ~1976!.49U. S. Rai and S. George, Cryst. Res. Technol.26, 511 ~1991!.50S. H. Neau and G. L. Flynn, Pharm. Res.7, 1157~1990!.51G. P. Bettinetti, C. Caramella, F. Giordano, A. La Manna, C. Margheritis,
and C. Sinistri, J. Thermal Anal.28, 285 ~1983!.52B. L. Sharma, N. K. Sharma, and M. Rambal, Thermochim. Acta206, 71
~1992!.53P. V. Babilev and V. V. Chiripitko, Farm. Zh.~Kiev! 2, 61 ~1985!.54G. De Maury, A. Chauvet, A. Terol, and J. Masse, Thermochim. Acta89,
203 ~1985!.55G. De Maury, A. Chauvet, and J. Masse, Thermochim. Acta87, 189
~1985!.56G. De Maury, A. Terol, and J. Masse, J. Thermal Anal.32, 121 ~1987!.57K. Sekiguchi, Y. Ueda, and Y. Nakamori, Chem. Pharm. Bull.11, 1108
~1963!.58P. Bret-Dibat and A. Lichanot, Thermochim. Acta147, 261 ~1989!.59N. G. Buckman, J. O. Hill, and R. G. Magee, J. Thermal Anal.37, 79
~1991!.60W. E. Acree, Thermochim. Acta219, 97 ~1993!.61Z. Gałdecki, M. L. Głowka, and Z. Go´rkiewicz, Acta Polon. Pharm.34,
521 ~1977!.62M. Draguet-Brughmans and R. Bouche´, J. Thermal Anal.20, 141~1981!.63N. Kaneniwa, M. Otsuka, and T. Hayashi, Chem. Pharm. Bull.33, 3447
~1985!.64J. Masse, R. Malaviolle, and A. Chauvet, J. Thermal Anal.16, 123
~1979!.65J. Masse, R. Malaviolle, and A. Chauvet, J. Thermal Anal.16, 341
~1979!.66A. Chauvet, A. Terol, G. De Maury, R. Malaviolle, and J. Masse, Ther-
mochim. Acta147, 217 ~1989!.67R. Malaviolle, G. De Maury, A. Chauvet, A. Terol, and J. Masse, Ther-
mochim. Acta121, 283 ~1988!.68M. S. L’vova, N. I. Garber, and E. I. Kozlov, J. Thermal Anal.33, 1231
~1988!.69R. Palepu and L. Moore, Thermochim. Acta30, 384 ~1979!.70R. Sabbah and M. Gouali, Aust. J. Chem.47, 1651~1994!.71J. R. Donnelly, L. A. Drewes, R. L. Johnson, W. D. Munslow, K. K.
Knapp, and G. W. Sovocool, Thermochim. Acta167, 155 ~1990!.72B. Jeanjean, S. Alberola, A. Terol, F. Sabon, and B. Pauvert, Ann.
Pharm. Fr.37, 95 ~1979!.
73S. V. Gritsenko, G. M. Dugacheva, N. V. Avramenko, L. I. Brutko, andA. G. Anikin, Khim.-Farm. Zh.12, 101 ~1978!.
74G. M. Gustin, Thermochim. Acta39, 81 ~1980!.75F. I. Khattab, Thermochim. Acta61, 253 ~1983!.76B. Jeanjean, S. Alberola, J. Rambaud, F. Sabon, and B. Pauvert, Ann.
Pharm. Fr.37, 175 ~1974!.77N. Kaneniwa, J.-I. Ichikawa, and T. Matsumoto, Chem. Pharm. Bull.36,
1063 ~1988!.78M. D. Tuladhar, J. E. Carless, and M. P. Summers, J. Pharm. Pharmacol.
35, 208 ~1983!.79K. Sekiguchi, I. Himuro, I. Horikoshi, T. Tsukada, T. Okamoto, and T.
Yotsuyanagi, Chem. Pharm. Bull.17, 191 ~1969!.80G. G. Lobbia, G. Berchiesi, and G. Poeti, Thermochim. Acta78, 297
~1984!.81S. S. Yang and J. Guillory, J. Pharm. Sci.61, 26 ~1972!.82J. Masse, R. Malaviolle, and A. Chauvet, Ann. Pharm. Fr.34, 407~1976!.83F. Giordano and G. P. Bettinetti, J. Pharm. Biomed. Anal.6, 951~1988!.84C. Sunwoo and H. Eisen, J. Pharm. Sci.60, 238 ~1971!.85J. Rambaud, B. Pauvert, Y. Lasserre, and M. Audran, Farmaco Ed. Prat.
41, 26 ~1986!.86F. Giordano, G. P. Bettinetti, A. La Manna, and P. Ferloni, Farmaco Ed.
Sci. 32, 889 ~1977!.87L. Maury, J. Rambaud, B. Pauvert, G. Berge, M. Audran, and Y.
Lasserre, Pharm. Acta Helv.60, 22 ~1985!.88J. Rambaud, L. Maury, Y. Lasserre, G. Berge, M. Audran, and J. P.
Declerq, Farmaco Ed. Prat.40, 152 ~1985!.89G. Siracusa and L. Abate, Thermochim. Acta36, 207 ~1980!.90L. Vogel and H. Schuberth, Chem. Tech.~Leipzig! 32, 143 ~1980!.91O. A. Momot, I. A. Borukhov, and M. T. Saibova, Deposited Document
VINITI 2964-76 ~1976!, 6 pp.92A. A. Kozyro, S. V. Dalidovich, and A. P. Krasulin, Zh. Prikl. Khim.
~Leningrad! 59, 1456~1986!.93T. Ozawa, Thermochim. Acta92, 27 ~1985!.94K. G. Joback and R. C. Reid, Chem. Eng. Commun.57, 233 ~1987!.95K. Mislow, J. Phys. Colloid Chem.52, 729 ~1948!.96A. Bylicki, Bull. Acad. Pol. Sci., Ser. Sci. Chim., Ge´ol., Geogr. 7, 239
~1959!.97H. Rheinboldt and E. B. Berthold, Univ. Sao Paulo, Fac. Filos. Cienc.
Let., Quim.2, 105 ~1947!.98K. Hrynakowski and F. Adamanis, Bull. Soc. Chim. Fr.53, 1168~1933!.99T. Gondova, P. Kralik, and J. Gonda, Thermochim. Acta156, 147
~1989!.100G. M. Dugacheva, L. A. Saryan, and V. A. Popkov, Vestn. Mosk. Univ.,
Ser. 2: Khim.32, 246 ~1991!.101G. Giuseppetti, C. Tadini, G. P. Bettinetti, F. Giordano, and A. La
Manna, Farmaco Ed. Sci.35, 138 ~1980!.102A. J. Winfield and S. M. H. Al Saidan, Int. J. Pharm.8, 211 ~1981!.103A. M. Agrawal, R. L. Nikore, and A. K. Dorle, Indian J. Pharm.35, 41
~1973!.104V. Ariesen, C. Ionescu, A. Tilinca, Z. Cojocaru, and M. Pitea, Farmacia
~Bucharest! 9, 65 ~1961!.105W. M. Higgins and M. F. W. Dunker, J. Am. Pharm. Ass., Sci. Ed.33,
310 ~1944!.106H. Busquet and C. Vischniac, Compt. Rend. Soc. Biol.119, 503 ~1935!.107T. Higuchi and J. L. Lach, J. Am. Pharm. Assoc., Sci. Ed.43, 349~1954!.108S. Alberola, J. Rambaud, B. Jeanjean, and F. Sabon, Trav. Soc. Pharm.
Montpellier 36, 281 ~1976!.109N. A. Daabis, S. Abd-Elfattah, and H. M. El-Banna, Pharmazie29, 396
~1974!.110R. Malviolle, G. De Maury, A. Chauvet, A. Terol, and J. Masse, J. Calo-
rim., Anal. Therm. Thermodyn. Chim.17, 497 ~1986!.
930930 JAMES SANGSTER
J. Phys. Chem. Ref. Data, Vol. 28, No. 4, 1999