26. tci cost of living spotlight report 2011
TRANSCRIPT
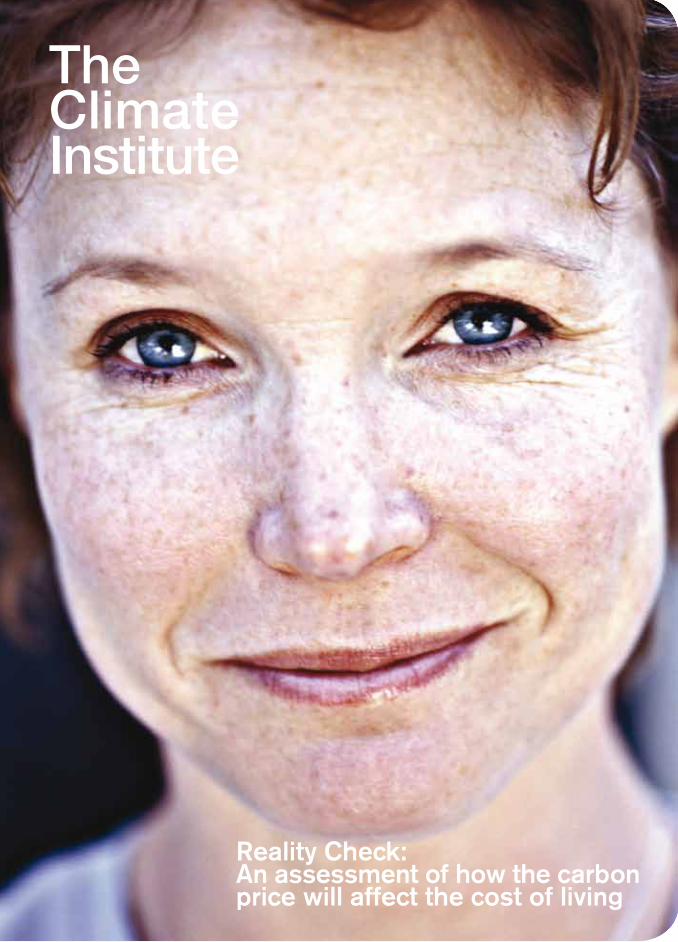
Reality Check: An assessment of how the carbon price will affect the cost of living
The Climate Institute
In PartnershIP WIth
this spotlight report provides the Climate Institute’s overview of an independent study undertaken by CsIrO and aeCOM.
Consumer advocate, ChOICe, and the australian Council of social service (aCOss), who are partners in the Cost of Living project, provided input and advice throughout the study.
the full report The Carbon Price and the Cost of Living can be downloaded from www.climateinstitute.org.au
For more information about the carbon price and your cost of living go to yourcarbonprice.com.au
Spotlight Report
Reality Check:An assessment of how the carbon price will affect the cost of living
Based on independent analysis by CsIrO and aeCOM

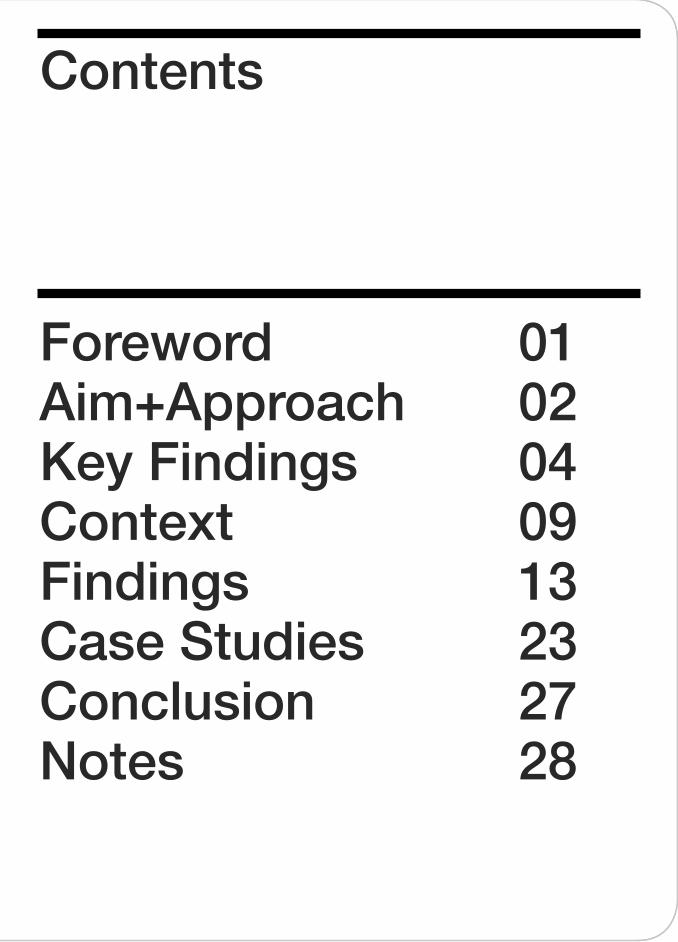
Foreword 01 Aim+Approach 02Key Findings 04Context 09Findings 13Case Studies 23Conclusion 27Notes 28
Contents
Foreword_ Acknowledgements_
Foreword
01
since 2005 the Climate Institute has worked towards its vision of a resilient australia prospering in a low carbon global economy, participating fully and fairly in international climate change solutions
as an independent research organisation our focus has been on providing evidence based information and building strategic partnerships to help switch australia’s economy and culture towards low carbon prosperity.
this project is an important example of this work, important and timely. after a ferocious public and political debate some of australia’s biggest companies will start to pay for their carbon pollution and, from 2015, the new laws require the reduction of millions of tonnes of pollution each year. the debate on these laws has thrown up many claims about their impact on the cost of living and left considerable confusion in its wake.
the Climate Institute has joined with respected consumer advocate ChOICe and the australian Council of social service to help sort fact from fiction.We commissioned CsIrO and economic experts aeCOM to take an independent examination of the cost impacts and weigh them against the proposed government support.
the results are a reality check against some extreme claims and we have combined them with some practical tips to further save costs in households.
I’d like to thank all those involved in the project and am confident the information, tools and suggestions provided will not only help many live with these laws but to participate in australia’s journey towards low carbon prosperity.
John Connor, CeO, the Climate Institute
the Climatre Institute extends its thanks to the following contributors and collaborators.
+ CsIrO and aeCOM were commissioned by the Climate Institute to provide an independent assessment of the likely impact of the carbon price on the cost of living.
+ Consumer advocate, ChOICe, and the australian Council of social service (aCOss), who are partners in the Cost of Living project, provided input and advice throughout the study.
+ this study was funded through a research grant from the Department of Climate Change and energy efficiency.
ApproachIntroduction_
Aim + Approach
02
In summary, the CsIrO-aeCOM study involved the following broad steps:
+ Step 1: assessing the overall cost of the carbon price to the australian economy and how it flows through to different sectors.
+ Step 2: estimating how the overall economic cost will affect the price of goods and services which australian households use in their everyday lives.
+ Step 3: Comparing the impact of the carbon price with other factors that affect the cost of living.
+ Step 4: estimating what these price rises mean for the weekly expenses of australian households, before and after they receive assistance from the Government to help them adjust to the carbon price.
From July 2012 australia will join other countries in limiting and pricing carbon pollution. For the first time around 500 of australia’s largest polluting companies will begin paying for the pollution they release into the atmosphere.
Like past economic reforms, the introduction of the carbon price has sparked a fierce public debate. those opposed to the carbon price have focused on the impacts on the cost of living, tapping into an area of deep public concern.
With this debate in mind, the Climate Institute commissioned australia’s premier scientific and research organisation, CsIrO, and leading technical professional consultancy, aeCOM, to prepare an independent assessment of the extent and magnitude of the impact of the carbon price on the cost of living. CsIrO and aeCOM were also asked to compare this impact with other factors that affect the cost of living.
the aim of the CsIrO-aeCOM analysis was not to convince people to support the carbon price. Instead, this study was designed to provide a credible, third-party assessment of carbon price impacts. the Climate Institute also partnered with consumer advocate, ChOICe, and the australian Council of social service (aCOss) to provide additional input to the study.
It is hoped this information will help people understand how the carbon price will affect their daily lives.
the findings of the CsIrO-aeCOM study have been published in a report entitled The Carbon Price and the Cost of Living, which can be downloaded from climateinstitute.org.au. the Climate Institute’s summary of the key findings is presented in the remainder of this document.
Key Findings
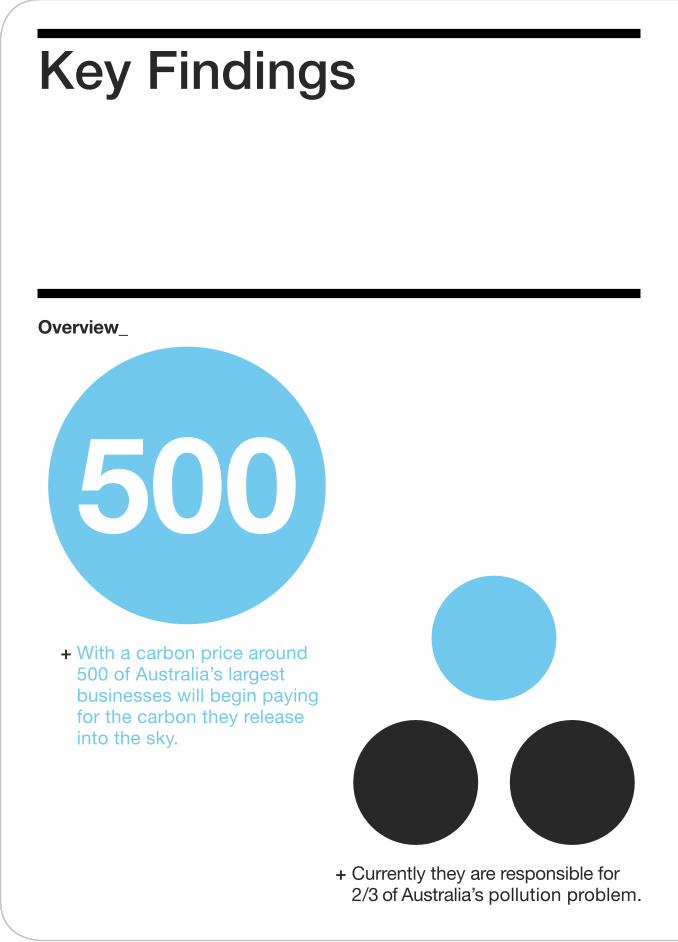
500+ With a carbon price around
500 of Australia’s largest businesses will begin paying for the carbon they release into the sky.
+ Currently they are responsible for 2/3 of Australia’s pollution problem.
Overview_
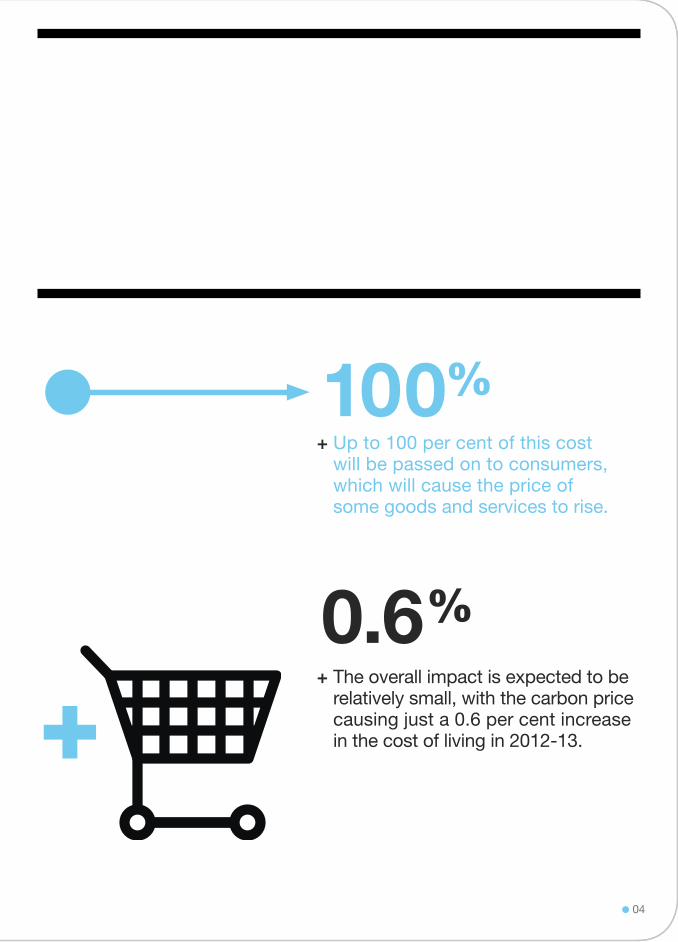
+ Up to 100 per cent of this cost will be passed on to consumers, which will cause the price of some goods and services to rise.
+ The overall impact is expected to be relatively small, with the carbon price causing just a 0.6 per cent increase in the cost of living in 2012-13.
%0.6
%100
+
04
Overview_
Key Findings
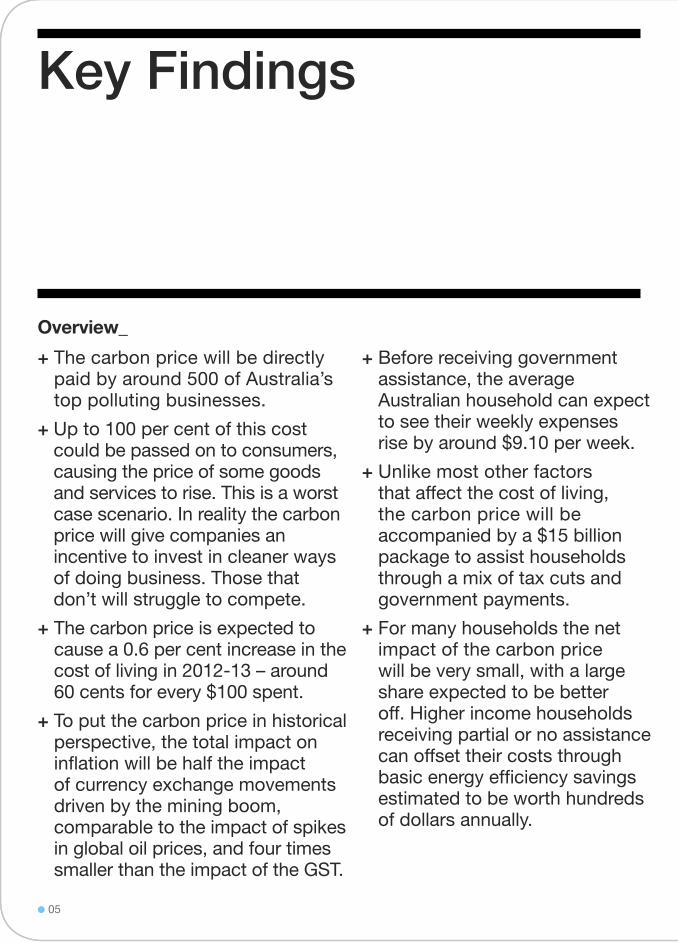
+ The carbon price will be directly paid by around 500 of Australia’s top polluting businesses.
+ Up to 100 per cent of this cost could be passed on to consumers, causing the price of some goods and services to rise. This is a worst case scenario. In reality the carbon price will give companies an incentive to invest in cleaner ways of doing business. Those that don’t will struggle to compete.
+ The carbon price is expected to cause a 0.6 per cent increase in the cost of living in 2012-13 – around 60 cents for every $100 spent.
+ To put the carbon price in historical perspective, the total impact on inflation will be half the impact of currency exchange movements driven by the mining boom, comparable to the impact of spikes in global oil prices, and four times smaller than the impact of the GST.
+ Before receiving government assistance, the average Australian household can expect to see their weekly expenses rise by around $9.10 per week.
+ Unlike most other factors that affect the cost of living, the carbon price will be accompanied by a $15 billion package to assist households through a mix of tax cuts and government payments.
+ For many households the net impact of the carbon price will be very small, with a large share expected to be better off. Higher income households receiving partial or no assistance can offset their costs through basic energy efficiency savings estimated to be worth hundreds of dollars annually.
05
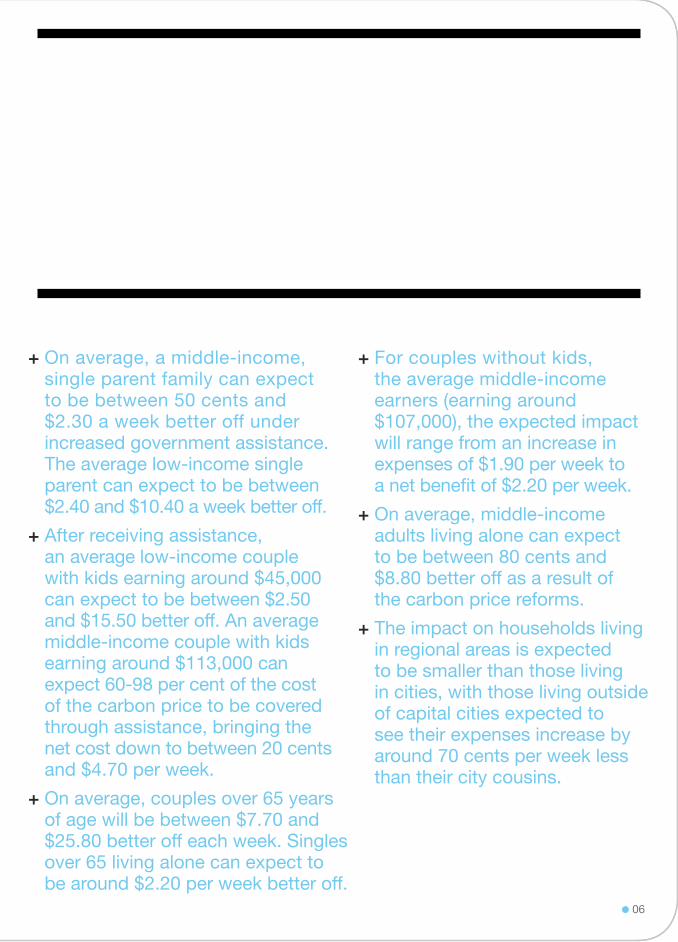
+ On average, a middle-income, single parent family can expect to be between 50 cents and $2.30 a week better off under increased government assistance. The average low-income single parent can expect to be between $2.40 and $10.40 a week better off.
+ After receiving assistance, an average low-income couple with kids earning around $45,000 can expect to be between $2.50 and $15.50 better off. An average middle-income couple with kids earning around $113,000 can expect 60-98 per cent of the cost of the carbon price to be covered through assistance, bringing the net cost down to between 20 cents and $4.70 per week.
+ On average, couples over 65 years of age will be between $7.70 and $25.80 better off each week. Singles over 65 living alone can expect to be around $2.20 per week better off.
+ For couples without kids, the average middle-income earners (earning around $107,000), the expected impact will range from an increase in expenses of $1.90 per week to a net benefit of $2.20 per week.
+ On average, middle-income adults living alone can expect to be between 80 cents and $8.80 better off as a result of the carbon price reforms.
+ The impact on households living in regional areas is expected to be smaller than those living in cities, with those living outside of capital cities expected to see their expenses increase by around 70 cents per week less than their city cousins.
06
Australia's per person pollution levels today are the highest in the developed world.
The carbon price has the potential to cut up to 1.1 billion tonnes of pollution from the atmosphere by 2020.
The carbon price explained
A Price On Pollution
Over the last century the average global temperature has risen by more than 0.7°C.1 On current trends, by the end of the century this is projected to increase to 3-4°C above pre-industrial levels.2 For Australia the consequences of this level or warming would be far reaching, with severe economic, social and environmental impacts predicted.3
australia is the 15th biggest carbon polluter in the world, ranked alongside countries like Mexico, the United Kingdom, south Korea and France. Per person, we are the largest polluter among industrialised countries, responsible for approximately 27 tonnes of pollution for every australian, compared to around 6 tonnes for every person in China.4
the challenge for australia, and all other countries, is to reduce this dependence on pollution in the most cost effective way. this is precisely what the legislated limit and price on pollution is meant to provide – a cost-effective mechanism for australia to transition to a low pollution economy.
Of course climate change is a global problem that needs a global solution. Putting a limit and price on pollution in australia needs to be viewed as one part of australia’s contribution to global efforts. Current commitments from other big countries, including China, europe and the Us, will see global pollution levels reduced by between 27 and 50 billion tonnes between 2012 and 2020.5
From July 2012 around 500 of australia’s biggest polluting businesses will begin paying for their carbon pollution. this means that each of these companies will legally require a permit for every tonne of pollution they release into the atmosphere. For the first three years of the scheme the Government will sell these permits, starting at a fixed price of $23 per tonne, as well as issuing a large number of permits for free to help businesses adjust.
the carbon pollution price means companies will begin to place an economic value on pollution and begin treating it as a cost of doing business. this will provide an incentive for businesses to find ways to reduce their pollution. Under the current situation, companies can pollute for free, whereas under the carbon price they are given the opportunity to save $23 for every tonne that can be avoided. every tonne of pollution cut means one less permit to acquire.
the carbon price will also help by making cleaner forms of energy cheaper compared to conventional coal. Over time, this will see more investment flowing into australia’s renewable energy resources, including wind, solar and geothermal.
How will it work?
09
breadmilkeggscheesecarbonapplesbananastomatoeslettuceonionschickenyoghurtpastalight globesdetergent petrol
10
Where will the price be applied? What will be achieved?In aggregate, the 500 or so companies covered by the carbon price account for around two-thirds of australia’s total emissions.6 the largest share of the total carbon price bill will apply to electricity generators, particularly those who burn coal for electricity production. the remainder of the carbon price bill will apply to a mix of sectors across the australian economy, including coal and gas companies, aluminium producers and cement companies.
Over the first four year of the scheme in excess of $12 billion worth of pollution permits will be allocated freely to australian businesses to help them transition to a carbon price. this means initially many companies will not have to pay for their full pollution liability. For example, aluminium producers will be eligible for permits equivalent to around 94.5 per cent of their carbon pollution liability. In effect this means aluminium producers will have their carbon price reduced from $23 per tonne to around $1.27 per tonne.
While in the first instance, a relatively large share of free pollution permits will be issued freely, this does not necessarily remove the incentive for companies to cut pollution. Freely allocated permits will be tradeable, which means they will be viewed by companies as an asset despite not having paid for the permits. this means it will continue to make economic sense for a company that receives free permits to look for cost-effective ways to cut pollution in order to get ahead of competitors (i.e. options that will cost less than the forward price for pollution).
the carbon price won’t apply to fuel used by cars or to emissions from farm activities. Other policies and initiatives will be put in place to deal with carbon pollution from these sources, but in the short to medium term this will not involve a carbon price.
after an initial fixed price period, in 2015 the carbon price will move to an emissions trading system. this means the price will be set by the market, rather than the Government, and there will be an absolute limit on the number of permits available. this guarantees a limit can be set on australia’s pollution levels – a limit that gets tighter over time.
according to modelling undertaken by the Commonwealth treasury, the carbon price along with other measures will save between 0.68 and 1.1 billion tonnes of carbon pollution between 2012 and 2020. this will see australia’s pollution levels reduced to between 5 and 25 per cent below 2000 levels by 2020. to put this into context, 1.1 billion tonnes is equivalent to taking up to 70 million cars permanently off the road by 2020.7
What? Where?How?
11
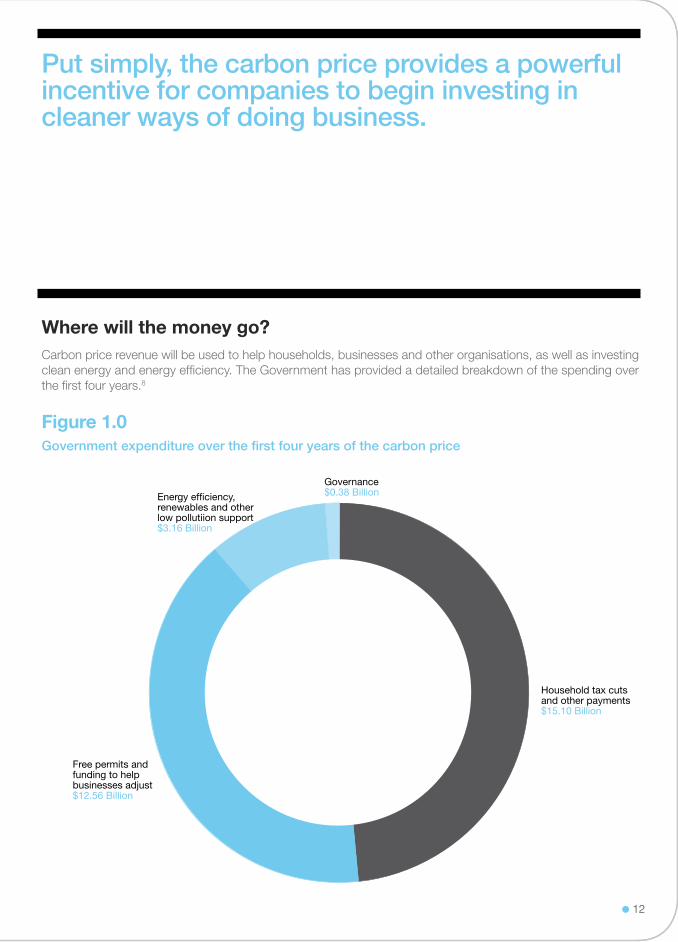
Where will the money go?Carbon price revenue will be used to help households, businesses and other organisations, as well as investing clean energy and energy efficiency. the Government has provided a detailed breakdown of the spending over the first four years.8
Put simply, the carbon price provides a powerful incentive for companies to begin investing in cleaner ways of doing business.
12
Government expenditure over the first four years of the carbon price
Figure 1.0
Governance $0.38 Billion
Household tax cuts and other payments$15.10 Billion
Energy efficiency, renewables and other low pollutiion support$3.16 Billion
Free permits and funding to helpbusinesses adjust$12.56 Billion
Counting The Costs
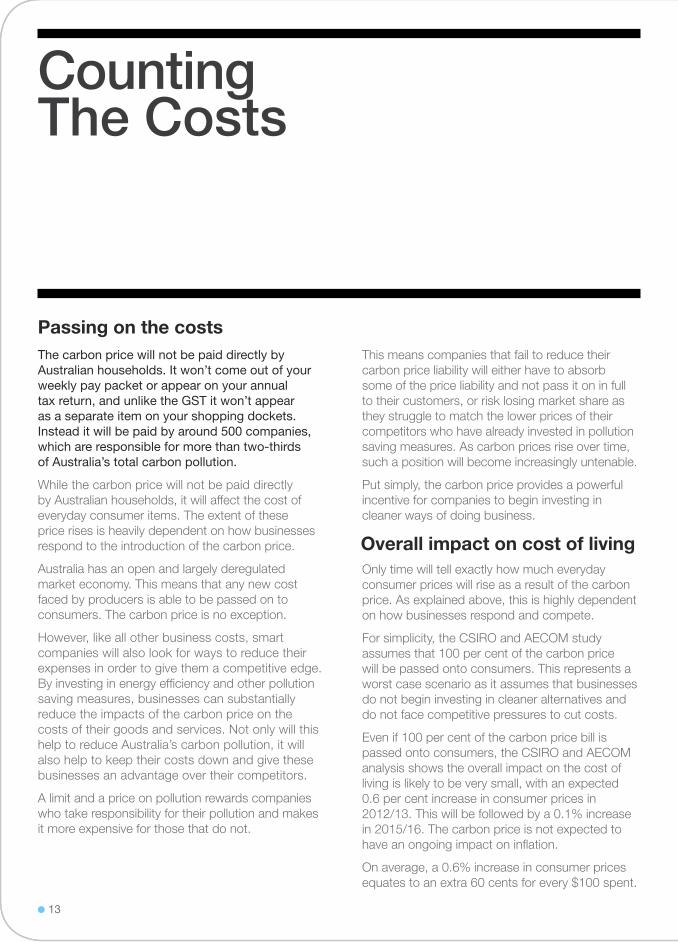
The carbon price will not be paid directly by Australian households. It won’t come out of your weekly pay packet or appear on your annual tax return, and unlike the GST it won’t appear as a separate item on your shopping dockets. Instead it will be paid by around 500 companies, which are responsible for more than two-thirds of Australia’s total carbon pollution.
While the carbon price will not be paid directly by australian households, it will affect the cost of everyday consumer items. the extent of these price rises is heavily dependent on how businesses respond to the introduction of the carbon price.
australia has an open and largely deregulated market economy. this means that any new cost faced by producers is able to be passed on to consumers. the carbon price is no exception.
however, like all other business costs, smart companies will also look for ways to reduce their expenses in order to give them a competitive edge. By investing in energy efficiency and other pollution saving measures, businesses can substantially reduce the impacts of the carbon price on the costs of their goods and services. not only will this help to reduce australia’s carbon pollution, it will also help to keep their costs down and give these businesses an advantage over their competitors.
a limit and a price on pollution rewards companies who take responsibility for their pollution and makes it more expensive for those that do not.
Passing on the coststhis means companies that fail to reduce their carbon price liability will either have to absorb some of the price liability and not pass it on in full to their customers, or risk losing market share as they struggle to match the lower prices of their competitors who have already invested in pollution saving measures. as carbon prices rise over time, such a position will become increasingly untenable.
Put simply, the carbon price provides a powerful incentive for companies to begin investing in cleaner ways of doing business.
Only time will tell exactly how much everyday consumer prices will rise as a result of the carbon price. as explained above, this is highly dependent on how businesses respond and compete.
For simplicity, the CsIrO and aeCOM study assumes that 100 per cent of the carbon price will be passed onto consumers. this represents a worst case scenario as it assumes that businesses do not begin investing in cleaner alternatives and do not face competitive pressures to cut costs.
even if 100 per cent of the carbon price bill is passed onto consumers, the CsIrO and aeCOM analysis shows the overall impact on the cost of living is likely to be very small, with an expected 0.6 per cent increase in consumer prices in 2012/13. this will be followed by a 0.1% increase in 2015/16. the carbon price is not expected to have an ongoing impact on inflation.
On average, a 0.6% increase in consumer prices equates to an extra 60 cents for every $100 spent.
Overall impact on cost of living
13
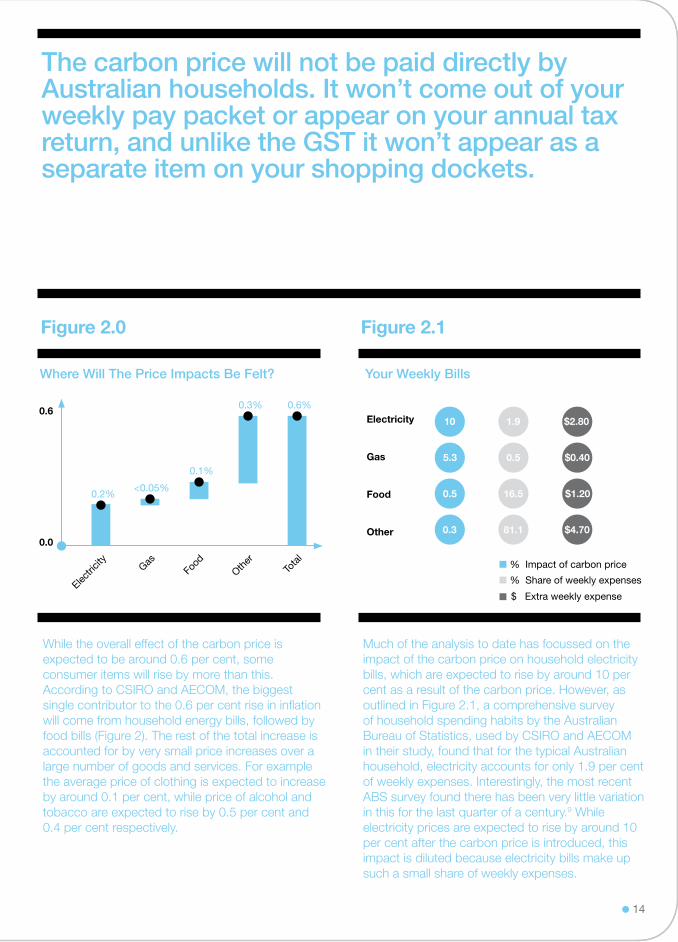
Figure 2.0 Figure 2.1
The carbon price will not be paid directly by Australian households. It won’t come out of your weekly pay packet or appear on your annual tax return, and unlike the GST it won’t appear as a separate item on your shopping dockets.
14
Where Will The Price Impacts Be Felt? Your Weekly Bills
Much of the analysis to date has focussed on the impact of the carbon price on household electricity bills, which are expected to rise by around 10 per cent as a result of the carbon price. however, as outlined in Figure 2.1, a comprehensive survey of household spending habits by the australian Bureau of statistics, used by CsIrO and aeCOM in their study, found that for the typical australian household, electricity accounts for only 1.9 per cent of weekly expenses. Interestingly, the most recent aBs survey found there has been very little variation in this for the last quarter of a century.9 While electricity prices are expected to rise by around 10 per cent after the carbon price is introduced, this impact is diluted because electricity bills make up such a small share of weekly expenses.
While the overall effect of the carbon price is expected to be around 0.6 per cent, some consumer items will rise by more than this. according to CsIrO and aeCOM, the biggest single contributor to the 0.6 per cent rise in inflation will come from household energy bills, followed by food bills (Figure 2). the rest of the total increase is accounted for by very small price increases over a large number of goods and services. For example the average price of clothing is expected to increase by around 0.1 per cent, while price of alcohol and tobacco are expected to rise by 0.5 per cent and 0.4 per cent respectively.
0.6
0.0
Electri
city
GasFo
od
Other
Tota
l
0.3% 0.6%
0.2%<0.05%
0.1%
Electricity
Gas
Food
Other
1.9
0.5
16.5
81.1
10
5.3
0.5
0.3
$2.80
$0.40
$1.20
$4.70
% Impact of carbon price
% Share of weekly expenses
$ Extra weekly expense
Counting The Costs
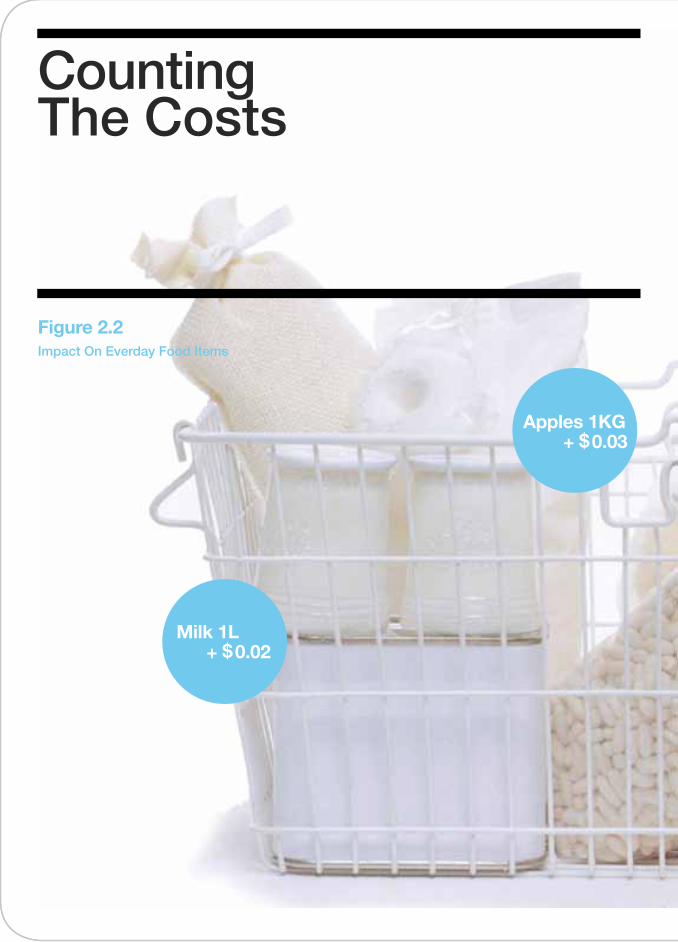
Apples 1KG + $ 0.03
Milk 1L + $ 0.02
Impact On Everday Food Items
Figure 2.2
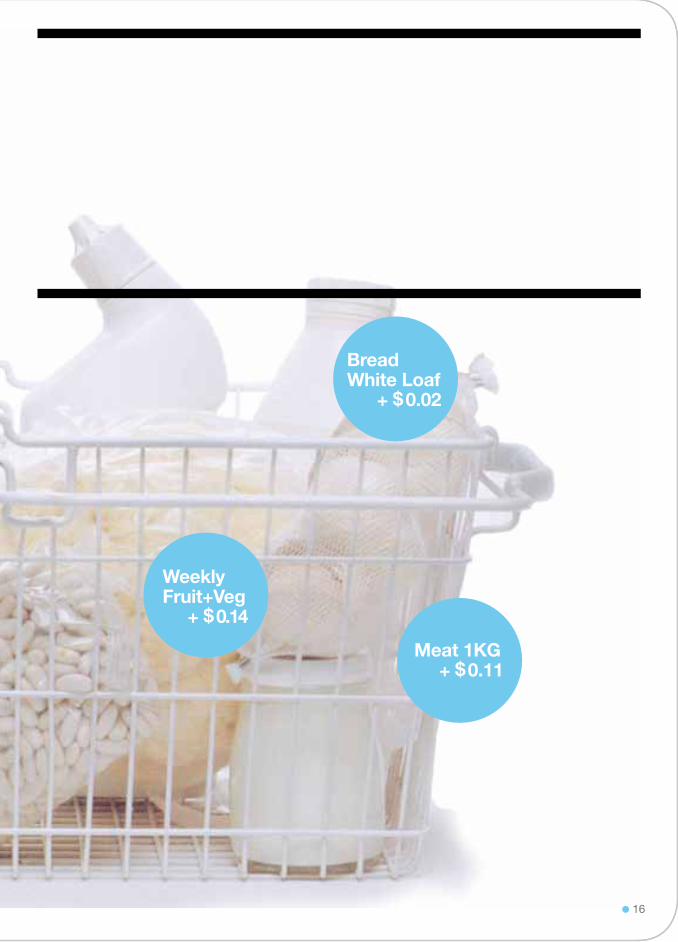
Bread White Loaf + $ 0.02
Meat 1KG + $ 0.11
16
Weekly Fruit+Veg + $ 0.14
How Does It Compare?
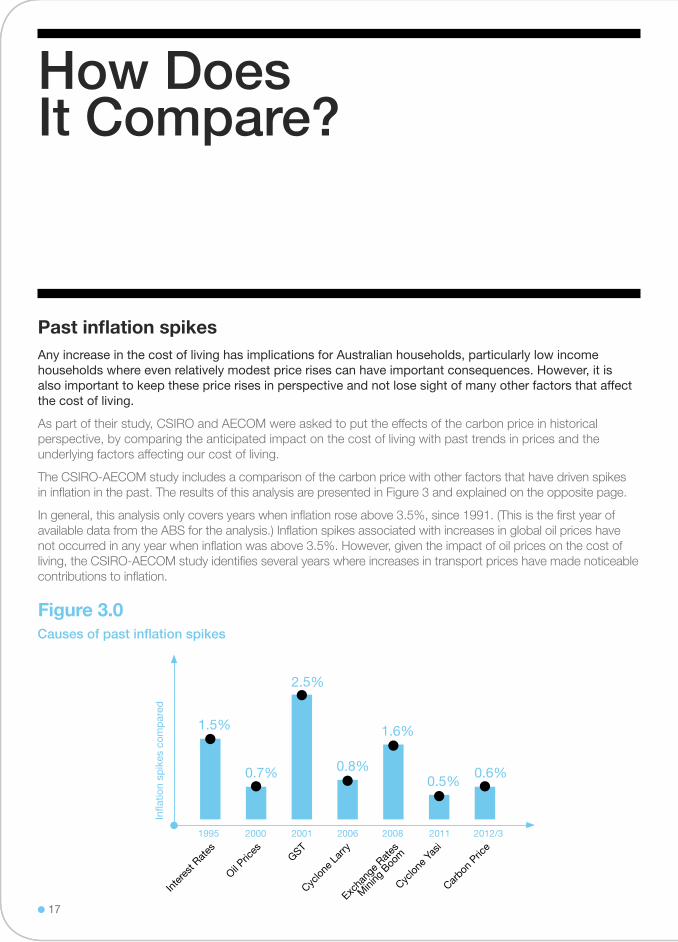
Any increase in the cost of living has implications for Australian households, particularly low income households where even relatively modest price rises can have important consequences. However, it is also important to keep these price rises in perspective and not lose sight of many other factors that affect the cost of living.
as part of their study, CsIrO and aeCOM were asked to put the effects of the carbon price in historical perspective, by comparing the anticipated impact on the cost of living with past trends in prices and the underlying factors affecting our cost of living.
the CsIrO-aeCOM study includes a comparison of the carbon price with other factors that have driven spikes in inflation in the past. the results of this analysis are presented in Figure 3 and explained on the opposite page.
In general, this analysis only covers years when inflation rose above 3.5%, since 1991. (this is the first year of available data from the aBs for the analysis.) Inflation spikes associated with increases in global oil prices have not occurred in any year when inflation was above 3.5%. however, given the impact of oil prices on the cost of living, the CsIrO-aeCOM study identifies several years where increases in transport prices have made noticeable contributions to inflation.
Past inflation spikes
Figure 3.0Causes of past inflation spikes
17
GST
Inter
est R
ates
Excha
nge R
ates
Mini
ng B
oom
Car
bon P
rice
Cyclon
e Lar
ry
Cyclon
e Yas
i
Infla
tion
spik
es c
omp
ared
1995
1.5%
2001
2.5%
2006
0.8%
2008
1.6%
2011
0.5%
2012/3
0.6%
Oil Pric
es2000
0.7%
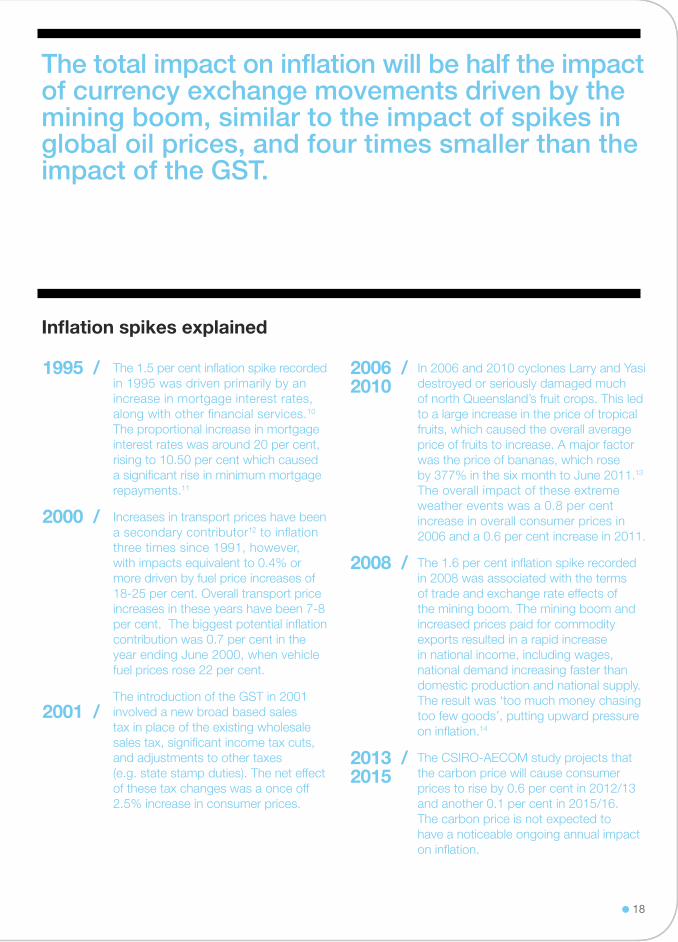
Inflation spikes explained
the 1.5 per cent inflation spike recorded in 1995 was driven primarily by an increase in mortgage interest rates, along with other financial services.10 the proportional increase in mortgage interest rates was around 20 per cent, rising to 10.50 per cent which caused a significant rise in minimum mortgage repayments.11
Increases in transport prices have been a secondary contributor12 to inflation three times since 1991, however, with impacts equivalent to 0.4% or more driven by fuel price increases of 18-25 per cent. Overall transport price increases in these years have been 7-8 per cent. the biggest potential inflation contribution was 0.7 per cent in the year ending June 2000, when vehicle fuel prices rose 22 per cent.
the introduction of the Gst in 2001 involved a new broad based sales tax in place of the existing wholesale sales tax, significant income tax cuts, and adjustments to other taxes (e.g. state stamp duties). the net effect of these tax changes was a once off 2.5% increase in consumer prices.
In 2006 and 2010 cyclones Larry and Yasi destroyed or seriously damaged much of north Queensland’s fruit crops. this led to a large increase in the price of tropical fruits, which caused the overall average price of fruits to increase. a major factor was the price of bananas, which rose by 377% in the six month to June 2011.13 the overall impact of these extreme weather events was a 0.8 per cent increase in overall consumer prices in 2006 and a 0.6 per cent increase in 2011.
the 1.6 per cent inflation spike recorded in 2008 was associated with the terms of trade and exchange rate effects of the mining boom. the mining boom and increased prices paid for commodity exports resulted in a rapid increase in national income, including wages, national demand increasing faster than domestic production and national supply. the result was ‘too much money chasing too few goods’, putting upward pressure on inflation.14
the CsIrO-aeCOM study projects that the carbon price will cause consumer prices to rise by 0.6 per cent in 2012/13 and another 0.1 per cent in 2015/16. the carbon price is not expected to have a noticeable ongoing annual impact on inflation.
2006 / 2010
1995 /
2000 /
2001 /
2008 /
2013 / 2015
The total impact on inflation will be half the impact of currency exchange movements driven by the mining boom, similar to the impact of spikes in global oil prices, and four times smaller than the impact of the GST.
18

Electricity + Food
The overall impact of the carbon price is expected to be relatively small, with around a 0.6 per cent increase in the cost of living in 2012-13. However, as noted above, the impact on household energy bills will be more noticeable. The CSIRO-AECOM analysis found that electricity prices are expected to rise by an additional 10 per cent in 2012-13 as a result of the carbon price. While this is not an insignificant price rise, it needs to be kept in perspective.
Over the period 2005/06 to 2009/10 average electricity prices in sydney rose by around 20 per cent, with another 20 per cent locked in between 2010/11 and 2012/13 even before the carbon price is introduced. the main factor behind electricity prices rises is the unprecedented investment in network infrastructure – new poles and wires – with an estimated $46 billion currently being rolled out nationally.15
significantly, as discussed below, there are many opportunities for households to save energy through simple steps around the home. In many cases, households could save even more than the 10 per cent increase associated with the carbon price.
What’s really driving electricity prices up?
19
Estimated Historic
Wholesale Energy
Trend to 2013-14 with carbon price (8.2% pa)
Network
Retail
Other
CarbonFigure 3.1Factors driving retail electricity prices in Sydney, 2009/10-2012/13
Ret
ail e
lect
ricity
pric
e($
/MW
h 20
10-1
1 co
nsta
nt p
rices
)
300
250
200
150
100
50
0
2006-07 2007-08 2008-09 2009-10 2010-11 2011-12 2012-13 2013-14
Increase from2010-11 levels
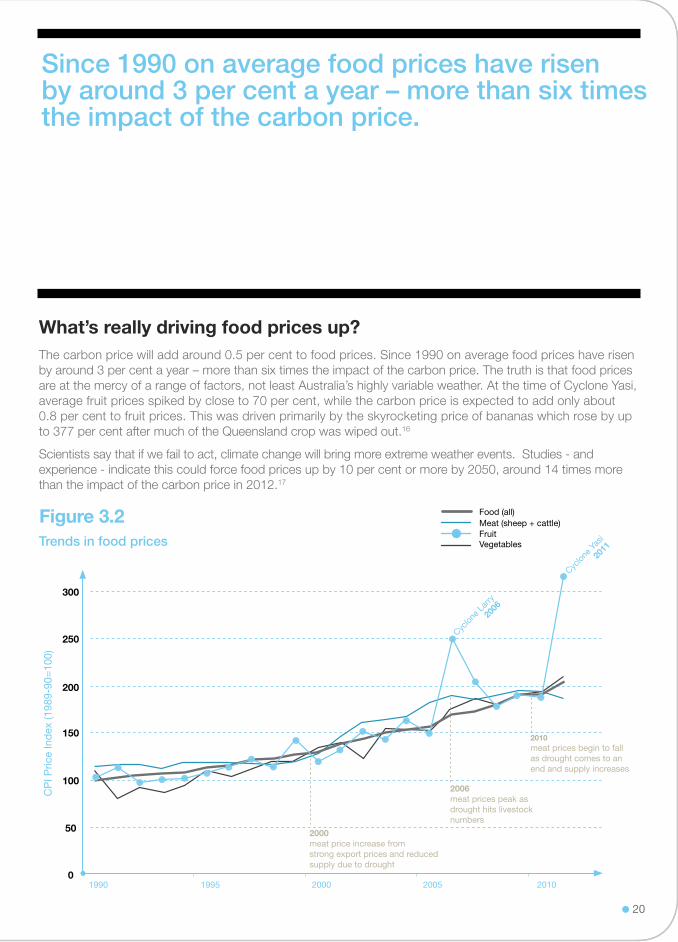
the carbon price will add around 0.5 per cent to food prices. since 1990 on average food prices have risen by around 3 per cent a year – more than six times the impact of the carbon price. the truth is that food prices are at the mercy of a range of factors, not least australia’s highly variable weather. at the time of Cyclone Yasi, average fruit prices spiked by close to 70 per cent, while the carbon price is expected to add only about 0.8 per cent to fruit prices. this was driven primarily by the skyrocketing price of bananas which rose by up to 377 per cent after much of the Queensland crop was wiped out.16
scientists say that if we fail to act, climate change will bring more extreme weather events. studies - and experience - indicate this could force food prices up by 10 per cent or more by 2050, around 14 times more than the impact of the carbon price in 2012.17
What’s really driving food prices up?
Since 1990 on average food prices have risen by around 3 per cent a year – more than six times the impact of the carbon price.
20
Food (all)Meat (sheep + cattle)FruitVegetablesTrends in food prices
Figure 3.2
1990
300
250
200
150
100
50
0
CP
I Pric
e In
dex
(198
9-90
=10
0)
1995 2000 2005 2010
Cyclon
e Lar
ry
2006
Cyclon
e Yas
i
2011
2000 meat price increase from strong export prices and reduced supply due to drought
2006 meat prices peak as drought hits livestock numbers
2010 meat prices begin to fall as drought comes to an end and supply increases
At Home
The impact of the carbon price will be felt differently by households depending on their income levels, expenditure patterns and the number of dependent children. With this in mind, the CSIRO-AECOM study assessed the likely impacts for four different household types. For each household type, three different income levels were assessed.
according to the Government, around half of the revenue raised from the sale of pollution permits will be used to help households manage the effects of the carbon price on daily costs. this assistance has been specifically designed with low-income households in mind, and according to the results of the CsIrO-aeCOM study, this appears to be justified. Indeed, the CsIrO-aeCOM study shows that while the overall impact of the carbon price on households is relatively small, the effects will be more significant for low-income households.
high-income households typically spend more on electricity, food and other items than low-income households, which means in dollar terms the impact of the carbon price is expected to rise with incomes. however, as a share of expenditure, the impacts are significantly smaller, and hence less noticeable, for high income households. according to the CsIrO-aeCOM analysis, households in the highest income bracket are expected to see their expenditure increase by 0.6 per cent in 2012/13 as a result of the carbon price, compared to 0.8 per cent on average for households in the lowest income bracket.
as well as facing a significantly smaller proportional increase in expenditure, high-income households, in general, are likely to be better able to cope with any price rises associated with the carbon price. they are also well placed to invest in energy efficiency which, as discussed below, can go a long way to offsetting much of the cost increase associated with the carbon price.
the CsIrO-aeCOM study also found that households living outside of capital cities can expect to face a smaller increase in living expenses than those living in capital cities. this is because these households generally use less energy than people living in cities. On average and before government assistance, households outside of capital cities can expect to see their expenses rise by around $8.70 per week, whereas the average for capital city households is around $9.40 a week.
Government Assistance
Based on the CsIrO-aeCOM analysis the Climate Institute has prepared seven case studies to illustrate what the carbon price will mean for a variety of australian families and individuals. these case studies can be downloaded from: www.climateinstitute.org.au
21

Your World
22
Your World
Couple With Kids Single Parent Family
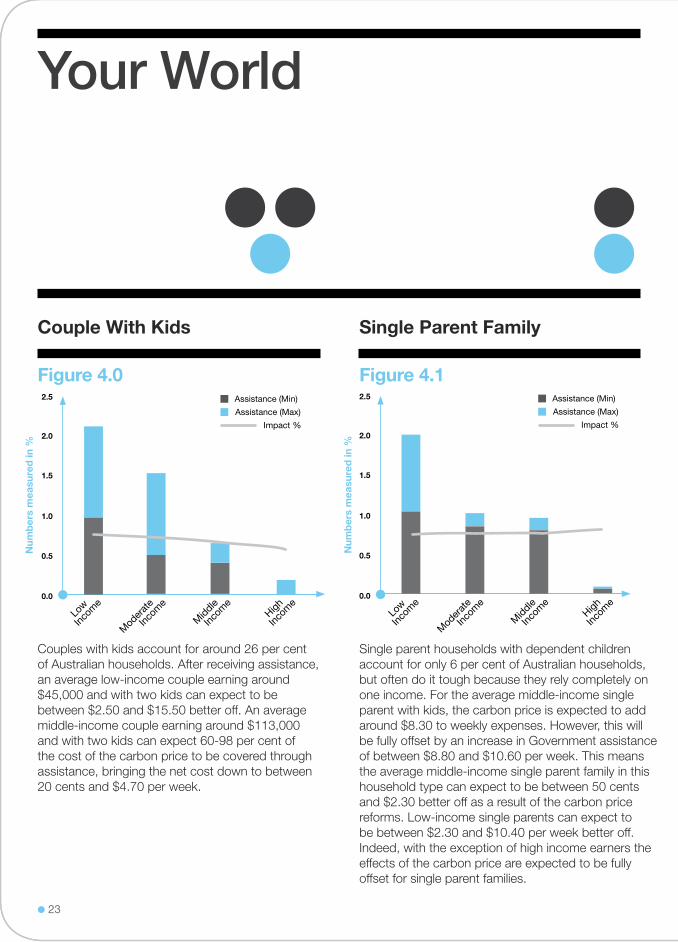
Couples with kids account for around 26 per cent of australian households. after receiving assistance, an average low-income couple earning around $45,000 and with two kids can expect to be between $2.50 and $15.50 better off. an average middle-income couple earning around $113,000 and with two kids can expect 60-98 per cent of the cost of the carbon price to be covered through assistance, bringing the net cost down to between 20 cents and $4.70 per week.
single parent households with dependent children account for only 6 per cent of australian households, but often do it tough because they rely completely on one income. For the average middle-income single parent with kids, the carbon price is expected to add around $8.30 to weekly expenses. however, this will be fully offset by an increase in Government assistance of between $8.80 and $10.60 per week. this means the average middle-income single parent family in this household type can expect to be between 50 cents and $2.30 better off as a result of the carbon price reforms. Low-income single parents can expect to be between $2.30 and $10.40 per week better off. Indeed, with the exception of high income earners the effects of the carbon price are expected to be fully offset for single parent families.
Figure 4.0 Figure 4.1
23
Num
ber
s m
easu
red
in %
Assistance (Min)
Impact %
Assistance (Max)
Low
Incom
e
Mod
erat
e
Incom
e
Middle
Incom
eHigh
Incom
e
1.5
1.0
0.5
0.0
2.0
2.5
Num
ber
s m
easu
red
in %
Assistance (Min)
Impact %
Assistance (Max)
Low
Incom
e
Mod
erat
e
Incom
e
Middle
Incom
eHigh
Incom
e
1.5
1.0
0.5
0.0
2.0
2.5
1.5
1.0
0.5
0.0
2.0
2.5
Couples Without Kids Single Adult
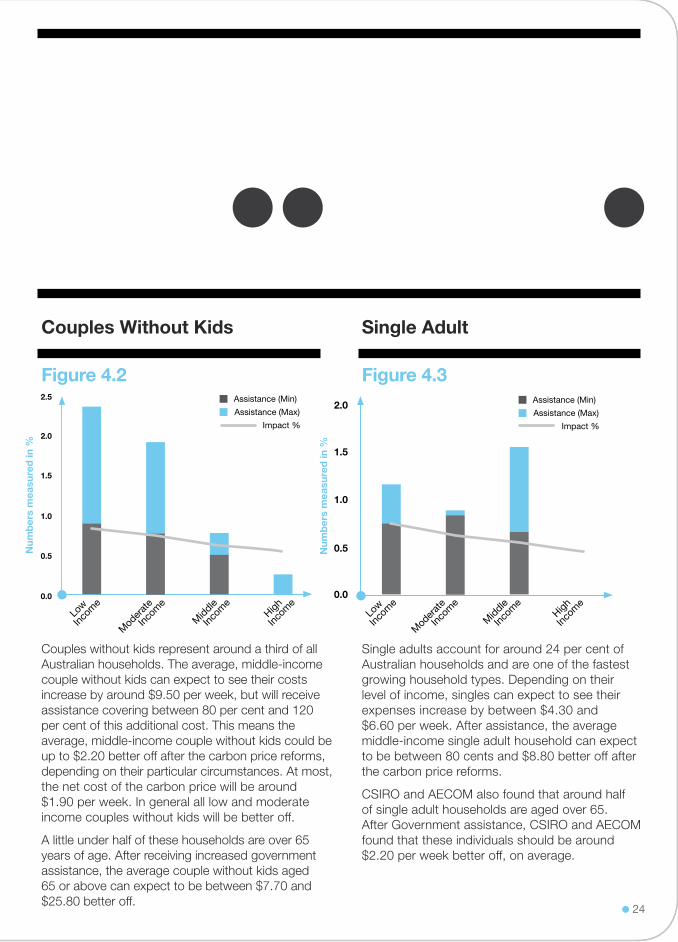
Couples without kids represent around a third of all australian households. the average, middle-income couple without kids can expect to see their costs increase by around $9.50 per week, but will receive assistance covering between 80 per cent and 120 per cent of this additional cost. this means the average, middle-income couple without kids could be up to $2.20 better off after the carbon price reforms, depending on their particular circumstances. at most, the net cost of the carbon price will be around $1.90 per week. In general all low and moderate income couples without kids will be better off.
a little under half of these households are over 65 years of age. after receiving increased government assistance, the average couple without kids aged 65 or above can expect to be between $7.70 and $25.80 better off.
single adults account for around 24 per cent of australian households and are one of the fastest growing household types. Depending on their level of income, singles can expect to see their expenses increase by between $4.30 and $6.60 per week. after assistance, the average middle-income single adult household can expect to be between 80 cents and $8.80 better off after the carbon price reforms.
CsIrO and aeCOM also found that around half of single adult households are aged over 65. after Government assistance, CsIrO and aeCOM found that these individuals should be around $2.20 per week better off, on average.
Figure 4.2 Figure 4.3
24
Low
Mod
erat
e
Middle
High
2.0
1.5
1.0
0.5
0.0
Num
ber
s m
easu
red
in %
Assistance (Min)
Impact %
Assistance (Max)
Incom
e
Incom
e
Incom
e
Incom
e
Impact %
Num
ber
s m
easu
red
in %
Assistance (Min)
Impact %
Assistance (Max)
Low
Incom
e
Mod
erat
e
Incom
e
Middle
Incom
eHigh
Incom
e
1.5
1.0
0.5
0.0
2.0
2.5
Conscious_
Smart Consumer
Smart Energy
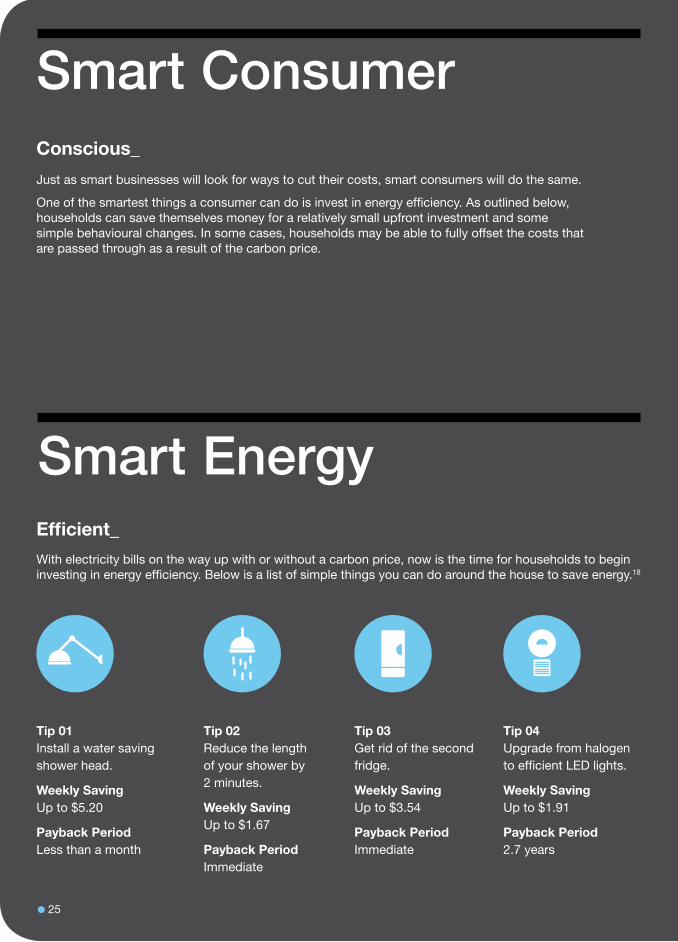
Just as smart businesses will look for ways to cut their costs, smart consumers will do the same.
One of the smartest things a consumer can do is invest in energy efficiency. As outlined below, households can save themselves money for a relatively small upfront investment and some simple behavioural changes. In some cases, households may be able to fully offset the costs that are passed through as a result of the carbon price.
Efficient_
With electricity bills on the way up with or without a carbon price, now is the time for households to begin investing in energy efficiency. Below is a list of simple things you can do around the house to save energy.18
Tip 02Reduce the length of your shower by 2 minutes.
Weekly Saving Up to $1.67
Payback Period Immediate
Tip 03Get rid of the second fridge.
Weekly Saving Up to $3.54
Payback Period Immediate
Tip 04Upgrade from halogen to efficient LED lights.
Weekly Saving Up to $1.91
Payback Period 2.7 years
Tip 01Install a water saving shower head.
Weekly Saving Up to $5.20
Payback Period Less than a month
25
Competitive_
Smart Business
Smart Regulations
Only time will tell how much of the carbon price will be passed on to consumers. In AECOM and CSIRO study, it’s assumed the initial pass through rate will be 100 per cent. But that won’t last for long. Faced with a new cost, smart businesses will look for new ways to reduce their pollution liability. They will invest in energy efficiency and other pollution saving options. Businesses that don’t take smart steps to reduce pollution may still try to pass on 100 per cent of the carbon price, but they will struggle to keep up with their cleaner, more efficient competitors.
Innovative_
Some states and countries have started to introduce smarter regulations which reward energy retailers who find energy savings in businesses and households. For example, a recent study by the independent regulator found that the NSW Energy Savers Scheme delivers energy savings with a net benefit to the community of about $24 per MWh.19 This means the value of the energy savings delivered by the scheme far outweigh the costs of achieving them. The report went on to find that these savings will help to keep electricity prices down for all energy users, not just those participating in the scheme. Recent modelling for the Federal Government has shown a National Energy Savings Initiative could save households up to $296 per year.20 This would be achieved by requiring energy retailers to invest in energy saving measures amongst their customer base.
26
Insights_ Looking Ahead_
Conclusion
In July next year the carbon price will come into effect and all australian households will then be able to judge for themselves what the impact has been on their cost of living. as outlined in the CsIrO-aeCOM study, there is likely to be a noticeable impact for some items. For others, the impact will be very small and in many cases will be barely noticeable. For most households the costs will be more than offset by an increase in Government assistance.
For low-income households any increase in the cost of living will be noticed. this underscores the importance of the financial assistance measures committed to as part of the carbon price reforms. alongside these reforms, efforts to support energy efficiency for low income groups need to be expanded. the funding for energy efficiency announced as part of the Clean energy Future policy package is an important start, but a long-term mechanism is needed to drive ongoing investments in energy efficiency across the australian economy. a national energy savings Initiative, already flagged by the Federal Government, should be a top priority.
While australians may not notice a significant difference in their cost of living after the carbon price comes into effect, the significance of this reform should not be overlooked. For the first time ever, businesses will be required to pay for the pollution they release into the atmosphere. this will help to unlock a new wave of low pollution innovation across the australian economy and (finally) begin our journey towards a clean energy economy.
the independent analysis by CsIrO and aeCOM concludes that even if 100 per cent of the carbon price is passed on to australian consumers, the overall impact on the cost of living will be relatively small – adding around 0.6 per cent to consumer prices. On average, this is less than 60 cents for every $100 spent.
the impact of the carbon price on consumer prices will be about half the impact of currency exchange movements driven by the mining boom, similar to the impact of spikes in global oil prices, and four times smaller than the impact of the Gst when it was introduced.
Unlike most other factors that affect the cost of living, the carbon price will be accompanied by a $15 billion package to assist households through a mix of tax cuts and government payments.
Before receiving government assistance, the average australian household can expect to see their weekly expenses rise by around $9.10 per week. however, for many households the net impact of the carbon price reforms (including government assistance) will be very small, with a large share expected to be better off. higher income households receiving partial or no assistance can offset their costs through basic energy efficiency savings.
the impact on households living in regional areas is expected to be smaller than those living in cities, with those living outside of capital cities expected to see their expenses increase by around 70 cents per week less than their city cousins.
27
Notes_Notes_
End
13 australian Bureau of statistics (2011), Consumer Price Index: June Quarter 2011, www.ausstats.abs.gov.au.
14 the analysis identifies this as a trade effect because the main price increases are spread across ‘non-traded goods’ as a whole – that is, goods and services that do not compete with imports (such as car and household maintenance, haircuts, fast food and restaurants, and other services).
15 Dunstan, C. & Langham, e. (2010), Close to Home: potential benefits of decentralised energy for NSW electricity consumers, prepared by the Institute for sustainable Futures, University of technology, sydney for the City of sydney.
16 australian Bureau of statistics (2011), Consumer Price Index: June Quarter 2011, www.ausstats.abs.gov.au
17 nelson, G., et al. (2010), Food security, farming, and climate change to 2050: Scenarios, results, policy options, IFPrI Issue Brief 66, International Food Policy research Institute (IFPrI), Washington DC.
18 this analysis was prepared by the sustainability advice team and Pitt and sherry and will be published by the Clean energy Council in a forthcoming consumer guide.
19 Kenington, D (2011) Energy Savings Scheme Cost Effectiveness Analysis Report, report to IPart, www.ipart.nsw.gov.au
20 Commonwealth of australia (2010), Report of the Prime Minister’s Task Group on Energy Efficiency, www.climatechange.gov.au.
1 australian academy of science (2010), The Science of Climate Change: Questions and Answers, www.science.org.au
2 Climate analytics (2011), Cancun Climate Talks – Keeping Options Open to Close the Gap, Climate action tracker Briefing Paper, www.climateactiontracker.org
3 australian academy of science (2010), as above.4 World resources Institute, Climate Analysis
Indicators Tool (CAIT) Version 8.0, Washington, DC, 2011
5 treasury (2011), Strong Growth Low Pollution: Modelling a Carbon Price, www.treasury.gov.au
6 Commonwealth of australia (2011), Securing a Clean Energy Future, www.climatechange.gov.au
7 this is the cumulative pollution savings over the period 2012-2020 under the 5 per cent and 25 per cent target, based on treasury (2011), as above.
8 Commonwealth of australia (2011), Securing a Clean Energy Future, www.climatechange.gov.au
9 australian Bureau of statistics (2011), Household Expenditure Survey, www.abs.gov.au.
10 Including consumer credit charges and motor vehicle insurance.
11 revisions to CPI methods since then mean that the measurement of inflation focuses on changes in the price of houses and housing services (such as rates and maintenance), and no longer directly includes mortgage interest payments.
12 Using the general method for identifying inflation spikes, increases in transport prices (including vehicle fuel) have not been the primary driver of any high inflation outcome for the two decades for which the data is available.
Drawing on the findings of the CsIrO-aeCOM study, the Climate Institute, ChOICe and aCOss have developed an interactive online tool where australian households can find out more about the carbon price and what it means for their cost of living. Go to: yourcarbonprice.com.au
28

In PartnershIP WIth
this spotlight report provides the Climate Institute’s overview of an independent study undertaken by CsIrO and aeCOM.
Consumer advocate, ChOICe, and the australian Council of social service (aCOss), who are partners in the Cost of Living project, provided input and advice throughout the study.
the full report The Carbon Price and the Cost of Living can be downloaded from www.climateinstitute.org.au
For more information about the carbon price and your cost of living go to yourcarbonprice.com.au


www.climateinstitute.org.au