25th financial analysts meet
TRANSCRIPT
Nestlé India Limited
Gurgaon 20th November 2015
25th Financial Analysts’ Meet
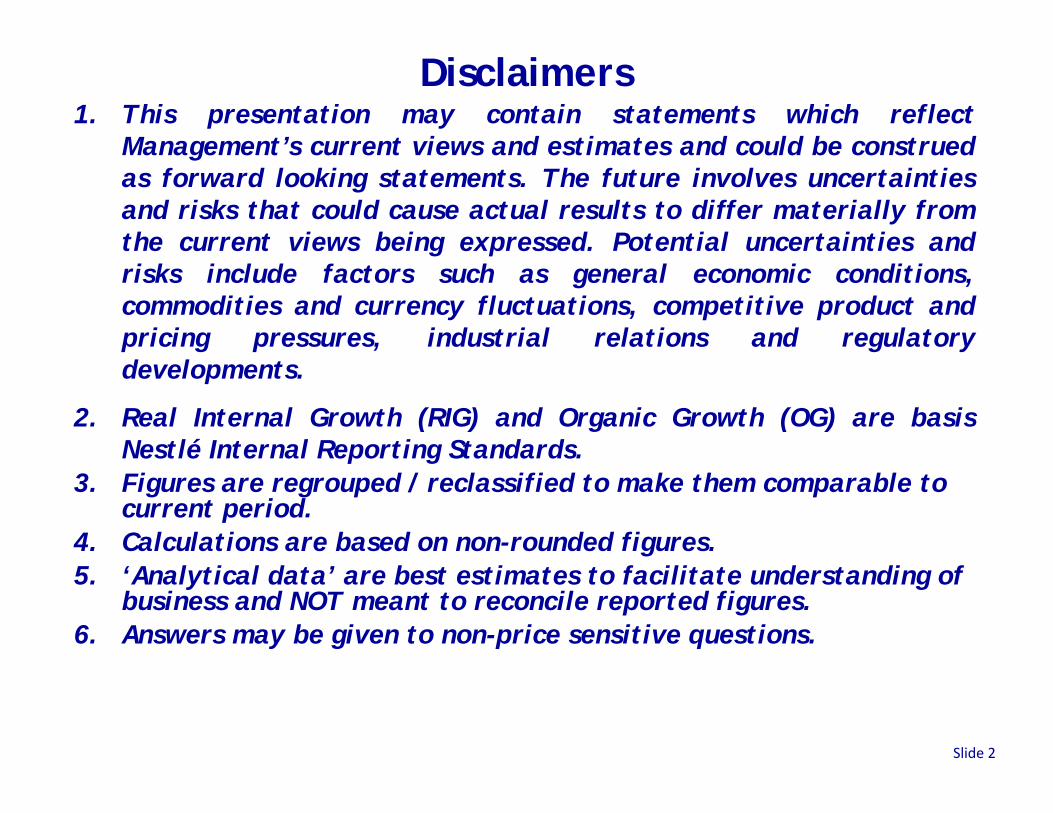
Disclaimers1. This presentation may contain statements which reflect
Management’s current views and estimates and could be construed as forward looking statements. The future involves uncertainties and risks that could cause actual results to differ materially from the current views being expressed. Potential uncertainties and risks include factors such as general economic conditions, commodities and currency fluctuations, competitive product and pricing pressures, industrial relations and regulatory developments.
2. Real Internal Growth (RIG) and Organic Growth (OG) are basis Nestlé Internal Reporting Standards.
3. Figures are regrouped / reclassified to make them comparable to current period.
4. Calculations are based on non-rounded figures.5. ‘Analytical data’ are best estimates to facilitate understanding of
business and NOT meant to reconcile reported figures. 6. Answers may be given to non-price sensitive questions.
Slide 2

Agenda
Slide 3
• Setting the Context & Strategic Suresh Narayanan Overview
• MAGGI Noodles Issue Sanjay Khajuria
• Key Financials Shobinder Duggal
• Questions & Answers

Financial Analysts’ MeetNestlé House
20.11.2015
Getting Stronger after the Storm !
2010
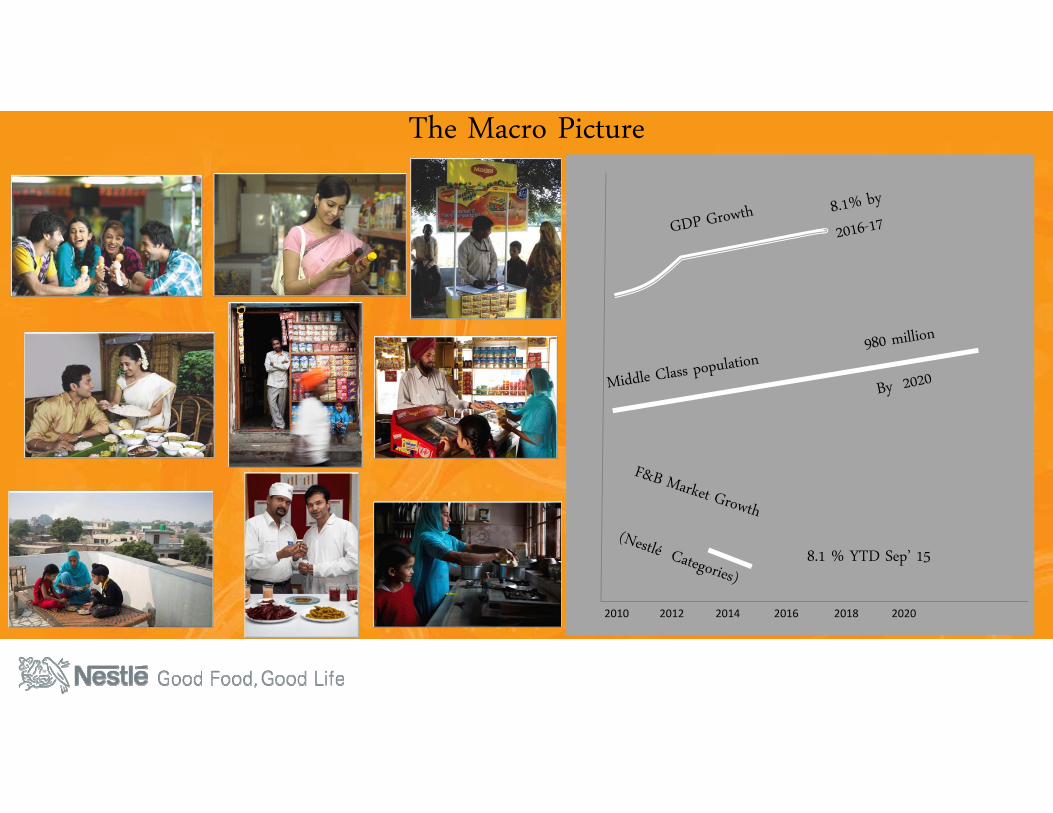
8.1 % YTD Sep’ 15
2012 2014 2016 2018 2020
The Macro Picture

Setting the Stage•Driving consumption across pyramid
•Metro towns (>10L) growth >50%
•Mega metros (>40L) becoming heterogeneous
•Villages transforming-Rural spends up
•Literacy co-relates with income
•Literacy and consumption +vely relatedLITERACY
URBANISATION
•Financially enabled women consume differently
•Working women increasing• Changing attitudes of women increasing
consumption
•Surge in internet and mobile penetration
•Brands/products under scrutiny
• Growing E-commerce makes markets and consumers
more accessible
•Double burden on the prowl
•Deficiency diseases
•Lifestyle diseases
•Proactive health
•Shorter shelf life for products, brands,
relationships
•No. of brands increasing
•Greater social acceptance for switching
•Consumers trade down on inflation halo
•Indians have tendency to trade up
RISING
WOMEN
TECHNOLOGY
SURGE
HEALTH
NOMADIC
CONSUMER
TRADING UP
& DOWN
• Improved literacy Improved standard of living
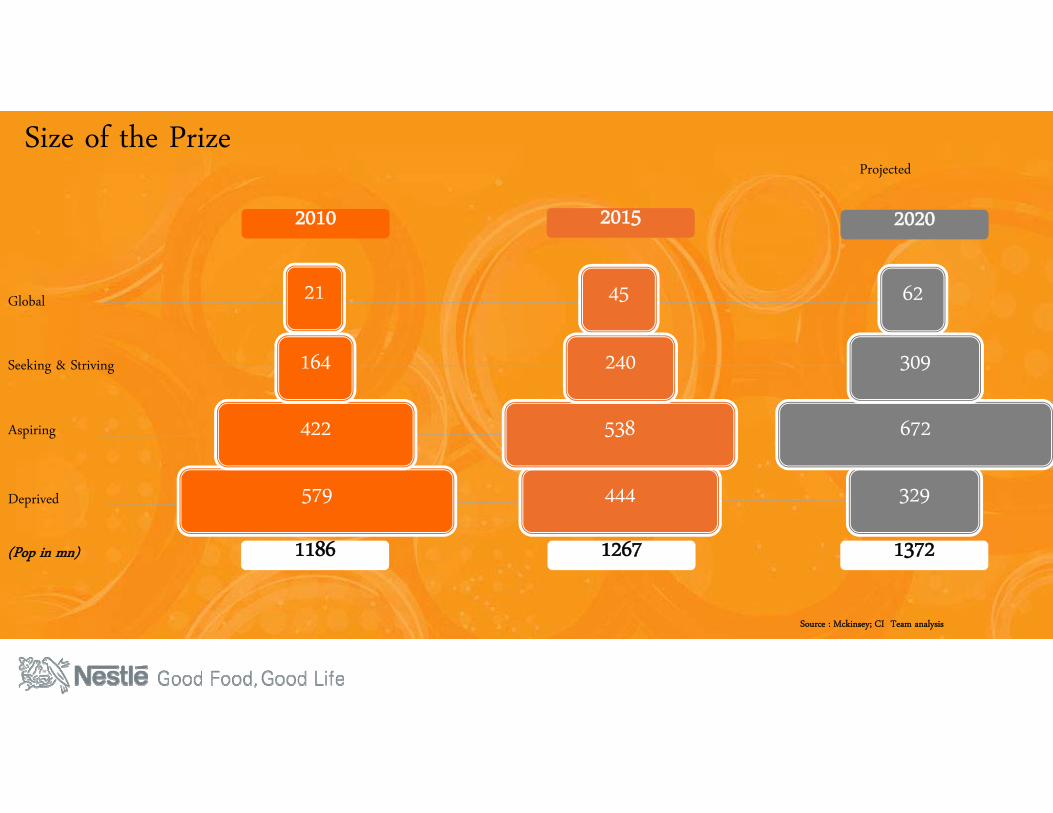
Source : Mckinsey; CI Team analysis
Size of the Prize
579
422
164
21
444
538
240
45
329
672
309
62Global
Seeking & Striving
Aspiring
Deprived
2010 2015 2020
1186 1267 1372(Pop in mn)
Projected
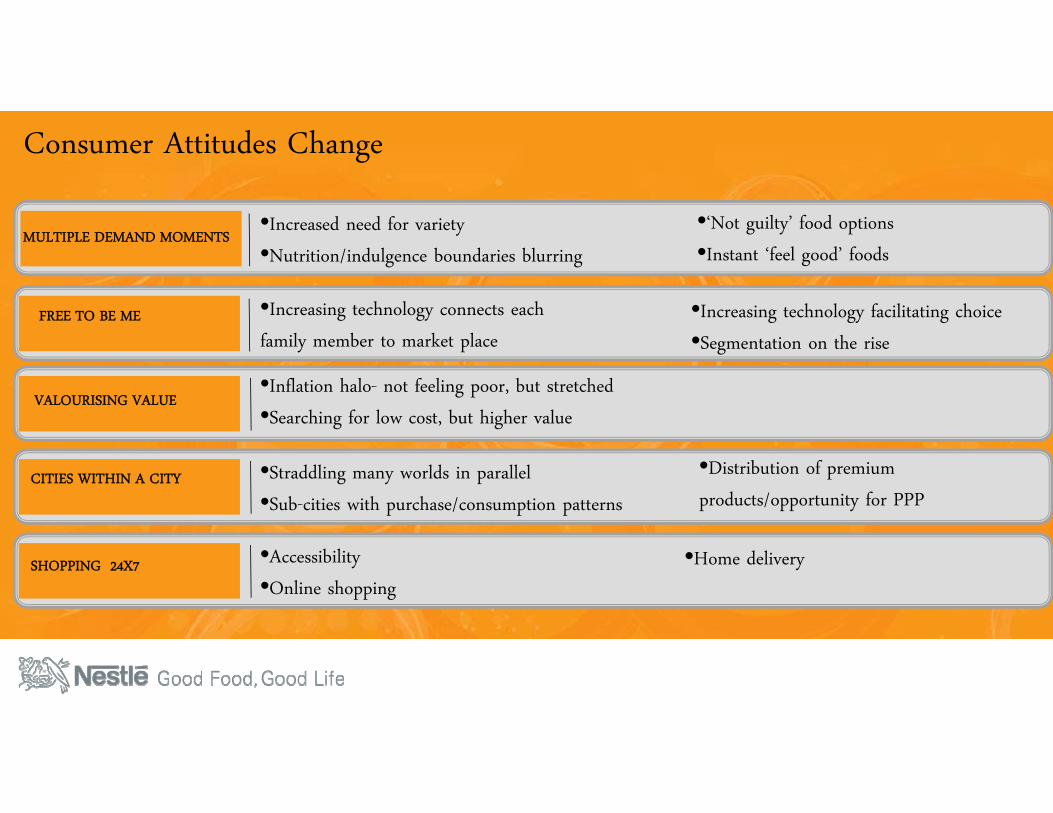
Consumer Attitudes Change
•Increased need for variety
•Nutrition/indulgence boundaries blurring
•‘Not guilty’ food options
•Instant ‘feel good’ foods
•Increasing technology connects each
family member to market placeFREE TO BE ME
MULTIPLE DEMAND MOMENTS
•Inflation halo- not feeling poor, but stretched
•Searching for low cost, but higher value
•Straddling many worlds in parallel
•Sub-cities with purchase/consumption patterns
•Accessibility
•Online shopping
VALOURISING VALUE
CITIES WITHIN A CITY
SHOPPING 24X7
•Increasing technology facilitating choice
•Segmentation on the rise
•Distribution of premium
products/opportunity for PPP
•Home delivery

10 Must Win Battles
Getting Stronger….

Bring Back ‘Double Digit’ Growth
Bring Nestlé Indiaback to stability

• Fast
• Focused
• Flexible
Learn to manage
Volatility and
Adversity
Revamp to be Fast,
Focused, Flexible
• Commercial Structures
• Environment Response Mechanisms
OUR PEOPLE:
Enable, Empower, Engage and
Energise
• Fit for Battle
• Accountability with responsibility
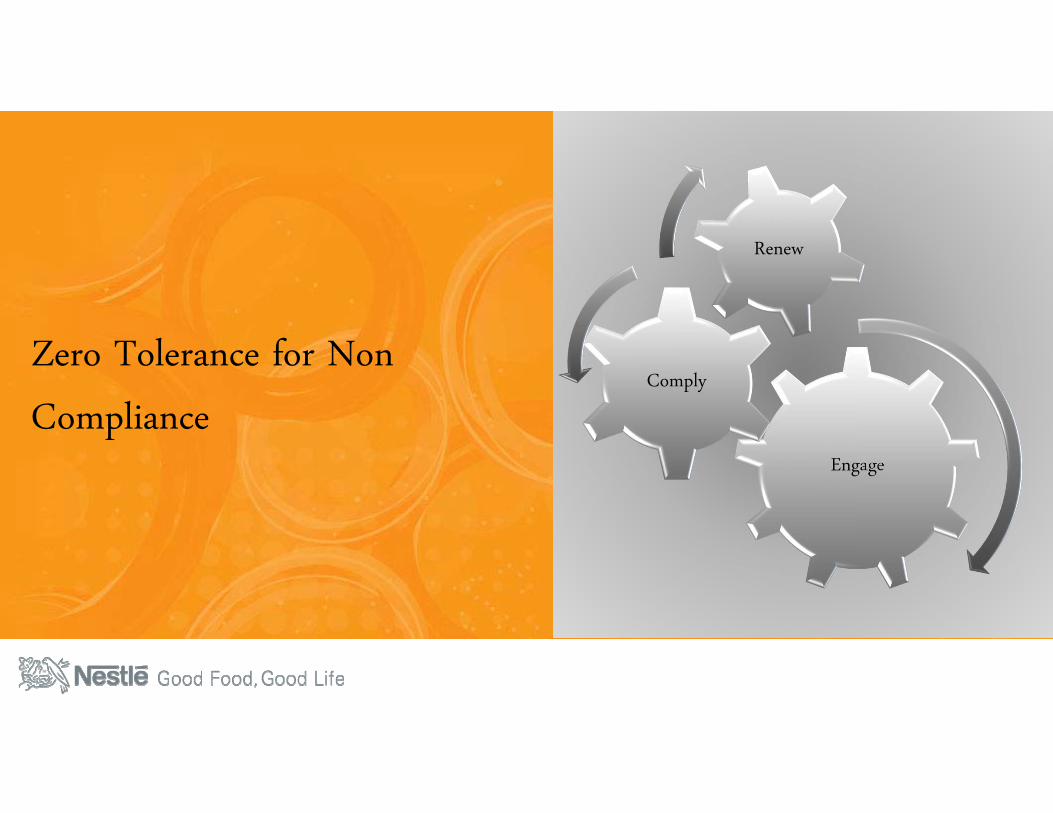
Zero Tolerance for Non
ComplianceEngage
Comply
Renew

Nurture Key Partners back to
health & trigger Positive
Relationships
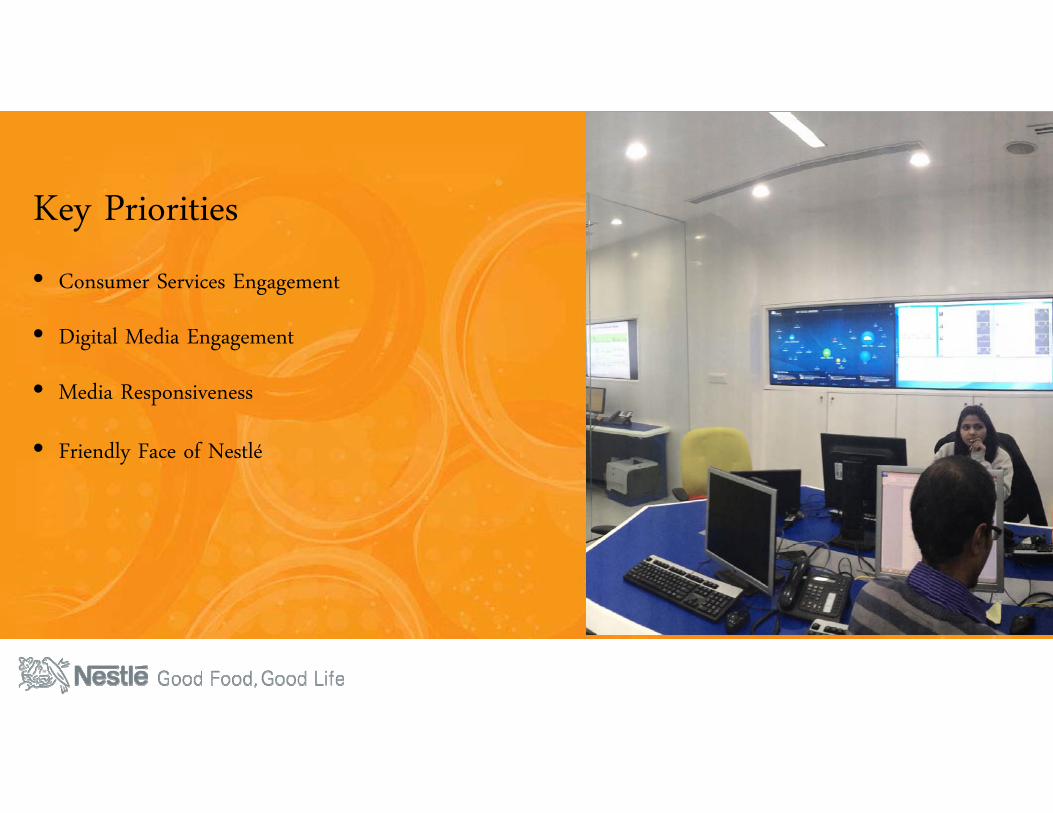
Key Priorities
• Consumer Services Engagement
• Digital Media Engagement
• Media Responsiveness
• Friendly Face of Nestlé
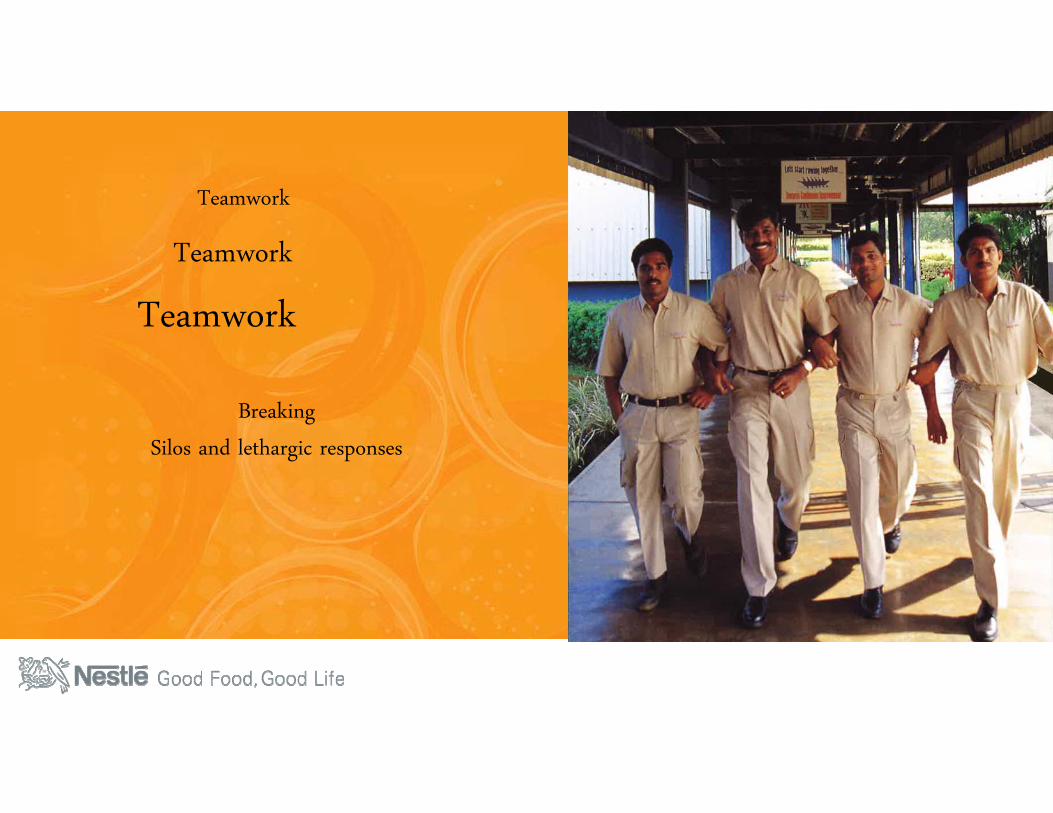
Breaking
Silos and lethargic responses
Teamwork
Teamwork
Teamwork
Proud to be Nestlé

What to expect
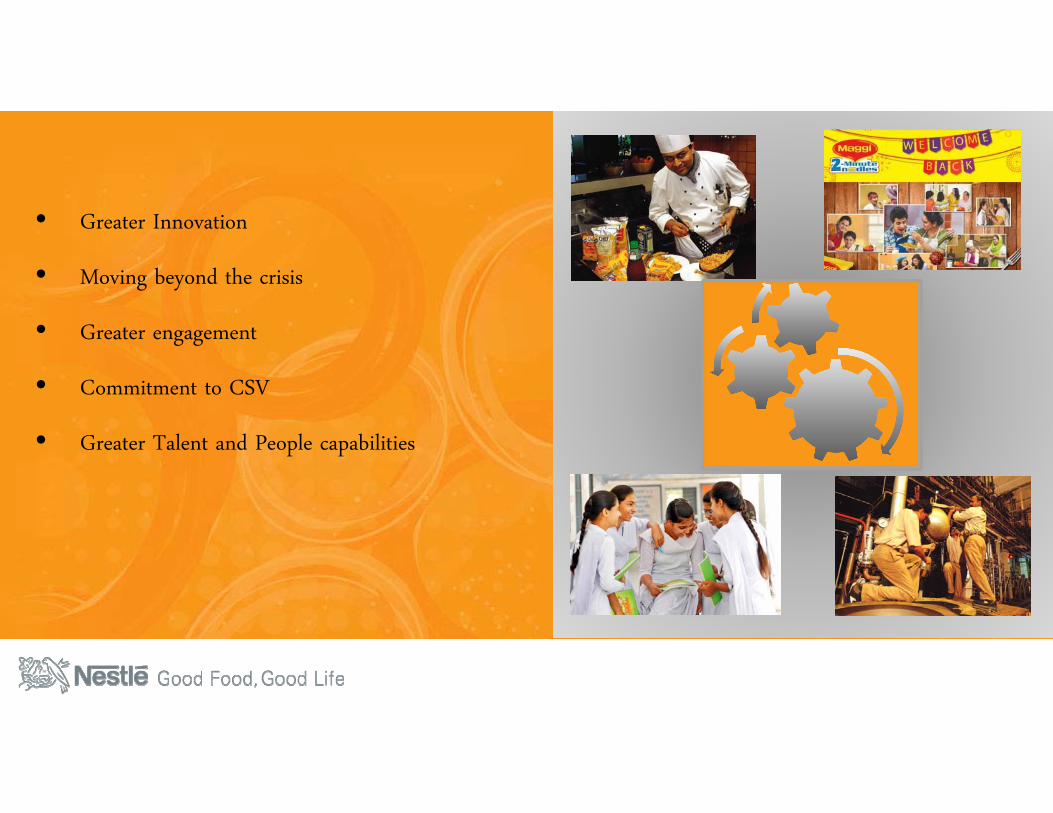
• Greater Innovation
• Moving beyond the crisis
• Greater engagement
• Commitment to CSV
• Greater Talent and People capabilities
MAGGI NOODLES UPDATE
Financial Analysts’ Meet20 November 2015
Nestlé House, Gurgaon
20 November 2015 Financial Analysts' Meet 2015 2
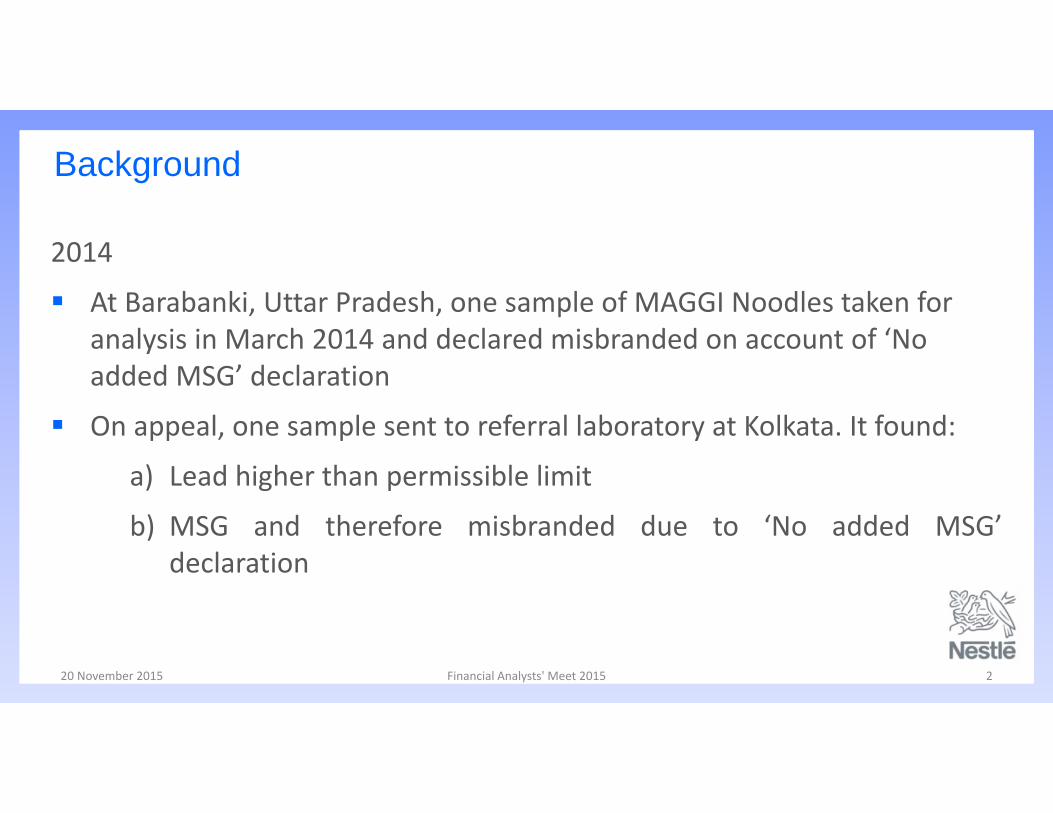
Background
2014
At Barabanki, Uttar Pradesh, one sample of MAGGI Noodles taken for analysis in March 2014 and declared misbranded on account of ‘No added MSG’ declaration
On appeal, one sample sent to referral laboratory at Kolkata. It found:
a) Lead higher than permissible limit
b) MSG and therefore misbranded due to ‘No added MSG’declaration
20 November 2015 Financial Analysts' Meet 2015 3
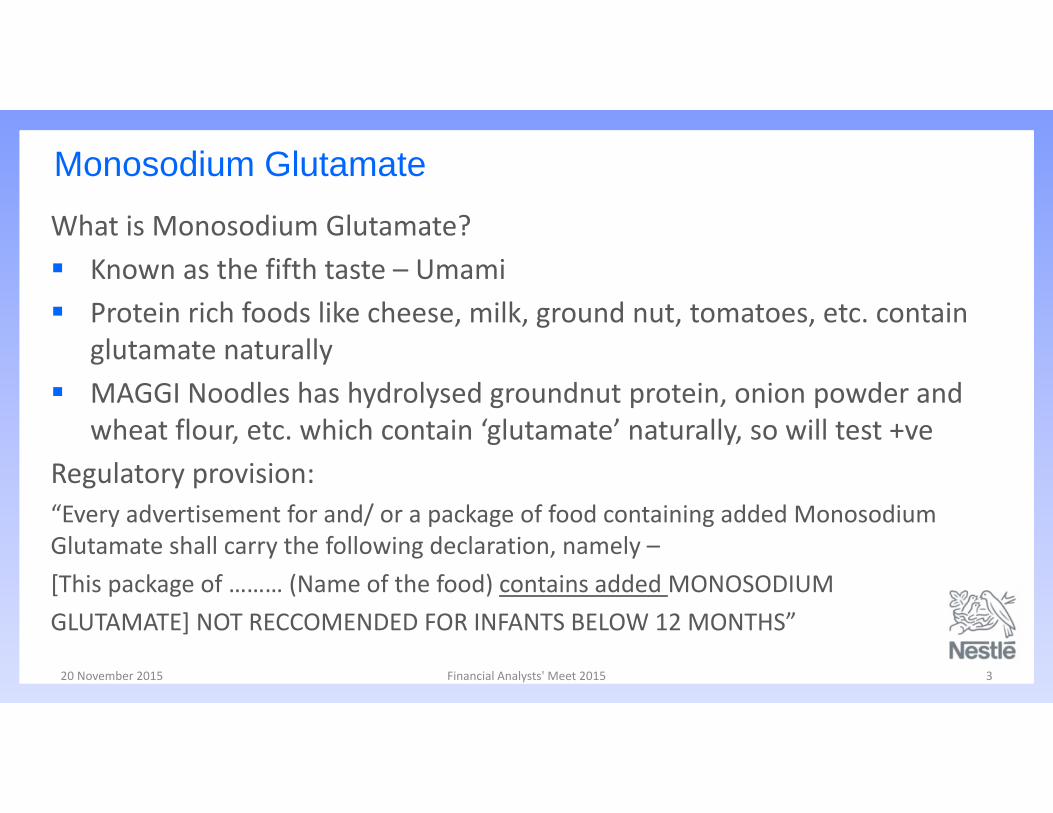
Monosodium Glutamate
What is Monosodium Glutamate? Known as the fifth taste – Umami Protein rich foods like cheese, milk, ground nut, tomatoes, etc. contain
glutamate naturally MAGGI Noodles has hydrolysed groundnut protein, onion powder and
wheat flour, etc. which contain ‘glutamate’ naturally, so will test +veRegulatory provision:“Every advertisement for and/ or a package of food containing added Monosodium Glutamate shall carry the following declaration, namely –[This package of ……… (Name of the food) contains added MONOSODIUM GLUTAMATE] NOT RECCOMENDED FOR INFANTS BELOW 12 MONTHS”

20 November 2015 Financial Analysts' Meet 2015 4
Lead
Lead occurs in the earth’s crust and is present in air, soil and dust Safety Limits are therefore fixed by regulators; in this case 2.5 “parts per
million”
We regularly monitors levels of lead in raw materials, water, packaging materials
All suppliers are audited by us Our tests have shown lead to be much below permissible limits The High Court mandated 3 independent NABL accredited, FSSAI notified
laboratories gave the same findings
20 November 2015 Financial Analysts' Meet 2015 5
At Nestlé Quality = Trust
300 personnel work in India in the area of food safety
11 Internal and External laboratories
NQAC laboratory at Moga factory has NABL accreditation and the capability to test heavy metals, antibiotics and other contaminants
Moga NQAC is capable of testing “Parts Per Billion”, whereas regulatory limits are only in “Parts Per Million”
100 million analyses are carried out every year globally
20 November 2015 Financial Analysts' Meet 2015 6
3,500 tests done in recent times at accredited labs (internal and external) have shown clear results
8 Countries including USA, UK, Singapore, Australia, etc. found MAGGI Noodles exported from India – “Safe for Consumption”
3 accredited labs mandated by Hon’ble Bombay High Court have cleared 100% samples (both existing and newly manufactured batches)
At Nestlé Quality = Trust

20 November 2015 Financial Analysts' Meet 2015 7
Test Results
0
0.5
1
1.5
2
2.5
Lead Result (ppm) ‐ All results Internal & External LabsTotal results 3,566 Nos.
MRL: 2.5 ppm
20 November 2015 Financial Analysts' Meet 2015 8
How it started
At Barabanki, Uttar Pradesh, one sample of MAGGI Noodles taken for analysis in March 2014 and declared misbranded on account of ‘No added MSG’ declaration
On appeal, one sample sent to referral laboratory at Kolkata. It found:
a) Lead higher than permissible limit
b) MSG and therefore misbranded due to ‘No added MSG’declaration
20 November 2015 Financial Analysts' Meet 2015 9
Background We were compliant and confident and in direct dialogues with
stakeholders Press Release ‐ 5th June 2015 12:30 AM“MAGGI Noodles are completely safe and have been trusted in India for over 30 years.The trust of our consumers and the safety of our products is our first priority. Unfortunately, recent developments and unfounded concerns about the product have led to an environment of confusion for the consumer, to such an extent that we have decided to withdraw the product off the shelves, despite the product being safe.We promise that the trusted MAGGI Noodles will be back in the market as soon as the current situation is clarified.”
Withdrawal process initiated. Around noon on 5th June, FSSAI ordered the ban on manufacture and
sale.
20 November 2015 Financial Analysts' Meet 2015 10
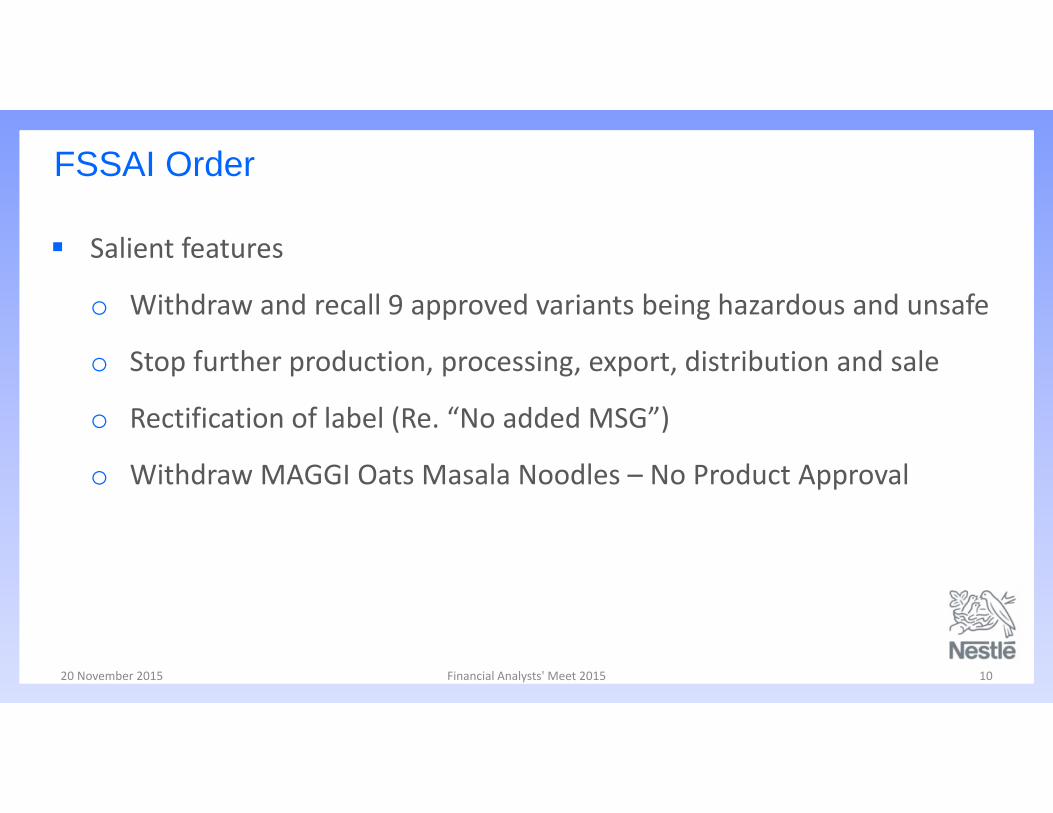
FSSAI Order
Salient features
o Withdraw and recall 9 approved variants being hazardous and unsafe
o Stop further production, processing, export, distribution and sale
o Rectification of label (Re. “No added MSG”)
o Withdraw MAGGI Oats Masala Noodles – No Product Approval

20 November 2015 Financial Analysts' Meet 2015 11
Proceedings before Hon’ble Bombay High Court
11th June – Petition filed in the High Court
13th August ‐ Bombay Court set aside the ban
Salient Features:
o Principles of Natural Justice not followed
o Labs conducting tests were not accredited
o ‘No Added MSG’ declaration – No ground for ban
o Refile application for MAGGI Oats Noodles
20 November 2015 Financial Analysts' Meet 2015 12
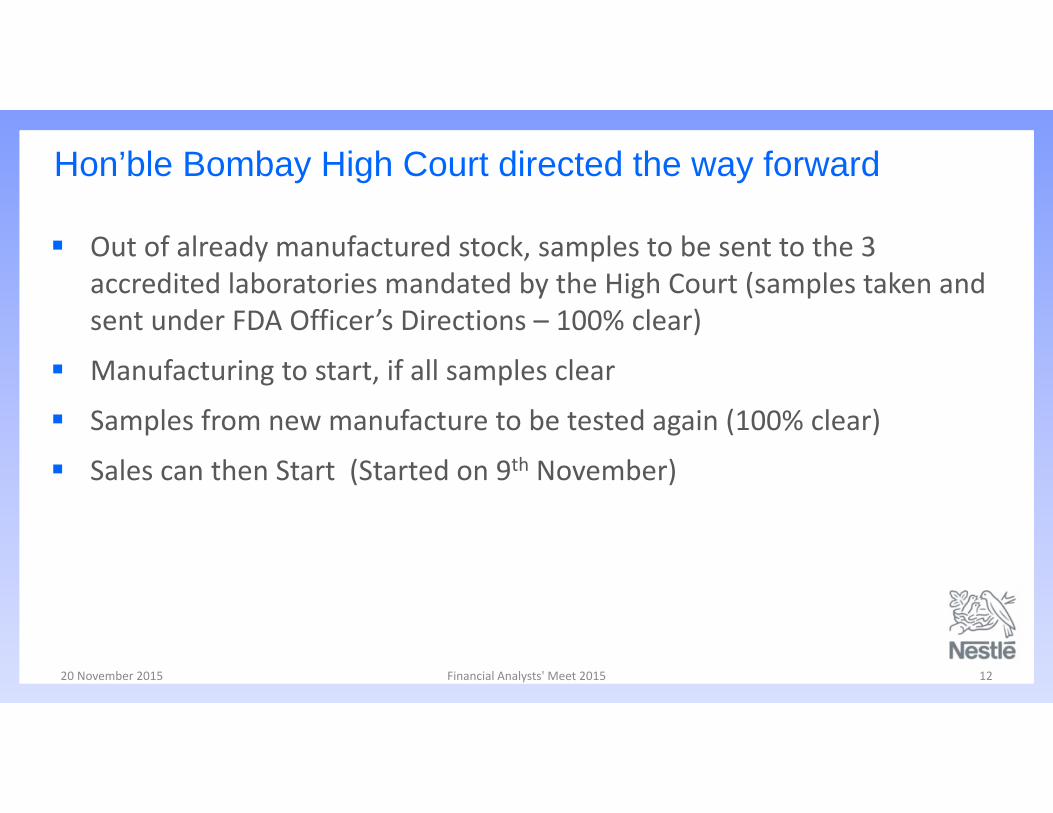
Hon’ble Bombay High Court directed the way forward
Out of already manufactured stock, samples to be sent to the 3 accredited laboratories mandated by the High Court (samples taken and sent under FDA Officer’s Directions – 100% clear)
Manufacturing to start, if all samples clear
Samples from new manufacture to be tested again (100% clear)
Sales can then Start (Started on 9th November)
20 November 2015 Financial Analysts' Meet 2015 13
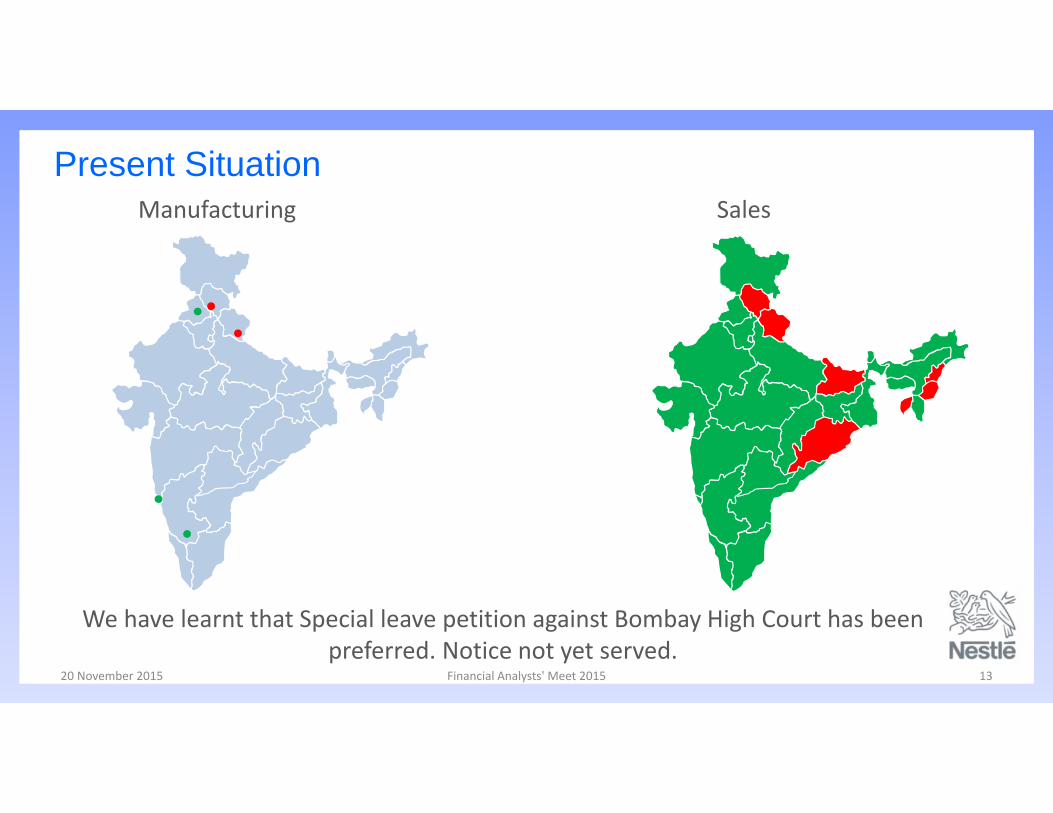
Present SituationManufacturing Sales
We have learnt that Special leave petition against Bombay High Court has been preferred. Notice not yet served.

20 November 2015 Financial Analysts' Meet 2015 14
Efficient and Transparent Withdrawal
Biggest withdrawal – handled professionally, transparently and efficiently
Immediate stoppage of Manufacturing, Blocked Stocks at Depots and Order processing, Customers’ stocks also blocked
Regular updates to FSSAI
Dedicated toll free number and customer care centre established
Recall information ads in leading mainline and regional newspapers
Picked up MAGGI directly from > 10,000 households
20 November 2015 Financial Analysts' Meet 2015 15
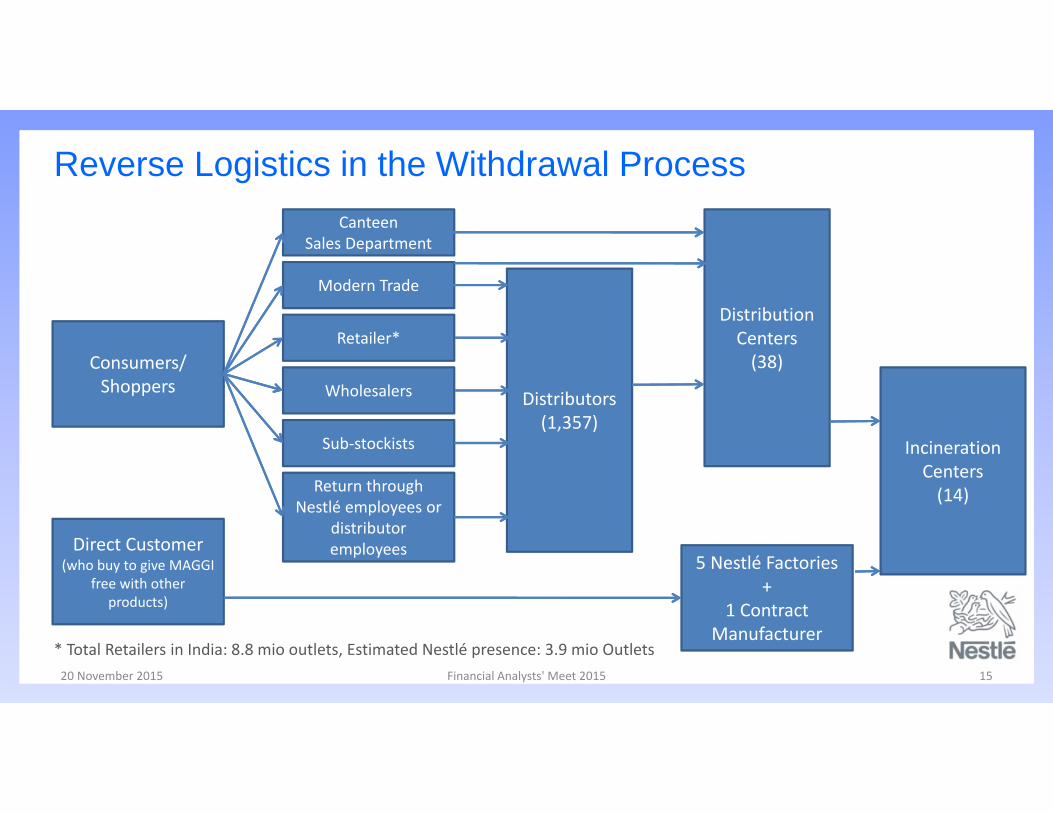
Reverse Logistics in the Withdrawal Process
Consumers/ Shoppers
CanteenSales Department
Modern Trade
Retailer*
Wholesalers
Sub‐stockists
Return through Nestlé employees or
distributor employees
Distributors(1,357)
Distribution Centers(38)
IncinerationCenters(14)
Direct Customer(who buy to give MAGGI
free with other products)
5 Nestlé Factories+
1 Contract Manufacturer
* Total Retailers in India: 8.8 mio outlets, Estimated Nestlé presence: 3.9 mio Outlets
20 November 2015 Financial Analysts' Meet 2015 16
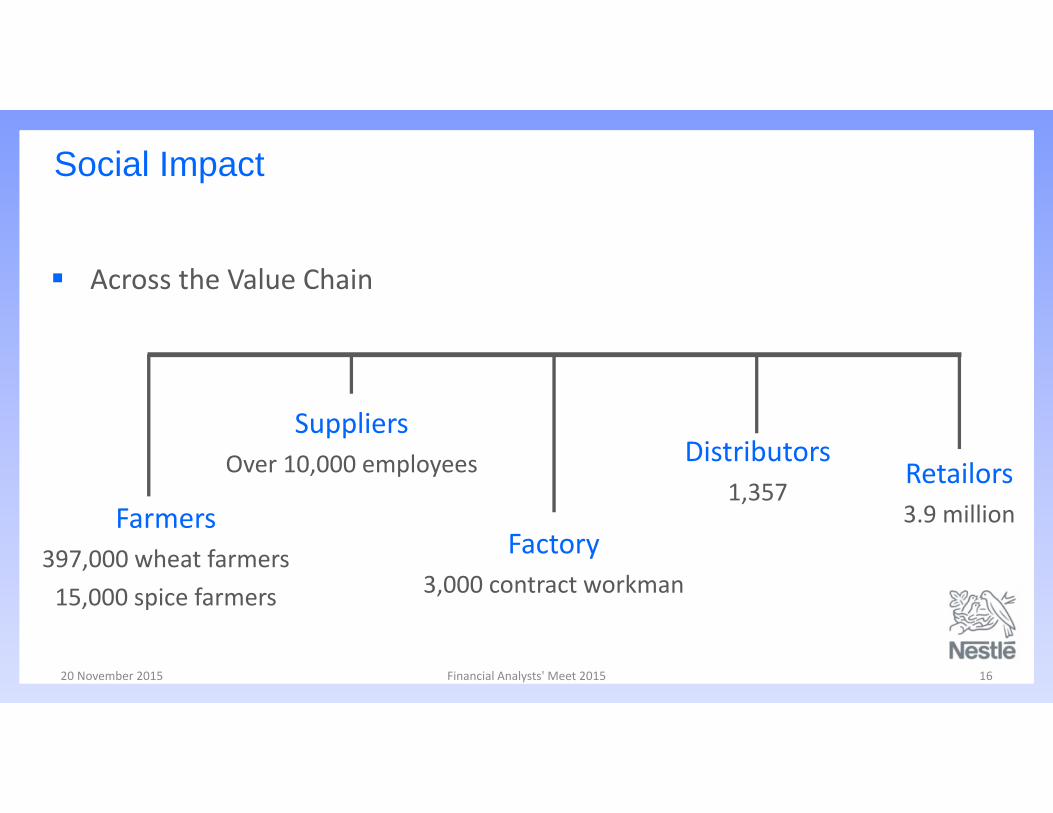
Social Impact
Across the Value Chain
Farmers397,000 wheat farmers15,000 spice farmers
SuppliersOver 10,000 employees
Factory3,000 contract workman
Distributors1,357
Retailors3.9 million
20 November 2015 Financial Analysts' Meet 2015 17
NCDRC
The Consumer Affairs Ministry filed a complaint before NCDRC seeking Rs. 640 Crores
Main allegations similar to the ones decided by Hon’ble Bombay High Court
NCDRC has sent 13 samples to CFTRI, Mysore for testing the level of Lead and MSG.
20 November 2015 Financial Analysts' Meet 2015 18
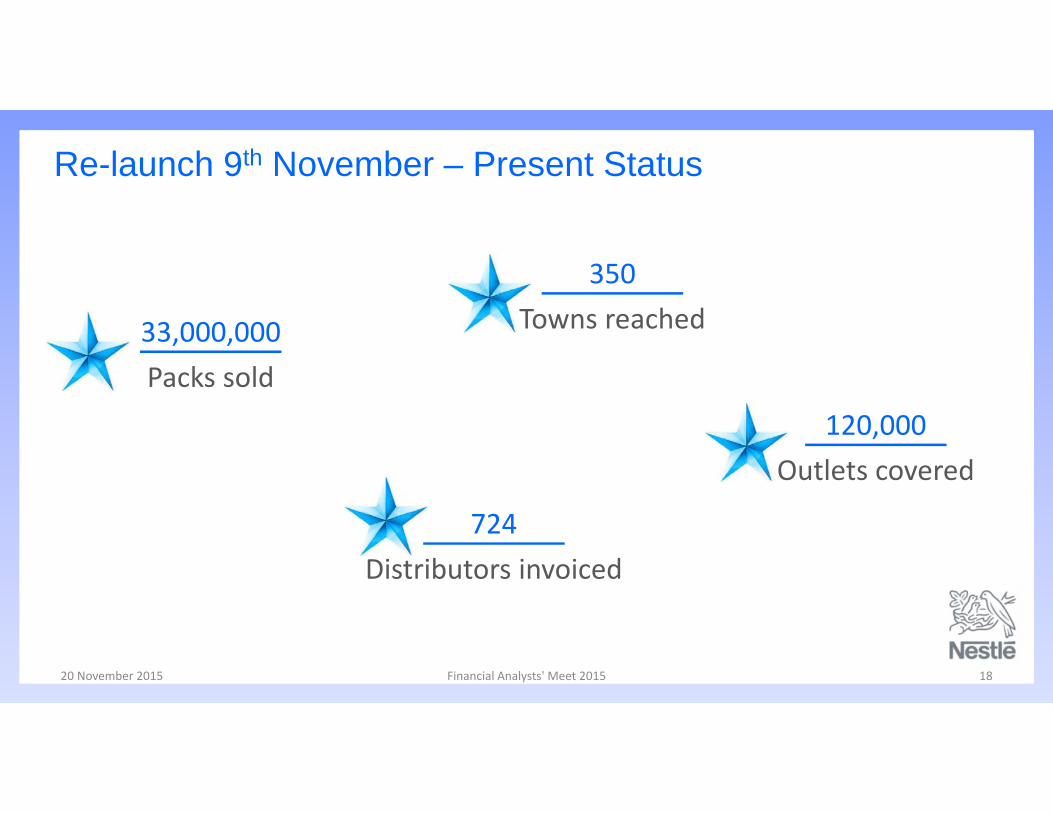
Re-launch 9th November – Present Status
33,000,000Packs sold
120,000Outlets covered
724Distributors invoiced
350Towns reached
20 November 2015 Financial Analysts' Meet 2015 19
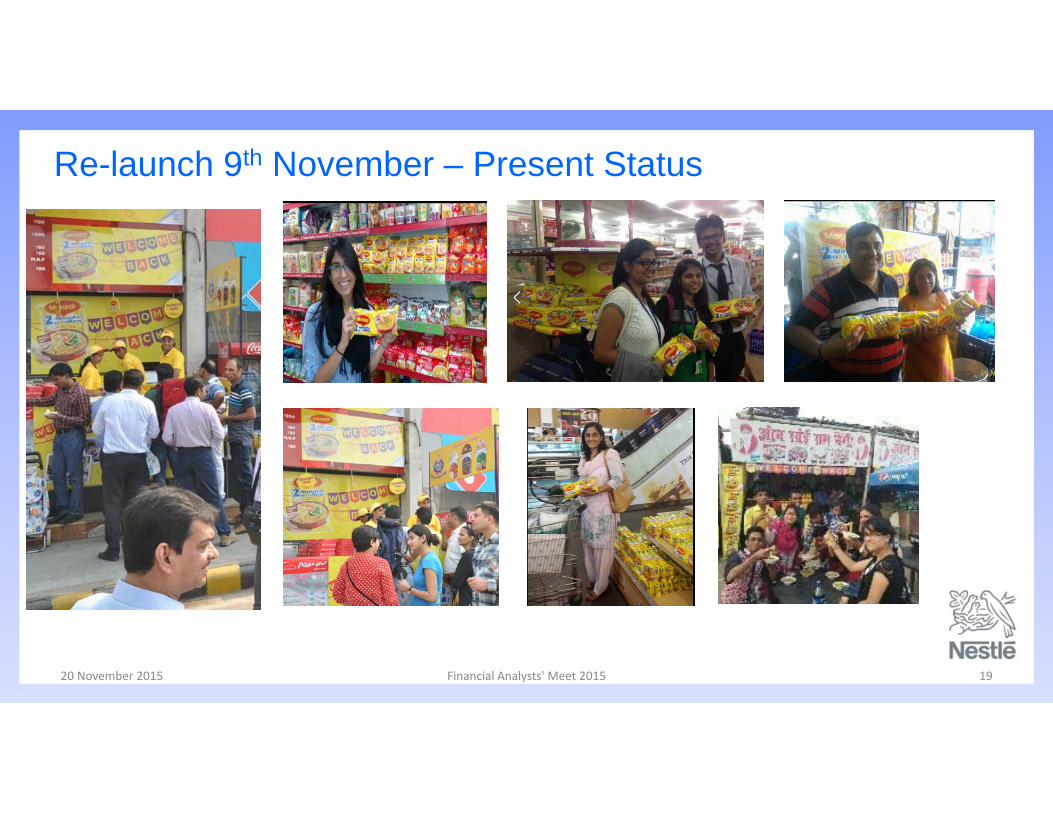
Re-launch 9th November – Present Status
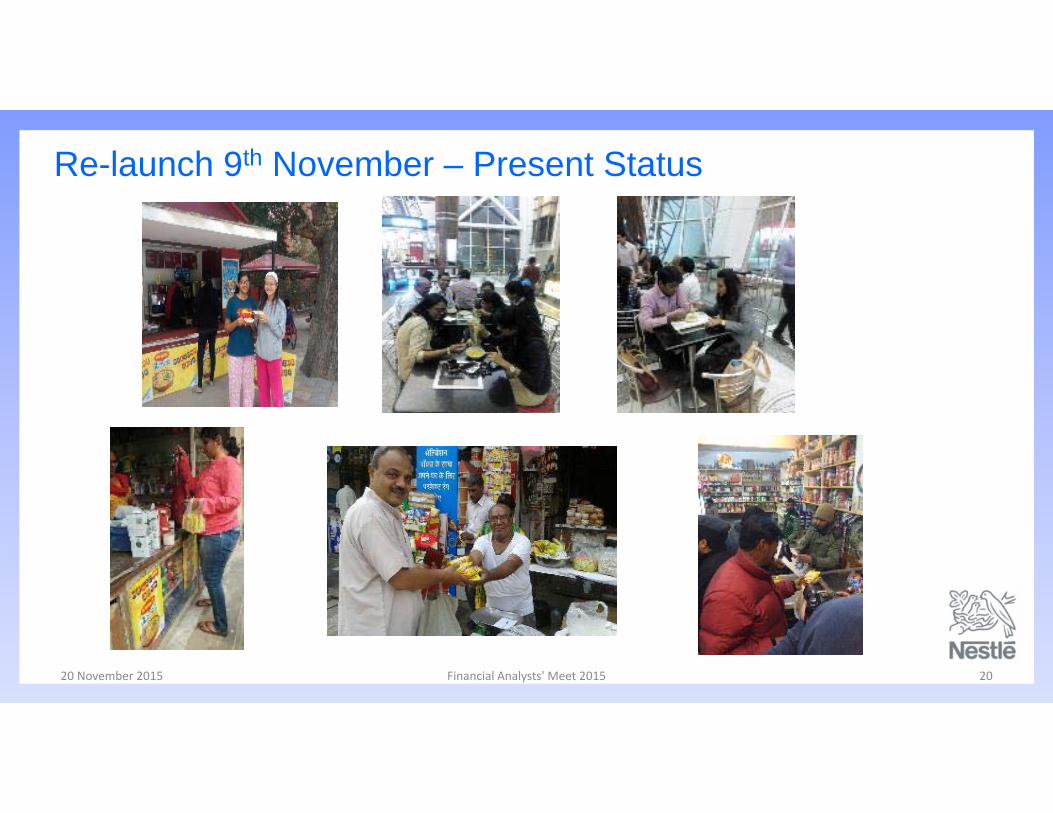
20 November 2015 Financial Analysts' Meet 2015 20
Re-launch 9th November – Present Status
Slide 1
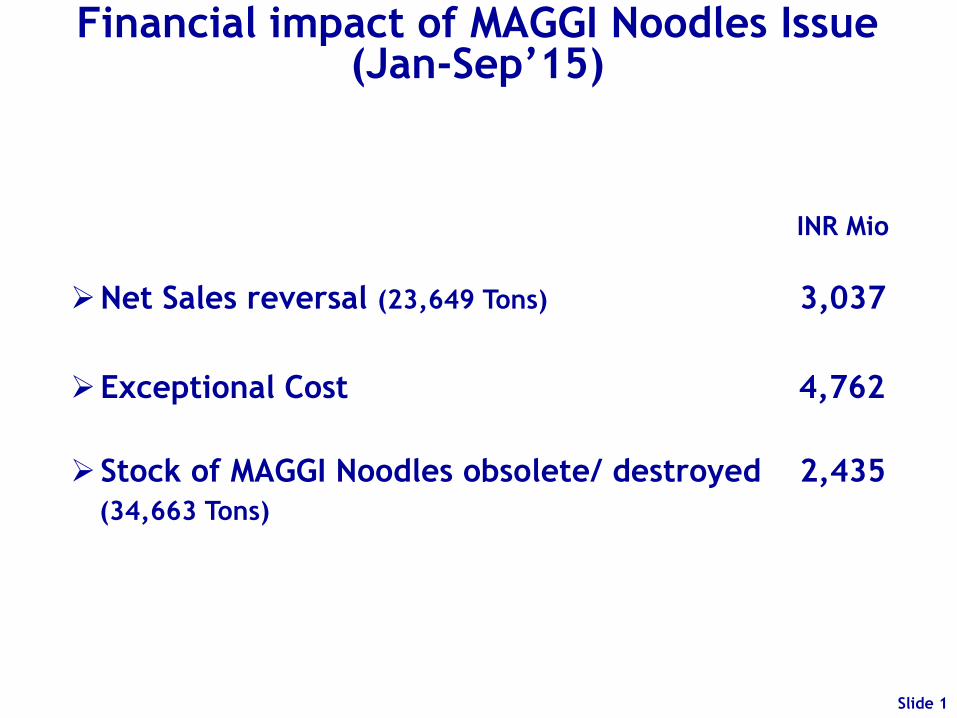
Financial impact of MAGGI Noodles Issue (Jan-Sep’15)
Slide 1
INR Mio
Net Sales reversal (23,649 Tons) 3,037
Exceptional Cost 4,762
Stock of MAGGI Noodles obsolete/ destroyed 2,435
(34,663 Tons)

INR 3,148 mio
INR 1,614 mio
Costs already incurred and reclassified to Exceptional Cost
Incremental costs due to MAGGI Noodles withdrawal
Exceptional Cost
-Cost of finished goods (Variable +Fixed)
-Obsolescence of RM/PM/ WIP
-Duties & Taxes etc.
-Third party commitments
-Reverse transportation
-Cost of incinerating stock
-Handling, repacking
-Laboratory testing
-Administrative costs
Slide 2
34% 66%
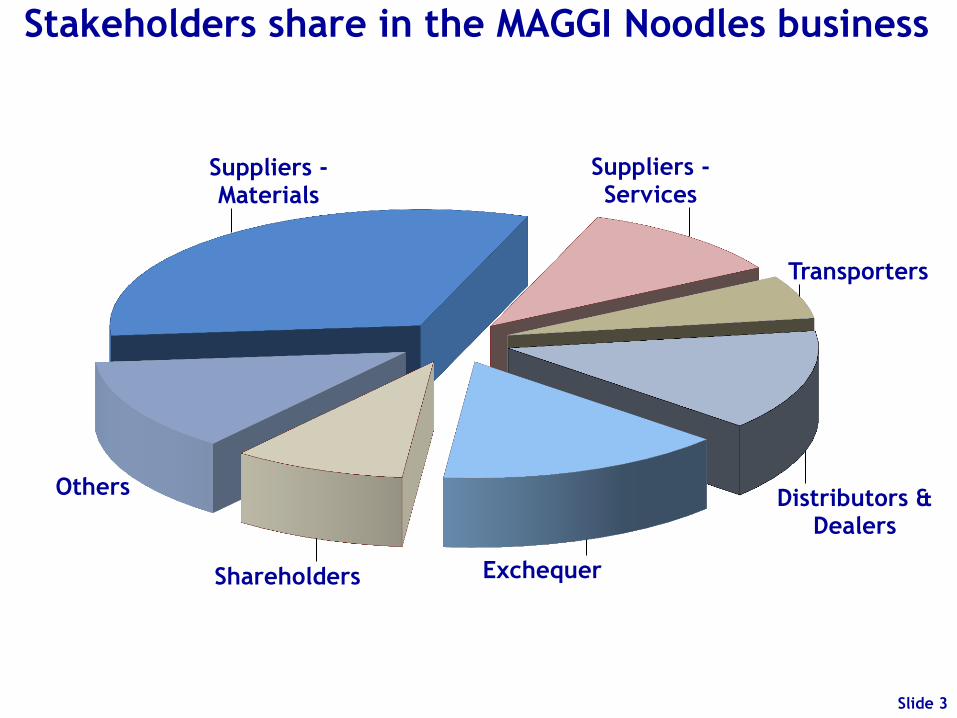
Suppliers - Materials
Suppliers - Services
Transporters
Distributors & Dealers
Exchequer Shareholders
Others
Stakeholders share in the MAGGI Noodles business
Slide 3
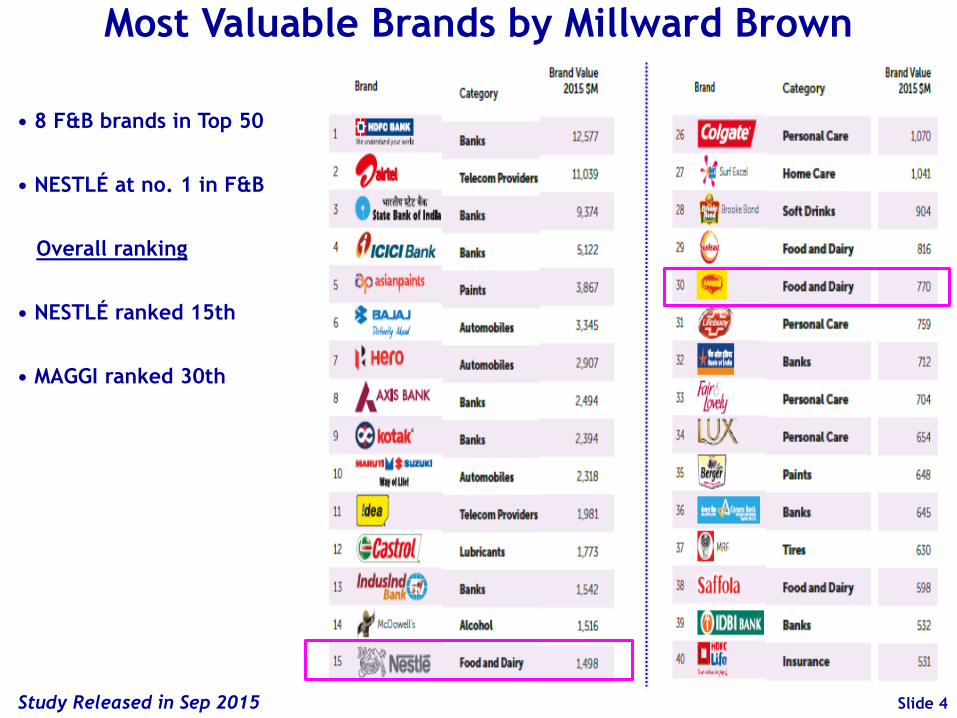
Most Valuable Brands by Millward Brown
Slide 4
• 8 F&B brands in Top 50
• NESTLÉ at no. 1 in F&B
Overall ranking
• NESTLÉ ranked 15th
• MAGGI ranked 30th
Study Released in Sep 2015
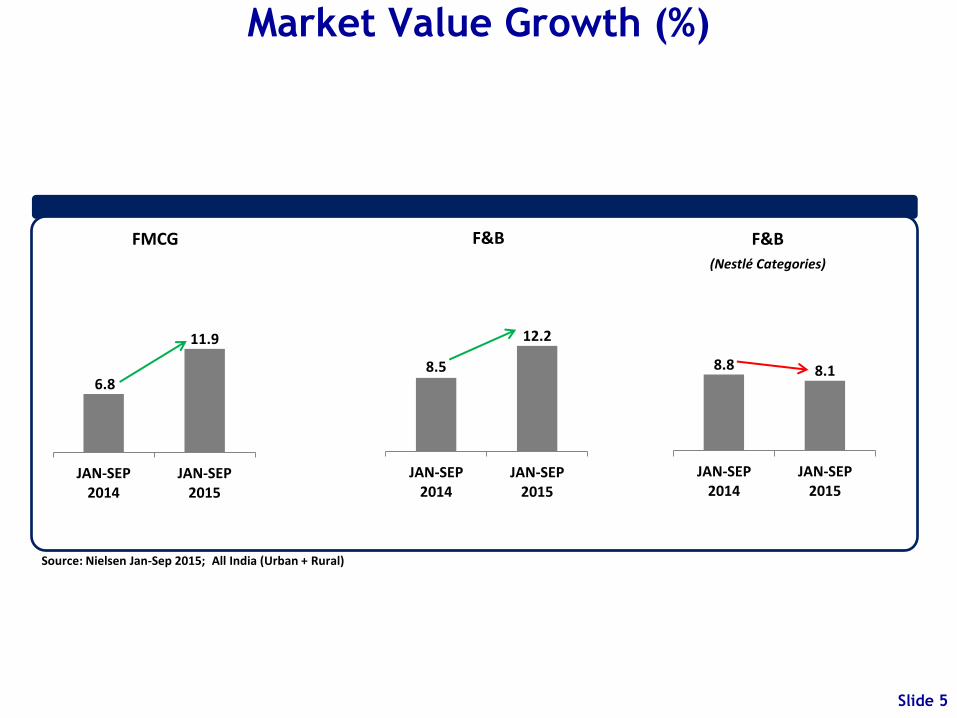
6.8
11.9
JAN-SEP2014
JAN-SEP2015
FMCG
8.5
12.2
JAN-SEP2014
JAN-SEP2015
F&B
8.8 8.1
JAN-SEP2014
JAN-SEP2015
F&B
(Nestlé Categories)
Source: Nielsen Jan-Sep 2015; All India (Urban + Rural)
Market Value Growth (%)
Slide 5
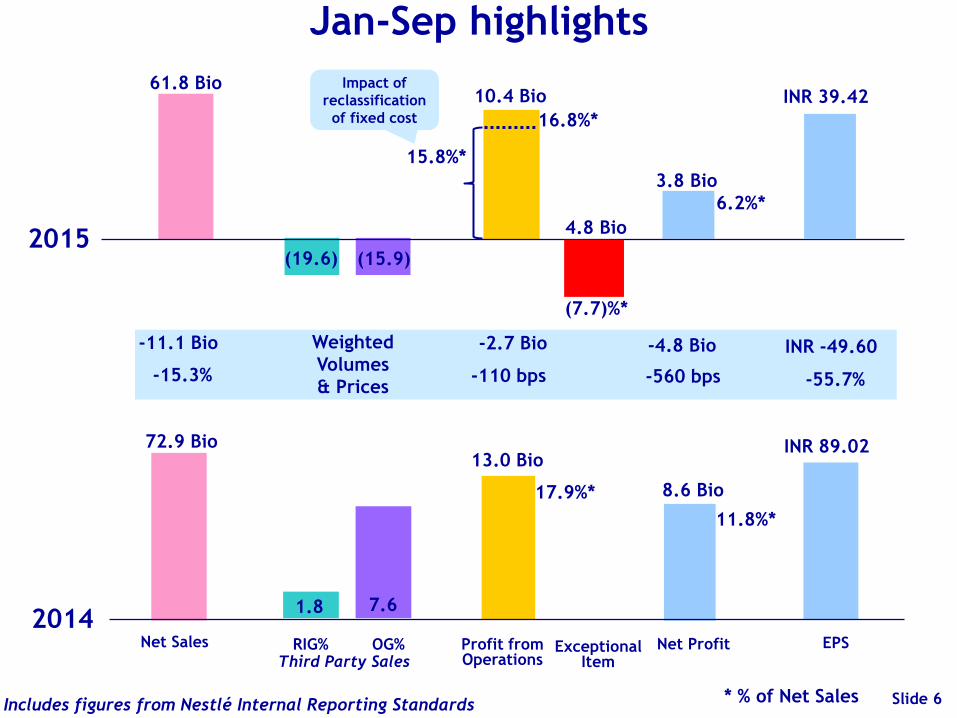
RIG% OG% Net Sales
61.8 Bio
-15.3% -110 bps
Weighted
Volumes
& Prices
Profit from Operations
10.4 Bio
Includes figures from Nestlé Internal Reporting Standards
-11.1 Bio
Net Profit Third Party Sales
* % of Net Sales
-560 bps
6.2%*
Jan-Sep highlights
2015
2014
INR -49.60
-55.7%
EPS
72.9 Bio
17.9%*
13.0 Bio
8.6 Bio
11.8%*
INR 89.02
Slide 6
1.8 7.6
(19.6)
-4.8 Bio
(15.9)
3.8 Bio
INR 39.42
-2.7 Bio
4.8 Bio
(7.7)%*
Exceptional Item
Slide 6
16.8%*
Impact of
reclassification
of fixed cost
15.8%*

4.2 4.2 4.6 4.9 5.2 3.2 2.0
23.1 24.2 25.6 25.2 25.1 19.3 17.4
Q3
2.9 9.3 8.9 11.7 8.4 (20.1) (32.1)
Q1 Q2 Q4
OPBIT
NET SALES % YoY
growth
18.0 17.5 18.1 19.4 20.6 16.7 11.4 % of
Net
Sales
2014 2015
INR Bio
INR Bio
98.1 Bio = 8.2% 61.8 Bio = -15.3%
17.9 Bio = 18.3%
Quarterly evolution of results
Slide 7
10.4 Bio = 16.8%
# 13.7% without reclassification of fixed cost to Exceptional item
## 2.7 Bio without reclassification of fixed cost to Exceptional item
#
##
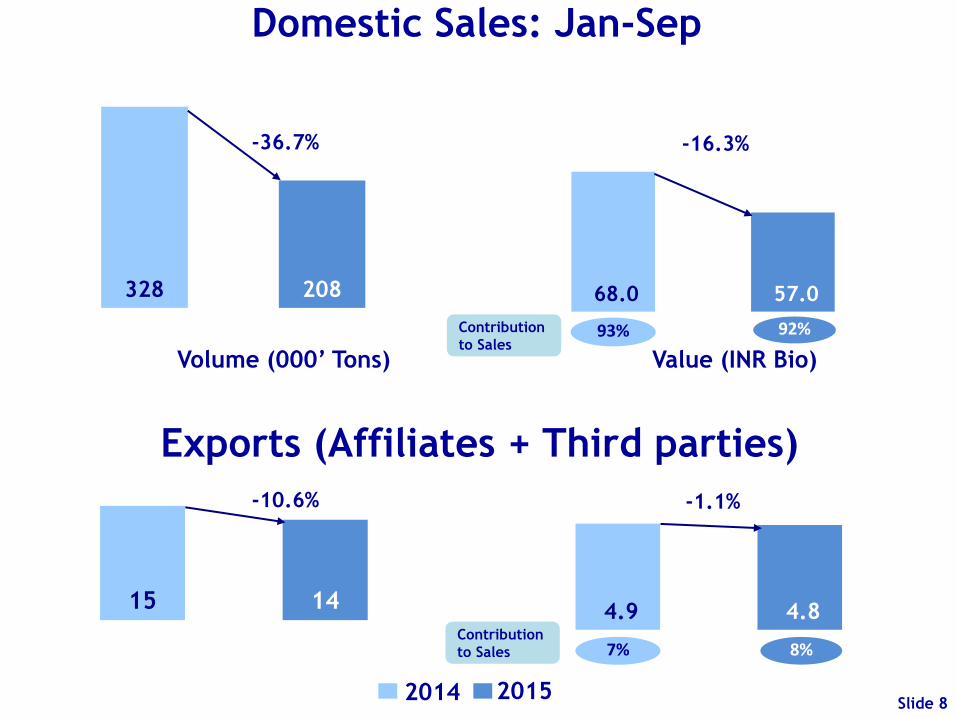
Domestic Sales: Jan-Sep
15 14 4.9 4.8
68.0 57.0 328 208
Exports (Affiliates + Third parties)
-36.7% -16.3%
-10.6% -1.1%
Volume (000’ Tons) Value (INR Bio)
2014 2015 Slide 8
Contribution
to Sales 93%
7%
92%
8% Contribution
to Sales
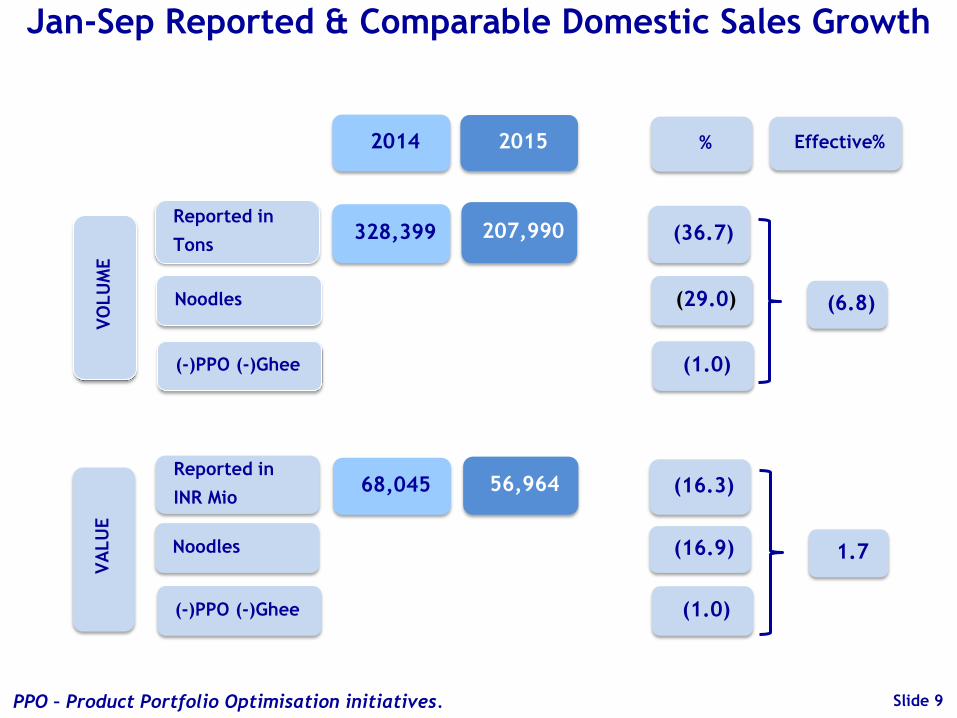
2015
Reported in
Tons 207,990
2014
328,399
%
(36.7)
Reported in
INR Mio 56,964 68,045 (16.3)
Slide 9
(6.8)
1.7
Effective%
Noodles (29.0)
Noodles (16.9)
(-)PPO (-)Ghee (1.0)
(-)PPO (-)Ghee (1.0)
Slide 9
VO
LU
ME
VA
LU
E
Jan-Sep Reported & Comparable Domestic Sales Growth
PPO – Product Portfolio Optimisation initiatives.
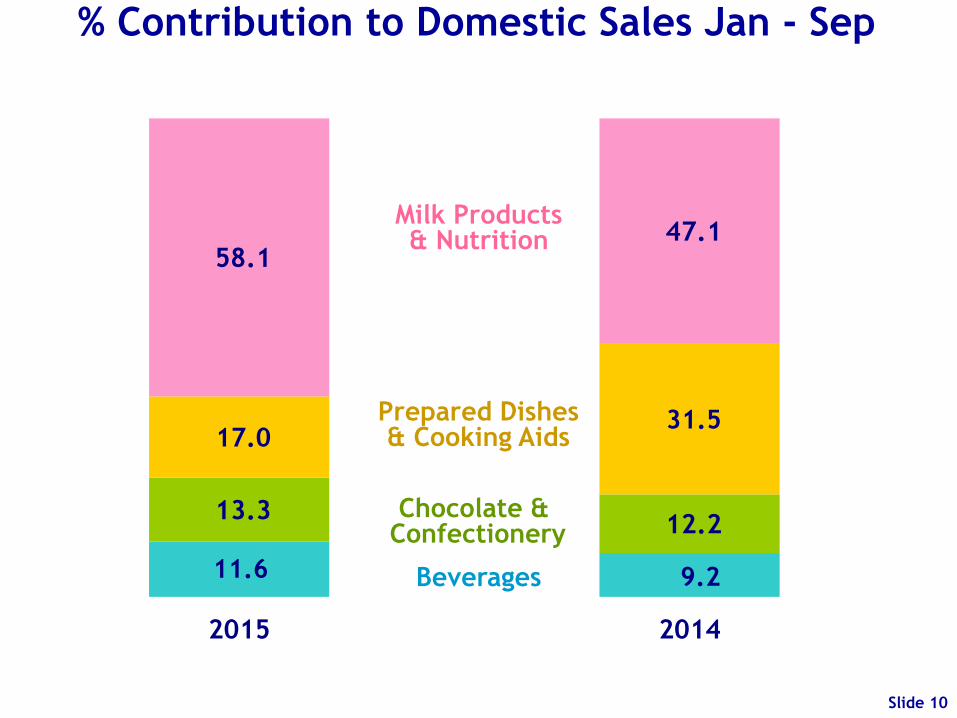
11.6 9.2
13.3 12.2
17.0 31.5
58.1 47.1
2015 2014
Chocolate & Confectionery
Prepared Dishes & Cooking Aids
Beverages
Milk Products & Nutrition
% Contribution to Domestic Sales Jan - Sep
Slide 10
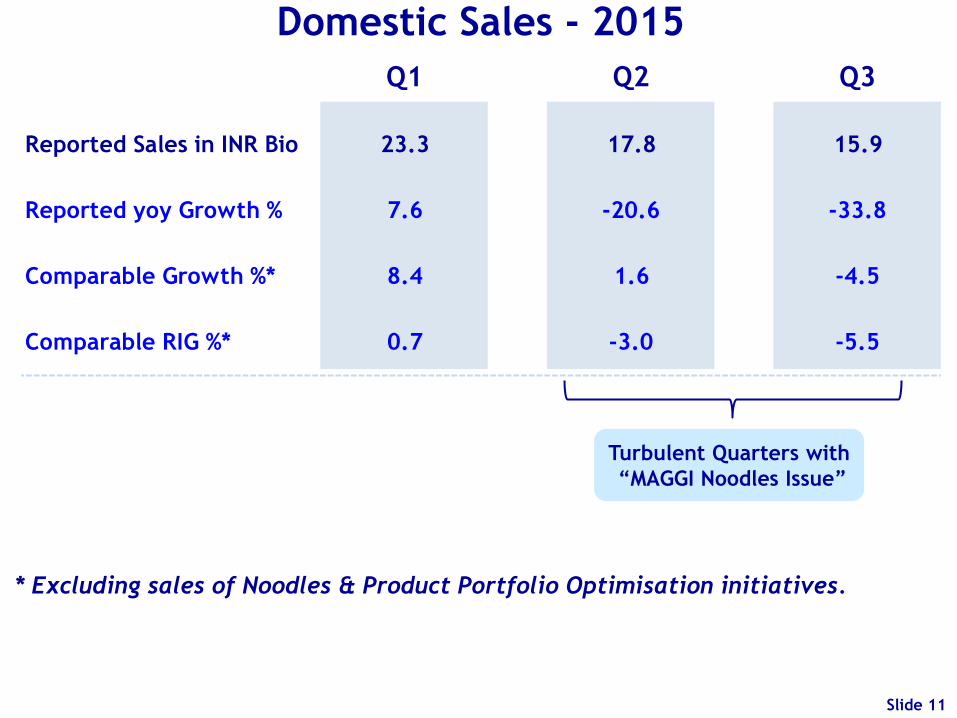
Domestic Sales - 2015
* Excluding sales of Noodles & Product Portfolio Optimisation initiatives.
Turbulent Quarters with
“MAGGI Noodles Issue”
Slide 11
Q1 Q2 Q3
23.3 17.8 15.9
Reported yoy Growth % 7.6 -20.6 -33.8
Comparable Growth %* 8.4 1.6 -4.5
Comparable RIG %* 0.7 -3.0 -5.5
Reported Sales in INR Bio
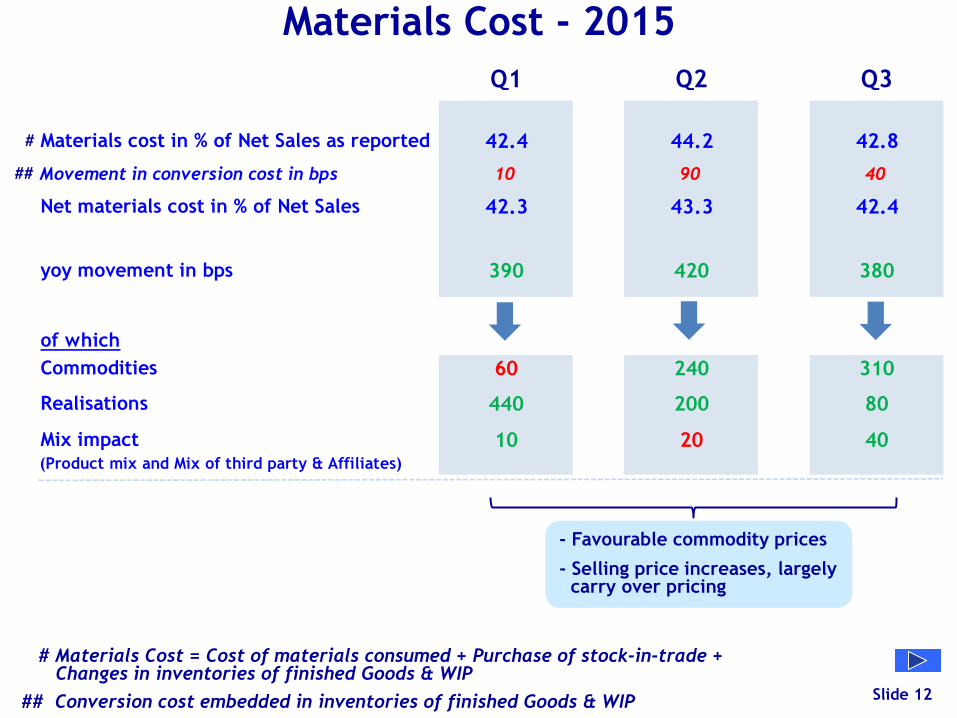
Materials Cost - 2015
# Materials Cost = Cost of materials consumed + Purchase of stock-in-trade + Changes in inventories of finished Goods & WIP
## Conversion cost embedded in inventories of finished Goods & WIP Slide 12
- Favourable commodity prices
- Selling price increases, largely carry over pricing
#
##
Q1 Q2 Q3
42.4 44.2 42.8
10 90 40
42.3 43.3 42.4
390 420 380
of which
60 240 310
440 200 80
10 20 40
Materials cost in % of Net Sales as reported
Commodities
Movement in conversion cost in bps
Net materials cost in % of Net Sales
(Product mix and Mix of third party & Affiliates)
Mix impact
Realisations
yoy movement in bps
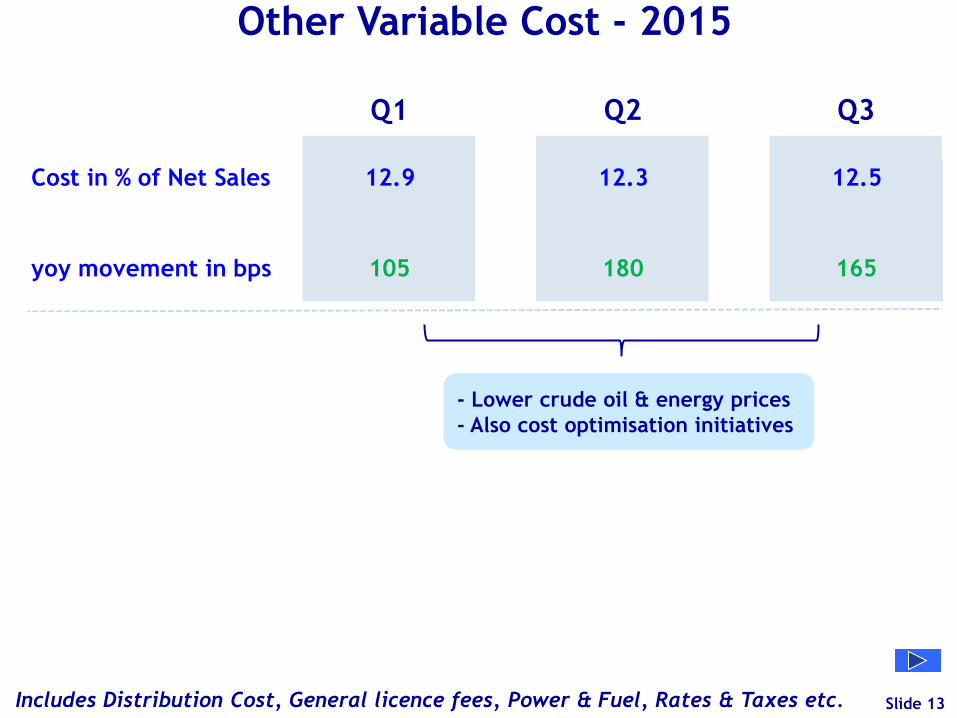
Other Variable Cost - 2015
Includes Distribution Cost, General licence fees, Power & Fuel, Rates & Taxes etc.
- Lower crude oil & energy prices
- Also cost optimisation initiatives
Slide 13
Q1 Q2 Q3
12.9 12.3 12.5
105 180 165
Cost in % of Net Sales
yoy movement in bps
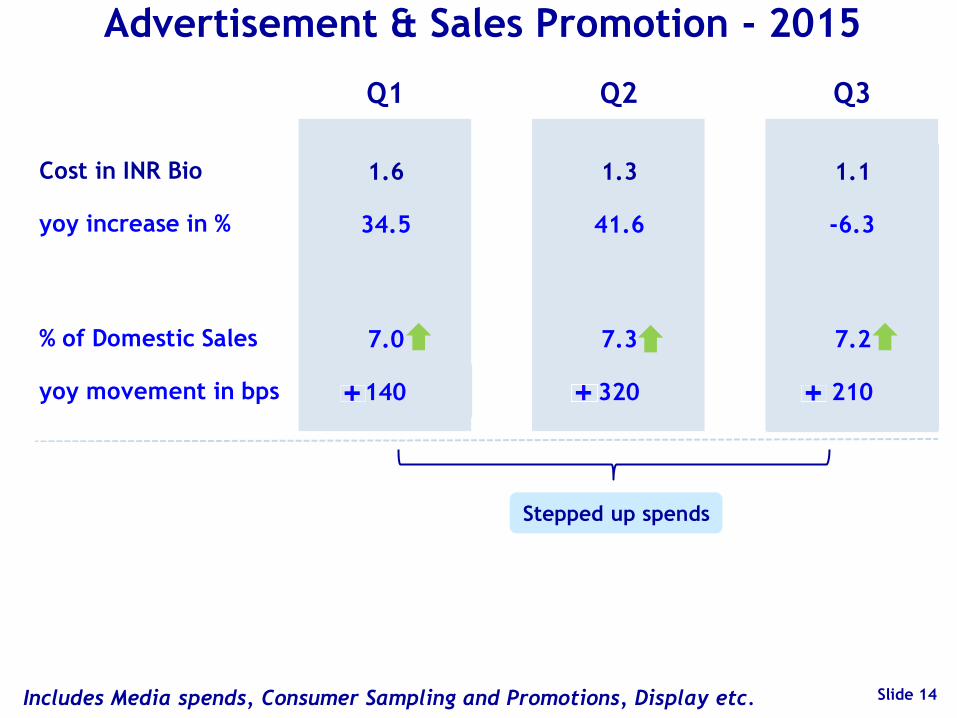
Advertisement & Sales Promotion - 2015
Includes Media spends, Consumer Sampling and Promotions, Display etc.
Stepped up spends
Slide 14
Q1 Q2 Q3
1.6 1.3 1.1
34.5 41.6 -6.3
7.0 7.3 7.2
140 320 210
yoy increase in %
Cost in INR Bio
% of Domestic Sales
yoy movement in bps
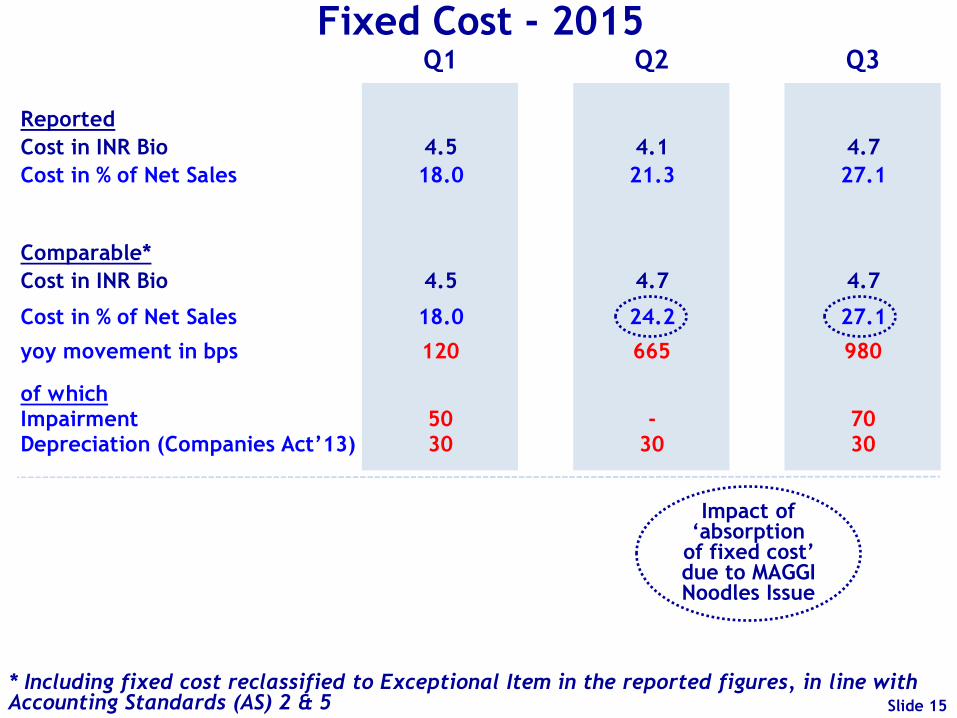
Fixed Cost - 2015
* Including fixed cost reclassified to Exceptional Item in the reported figures, in line with Accounting Standards (AS) 2 & 5 Slide 15
Q1 Q2 Q3
4.5 4.1 4.7
18.0 21.3 27.1
Cost in INR Bio 4.5 4.7 4.7
18.0 24.2 27.1
120 665 980
of whichImpairment 50 - 70Depreciation (Companies Act’13) 30 30 30
Cost in % of Net Sales
Reported
Cost in INR Bio
yoy movement in bps
Comparable*
Cost in % of Net Sales
Impact of ‘absorption
of fixed cost’ due to MAGGI Noodles Issue
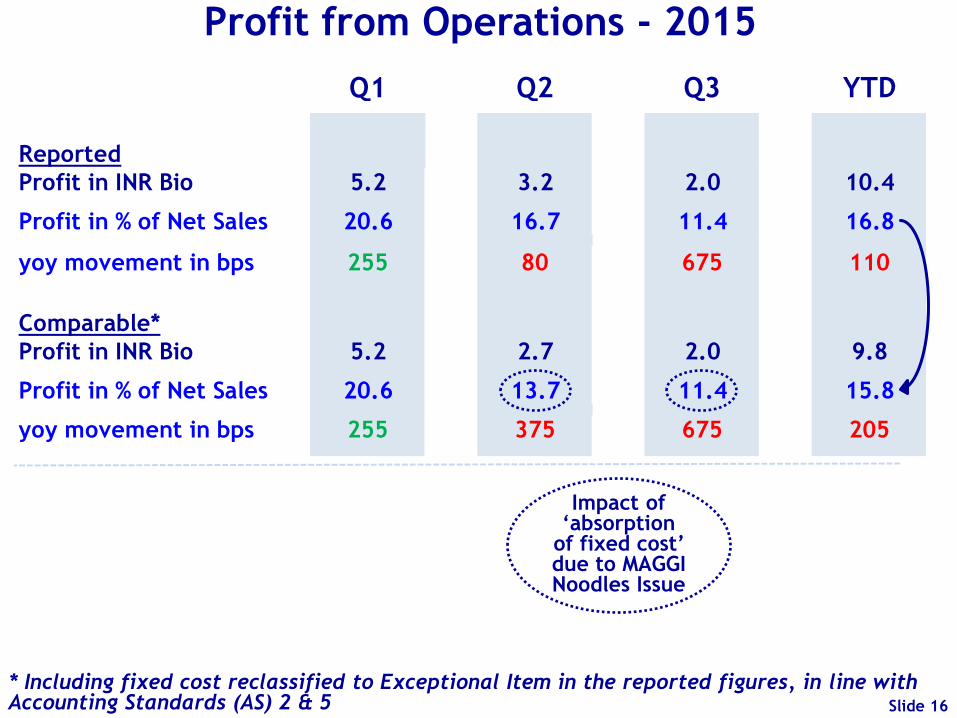
Profit from Operations - 2015
Slide 16
Q1 Q2 Q3 YTD
Reported
5.2 3.2 2.0 10.4
20.6 16.7 11.4 16.8
255 80 675 110
Comparable*
5.2 2.7 2.0 9.8
20.6 13.7 11.4 15.8
255 375 675 205
Profit in % of Net Sales
Profit in % of Net Sales
yoy movement in bps
Profit in INR Bio
Profit in INR Bio
yoy movement in bps
* Including fixed cost reclassified to Exceptional Item in the reported figures, in line with Accounting Standards (AS) 2 & 5
Impact of ‘absorption
of fixed cost’ due to MAGGI Noodles Issue

4.3 1.7
34.0 34.1
33.2
30.6
Jan-Sep 2014 Jan-Sep 2015
Tax Expense (INR Bio) Marginal Tax Rate (%) Effective Tax Rate (%)
Tax Cost and Effective Tax Rate
ETR drops by 260 bps
Of which,
- Higher tax benefits :100
- Mix of profits from tax
holiday and other sites. :240
- Deferred tax revaluation : 75 (Surcharge 12% Vs 10%)
Slide 17

MAGGI Noodles issue impacts Net Profit
11.8% 75 bps
6.2%
Profit from Operations
% are net of tax & in reference to sales
Treasury Elements
35 bps
Slide 18
Jan - Sep 2014
Jan - Sep 2015
Tax Expense
30 bps
Exceptional Item
510 bps
20 bps
INR
8.6
Billion
INR
3.8
Billion
Treasury Income : 25 bps
ECB Costs : 10 bps
Others
Contingencies : 15 bps
(Others)
CSR Expense : 10 bps
Q1 Q2 Q3
Net Profit % 12.8 -3.3 7.2

Slide 19
11.7
2.8
4.8
0.4
1.3
2.3
7.1
1.0
1.3
Profit before
Finance Cost,
Other income,
Exceptional item
& Tax expense
Depreciation
& Impairment Trade & Other
elements of
Working
Capital
Jan - Sep
2015
Cash generation from Operations
INR Bio
Slide 19
16.0%
11.6%
% are in reference to sales
Jan - Sep 2014
Exceptional
Item
Taxation
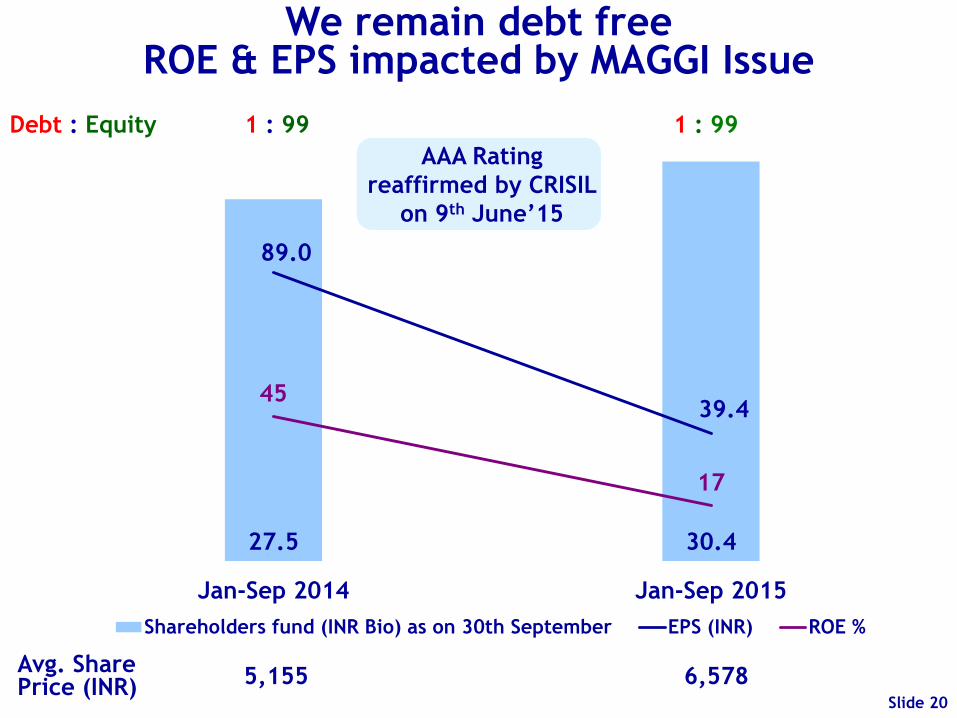
27.5 30.4
89.0
39.4 45
17
Jan-Sep 2014 Jan-Sep 2015
Shareholders fund (INR Bio) as on 30th September EPS (INR) ROE %
We remain debt free ROE & EPS impacted by MAGGI Issue
Avg. Share Price (INR)
Debt : Equity 1 : 99 1 : 99
5,155 6,578 Slide 20
AAA Rating
reaffirmed by CRISIL
on 9th June’15
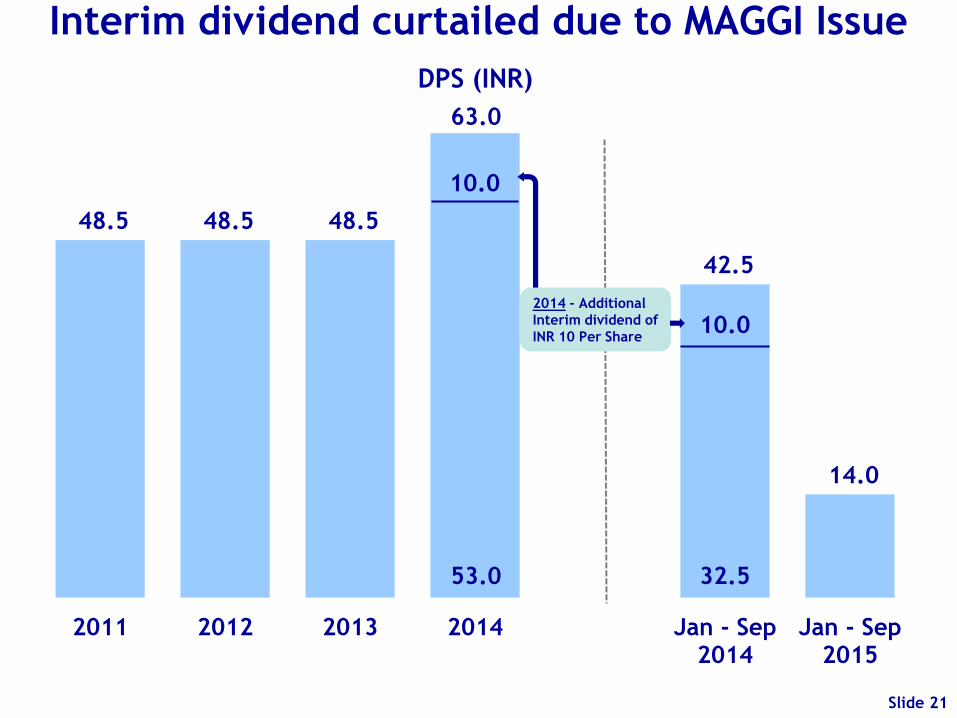
48.5 48.5 48.5
63.0
42.5
14.0
2011 2012 2013 2014 Jan - Sep2014
Jan - Sep2015
DPS (INR)
Interim dividend curtailed due to MAGGI Issue
Slide 21
2014 - Additional
Interim dividend of
INR 10 Per Share
53.0
10.0
10.0
32.5

Linked Slides
Slide 22
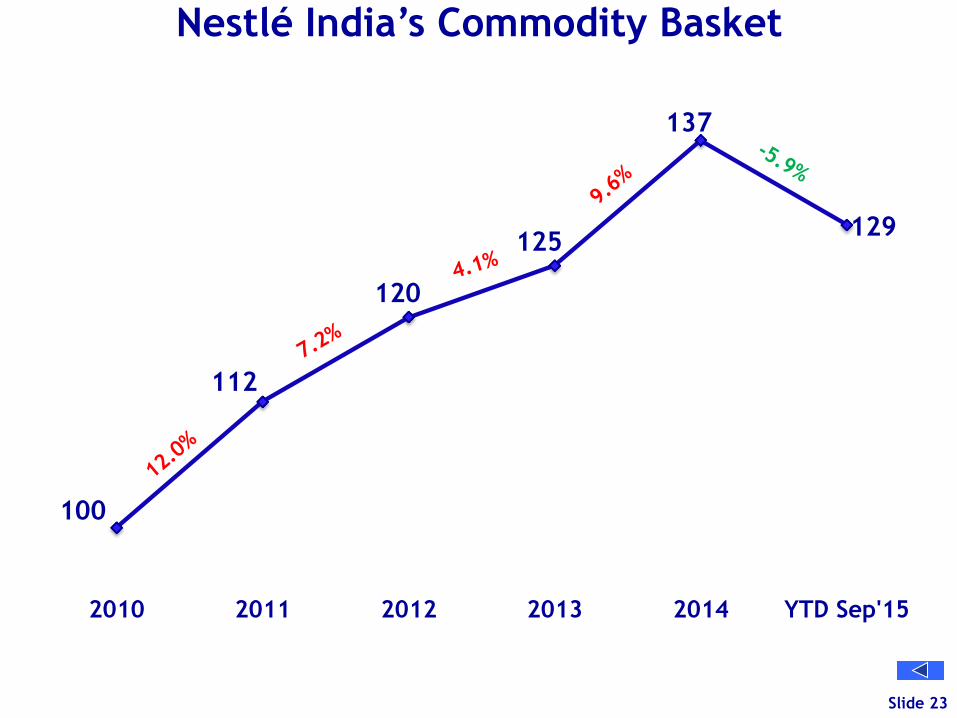
100
112
120
125
137
129
2010 2011 2012 2013 2014 YTD Sep'15
Nestlé India’s Commodity Basket
Slide 23
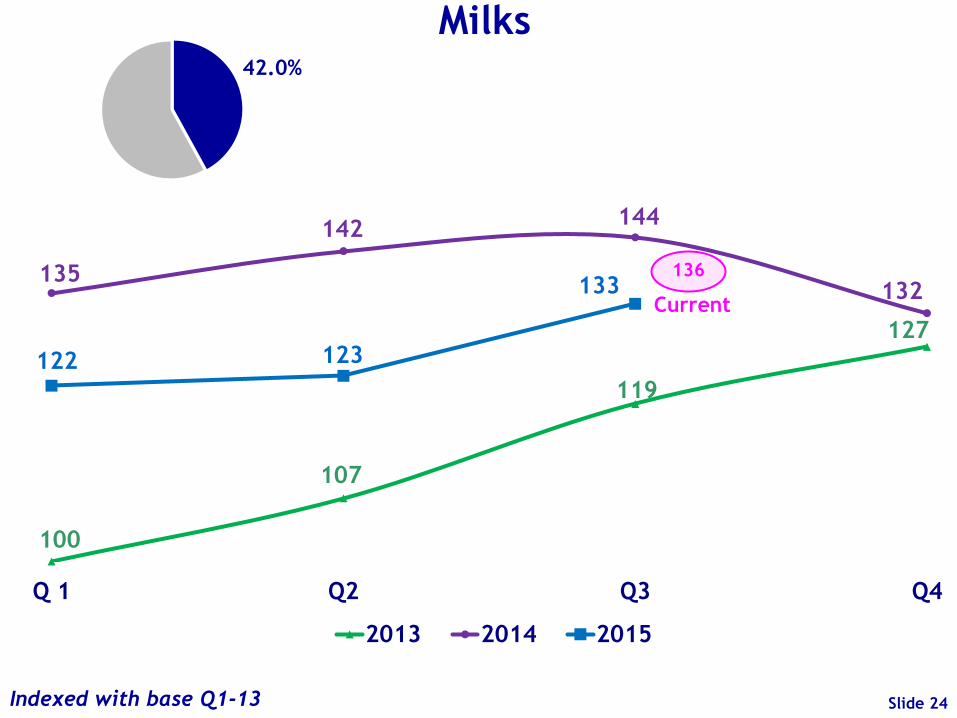
100
107
119
127
135
142 144
132
122 123
133
Q 1 Q2 Q3 Q4
2013 2014 2015
42.0%
136
Indexed with base Q1-13
Current
Milks
Slide 24

100 100 102
136
152
163 159
148
127
118 118
Q 1 Q2 Q3 Q4
2013 2014 2015
4%
110
Indexed with base Q1-13
Current
MSK
Slide 25
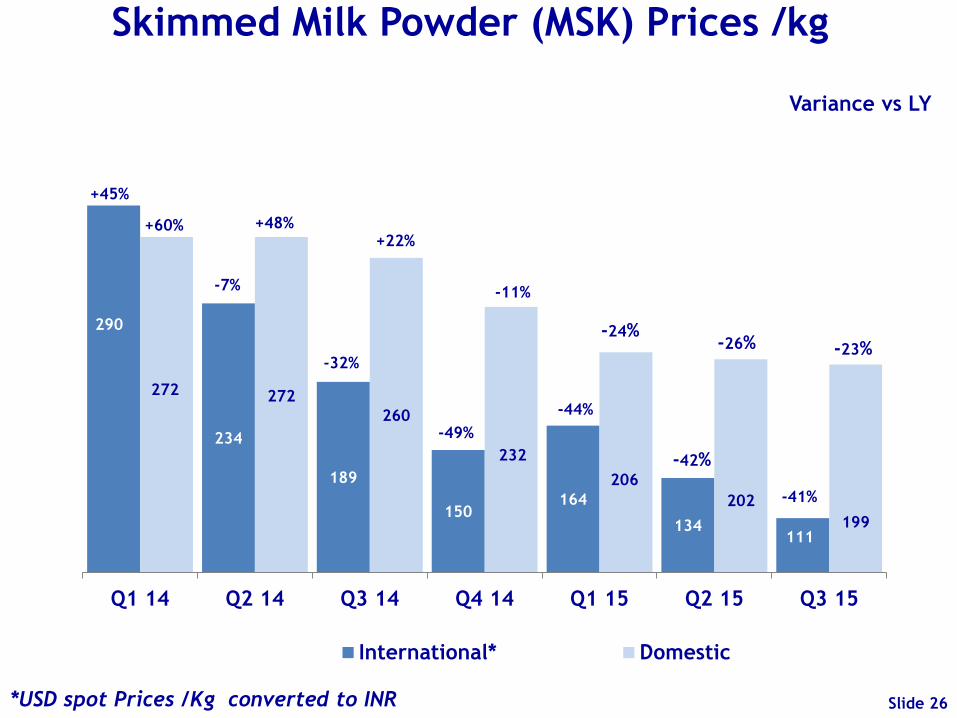
290
234
189
150 164
134 111
272 272
260
232
206
202
199
Q1 14 Q2 14 Q3 14 Q4 14 Q1 15 Q2 15 Q3 15
International* Domestic
-49%
-44%
-24%
-11%
-42%
-26% -23%
-41%
Variance vs LY
+45%
+60%
-7%
+48%
Skimmed Milk Powder (MSK) Prices /kg
*USD spot Prices /Kg converted to INR Slide 26
-32%
+22%
Slide 26
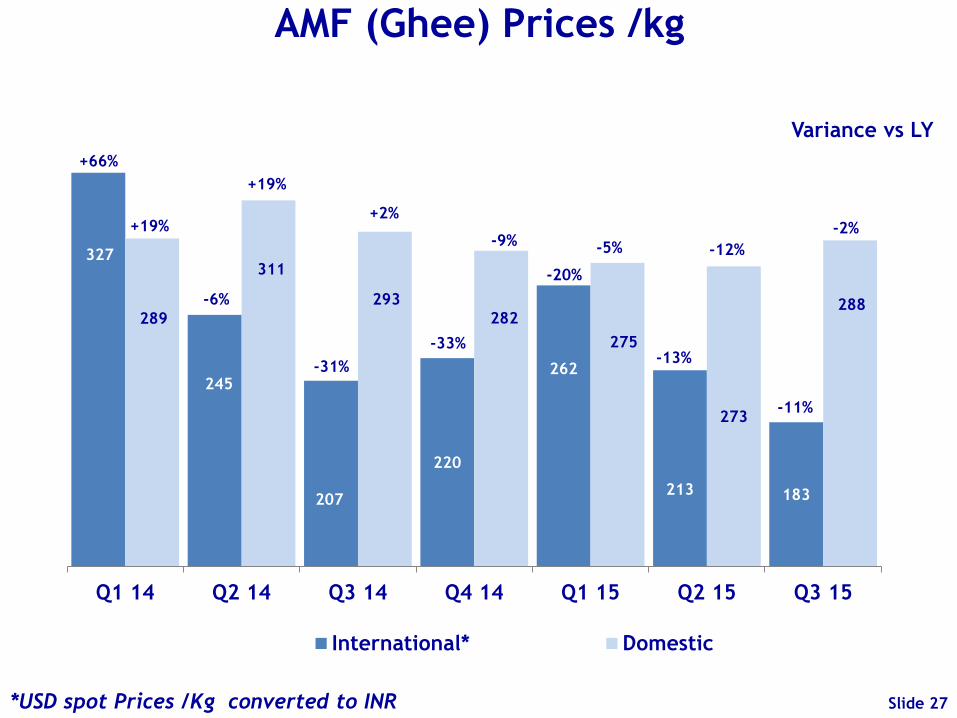
327
245
207
220
262
213 183
289
311
293
282
275
273
288
Q1 14 Q2 14 Q3 14 Q4 14 Q1 15 Q2 15 Q3 15
International* Domestic
Variance vs LY
+66%
+19%
-6%
+19%
AMF (Ghee) Prices /kg
*USD spot Prices /Kg converted to INR
-31%
+2%
-33%
-9% -5%
-20%
-13%
-12%
-2%
-11%
Slide 27
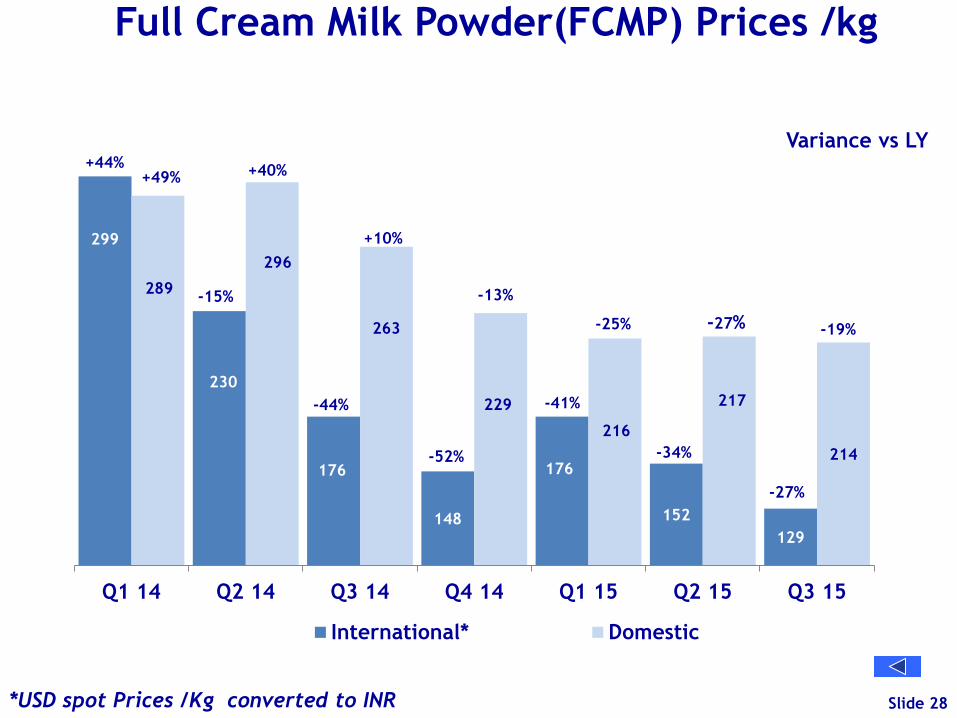
299
230
176
148
176
152
129
289
296
263
229
216
217
214
Q1 14 Q2 14 Q3 14 Q4 14 Q1 15 Q2 15 Q3 15
International* Domestic
-27% -19%
Variance vs LY +44%
+49%
-15%
+40%
Full Cream Milk Powder(FCMP) Prices /kg
*USD spot Prices /Kg converted to INR Slide 28
-44%
+10%
-52%
-13%
-25%
-41%
-34%
-27%
Slide 28
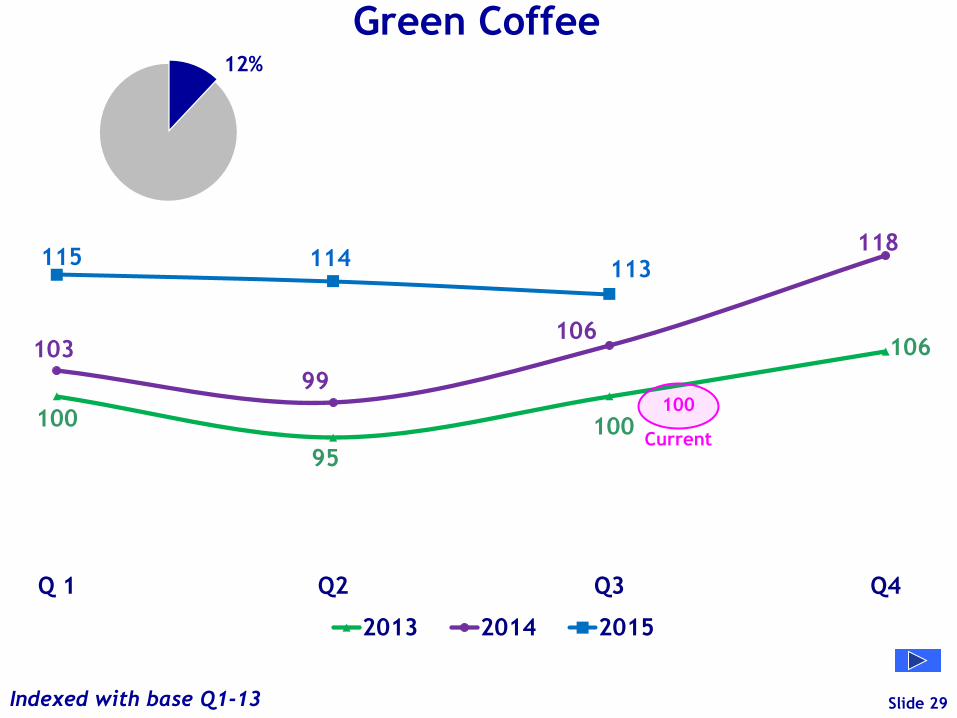
100
95
100
106 103
99
106
118 115 114 113
Q 1 Q2 Q3 Q4
2013 2014 2015
100
Indexed with base Q1-13
Current
Green Coffee
Slide 29
12%

100
96
102 103
100
104
99 99 100
95
100
Q 1 Q2 Q3 Q4
2013 2014 2015
98
Indexed with base Q1-13
Current
Wheat Flour
Slide 30
8%
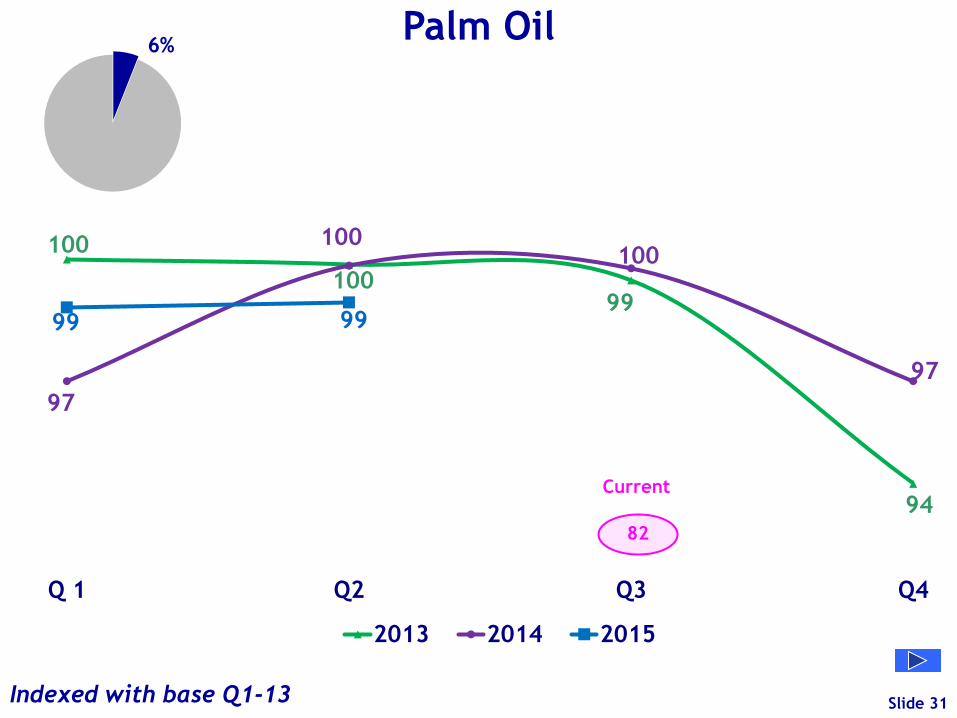
100
100 99
94
97
100 100
97
99 99
Q 1 Q2 Q3 Q4
2013 2014 2015
82
Indexed with base Q1-13
Current
Palm Oil
Slide 31
6%
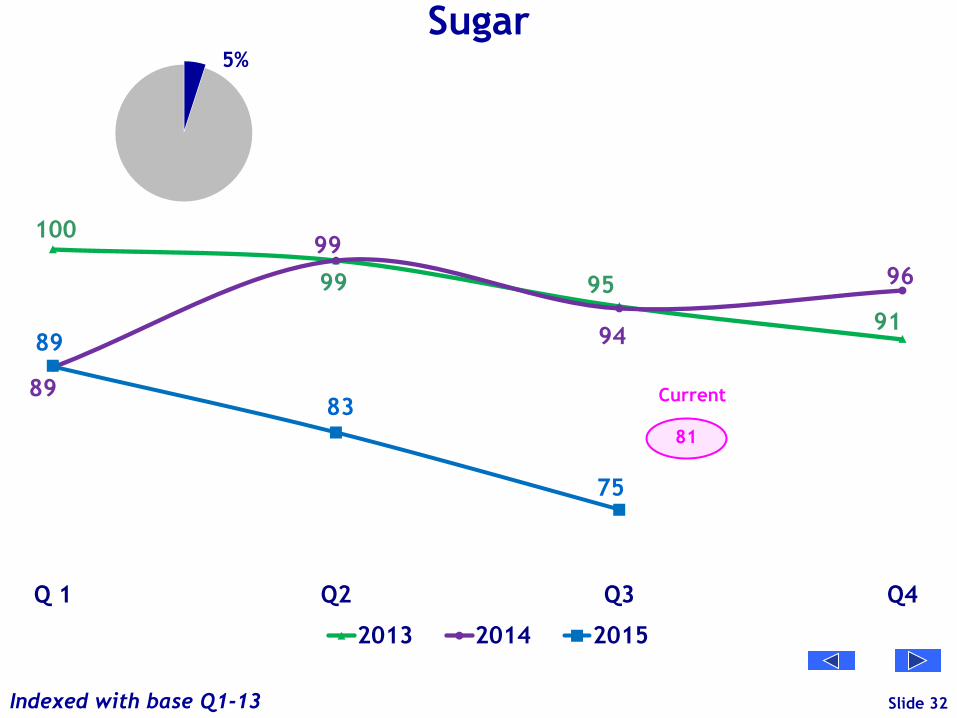
100
99 95
91
89
99
94
96
89
83
75
Q 1 Q2 Q3 Q4
2013 2014 2015
81
Indexed with base Q1-13
Current
Sugar
Slide 32
5%
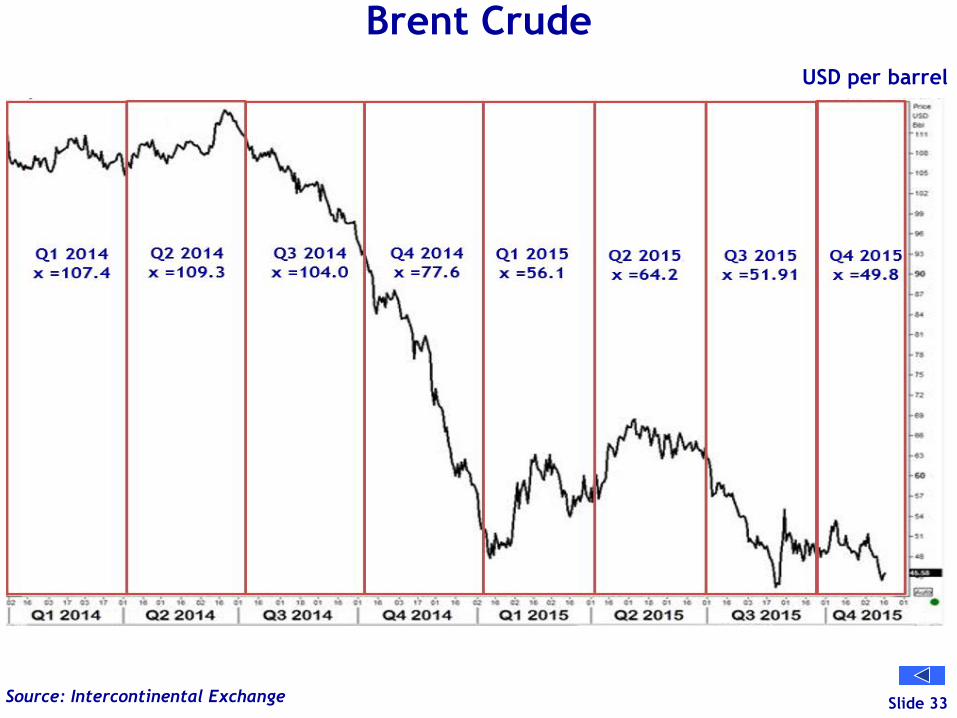
Brent Crude
Slide 33 Source: Intercontinental Exchange
USD per barrel
London Exchange
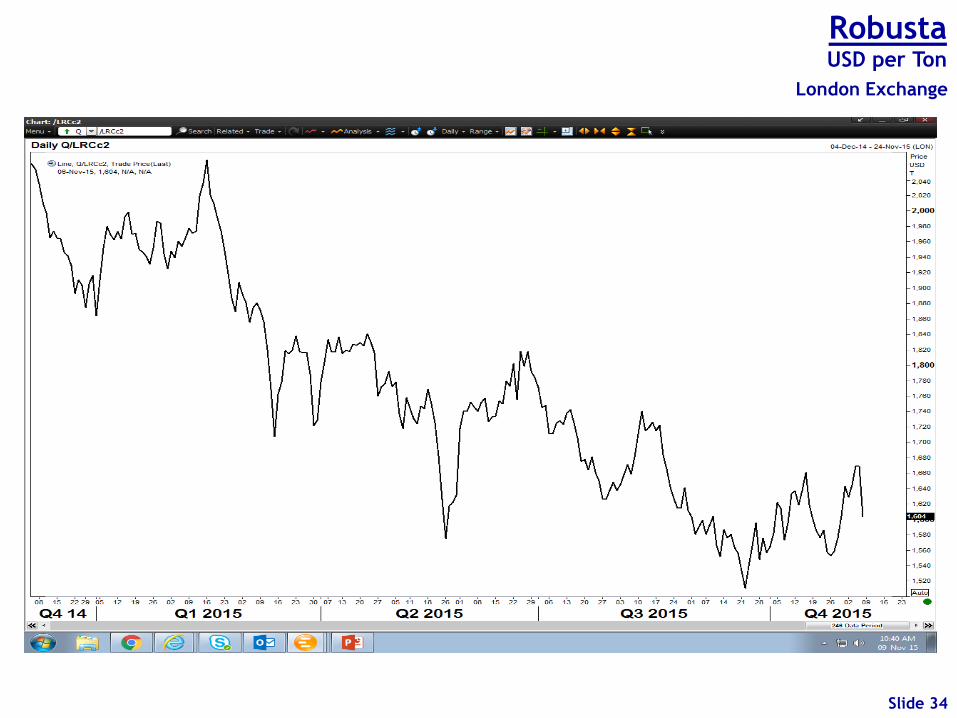
Slide 34
Robusta USD per Ton
Slide 34
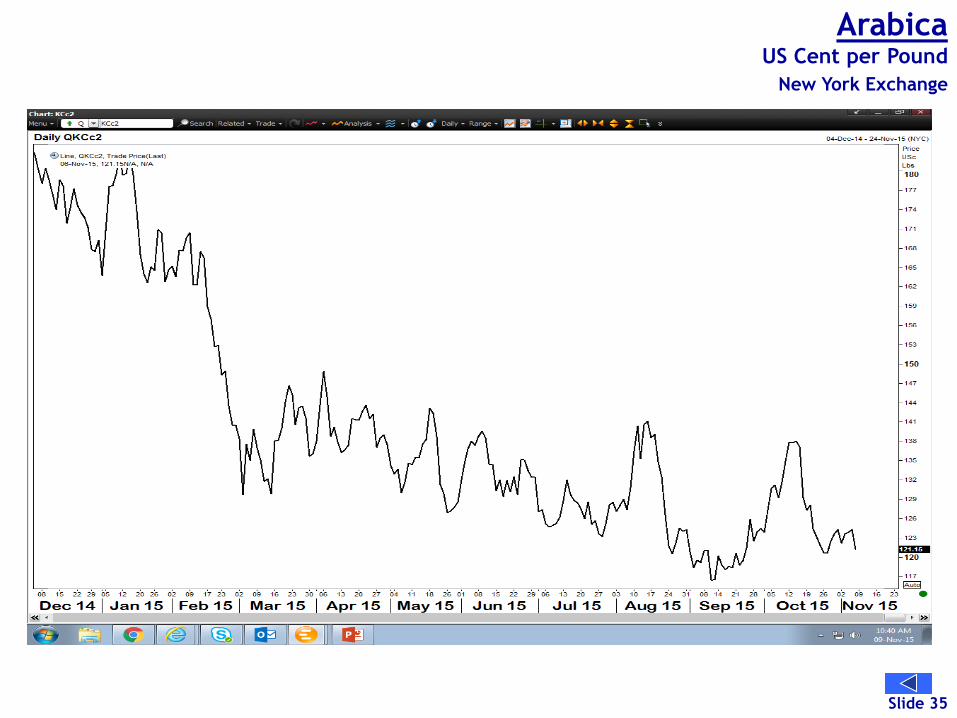
Slide 35
Arabica US Cent per Pound
New York Exchange
Slide 35
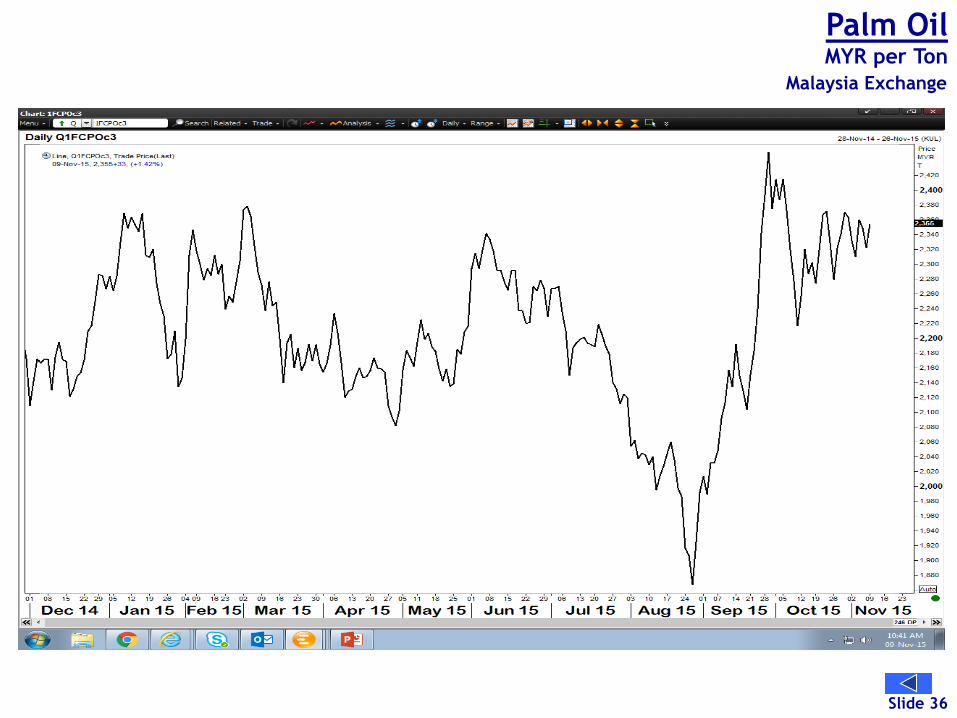
Slide 36
Malaysia Exchange
Palm Oil MYR per Ton
Slide 36
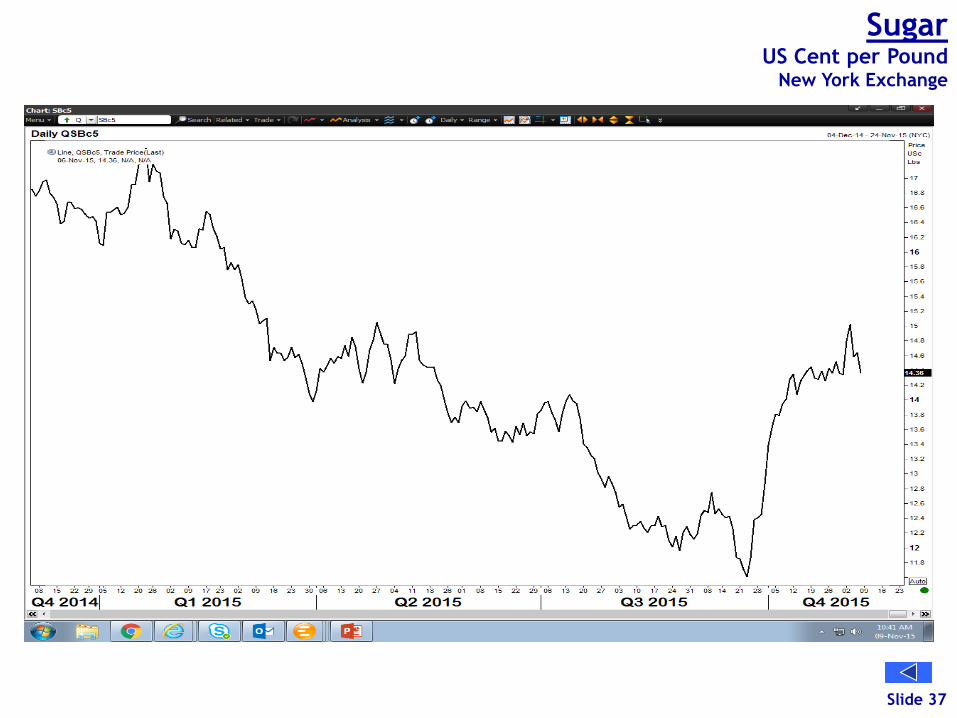
Slide 37
Sugar US Cent per Pound
New York Exchange
Slide 37