25/04/08 provider conference april 08 mark janes
TRANSCRIPT

25/04/08
Provider Conference April 08
Mark Janes

25/04/08
Providers are critical to the success of this programme.Clarity in communication.Listening.Honesty openness.Users and carers at the centre of the partnership.Continuous improvement
Changing the pattern of provisionRemoving ineligible funding.Focus on need.Shift to floating support where appropriateRedistribution of money from some client groups to others.Five year strategy.
Last Year

25/04/08
Commissioning Body
Budget Strategy Group
Members Overview Group
Service User Reference Group
Offenders groupAccommodation ServicesOlder People
Young Peoples Group
Programme DevelopmentGroup Provider Forums

25/04/08
Audit Commission
• Have inspected Supporting People in Hertfordshire twice.
• In May 06 they found the programme to be poor with promising prospects.
• In Jan 08 they re-inspected and remain critical of some aspects of the programme. Discussions with the Audit Commission have been taking place through March and the report will be with the County Council in April.

25/04/08
Commissioning Cycle
BuyingSUPPORT
MonitoringSUPPORT
Understanding need forSUPPORT
Designing SUPPORT

25/04/08
Priorities
• Are now embedded and driven by the strategy and the improvements needed identified by the Audit Commission.
• Work plan is reviewed at each Commissioning Body.
• All is dependent on the strength of the partnerships to deliver.
• Strategy.

25/04/08
Supporting People Strategy
• Adopted by all partners in summer of 2007.
• Five Year Strategy.
• See Easy Guide.

25/04/08
Priorities 08/09
• Older people.• Substance misuse.• Homeless services.• Offenders.• Physical disability.• Domestic Violence/Abuse.• Mental health.• Service user involvement.• Move on.• Contract / Service reviews.• Diversity

25/04/08
Finance
• Hertfordshire County £21,000,881 now confirmed.
• VFM will break even.• £2 million in retraction over next three years.• 2% inflation for 08/09. Figure for subsequent
years not agreed.• £1.4 million investment fund.• Reducing administration grant over next three
years.• Possible removing of ring fence in 2009.
25/04/08
Service user
• Service User Reference Group met for first time in December 07 and in April 08 with Commissioning Body members.
• We are involving service users throughout the commissioning cycle
• Having your say.• Need.• Specification.• Deciding who to buy services from.• Monitoring.• Communication• Service level.

25/04/08
Safeguarding
• Adults and Children
• Lead Officer now sitting on the Adults Safeguarding Committee
• On-line training pack
• Service review
• Serious concerns about establishments

25/04/08
Performance Indicators
• Summary information.
• Outcomes 2 quarters.
• Long term no data yet.
• Benchmarking Performance Indicators.
• Service targets for April 08.
25/04/08
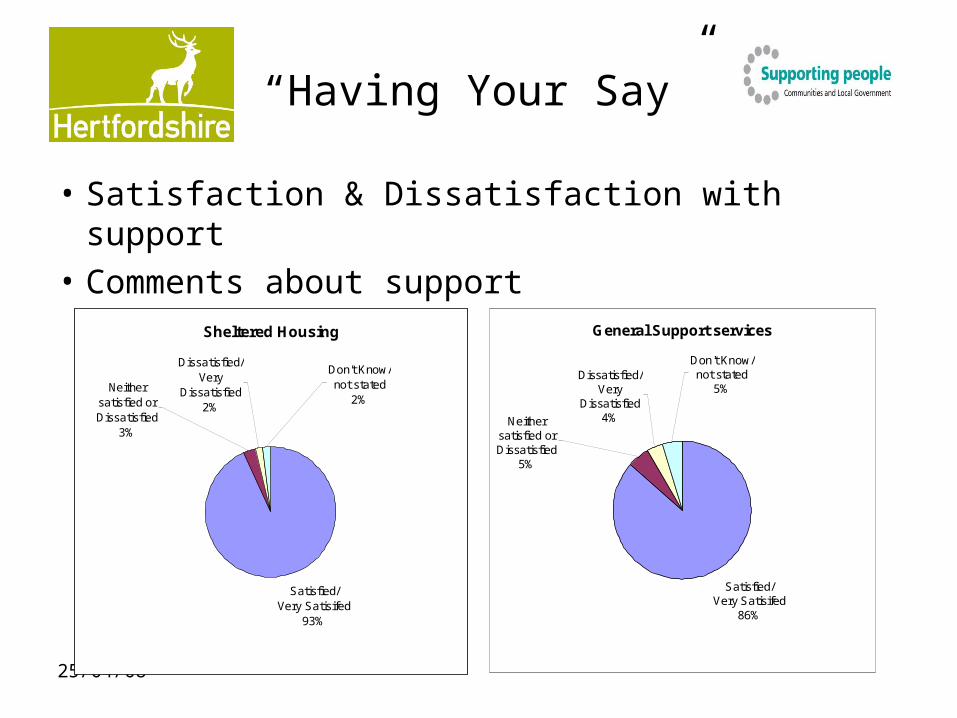
“Having Your Say”
• Satisfaction & Dissatisfaction with support
• Comments about supportSheltered Housing
Satisfied/ Very Satisifed
93%
Neither satisfied or Dissatisfied
3%
Don't Know/ not stated
2%
Dissatisfied/ Very
Dissatisfied2%
General Support services
Satisfied/ Very Satisifed
86%
Neither satisfied or Dissatisfied
5%
Don't Know/ not stated
5%Dissatisfied/
Very Dissatisfied
4%

25/04/08
1) Usage Q1 Q2 Q3 Q4 06/07 07/08 target
SPI 1Availability
98.2%
97.7%
99.0%
98.6% 98%
Percentage of all accommodation-based SP contracted units which are reported by providers as having been available.
SPI 2 AUtilisation
(Accommodation-based services)
95.3%
94.8%
95.0%
95.3% 96%
The percentage of all available SP contracted units which are reported by providers as having been utilised.
SPI 2 BUtilisation
(support- only services)
93.7%
94.5%*
95.6%*
90.1% 95%
*Further verification of these numbers is required
The percentage of SP contracted units which are reported by providers as having a service user with a support plan applicable to them
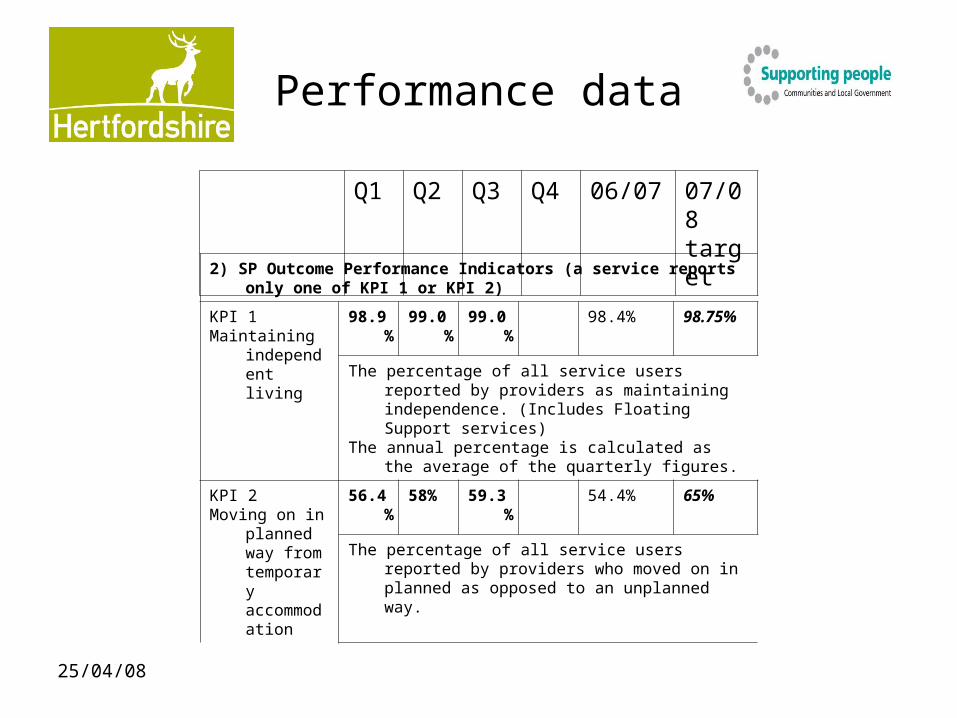
Performance data
25/04/08
2) SP Outcome Performance Indicators (a service reports only one of KPI 1 or KPI 2)
KPI 1Maintaining
independent living
98.9%
99.0%
99.0%
98.4% 98.75%
The percentage of all service users reported by providers as maintaining independence. (Includes Floating Support services)
The annual percentage is calculated as the average of the quarterly figures.
KPI 2Moving on in
planned way from temporary accommodation
56.4%
58% 59.3%
54.4% 65%
The percentage of all service users reported by providers who moved on in planned as opposed to an unplanned way.
Q1 Q2 Q3 Q4 06/07 07/08 target
Performance data

25/04/08
Move on
Year 2006-07
06- 07 No. of people departing
Q1 2007-08 Q2 2007-08 Q3 2007-08 National Q2 data
Domestic violence 56.3% 281 78% 84.6% 76.7% 80.0%
Homeless Families 68.4% 4* 88% 79.8% 90.4% 75.8%
Mental Health problems 53.9% 42 88% 88.9% 100% 76.4%
Single Homeless 50.5% 1719 46% 47.0% 40.3% 69.0%
Young People at Risk 58.4% 147 59% 68.9% 75% 75.6%
Overall KPI 2 for all client groups:
54.4% 2671 56.4% 58.0% 59.3% 71.3%
25/04/08
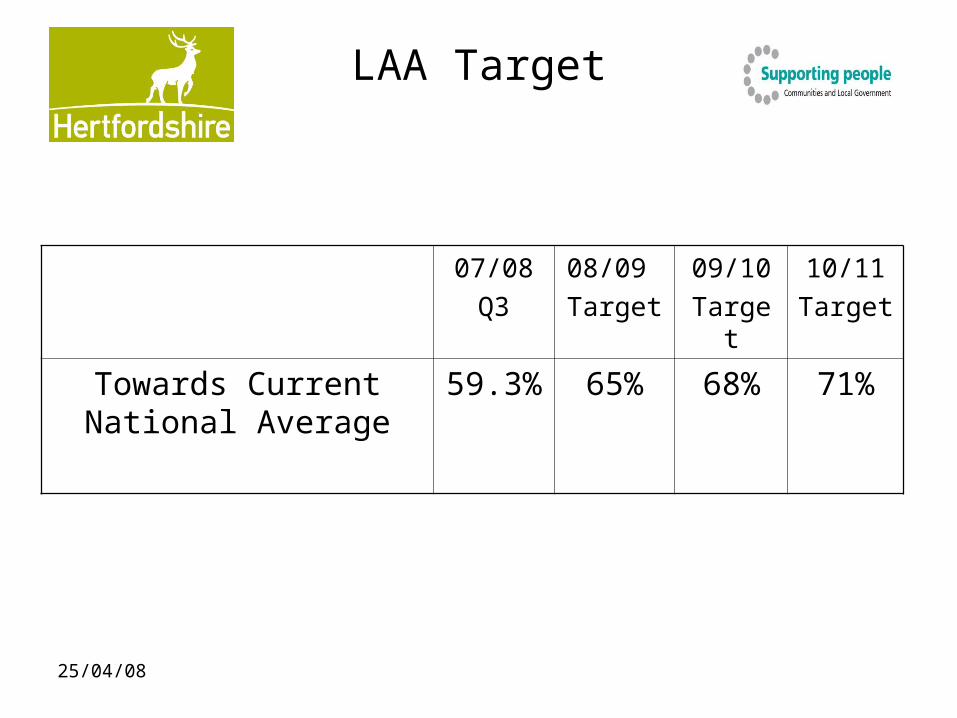
LAA Target
07/08
Q3
08/09
Target
09/10
Target
10/11
Target
Towards Current National Average
59.3% 65% 68% 71%

25/04/08
Targets by client group 08/09
Homeless Families, Teenage Parents, Women at Risk of Domestic Violence, Mental Health
80%
Services for other groups including Single Homeless.
65%
Night Shelter type Single Homeless 50%

25/04/08
Outcomes
Stay Healthy
% needing support
% needing support & outcome achieved
Number outcome achieved
Did the client need support to better manage their physical health?
33% 76% 244
Did the client need support to better manage their mental health?
30% 67% 190
Did the client need support to better manage their substance misuse issues?
28% 46% 123
Is assistive technology/aids and adaptations helping the client maintain independence?
3% 96% 24

25/04/08
Outcomes
Enjoy and Achieve
% needing support
% needing support & outcome achieved
Number outcome achieved
Did the client need support to participate in training and education?
25% 54% 130
If qualification applicable, has the client achieved this?25% 19% 46
Did the client need support to participate in leisure/cultural/faith/informal learning?
26% 79% 196
Did the client need support to participate in any work- like activities?
15% 59% 83
Did the client need support to establish contact with external services OR with friends/ family?
47% - -

25/04/08
Quality Assessment Framework
• Summary at mid January 08
• Information that has been used to establish quality score.
• Overall QAF d,c,b,a.
• Five services moved to overall score of d.
• So overall an improving picture.

25/04/08
QAF
QAF ANALYSIS 3 YEAR TREND'SUPPORT PLANNING'
1 1 00
50
100
150
200
250
300
350
400
A 1 1 3
B 29 25 216
C 368 378 188
D 1 1 0
Support Planning05/06
Support Planning06/07
Support Planning07/08

25/04/08
QAF
QAF ANALYSIS'TOTAL A, B, C, D TREND OVER 3 YEARS'
9 4 00
500
1000
1500
2000
2500
A 6 5 48
B 212 280 1362
C 2077 2141 1032
D 9 4 0
TOTAL05/06
TOTAL06/07
TOTAL07/08

25/04/08
Today
• 08/09
• Provider involvement critical.
• As we have money to invest in housing related support, what should we buy?
• How should we approach this process?
• What should we not do?