2.5. value creation in leveraged buyouts - universit¤t st.gallen
TRANSCRIPT

Value Creation in Leveraged Buyouts
D I S S E R T A T I O N of the University of St. Gallen,
Graduate School of Business Administration, Economics, Law, and Social Sciences (HSG)
to obtain the title of Doctor of Business Administration
submitted by
Nicolaus Loos
from
Hamburg, Germany
Approved on the application of
Prof. Dr. Martin Hilb
and
Prof. Dr. Beat Bernet
Dissertation No. 3052
Gutenberg AG, Liechtenstein


The University of St. Gallen, Graduate School of Business Administration, Economics, Law, and Social Sciences (HSG) hereby consents to the printing of the present dissertation, without hereby expressing any opinion on the views herein expressed.
St. Gallen, April 19, 2005
The President:
Prof. Ernst Mohr, PhD


To my Mother Beatrice –
For her Love, unrelenting Dedication
And Support towards my Education.


Acknowledgements
I would like to thank Professor Martin Hilb and Professor Beat Bernet for their patient supervision
and their advice. Without their granted freedom and flexibility, encouragement, guidance,
confidence and their academic example this thesis could not have been written. Professor Hilb has
been very supportive throughout the development of my dissertation and gave me the necessary
motivation and freedom to form my ideas. His patience with respect to my continued parallel
professional obligations in London was gladly appreciated. Profound gratitude also goes to
Professor Maurizio Zollo and Professor Oliver Gottschalg from the INSEAD Buyout Research
Centre for inviting me as a visiting doctoral student and researcher to Fontainebleau. Their
theoretical groundwork, introduction to the fundamentals of statistics during my studies and
genuine insights into the development of this thesis has been invaluable. My appreciation
especially goes to Prof. Gottschalg for our successfully developed research partnership around
various LBO related research projects throughout my time in France, his availability for the
countless brainstorming and “data cracking” sessions as well as for becoming a great friend (who
also encouraged and pushed me through the New York Marathon in 2003). I am also much
indebted to Prof. Maurizio Zollo for giving me the opportunity of a stimulating and very hospitable
stay at the Strategy department at INSEAD. It was an academic experience that will accompany me
for the rest of my life.
Furthermore, great thanks must go to the armada of research assistants that supported my research
efforts through wearisome ground research, data collection, database development and
improvements: Ariadna Stefanescu, Pfumo Mubako, Gilad Pais, Sachar Rachim, Alfonso Olivares,
Rabie Nadi, Qiang Guo, Li Rong, Kate Deurloo, Victor Alves, Arad Edrey, Shiri Katz, Anne-Laure
Alviset and Sandrine Dupuis. Ariadna had become an invaluable buyout database “wizard” and
through her ingenious computer scientific knowledge she could resolve any database related
problems – sometimes even at “inhumane” hours of the day. Dr. Achim Berg’s diligently collected
and shared universal anthology of research material as well as his material theoretical groundwork
has clearly benefited the literature review section of this study. Further thanks has to be extended to
colleagues in the field of LBO research, including Christopher Boehringer, Dr. Ludovic Phalippou,
Dr. Cristina Soppelsa, Dr. Daniel Zipser, as well as in other fields, including Dr. Michael Gibbert,
Dr. Ralph Welpe and Dr. Stefanie Leenen for their help and advice.
I would like to thank Thomson Financial Venture Economics in New York, especially the head of
the research department Mr. Jesse Reyes, for offering access to their vast databases on LBO deal
and fund data via the INSEAD research collaboration. I am also grateful for the various fruitful
early and continued discussions held with leading Private Equity fund of fund investors, including
Allianz Capital Partners, Axa Private Equity, Credit Suisse First Boston Private Equity, Deutsche
Bank Capital, Feri Investments, HarborVest Partners, Henderson Private Equity, Pantheon
Ventures and The Partners Group regarding the determinants of buyout value creation, which
contributed to this study’s research model configuration. I am indebted to several Limited Partners,

who through research collaborations have been able to grant access to the confidential LBO fund
information that represents the main primary data source in this study. I would like to extend my
special thanks Mr. Norman Rafael and his colleagues in London and New York in on of these
organizations – without their personal efforts this study would have not been made possible. All
errors are mine alone.
Inexpressible is my gratitude for the help and support of my friends and family. My father’s
backing for the financing of my sabbatical year considerably helped me to exclusively focus on my
research and to complete this study more swiftly. My mother’s love and her hands-on
encouragement have helped me not to lose track. She lifted my thoughts away and offered a vision
of “a life after the dissertation” when it was most needed. As representatives for many supportive
friends, I especially would like to thank Mrs. Juliane von Gehren and Mr. Florian Schick for being
similarly strong “motivators” throughout some of my most isolated times, during which I
completed this dissertation. Señor Andrés Rodenas de la Vega, Mr. Stefan Alceski-Pendoff and Mr.
Florian Schick have become great friends and contributed a lot to make the year in France also a
very social and enjoyable one. Last but not least I would like to thank the person that most closely
followed the stepwise development of this thesis: Miss Sophie Werhahn-Mees has walked along
with the ups and downs of its growth path, patient but always urging on, cheering on the way,
listening to partly obscure thoughts and making the time working on it worth living.
London, November 2004
Nicolaus Loos


Summary of Content I
Summary of Content
List of Figures…………………………………………………..…X
List of Tables……………………………………………………XV
List of Abbreviations………………………………...…...…..XVII
Abstract…………………………………………………...……..XX
1. Introduction ................................................................................1
1.1. Background of Research.................................................................................... 1
1.2. Problem Statement............................................................................................. 2
1.3. Need for Study................................................................................................... 3
1.4. Purpose of Study................................................................................................ 4
1.5. Scope and Limitations ....................................................................................... 5
1.6. Organization of Research .................................................................................. 6
2. Literature Review.......................................................................8
2.1. Definitions and the Buyout Process .................................................................. 8
2.2. The Buyout Controversy – Alleviating Common Beliefs ............................... 15
2.3. Agency Theory of Leveraged Buyouts............................................................ 17
2.4. Strategic Management View of Leveraged Buyouts....................................... 19
2.5. Value Creation in Leveraged Buyouts ............................................................ 21
2.6. Value Destruction in Acquisitions and Leveraged Buyouts............................ 34
3. Methodology and Research Design.........................................37
3.1. Research Goal of the Study ............................................................................. 37
3.2. Research Object of the Study .......................................................................... 39
3.3. Research Model ............................................................................................... 44
3.4. General Hypotheses......................................................................................... 49
3.5. Performance Evaluation .................................................................................. 50
3.6. Empirical Approach......................................................................................... 60
3.7. Research Methodology and Data Analysis...................................................... 73
Summary of Content II
4. Empirical Part I – Market and Financial Value Drivers......77
4.1. Introduction ..................................................................................................... 77
4.2. Control Population Overview.......................................................................... 78
4.3. Leveraged Buyout Deal Performance ........................................................... 113
4.4. Leveraged Buyout Deal vs. Public Market & Industry Financial Performance…............................................................................................... 173
4.5. Leveraged Buyout Value Attribution Analysis ............................................. 204
4.6. Conclusions ................................................................................................... 213
5. Empirical Part II – The GP Firm and Manager Effect ......217
5.1. Introduction ................................................................................................... 217
5.2. Investment Manager and General Partner Firm Characteristics.................... 218
5.3. Modeling the Buyout Firm Experience Effect .............................................. 268
5.4. Conclusions ................................................................................................... 277
6. Empirical Part III – Buyout Strategies ................................279
6.1. Introduction ................................................................................................... 279
6.2. Target Company Characteristics ................................................................... 294
6.3. Deal Decisions and Characteristics ............................................................... 305
6.4. Acquisition Process and Strategic Events ..................................................... 316
6.5. Modelling Buyout Characteristics, Decisions and Strategic Events ............. 323
6.6. Conclusions ................................................................................................... 331
7. Summary and Conclusions....................................................332
7.1. Summary of Study’s Key Findings ............................................................... 332
7.2. Contributions to Research and Applications to Practice ............................... 347
7.3. Limitations of Study and Areas of Future Research ..................................... 353
8. Appendices ..............................................................................355
9. Bibliography ...........................................................................369
Curriculum Vitae

Table of Content III
Table of Content
List of Figures…………………………………………..….…...…X
List of Tables……………………………………………………XV
List of Abbreviations………………………………...…….…XVII
Abstract……………………………………………………....….XX
1. Introduction ................................................................................1
1.1. Background of Research.................................................................................... 1
1.2. Problem Statement............................................................................................. 2
1.3. Need for Study................................................................................................... 3
1.4. Purpose of Study................................................................................................ 4
1.5. Scope and Limitations ....................................................................................... 5
1.6. Organization of Research .................................................................................. 6
2. Literature Review.......................................................................8
2.1. Definitions and the Buyout Process .................................................................. 8
2.1.1. The Private Equity Investment Asset Class .....................................................82.1.1.1. History of Private Equity ............................................................................. 9
2.1.2. Buyout Classification, Organizational Form and Corporate Governance .....11
2.1.3. The Buyout Process .......................................................................................13
2.2. The Buyout Controversy – Alleviating Common Beliefs ............................... 15
2.3. Agency Theory of Leveraged Buyouts............................................................ 17
2.4. Strategic Management View of Leveraged Buyouts....................................... 19
2.5. Value Creation in Leveraged Buyouts ............................................................ 21
2.5.1. Direct Drivers of Value Creation...................................................................222.5.1.1. Achieving Cost Reductions in Buyouts ..................................................... 222.5.1.2. Improving Asset Utilization in Buyouts .................................................... 232.5.1.3. Generating Growth in Buyouts .................................................................. 242.5.1.4. Financial Engineering in Buyouts.............................................................. 26
2.5.2. Indirect Drivers of Value Creation ................................................................272.5.2.1. Management and Employee Incentivation in Buyouts.............................. 27
Table of Content IV
2.5.2.2. Change in Corporate Governance in Buyouts ........................................... 282.5.2.3. Leverage as Value Creator in Buyouts ...................................................... 292.5.2.4. Buyout Culture and Communication ......................................................... 30
2.5.3. Other Sources of Value Creation in Buyouts.................................................312.5.3.1. Information Asymmetries and Market Inefficiency around Buyouts ....... 322.5.3.2. Acquisition and Negotiation Skills in Buyouts ......................................... 33
2.6. Value Destruction in Acquisitions and Leveraged Buyouts............................ 34
3. Methodology and Research Design.........................................37
3.1. Research Goal of the Study ............................................................................. 37
3.2. Research Object of the Study .......................................................................... 39
3.2.1. Industry Perspective.......................................................................................393.2.1.1. Pressure for Disclosure in the Private Equity Industry ............................. 393.2.1.2. Pressure for Performance in the Private Equity Industry .......................... 393.2.1.3. Consolidation in the Private Equity Industry ............................................ 413.2.1.4. Benchmarking Returns in the Private Equity Industry.............................. 41
3.2.2. Transaction Perspective .................................................................................42
3.3. Research Model ............................................................................................... 44
3.3.1. Development of the Research Model.............................................................44
3.3.2. The Research Model ......................................................................................45
3.4. General Hypotheses......................................................................................... 49
3.5. Performance Evaluation .................................................................................. 50
3.5.1. Overview of Performance Evaluation............................................................50
3.5.2. Performance Evaluation in Leveraged Buyouts ............................................50
3.5.3. The Internal Rate of Return Formula.............................................................52
3.5.4. Value Attribution in Buyouts – Deduction and Extension of the IRR Formula through the Dupont Equation.........................................................................52
3.5.5. Value Attribution Case Study – The University of St. Gallen Catering Company........................................................................................................57
3.6. Empirical Approach......................................................................................... 60
3.6.1. Private Equity Data Collection ......................................................................60
3.6.2. The Venture Economics Database .................................................................61
3.6.3. The INSEAD LBO Research Database .........................................................64
3.6.4. Sample Comparison and Mean Comparison Test..........................................67
3.6.5. Other Data Sources ........................................................................................70
3.7. Research Methodology and Data Analysis...................................................... 73
3.7.1. Research Methodology Discussion................................................................73
3.7.2. Approach to Data Analysis ............................................................................75
4. Empirical Part I – Market and Financial Value Drivers......77
4.1. Introduction ..................................................................................................... 77
4.2. Control Population Overview.......................................................................... 78
4.2.1. Private Equity, Venture Capital and Buyout Market Historical Fundraising 784.2.1.1. Overview of Historical Private Equity Fundraising .................................. 784.2.1.2. A Global View on Private Equity Fundraising.......................................... 814.2.1.3. Private Equity Investment Allocation by Industries.................................. 83
4.2.1.3.1. Level 3 Industry Classification ............................................................ 84
Table of Content V
4.2.1.3.2. Level 4 Industry Classification ............................................................ 87
4.2.1.4. Summary of Findings ................................................................................. 91
4.2.2. Private Equity, Venture Capital and Buyout Market Historical Fund Performance ...................................................................................................924.2.2.1. Overall Private Equity Fund Performance................................................. 934.2.2.2. Buyout Fund Performance ......................................................................... 944.2.2.3. Venture Capital Fund Performance ........................................................... 944.2.2.4. Weighted and Unweighted IRR ................................................................. 954.2.2.5. Private Equity Risk and Return Development........................................... 964.2.2.6. Performance Trends by Industry Sector .................................................... 99
4.2.2.6.1. Level 3 Industry Classification ............................................................ 99
4.2.2.6.2. Level 4 Industry Classification .......................................................... 102
4.2.2.7. Private Equity Returns across Countries ................................................. 1054.2.2.8. Private Equity Returns by Geography ..................................................... 1064.2.2.9. Performance by Exit Mode of Private Equity Investments..................... 1084.2.2.10. Performance by Investment Stage of Private Equity Investments ........ 1104.2.2.11. Summary of Findings............................................................................. 111
4.3. Leveraged Buyout Deal Performance ........................................................... 113
4.3.1. Test Setting ..................................................................................................1144.3.1.1. Tested Variables and Hypotheses ............................................................ 1144.3.1.2. Methodology and Data............................................................................. 117
4.3.2. Buyout Performance by Year ......................................................................1194.3.2.1. Overview of Buyout Performance by Year ............................................. 1194.3.2.2. Realized vs. Unrealized Buyout Performance by Year ........................... 1194.3.2.3. European vs. U.S. Buyout Performance by Year .................................... 1204.3.2.4. Regression Results ................................................................................... 121
4.3.2.4.1. Descriptive Statistics .......................................................................... 121
4.3.2.4.2. Regression Model............................................................................... 124
4.3.2.5. Summary of Findings ............................................................................... 124
4.3.3. Buyout Performance across Countries.........................................................1254.3.3.1. Regression Results ................................................................................... 126
4.3.3.1.1. Descriptive Statistics .......................................................................... 126
4.3.3.1.2. Regression Model............................................................................... 127
4.3.3.2. Summary of Findings ............................................................................... 127
4.3.4. Buyout Performance by Industry Sector......................................................1284.3.4.1. Level 3 Industry Classification ................................................................ 1284.3.4.2. Level 4 Industry Classification ................................................................ 1304.3.4.3. Regression Results ................................................................................... 132
4.3.4.3.1. Descriptive Statistics .......................................................................... 133
4.3.4.3.2. Regression Model............................................................................... 134
4.3.4.4. Summary of Findings ............................................................................... 136
4.3.5. Ownership and Buyout Performance ...........................................................1364.3.5.1. Regression Model..................................................................................... 1394.3.5.2. Summary of Findings ............................................................................... 140
4.3.6. Deal Size and Buyout Performance .............................................................1404.3.6.1. Regression Results ................................................................................... 141
4.3.6.1.1. Descriptive Statistics .......................................................................... 142
4.3.6.1.2. Regression Model............................................................................... 143
4.3.6.2. Summary of Findings ............................................................................... 143
4.3.7. Investment Holding Time and Buyout Performance ...................................1444.3.7.1. Regression Results ................................................................................... 145
4.3.7.1.1. Descriptive Statistics .......................................................................... 145
4.3.7.1.2. Regression Model............................................................................... 146
4.3.7.2. Summary of Findings ............................................................................... 146
4.3.8. Leveraged Buyout Performance according to Entry and Exit Modes..........1474.3.8.1. Leveraged Buyout Performance according to Entry Mode..................... 147
4.3.8.1.1. Entry Mode and Invested Capital ...................................................... 147

Table of Content VI
4.3.8.1.2. Entry Mode and Holding Period........................................................ 149
4.3.8.2. Leveraged Buyout Performance according to Exit Mode....................... 1514.3.8.2.1. Exit Mode and Invested Capital......................................................... 152
4.3.8.2.2. Exit Mode and Holding Period .......................................................... 153
4.3.8.3. Regression Results ................................................................................... 1554.3.8.3.1. Descriptive Statistics .......................................................................... 155
4.3.8.3.2. Regression Model............................................................................... 157
4.3.8.4. Summary of Findings ............................................................................... 157
4.3.9. Leveraged Buyout Performance according to Entry and Exit Types...........1584.3.9.1. Leveraged Buyout Performance according to Entry Type...................... 1584.3.9.2. Leveraged Buyout Performance according to Exit Type ........................ 1634.3.9.3. Regression Results ................................................................................... 165
4.3.9.3.1. Descriptive Statistics .......................................................................... 165
4.3.9.3.2. Regression Model............................................................................... 167
4.3.9.4. Summary of Findings ............................................................................... 167
4.3.10. Summary Tests ............................................................................................1684.3.10.1. Test of Combined Entry and Exit Control Variables ............................ 1684.3.10.2. Test of Buyout Firm Variables .............................................................. 169
4.3.10.2.1. Descriptive Statistics........................................................................ 169
4.3.10.2.2. Regression Model............................................................................. 170
4.3.10.3. Test of Combined Entry, Exit and GP Firm Variables.......................... 171
4.3.11. Summary of Test Results .............................................................................172
4.4. Leveraged Buyout Deal vs. Public Market & Industry Financial Performance................................................................................................... 173
4.4.1. Test Setting ..................................................................................................1734.4.1.1. Variables and Hypotheses ........................................................................ 1744.4.1.2. Methodology and Data............................................................................. 175
4.4.2. LBO Value Creation by Industry Sector......................................................1764.4.2.1. LBO Value Creation by Industry Sector and Region.............................. 1784.4.2.2. LBO vs. Equity Market Performance (by Industry)................................ 179
4.4.3. A Buyout Performance Index over Time.....................................................1814.4.3.1. The Buyout Performance Entry Date Index ............................................ 1814.4.3.2. The Buyout Performance Exit Date Index............................................... 184
4.4.4. LBO Value Creation, Equity Market Return and Correlation .....................1874.4.4.1. Regression Analysis ................................................................................. 1884.4.4.2. Additional Descriptive Findings .............................................................. 188
4.4.5. Statistical Tests ............................................................................................1894.4.5.1. Financial Industry Conditions at Deal Entry ........................................... 190
4.4.5.1.1. Descriptive Statistics .......................................................................... 190
4.4.5.1.2. Regression Models ............................................................................. 192
4.4.5.2. Financial Industry Conditions at Deal Exit ............................................. 1924.4.5.2.1. Descriptive Statistics .......................................................................... 193
4.4.5.2.2. Regression Model............................................................................... 195
4.4.5.3. Modeling Buyout Performance vs. Benchmark Industry and Equity Market Performance............................................................................................... 1964.4.5.3.1. Descriptive Statistics .......................................................................... 197
4.4.5.3.2. Coefficient Statistics........................................................................... 198
4.4.5.3.3. Regression Models ............................................................................. 199
4.4.6. Summary of Test Results .............................................................................202
4.5. Leveraged Buyout Value Attribution Analysis ............................................. 204
4.5.1. Test Setting ..................................................................................................2044.5.1.1. Tested Variables and Hypotheses ............................................................ 2044.5.1.2. Methodology and Data............................................................................. 206
4.5.2. Test Results..................................................................................................2074.5.2.1. Descriptive Results................................................................................... 207
4.5.2.1.1. Financial Performance Comparison ................................................. 207
4.5.2.1.2. Value Attribution ................................................................................ 209
Table of Content VII
4.5.2.2. Regression Test ........................................................................................ 2124.5.2.3. Summary of Test Results ......................................................................... 212
4.6. Conclusions ................................................................................................... 213
5. Empirical Part II – The GP Firm and Manager Effect ......217
5.1. Introduction ................................................................................................... 217
5.2. Investment Manager and General Partner Firm Characteristics.................... 218
5.2.1. Test Setting ..................................................................................................2185.2.1.1. Tested Variables and Hypotheses ............................................................ 218
5.2.1.1.1. Time-related Experience .................................................................... 219
5.2.1.1.2. Educational Experience Profile ......................................................... 220
5.2.1.1.3. Professional Experience Profile ........................................................ 220
5.2.1.1.4. Diversity and Hierarchy Profile ........................................................ 2215.2.1.1.5. Homogeneity Profile .......................................................................... 222
5.2.1.2. Methodology and Data............................................................................. 223
5.2.2. Investment Manager Characteristics............................................................2255.2.2.1. Age, Tenure with the Firm and Private Equity Experience .................... 2255.2.2.2. Education of Buyout Fund Investment Professionals ............................. 227
5.2.2.2.1. Degrees Earned.................................................................................. 228
5.2.2.2.2. Additional Professional Qualifications ............................................. 229
5.2.2.2.3. Fields of Degrees Earned .................................................................. 230
5.2.2.2.4. Buyout Investment Manager University Ranking.............................. 232
5.2.2.2.5. Buyout Investment Manager Business School Ranking..................... 233
5.2.2.3. Professional Experience and Network of Buyout Investment Managers 234
5.2.3. General Partner Firm Characteristics...........................................................2375.2.3.1. Average Buyout Firm Team Size and Hierarchy .................................... 237
5.2.4. Performance of Buyout Firms......................................................................2405.2.4.1. Buyout Firm Returns................................................................................ 2415.2.4.2. Realized vs. Unrealized Buyout Fund Returns........................................ 2415.2.4.3. General Partner Team Size and Performance.......................................... 243
5.2.5. Performance of Investment Managers .........................................................2455.2.5.1. Buyout Performance by Education .......................................................... 245
5.2.5.1.1. Degree Level and Buyout Performance............................................. 2455.2.5.1.2. Degree Type and Buyout Performance.............................................. 247
5.2.5.1.3. Universities and Buyout Performance............................................... 247
5.2.5.1.4. Business Schools and Buyout Performance....................................... 248
5.2.5.2. Professional Experience, Network and Buyout Performance ................. 2495.2.5.3. Experience and Buyout Performance ...................................................... 251
5.2.5.3.1. Private Equity Experience and Buyout Performance........................ 251
5.2.5.3.2. Buyout Firm Tenure and Buyout Performance ................................. 252
5.2.5.3.3. Buyout Firm Hierarchy and Buyout Performance ............................ 253
5.2.5.3.4. Investment Professional Age and Buyout Performance .................... 254
5.2.6. Modeling the Buyout Firm and Team Manager Effect................................2565.2.6.1. Descriptive Statistics ................................................................................ 256
5.2.6.1.1. Manager/ Time Experience Effect ..................................................... 2565.2.6.1.2. Manager/Team Professional Experience Effect ................................ 257
5.2.6.1.3. Manager/Team Education Background Effect .................................. 257
5.2.6.1.4. Manager/Team Diversity and Hierarchy Effect ................................ 260
5.2.6.2. Coefficient Statistics Analysis ................................................................. 2615.2.6.3. Linear Regression Models Analysis ........................................................ 263
5.2.7. Summary of Findings...................................................................................265
5.3. Modeling the Buyout Firm Experience Effect .............................................. 268
5.3.1. Test Setting ..................................................................................................2685.3.1.1. Tested Variables and Hypotheses ............................................................ 2695.3.1.2. Methodology and Data............................................................................. 271
5.3.2. Test Results..................................................................................................272

Table of Content VIII
5.3.2.1. Descriptive Statistics ................................................................................ 2725.3.2.2. Coefficient Statistics ................................................................................ 2735.3.2.3. Linear Regression Models Analysis ........................................................ 275
5.3.3. Summary of Findings...................................................................................276
5.4. Conclusions ................................................................................................... 277
6. Empirical Part III – Buyout Strategies ................................279
6.1. Introduction ................................................................................................... 279
6.1.1. Test Setting ..................................................................................................2806.1.1.1. Tested Variables and Hypotheses ............................................................ 280
6.1.1.1.1. Target Company Characteristics....................................................... 281
6.1.1.1.2. Deal Decisions and Characteristics .................................................. 285
6.1.1.1.3. Acquisition Process and Strategic Events ......................................... 290
6.1.1.2. Methodology and Data............................................................................. 293
6.2. Target Company Characteristics ................................................................... 294
6.2.1. Test results ...................................................................................................2946.2.1.1. Geographic Scope and Buyouts Performance ......................................... 2946.2.1.2. Type of Goods and Buyouts Performance............................................... 2956.2.1.3. Industry Cyclicality and Buyouts Performance....................................... 2966.2.1.4. Market Share and Buyouts Performance ................................................. 2976.2.1.5. Generic Business Strategy and Buyouts Performance ............................ 2986.2.1.6. Market Structure and Buyouts Performance............................................ 2996.2.1.7. Product Diversification and Buyouts Performance ................................. 3006.2.1.8. Customer Base and Buyout Performance ................................................ 3006.2.1.9. Distribution Channels and Buyout Performance ..................................... 3016.2.1.10. Prior Organizational Structure and Buyout Performance ..................... 3026.2.1.11. Prior Corporate Governance Structure and Buyout Performance......... 3036.2.1.12. Prior Ownership Structure and Buyout Performance............................ 304
6.3. Deal Decisions and Characteristics ............................................................... 305
6.3.1. Test results ...................................................................................................3056.3.1.1. Management Incentives through Equity Participation and Buyout
Performance.............................................................................................. 3056.3.1.2. MBO vs. MBI and Buyout Performance ................................................. 3086.3.1.3. Deal Source and Buyout Performance..................................................... 3096.3.1.4. Seller Type and Buyout Performance...................................................... 3106.3.1.5. Co-Investors and Buyout Performance.................................................... 3116.3.1.6. Further Involvement of Previous Owner and Buyout Performance........ 3126.3.1.7. Seller’s Motivation and Buyout Performance ......................................... 3136.3.1.8. Buyer’s Motivation and Buyout Performance......................................... 314
6.4. Acquisition Process and Strategic Events ..................................................... 316
6.4.1. Test results ...................................................................................................3166.4.1.1. Key Strategic Reorientation/Organizational Events and Buyout
Performance.............................................................................................. 3166.4.1.2. New Sub-Strategy Implementation Events.............................................. 3176.4.1.3. Capacity, Resource Planning and (Dis)Investment Activities ................ 319
6.4.1.3.1. Disinvestment Activities and Buyout Returns .................................... 319
6.4.1.3.2. Investment Activities and Buyout Returns ......................................... 321
6.5. Modelling Buyout Characteristics, Decisions and Strategic Events ............. 323
6.5.1. Test results ...................................................................................................3236.5.1.1. Descriptive Statistics ................................................................................ 3236.5.1.2. Coefficient Statistics ................................................................................ 3266.5.1.3. Linear Regression Models Analysis ........................................................ 328
6.5.2. Summary of Findings...................................................................................329
Table of Content IX
6.6. Conclusions ................................................................................................... 331
7. Summary and Conclusions....................................................332
7.1. Summary of Study’s Key Findings ............................................................... 332
7.1.1. Summary Findings on Market & Financial Related Value Creation Drivers .........................................................................................................332
7.1.2. Summary Findings on Buyout Firm and Investment Manager Related Value Creation Drivers...........................................................................................338
7.1.3. Summary Findings on Buyout Strategy Related Value Creation Drivers....342
7.1.4. Interpretation of Results with Research Hypotheses ...................................346
7.2. Contributions to Research and Applications to Practice ............................... 347
7.2.1. Contributions to Agency Theoretical and Finance Research.......................347
7.2.2. Contributions to Strategic Management Research.......................................350
7.2.3. Applications of Findings to Private Equity Practitioners.............................352
7.3. Limitations of Study and Areas of Future Research ..................................... 353
8. Appendices ..............................................................................355
9. Bibliography ...........................................................................369
Curriculum Vitae
List of Figures X
List of Figures
Figure 1: Purpose of Study – Suggested Approach to Reading according to Audience ________________ 5
Figure 2: Areas of Private Equity Investment ________________________________________________ 8
Figure 3: Overview of the Buyout Process _________________________________________________ 14
Figure 4: Key Areas and Criteria for LBO Fund Due Diligence ________________________________ 40
Figure 5: General Acquisition Process ____________________________________________________ 45
Figure 6: Acquisition Process – adapted to Leveraged Buyouts_________________________________ 45
Figure 7: LBO Value Creation Model_____________________________________________________ 46
Figure 8: Research Model______________________________________________________________ 47
Figure 9: Summary of Value Attribution in Buyout of the St. Gallen University Catering Company, Inc._ 59
Figure 10: Flow of Private Equity Financial Reporting Information _____________________________ 61
Figure 11: Study’s Venture Economics Sample Overview (January 1980 – June 2003) ______________ 63
Figure 12: Conceptual Approach to Data Analysis in the Study_________________________________ 76
Figure 13: Total Global Venture Capital, LBO and Private Equity Funds Raised (US$ mm) by Year ___ 79
Figure 14: Total Global Venture Capital, LBO and Private Equity Funds Raised (No. of Funds) by Year 80
Figure 15: Average Fund Size of Total Global Venture Capital, LBO and all Private Equity Funds Raised
(US$ mm) by Year ___________________________________________________________ 81
Figure 16: Total Global Venture Capital, LBO and all Private Equity Funds Raised (US$ mm) by
Country____________________________________________________________________ 82
Figure 17: Total Global Venture Capital, LBO and all Private Equity Funds Raised (No. of Funds Raised)
by Country _________________________________________________________________ 83
Figure 18: Total Amount of Deal Investments (1980-2002) by Industry Sector (Level 3) _____________ 85
Figure 19: Total Number of Deals (1980-2002) by Industry Sector (Level 3) ______________________ 85
Figure 20: Average Deal Size (1980-2002) by Industry Sector (Level 3) __________________________ 86
Figure 21: Average Private Equity Deal Sizes (1980-2002) by Year _____________________________ 87
Figure 22: Total Amount of Deal Investments (1980-2002) by Industry Sector (Level 4) _____________ 88
Figure 23: Total Number of Deals (1980-2002) by Industry Sector (Level 4) ______________________ 89
Figure 24: Average Deal Size (1980-2002) by Industry Sector (Level 4) __________________________ 90
Figure 25: Non-weighted Average Net Fund Returns by Year and by Fund Type (1983-2002) _________ 92
Figure 26: Weighted Average Net Fund Returns by Year and by Fund Type (1980-2003) ____________ 93
Figure 27: Weighted and Unweighted Net Venture Capital Fund Returns by Year (1980-2003)________ 95
Figure 28: Weighted and Unweighted Net Buyout Fund Returns by Year (1980-2003) _______________ 96
Figure 29: Weighted Net Buyout Fund Returns and Volatility by Year (1980-2003) _________________ 97
Figure 30: Weighted Net Venture Capital Fund Returns and Volatility by Year (1980-2003) __________ 98
Figure 31: Average Net Fund Return of Investments made (1983-2003) by Level 3 Industry Sector (Proxy
Trend) ____________________________________________________________________ 100
Figure 32: Average Net Buyout Fund Return of Investments made (1983-2003) by Industry Sector (Proxy
Trend) vs. Total Amount of Deal Investments (1980-2002) by Industry Sector (Level 3) ____ 101
Figure 33: Average Net Venture Capital Fund Return of Investments made (1983-2003) by Industry Sector
(Proxy Trend) vs. Total Amount of Deal Investments (1980-2002) by Industry Sector
(Level 3) __________________________________________________________________ 102

Table of Tables XI
Figure 34: Average Net Fund Return of Investments made (1983-2003) by Level 4 Industry Sector (Proxy
Trend) ____________________________________________________________________ 103
Figure 35: Average Net Buyout Fund Return of Investments made (1983-2003) by Industry Sector (Proxy
Trend) vs. Total Amount of Deal Investments (1980-2002) by Industry Sector (Level 4) ____ 104
Figure 36: Average Net Venture Capital Fund Return of Investments made (1983-2002) by Industry Sector
(Proxy Trend) vs. Total Amount of Deal Investments (1980-2002) by Industry Sector
(Level 4) __________________________________________________________________ 105
Figure 37: Average Net Fund Returns (1983-2002) by Country________________________________ 105
Figure 38: Average Net Private Equity Fund Returns (1980-2002) of Investments made by Year and by
Region (Fund’s jurisdiction) __________________________________________________ 106
Figure 39: Average Net Venture Capital Fund Returns (1980-2002) of Investments made by Year and by
Region (Fund’s jurisdiction) __________________________________________________ 107
Figure 40: Average Net Buyout Fund Returns (1980-2002) of Investments made by Year and by Region
(Fund’s jurisdiction)_________________________________________________________ 108
Figure 41: Weighted Average Net Fund Returns of Funds based on Investment Status ______________ 109
Figure 42: Weighted Average Net Fund Returns of Funds based on Investment Stage ______________ 110
Figure 43: Average Gross Returns of Buyout Deals by Investment Status and by Year (1981-2002)____ 119
Figure 44: Average Gross Returns of Realized Buyout Deals by Region and by Year (1981-2002) ____ 121
Figure 45: Average Gross Returns of Realized Buyout Deals by Country ________________________ 125
Figure 46: Average Gross Returns of Buyout Deals by Industry Sector and Investment Status
(1980-2002) _______________________________________________________________ 128
Figure 47: Average Gross Returns of Buyout Deals by Industry Sector and by Region (1980-2002) ___ 129
Figure 48: Average Gross Returns of Buyout Deals by Industry Sector (Level 4) and Investment Status
(1980-2002) _______________________________________________________________ 131
Figure 49: Average Gross Returns of Buyout Deals by Industry Sector (Level 4) and Region
(1980-2002) _______________________________________________________________ 132
Figure 50: Average Gross Returns of Realized Buyout Deals by Ownership Percentage Quartile _____ 137
Figure 51: Average Gross Returns of Realized U.S. Buyout Deals by Ownership Percentage Quartile _ 138
Figure 52: Weighted Average Gross Returns of Realized European Buyout Deals by Ownership Percentage
Quartile __________________________________________________________________ 139
Figure 53: Weighted Average Gross Returns of Realized Buyout Deals by Average Investment Size
Categories ________________________________________________________________ 140
Figure 54: Average Gross Returns of Realized Buyout Deals by Holding Period __________________ 144
Figure 55: Weighted Average Gross Returns of Buyout Deals by Entry Mode, Average Invested Capital and
Investment Status ___________________________________________________________ 148
Figure 56: Weighted Average Gross Returns of Buyout Deals by Entry Mode, Holding Period and
Region____________________________________________________________________ 149
Figure 57: Weighted Average Gross Returns of Buyout Deals by Entry Mode, Holding Period and
Investment Status ___________________________________________________________ 150
Figure 58: Weighted Average Gross Returns of Buyout Deals by Entry Mode, Average Invested Capital and
Region____________________________________________________________________ 151
Figure 59: Weighted Average Gross Returns of Buyout Deals by Exit Mode and Invested Capital_____ 152
Figure 60: Weighted Average Gross Returns of Buyout Deals by Exit Mode, Holding Period and
Region____________________________________________________________________ 153
Figure 61: Weighted Average Gross Returns of Buyout Deals by Exit Mode and Holding Period _____ 154

Table of Tables XII
Figure 62: Weighted Average Gross Returns of Buyout Deals by Exit Mode, Holding Period and
Region____________________________________________________________________ 155
Figure 63: Weighted Average Gross Returns of Buyout Deals by Entry Type, Holding Period and
Investment Status ___________________________________________________________ 159
Figure 64: Weighted Average Gross Returns of Buyout Deals by Entry Type, Average Invested Capital and
Investment Status ___________________________________________________________ 160
Figure 65: Weighted Average Gross Returns of Buyout Deals by Entry Type, Holding Period and
Region____________________________________________________________________ 161
Figure 66: Weighted Average Gross Returns of Buyout Deals by Entry Type, Average Invested Capital and
Region____________________________________________________________________ 161
Figure 67: Development of Weighted Average Gross Returns, Average Invested Capital and Average
Holding Period of Buyout Deals acquired via Auction ______________________________ 162
Figure 68: Weighted Average Gross Returns of Buyout Deals by Exit Type, Average Invested Capital and
Average Holding Period______________________________________________________ 163
Figure 69: Weighted Average Gross Returns of Buyout Deals by Exit Type, Average Invested Capital,
Average Holding Period and Region ____________________________________________ 164
Figure 70: Realized LBO Deals’ Value Creation vs. Industry Indices (Level 3) ___________________ 177
Figure 71: Realized LBO Deals’ Value Creation vs. Industry Indices (Level 4) ___________________ 178
Figure 72: Realized LBO Deals’ Value Creation vs. Industry Indices (Level 3) for selected Industries by
Region____________________________________________________________________ 179
Figure 73: Realized LBO Deals’ Value Creation Index vs. Equity Market Performance (S&P 500, MSCI
Europe/World) grouped by Deal’s Industry Classification ___________________________ 180
Figure 74: Realized LBO Deals’ Value Creation Index vs. Industry Indices Performance (Level 6) by
Buyout Acquisition Year ______________________________________________________ 181
Figure 75: Realized LBO Deals’ Value Creation Index vs. Average Holding Period of Deals by Buyout
Acquisition Year ____________________________________________________________ 182
Figure 76: Realized LBO Deals’ Value Creation Index vs. Average Industry Performance Driver CAGRs
by Acquisition Year__________________________________________________________ 183
Figure 77: Realized LBO Deals’ Value Creation Index vs. Industry Indices Performance (Level 6) by
Buyout Exit Year____________________________________________________________ 184
Figure 78: Realized LBO Deals’ Value Creation Index vs. Average Industry Performance Driver CAGRs
by Buyout Exit Year _________________________________________________________ 185
Figure 79: Realized LBO Deals’ Value Creation Index vs. Average Holding Period of Deals by Buyout Exit
Year _____________________________________________________________________ 186
Figure 80: Realized LBO Deals’ Value Creation Index vs. Average Industry Indices Performance (Level 6)
and S&P 500 Composite Price Index by Buyout Acquisition Year______________________ 189
Figure 81: Revenue, Cash Flow and Profitability Development for Buyout Deals vs. Industry
Comparables_______________________________________________________________ 207
Figure 82: Entry and Exit Conditions for Buyout Deals vs. Industry Comparables _________________ 208
Figure 83: Value Attribution of All Buyout Deals vs. Industry Comparables______________________ 210
Figure 84: Value Attribution of Buyout Deals vs. Industry Comparables – Consumer Goods Sector ___ 210
Figure 85: Value Attribution of Buyout Deals vs. Industry Comparables – Basic Industries and General
Industrials_________________________________________________________________ 211
Figure 86: Value Attribution of Buyout Deals vs. Industry Comparables – Information Technology
Sector ____________________________________________________________________ 211

Table of Tables XIII
Figure 87: Investment Manager and General Partner Firm Drivers of Value Creation _____________ 219
Figure 88: Distribution of Age of Buyout Fund Investment Professionals ________________________ 225
Figure 89: Distribution of Tenure of Buyout Fund Investment Professionals______________________ 226
Figure 90: Distribution of Private Equity Experience of Buyout Fund Investment Professionals ______ 227
Figure 91: Distribution of all Degrees Earned by Buyout Fund Investment Professionals ___________ 228
Figure 92: Distribution of First Degree Earned by Buyout Fund Investment Professionals __________ 228
Figure 93: Distribution of Second Degree Earned by Buyout Fund Investment Professionals ________ 229
Figure 94: Distribution of Third Degree Earned by Buyout Fund Investment Professionals__________ 229
Figure 95: Additional Professional Qualifications Earned by Buyout Fund Investment Professionals __ 230
Figure 96: Field of all Degrees Earned by Buyout Fund Investment Professionals _________________ 230
Figure 97: Field of first Degree Earned by Buyout Fund Investment Professionals ________________ 231
Figure 98: Field of second Degree Earned by Buyout Fund Investment Professionals ______________ 231
Figure 99: Field of third Degree Earned by Buyout Fund Investment Professionals ________________ 231
Figure 100: Top 31 Universities – All Degrees Earned by Buyout Fund Investment Professionals_____ 232
Figure 101: Top 12 Universities – MBA Degrees Earned by Buyout Fund Investment Professionals ___ 233
Figure 102: Network, Professional Experience and Current Positions of Buyout Fund Investment
Professionals by Sector ______________________________________________________ 234
Figure 103: Typical Buyout Fund Hierarchy and Functions with Average Number of Investment
Professionals per Level ______________________________________________________ 238
Figure 104: Average GP Team Size and Size Category Frequency vs. Average Deal Size of Buyout
Funds ____________________________________________________________________ 239
Figure 105: Weighted Average Gross IRR based on all underlying Transactions by General Partner __ 241
Figure 106: Realized vs. Unrealized deal-based Weighted Average Gross IRR by General Partner____ 242
Figure 107: Weighted Average Gross IRR on Realized Deals by Buyout Firm Team Size____________ 243
Figure 108: Weighted Average Gross IRR on Deals by Individual Buyout Investment Professionals by
Degree Level_______________________________________________________________ 246
Figure 109: Weighted Average Gross IRR on Deals by Individual Buyout Investment Professionals by
Degree Type _______________________________________________________________ 247
Figure 110: Weighted Average Gross IRR on Deals by Individual Buyout Investment Professionals by
attended University__________________________________________________________ 248
Figure 111: Weighted Average Gross IRR on Deals by Individual Buyout Investment Professionals by
attended Business School _____________________________________________________ 249
Figure 112: Weighted Average Gross IRR on Deals by Individual Buyout Investment Professionals by
Position___________________________________________________________________ 250
Figure 113: Weighted Average Gross IRR on Deals by Individual Buyout Investment Professionals by
Years of Private Equity Experience _____________________________________________ 252
Figure 114: Weighted Average Gross IRR on Deals by Individual Buyout Investment Professionals by
Years of Tenure_____________________________________________________________ 253
Figure 115: Weighted Average Gross IRR on Deals by Individual Buyout Investment Professionals by
Hierarchy _________________________________________________________________ 254
Figure 116: Weighted Average Gross IRR on Deals by Individual Buyout Investment Professionals by
Age ______________________________________________________________________ 255
Figure 117: Strategic Drivers of Value Creation ___________________________________________ 281
Figure 118: Buyout Deal Performance by Level of Geographic Scope of Operations _______________ 295
Figure 119: Buyout Deal Performance by Type of Goods ____________________________________ 296

Table of Tables XIV
Figure 120: Buyout Deal Performance by Cyclicality of Industry ______________________________ 297
Figure 121: Buyout Deal Performance by Market Share Position ______________________________ 297
Figure 122: Buyout Deal Performance by Generic Business Strategy ___________________________ 298
Figure 123: Buyout Deal Performance by Market Structure Position ___________________________ 299
Figure 124: Buyout Deal Performance by Product Diversification of Buyout Target _______________ 300
Figure 125: Buyout Deal Performance by Size of Customer Base of Buyout Target ________________ 301
Figure 126: Buyout Deal Performance by Distribution Channel of Buyout Target _________________ 302
Figure 127: Buyout Deal Performance by Organizational Structure of Buyout Target ______________ 303
Figure 128: Buyout Deal Performance by Corporate Governance Structure of Buyout Target________ 304
Figure 129: Buyout Deal Performance by Corporate Governance Structure of Buyout Target________ 305
Figure 130: Buyout Deal Performance by GP’s Management Incentive Strategy of Buyout Target ____ 306
Figure 131: Buyout Deal Performance by Percentage of Target Management Equity Participation ___ 307
Figure 132: Buyout Deal Performance by Role of Management in Deal Origination _______________ 308
Figure 133: Buyout Deal Performance by Deal Source ______________________________________ 309
Figure 134: Buyout Deal Performance by Seller Type _______________________________________ 310
Figure 135: Buyout Deal Performance by Type of Co-Investor ________________________________ 311
Figure 136: Buyout Deal Performance by Number of Co-Investors_____________________________ 312
Figure 137: Buyout Deal Performance by Involvement of Previous Owner_______________________ 313
Figure 138: Buyout Deal Performance by Seller Motivation __________________________________ 314
Figure 139: Buyout Deal Performance by Buyer Motivation __________________________________ 315
Figure 140: Buyout Deal Performance by Key Strategic Reorientation/Organizational Event ________ 317
Figure 141: Buyout Deal Performance by New Sub-Strategy Implementation Events _______________ 318
Figure 142: Buyout Deal Performance by Capacity, Resource Planning and (Dis)Investment Activities 319
Figure 143: Buyout Deal Performance by Acquisition and Divestiture Activity____________________ 320
Figure 144: Buyout Deal Performance by Type of Add-on Acquisition __________________________ 322
Figure 145: Buyout Deal Performance by Number of Add-on Acquisitions _______________________ 323

Table of Tables XV
List of Tables
Table 1: Characteristics of the Ideal LBO Candidate_________________________________________ 12
Table 2: Types of Corporate Restructuring_________________________________________________ 42
Table 3: Forms of Leveraged Buyout Transactions Classification _______________________________ 43
Table 4: Private Equity Funds and Buyout Funds – Total Population Overview ____________________ 62
Table 5: Buyout Funds’ underlying Deals – Total Population Overview __________________________ 63
Table 6: Limited Partners’ Primary Dataset Overview _______________________________________ 66
Table 7: Mean Comparison Test – Group Statistics Summary __________________________________ 69
Table 8: Mean Comparison Test – Independent Samples Test Results ____________________________ 69
Table 9: Datastream Industry Classifications (Level 3, Level 4) ________________________________ 71
Table 10: Datastream Industry Classifications (Level 6) ______________________________________ 72
Table 11: Descriptive and Correlation Statistics on Entry and Exit Years ________________________ 122
Table 12: Coefficients and Collinearity Statistics on Entry and Exit Years _______________________ 123
Table 13: Linear Regression Model on Entry and Exit Year Dummy Variables____________________ 124
Table 14: Descriptive and Correlation Statistics on Country Variables__________________________ 126
Table 15: Coefficients and Collinearity Statistics on Country Variables _________________________ 127
Table 16: Linear Regression Model on Country Variables____________________________________ 127
Table 17: Descriptive and Correlation Statistics on (significant) Industries ______________________ 133
Table 18: Coefficients and Collinearity Statistics on Combined Entry and Exit Dummy Variables_____ 134
Table 19: Linear Regression Model on Industries Level 3, 4 and 6 _____________________________ 135
Table 20: Descriptive and Correlation Statistics on Deal Size Variables_________________________ 142
Table 21: Coefficients and Collinearity Statistics on Deal Size Variables ________________________ 143
Table 22: Linear Regression Model on Deal Size Variables___________________________________ 143
Table 23: Descriptive and Correlation Statistics on Holding Period Variables____________________ 145
Table 24: Coefficients and Collinearity Statistics on Holding Period Variables ___________________ 146
Table 25: Linear Regression Model on Holding Period Variables______________________________ 146
Table 26: Descriptive and Correlation Statistics on Entry and Exit Modes _______________________ 156
Table 27: Coefficients and Collinearity Statistics on Entry and Exit Modes ______________________ 157
Table 28: Linear Regression Model on Entry and Exit Mode Dummy Variables ___________________ 157
Table 29: Descriptive and Correlation Statistics on Entry and Exit Types________________________ 166
Table 30: Coefficients and Collinearity Statistics on Entry and Exit Modes ______________________ 166
Table 31: Linear Regression Model on Entry and Exit Type Dummy Variables____________________ 167
Table 32: Linear Regression Model on all combined Entry ad Exit Dummy Variables ______________ 168
Table 33: Descriptive and Correlation Statistics on General Partners __________________________ 169
Table 34: Coefficients and Collinearity Statistics on General Partners __________________________ 170
Table 35: Linear Regression Model on General Partners ____________________________________ 170
Table 36: Linear Regression Model on Deal Size Variables___________________________________ 171
Table 37: Overview of Correlation Tests between Private Equity and Market Returns ______________ 187
Table 38: Correlation Table on Buyout Correlation with Industry Performance___________________ 188
Table 39: Linear Regression Model on Buyout Correlation with Industry Performance _____________ 188
Table 40: Descriptive Statistics on Industry Financial Entry Conditions_________________________ 191

Table of Tables XVI
Table 41: Coefficients and Collinearity Statistics on Entry Condition Variables___________________ 192
Table 42: Linear Regression Model on Entry Condition Variables _____________________________ 192
Table 43: Descriptive Statistics on Industry Financial Exit Conditions __________________________ 194
Table 44: Coefficients and Collinearity Statistics on Exit Condition Variables ____________________ 195
Table 45: Linear Regression Model on Exit Condition Variables ______________________________ 196
Table 46: Nested Linear Regression Models on Industry Financial Performance Drivers (Level 3/4/6)_ 199
Table 47: Operationalization of Buyout Team Characteristics Explanatory Variables ______________ 224
Table 48: Examples of Positions and Institutions of Buyout Fund Investment Managers by Profession _ 235
Table 49: Examples of Positions and Institutions of Buyout Fund Investment Managers by Profession or
Affiliation _________________________________________________________________ 237
Table 50: Descriptive and Correlation Statistics on Buyout Firm Deal Experience Variables ________ 258
Table 51: Descriptive and Correlation Statistics on Buyout Firm Deal Experience Variables (Unis)___ 260
Table 52: Coefficients and Collinearity Statistics on Buyout Firm Team Experience Variables _______ 262
Table 53: Linear Regression Model on Buyout Firm Deal Experience Variables __________________ 264
Table 54: Operationalization of Explanatory Variables ______________________________________ 271
Table 55: Descriptive and Correlation Statistics on Buyout Firm Deal Experience Variables ________ 272
Table 56: Coefficients and Collinearity Statistics on Buyout Firm Deal Experience Variables________ 274
Table 57: Linear Regression Model on Buyout Firm Deal Experience Variables __________________ 276
Table 58: Descriptive and Correlation Statistics on Buyout Firm Strategy Variables _______________ 325
Table 59: Coefficients and Collinearity Statistics on Buyout Strategy Variables ___________________ 327
Table 60: Linear Regression Model on Buyout Firm Strategy Variables _________________________ 328
Table 61: Summary Findings – Buyout Deal Performance and Entry and Exit (Control) Variables ____ 333
Table 62: Summary Findings – Buyout Performance vs. Industry Performance and Financials _______ 336
Table 63: Summary Findings – Buyout vs. Industry Financial Performance ______________________ 337
Table 64: Summary Findings – Investment Manager and GP Firm Characteristics ________________ 339
Table 65: Summary Findings – GP Firm Buyout Experience Profile ____________________________ 341
Table 66: Summary Findings – Buyout Target Strategic Characteristics_________________________ 343
Table 67: Summary Findings – Buyout Strategic Deal Decisions and Characteristics ______________ 344
Table 68: Summary Findings – Buyout Acquisition Process and Strategic Events__________________ 345
Table 69: Coefficients and Collinearity Statistics on Combined Entry and Exit Dummy Variables_____ 356
Table 70: Descriptive and Correlation Statistics on Industry Financial Performance Driver
(Level 3/4/6) _______________________________________________________________ 357
Table 71: Coefficients and Collinearity Statistics on Industry Financial Performance Driver (Level 3) _ 358
Table 72: Coefficients and Collinearity Statistics on Industry Financial Performance Driver (Level 4) _ 359
Table 73: Coefficients and Collinearity Statistics on Industry Financial Performance Driver (Level 6) _ 360
Table 74: Correlation Statistics on Deal Entry Condition Variables ____________________________ 361
Table 75: Correlation Statistics on Deal Exit Condition Variables _____________________________ 362

List of Abbreviations XVII
List of Abbreviations
A Assets
Acq. Acquisition
AIM Alternative Investment Management
ARD American Research and Development Corporation
Avg Average
BO Buyout
bn Billion
CAGR Compounded Annual Growth Rate
CalPERS The California Public Employees’ Retirement System
CAPM Capital Asset Pricing Model
CD&R Clayton, Dubilier & Rice, Inc.
CEO Chief Executive Officer
CFA Certified Financial Analyst
CFO Chief Financial Officer
CH Switzerland
CPA Certified Public Accountant
DB Deutsche Bank
Df (Statistical) Degree of Freedom
E Equity
EBITDA Earnings before Interest, Depreciation, Amortization and Taxes
Ec. Economics
e.g. Exempli gratia (Latin), for example
EM Equity Multiplier
ESOP Employee Stock Ownership Plan
et al. Et alii, et aliae, et alia (Latin), and others
etc. Et cetera (Latin), and other things, and so forth
EU European Union, Europe
EV Enterprise Value
EVCA European Private Equity and Venture Capital Association
Exp. Experience
FV Future Value
GDP Gross Domestic Product
GH General Hypothesis
GP General Partner
H Hypothesis
HBS Harvard Business School
HEC Haute Etudes Commerciales School of Management

List of Abbreviations XVIII
Herf. D. Herfindahl Degree (Index)
Hold Per Holding Period (of Investment)
i.e. Id est (Latin), that is
Ind. Industry
Inv Cap Invested Capital
IPO Initial Public Offering
IRR Internal Rate of Return
IT Information Technology
JD Juris Doctor, Doctor of Law
KKR Kohlberg Kravis Roberts & Co.
LBO Leveraged Buy-Out
ln Natural Logarithm
LP Limited Partner
M&A Mergers & Acquisitions
M.B.A. Master of Business Administration
Mgmt Management
mm Million
MBI Management Buy-In
MBO Management Buy-Out
MIT Massachusetts Institute of Technology
MSCI Morgan Stanley Capital International, Inc. (Capital Market Indices Provider)
MSDW Morgan Stanley Dean Witter
N/A Not announced, not applicable
NAV Net Asset Value
N, n Statistical Frequency, Case Number
ND Net Debt
NI Net Income
NVCA American National Venture Capital Association
NYU New York University
p (Statistical) Probability Value
PC Portfolio Company
PE Private Equity
PEIGG Private Equity Industry Guidelines Group
PhD Philosophi Doctor (Latin), Doctor of Philosophy
PPM Private Purchase Memorandum
P-to-P Public to Private
R&D Research and Development
Rev Revenues
ROE Return on Equity
S&P Standard and Poors
SBA Small Business Administration

List of Abbreviations XIX
SBIC Small Business Investment Companies
SFA Securities and Futures Authority
Sig. Significance
StDev Standard Deviation
TMT Technology, Media and Telecom; Top Management Team
UCLA University of California Los Angeles
U.K. United Kingdom
Uni University
U.S. United States of America
USA United States of America
US$ U.S. Dollar
USD U.S. Dollar
VC Venture Capital
VE (Thomson Financial) Venture Economics
VIF Variance Inflation Factor
WACC Weighted Average Cost of Capital
yrs Years

Abstract XX
Abstract
This study addresses sources of value creation in leveraged buyouts. Prior studies in the field of
Private Equity – and especially buyout – research broadly suffered from a lack of accessibility to
the highly confidential buyout deal and fund performance data of Private Equity firms. Following
the establishment of a few selective, successful research collaborations with leading Private Equity
Fund investors (Limited Partners) and subsequent access to their vast archives of collected
information, including obtained performance data, this study sheds light on the performance
dynamics of a sample of more than 3,000 realized and unrealized leveraged buyout transactions,
undertaken by 84 of the major buyout-focused U.S. and European Private Equity firms, drawn from
252 of these firms’ funds between 1973 and 2003, with the majority of recorded transactions taking
place during the 1990s. The study addresses value creation drivers according to three dimensions:
(i) exogenous, i.e. capital market-, industry-, financial- and acquisition-related value drivers, (ii)
endogenous, i.e. buyout investment manager and buyout firm profile as well as experience related
drivers, and (iii) buyout acquisition strategy related value drivers.
The theoretical part reviews two competing explanations for the phenomenon of apparently
significantly higher value generation and return out-performance of leveraged buyouts undertaken
by financial buyers, when weighed against comparable companies on the one side, as well as
compared to common merger and acquisition activity of strategic buyers on the other side. The
agency theoretical explanation is established around the far-reaching changes in corporate
governance regimes at buyout targets post acquisition: the frequent use of managerial incentives act
as stimuli for closer management supervision and control on the one side, and as a mean to initiate
more radical strategic change on the other side. By contrast, the strategic management view is
centred around the fact that in the event of a complete absence of synergies that would drive
acquisition rationales of strategic buyers, the interaction and knowledge transfer between the LBO
firm and its portfolio companies as well as the development of an acquisition competence on part
of the LBO organization must be seen as most important available source for the observed degree
of value generation. Subsequently, the theoretical part continues by providing an in-depth overview
of possible direct and indirect drivers of value creation or value destruction in leveraged buyouts,
based on the universe of available buyout literature. The theoretical section also offers a framework
to analyse leveraged buyout transactions and introduces the “leveraged buyout value attribution
formula”, a deduction from the Dupont formula that makes explicit the relative sources of value
generation in a particular buyout.
The empirical part is structured into three main chapters alongside the above identified three
dimensions of potential sources of value creation. The first empirical chapter starts with an
overview of the universe of leveraged buyout transactions, assembled by Private Equity
information provider Thomson Financial Venture Economics, with respect to Private Equity
fundraising and fund performance history. Subsequently, based on the primary transaction dataset

Abstract XXI
collected from Limited Partners, the study finds evidence that several of the herein examined
exogenous factors such as entry and exit years, entry and exit types and modes, industry,
country/origin, amount of invested capital, percentage of ownership, holding period, acquiring GP
firm, industry and equity market performance, as well as industry financial development, have
demonstrated to be (statistically) significant value/performance drivers in the leveraged buyout
value creation process, as measured by the dependent variable gross deal performance’s internal
rate of return (IRR).
The second empirical chapter introduces endogenous factors of value creation, focusing on the
LBO organization and its members. The Private Equity firms examined in this study were screened
with a view on their investment managers’ level and type of education, professional experience as
well as the buyout firm’s hierarchical homogeneity/diversity and organizational deal-making
experience profile. The study finds evidence that the professional experience, and to a lesser degree
the investment managers’ education, has a significant impact on expected returns. In addition, the
LBO firm’s organizational structure, team composition and diversity vs. homogeneity
configuration are found to play an important role from a return perspective. Detailed, previously
unpublished descriptive results with respect to profiling characteristics of investment manager
backgrounds and LBO firm organizations are presented. Moreover, in contrast to earlier findings
from the M&A literature field, this study uncovers evidence for the existence of a learning effect in
executing buyout transactions. While a long transaction experience track record (often associated
with more established funds) and geographic investment focus proves to be positively correlated to
performance, a focus limited to one or few industries does not. These findings collectively
underline the existence of a “GP effect” in leveraged buyouts.
The third and final chapter of the empirical part presents descriptive and statistical results published
for the first time in this form of an analysis of leveraged buyouts’ strategic value drivers, i.e. what
observable strategies do buyout firms follow and which buyout target characteristics and strategic
deal decisions may lead to higher value creation. Despite being partially restricted by lower sub-
sample sizes for a few of the analyzed independent variables (and hence accompanied by lower
statistical significance levels), the exploratory micro-level analysis in this study offers several
surprising results regarding buyout target characteristics, affirming both prior agency theoretical
and to a lesser extent strategic management theory oriented M&A literature. The analysis of
strategic measures in the critical post-acquisition management phase demonstrates that an exchange
of top management teams as well as growth oriented (also through add-on acquisitions) rather than
cost cutting strategies will benefit buyout transaction returns. Overall, the agency theoretical
explanation of superior returns in leveraged buyout finds stronger evidence.
In summary, the presented study’s research approach has been of exploratory nature and its main
contributions to theory and practice can be seen in the developed three-pillared conceptual
framework, an unparalleled sample size compared to any study in Private Equity research (as
known by the author at this time) as well as the magnitude of previously unpublished descriptive

Abstract XXII
and statistical findings regarding performance of leveraged buyout transactions. The consistently
high levels of statistical significance further support the chosen research design. Each of the three
chapters of the empirical results part is thereby seen as major ground to further deepen the
understanding of academia and practitioners in the future. Moreover, this study has also
intentionally omitted one area of potential future research: the acquisition-related dynamics and
interactions initialized through the buyout firm on the portfolio company management level.

“Once you buy a company, you are married. You are
married to that company. It’s a lot harder to sell a company
than it is to buy a company. People always call and
congratulate us when we buy a company. I say, ‘Look, don’t
congratulate us when we buy a company, congratulate us
when we sell it. Because any fool can overpay and buy a
company, as long as money will last to buy it.’ Our job
really begins the day we buy the company, and we start
working with the management, we start working with where
this company is headed.”
Henry R. Kravis
Financier and Investor

1. Introduction
1.1. Background of Research
Leveraged Buyouts (LBOs) came to fame during the 1980s in the United States when they
contributed as a major ingredient to the hostile takeover boom at that time. The American corporate
sector had experienced a dramatic increase in leveraged buyout activity between 1979 and 1989
with over 2,000 leveraged buyouts valued in excess of $250 billion (Opler and Titman 1993). The
new phenomenon found a climax in 1989, when Private Equity firm Kohlberg, Kravis & Roberts
(KKR) acquired RJR-Nabisco for $25 billion in a leveraged buyout takeover, a transaction almost
double the size of the largest previous acquisition to that date, the $13.2 billion Chevron purchase
of Gulf Oil in 1985 (Jensen 1989a). The extraordinary returns on early LBO investments had led to
an inflow of large amounts of capital from investors into LBO funds (Kaplan and Stein 1993). Both
the number of transactions and the average size of the deals had increased significantly during the
decade. However, capital market turbulence in the late 1980s, especially following “Black
Monday” on October 19th, 1987 as well as changes in the financial market environment and
defaults of a range of highly levered target companies led to a rapid decline of leveraged buyout
activity as well as a breakdown of the associated high yield (or junk) bond market until 1990-91
(Kester and Luehrman 1995; Allen 1996).
More recently, the Private Equity industry has seen considerable growth again, especially in the
formerly rather immature European market. On a per capita basis, European buyout activity is still
approximately half the level of the U.S., whereas venture investment stands at one-sixth of U.S.
levels. The European market has grown in value from €500 million in 1984 to €24.3 billion in 2001
(Gompers and Lerner 2002). Several specific drivers can be identified, which contributed to this
growth: European governments have broadly lifted prohibitions on Private Equity investment and
introduced fiscal reforms to boost this attractive alternative investment asset class, most notably in
Germany, which has become the most active buyout market in Europe (Bance 2002). General
changes in employment policies, increased government funding and taxation reforms have further
benefited the investment environment. Many countries in Europe have been re-examining their
bankruptcy rules to ease restrictions on debtors. Along with that, the emergence of more dynamic
financial markets has aided high yield debt issuance in particular – a key factor in the earlier
development of Private Equity in the United States (Gompers and Lerner 2002). Growth in buyout
activity was also amplified by the general dramatic drop in asset prices as part of the global
economic downturn that entailed the stock market decline after March 2000. In these environments
of uncertainty since then, merger and acquisition activity has since then to a great extent been
driven by buyout firms, as large corporations have been more focused on aggressively restructuring
their business portfolios in order to strengthen their balance sheets and improve profitability.
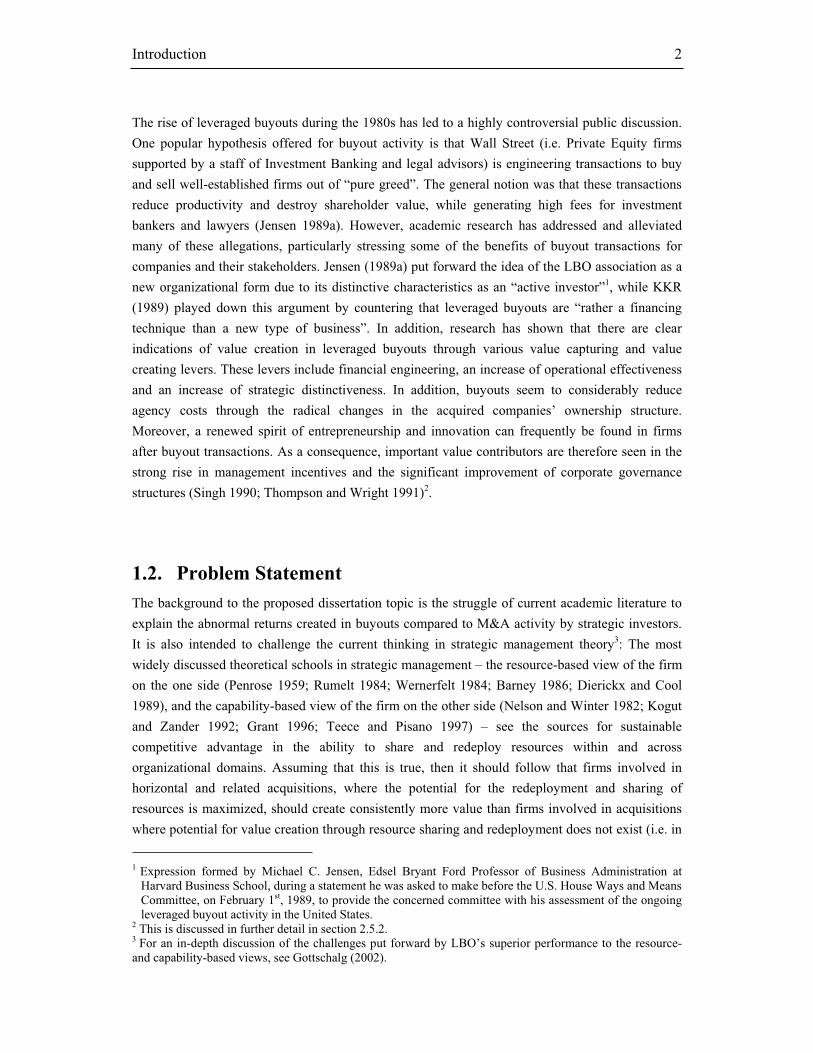
Introduction 2
The rise of leveraged buyouts during the 1980s has led to a highly controversial public discussion.
One popular hypothesis offered for buyout activity is that Wall Street (i.e. Private Equity firms
supported by a staff of Investment Banking and legal advisors) is engineering transactions to buy
and sell well-established firms out of “pure greed”. The general notion was that these transactions
reduce productivity and destroy shareholder value, while generating high fees for investment
bankers and lawyers (Jensen 1989a). However, academic research has addressed and alleviated
many of these allegations, particularly stressing some of the benefits of buyout transactions for
companies and their stakeholders. Jensen (1989a) put forward the idea of the LBO association as a
new organizational form due to its distinctive characteristics as an “active investor”1, while KKR
(1989) played down this argument by countering that leveraged buyouts are “rather a financing
technique than a new type of business”. In addition, research has shown that there are clear
indications of value creation in leveraged buyouts through various value capturing and value
creating levers. These levers include financial engineering, an increase of operational effectiveness
and an increase of strategic distinctiveness. In addition, buyouts seem to considerably reduce
agency costs through the radical changes in the acquired companies’ ownership structure.
Moreover, a renewed spirit of entrepreneurship and innovation can frequently be found in firms
after buyout transactions. As a consequence, important value contributors are therefore seen in the
strong rise in management incentives and the significant improvement of corporate governance
structures (Singh 1990; Thompson and Wright 1991)2.
1.2. Problem Statement
The background to the proposed dissertation topic is the struggle of current academic literature to
explain the abnormal returns created in buyouts compared to M&A activity by strategic investors.
It is also intended to challenge the current thinking in strategic management theory3: The most
widely discussed theoretical schools in strategic management – the resource-based view of the firm
on the one side (Penrose 1959; Rumelt 1984; Wernerfelt 1984; Barney 1986; Dierickx and Cool
1989), and the capability-based view of the firm on the other side (Nelson and Winter 1982; Kogut
and Zander 1992; Grant 1996; Teece and Pisano 1997) – see the sources for sustainable
competitive advantage in the ability to share and redeploy resources within and across
organizational domains. Assuming that this is true, then it should follow that firms involved in
horizontal and related acquisitions, where the potential for the redeployment and sharing of
resources is maximized, should create consistently more value than firms involved in acquisitions
where potential for value creation through resource sharing and redeployment does not exist (i.e. in
1 Expression formed by Michael C. Jensen, Edsel Bryant Ford Professor of Business Administration at
Harvard Business School, during a statement he was asked to make before the U.S. House Ways and Means Committee, on February 1st, 1989, to provide the concerned committee with his assessment of the ongoing leveraged buyout activity in the United States.
2 This is discussed in further detail in section 2.5.2. 3 For an in-depth discussion of the challenges put forward by LBO’s superior performance to the resource- and capability-based views, see Gottschalg (2002).

Introduction 3
buyout transactions). While this has been found to be at least partially supported (Chatterjee 1986;
Lubatkin 1987; Lubatkin and O'Neill 1987; Singh and Montgomery 1987; Seth 1990; Healy,
Palepu et al. 1992) in comparing related and unrelated acquisitions by so-called “strategic” buyers
(i.e. firms engaged in manufacturing or service activities), the empirical evidence seems to show
that the opposite is true when the performance of these acquirers is juxtaposed to the performance
of “financial” acquirers (i.e. LBO firms engaged in the acquisition and divestiture of companies as
their principal activity), which, by definition, cannot leverage any type of traditional resource-
based advantage with the acquired firms (Gottschalg 2002).
This contrast is particularly striking when the average returns to shareholders of “strategic”
acquirers are compared with similar returns provided by “financial” acquirers specialized in
leveraged buyouts (LBOs) to the investors in the closed-end funds that they manage in order to
carry out their acquisitions. Whereas in the former case, literature shows that the average abnormal
return to acquirers’ shareholders is zero (Jensen and Ruback 1983; Franks, Harris et al. 1991) and
in some studies is even found to be significantly negative (Agrawal, Jaffe et al. 1992), the average
returns to investors in buyout funds are consistently and abundantly superior, ranging historically
well above 30% average compound annual return (Kaplan 1989b) and maintaining superior, albeit
lower, levels even in recent years (Venture-Economics 1999; Butler 2001; CalPERS 2002; Reyes
and Mendell 2004; Venture-Economics 2004). The superiority of returns from buyout investments
remains even after an adjustment for differences in financial leverage and operational risk between
buyout transactions and the average “strategic” acquisition (Kaplan 1989b).
As a result of this apparent phenomenon of consistently higher returns found among leveraged
buyout compared to strategic buyer transactions, this study shall (i) theoretically explore an
appropriate framework to study this research topic, (ii) provide (descriptive and statistical)
evidence about the seemingly superior value creation dynamics in leveraged buyouts, and (iii)
make explicit the underlying value drivers and success factors that contribute to this
(out)performance. In an unprecedented analysis of both primary and secondary Private Equity fund
and deal data collected within research partnership agreements with Venture Economics and
renowned Private Equity Fund of Fund investors, the author seeks to lift part of the mystery
surrounding buyout performance and to re-introduce an under-researched topic to the academic
world.
1.3. Need for Study
The present study is motivated by the overall relatively sparse amount of research in the fields of
finance and strategic management on leveraged buyouts, especially with regard to performance and
its value drivers. One of the key reasons for the lack of studies in this field has been the traditional
Introduction 4
difficulty in accessing data.4 Unlike in the public market domain, where both stock performance
data and accounting information are easily accessible, the Private Equity industry in particular has
sealed disclosure of both fund and deal performance. Most of the influential literature on the topic
was published during the late 1980s and early 1990s, when the buyout phenomenon became a
matter of public and academic interest, with a lower number of major contributions during the late
1990s. The recent steep increase in leveraged buyout activity has now also revived research efforts.
Among the most recent, the finance field has contributed with several working papers on Private
Equity fund performance, based on Venture Economics data (Kaplan and Schoar 2003; Ljungqvist
and Richardson 2003). However, no single study has been introduced yet, which endeavored to
take a holistic view on the topic of performance of buyouts and its drivers. The author saw the clear
potential to gain access to (i) a meaningful set (i.e. significantly larger than for prior studies) of
individual buyout transaction data, and (ii) Private Equity industry experts, in order to design a
research model that takes into account the key drivers of buyout performance, thereby making a
contribution to this field of research that goes beyond a pure financial evaluation of buyout fund
performance (i.e. analysis of the Private Equity investment asset class).
1.4. Purpose of Study
The study is aimed at two audiences – Academia as well as Private Equity practitioners. The goal
of applied corporate finance research is to identify a research gap, which makes a contribution to
finance theory-building and equally provides answers to current real-world issues. The former
point has been challenged above such that the author seeks to fill an evident research gap through a
holistic methodology towards sources of value creation in buyouts. Concerning the latter point, the
Private Equity industry is undergoing radical changes: the increased investor pressure for more
explicit disclosure in the Private Equity industry, the need for institutional investors such as Private
Equity Fund of Funds to identify top quartile performing LBO funds for their large scale
investment decisions as well as an expected consolidation in a currently overcrowded and to a large
extent still underinvested Private Equity industry form a fascinating basis for this study.
Accordingly, this study could and should therefore be read both with an academic and
practitioner’s eye: On the one hand, the academic reader may want to focus on the literature
review, the research model and applied methodology, the dataset, variable hypothesis discussion as
well as test and interpretation of statistical results. The academic reader may pay less attention to
the descriptive sections, which graphically present and review extensive new insights on
performance distributions and determinants of value creation, however, not all of which can be
4 Important more recent LBO (operating financial) performance studies with respect to sample size include
Long, W. F. and D. F. Ravenscraft (1993a), using a sample of 209 leveraged buyouts (LBOs) and 48 going private transactions occurring between 1978 and 1989, or Opler, T. and S. Titman (1993), using a sample of 180 LBOs between 1980 and 1990.

Introduction 5
verified through statistical significance.5 On the other hand, the (LBO fund investor/analyst or
Limited Partner) practitioner may especially focus on the descriptive results with a view on how to
improve his/her institution’s fund due diligence processes in order to make better (top quartile)
LBO fund investment decisions. Of particular importance could be the deduction and application of
the value attribution formula (see section 3.5.4.), the evaluation of buyout performance versus
industry (index) performance and the analysis of buyout firm and investment managers in the
second chapter of empirical results. Finally, from a General Partner view, the study should provide
recommendations to questions such as which industry sectors have historically performed
exceptionally well, which entry and exit characteristics and market conditions surrounding buyout
targets are advantageous as well as which strategic actions on average as well as on a relative basis
should receive the highest investment-managerial attention. The following figure 1 summarizes the
author’s suggested approach to reading this study, according to audience:
AcademiaAcademia Private Equity Practitioner
Private Equity Practitioner
Literature ReviewLiterature Review
Omit: Potentially
descriptive findings
Omit: Potentially
descriptive findings
Limited PartnerLimited Partner
General PartnerGeneral Partner
Research Model and MethodologyResearch Model and Methodology
Control Population ResultsControl Population Results
Variable Hypothesizes DiscussionVariable Hypothesizes Discussion
Dataset OverviewDataset Overview
Literature ReviewLiterature Review
Value Attribution Formula DeductionValue Attribution Formula Deduction
Summary (statistical) FindingsSummary (statistical) Findings
IM/Buyout Firm ProfilesIM/Buyout Firm Profiles
Descriptive FindingsDescriptive Findings
Buyout StrategiesBuyout Strategies
Industry PerformancesIndustry Performances
Entry and Exit Modes and TypesEntry and Exit Modes and Types
Buyout Strategies and EventsBuyout Strategies and Events
Entry and Exit Industry ConditionsEntry and Exit Industry Conditions
Statistical Results/SignificanceStatistical Results/Significance
Validity of Results/Research ModelValidity of Results/Research Model
Omit: StatisticsOmit: StatisticsOmit: Potentially
literature
Omit: Potentially
literature
Figure 1: Purpose of Study – Suggested Approach to Reading according to Audience
1.5. Scope and Limitations
The scope of this study is intended to provide a broad and holistic overview of potential sources of
value creation in leveraged buyouts. The chosen research design is built upon three main pillars of
value drivers, which are given near equal attention through three empirical chapters; each area of
value drivers is considered distinct and hence requires a separate empirical analysis and approach.
The study is of a highly exploratory nature and intends to make explicit trends in an un-researched
5 Also compare section 3.7.2., which further provides a useful overview of the approach to data analysis in this study.

Introduction 6
field, i.e. offers at length a new approach to evaluating buyout performances. It is also based on an
unprecedented dataset, i.e. with regard to breadth of buyout transactions, i.e. total number, and
depth of buyout transactions, i.e. extent of codified and extracted data/information as well as
number of calculated variables. The study therefore promotes an extensive graphical and
descriptive presentation and discussion of results. Due to the complexity of tested variables,
statistical analysis cannot be computed on all variables at once, but is tested group-wise on various
sub-samples of the total primary dataset, however, clearly divided within the empirical chapters.
Results from the statistical analysis crucially need to be put adjacent to the descriptive findings, as
the latter’s recommendations and trends cannot broadly be validated without appropriate statistical
significance levels.
Consequently, the limitations of this study’s approach are considered twofold. First, due to the
chosen holistic approach to the study’s research design, and hence created complexity resulting
from a breadth of variables tested throughout the three empirical chapters, the overall research
model, as outlined in section 3.3., may lose some degree of its transparency at times. In fact, the
author considers each empirical chapter in itself as highly fertile ground for further research which
eventually must be extended through further literature field interpretation and further developed
tests. Secondly, this study does not propose explaining or even giving an educated indication of
levels of net return (to investors) in the Private Equity or Buyout Fund investment asset class, as
this analysis would need to be based on an exact, time-sensitive evaluation of cash flows, adjusted
for market and risk factors. Instead, this study is solely concerned with the illumination of actual
observed levels of gross buyout performance, e.g. comparisons with public market investment, the
relative attractiveness of the alternative investment options the buyout firm encounters at any given
time, as well as distinct value drivers from three major sources – market and financial drivers,
buyout manager and buyout firm drivers, and strategic drivers.6
1.6. Organization of Research
Following the introductory section to the dissertation topic, the subsequent 2nd chapter will provide
a literature overview on leveraged buyouts, focusing (i) on the major views based on agency theory
(finance) and the resource-based view (strategic management), and (ii) existing theory with regard
to identified sources of value creation. Next, the 3rd theoretical chapter provides an extensive
overview of this study’s complex research model, research goals and objectives, general
hypotheses, chosen methodology and empirical approach as well as data overview. In addition, it
includes a mathematical deduction of the performance evaluation metric, i.e. the dependent
variable internal rate of return (IRR), and the buyout value attribution formula.

Introduction 7
Chapters four, five and six represent the three sub-divided chapters of empirical results in this
study. For clarity of presentation, each chapter comprises an introduction to the problem, data
overview and discussion of several testable “variable hypotheses” (“H”), which are independent
from the study’s main general hypotheses (“GH”) and intended to impart return expectations. The
large 4th chapter first introduces the control population based on Private Equity fund return data
provided by Venture Economics. Broad trends based on this data are presented. The chapter then
introduces the study’s primary sample, for which initially a range of entry- and exit-related
variables of individual buyout performance are shown, a closer comparison with public market and
industry index performance is offered, and finally buyout company financial performance is
juxtaposed against industry peers. The 5th chapter of empirical results shifts the attention to the “GP
effect” in leveraged buyouts by familiarizing the reader with investment manager profiles and
buyout firm characteristics, its team dynamics and performance thereof. It also evaluates the
experience effect achieved by buyout firms through regularly executing this specific type of
transaction. The 6th chapter of empirical results appraises strategic aspects of buyouts: the effects of
differing buyout target characteristics and business strategies, specific acquisition-related deal
decisions as well as strategic actions taken in the post-acquisition management phase are put into
perspective with acquisition performance. The 7th chapter summarizes and concludes this study.
6 The actual levels of gross returns presented in this study are in various cases exceptionally high, since
frequently based on (successful) realized transactions only, and therefore should not be compared with overall levels of fund returns to Private Equity investors.

2. Literature Review
The emergence of the LBO phenomenon during the takeover boom of the 1980s has stimulated a
broad stream of academic research that analyses the effects of LBO transactions. This research in
the areas of both corporate finance and strategic management can be categorized according to the
focal impact of the LBO transaction into studies primarily concerned with the effect on target
valuation, operational changes, impact on corporate governance and strategy, changes in the
resource and capability base and profitability. The following sections are intended to give an
overview of the relevant LBO literature, with special attention to value creation drivers in buyout
transactions.
2.1. Definitions and the Buyout Process
2.1.1. The Private Equity Investment Asset Class
Leveraged buyouts are part of the Private Equity investment asset class, which besides buyouts also
includes Venture Capital (seed, start-up, expansion and replacement capital) as well as mezzanine
capital. Private Equity itself is part of the wider alternative investment universe, which comprises
asset classes such as hedge funds, real estate, physical commodities, currencies and interest rates
(Bance 2002). Private Equity investing may broadly be defined as “investing in securities through a
negotiated process”, as the majority of Private Equity investments are in unquoted companies.
Private Equity investment is typically a transformational, value-added, active investment strategy
and it calls for highly specialized skills by the investment manager, which among other areas is a
key due diligence area for investors’ assessment of a fund management team. The processes of
buyout and venture investing call for different applications of these skills as they focus on different
stages of the life cycle of a company. Private Equity investing is often divided into five broad
categories, as outlined below:
Seed Start-up ExpansionReplacement
CapitalBuyout
Maturity of the Company
Seed Start-up ExpansionReplacement
CapitalBuyout
Maturity of the Company
Figure 2: Areas of Private Equity Investment

Literature Review 9
2.1.1.1. History of Private Equity
The history of Private Equity is best described by analyzing the developments in the United States
during the second half of the 20th century. The first professionally managed Private Equity
investments in the U.S. date back to the formation of the American Research and Development
Corporation (ARD), a publicly traded, closed-end Company, in 1946. As the wealth distribution in
the U.S. was becoming concentrated in the hands of financial institutions rather than individuals,
the ARD founders hoped to (i) create a private institution that attracted institutional investors and
(ii) provide capital and managerial expertise to acquired businesses. At the same time, the
development of the ARD paralleled the postwar creation of similar professional organizations
managing Venture Capital investments of wealthy families. Other Private Equity investments were
funded on a deal-by-deal basis by syndicates of wealthy individuals, corporations, and institutional
investors organized by investment managers (Fenn, Liang et al. 1996).
As a direct response to the short supply of Private Equity capital throughout the 1950’s, the U.S.
Congress undertook several initiatives to remedy this situation. Most importantly, it passed new
legislation with the Small Business Investment Act of 1958, which paved the way for the
establishment of Small Business Investment Companies (SBICc). These SBICs were private
corporations licensed by the Small Business Administration (SBA) to provide professionally
managed capital to risky companies. The SBICs were allowed to supplement private capital with
SBA loans and were eligible for certain tax benefits. In return, however, they were subject to
certain restrictions, e.g. limitations on the size of the companies in which they invested as well as
restrictions on their ability to take controlling interests in acquired companies. As a consequence,
the SBICs attracted more risk-averse individuals rather than institutional investors.
Throughout the 1960s, Private Equity managers had gained valuable experience, but seen only
modest personal reward. This provided the impetus for the formation of a significant number of
Venture Capital Limited Partnerships as a way of addressing the compensation issue. Under the act
of 1940, managers of publicly traded Venture Capital firms could not receive stock options or other
forms of performance-based compensation (Liles 1977). The Limited Partnership thus not only
resolved the inadequate compensation problem, it was also appealing in order to avoid the SBIC-
type investment restrictions. Moreover, Limited Partnerships attracted new and more sophisticated
investors compared to the publicly traded SBICs, which was backed mainly by small retail
investors. In the early 1970s, organized Venture Capital financing through Limited Partnership
started to be recognized as an industry, and in 1973 the influential U.S. National Venture Capital
Association (NVCA) was formed.
The formation of the new type of Private Equity partnerships was nevertheless further inhibited by
several factors that converged to slow investments for nearly a decade. The most significant was
the weak state of the IPO market in the mid-1970s. During 1973-1975, only 83 IPOs raised US$ 5
million or less, while in 1969 alone, 548 IPOs had raised US$ 5 million or less (Ibbotson, Sindelar
et al. 1988). At the same time, the prevailing recession and weak stock markets slowed investment

Literature Review 10
and acquisition activities of corporations. The poor exit opportunities led to a shift of Private
Equity professionals’ focus to their unrealized portfolio companies, leaving fewer resources
working on new investments while firms became reluctant to finance new deals. In addition, capital
gains tax rates had increased sharply in 1969 and the tax treatment of employee stock options was
changed unfavorably, making stock-based compensation less attractive (SBA 1977). Another
perceived problem was the general shortage of qualified and entrepreneurial managers that were
able to successfully restructure and run the acquired businesses. Despite the low level of startup
financing activity during the 1970s, yields were constantly rising, paving the way for the industry’s
explosive growth in the 1980s. However, the adverse conditions of the 1970s had not only
discouraged direct investment in Venture Capital, but also forced fund managers to develop
strategies for non-venture Private Equity capital allocation. Consequently, large proportions of
Private Equity capital were redirected to acquisitions of more established companies – the
Leveraged Buyout was born. In addition, several recommendations lobbied through the Private
Equity asset management industry were implemented during 1978-1980, such as changes in the
employee retirement income security act regulations as well as tax and securities laws, stimulating
the explosive industry growth that was to follow. However, the most significant change was the
U.S. Department of Labor’s decision to change the interpretation of the “prudent man” provision
governing pension fund investing.7 The U.S. Labor Department ruled that investments in Private
Equity/Venture Capital partnerships would be permitted, which led to an influx of capital (Fenn,
Liang et al. 1996).
The boom of Private Equity during the 1980s was supported by further regulatory changes. The
Private Equity industry took advantage of the U.S. Congress decision concerning registration as
investment advisers: registration under the Investment Advisors Act was not necessary when
advisors have fourteen or less clients: hence, many partnerships restricted the number of Limited
Partners to less than fourteen. Soon after, the small Business Investment Incentive Act of 1980
rendered this limitation unnecessary by redefining Private Equity partnership as business
development companies, thus exempting them from the Investment Advisor Act. Moreover, the
capital gains tax was reduced and the passage of the Incentive Stock Option Law in 1981 initiated
the resumption of broader usage of stock options as compensation alternative by deferring the
incurred tax liability to the time when the stocks were sold. These regulatory changes were crucial
to increase the Private Equity industry’s access to capital.
In Europe, however, the development of the Private Equity industry traditionally lagged far behind
the U.S. and only genuinely started making serious progress during the 1990s. Recent structural
and legal changes throughout Europe, especially with respect to pension fund and insurance
company regulations, have allowed for a liberalization of investment choices available to
7 This provision had previously been interpreted as prohibiting pension fund investment in securities issued
by small and new companies and Venture Capital funds. Pension funds managers had regarded Private Equity investments as a potential violation of their fiduciary responsibilities and discouraged investments in Venture Capital funds.

Literature Review 11
institutional investors. The movement of assets from fixed income investments into equities and
other products was accelerated in the late of 1990s by the low inflation environment, with the
creation of the Euro assuring free movement of capital. In addition, new capital gains tax
legislation in European countries has been a recent catalyst for Private Equity investment in
Europe.
2.1.2. Buyout Classification, Organizational Form and Corporate Governance
A Leveraged Buy-Out (LBO) can be defined as a transaction in which a group of private investors,
typically including management, purchases a significant and controlling equity stake in a public or
non-public corporation or a corporate division, using significant debt financing, which it raises by
borrowing against the assets and/or cash flows of the target firm taken private. Since the evolution
of the LBO as a common form of takeover of public or private enterprises in the 1980s, several
specialized companies, hereafter referred to as “LBO firms” (or: leveraged buyout firms/funds,
Private Equity firms/funds, financial sponsors or General Partners (GPs), GP firm, LBO
association), focused on making this type of investment with capital, which they raise in the Private
Equity market. However, the group of private investors can consist of any combination of a
leveraged buyout firm, management or another corporation. Accordingly, leveraged buyouts can be
further classified into Management Buy-outs (MBO), in which the current management seeks
support from outside providers of both debt and equity capital to take control of the equity of the
company from its previous owners, and the Management Buy-In (MBI), in which an external
management team funded by outside investors takes over control of a given target company. In
both cases, the investor typically targets the acquisition of a significant portion or majority control
in the target firm, which entails a change of ownership.
Investment styles of buyout firms can vary widely, ranging from “growth” to “value” and “early”
to “late stage” strategies. Financing expansion through multiple acquisitions is often referred to as a
“buy and build” strategy. Furthermore, buyout funds may take either an active or a passive
management role. As an important characteristic, buyout investors ordinarily tend to invest in more
mature companies with established business plans to finance expansions, consolidations,
turnarounds and sales, or spinouts of divisions or subsidiaries. The ideal LBO candidate is
characterized by strong, non-cyclical and stable cash flows with significant unused borrowing
capacity. The firm’s service or product is preferably well established, with minimal requirements
for capital expenditure, research and development, or an aggressive marketing campaign. Hence,
firms experiencing high growth and/or rapid technological change are not attractive LBO
candidates, because of the operating demands on cash and uncertain revenues. Labor relations of
the ideal LBO candidate are favorable and the regulatory environment is stable to assure consistent
cash flows. Finally, some subset of assets of the ideal LBO candidate could be easily divisible and
is hence highly attractive to outside bidders as an additional potential source of cash (KKR 1989;
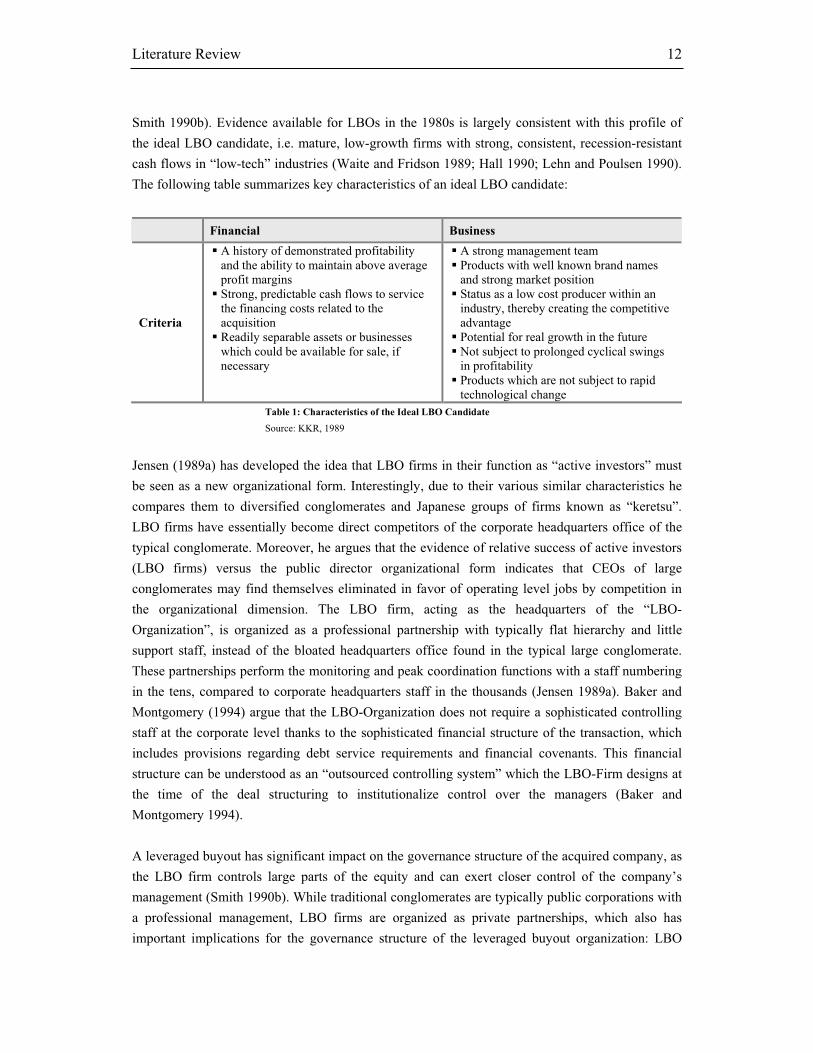
Literature Review 12
Smith 1990b). Evidence available for LBOs in the 1980s is largely consistent with this profile of
the ideal LBO candidate, i.e. mature, low-growth firms with strong, consistent, recession-resistant
cash flows in “low-tech” industries (Waite and Fridson 1989; Hall 1990; Lehn and Poulsen 1990).
The following table summarizes key characteristics of an ideal LBO candidate:
Financial Business
Criteria
A history of demonstrated profitability and the ability to maintain above average profit margins Strong, predictable cash flows to service the financing costs related to the acquisition Readily separable assets or businesses which could be available for sale, if necessary
A strong management team Products with well known brand names and strong market position Status as a low cost producer within an industry, thereby creating the competitive advantage Potential for real growth in the future Not subject to prolonged cyclical swings in profitability Products which are not subject to rapid technological change
Table 1: Characteristics of the Ideal LBO Candidate
Source: KKR, 1989
Jensen (1989a) has developed the idea that LBO firms in their function as “active investors” must
be seen as a new organizational form. Interestingly, due to their various similar characteristics he
compares them to diversified conglomerates and Japanese groups of firms known as “keretsu”.
LBO firms have essentially become direct competitors of the corporate headquarters office of the
typical conglomerate. Moreover, he argues that the evidence of relative success of active investors
(LBO firms) versus the public director organizational form indicates that CEOs of large
conglomerates may find themselves eliminated in favor of operating level jobs by competition in
the organizational dimension. The LBO firm, acting as the headquarters of the “LBO-
Organization”, is organized as a professional partnership with typically flat hierarchy and little
support staff, instead of the bloated headquarters office found in the typical large conglomerate.
These partnerships perform the monitoring and peak coordination functions with a staff numbering
in the tens, compared to corporate headquarters staff in the thousands (Jensen 1989a). Baker and
Montgomery (1994) argue that the LBO-Organization does not require a sophisticated controlling
staff at the corporate level thanks to the sophisticated financial structure of the transaction, which
includes provisions regarding debt service requirements and financial covenants. This financial
structure can be understood as an “outsourced controlling system” which the LBO-Firm designs at
the time of the deal structuring to institutionalize control over the managers (Baker and
Montgomery 1994).
A leveraged buyout has significant impact on the governance structure of the acquired company, as
the LBO firm controls large parts of the equity and can exert closer control of the company’s
management (Smith 1990b). While traditional conglomerates are typically public corporations with
a professional management, LBO firms are organized as private partnerships, which also has
important implications for the governance structure of the leveraged buyout organization: LBO

Literature Review 13
firms act as intermediaries between shareholders (essentially the investors in the LBO fund) and the
professional management teams of the LBO fund’s individual portfolio companies. From a
corporate governance point of view, the professionals of the LBO firm must be seen as a hybrid
between managers (or “agents”) and owners (or “principals”). The incentive structure for the LBO
fund managers is such that there is an almost complete incentive alignment between them and the
owners (Baker and Montgomery 1994)8. With respect to the managers of the LBO fund’s portfolio
companies, the LBO firm partners or associates act as both additional professional managers by
adjusting strategic and operational objectives as well as legal representatives of the shareholders.
They are in effect in a position to closely monitor the management of the portfolio company,
supported by the carefully tailored financial structure for their controlling.
2.1.3. The Buyout Process
The buyout process begins with a “target selection” phase, in which the LBO firm screens the
market for potential investment opportunities meeting the rigid criteria for a successful LBO
candidate as outlined above as well as offering scope for value creation to meet the high levels of
internal rate of return (IRR) LBO fund investors demand9. As the majority of the transactions are
“privately negotiated”, deals generally need to be treated highly confidentially – at least in the
initial phases – in order to avoid the attention of competing buyers. As a consequence, LBO firms
rely on superior contacts and industry knowledge to identify potential investment opportunities
early. LBO fund investors pay close attention to whether fund managers are able to generate
“proprietary deal flow”, as returns on these directly initiated investments generally tend to be
higher. As a result, a range of buyouts today, often in the context of a sale of a business or division
out of a corporate portfolio, are being sold through a competitive auction process involving several
financial and strategic buyers. However, although these auctions have been driving up realized
gains for the seller, they at the same time have been reducing the value capturing potential for the
acquiring (LBO) firm.
It is important to note that unlike strategic acquirers LBO firms typically do not put much emphasis
on aspects like resource relatedness or strategic fit between existing portfolio companies and
potential takeover candidates (Baker and Montgomery 1994). In their acquisition rationale, they
primarily rely on a set of generic criteria regarding industry-level dynamics and financial
benchmarks. While many LBO firms are similar in their basic criteria for takeover candidates
(mature industries, stable cash flows, low operational risk), some of them have successfully
differentiated themselves from industry peers through a specialization strategy. Such
8 The design of the compensation structure for professionals from LBO firms actually guarantees that these
managers are in a risk-return position that is almost identical with that of the owners. 9 In general, between 20-30% IRR represents the expected return from investors, but LBO firms generally
manage expectations and promise much less. On the other side, LBO firms generally target a 25-35% IRR in buyout executions in order to have some cushion for “downside risk” of certain riskier investments.

Literature Review 14
specializations can be observed with respect to company size (e.g. small- or mid-caps), geography,
industry and level of acceptable technological risk. Another LBO firm investment strategy, which
does make synergies an important factor, is a “buy-and-build” buyout acquisition strategy. The
rationale for this risky strategy is that by combining a set of related businesses, the new entity can
not only generate value by exploiting synergies and cutting costs, but it also gains critical mass to
be either attractive for a trade buyer or to be floated through an initial public offering (IPO).
Once a suitable target company has been identified, the LBO firm enters into the potentially
lengthy process of “Due Diligence and Deal Structuring”, during which a detailed business plan for
the proposed investment, generally presented by the target company’s management team, is being
developed and the financial details of the transaction are negotiated with the current owner. As
mentioned above, as more and more LBO-Firms have entered the market, competing for a limited
number of potential takeover targets, the typical acquisition-mode today is often similar to a
(limited) auction, during which several LBO firms submit their bids for a given takeover candidate.
These bids do not only contain the proposed acquisition price, but also a detailed “financial
package”, which outlines level and conditions of the debt financing, details about debt service
requirements and financial covenants as well as provisions regarding management co-ownership
and incentive plans. It has been argued that the upfront agreed financial structure of a buyout
investment determines a considerable part of the potential value creation by the LBO firm (Baker
and Montgomery 1994).
Target
Selection
Due Diligence &
Deal Structuring
Post-
Acquisition
Management
Exit
Buyout Firm and Buyout Manager Characteristics
Figure 3: Overview of the Buyout Process
After the future owner(s) of the target company have been determined, this company becomes one
of the LBO firm’s “portfolio companies”. The ensuing phase is the “Post-acquisition Management
Phase”, in which the LBO firm swiftly exercises its newly gained influence on managerial
decisions of the buyout target. Therefore, this phase represents the key focus of the proposed
dissertation as most of the value creation is expected to be realized during this phase10.
Most commonly, LBO firms play an important role in the post-buyout phase in determining the
financial management of the portfolio company going forward: they introduce cost savings and
active management of both sides of the balance sheet, shift the financial focus from earnings to
10 This assumption is based on efficient market theory. Given the increased competition for suitable buyout
targets and the increase of competitive auctions the “lucky buy/buy-cheap” opportunities should become

Literature Review 15
cash flows and support the portfolio company’s management in their negotiations with its lenders
(Bull 1989; Kaplan 1989b; Smith 1990b). Despite their managerial role and clear guidance, LBO
firms have traditionally sought to limit their influence on the operational management of their
portfolio companies. Consequently, they still widely rely on the portfolio company’s top
management team to implement the jointly defined value creation strategies. Therefore, the LBO
firm puts in control a top management team of its choice at the time of the acquisition, hiring
dedicated professionals if necessary. In case of management failure, it generally acts swiftly to
make the required replacements later on in the process. However, some LBO firms have also
developed a capability of successfully getting involved in the strategic or operational management
of their portfolio companies (Kester and Luehrman 1995). In this case, professionals from the LBO
firm work together with the portfolio company’s management on issues like marketing, production,
or the forging of strategic alliances.
The typical LBO is planned as an investment with a limited time horizon of three to five years. A
study of 200 public-to-private chemical buyouts by Butler (2001) shows that less than one third of
the purchasers exited within five years, with an average exit time of 4.4 years between 1980 and
2000. The “exit” of the LBO firm from its stake in the portfolio company takes place either in the
form of an Initial Public Offering (IPO), a trade sale of the portfolio company to a strategic buyer
or as a “re-leverage” and secondary buyout by another financial investor. In case of an unsuccessful
investment, bankruptcy procedures may take the place of the exit. However, the nature of the
buyout as a privately negotiated transaction allows for significant room for re-negotiation between
lenders and shareholders about debt repayment terms and covenant levels. Bankruptcy can
therefore be avoided in most cases (Jensen 1989a).
2.2. The Buyout Controversy – Alleviating Common Beliefs
One of the main challenges surrounding the leveraged buyout phenomenon in the 1980s was for
research to prove wrong the negative – and in most aspects unjustified – public opinion towards
buyouts. At the same time, it was academia’s goal not only to explain this new phenomenon
“buyouts”, mainly to corporate America, but also to highlight the apparently beneficial stimuli on
corporate governance and performance of buyout target companies. An initial claim was that the
explosive buyout activity was solely attributed to incentives provided by the tax code in the U.S.
(Scholes and Wolfson 1989). The tax deductibility of the large amount of interest payments in a
buyout company effectively reduces the tax liability to zero for several years into the buyout.
However, several authors were able to show that when considering the total net tax effect caused
by the LBO, the tax authorities actually collect up to 60% more taxes than without the event of the
buyout. This is attributed to the fact that (i) there is a substantial amount of additional taxes paid in
less frequent in an efficient market. Value creation can therefore only be realized through clearly defined buyout strategies during the post-acquisition phase.

Literature Review 16
the year of the buyout as a result of capital gains realized by the selling shareholders, (ii) the same
interest payments that give rise to tax deductions by the interest payer are taxable to most
recipients, and (iii) taxes are paid on any gains from asset dispositions following the buyout as well
as (iv) upon the eventual exit from the buyout investment (KKR 1989; Jensen 1989a; Smith 1990b;
Butler 2001).
Another allegation is that buyouts represent a simple wealth transfer from other stakeholders in the
company prior to the buyout. Shleifer and Summers (1988) argue that hostile takeovers and other
control transactions can transfer value to shareholders from employees by breaking implicit
contracts, i.e. by firing workers and/or reducing their wages, with those employers. However,
Kaplan (1989b) showed that the median change in employment after buyouts is only 0.9%, and for
a sub-sample of buyouts that do not make any divestitures, employment actually increases 4.9%.
Similarly, employment growth in the KKR portfolio of companies has increased from 2.3% per
annum prior to the buyout to 4.2% after the buyout (KKR 1989). This evidence shows that investor
wealth gains from LBOs may not be attributed to significant employee layoffs or wage reductions.
Another important stakeholder group in pre-buyout companies, which is subject to potential wealth
transfers post-buyout, are the target’s bondholders. The potential wealth loss experienced by the
original bondholders is argued to be a direct result of the increase in default risk caused by the
incremental LBO debt financing. Marais, Schipper et al. (1989) examined returns to pre-buyout
bondholders and found them to be insignificant. Asquith and Wizman (1990) demonstrate that pre-
buyout shareholders’ gains are not attributable to pre-buyout bondholder’s losses from an
unexpected increase in the financial leverage. Their evidence indicates that wealth losses accrue
only to bonds that do not have protective covenants against unexpected leverage increases. This
fact should presumably be priced into the bonds ex ante so as to compensate investors for the extra
risk implied by lack of protection (Palepu 1990). Bonds that have strong protective covenants
against unexpected leverage increases actually experience a gain at the announcement of the
buyout. In practice, most bondholders have sought protection against an issuer incurring increased
indebtedness, hence forcing LBO firms to obtain bondholders consent or to repurchase their bonds
at a significant premium (KKR 1989).
Critics of management buyouts, a form of leveraged buyout where the current (MBO) rather than
outside (MBI) management team takes control of the company, argue that these transactions allow
managers to exploit their asymmetric, private information on firms’ prospects at the expense of
outside shareholders. This concern has been mitigated by the fact that managers are often required
to share their projections with competing bidders. Secondly, competing bids are evaluated by a
committee of outside directors who do not participate in the buyout. Kaplan (1989b) reports that
the majority of MBOs in his study were completed by non-management bidders (MBIs) in the end.
Finally, LBO firms are frequently accused of achieving the high post-buyout returns through an
underinvestment in the long-term future of the target, necessitated by the immediate demands on

Literature Review 17
cash to service the LBO debt. Allegations are made that cutbacks in expenditures for maintenance
and repairs of existing capacity, replacement and/or expansion of existing facilities, R&D and
advertising expenses will weaken the competitive position of these highly leveraged firms in the
long run. The evidence does not support these allegations. Smith (1990a) finds no evidence of a
decline in expenditures for either advertising or maintenance and repairs as a percentage of sales.
R&D data was not publicly available for most firms analyzed by Kaplan (1989b) and Smith
(1990a), because the level of R&D for LBO samples is frequently below the disclosure threshold of
1% of sales. This is consistent with the characteristically low R&D intensity found in buyout
targets in general (Hall 1990). However, Lichtenberg and Siegel (1990) report that the average
R&D intensity of buyout firms increased at a rate comparable to that of non-buyout firms. Finally,
although a significant reduction in absolute capital expenditures levels in the post-buyout period is
documented in Kaplan (1989b) and Smith (1990b), the low growth in sales and low R&D
expenditures prior to LBOs in general (Hall 1990; Lehn and Poulsen 1990) may also imply a lack
of attractive investment opportunities (Smith 1990a; Smith 1990b). This suggests that investment
decisions in buyout companies are likely to be much more scrutinized for their value creation
potential.
2.3. Agency Theory of Leveraged Buyouts
Agency theory argues that there is an inherent conflict within the corporation, arising from
diverging goals of the company’s owners and their professional managers (Berle and Means 1932;
Jensen and Meckling 1976; Fama 1980; Fama and Jensen 1983a; Fama and Jensen 1983b; Jensen
1986). The theory of agency relationships is therefore concerned with the contractual problems that
occur, when “one or more persons (principal(s)) engage another person (the agent) to perform some
service on their behalf, which involves delegating some decision-making authority to the agent”
(Jensen and Meckling 1976). From the assumption that both parties are maximizing their individual
utility, agency theory concludes that the agent does not always act in the best interest of the
principal. A number of governance mechanisms can limit the agency conflict. These mechanisms
include improved monitoring and reduction of the agent’s discretionary decision space (board of
directors), the market for corporate control, managerial equity ownership and other incentive
alignment devices (Fama 1980; Demsetz 1983; Jensen 1988). However, each of these possibilities
is costly to the principal. The sum of these cost and the residual loss from divergent behavior has
been termed “agency costs” (Jensen and Meckling 1976). These agency costs are not exogenous to
the firm, but depend to a large extent on factors, such as governance structure, top management
incentives, etc. (Smith 1990a). In the event of a buyout, several of the determinants of agency cost
change considerably (Jensen 1986). Consequently, buyouts are expected to have a significant
impact on the firm’s agency costs (Kaplan 1989b).
The first important change in agency cost caused by the buyout stems from the significant use of
debt financing in a typical LBO deal. In general, agency cost of free cash flow arise when cash

Literature Review 18
flow exists in excess of what is required to fund all of a firm’s projects that have positive net
present values, when discounted at the relevant cost of capital.11 Such free cash flows must be paid
out to shareholders if the firm is to be efficient and to maximize shareholder value, but managers
have few incentives to do so and prefer to retain control (Jensen 1986; Jensen 1989b).12 The much
higher leverage after a buyout increases the requirements of debt and interest service payments,
thereby significantly reducing the amount of free cash flow that is at the buyout company
managers’ discretion (Kaplan 1989b; Smith 1990b). Thus, high leverage means less managerial
discretion and therefore reduces the “agency cost of free cash flow” (Jensen 1986). Consequently,
increased financial leverage in buyouts is assumed to lead to value creation.
However, increasing leverage of a company to achieve higher performance cannot be a linear
relationship, since increased leverage also increases the cost of financial distress. The potential risk
of financial distress associated with the LBO debt burden may even call into question the ability for
the buyout target to survive (Smith 1990b). However, (Jensen 1989a) put forward the “privatization
of bankruptcy” theory, which suggests that the costs to a firm in insolvency – the situation in which
a firm cannot meet its contractual obligations to make payments – are likely to be much smaller in
the new world of high leverage ratios than prior to the buyout. The reason is that there are higher
incentives to preserve value in the leveraged buyout model as a result of a very different set of
institutional arrangements and practices that substitute the usual bankruptcy process in courts. The
low frequency of buyouts that enter bankruptcy provide support for the fact that parties accomplish
reorganization of claims more efficiently outside the courtroom (Jensen 1989a).
The second important determinant of agency cost, which is affected by an LBO, is the oversight
and control that the owners have over the management of the company. Professionals from the
investing LBO firm are in the position to closely monitor the portfolio company management and
to exert direct control over them (Smith 1990b). As representatives of the majority shareholders,
they have the legal power to influence managerial decisions both directly and through their right to
determine the composition of the top management team. This monitoring and control function of
the LBO firm has been seen as one of the principal capabilities of the LBO organization (Baker and
Montgomery 1994). One aspect of control over the portfolio company, which is of particular
11 Lehn and Poulsen (1989) argued that unsuccessful diversification is a result of free cash flows. Because of
low growth prospects firms have few opportunities to reinvest the cash flow profitably in the firms’ current lines of business. If the firm’s management is specialized in its current lines of business, it may be unprofitable to invest cash flow into diversification.
12 There are various reasons for managers’ reluctance to pay out excess corporate incomes. Mueller (1969) argued that one of managers’ goals is the “growth in physical size of their corporation rather than its profits of shareholder welfare”. This “intent upon maximizing growth will tend to ignore, or at least heavily discount, investment opportunities outside the firm, since these will not contribute to the internal expansion of the firm”. Jensen (1986) explained that managers resist distributing surplus cash resources to keep their opportunity for increased discretionary spending and to be able to invest them into growth-maximizing or empire-building projects that yield low or negative returns and involves excess staff and indulgent perquisites. Managers do this because such investments maximize their own utility (e.g. Jensen and Meckling 1976). Additionally, keeping cash reserves increase the size of the company and management’s autonomy vis-à-vis the capital markets (Jensen 1989b).

Literature Review 19
interest, is the owner’s right to determine the composition of the top management team. The
question of the performance impact of replacements of the top management team has received
much attention both in the theoretical and the empirical literature. One side of this literature
supports the hypothesis of the “market for corporate control” (Manne 1965; Jensen and Ruback
1983), according to which different management teams compete for the control over companies.
Based on agency theoretical considerations, this view sees corporate takeovers primarily as a mean
to exchange inefficient management teams and to improve the company’s performance by putting
in control a more efficient management team. If this view were true, we could potentially also
expect to see a positive performance impact of replacements in the top management team through
the composition of an efficient top management team for the buyout company.
As a third and most important factor to reduce agency costs and to generate value, buyout
transactions are characterized by their considerable use of top management incentives and
management co-ownership in order to align interest between LBO firm (and their investors) and
management. Equity holdings of top managers increase the cost of shirking and consuming
perquisites (Smith 1990a) to them and increase the degree of common interests between owners
and managers. In general, the target company’s top management team had no or only a suboptimal
incentive system prior to the LBO with the incentives either not being very effective (suboptimal
level of co-ownership or stock options etc.), or they were based on performance measures that do
not perfectly reflect the owner’s interest (e.g. rewards based on short-term earnings/stock
performance rather than long-term cash flow or earnings potential and value creation). Leveraged
buyouts specifically, with their limited life and foreseeable liquidation of the investment, create a
situation in which equity holdings of top managers are better suited to align interests between
managers and shareholders and thus to enforce shareholder-wealth-maximizing behavior than
otherwise possible (Baker and Montgomery 1994).
2.4. Strategic Management View of Leveraged Buyouts
Strategic Management researchers have focused their attention in the acquisition literature on the
way resources and knowledge is transferred between acquirer and target. The resource-based view
of the firm (Penrose 1959; Rumelt 1984; Wernerfelt 1984; Barney 1986; Dierickx and Cool 1989)
sees the ability to share and redeploy resources within and across organizations as the dominant
source of sustainable competitive advantage. Consequently, a resource-based look at acquisitions
focuses on the potential to create value through a combination of resources between acquirer and
target. As a result of their organizational configuration, LBO firms when compared to strategic
buyers are purely financial, non-strategic acquirers, which make no attempt to foster synergies
among their portfolio companies (Baker and Montgomery 1994).13 Therefore, buyout transactions
13 Exception to this argument would be the frequently observed buy-and-build strategy, in which the LBO
firm acquires a platform company and adds further related businesses to “build” a larger industry player.

Literature Review 20
do not fall in the same domain of expected synergistic value creation, which the resource-based
view sees as the driving force behind related acquisitions. What remains from a resource-based
perspective, is the analysis of the resource bundle that the portfolio company represents as a
standalone business as well as the potential redeployment of resources between the portfolio
company and the LBO firm as its “new corporate headquarters” (Gottschalg 2002).
The buyout gives the LBO firm direct access to the resources of its portfolio company. As it
chooses not to share any of these resources with other portfolio companies, a large portion of the
value creation of the LBO has to come from an increase in profitability of the portfolio company’s
resource bundle as a standalone business. Therefore, it is crucial to the success of the LBO to
enhance the utilization of these resources. The LBO firm has a range of options to increase the
resource efficiency of its portfolio company (e.g. cost cutting, capacity optimization, introduction
of new incentive systems, stretched budgets, pressure from financial leverage, etc.). However, one
potentially detrimental factor to resource efficiency under the resource-based view of the firm is the
disruptive effect of changes in the resource base of the portfolio company. Therefore, a negative
impact of changes in the portfolio company’s resource bundle on the performance of the LBO
would be expected. In general, the analysis on resource turnover focuses on replacements in the top
management team of the portfolio company. The expertise and social capital of the members of the
top management team constitutes the most valuable resource to the company (Barney 1986). At the
same time, this variable might be considered a good proxy for a more general construct of overall
replacements of resources (Zollo and Singh 2000). Consequently, the analysis of buyouts under the
resource-based view would expect a negative performance impact of replacements in the top
management team. This view receives support from studies relating managerial turnover to
performance in a general acquisition context, which found that managerial turnover reduces
acquisition performance (Cannella and Hambrick 1993; Krishnan, Miller et al. 1997; Zollo and
Singh 2000). However, this proposition is in sharp disagreement with the agency theoretical
reasoning of the proponents of the “market for corporate control” hypothesis (Manne 1965; Jensen
and Ruback 1983), as outlined above. A better understanding of the dynamics of management
teams, their interaction with LBO firm professionals and their contribution to post-buyout
performance may therefore be an important aspect in assessing value creation in buyouts.
As a consequence, in the absence of any horizontal synergies through resource sharing among the
portfolio companies of an LBO firm, the only possible way to generate rents through resource
redeployment is a vertical exchange between the LBO firm and each individual portfolio company.
The principal resource of the LBO firm as “corporate headquarters” of the LBO organization is its
human capital, more specifically the knowledge and expertise of its professionals. Private Equity
firms have not only established substantial competences in financial engineering, but they can also
rely on dedicated industry experts developed internally or recruited externally to give advice on

Literature Review 21
particular transactions. 14 The sharing of these resources with a portfolio company implies a
knowledge transfer from the LBO firm to its portfolio company. While such a knowledge transfer
is difficult to observe empirically, it can potentially be operationalized by looking at both the scope
of strategic redirection and amount of operational interventions by the LBO firm (Gottschalg
2002). If value is created by the LBO firms’ interventions and knowledge transfer, a positive
performance impact should be observed subsequent to a leveraged buyout.
According to this literature review of LBOs from the viewpoint of two complementary perspectives
of management theory, several mechanisms have been identified through which buyouts – in their
general characteristic as unrelated acquisitions – could be a source of substantial value creation.
Implicitly, these unique approaches to acquiring companies may also contribute to explaining how
LBO firms are able to generate substantially higher (abnormal) returns from their buyouts than
those achieved by buyers in strategic, “related” acquisitions.
2.5. Value Creation in Leveraged Buyouts
Value Creation in buyouts results from various sources and therefore has to be analyzed on various
layers. Firstly, there is a range of drivers that have a direct effect on the operating efficiency or
relate to the optimal utilization of assets of the company. These drivers are referred to as direct,
intrinsic, operational or “value creating” drivers and have in common that they improve free cash
flows of the buyout company. Secondly, there are several drivers, which are non-operational in
nature, but do lead to an expansion of value created between acquisition and realization of the
investment. These drivers, referred to as indirect, extrinsic, non-operational or “value capturing”
drivers, are generally not straightforwardly quantifiable, but do play an important role in the overall
value creation process and may be interdependent with the direct value drivers. Research shows
that the majority of value creation (about two thirds) is being realized during the holding period of
the buyout company (direct value driver effect) and the remainder (about one third) is realized by
the actual transaction and its circumstances/configuration (indirect driver effect) (Anslinger and
Copeland 1996; Butler 2001). The following section outlines both categories of drivers in detail.15
14 Private Equity firm Carlyle, well known for its acquisitions in the aerospace, military and defense industry,
counts former U.S. president George W. Bush Sr. and former British Prime Minister John Majors to its advisors. Private Equity firm Clayton, Dubelier & Rice is being advised by former CEO and Chairman of General Electric, Jack Welch, on its industrial-related transactions.
15 This section is built upon and benefits from research developed by Berg and Gottschalg (2003) on drivers of value creation and their categorization. The author would like to acknowledge their ground work and intellectual ownership of the adopted categorization.
Literature Review 22
2.5.1. Direct Drivers of Value Creation
Direct drivers are characterized to generally also have a concrete and direct effect on the free cash
flow generation of the company, either through increasing revenues, cutting expenses or more
efficient use of capital or through sophisticated financial engineering. Direct drivers therefore
enhance the financial performance and causes real value creation at the acquired buyout company
(Kitching 1989).16
2.5.1.1. Achieving Cost Reductions in Buyouts
Jensen (1989a) suggests that the primary source of value creation from buyouts is organizational
changes that lead to improvements in firms’ operating and investment decisions. According to this
view, when companies undergo a buyout, increased management ownership and high financial
leverage associated with the buyout provide strong incentives for managers to generate higher cash
flows through better operating performance (Palepu 1990). Consequently, operating performance
and investment decisions are likely to be superior following the buyout. Leveraged buyouts are also
likely to occur in companies that show significant potential to generate higher cash flows and have
low alternative investment opportunities (Baker and Wruck 1989; Kaplan 1989b; Lichtenberg and
Siegel 1990; Smith 1990b). A substantial literature has developed that shows that buyout
transactions have a positive effect on the operational performance of target companies (Baker and
Wruck 1989; Bull 1989; Jensen 1989a; Kaplan 1989b; Lichtenberg and Siegel 1990; Muscarella
and Vetsuypens 1990; Singh 1990; Smith 1990a; Long and Ravenscraft 1993c; Ofek 1994; Smart
and Waldfogel 1994; Phan and Hill 1995; Holthausen and Larcker 1996; Weir and Laing 1998).
Kaplan (1989b) provides early evidence of management buyouts’ strong improvements in
operating performance, even after adjustments for industry-wide changes. Smith (1990b) proves
that the improvements in operating cash flows are correlated with the buyout-induced changes in
debt ratio and ownership structure, consistent with Jensen’s (1989a) view that organizational
changes play an important role in the efficiency gains. With respect to production efficiency,
(Lichtenberg and Siegel 1990) analysed post-buyout operating enhancements in total factor
productivity in plants of LBO companies, finding significant short-term improvements compared to
non-LBO plants. These operating performance improvements often coincide with substantial
changes in the way the operations are organized and managed (Muscarella and Vetsuypens 1990;
Wright 2001). One view is that the performance improvements are specifically induced by the
buyout. A contrasting view suggests that the performance improvements would have occurred with
or without a buyout, and that the buyout premiums are merely a result of undervaluation of LBO
target firms, induced by different information asymetry about the future performance of the firm
(Baker and Wruck 1989). This view is specifically shared in relation to management buyouts.17
16 For a theoretical deduction of the impact of improved financial performance on the investment’s internal
rate of return (IRR), which represents the study’s preferred measure of value creation, refer to section 3.5. 17 Critics of management buyouts argue that MBOs allow managers to exploit their private information on
firms’ prospects at the expanse of outside shareholders. This has been widely mitigated by research findings (Kaplan 1989a, 1989b).

Literature Review 23
One major area of cost reductions relates to cuts in overhead costs. Singh (1990) argues that buyout
targets had accumulated higher levels of slack than non-buyout firms (slack as defined by Cyert
and March 1963). LBO organizations are characterized by significantly leaner corporate functions
than for instance conglomerates. This disparity is implicitly reflected through the frequent
aggressive cutbacks by LBO firms of bloated corporate centers at their portfolio companies. LBO
firms increase overhead efficiency by improving the control system, building better mechanisms
for coordination and communication flow and by enhancing the speed of decision making. The new
processes installed at buyout companies are characterized by markedly less bureaucracy
(Easterwood, Seth et al. 1989; Samdani, Butler et al. 2001). While admitting the importance of cost
reduction measures, Esterwood, Seth et al. (1989) point out that any organizational changes must
be such that they do not negatively affect the company’s ability to compete in the market place.
2.5.1.2. Improving Asset Utilization in Buyouts
Another important way to increase cash flow generation is to make more efficient use from
corporate assets (Bull 1989). Following the buyout, management swiftly starts to tighten the
control on corporate spending (Anders 1992; Holthausen and Larcker 1996). Kaplan (1989b) and
Smith (1990b) report significant increases in operating cash flows. Capital productivity is improved
through adjustments in the management of working capital, i.e. via an acceleration of the collection
of receivables, a reduction in the inventory holding period and in some instances through an
extension of the payment period to suppliers (Baker and Wruck 1989; Muscarella and Vetsuypens
1990; Singh 1990; Smith 1990b; Long and Ravenscraft 1993a; Kester and Luehrman 1995;
Samdani, Butler et al. 2001). Esterwood, Seth et al. (1989) showed that better working capital
management leads to sharply reduced levels of inventory and receivables compared to pre-buyout
levels on a company level, while Holthausen and Larcker (1996) found that post-buyout firms
have, on average, also significantly smaller amounts of working capital than their industry peers.
However, Wright and Robbie (1996) point out that the generally increased focus on efficiency and
tighter cost control developed in many corporations during the 1990s has led to lower overall
attractiveness to initiate buyouts that are driven by cost cutting plans. Consequently, this trend
could affect and limit the overall scope for value creation from restructuring (Wright and Robbie
1996).
In addition to cost cutting efforts and better working capital management, cash flows are further
enhanced through reduced capital expenditures, since the redeployment of resources and assets
plays an important role in increasing the overall operational efficiency. KKR (1989) argues that the
long-run objective of a leveraged buyout should be to create value for the new owners by
increasing profitability, while failure to make capital expenditures without good economic cause is
short-sighted and counter-productive. However, capital spending is reported to be considerably
lower following the buyout (Kaplan 1989b; Smith 1990a), while KKR (1989) proofs this only
holds for the first year post-buyout (among their portfolio companies). According to the free cash
flow theory, the incentive realignment will lead managers to divest low-synergy assets and to cease

Literature Review 24
spending cash on poor investment decisions (Grossman and Hart 1982; Jensen 1986; Jensen
1989a). Hence, buyout management slashes unsound investment programs and disposes of assets
that are unnecessary or underutilized (Phan and Hill 1995).
2.5.1.3. Generating Growth in Buyouts
LBO firms not only rely on operational improvements to increase value in buyout investments, but
also aggressively seek to boost revenues. Wright (2001) argues that buyouts can no longer be
viewed solely as a mean to address corporate inefficiencies. From a capital markets perspective, a
strong track record of growth – achieved internally or externally – has important implications to
valuation by future investors at the time of the exit from the buyout, i.e. through an initial public
offering (IPO) or trade sale (Butler 2001). A study from Singh (1990) confirms that buyouts
coming back to the capital market had experienced significantly higher revenue growth.
In addition to the higher pressure to generate cash flows to service debt (Jensen 1989a), LBO firms
are known for their tendency to produce ambitious business plans, hence raising the standards for
management performance (Baker and Montgomery 1994; Butler 2001). Through the aggressive
targets and increased risk of financial distress, LBO firms are forcing portfolio company managers
to much more adhere to these grand performance goals and make budgets pay off, thereby widely
eliminating some of the perceived managerial inefficiencies (Easterwood, Seth et al. 1989; Smith
1990b; Anders 1992). The performance pressure increases the minimum level of acceptable
performance and managers are forced to work harder after the buyout or risk losing their jobs
(Baker and Wruck 1989). Buyout associations spend a serious amount of time on selecting the top
management team and they generally do not hesitate to replace it if corporate performance should
falter (Anders 1992). As a consequence, the new ownership structure of the organization and the
change in governance and incentives generally increases managers’ willingness to make rather
drastic changes in operations and to take rather unpopular actions if required (Singh 1990).
In order to achieve superior performance and value creation, constant improvements in operational
effectiveness to achieve superior profitability is necessary, but usually not sufficient (Porter 1996).
The LBO firm plays an important role in re-establishing or reinforcing the strategic focus of the
buyout target. It often follows an outpacing strategy of combining operational improvements and
product cost awareness with higher product value and innovation (Gilbert and Strebel 1987),
instead of a pure cost or product differentiation strategy (Porter 1985). LBO firms work with
buyout managers to make decisions that increase the strategic distinctiveness and eventually
improves the competitive positioning of the company. They emphasize on restoring strategic focus
and an overall reduction of complexity (Seth and Easterwood 1993; Phan and Hill 1995). Decisions
are made on which markets to be in and with which products to compete, conducting changes in
pricing, product quality, customer service and customer mix as well as on the reorganization of
distribution channels if required (Muscarella and Vetsuypens 1990). As a consequence, the total
level and scope of diversification of activities gets reduced and inefficient cross-subsidies between

Literature Review 25
different product lines get cut (Liebeskind and Wiersema 1992; Wiersema and Liebeskind 1995).
Inefficient or non-core operations are being sold to a third party (Hoskisson and Turk 1990;
Muscarella and Vetsuypens 1990; Singh 1990; Anders 1992; Baker 1992; Seth and Easterwood
1993; Singh 1993).
Alternatively, LBO firms may decide to undertake add-on acquisitions of either new lines of
business or to expand business scope in such areas in which distinctive competences and resources
are strong compared to competition (Easterwood, Seth et al. 1989; Liebeskind and Wiersema 1992;
Seth and Easterwood 1993). Some buyout transactions are intended from the beginning to
accomplish a “buy-and-build” strategy, in which LBO firms undertake an initial buyout investment
in a fragmented and/or sub-scale market to build a nucleus (Samdani, Butler et al. 2001). The
acquired portfolio company is usually provided with pre-determined financing for acquisition
purposes from its lenders. Alternatively, the LBO firm buys companies in separate transactions and
merges these subsequently. Several LBO firms have focused on buy-and-build strategies, thereby
leveraging their industry know-how in successive acquisitions, which may lead to a consolidation
in that market segment (Seth and Easterwood 1993; Baker and Montgomery 1994; Allen 1996;
Wright 2001). 18 The rationale for buy-and-build strategies involves the fact that through the
consolidation, synergies can be realised and companies may achieve critical mass to be floated on
the stock market, a goal that would have not been reached on a standalone basis.
Another important driver to increase revenue growth is related to the revived spirit of
entrepreneuralism and new product innovations in buyout companies. In both divisional and
corporate buyouts the transformation of the organizations’ corporate governance has some
elements resembling a start-up firm, wherein operating mangement typically enjoys high levels of
equity.19 Supporters of the buyout activity contend that the radical change in capital and ownership
structure of the firm is accompanied by radical (and positive) changes in the firm’s post-buyout
operations, thus interpreting the activity as an indicator of entrepreneurship (Singh 1990). LBO
firms drastically change the way business is conducted if a strategic innovation offers a high
likelihood of success (Markides 1997; Markides 1998; Wright 2001). Malone (1989) in a U.S.
study and Wright and Coyne (1985) and Wright, Thompson et al. (1992a) for the UK show
significant increases in new product development occuring post-buyout, which according to the
view of the entrepreneurs concernend would not have been realised otherwise (Bull 1989). A more
detailed study by Zahra and Fescina (1991) shows substantial increases in product development,
technological alliances, R&D staff and capabilities and new business creation activities. These
corporate entrepreneurship factors are also significantly and positively associated with changes in
company perfromance (Wright, Wilson et al. 1996).
18 Private Equity firm Carlyle Group, one of the world’s largest, has build significant expertise in the
aerospace and defense industries, leveraging the experience of its chairman emeritus Frank Carlucci, a former U.S. Secretary of Defense. Firms in this arena make up a significant share of the portfolio at Carlyle.
19 Buyouts, however, differ markedly compared to start-ups in terms of the high level of debt carried by the now-private firm, which is atypical in a start-up situation.

Literature Review 26
2.5.1.4. Financial Engineering in Buyouts
Leveraged buyouts have often been described to be simply “a financing technique for acquiring a
company rather than a new type of organizational form” (KKR 1989). The whole concept of the
leveraged buyout technique, in which the acquirer borrows a large percentage of the purchase price,
typically from a variety of sources such as commercial banks, insurance companies, other
sophisticated financial institutions and/or public purchaser of debt, highlights the significance of
financial engineering. LBO firms apply their intimate knowledge of capital market mechanisms
during the acquisition process and then share their financial expertise with the buyout target
company thereafter (Anders 1992). In the deal structuring process, LBO firms leverage their
excellent contacts to the above mentioned investors in the financial community to negotiate best
available terms for the financing. LBO firms generally create competition among financing banks
and/or investors to ensure to be given the best possible terms. They are also likely to be repeat
players in the leveraged finance debt markets, and with their reputations as high profile clients and
profitable borrowers at stake, lenders are likely to deal with them at easier terms (Cotter and Peck
2001).
After the buyout, LBO firms continue to lead negotiations for the portfolio company, assisting
management in negotiating bank loans, bond underwritings, initial public offerings and subsequent
stock sales at terms that the portfolio company would not have been able to receive on a standalone
basis (Anders 1992; Cotter and Peck 2001). The application of the LBO firm’s financial
engineering skills assists the portfolio company to manage its balance sheet through an optimal use
of capital markets (Anders 1992). LBO firms are also likely to reduce agency costs of debt and
costs of financial distress (Jensen 1989a; Palepu 1990). On the one hand, they have a comparative
advantage over other equity investors in monitoring management, thus lowering the benefits from
using tighter debt terms to motivate managers (Cotter and Peck 2001). On the other hand, LBO
firms can also avoid much of the costs of financial distress20, and consequently, have reduced
incentives to transfer wealth from lenders (DeAngelo, DeAngelo et al. 1984; Opler and Titman
1993). With respect to the weighted average cost of capital (WACC), Long and Ravenscraft
(1993a) and Samdani, Butler et al. (2001) argue that it is more or less independent of leverage,
since the tax advantage of a high level of debt is almost entirely offset by the higher cost of that
debt. Or as Rappaport (1990) puts it: “borrowing per se creates no value other than tax benefits.
Value comes from the operational efficiencies debt inspires”.
20 Features that lead to lower costs of financial distress include (i) an institutionalized debt workout process
(or the privatization of bankruptcy) that may lower bankruptcy costs, (ii) strip financing where debt and equity are owned by the same investor, which decreases conflict between different classes of securityholders, and (iii) LBO sponsorship by specialist firms with reputational incentives to look out for debtholders, lenders and other investors’ interests (DeAngelo and DeAngelo 1987, Jensen 1989b, Opler 1993, Wruck 1990).

Literature Review 27
2.5.2. Indirect Drivers of Value Creation
In addition to value creation from financial engineering, operational improvements and through
strategic repositioning which lead to stronger growth, there are important non-operational drivers in
a buyout transaction, which play a role in value creation. These indirect drivers do not directly
affect performance, but rather amplify the positive performance effects attributed to the direct
drivers. Indirect drivers are related to the changes in the organizational, corporate governance and
ownership structure. Research has shown that agency conflicts are highly relevant in the buyout
context (Opler and Titman 1993), and buyouts are widely described as creating value through a
reduction of agency costs (Jensen 1989a). The implicit changes in organizational structure and
ownership in a buyout transaction allow to take advantage of these agency costs reduction
mechanisms and subsequently lead to improved operating performance (Smith 1990a). These
mechanisms are described in more detail in this section.
2.5.2.1. Management and Employee Incentivation in Buyouts
According to Cotter and Peck (2001), buyout transactions “provide a ‘carrot’ and a ‘stick’
mechanism to ameliorate agency costs”. Buyout associations conduct changes in the ownership and
governance structure to provide incentives (the “carrot”) in order to align the interests of all parties
involved and to reduce agency costs after the buyout (Bull 1989; Jensen 1989b; Lichtenberg and
Siegel 1990). Managers are encouraged (if not forced) to increase their share in equity ownership in
the company to a significant level (Muscarella and Vetsuypens 1990).21 It is expected that this
increase in the equity stake of the management directly increases the personal costs of inefficiency
(Smith 1990b) and reduces their incentive to shirk (Jensen and Meckling 1976; DeAngelo,
DeAngelo et al. 1984; Smith 1990a; Weir and Laing 1998). Furthermore, the change in status, from
manager to co-owner could increase financial performance because it gives managers a positive
incentive to look for efficiency gains and smart strategic moves (Phan and Hill 1995; Weir and
Laing 1998). Their equity participation gives them a greater stake in any value-increasing actions
that are taken (e.g. Jensen and Meckling 1976) and thus leads to better operating and investment
decisions (Easterwood, Seth et al. 1989; Palepu 1990).22 Taylor (1992) is convinced that “managers
do not fail to do the right thing because they are unaware of what the right thing is. All too often,
they fail to do the right thing because it is not in their economic interest or because there are no
penalties for doing the wrong thing.” Another motivational side effect of the construction is that
21 Managers get usually offered a substantial stake in the equity of the company at favourable conditions
(“sweet equity”). As a consequence, due to the high amount of the total investment compared to their personal net worth, managers usually have to take big financial risks to participate in the buyout (“pain equity”) (Kitching 1989; Wright et al. 1992a; Beaver 2001; Samdani et al. 2001).
22 The equity owned by management in the LBO companies is generally illiquid. However, because of the requirement that the LBO association must liquidate the Limited Partnership within a fairly short time period (10 years or less), there is a quasi-guarantee that the company will be valued in a third-party transaction, at some point in the near future. This guarantee of future liquidity, and of an objective and unbiased valuation event, is crucial to the incentives provided by management equity ownership (Baker and Montgomery 1994).
Literature Review 28
management finds itself with a substantial un-diversifiable equity investment and their specific
human capital locked into the company. This double lock-in should give them a strong motivation
to safeguard their position (Wright, Thompson et al. 1992a).
On the contrary, increased managerial ownership in equity can result in a decrease in financial
performance due to managerial risk aversion and the potential under-diversification of the
managers’ wealth (Fama and Jensen 1985; Morck and Shleifer 1988; Holthausen and Larcker
1996). Furthermore, Demsetz (1983) and Fama and Jensen (1983a) argue that if managerial equity
ownership is concentrated, the manager may have effective control over the organization and
disciplining mechanisms such as the market for corporate control and managerial labour markets
may be rendered ineffective, which could result in a decline in performance as well (Holthausen
and Larcker 1996).
In addition to an increased equity ownership of the top management, buyout associations increase
the sensitivity of pay-to-performance for a large number of employees in the company (Jensen
1989a; Jensen 1989b; Anders 1992; Fox and Marcus 1992). General Partners at the LBO firm in
general have an effective ownership interest in the gains realized by the buyout pool of up to 20%,
with management also sharing significant gains (Jensen 1989a). New incentive systems are being
implemented and employee contracts are being adapted in order to step up motivation to achieve
the key goals of the organization, including changes in the way employees get evaluated and
compensated (Baker and Wruck 1989; Easterwood, Seth et al. 1989; Muscarella and Vetsuypens
1990). These employee incentive schemes are not necessarily only restricted to upper and middle
management. LBO firms may introduce employee share ownership plans (ESOPs) or other
shareholdings schemes and participation programmes post-buyout (Wright, Thompson et al.
1992a). The compensation and ownership plans make the rewards to managers and employees
highly sensitive to the performance of their particular business unit (Baker and Wruck 1989).23 The
use of incentives is consistent with the view that they benefit the owners and reduce managerial
opportunism (Demsetz 1983). Support for the view that incentives help to reduce managerial
opportunism comes from Wright and Robbie (1996), who empirically demonstrated that incentives
were negatively related to MBO failure.
2.5.2.2. Change in Corporate Governance in Buyouts
The increase in incentives usually goes along with a radical transformation and improvement of
corporate governance structures in buyout companies to increase the quality of monitoring (Singh
1990; Thompson and Wright 1991). The greater concentration of equity in the hands of active
investors encourages closer monitoring and leads to a more active representation in the board of
directors (Lowenstein 1985; Jensen 1989a; Jensen 1989b; Smith 1990a). Jensen (1989a) describes
23 For an early review of employee ownership studies, see Wilson (1992). Conte and Svejnar (1987) and
Jones and Kato (1995) find significant and positive effects on a value added measure of productivity from wider share ownership, no matter whether in cooperative or ESOP form.

Literature Review 29
an “active investor” as a person or party who “monitors management, sits on boards, is sometimes
involved in dismissing management, is often intimately involved in the strategic direction of the
company and on occasion even manages”. The monitoring of management and the increased
involvement by members of the board offers the opportunity to obtain direct access to confidential
company information. Furthermore, portfolio companies’ management is generally being evaluated
on a regular basis (Palepu 1990; Anders 1992; Cotter and Peck 2001). Buyout specialists as
professional active investors are likely to have a comparative advantage over third party equity
investors in monitoring managers of post-buyout organization (DeAngelo, DeAngelo et al. 1984;
KKR 1989; Jensen 1989a; Cotter and Peck 2001). However, the new corporate governance
structure also raises the importance of another stakeholder, the buyout company’s financial lenders,
which have generally received a pledge on the shares and assets of the company in exchange for
financing. The financial lenders have strong incentives to monitor the managements’ actions
closely and to make sure that the buyout company is able to meet budgets. 24 The financial
covenants and debt repayment requirements accompanying the financing serve as clear benchmarks
for the operating flexibility of the buyout company and constrain management action (Baker and
Wruck 1989; Lichtenberg and Siegel 1990; Baker and Montgomery 1994).
2.5.2.3. Leverage as Value Creator in Buyouts
Besides value creation through incentivation, the use of significant amounts of debt in a buyout
transaction contributes to value creation itself as it not only represents an important factor in the
financing structure of the transaction, but also limits managerial discretion. Grossman and Hart
(1982) and Jensen (1986, 1989a) argue that debt can induce management to act in the interest of
investors in ways that cannot be duplicated with optimally designed compensation packages (Opler
and Titman 1993). In relation to the agency cost theory, Jensen (1986, 1989a, 1989b) emphasizes
that the use of debt in buyouts facilitates a reduction of available free cash flow and compels
managers to service debt payments rather than spend it inefficiently. It reduces managers’
discretion over corporate expenditures25 (Grossman and Hart 1982; Stulz 1990; Smith 1990a) and
limits possible non-value maximizing behaviour (Newbould and Chaffield 1992). Therefore, the
debt burden forces managers to efficiently run the company to avoid default (Lowenstein 1985;
Jensen 1986; Thompson and Wright 1991; Cotter and Peck 2001).
The use of debt financing is in some instances encouraged through the asymmetric information
inherent in buyouts (Opler and Titman 1993). Signalling arguments made by Ross (1977) and
Brealey, Leland et al. (1977) suggest that in the presence of substantial asymmetric information,
managers with favourable information are likely to hold a large share of the firms stock and obtain
outside financing disproportionably with debt. Grossman and Hart (1982) mention another benefit
24Wright, Thompson et al. (1992) argue that institutions supplying debt and loan finance have a comparative
advantage in monitoring a company because of their long experience in that matter. 25 A number of empirical studies have shown that expenditures decline following a leveraged buyout (Bull
1989; Kaplan 1989b; Kitching 1989; Muscarella and Vetsuypens 1990; Smith 1990a).

Literature Review 30
of debt financing to influence managerial behaviour, which relates to bankruptcy costs for
managers. The high personal investment in the buyout company through equity stakes, but also
non-financial aspects such as loss of power, control and reputation can create an important
incentive driver for managers to work harder, dispose of prior privileges and making better
operating and investment decisions. By this means, the risk of default is reduced considerably.
However, one of the main criticisms of the disproportionate debt financing in leveraged buyouts
has been their increased exposure to external shocks and financial distress. These shocks caused
e.g. through sudden economic weakness with shortfall in demand or an increase in interest rates,
can lead to bankruptcy (Rappaport 1990; Singh 1990; Singh 1993). Furthermore, the increased
financial leverage can make a firm short-term oriented because of its vulnerability to financial
distress, leading to a decline in long-term competitiveness (Palepu 1990; Gifford 2001). Rappaport
(1990) even suggests that modern competition would “require the financial flexibility of a public
company not burdened with extraordinary debt”. Moreover, significant financial leverage could
lead to non-value maximising project selection decisions by managers due to managerial risk
aversion: high leverage could cause risk-averse managers to alter their investment decisions in such
way as to decrease the risk of the assets of the firm in order to reduce the likelihood of default
(Myers 1984; Holthausen and Larcker 1996)26. Conversely, Jensen (1989a) argues that the risk of
insolvency of buyout firms and the associated costs of financial distress are much lower than
proclaimed, since financial innovations and the interest of all parties of a successful workout
process reduces bankruptcy risk considerably (referred to as “privatization of bankruptcy”). Kaplan
(1989b) and Kaplan and Stein (1993) show that the systematic risk of equity in leveraged buyouts
is much smaller than what would normally be predicted given the amount of financial leverage in
these transactions. One explanation for the superior performance of equity in buyout transactions
and the substantially lower risks than implied is related to the associated beneficial organizational
changes (Palepu 1990). Under this hypothesis, although LBOs increase financial risk of the
company, they reduce business risk at the same time.27 Furthermore, Opler and Titman (1993)
show that in most buyouts more debt is used than is needed to eliminate taxes, supporting the idea
that the role of debt rather relates to the incentive problems associated with free cash flow and the
cost of financial distress are therefore considered to be much lower.
2.5.2.4. Buyout Culture and Communication
As highlighted among the direct drivers with respect to revenue growth, buyouts often benefit from
a revived entrepreneurial spirit, which not only leads to more innovative ideas and processes, but
also benefits corporate culture and lines of communication. Firstly, the new organizational structure
of the buyout with more direct and open interaction between and governance presents managers of
26 It has been argued that an emphasis on financial controls induces managerial risk aversion (Lei and Hitt
1995) 27 Consistent with this hypothesis, Jensen, Burkhardt et al. (1992) document evidence of operating risk
reductions in a case study of a leveraged buyout.

Literature Review 31
post-buyout companies with an atmosphere, which is less constrained with corporate bureaucracy
and centralism28 (Lowenstein 1985; Jensen 1989a; Hoskisson and Turk 1990; Taylor 1992; Butler
2001; Wright 2001). “Buyouts provide the imagery as a creative way to reintroduce an
entrepreneurial drive in the publicly held firm” (Singh 1990) as management feels and acts as
entrepreneurs under the new organization, relieved from constraints of a corporate headquarters
and thus encouraged to make independent decisions (Bull 1989; Jensen 1989a; Houlden 1990;
Kester and Luehrman 1995; Weir 1996). Several authors have described this effect as “LBO fever”
or “Buyout adrenaline”: energized and highly motivated management teams are willing to take
nearly any action to make their buyout a success (Houlden 1990; Beaver 2001; Samdani, Butler et
al. 2001). This includes taking even unpopular and difficult decisions like cutting jobs and
disposing businesses (Butler 2001).
Another important aspect relates to improved communication and direct interaction between
portfolio company management and LBO firm (Kester and Luehrman 1995). In practice, decisions
can be taken much more freely and independently by buyout management as the LBO firm is well
aware of overall strategic direction and the responsible LBO firm partner is just a phone call away
from discussing and signing off more difficult decisions. LBO firms may choose to work directly
with management on a day-to-day basis, and even if not, they are much closer to operations and
management than in a traditional organization (Bull 1989; Hite and Vetsuypens 1989; Anders
1992). Furthermore, LBO firms bring substantial additional knowledge into the portfolio company,
acting as advisors and enablers. Firstly, their financial engineering skills and industry expertise is a
valuable new resource to the company and leads to cross-utilization of managerial talent (Hite and
Vetsuypens 1989). In addition, they frequently recruit outside advisors with industry expertise into
the company. Their network with the financial services and investor community helps the company
to get better access to the financial markets and prepares it for an eventual exit through an IPO or
trade sale.
2.5.3. Other Sources of Value Creation in Buyouts
The discussed direct and indirect drivers of value creation relate to the period post acquisition, with
the direct drivers unswervingly affecting cash flows and indirect drivers enhancing the former.
However, value in leveraged buyouts is often already created before signing the share purchase
agreement, since a lot of value can be captured during the acquisition and negotiation process.
These value drivers either relate to information asymmetries and capital market inefficiencies or
superior negotiation skills. As Haspeslagh and Jemison (1991) put it: “A (LBO) firm’s ability to
capture value through (buyout) acquisitions rests largely on the skills of a small but highly
28 Wright et al. (2001) highlighted that managers of pre-buyout organizations felt discouraged if their
business division frequently provided profitable and innovative investment opportunities, which were in turn given low attention and the management was provided with limited discretion, because their division was not regarded of central importance to the parent organization (see also Weir 1996, Beaver 2001).

Literature Review 32
experienced cadre of legal and financial experts and operating managers with well-developed
expertise in analysis and deal-making”. With respect to the above categorization, these sources of
value creation are rather “indirect” in nature, but from a “direct” financial value creation
perspective mainly relate to the transaction multiple arbitrage between entry and exit multiple.
2.5.3.1. Information Asymmetries and Market Inefficiency around Buyouts
Leveraged Buyouts have been widely accused to simply exploit insider information to create value
in the transaction (DeAngelo, DeAngelo et al. 1984; Lowenstein 1985; Wright and Coyne 1985;
DeAngelo 1986; Lehn and Poulsen 1989; Opler 1992; Wright, Robbie et al. 1998). In the eyes of
critics, value is created merely through the exploitation of private information that induces a market
correction in the value of the assets involved (Singh 1990). The reason for the apparent controversy
is that managers are subject to severe conflicts of interest in buyout transactions, because they
cannot simultaneously act as both buyer and agent for the seller (Jensen 1989a). Therefore,
especially leveraged buyouts in the form of a management buyout, in which the incumbent
management participates significantly in the equity, have been scrutinized by research (Long and
Ravenscraft 1993a). Lowenstein (1985) reports a range of insider techniques and options that pre-
buyout management has available to depress the valuation of the company. Since management is
the essential source of the business plan, on which a company is acquired, an opportunistic
management team could take advantage of their insider information and misrepresent the future
business and earnings development of the company (Lowenstein 1985; DeAngelo 1986; Hite and
Vetsuypens 1989; Ofek 1994). Under this scenario, value would be transferred from selling
shareholders to acquirers (management) as a result of private and inside information (Palepu 1990;
Wright, Thompson et al. 1992a). Effectively, acquirers (management) would buy a company for
less than a similarly informed bidder would be willing to pay, and informed owners would be
willing to accept (Kaplan 1989b).
However, there are various arguments to support the fact that information asymmetries are not a
major source of value creation on buyouts, but rather contribute to managers’ motivation to initiate
a buyout (Lee 1992). Kaplan (1989b) found in his study on management buyouts that the majority
of transactions are not completed by the existing management team. Moreover, court decisions
have early paved the way to address conflicts of interest by conducting open auctions and using
independent committees on the board of directors as well as independent external counsel (KKR
1989). The application of limited auctions for the acquisition process regularly involves extensive
disclosure requirements prepared by outside advisors, which lowers the potential that managers of
buyout targets are able to systematically conceal information about business and earnings prospects
from the acquiring party (Lowenstein 1985; Palepu 1990; Singh 1990; Lee 1992). Assuming
somewhat efficient capital markets, the danger of exploitation of insider information should be
anticipated by increasingly educated investors and the monitoring routines exercised by
independent committees and financial market analysts during open auctions, which have today
become the de-facto standard selling process (Jensen 1989b; Wright and Robbie 1996; Indahl and

Literature Review 33
Zinterhofer 1998; Wright 2001). As a result of these counter-arguments to information asymmetry
as source of value creation, Singh (1990) concludes that “the pure managerial opportunism
argument implies a higher level of manipulation of superior information by management teams
than is feasible in a competitive acquisition environment”. This is also to some extent demonstrated
by the decreasing returns on LBO transactions experienced over the recent years as competition
among LBO firms for deals has intensified (Reyes and Mendell 2004).
2.5.3.2. Acquisition and Negotiation Skills in Buyouts
Financial buyers consistently paid less for their acquisitions than did trade buyers during the 1990s
(Butler 2001). One explanation is that compared to strategic buyers, they follow a dispassionate
approach, as they screen dozens of deals for every one they execute. By contrast, strategic buyers
are restricted to their respective industry and a few targets. They tend to overestimate synergies or
get carried away in the auction of the prize of the asset, on which corporate managers have set their
hearts and possibly careers (Butler 2001). LBO firms may therefore often choose to avoid too
competitive auctions with several trade buyers participating as they already expect them “to pay
crazy prices”. 29 The second explanation is that LBO firms have developed excellent deal
negotiation skills. They are tough negotiators and tend to negotiate downward from a price that had
earlier been accepted in principle during the due-diligence phase: once they find themselves the
sole bidder, they are skilled at discovering problems (for instance off-balance sheet liabilities, such
as environmental liabilities, outdated equipment that requires higher capital investment) in the
seller’s business offer (Butler 2001).
Another source of value creation potential is the network the LBO firm has created among
corporate managers and the financial community. Their ongoing interaction with the financial
community (especially Investment Bankers) about potential acquisition targets and their various
approaches to top managers of potential targets, allows LBO firms to build up considerable
industry expertise (Anders 1992). In addition, LBO firms should benefit from an “acquisition
learning curve”, as most buyout professionals have executed dozens of deals. Even if a specific bid
is unsuccessful, the bidding process and involved due diligence provides a valuable source of
inside information and industry developments (Anders 1992). In contrast to the above outlined
efficient market argument of buyout information, LBO firm professionals could have more direct
and timely access to critical information through their network and are able to interpret it faster
than the average market participant, hence enabling them to make quick decisions regarding
acquisitions (Fox and Marcus 1992). Therefore, attractive target companies can be identified and
approached before other potential bidders are alerted about this specific acquisition opportunity
(Wright and Robbie 1996). This is evidenced by several (hostile) takeover bids in the past, in which
a strategic buyer (“white knight”) enters the bidding only after a financial buyer has made an
official tender offer. As a consequence, the LBO firm’s professionalism in deal negotiation, deal

Literature Review 34
structuring and due diligence reduces the gap of asymmetric information and hence often makes
LBO firms the preferred party for the vendor of the asset, especially when a quick execution of the
transaction is of relevance.30
2.6. Value Destruction in Acquisitions and Leveraged Buyouts
As outlined above, although LBO Associations in this and earlier studies are mainly associated
with a capability to create value in their acquisition targets, the contrary effect is equally possible.
The broad literature on value destruction experienced at companies, not only but especially in the
M&A context, as well as in the overall economy, was initiated by the discussion of the
extraordinary destruction of value/welfare after the world economic crisis of the late 1920s and the
Second World War.31 More recently, the literature on value destruction has widely focused on
management failures, ill-fated diversification strategies and especially corporate merger and
acquisition activity of (publicly traded) companies, habitually measured by various return
characteristics to their owners.
The M&A literature has shown through several studies that the average abnormal return to
acquirers’ shareholders from merger and acquisition activity is either zero (Jensen and Ruback
1983; Franks, Harris et al. 1991), or even significantly negative over one to three years after the
merger (Langetieg 1978; Dodd 1980; Asquith 1983; Magenheim and Mueller 1988; Agrawal, Jaffe
et al. 1992), which indicates that acquirers are paying at least equal or above the level of achievable
value generation potential (i.e. synergies) of the target, hence destroying shareholder value. The
notion of consistently negative returns is a puzzle to researchers as it holds as argument against the
efficient market hypothesis. This led Jensen and Ruback (1983) to remark: “These post-outcome
negative returns are unsettling because they are inconsistent with market efficiency and suggest
that changes in stock prices during takeovers overestimate the future efficiency gains from
mergers”. Ruback (1988) later adds: “Reluctantly, I think we have to accept this result – significant
negative returns over the two years following a merger – a fact”. However, the results are not all
one-sided. Langestieg (1978) had found that post-merger abnormal performance is not significantly
different from that of a control firm in the same industry. Neither Mandelker (1974) nor Malatesta
(1983) and Bradley and Jarrell (1988) – using Magenheim and Mueller’s sample but employing a
different methodology – find significant underperformance after the acquisition. More recently,
more sophisticated multifactor benchmark studies such as performed by Franks, Harris et al. (1991)
29 Partially based on the fact that financial buyers are often disadvantaged in competitive auctions with trade
buyers, as they cannot rely on synergies to justify a higher acquisition price. 30 Professional deal execution and speed are often relevant in corporate divestitures in which conglomerates
sell divisions, as divisional management and employees are not or only marginally involved in the negotiation process and consequently the vendor generally prefers to limit the time of uncertainty.
31 See for example Machlup (1935), v. Hayek (1932), Schiff (1933) and Kaldor (1932) for a European perspective of the world economic crisis and its impact on the value of companies. See Robinson (1945) for a summary of value destruction and problems of European reconstruction post World War II.

Literature Review 35
did not find any underperformance, but then again, using a comparable approach Agrawal, Jaffe et
al. (1992) did.
The important question in this context therefore is: what triggers merger and acquisition activity
and which factors determine value creation and value destruction? The notion of managerial
superiority as a motive for mergers can be traced back to Manne’s (1965) view of the market for
corporate control as an arena in which competing management teams vie for control for corporate
assets. Jensen and Ruback (1983) conclude that managerial competition “provides the mechanism
through which economies of scale or other synergies available from combining or reorganizing
control and management of corporate resources are realized”. Hence, the takeover market is an
important component of the managerial labor market; it therefore complements the internal and
external managerial labor markets as discussed by Fama (1980). More recent studies have found
that announcement-period stock returns are positively correlated with acquirer’s pre-merger
performance and negatively correlated with acquirees’ pre-merger performance (Lang, Stulz et al.
1989; Morck, Shleifer et al. 1990; Servaes 1991). These findings have been interpreted by Servaes
(1991) as evidence that “better performing firms also make better acquisitions and that more value
can be created from taking over poorly performing companies”. However, other studies have found
that acquired firms do not appear to have been unprofitable prior to merger (Boyle 1970;
Ravenscraft and Scherer 1987; Herman and Lowenstein 1988; Scherer and Ravenscraft 1989) and
that their performance either does not improve or actually declines following acquisitions (Mueller
1977; Mueller 1980; Mueller 1985; Rhoades 1986; Ravenscraft and Scherer 1987; Herman and
Lowenstein 1988; Scherer and Ravenscraft 1989). As mentioned above, a range of studies has even
found systematically negative abnormal returns post-merger (Langetieg 1978; Chung and Weston
1982; Asquith 1983; Dosoung and Philippatos 1983; Malatesta 1983; Magenheim and Mueller
1988; Agrawal, Jaffe et al. 1992; Philippatos and Baird Iii 1996). Accordingly, the evidence does
not clearly give support for the notion of managerial superiority and that the mechanisms of the
market of corporate control necessarily lead to either value creation or value destruction in
acquisitions.
The LBO literature documenting value destruction is thin and frequently based on case study
research of individual buyout transactions (Baker 1992; Bruner and Eades 1992; Wruck and
Stephens 1994; Wruck 1994a; Wruck 1994b; Lys and Vincent 1995; DeAngelo and DeAngelo
1998). Kaplan and Stein (1993) more broadly examined value destruction in buyouts across the
1980s and found indications of an increasing ‘overheating’ phenomenon in the buyout market
during that time, characterized by increased levels of financial leverage, use of public junk debt,
and extraction of equity capital through dividends by management and shareholders, which in
combination led to an overall increase of the level of risk and financial distress. Denis and Denis
(1995) report that 31% of the firms completing leveraged recapitalizations – often the most
aggressively structured form of leveraged buyouts – between 1985 and 1988 subsequently
encountered financial distress. On July 28, 1988, Revco Drug Stores filed for bankruptcy in what is
arguably the most notable failure in the annals of highly leveraged transactions (Wruck 1994b).

Literature Review 36
The firm collapsed merely 19 months after going private, a life span astonishing for its brevity.
Notable in the panoply were Revco’s financial advisors, and their inclusion was an unprecedented
extension of the doctrine of fraudulent conveyance. Perhaps the most arresting aspect of this case
was the allegation made in the financial press, and eventually by the bankruptcy examiner himself
that the leveraged buyout left Revco with an “unreasonably small amount of capital” (Bruner and
Eades 1992). However, Roden and Lewellen (1995) find evidence of a highly conscious effort on
the part of the buyout groups and their capital suppliers to tailor the respective financing packages
to the specific circumstances of the individual firms being acquired, discounting the negligence
argument. Nevertheless, the rise in bankruptcies during the late 1980s led to a constant rise in
voiced criticism questioning the ethical nature and social value of these transactions (Bruner and
Paine 1988), which were increasingly and stereotypically perceived as “value destroying”. Shleifer
and Summers (1988) support the idea of value destruction (or transfer) through their analysis on
gains from hostile takeovers, which they generally attributed to stakeholders’ wealth losses such as
declines in value of subcontractors’ firm-specific capital or employees’ human capital. In their
view, shareholder gains in takeovers are therefore redistributions from stakeholders, and will in the
long run eventually result in a deterioration of trust, which is deemed necessary for the functioning
of the corporation. Other major stakeholders of buyout targets subject to potential wealth losses
besides suppliers and employees were seen in existing pre-buyout bondholders (Warga, Warga et
al. 1993), as well as the government (the “taxman”) (Kaplan 1989a). Despite criticism regarding
value destruction caused by aggressive leveraged buyouts, several authors also stress the benefits of
financial distress and its positive effect on internal capital markets and organizational efficiency in
the buyout context (Wruck 1990; Wruck 1994a; Kaplan, Mitchell et al. 1997). According to Wruck
(1990), imperfect information and conflicts of interest among the target firm’s claimholders have
the largest influence on the outcome of financial distress, both areas in which methods for resolving
these problems are generally available. Denis and Denis (1995) therefore attributed the high rate of
distress cases in the late 1980s primarily to unexpected macroeconomic and regulatory
developments, rather than structural deficiencies.
Furthermore, the broad literature researching performance improvements in LBOs (Baker and
Wruck 1989; Jensen 1989a; Kaplan 1989b; Lichtenberg and Siegel 1990; Muscarella and
Vetsuypens 1990; Singh 1990; Smith 1990a; Long and Ravenscraft 1993c; Ofek 1994; Smart and
Waldfogel 1994; Phan and Hill 1995; Weir and Laing 1998), as well as reverse LBOs (Holthausen
and Larcker 1996; Jalilvand and Switzer 2002) appears to be less divided with respect to post-
buyout performance than the literature on post-merger and acquisition performance. The positively
skewed literature findings could suggest that the scope for value destruction in buyout targets may
be significantly lower than in public market mergers and acquisitions. One potential explanation
could be seen in the fact that financial buyers limit their downside risk through a very disciplined,
dispassionate and objective target selection approach, which on average makes them pay
consistently less than trade buyers, i.e. they avoid overpaying for their acquisitions (Butler 2001).

3. Methodology and Research Design
3.1. Research Goal of the Study
The purpose of the proposed study is to provide practitioners in the Private Equity industry and
academia with a better understanding of the value creation process in buyout transactions.
Especially, this study seeks to shed light on the drivers that lead to such successful buyout
transactions and in turn to the observed “abnormal” performance in LBO funds when compared to
either similar acquisitions performed by strategic buyers or to public equity market performance.
More specificly, the thesis shall focus on factors influencing performance and contributing to value
creation from three major sources:
1. The contribution of exogenous, systematic drivers of value creation, which are (i) related to
general market conditions, (ii) related to the financial performance of the target or its
industry or (ii) related to the type of acquisition undertaken (together the “financial” impact
on performance).
2. The contribution of indigenous, non-systematic drivers of value creation, which can be
attributed to the following two areas:
a) The characteristics and resulting managerial approach of buyout investment
manager profiles as well as buyout firm profiles (the “managerial” impact on
performance)
b) The acquisition management approach and strategic drivers specific to each single
LBO transaction (the “strategic” or “operational” impact on performance)
In brief, the proposed dissertation shall provide answers to three closely linked research questions:
R1: What are the drivers of value creation in a leveraged buyout transaction and how
do these drivers positively correlate to a firm’s acquisition performance?
R2: Beyond purely “financial” value drivers, what impact on success does the human
factor “Buyout Firm and its Investment Manager Team”, have; and to what extent
does the strategic factor “Buyout Strategies”, contribute to positive buyout
performance?
R3: What can Private Equity firm practitioners and their investors learn from the
analysis of past buyout transactions and how can they apply this knowledge to
make better investment decisions in the future?

Research Design and Methodology 38
The dissertation’s ultimate goal is to develop a better understanding of how value is created in
buyouts with a particular focus on how the LBO firm and its team of investment managers
contributes to this value creation, in effect not only determining the individual transaction’s, but
eventually the whole LBO fund’s performance. The factor management on both the company level
and to a lesser extent on the LBO fund management level has been identified as a key criterion in
prior pilot studies, although this study will limit its scope to the LBO fund management level. The
factor management on the company level has been more frequently researched with respect to
principal agency (i.e. alignment of interest) theory (Easterwood, Seth et al. 1989; Kaplan 1989b;
Morck, Shleifer et al. 1990; Palepu 1990; Smith 1990b; Wiersema and Liebeskind 1995; Weir and
Laing 1998; Gottschalg 2002). Based on these prior findings, there continues to be a clear
indication that agency theory (Jensen and Meckling 1976) and its implications play a crucial role in
the buyout context overall. However, this especially applies at the micro-level of the company, as
organizational changes in ownership structure and corporate governance have significant effects on
buyout performance. However, LBO Fund of Fund managers have highlighted in interviews prior
to this study that their fund investment decisions for an LBO fund are significantly driven by their
assessment of the LBO fund management team and their implemented value creation strategies
rather than purely on their performance track record.32 According to their argument, the increased
competition in the Private Equity industry for attractive assets makes the role of the buyout firm
and its managerial capabilities to identify and implement such value enhancing strategies
quintessential. Based on that perspective, this study therefore seeks to explore these additional
important and almost completely un-researched, somewhat more macro-level factors of value
creation in more detail. Consequently, this study will initially focus on financial (and other
exogenous) drivers surrounding buyout transactions. Subsequently, this study analyzes investment
manager and buyout firm teams as well as their value creation strategies in more depth.
In summary, this study seeks to be an important contribution (i) for practitioners in the Private
Equity fund and investor community, as it counts as the first study to provide a comprehensive
overview of Private Equity and Buyout Fund returns as well as its value creation drivers, based on
an unique data set, (ii) to the recent increased discussion and investor demands for more
transparency and disclosure in the Private Equity industry, pointing at key areas of focus, (iii) to the
existing literature, focusing on two areas of value creation drivers – the buyout association and
their value creation strategies – that have not yet been broadly analyzed in academic research, (iv)
to the broader academic research effort to develop an integrated theory of the firm by combining
findings from the finance (agency theoretical), management team and strategic management fields,
using the buyout context as a platform.
32 Private Equity Fund of Funds are more frequently making use of newly developed LBO fund management
team evaluation tools in order to assess the buyout firm’s quality of investment professionals and their investment approach and track record.

Research Design and Methodology 39
3.2. Research Object of the Study
3.2.1. Industry Perspective
This dissertation focuses in general on the global Private Equity industry, with particular focus on
Leveraged Buyout Funds.33 The increased pressure for disclosure in the Private Equity industry, the
need for institutional investors such as Private Equity Fund of Funds to identify top quartile
performing LBO funds for their large scale investment decisions as well as an expected
consolidation in an overcrowded and to some extent still underinvested Private Equity industry
form a fascinating basis to study the above outlined research questions and to contribute to the
current discussion in the industry.
3.2.1.1. Pressure for Disclosure in the Private Equity Industry
Spurred by the turbulent capital market development subsequent to the burst of technology
(investment) bubble in 2000, the Private Equity industry has become under intense pressure from
its investor community. Investor calls for more transparency and disclosure around investment
returns and with respect to strategic actions taken in individual investments – in order to better
assess a Private Equity Fund’s capabilities – have mounted. After significant pressure from its
contributing members, several U.S. pension funds have initiated basic disclosure of their LBO fund
investments’ returns and announced increased transparency.34 With more and more industry players
openly debating disclosure policies, the industry is set to undergo radical change. This study is
intended to contribute by finding relevant disclosure areas and formats for the practitioner
community.
3.2.1.2. Pressure for Performance in the Private Equity Industry
The Private Equity industry has seen an unparalleled inflow of capital during the boom years of the
technology and internet bubble and sharply increasing capital markets (see detailed results in
section 4.2.1.). On the one hand, investors were seeking to benefit from the stellar returns realized
33 A limitation on individual countries is not useful, as most large buyout funds have either a global or Pan-
European investment focus and are not restricted to individual countries to seek investment opportunities. Some funds may also invest in other assets besides traditional buyout situations.
34 The California Public Employees’ Retirement System (CalPERS) was forced to publish returns on its alternative investment program (AIM), including returns on its Private Equity fund investments, for the first time in summer 2002 after threatened litigation by a court rule initiated by its pensioners. This publication was followed by several other pension funds’ disclosures. On March 17th 2003, CalPERS announced to become the first U.S. public pension fund to adopt a comprehensive performance disclosure policy for its Private Equity investments in an effort to improve transparency for its members. CalPERS will publish on a quarterly basis, internal rate of returns (IRRs) for its funds and fund of funds, and amounts of cash invested and profits realized from that cash invested. In addition, the System intends to work closely with the Private Equity industry to improve the quality of public information related to IRRs and portfolio company valuations.

Research Design and Methodology 40
in Private Equity during this time, especially in Venture Capital, but also in the buyout area as open
capital markets allowed quick exits from investments.
On the other hand, investors were keen to diversify their heavily equity-balanced portfolios with
alternative investments, such as the less correlated Private Equity investment asset class. The large
availability of capital at the same time triggered a boom of Private Equity Fund of Funds, as these
new investment vehicles were allowing a large class of investors, which were previously restricted
from direct investments into Private Equity funds, “to take part in the game” through the less risky
and more diversifying approach of these specialized fund of funds. However, the steep economic
and capital market downturn that started in March 2000 has left the Private Equity industry with
enormous amounts of un-invested capital, as well as few investment and exit opportunities.
MANAGEMENTExperience
Leadership
Cohesiveness
Internal resources
Economics
SUPERIOR
LBO FUND
PERFORMANCE
INVESTMENT PROCESSDeal flow
Due diligence
Investment committee
Advisory board
PERFORMANCEPortfolio composition
Realized returns
Unrealized returns
Record of success
Adherence to strategy
STRATEGYMarket opportunity
Market differentiated
Industry knowledge
Value add
Competitive advantage
TERMS & CONDITIONSAlignment of interests
Fees
Carried interest
Key man
No fault divorce
Figure 4: Key Areas and Criteria for LBO Fund Due Diligence
Source: Anonymous Private Equity Fund of Fund.
In this environment, achieving performance on investments, which is in the top quartile of the
industry, is therefore vital for all players in the industry. As a consequence, Private Equity investors
continue to advance their investment due diligence approach and tools to substantiate their
investment decisions. Figure 4 summarizes key areas of due diligence that these investors have
developed in order to assess the potential of an LBO fund to demonstrate superior performance.
This study seeks to contribute to this increasing due diligence effort by reflecting on historic data
and trends and introducing new investment analysis tools that could improve investment decisions
in the practitioner community going forward.

Research Design and Methodology 41
3.2.1.3. Consolidation in the Private Equity Industry
As a result of the above mentioned pressure for more disclosure and performance, the Private
Equity industry is set to undergo a substantial consolidation. The lack of investment opportunities
has already led several Private Equity funds to return their raised capital – in part or completely –
to investors. Industry experts suggest that a large amount of the more recently established Private
Equity funds will go out of business, while the market for new fundraisings has become much more
challenging 35 . Furthermore, some of the largest investment banks with merchant banking
operations in the industry have suffered from considerable asset write-downs on their Private
Equity portfolios, eradicating already weak earnings and hence reporting large losses. These banks
have started to divest or securitize these portfolios in order to reduce earnings volatility on the one
hand, and in order to comply with new legislation on bank capitalization set out by the Basel II
Accord.36 These portfolios, often offloaded at steep discounts to net asset value (NAV), are now
traded in the Private Equity secondary market among fund of funds and other investors. Private
Equity fund of funds, however, are themselves equally suffering from the dismal recent
performance of the primary funds in which they have invested.
3.2.1.4. Benchmarking Returns in the Private Equity Industry
In spite of the external pressures and the increased scrutiny of fund performance by investors, there
currently is only very limited knowledge around appropriate benchmarking tools in the Private
Equity market. Private Equity return data providers such as Venture Economics and PE Intelligence
generally provide investors with fund return benchmarks according to vintage years. This approach
is not taking into consideration some important elements. First, fund returns are dependent on the
nature of its underlying investments, which means that funds focusing on high risk investments
(e.g. Venture Capital) may generate higher returns than funds that are investing in traditional
mature businesses. Also, the average return of investments may be boosted by a single or a few
successful investments. Secondly, the aggregation on the fund level does not make explicit the
value creation that the buyout firm has generated, e.g. when compared to public market
performance of targets in their respective industries. Finally, geographic differences may not be
accounted for when comparing returns with benchmark funds. This study proposes alternative ways
of benchmarking Private Equity investments, taking into account investment timing, horizon,
industry performance and geographic differences.
35 Some of the largest Private Equity firms, e.g. Doughty Hanson, Industri Kapital or Terra Firma Capital
Partners, had to reduce their fund raising targets in 2003 following problems to secure a sufficient level of commitments.
36 For example, Deutsche Bank’s Private Equity arm, DB Capital, has been spun off in 2003 in a management buyout to some of its partners and is now operating under the new name MidOcean Partners. UBS Capital has been sold in 2003 as the bank decided to reduce its Private Equity direct involvement. JPMorgan Capital Partners, one of the largest merchant banks worldwide, has significantly reduced its portfolio and is also considering a spin-off.

Research Design and Methodology 42
3.2.2. Transaction Perspective
The traditional subject in M&A literature surrounds mergers and acquisitions, takeovers and related
issues of corporate restructuring that result in a change of a firm’s ownership structure. This study
on performance and value creation drivers of buyout transactions focuses on deals that have been
characterized by Copeland and Weston (1988) as “Leveraged Buyouts” in their categorization of
corporate restructuring events. All other corporate restructuring types are not being considered, as
they are either more likely to resemble acquisition activity among non-financial, strategic buyers
(i.e. mergers and acquisitions, divestitures, etc.) or do not follow the intention of change in
ownership and use of significant debt financing to gain the required control over a potential target.
Hence, although at least three alternatives can result in change in ownership structure according to
Copeland and Weston (1988), these options lack the significant debt financing involved in
Leveraged Buyout. As expanded on in the literature review, debt financing is seen to play a
fundamental role buyout and has significant effects on management financial discipline,
incentivation, agency costs and value creation. Therefore, no other categories are considered in this
study’s samples.
I. Expansion Mergers and Acquisitions Tender offers Joint ventures
II. Sell-offs Spin-offs (Split-offs & Split-ups) Divestures Equity carve-outs
III. Corporate control
Premium buybacks Standstill agreements Anti-takeover amendments Proxy contests
IV. Changes in ownership structure
Exchange offers Share repurchase Going private Leveraged buyouts Study Sample Focus
Table 2: Types of Corporate Restructuring
Source: Copeland and Weston (1988)
Accordingly, leveraged buyouts in this study can be described as “transactions in which a (majority
control) ownership stake is acquired (at least involving a change in ownership) and a significant
amount of debt is utilized to finance the purchase price of the acquisition”. Based on this
perspective, there are several types of leveraged buyouts from a market and ownership perspective
that can be distinguished in general:37
37 See Butler (2001) for details on internal LBOs, adapted by the author.

Research Design and Methodology 43
Form Characteristics Ownership
A. Management Buy-Out (MBO)
Encompasses the current management team, seeking advice and financing from outside investors to acquire the company, generally with a LBO firm
Change: LBO
B. Management Buy-In (MBI)
Encompasses an external management team, seeking advice and financing from investors to acquire the company, generally with a LBO firm
Change: LBO
C. Public to Private (P-to-P)
Encompasses a LBO firm (and/or MBO/MBI), making a tender offer for shares of a public company, taking it private.
Change: LBO
D. Private to Private Encompasses a LBO firm (and/or MBO/MBI), buying a controlling stake in a private company, often a family firm
Change: LBO
E. Divisional
Spin-off
Encompasses a LBO firm (and/or MBO/MBI), buying a division of a private or public company (corporate divestiture), running it as an individual business
Change: LBO
F. Internal LBO There are several types of internal LBOs that can be distinguished:
Internal Carve-Out, leaving ownership of division with parent company Leveraged Partial Public Offering, offering part of the company on the public market Corporate Management Buy-Out, with parent company retaining majority control JV LBO, separation from parent, but parent company retains significant minority stake
Generally no significant change:
No LBO
G. Leveraged Recapitalization
Generally encompasses a public company, which leverages itself in combination of a employee equity participation program in order to strengthen the incentive to maximize the company’s performance
No significant change:
No LBO
H. Secondary
Buy-Outs
A buyout investment is purchased in a transaction encompassing two LBO firms
Change: LBO
Table 3: Forms of Leveraged Buyout Transactions Classification
According to this LBO transaction classification, this study includes all of the above outlined forms
of leveraged buyouts and their combinations, except for the internal LBO and leveraged
recapitalization (“F” and “G”). Although these latter two forms of buyouts may potentially involve
some form of debt financing, they do lack the necessary change of ownership that allows
meaningful organizational transformation. In other words, although these latter forms may result in
some of the benefits associated with LBOs, the continued dominant involvement of the former
shareholders is unlikely to induce a far-reaching re-alignment of interests or radical corporate
restructuring. Secondary buyouts do qualify as LBOs for the purposes of this study, despite the fact
that this form is not expected to accompany such significant corporate change due to the similarity
of objectives of the financial buyer and seller. Although not subject of this study, it could be
anticipated that the transformational changes and factors contributing to value creation differ
between primary and secondary buyout.

Research Design and Methodology 44
3.3. Research Model
3.3.1. Development of the Research Model
The presented research model has, on the one hand, been developed on the basis of the literature
review. However, the most important input to the research model’s design came from interviews
carried out prior and during this study with industry practitioners in the Private Equity Fund as well
as Private Equity Fund of Funds industry. Through these brainstorming sessions about (i) what an
ideal approach to measuring value creation in buyouts would be, and (ii) which effects and control
variables should crucially be taken into consideration, this research model has gained considerable
complexity, yet strong explanatory power of variance in buyout returns (i.e. the dependent variable
deal IRR in this study). The expert interviews not only helped to ensure that the study adequately
reflects the key focal points and most important drivers of value creation in buyouts, but also
indirectly contributed to increase the validity of the proposed research (and regression) model(s).
Furthermore, this process also guaranteed to derive conclusions which are relevant and useful for
the buyout practitioner community, i.e. both for Private Equity firms and their (buyout) managers
as well as Private Equity investors.
In summary, the development of the proposed research model followed these steps:
1. Identification of the main sources of value creation according to the steps in a typical
leveraged buyout acquisition process, starting from the pre-acquisition and negotiation
phase to the post-acquisition phase of organizational changes and operational
improvements with their respective performance impacts.
2. Challenge and extend ideas through brainstorming sessions with Private Equity
practitioners. Identification of relevant (external, systematic) control variables that will
influence buyout returns. Identification of areas of research interest of practitioners, which
influenced research design.
3. Definition and aggregation of constructs based on key variables on the buyout firm and
manager level, buyout strategy and buyout target level as well as control variable level,
which could have significant influence on the value creation process in buyouts.
4. Test of the research model’s desired constructs and variables for predictability and
operationalizability based on accessible data.
5. As an overall goal, the research model at all times was intended to form a reliable basis to
provide a constructive contribution to (i) practitioners in the Private Equity and industry
and their investors to improve their due diligence and investment processes for leveraged
buyouts and LBO funds respectively, and (ii) to academia’s so far limited understanding of
sources of value creation in Buyouts and potential discovery of important non-researched
drivers, e.g. the impact of the factor (GP team) management.

Research Design and Methodology 45
3.3.2. The Research Model
As mentioned above, the research model design has been based on both expert interviews and
literature review. Following the latter, a typical acquisition process that holds for any type of
acquisition, including leveraged buyouts, can generally be understood as an eight-step process:
Strategic Objectives Search & Screening Strategic
Evaluation
Financial
Evaluation
Post-Acquisition
Evaluation Integration Agreement Negotiation
Figure 5: General Acquisition Process
Source: Hasepeslagh and Jemison (1991)
With respect to analyzing value creation in buyouts, the focus according to this model must be on
the “negotiation” and “integration” phases. According to one stream of research (Anders 1992; Fox
and Marcus 1992; Wright, Wilson et al. 1996; Butler 2001), buyout firms have consistently been
able to capture value from the seller through skilled negotiations. However, given counter-
arguments based on the efficiency of today’s auction processes (Jensen 1989b; Singh 1990; Wright
and Robbie 1996; Indahl and Zinterhofer 1998; Wright 2001), most authors agree that the main
source of value creation will originate from the post-acquisition management phase, rather than
market inefficiency. Following the latter argument, i.e. assuming for a moment to fully discount the
potential source of value creation from the negotiation phase on the basis of efficient market theory,
the post-acquisition management phase hence offers the single and foremost opportunity to
demonstrate the value that a certain buyout firm can bring to the buyout target through its team of
investment managers and its buyout target value creation strategy. The below process chart (figure
6) summarizes the key steps in a buyout acquisition process.
Target
Selection
Due Diligence &
Deal Structuring
Post-
Acquisition
Management
Exit
Buyout Firm and Buyout Manager Characteristics
Figure 6: Acquisition Process – adapted to Leveraged Buyouts
However, such process charts do not sufficiently reflect the potential other sources of value
creation, which are inherent in the respective buyout firm’s managerial and strategic characteristics.
In addition, they not only say little about the different levels of characteristics, from which drivers

Research Design and Methodology 46
of value creation are derived from, but they also neglect the important interactions and
interdependencies among value drivers. In fact, the process chart implicitly assumes that the
process itself creates the anticipated value creation performance. Thus, such an approach tends to
underestimate the influence that the LBO Fund and its management team may have on the
performance of the deal. In addition, it is unable to capture side-effects that make a flow chart
analysis irrelevant. Taking these factors into account, the focus shifts from an acquisition process
view to a value creation view that could be illustrated as follows:
Real Value
Creation
Buyout Firm
& Buyout Manager specific
Value Creation
Drivers (the “GP Effect”)
Acquisition Management & Strategic
Value Creation Drivers of Individual LBO
Investment (the “Strategy Effect“)
Exogenous/
Systematic
Factors
Inte
rdep
ende
ncie
s&
Inte
ract
ions
Control for
industryperform
ance
Market &
Financial
Value Creation
Drivers
Figure 7: LBO Value Creation Model
The LBO Value Creation model outlines the major categories that may influence buyout
performance. First, market and financial value creation drivers, such as the state of the public
equity markets or financial developments and outlook in a certain industry, explain to a certain
extent the performance of a buyout target, given that there is a indisputable link to economic and
industry dynamics. Secondly and more importantly, this study argues that the buyout firm itself is a
direct source of value creation, as on the one hand the experience and profile of an individual
buyout investment managers and on the other hand the experience of the buyout firm as a whole in
undertaking buyout transactions may affect the return of buyout transactions.
Thirdly, acknowledging that there may be a “GP effect” in value creation through the acquiring
General Partner firm, the third layer of analysis focuses on value drivers that are based on the
strategic actions taken by the buyout firm to implement their desired value generation process.
After controlling for exogenous, systematic factors, such as transaction entry and exit modes and
types (further detail below) that affect buyout success, value creation can to a large extent be made
explicit through this model. Lastly, in order to make a relative comparison, each investment is
benchmarked against public market performance in its respective industry over the investment
horizon to uncover “excess-to-market” or real value creation. The illustration of the LBO Value

Research Design and Methodology 47
Creation model as a pyramid is intentional and represents a macro to micro view of value creation
drivers. The final layer, neither depicted in the LBO Value Creation model nor part of this study,
would be a company and target management level, which does, however, go beyond the scope of
this study. The research design chosen by the author intentionally omits this layer due to his
conviction that the key strategic decisions leading to value creation are made on the GP level, and
not the company level.
The following research model summarizes these identified levels of potential value creation drivers
in leveraged buyouts that may lead to real (market-adjusted) buyout acquisition out-performance:
Exogenous / Systematic
Value Creation Drivers
Exogenous / Systematic
Value Creation Drivers Indigenous / Non-Systematic Value Creation DriversIndigenous / Non-Systematic Value Creation Drivers
Market
Characteristics
Market
Characteristics
Industry Financial
Characteristics
Industry Financial
Characteristics
Acquisition Entry & Exit
Characteristics
Acquisition Entry & Exit
Characteristics
Investment Manager
Characteristics
Investment Manager
Characteristics
Buyout Firm
Characteristics
Buyout Firm
Characteristics
Target
Characteristics
Target
Characteristics
Deal Decisions &
Characteristics
Deal Decisions &
Characteristics
Acquisition Process &
Strategic Events
Acquisition Process &
Strategic Events
Buyout Acquisition
Performance
Buyout Acquisition
Performance
Total Deal Population Control GroupTotal Deal Population Control Group
Other Control VariablesOther Control Variables
H +/-
H +/-
H +/-
H +/-
H +/-
H +/-
H +/-
H +/-
Figure 8: Research Model
The research model is an extension from previous approaches to analyze leveraged buyouts on a
company level, which almost exclusively concentrates on the buyout company itself (Kaplan
1989b; Lichtenberg and Siegel 1990; Smith 1990b; Gottschalg 2002). The core of the model on the
far right therefore still forms aspects of the “buyout company level”. However, as outlined above,
the perspective of the buyout company level in this study shifts up the causal chain to a perspective,
in which corporate action is seen as strategic events initiated by the acquiring buyout firm. The
buyout company or strategic level will take into consideration three areas of variables: (i) the
buyout target’s specific operational and organizational characteristics, business strategy, market
approach, and operating environment, (ii) deal specific decisions taken by the acquiring buyout
firm, motivations for the deal and role of management, and (iii) the specific acquisition process, on
the one hand in order to capture to some extent the process based view of value creation as outlined
by Haspeslagh and Jemison (1991), and on the other hand to encapsulate the strategic actions
implemented at the buyout target by management (but based on the General Partner’s guidance).

Research Design and Methodology 48
The research model in this study is extended by another important level of potential value drivers,
which are determined by the LBO fund and its management team. This level has been developed
according to Private Equity industry expert views that the experience profile of individual
investment managers as well as the buyout experience gained by the General Partner as a firm has a
strong potential impact on buyout performance. Under this view, the core of the research model
shifts to the GP firm as it is the main source of action for any value creation processes implemented
at the company level. For instance, the success of a leveraged buyout under this model therefore
not necessarily depends on (operational) decisions and actions taken at the company level by the
target’s management. Instead, it is more dependent on the strength of the GP management team,
determined for example by the GP team’s background, experience and creativity, its cohesiveness
and functionality as a team as well as the team’s investment track record. Also, the GP firm’s
management approach towards leading the buyout portfolio company, setting its strategy as well as
their proprietary network will be important variables that may determine value creation.
Finally, the research model in this study includes a third pillar categorized as exogenous,
systematic factors of value creation. This layer includes the following variables: (i) market
characteristics, encapsulating industry and equity market performance, state of the overall
economy, and entry and exit conditions and valuation levels, (ii) industry financial characteristics,
which determines what the recent, current and expected financial status in the respective buyout
target’s industry is both at the time of entry and exit, and (iii) acquisition entry and exit conditions,
which unlike the before mentioned market-related conditions include the entry and exit types, e.g.
auction , negotiated sales, intermediary, IPO, and entry and exit modes, e.g. acquisition,
recapitalization, private or public exit. These combined exogenous factors have a fundamental
impact on the performance of a buyout. Nevertheless, one of the reasons why this study stresses the
importance of the GP firm is that the more successful GP firms should be able to read the
exogenous factors and exploit opportunities accordingly, both at the time of entry and exit. For
instance, the investment decision for a buyout target in a certain industry by the GP firm should be
based on a view on market entry conditions and valuation, growth prospects for the industry, and
positive exit prospects in the near- or mid-term. Therefore, although these factors are de facto
exogenously given, successful LBO firms will consistently have to take a better view on companies
than public markets and/or their buyout target’s management. In order to achieve this goal, LBO
firms may choose to restrict their LBO fund’s investment strategy with respect to investment size
or pursue a regional or industry niche focus. Several control variables, such as entry and exit years,
geographic distribution, separation of realized and unrealized deals, amount of invested capital,
ownership percentage acquired, etc. support the research model to identify, isolate and test the
above outlined constructs and to explain variance in buyout returns.
The presented research model is intended to provide a basis for practitioners and academia to
explain variance in buyout performance based on historical buyout returns. The model’s results
should be utilized to develop research in the buyout field further and – from a practitioner/investor
point of view – to eventually provide forward-looking indications about which specific LBO fund

Research Design and Methodology 49
and which LBO firm management team is likely to add value to a specific buyout transaction and
which is not. For instance, an excellent GP team track record gained in one industry may not
guarantee success in a new buyout opportunity, if (i) it is not within the GP’s core industry or
regional focus, (ii) it is far larger than prior transactions performed by the team, or (iii) the strategy
setting and management approach differ.
The following section summarizes the main hypotheses of the study. The subsequent sections will
then provide more detail about the empirical approach and operationalization of the research model,
as well as a detailed formula deduction of the dependent variable in this study – buyout deal gross
IRR (internal rate of return) performance. As this study is arranged into three main sections of
empirical tests, a detailed description of tested independent variables and their measurability,
followed by further discussion and conclusion with respect to tested variable hypotheses is
provided in each empirical test section of this study separately.
3.4. General Hypotheses
The introduced research model forms the basis to provide constructive answers to the following
general hypotheses (“GH”) along the model’s three pillars:
GH1. The more favorable the market, industry, entry and exit conditions surrounding a
buyout acquisition, the higher the expected buyout return on investment.
GH2. The higher the degree of relevant background and experience of an individual
investment manager, as well as the higher the degree of combined diversity of such
backgrounds, assembled knowledge and experience of a buyout firm in relation to
executing buyout deals, the higher the expected buyout return on investment.
GH3. The more attractive the target company’s business characteristics, the more
favorable the deal decisions taken by the acquiring LBO fund and the more radical
the strategic actions implemented by the acquiring LBO fund, the higher the
expected buyout return on investment.
These three overall research study hypotheses will be further extended in each of the three sections
of empirical tests. A range of explanatory dependent variables are introduced, defined and tested
through multivariate regression models in each respective section. The results from these tests will
support acceptance or rejection of the above main hypotheses of the study.
Due to the complexity and number of explanatory variables in the empirical tests, not all variables
will be tested in a single multivariate model. Instead, variables will be tested according to their
main pillar from a macro to micro level as outlined in the value creation model (figure 7) and

Research Design and Methodology 50
research model (figure 8). Complexity is being added iteratively through nested multivariate
regression models in order to demonstrate relative impacts of each explanatory variable or group of
variables to the model’s power to explain variance in buyout returns (IRR).
3.5. Performance Evaluation
3.5.1. Overview of Performance Evaluation
Venkatraman and Ramanujam (1986) distinguish three general categories of business performance
measures: financial performance, operational performance and organizational effectiveness.
Financial performance is the narrowest, but the most frequently used concept in both finance as
well as the empirical strategic management studies (Hofer 1983). Measures used are either
accounting-based, such as sales growth, profitability, earnings per share, or market-based like
(abnormal) stock returns. To widen the perspective of the concept of business performance,
Venkatraman and Ramanujam (1986) combined financial and operational performance.
Operational performance can be evaluated with non-financial measures such as market share and
product quality reflecting the fulfillment of economic and operational goals. The broadest domain
introduced by Venkatraman and Ramanujam, the domain of organizational effectiveness, has been
approached conceptually by strategic management. However, no generally accepted measures have
yet been introduced, and most studies have continued using financial and business performance
measures. Research in the fields of finance and strategic management has been criticized for using
accounting-based data to measure performance (Datta, Rajagopalan et al. 1991; Hoskisson, Hitt et
al. 1993). This criticism draws on the weakness of accounting data in manipulating firm
performance and suggests that researchers should focus on market-based performance measures
exclusively or at least to validate the results obtained with accounting data (Nayyar 1992; Dalton,
Daily et al. 1998). As a consequence, this study will only employ a market-based measure of
performance: the internal rate of return (IRR) on buyout investments will serve as primary indicator
of buyout performance and value creation. Nevertheless, as demonstrated in section 3.5.4. through
a mathematical return deduction formula, the market-based return can be broken into constituents,
which are based on the operating and accounting performance of the target.
3.5.2. Performance Evaluation in Leveraged Buyouts
At the end of a buyout process, i.e. upon full exit from the investment, remains the evaluation of
the buyout performance, which gives evidence about the degree of value creation in the deal.
Although the LBO firm generally takes strategic action and value creating measures immediately
after the acquisition, a large portion of value creation will only occur over the subsequent months
or years. LBO firms frequently report “hypothetical” returns of their unrealized investments

Research Design and Methodology 51
according to current market valuation over the holding period, e.g. during new fundraising efforts.
These unrealized deal returns are based on the assumption that a certain portfolio company would
(on average) be valued according to industry peers if sold at any given time. However, it is
standard practice (for investors) to measure LBO performance at the time of the exit from the
investment, i.e. to analyze actual realized returns38.
As a consequence, in order to measure the long-term performance impact of the buyout, the study
intends to focus on the internal rate of return (IRR) of the buyout as superior performance measure
and dependent variable. Theoretically, the internal rate of return method compares the value of the
buyout firm’s equity stake at exit against their initial equity investment. This simple method,
however, can be flawed should there be significant intermediate cash flows (e.g. extraordinary
dividends) that were paid out to the shareholders. Nonetheless, the internal rate of return
calculation can easily be extended to include a discounted cash flow analysis, in which all cash
inflows (and outflows) by the General Partner are discounted appropriately. It has become market
practice to calculate and report deal IRRs based on exact cash in- and outflows and their timing. On
the other hand, exact cash in- and outflows are not generally adequately documented and made
available by General Partners, e.g. through their private purchase memoranda. Instead, these cash
flows are often only implicitly presented through a differentiation between realized and unrealized
values of an investment at the time of exit or valuation date. The realized value portion will
incorporate both cash inflows during the holding period and/or at exit. The total value, which
combines realized and unrealized values, therefore represents a good proxy to calculate returns on
invested capital.39 In addition, sizable intermediate cash in- or outflows are generally not very
frequent, since (i) covenant restrictions under the debt financing agreements do not generally
permit cash dividends from the portfolio company to the financial sponsor, and (ii) sponsors are
generally reluctant to invest additional capital into the business after their initial investment.
Based on the above discussion, this study’s descriptive and statistical analysis is mainly based on
reported IRRs from buyout firms; hence IRRs used as performance measures in this study should
ceteris paribus reflect the correct cash flow-based reporting methodology, while at the same time a
certain degree of reporting flexibility of buyout funds must be acknowledged. A small portion of
transaction IRRs in the database underlying this study has been calculated manually based on total
value assumptions at exit, assuming no intermediate cash flows for the above mentioned reasons.
38 Investors generally also perform an evaluation of unrealized returns, applying their own valuation
techniques and views on these investments. 39 However, there is no detailed information given by the General Partner whether some part of the
intermediate cash flows are compounded to account for the time value of money. However, this effect is more likely to be negligible since paid out distributions to Limited Partners are not necessarily reinvested at the same return. Consequently, this assumption is the more conservative approach, but may slightly affect the actual level of IRR.

Research Design and Methodology 52
3.5.3. The Internal Rate of Return Formula
The primary measure of return in a LBO transaction and the dependent variable in this study is the
gross internal rate of return on invested capital by the fund. Buyout funds generally report both
gross and net IRRs, which are both based on actual cash flows. This study exclusively focuses on
gross IRR, i.e. actual returns on a single buyout investment made by the General Partner compared
to net IRR, which represents the actual distribution to the buyout fund’s investors (Limited
Partners) net off fund management fees as well as carried interest. The latter represents the profit
sharing part of the General Partner on the respective transaction and is commonly set at 20% as an
industry standard. The importance for choosing gross IRR as primary measure in this study is based
on the fact that the goal of the empirical analysis is (i) to compare actual deal performance with
public market industry performance over the investment period, and (ii) to break down and analyze
the determinants of this gross IRR value creation. This study therefore does not intend to measure
cash flow returns to fund investors, which would be appropriate for an evaluation of Private Equity
as and investment asset class40.
The buyout target’s valuation is generally based on entry and exit point enterprise values (as
reported), from which equity contributions to the General Partner are calculated. The dependent
variable is defined as:
(1/ Holding Period)
1Exit
Entry
Equity ValueIRR
Equity Value
with
Equity Value Exit = Amount of total realized and unrealized value at time of exit (or at
time of deal valuation)
Equity Value Entry = Equity amount invested by General Partner (at time of acquisition)
Holding Period = Date of exit minus date of acquisition, expressed in years
3.5.4. Value Attribution in Buyouts – Deduction and Extension of the IRR Formula through the Dupont Equation
The total Equity Value at exit is a result of the combined value creation activities that the buyout
firm has implemented over the holding period of the investment. In the majority of cases, these
activities should have had a positive influence on (i) revenue growth at the target, (ii) improvement
in operating efficiency at the target (measured as EBITDA margin), (iii) relative trading multiple
valuation of the company (indirect result either through improvements of financial performance in
(i) and (ii) or through a general increase in trading valuations in the public markets), and (iv) cash
flow generation at the target, which has led to leverage/debt reduction. As a consequence, an ex-
40 Compare Gottschalg, Phalippou et al. (2003), Kaplan and Schoar (2003) and Ljungqvist and Richardson
(2003) for recent findings.

Research Design and Methodology 53
post comparison of these constituents at the time of acquisition and disposal of the business allows
making explicit what the sources of increases in equity value have been over the holding period.
The following mathematical deduction, in the following referred to as “Value Attribution Analysis
of Leveraged Buyouts”, is based on the Dupont formula. The Dupont formula has traditionally
attracted widespread academic attention from various research fields, including finance, marketing,
strategic management and operations research for its ability to make explicit drivers of
performance (Banker, Hsi-Hui et al. 1993; Banker, Hsi-Hui et al. 1996; 1997; Banker and Brief
1999; Firer 1999; Rust and Keiningham 1999; Rust, Moorman et al. 2002).
Based on the IRR formula, the equity value can be further decomposed utilizing an adapted
variation of the Dupont formula, which offers additional insight into the value drivers of complete
transactions:
From Enterprise Value (EV) = Equity (E) + Net Debt (ND)
We receive E = EV – ND
Which is E = Sales x EBITDA margin x EBITDA multiple – Net Debt
EBITDA
Enterprise Value
Equity
The exact mathematical deduction from the simple Dupont formula is as follows:
Rev AROE =
A E
NI
Rev
= Profit Margin x Asset Turnover x Equity Multiplier
with
NI = Net income
Rev = Revenues
A = Assets
E = Equity
or
ROE = ROA x EM
= Return on Assets x Equity Multiplier
We shall consider Assets = Total Debt (D) + Market Value of Equity (E)
= Enterprise Value (EV)
and receive
Rev EVROE =
EV E
NI
Rev

Research Design and Methodology 54
As we are not interested in the (static) return on equity, but seek to determine the (dynamic) equity
appreciation between entry and exit of the buyout transaction under review, we divide both sides by
net income and take the reciprocal to obtain
EV EE = Re
Rev EVv
As we eventually want to display both, the sales and margin growth impact on IRR, we introduce
our operating earnings measure “earnings before interest, taxes, depreciation and amortization”
(EBITDA) by multiplying both sides by one, and receive
EBITDA EV EE =
Rev EBITDA EVRe v
In order to determine the (dynamic) IRR and analyze the value attribution of its constituents over
time, we build compounded annual growth rates (CAGRs) on both sides of the formula, and
receive
EBITDA(1+(CAGR(E)) = (1+(CAGR(Rev)))(1+(CAGR ))
Rev
EV E (1+CAGR( ))(1+(CAGR ))
EBITDA EV
with (1+CAGR(E)) being equivalent to 1+IRR(Equity). In order to receive an “addition format” for
the value-creating elements that decompose the equity IRR of the transaction, we need to take the
natural logarithm (ln) of the equation. In order to achieve the effect on 100% of the IRR, we then
need to divide both sides by the natural logarithm of 1+IRR(equity) to obtain
EBITDAln(1+(CAGR ))Revln(1+(CAGR(Rev)))100% = +
ln(1+(CAGR(E)) ln(1+(CAGR(E))
EV Eln(1+CAGR( )) ln(1+(CAGREVEBITDA + +
ln(1+(CAGR(E))
))
ln(1+(CAGR(E))
Each bracket now represents the value adding component of equity IRR that add up to 100% (pure
leveraged buyout value attribution analysis). By multiplying both sides with the equity IRR, we
find each factor’s contribution to the level of IRR, hence
EBITDAln(1+(CAGR ))
ln(1+(CAGR(Rev))) RevIRR (Equity) = IRR (Equity) +IRR (Equity)
ln(1+(CAGR(E)) ln(1+(CAGR(E))
EVln(1+CAGR( ))
EBITDA + IRR (Equity)
ln(1
Eln(1+(CAGR ))
EV+IRR (Equity)
+(CAGR(E)) ln(1+(CAGR(E))
or, in simpler terms
IRR (Equity) = Revenue growth effect (on IRR) + EBITDA margin effect (on IRR)
+ Multiple expansion effect (on IRR) + Leverage Effect (on IRR)

Research Design and Methodology 55
Alternatively, we can also determine the Dupont-enabled value decomposition based on enterprise
values only, i.e. without equity values, as long as we know the capital return multiple on the
transaction (i.e. equity capital received at exit from transaction divided by total equity capital
invested). Hence, neglecting leverage in the Dupont formula for a moment, and due to
EV = Revenues x EBITDA margin x (EV/EBITDA)
the EV multiple effect can be presented as a multiplication of factors between entry and exit, so we
receive
EV Multiple =
EV Rev EBITDA margin EV/EBITDAExit Exit Exit Exit = EV Rev EBITDA margin EV/EBITDA EntryEntry Entry Entry
In order to determine the impact of financial engineering, i.e. leverage and/or other amplification of
equity through debt pay down and other cash generation at target, we compare the total capital gain
multiple of the equity investment between entry and exit
Total Capital Gain Multiple = Return Multiple
= Value of Equity at Exit / Total Cost of Investment
=E
Exit
CostEntry
=
Hence, the leverage effect is determined by
Leverage Effect =
EExit
CostEntry
EVExit
EVEntry
Hence, the complete capital gain multiple must be equivalent to
EExit
CostE Rev EBITDA margin EV/EBITDAEntryExit Exit Exit Exit = EVCost Rev EBITDA margin EV/EBITDAExit EntryEntry Entry Entry
EVEntry
Similar to the equity IRR method above, we need to take the natural logarithm (ln) in order to
receive an “addition format” for the value-creating elements of the buyout transaction. In turn, we
index both sides by dividing by the natural logarithm of the capital gain multiple to obtain

Research Design and Methodology 56
EExit
CostEntry
lnEV Rev EBITDA margin EVExit Exit Exit ln ln ln
EV Rev EBITDA marginEntry Entry Entry
100% = + + +E E E
Exit Exit Exitln ln lnCost Cost Cost
Entry Entry Entry
/EBITDA ExitEV/EBITDA Entry
EExitln
CostEntry
which will result in the exact same value attribution results as with the deduction by equity IRR.
Correspondingly, the enterprise value approach can also be implemented with the compounded
annual growth formula, if applied equally to EV multiple constituents as well as total capital gain
multiple.
However, the limitation of this formula is that it only holds for utilization in a single event exit, i.e.
a single point of entry and exit from the business. In practice, there may be intermediate cash flows
into (additional investment) or from the buyout target (dividends, recapitalization). Moreover, exit
methods, such as an IPO, often involve a gradual divestment from the business with several share
placements of the buyout firm. Therefore, the value attribution formula would have to be further
extended to allow for these intermediate cash flow events. This, however, especially complicates
the computation of the leverage effect part of the formula (further proof omitted here). One solution
for any ex-post analysis is to apply an appropriate compounding growth rate to calculate the future
value (FV) of any intermediate cash flows at the time of exit, i.e. to receive a total value. The
applied interest rate could either be related to the IRR, an alternative investment, or the risk-free
rate.

Research Design and Methodology 57
3.5.5. Value Attribution Case Study – The University of St. Gallen Catering Company
The below case study has been developed to illustrate the theoretical deduction of the value
attribution formula through a practical example.41
Value Attribution in Leveraged Buyouts – Case Study
After a pro-longed period of underperformance, the University of St. Gallen Catering Company,
Inc. had been subject to a successful management buyout by the UNISG Student Buyout Capital
Fund in December 1999. After successful implementation of several value-enhancing strategies
through the fund (e.g. a “value for money” program), it was sold to a consortium of investors in
December 2003.
Question: How much value was created in this transaction and what were the value drivers
that generated the return for the student management buyout fund?
The following table is a summary of key financials of the St. Gallen University Catering
Company, Inc. at the time of acquisition and disposal:
St. Gallen University Catering Company, Inc. – Key Financials
in CHF ‘000, as of 31, December Entry Year = 1999 Exit Year = 2003 CAGR 99-03
Revenues 1,250 1,750 8.8%
EBITDA 125 225 15.8%
EBITDA margin 10.0% 12.9% 6.5%
Transaction multiple (EV/EBITDA) 5.0x 6.0x 4.7%
Cost of Investment/Equity Value 150 1,225 69.0%
Enterprise Value 625 1,350 21.2%
Total Net Debt 475 125 -28.4%
Equity Contribution 24.0% 91.7%
Solution
1. Determination of Enterprise Values into revenue, margin and multiple effect:
EVEntry = Revenues x EBITDA margin x Transaction entry multiple
= 1,250 x 10.0% x 5.0 = 625
EVExit
= Revenues x EBITDA margin x Transaction exit multiple
= 1,750 x 12.9% x 6.0 = 1,350
41 Setting, names and figures are purely fictious and not inspired by actual events.

Research Design and Methodology 58
Hence, the EV multiple effect can be presented as a multiplication of factors between entry and
exit, i.e.
EV multiple = Revenue multiple x Margin multiple x Multiple multiple
EV multiple = 1.40 x 1.29 x 1.20 = 2.16
As we want to achieve an equity IRR point of view, we have to take the compounded annual
growth rate between 1999 and 2003 (i.e. four year compounding), inherent in the multiple
growth, into account. Hence, taking the fourth square root results into
Annualized EV multiple = 1.09 x 1.06 x 1.05 = 1.21
2. Determination of financial engineering/ leverage effect, i.e. the amplification of equity
through cash generation/ debt pay-down at St. Gallen University Catering Company, Inc.
We determine the total capital gain multiple of equity stake from entry to exit
Capital gain = Value of Equity at Exit / Total Cost of Investment
Capital gain = 1,225 / 150 = 8.17
and by controlling for the compounded annual growth, we receive
Annualized Capital gain = 1.69
which, by subtracting by one, represents the equity IRR of 69% in the transaction.
Consequently, the leverage effect in the transaction must be
Leverage effect = Annualized Capital gain multiple / Annualized EV multiple
= 1.69 / 1.21 = 1.39
3. Analysis of value drivers in transaction
The total levered capital gain multiple, i.e. accounting for the leverage effect, is therefore
Levered capital gain multiple = 1.39 x 1.09 x 1.06 x 1.05 = 1.69
We take the natural logarithm in order to extract the value-adding elements that can be added up
ln(Levered capital gain multiple) = ln(leverage effect) + ln(sales effect)
+ ln(margin effect) + ln(multiple effect)
ln(Levered capital gain multiple) = 0.33 + 0.08 + 0.06 + 0.05 = 0.53
In order to get the effect for 100%, we index by the ln(Levered capital gain multiple) and receive
Indexed capital gain = 0.63 + 0.16 + 0.12 + 0.09 = 100%

Research Design and Methodology 59
Answer
The leveraged buyout of the St. Gallen University Catering Company, Inc. between 1999 and
2003 led to an annualized return of 69%. The decomposition of value drivers in the transaction is
as follows:
Effect % of total Contribution to IRR
Leverage effect 63% 43,7%
+ Revenue effect 16% 11,1%
+ Margin effect 12% 8,3%
+ Multiple effect 9% 6,0%
= Total Capital Gain effect 100% 69,0%
Multiple effect 9%
Margin effect 12%
Revenue effect
16%
Leverage effect
63%
Figure 9: Summary of Value Attribution in Buyout of the St. Gallen University Catering Company, Inc.

Research Design and Methodology 60
3.6. Empirical Approach
3.6.1. Private Equity Data Collection
There are several hypothetical sources of information on leveraged buyout transactions. First and
the most obvious, buyout firms could act as a direct source of information. However, Private
Equity firms generally are extremely reluctant to share any information about their transactions and
track record in order to avoid weakening their position in future deal negotiations, i.e. to reveal
information that could adversely affect current investment exit plans. Private Equity firms do
participate in surveys, but the amount of surveys received by these firms is large and makes a
selection process in light of their limited resources inevitable. Based on the author’s experience,
Private Equity firms will also be hesitant to disclose any financial information in these
questionnaires. Secondly, industry associations provide a valuable source of information on general
industry trends, but do not generally comment on individual transactions, their financial
performance or their member base.
Thirdly, there is a select group of Private Equity information providers such as Thomson Financial
Venture Economics (“VE”) that specializes in Private Equity return reporting. VE thereby acts as
an intermediary, collecting data from the majority of the world’s Private Equity funds and their
investments, and reports these in two ways to clients: (i) it provides summary reports for investors
(Limited Partners) on individual funds if the investor is an active investor in that particular fund,
and (ii) it provides fund performance benchmarks based on the collected universe of fund data to
the Private Equity community on an anonymous basis, i.e. no single fund performance is published,
but instead blended results based on a selected group/specification of funds. There are several other
providers of such professional reporting services, generally referred to as “gatekeepers”, which in
addition to reporting services also provide consulting services to Limited Partners, e.g. in order to
optimize those clients’ Private Equity fund investment strategies and/or due diligence processes.
Consequently, the one group that in particular has high quality access to the detailed reported
financial and return information on buyout funds is the funds’ investor base/Limited Partners,
either directly or indirectly (i.e. via VE or gatekeepers). However, confidentiality agreements
generally prohibit them from sharing data with other third parties. Figure 10 summarizes the flow
of financial reporting information in the Private Equity industry.
A final source of Private Equity information can be found in the public domain. First, there are
several publicly listed “Private Equity” funds, e.g. in the form of listed Investment Trusts that
publish information about their investments in their financial reporting. Secondly, another publicly
available source exists for “reverse LBO” transactions, i.e. public-to-private buyouts that have
subsequently been re-listed on the public market. Again, their obligatory historical financial
reporting requirements in their offering memoranda reveal some financial and strategic information
about the time the company had been taken private. However, reverse LBOs are not necessarily a
representative sample of all buyouts and the number of such limits the maximum sample size.

Research Design and Methodology 61
Furthermore, the critical “performance variable” IRR is not revealed and must be replaced by other
metrics of performance measurement, e.g. financial accounting ratios.
“Gatekeeper““Gatekeeper“
Limited
Partner B
Limited
Partner B
General Partner – Buyout FundGeneral Partner – Buyout Fund
Portfolio
Company A
Portfolio
Company A
Direct Financial
and Return
Reporting
Financial Reporting, Details on Corporate Activity
Portfolio
Company B
Portfolio
Company BPortfolio
Company E
Portfolio
Company EPortfolio
Company C
Portfolio
Company CPortfolio
Company D
Portfolio
Company D
Limited
Partner C
Limited
Partner CLimited
Partner D
Limited
Partner D
Private Equity
Information Provider
Private Equity
Information Provider
Limited
Partner A
Limited
Partner ALimited
Partner E
Limited
Partner E
Indirect Financial
and Return
Reporting
Indirect Financial
and Return
Reporting
Figure 10: Flow of Private Equity Financial Reporting Information
The data that builds the basis of this study was collected from two of the above-mentioned sources.
First, the author during his tenure as researcher at the INSEAD LBO Research Centre and
Thomson Venture Economics, New York, agreed on a far-reaching cooperation in research,
through which the author and his fellow LBO researchers gained access to the entire Venture
Economics Private Equity database for statistical research, however, on a fully anonymous basis:
no single investment, fund, or General Partner could be identified at any time in the project.
Nevertheless, the VE database presents the most detailed available information source on Private
Equity, including buyouts and Venture Capital transactions, to date. Secondly, the author during his
tenure and research involvement at the INSEAD LBO Research Centre signed confidentiality and
collaboration agreements with several Limited Partners, some of which are among the world’s
leading Fund of Funds investors in global Private Equity funds. A detailed overview of these data
sources is provided in the next sections.
3.6.2. The Venture Economics Database
The Thomson Venture Economics database is mainly intended to collect accurate fund returns of
global Private Equity funds.42 The database carries funds starting from 1967 until today (as of June
42 The author would like to thank Mr. Jesse Reyes, Head of Research, and Thomson Venture Economics,
New York, for generous access to their databases via the research collaboration.

Research Design and Methodology 62
2003), whereby the records of newly raised funds over the last decade have become increasingly
complete. Venture Economics (VE) records the amount and date of all cash flows, going in and out
of the respective fund. It also provides the aggregate quarterly book value of all unrealized
investments for each fund until June 2003. Cash flows recorded in the VE dataset reflect net returns
to Limited Partners (LPs), as cash flows from LPs to General Partners (GPs) (“take-downs”)
include all fee payments, and cash flows from GPs to LPs (“distributions”) are already reduced by
the carried interest and other charges. VE also collects information on the Private Equity
investments that each fund undertakes through its VentureXpert database. However, the various
cash flows associated to a single fund cannot be associated with individual transactions; the dataset
therefore does not yet allow calculating accurate deal IRRs (i.e. for outside researchers, without the
appropriate VE knowledge regarding allocation to anonymous portfolio companies). Nevertheless,
there is highly valuable information that can be utilized from the VentureXpert database that offers
insights into the nature of transactions undertaken by a certain fund. The basic information used
from this dataset is for example the company’s VE industry code, which allows a classification of
transactions according to their industry source, amounts invested in each company, and entry/exit
dates of each investment. Based on this information on the company level and the accurate cash
flow based fund IRR calculations, this study will combine these two datasets to draw some basic
conclusions about returns. The following table provides an overview of the size of the VE database:
Fund Specialization Fund Focus No. of Funds Observation Period Source43
Private Equity
Global Global
Europe only Europe only
17,993 10,705
3,855 2,378
All 1968-2003 1990-2000
All 1968-2003 1990-2000
Thompson Financial Venture Economics
Buyout-related
Global Global
Europe only Europe only
4,041 2,288
779536
All 1968-2003 1990-2000
All 1968-2003 1990-2000
Thompson Financial Venture Economics
Buyout44
Global Global
Europe only Europe only
Study’s sample
1,454 993290214802
All 1968-2003 1990-2000
All 1968-2003 1990-2000 1980-2003
Thompson Financial Venture Economics
Table 4: Private Equity Funds and Buyout Funds – Total Population Overview
The total number of Private Equity funds in the Venture Economics database as of March 2003 was
17,993. As this study focuses on leveraged buyouts, a further classification of this total number is
necessary. The amount of buyout-related and pure buyout funds was 4,041 and 1,454 respectively.
The proportion of European Private Equity funds in the database is considerably lower, with only
approximately 21%. The average number of deals for buyout-related and pure buyout funds has
43 Thompson Financial Services, Venture Economics Private Equity fund database, as of March 2003.

Research Design and Methodology 63
been 4.4 and 5.5 respectively between 1968 and 2003, acknowledging that the average deal size
and number of deals per fund has increased substantially over recent years (see results section
4.2.1.3.). The provided dataset in this study is limited to 802 U.S. and European buyout funds
between 1980 and 2003. The below table summarizes the universe of underlying transactions for
the two relevant buyout categories in the VE database:
Target Company
Categorization Company Location No. of Deals Observation Period Source45
Buyout-related
Global Global
Europe only Europe only
17,611 12,523
4,646 3,459
All 1968-2003 1990-2000
All 1968-2003 1990-2000
Thompson Financial Venture Economics
Buyout
Global Global
Europe only Europe only
7,992 4,438 2,136 1,438
All 1968-2003 1990-2000
All 1968-2003 1990-2000
Thompson Financial Venture Economics
Table 5: Buyout Funds’ underlying Deals – Total Population Overview
The dataset available for this study included 64,490 Private Equity transactions based on 27,739
companies, which involved 134,640 investments by various funds, between January 1980 and June
2003. These figures suggest that several companies saw several transactions, which particularly
applies for companies that are subject to Venture Capital transactions. These companies generally
undergo several financing rounds, each of which counts as one transaction in the VE database. On
the buyout side, companies may also undertake secondary buyouts or other financing events. The
study’s sample includes 9,636 buyout (BO) fund transactions, 51,995 Venture Capital (VC) fund
transactions and 2,859 others, which will represent the basis of the analysis. The below table
summarizes the Venture Economics dataset sample used in this study.
Buyout Funds Venture Capital
Funds Other Funds
Total Private
Equity Funds
Number of Investments 17,954 77,437 39,249 134,640
Number of Companies46 N/A N/A N/A 27,739
Number of Deals 9,636 51,995 2,859 64,490
Figure 11: Study’s Venture Economics Sample Overview (January 1980 – June 2003)
44 The “Buyout” category is held more restrictive in the definition of a pure buyout, while “Buyout-related”
funds may also invest in other investment stages of the company or engage in alternative financing forms. 45 Thompson Financial Services, Venture Economics Private Equity fund database, as of March 2003. 46 Due to the fact that companies received investments from different types of funds in a single transaction,
the sum of each category of “number of companies” that received investments from the various fund types would necessarily be larger than the actual total (double-counting) and has therefore been omitted here.
Research Design and Methodology 64
It should be noted that the Venture Economics database in this study only serves as secondary data
source. The main reasons for analysis of the above outlined data in this study is (i) to provide a
performance benchmark and total population control group to the primary dataset selected for the
INSEAD LBO Research database, and (ii) to perform analysis and to present descriptive statistics
and results on so far unpublished data in this format. However, the Venture Economics database
has several limitations. Firstly, the return data (IRRs) are only recorded on a buyout fund level, not
on a deal level, which makes an in-depth analysis of the potential sources of value creation
impossible. The presented statistics in this study therefore focuses on fund returns and uses these
also as a very rough proxy for individual investments (see section 4.2.2.6. and following for proxy
return analysis). Secondly, while the database contains several thousand buyout investments, it
captures only a limited number of variables on each of these transactions (e.g. date, location,
industry, investment stage, acquirer, etc.). Thirdly, the database also does not provide financial
information about individual transactions, no details about value creation strategies at portfolio
companies and no information about the investment managers and General Partner firm
undertaking the transaction. Consequently, the data is very valuable for the above outlined
purposes, but not fully adequate to support this study’s research model.
3.6.3. The INSEAD LBO Research Database
In addition to the dataset from Private Equity information provider Venture Economics, which
represents a near proxy to the total global population of recorded Private Equity data, the author
during his tenure as researcher at the INSEAD LBO Research Centre has collected a second unique
dataset of over 3,000 Leveraged Buyout transactions undertaken by 84 buyout-focused Private
Equity firms, drawn from 252 of these firms’ funds between 1973 and 2003, with the majority of
recorded transactions taking place during the 1990s. These buyouts took place across a variety of
industries and over half of the recorded transaction has been realized (56.1%). The data contains
characteristics of (i) the investing General Partner (including prior buyout track record), (ii)
individual portfolio companies (including information regarding industry category, geographic
location) and (iii) buyout transactions (including the size of the investment, entry and exit year,
type and mode of in- and divestment, investment performance, to a lower degree strategic events,
etc.). Based on this data source – the first of such breadth and depth – this study attempts to
establish the missing link to deal-level performance and its sources of value creation.
Data is mainly derived from the records several large institutional investors in Private Equity funds
in Europe and the U.S., referred to as “the Limited Partners”47. The research partners are among the
47 Limited Partners in the Limited Liability Partnerships provide the capital for equity investments of the
buyout association (typically pension funds, large financial institutions, and specialized fund of funds

Research Design and Methodology 65
world’s largest investors in Private Equity funds and manage commitments to such funds in the
size of several billion US$. As a condition for obtaining the data, the research agreements foresee
to neither identify the Limited Partners nor the names of the General Partners, their respective
underlying funds and portfolio investments in the dataset. The dataset represents both investments
undertaken by the Limited Partners as part of their Private Equity Fund of Funds activities as well
as randomly selected Private Placement Memoranda (PPMs) from the large archives of the Limited
Partners. These PPMs are constantly being made available to Limited Partners by General Partners
on a global basis in their efforts to raise new capital (i.e. new funds). Each of these institutions
(LPs) screens several hundred newly raised buyout funds every year during their due diligence
process48. The size of available data can be considered unique as the Limited Partners due to their
significant influence and size receive almost the entire universe of PPMs that are being distributed
for fundraising purposes in the U.S. and Europe, hence providing a very good proxy for the total
population of Private Equity funds.
Most of the information on buyout firms and transactions in this study has been extracted from
Private Placement Memoranda, an offering document, in which Buyout Firms describe their
previous transactions for fundraising purposes49. PPMs submitted from buyout firms are used by
potential investors to assess quality and strategy of the General Partner. Typically, PPMs contain
information about the complete investment track record, i.e. a chronological list of all buyout
investments including selective information on individual transactions. As a consequence of the
confidential nature of PPMs, all information has been “sanitized”, i.e. the names of General
Partners, Limited Partners and portfolio companies have been replaced by numeric codes prior to
the entering the data into the database.
With respect to the depth of the sample, it can be stated that the data is highly heterogeneous as
each General Partner chooses his own level of transparency and disclosure of sensitive information
in the PPM. The information about fund investments provided by the group of Limited Partners has
proven to be available in much broader depth, since additional information requests to the General
Partner during the Limited Partners’ fund due diligence phase have generated valuable insight
information.50 Furthermore, Limited Partners commonly performs auxiliary sophisticated analysis
to the data presented in the PPMs, e.g. revaluing unrealized investments in the General Partners’
investors). They collect a large amount of information on buyouts associations in the context of their “fund due diligence” and investment process.
48 Many of these are newly established “first-time funds” and hence do not report any track record of prior transactions in their PPM. These funds are consequently not useful for the research goals in this study.
49 The fact that PPMs are marketing instruments leads to the expectation that buyout transaction, and especially the role of the General Partner, will be systematically presented in an overly positive fashion. Although there are industry guidelines to the presentation of financial information, this fact has to be kept in mind when interpreting results of this study.
50 The General Partners differentiate in their level of initial disclosure to Limited Partners. Generally, only in case a Limited Partner shows serious interest in the fund investment opportunity and initiates further due diligence, the General Partner will submit an extended due diligence package to the Limited Partner, which supplements the PPM with far-reaching background information on each transaction undertaken, financial information, etc.

Research Design and Methodology 66
portfolio, commonly using multiple valuation techniques. Data collection from these vast
documents was achieved through an intense and time-consuming effort by the author and a
dedicated team of supporting research assistants, which transformed the heterogeneous data
provided by the Limited Partners as well as in the PPMs into a standardized database. To the best
of the author’s knowledge, no published study in academic research exists in which detailed
information (including performance and portfolio company characteristics) has been used across a
similarly large sample of buyouts. The following table provides an overview of the primary sample
in this study:51
Primary Data Overview
U.S. Buyouts European Buyouts Total Buyouts
Realised Unreal. All Deals Realised Unreal. All Deals Realised Unreal. All Deals
Number of Deals (N) 682 459 1,145 403 356 759 1,688 1,316 3,009
Minimum IRR (%) -100.0% -100.0% -100.0% -100.0% -100.0% -100.0% -100.0% -100.0% -100.0%
Maximum IRR (%) 472.0% 437.4% 472.0% 466.0% 401.0% 466.0% 478.1% 437.4% 478.1%
Mean IRR (%) 55.5% 21.5% 42.0% 59.5% 7.3% 35.0% 52.8% 9.3% 33.8%
StDev of IRR (%) 89.8% 69.9% 84.0% 82.4% 58.6% 76.8% 87.6% 63.3% 80.8%
Variance of IRR (%) 80.6% 48.8% 70.6% 68.0% 34.4% 58.9% 76.7% 40.0% 65.3%
Industry Distribution
(N, IRR)
Basic Industries 48
57.6% 49
12.8% 97
35.0% 28
52.9% 32
-1.3%60
24.0% 123
55.2% 103
7.6% 226
33.5%
Cyclical Consumer
Goods
4347.4%
331.8%
7627.6%
2441.5%
264.8%
5022.4%
11639.6%
864.5%
20224.7%
Cyclical Services 93
48.4% 101
20.7% 195
34.9% 91
50.3% 61
2.9% 152
31.3% 234
11.9% 284
47.0% 519
31.5%
General Industrials 54
70.9% 40
19.3% 94
48.9% 49
65.2% 37
-6.1%86
34.5% 172
57.1% 120
4.4% 292
35.5%
Information
Technology
34131.3%
2732.7%
6187.6%
5294.3%
786.2%
13041.5%
10898.5%
1314.6%
23947.0%
Non-cyclical
Consumer Goods
8452.9%
6149.5%
14851.7%
7762.7%
658.9%
14238.1%
23552.5%
15622.6%
39440.7%
Non-cyclical Services 20
78.6% 13
50.0% 33
67.3% 17
91.1% 13
41.1% 30
69.4% 56
89.6% 40
31.8% 96
65.5%
Resources 80
36.0% 31
-4.0%111
24.8% 4
3.0% N/A
43.0%
9938.9%
41-2.2%
14026.9%
Financials 30
49.7% 22
30.7% 52
41.7% 6
35.1% 8
34.7% 14
34.8% 61
52.8% 43
34.2% 104
45.1%
Utilities 4
43.8% 1
27.7% 5
40.5% N/A N/A N/A
443.8%
127.7%
540.5%
N/A192
50.4% 82
14.7% 274
39.7% 55
40.3% 36
19.2% 91
32.0% 430
44.9% 361
2.7% 792
25.7%
Table 6: Limited Partners’ Primary Dataset Overview
51 Note that the classification in this table includes realized and unrealized buyouts from the U.S. and Europe.
For interpretation purposes (e.g. with respect to mean IRR), the total buyouts column also includes deals, which could not be clearly classified into either the category for U.S./Europe (for example buyouts from other regions) or realized/unrealized (not announced).

Research Design and Methodology 67
3.6.4. Sample Comparison and Mean Comparison Test
It is difficult to assess, how representative the above described primary sample of leveraged buyout
funds and transactions is compared to the entire universe. This is due to the confidential nature of
buyout investments and as a result of the fact that even some very basic characteristics of the
overall population are unavailable. One solution though is to make some inference about the
sample characteristics by comparing it to the largest available database on buyout funds,
VentureXpert, managed by Thomson Financial Venture Economics (see section 3.6.2.). This
database provides aggregate performance information on a sample of 802 U.S. and European pure
buyout funds. As of June 30th, 2003, the average (pooled) net internal rate of return (IRR) on these
funds has been 12.3% for U.S. funds and 13.1% for European Funds, which compares to a (fund-
size weighted) gross IRR of 24.2% for the primary sample in this study, which includes 252 Funds.
The comparison of the number of funds suggests that the study’s sample contains over 30% of the
universe of buyout funds.
A large portion of the difference in the IRR figures between the primary sample and the Venture
Economics sample stems from the fact that the Venture Economics figures are net of management
fees and carried interest52, while the primary sample’s IRR represents gross returns. At the same
time, however, this study’s sample may be biased towards top-performing buyouts firms. On the
one side, the selection of the dataset from the outset was designed to avoid survivorship bias as (i)
all of the recent investments made by the Limited Partners, on which information was available,
have been included in the sample, and (ii) buyout General Partners have been selected randomly to
extend the sample. Nevertheless, on the other side survivorship bias could potentially arise
indirectly from the two above mentioned sources, because (i) the selection criteria for investments
made by the Limited Partners in buyout funds are particularly strict and generally do not involve
“first-time” funds; no proven track record of these funds is available that could be verified during
the due diligence phase in order to support a relatively risky first-time fund investment decision53,
and (ii) the selection of suitable documents among the universe of electronically stored PPMs has
intentionally been shifted towards General Partners with a longer investment history for the
purpose of creating this study’s main sample database most efficiently. This approach also not only
permits for greater depth of presented data, but also allows for essential time-series and cross-
52 Carried interest represents the share of return on invested equity capital beyond a certain hurdle rate,
generally between 8-12 per cent, which the Limited Partners agree to pay to the General Partner as incentive fee. Carried interest is generally set at 20 percent as an industry standard. In addition, the General Partner charges a yearly management fee from the Limited Partners of typically about 2% of the capital committed and/or invested to the buyout association.
53 Ljungqvist & Richardson (2003) discount this possibility of selection bias, as they are not convinced that a Limited Partner has extraordinary fund-picking abilities (in line with efficient market theory). They also argue that the Limited Partner, often a large financial services firm, may have an interest to sell other (investment) banking products to the General Partner and/or its portfolio companies alongside its investment. This may explain some degree of skewness towards larger funds that in turn undertake large buyout transactions, but not necessarily towards better performing ones. Among the data supportive

Research Design and Methodology 68
sectional analysis of performance, e.g. measuring the influence of increases in fund size and hence
available capital on performance as well as the GP team dynamics over time (see empirical chapter
two). However, this sample selection procedure also implies that the sample may to some extent be
skewed towards larger and more successful funds that have been in the business for a longer time.
As a consequence of this research design, we can assume that only buyout firms, who relatively
successfully managed their first fund, would be in a position to send PPMs to raise money for a
subsequent fund. Hence the worst-performing buyout associations may either not attempt or
succeed in raising subsequent funds, and hence their buyout investments would be excluded from
the sample. Furthermore, as mentioned earlier, it needs to be considered that PPMs on the one side
are (legally) approved, often partially audited offering documents, but on the other side also
marketing instruments, which may result in some bias from the self-reported nature of the
information they contain.54 Finally, there may be some level of selection bias from the fact that the
Limited Partners may not necessarily receive all PPMs and only a subset of the total available data
could be codified. The overall upward bias in the Limited Partners’ data, however, is considered to
have only limited consequences in the context of this study, as the primary objective of this study is
to explain variation and relative trends across buyout investments. In other words, it is not the
intention of this study to assess the overall average level of risk- and market-adjusted returns of
buyout investments or the Private Equity investment asset class as a whole (although these points
will be touched upon). Instead, the foremost intention of this study is to make explicit sources of
value creation that led to particular levels of performance in leveraged buyouts.
As a consequence of the above described procedure of data collection for the purposes of this study,
a comparison of means highlights the mentioned differences. An independent means test shows that
the average means differ considerably between the Venture Economics control population and the
Limited Partners’ dataset, with 17.5% and 33.8% respectively. The sample for comparison has
been chosen according to the following methodology. Among the 802 Buyout-focused funds in the
Venture Economics database (whole population), only those have been selected that were declared
as fully liquidated, as otherwise very recent funds with much lower performance from paid out
investments would have been included. 55 This resulted in 102 liquidated funds, which is the
methodologically correct, however, comparatively low number given the overall original
population. The Limited Partners’ dataset does not represent reported but calculated fund returns,
which are based on each fund’s underlying individual transactions’ performance. The initial
weighted average returns had to be further adjusted for carried interest and management fees in
order to compare them with the reported net fund returns of Venture Economics. The following
methodology has been used to make this approximating transformation:
Limited Partners in this study are also large global financial organizations that could have an interest to sell other products.
54 This becomes transparent in particular with respect to valuation of unrealized investment. See section 4.3.2.2. for a discussion.

Research Design and Methodology 69
1
. . . .
, 1 + 1 - - Hold. Per. Mgmt fee = 1
Hold Per Hold Per
Gross Wgt
Net
Avg Inv Cap Fund IRR Carried Interest Avg Inv Cap
Fund IRRAvg Inv Cap
The above formula in the denominator determines appreciated equity capital value based on gross
weighted fund IRR, which has been calculated on the fund’s individual transactions, then adjusts it
for carried interest (assumed 20% as an industry norm) and subtracts the management fee (assumed
only on invested, not committed capital) over the average holding period. Through a standard IRR
formula, adjusted net fund returns are finally being calculated, which are lower than the gross
weighted average. Several of the 252 funds had been excluded, because there was an incomplete
and/or too low amount of transactions available for codification, which would have distorted fund
returns. The results of the independent samples test outlined below demonstrate that there is a
considerable difference in means between the net buyout fund return captured in the Venture
Economics database and the Limited Partners’ dataset, with 17.5% and 33.8% net average IRR
respectively. In addition, especially the standard deviation of returns appears to be higher for the
Limited Partners’ dataset with 69.2% compared to the lower 31.4% for Venture Economics.
Group Statistics Fund IRR Source N Mean Std. Deviation Std. Error Mean
Fund IRR Venture Economics 102 17,541 31,375 3,107
Fund IRR Limited Partners’ Data
190 33,798 69,159 5,017
Table 7: Mean Comparison Test – Group Statistics Summary
Independent Samples Test
Levene’s Test
for Equality of
Variances
t-test for Equality of Means
F Sig. t Df Sig. (2-
tailed)
Mean
Difference
Std. Error
Difference
95% Confidence Interval
of the Difference
Lower Upper
Fund
IRR
Equal variances
assumed 13,924 ,000 -2,252 290 ,025 -16,257 7,220 -30,469 -2,0462
Fund
IRR
Equal variances
not assumed -2,755 283,674 ,006 -16,257 5,901 -27,873 -4,641
Table 8: Mean Comparison Test – Independent Samples Test Results
The differences in the underlying datasets become more obvious when interpreting the results for
the independent samples test. The Levene’s Test for the Equality of Variances under the scenario of
equal variances assumed is highly significant, which in fact means that the underlying variances
differ and are not comparable. The overall significance of the model is high as well at the 0.05 level.
The difference in means and especially variance can be the result of several factors. First, the
remaining methodological differences with regard to computation of returns, which are cash flow
based for Venture Economics and based on gross performance for the Limited Partners’ data, may
lead to higher variance for the Limited Partners’ dataset. Secondly, as outlined in the above
discussion it must be expected that there is a certain degree of survivorship bias as a result of the
clearly better performing funds in the Limited Partners’ dataset. As a consequence, from a
55 The mean net fund IRR on this larger sample is only 6.1%, with a standard deviation of returns of 34.5%.

Research Design and Methodology 70
statistical point of view the results on the Limited Partners’ sample in this study have to be
interpreted with care at all times, or in other words, conclusions from the results in this study with
respect to the total population of buyout funds can only be made for observed relative trends of the
individually reviewed variables, but not necessarily with respect to its absolute level of returns,
which by tendency will be higher.
3.6.5. Other Data Sources
Alongside the enduring primary LBO data collection and database codification, the database was
complemented by financial and performance benchmark data from Thomson Financial Datastream
(“Datastream”). During the database information coding of the Limited Partners’ data, an industry
classification of each LBO transaction has been assigned. This effort allows making subsequent
analysis of performance differences across industries. In essence, by assigning each transaction an
industry code the database can generate (i) a benchmark stock market performance over the exact
holding period of the underlying buyout investment from entry to exit, and (ii) an output of the
industry’s average financial accounting performance, e.g. average industry sales growth, margin
growth, etc. This permits benchmarking of the buyout’s IRR and financial performance against the
industry, thereby making explicit any out-performances. Secondly, the industry benchmark
contributes to understanding to what extent buyout returns are exogenously driven by industry
performance.
The industry classification has been based on Datastream’s industry codes, which are available and
grouped on several aggregation hierarchies. At the highest level of detail (referred to as Level 6),
this classification includes 96 different industries. On two further less detailed, more aggregated
levels, the classification distinguishes between 35 industries (Level 4) and 10 industries (Level 3)
respectively. The classification of transactions during the data input phase has been mainly carried
out on Level 6, which ensures an unprecedented high level of comparability for a benchmarking
analysis between comparable public markets (industry indices) and actual transaction performance
(compared to a simple stock market performance). Not surprisingly, the Level 4 and especially the
Level 3 aggregation provide for better possibilities of presentation and interpretation of general
industry trends, while the high level of detail in the Level 6 categorization reveals for instance
preferred and successful niche industries targeted by General Partners. Due to the direct
hierarchical interdependency of all three levels, a classification on Level 6 automatically classifies
the transaction within its respective Level 4 and Level 3 categories (please see tables 9 and 10 for
details).

Research Design and Methodology 71
Industries - Level 3 Industries - Level 4 Code Industry Description Code Industry Description
BASIC BASIC INDUSTRIES AERSP AEROSPACE & DEFENCE
CYCGD CYCLICAL CONSUMER GOODS AUTMB AUTO & PARTS
CYSER CYCLICAL SERVICES BANKS BANKS
GENIN GENERAL INDUSTRIALS BEVES BEVERAGES
ITECH INFORMATION TECHNOLOGY CHMCL CHEMICALS
NCYCG NON-CYCLICAL CONSUMER GOODS CNSBM CONSTRUCTION & BUILDING MATERIALS
NCYSR NON-CYCLICAL SERVICES DIVIN DIVERSIFIED INDUSTRIALS
RESOR RESOURCES ELECT ELECTRICITY
TOTLF FINANCIALS ELTNC ELECTRONIC & ELECTRICAL EQUIPMENT
UTILS UTILITIES ENGEN ENGINEERING & MACHINERY
FDRET FOOD & DRUG RETAILERS
FOODS FOOD PRODUCER/PROCESSORS
FSTPA FORESTRY & PAPER
HHOLD HOUSEHOLD GOODS & TEXTILES
HLTHC HEALTH
INFOH INFORMATION TECHNOLOGY & HARDWARE
INSUR INSURANCE
INVSC INVESTMENT COMPANIES
LESUR LEISURE + HOTELS
LIFEA LIFE ASSURANCE
MEDIA MEDIA & ENTERTAINMENT
MNING MINING
OILGS OIL & GAS
PERSH PERSONAL CARE & HOUSEHOLD APPLICATIONS
PHARM PHARMACEUTICALS & BIOTECHNOLOGY
RLEST REAL ESTATE
RTAIL RETAIL, GENERAL
SFTCS SOFTWARE & COMPUTER SERVICES
SPFIN SPECIALITY & OTHER FINANCE
STLOM STEEL & OTHER METALS
SUPSV SUPPORT SERVICES
TELCM TELECOM SERVICES
TOBAC TOBACCO
TRNSP TRANSPORT
UTILO OTHER UTILITIES
Table 9: Datastream Industry Classifications (Level 3, Level 4)
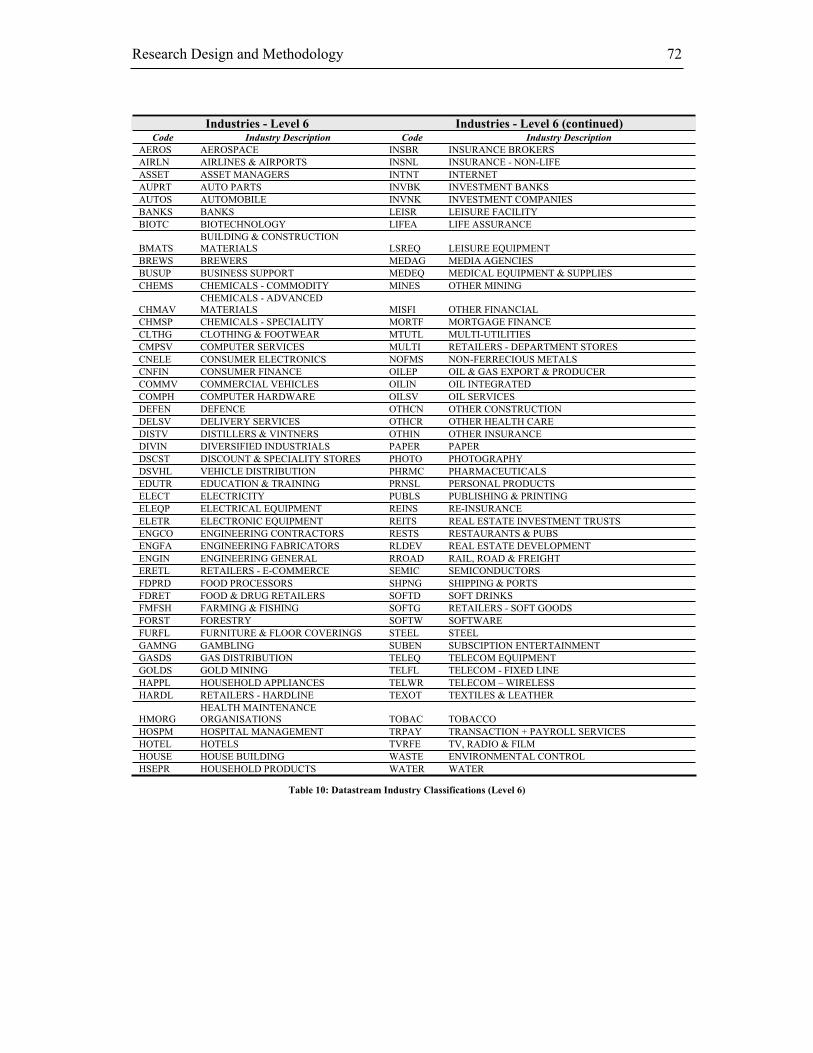
Research Design and Methodology 72
Industries - Level 6 Industries - Level 6 (continued) Code Industry Description Code Industry Description
AEROS AEROSPACE INSBR INSURANCE BROKERS
AIRLN AIRLINES & AIRPORTS INSNL INSURANCE - NON-LIFE
ASSET ASSET MANAGERS INTNT INTERNET
AUPRT AUTO PARTS INVBK INVESTMENT BANKS
AUTOS AUTOMOBILE INVNK INVESTMENT COMPANIES
BANKS BANKS LEISR LEISURE FACILITY
BIOTC BIOTECHNOLOGY LIFEA LIFE ASSURANCE
BMATS BUILDING & CONSTRUCTION MATERIALS LSREQ LEISURE EQUIPMENT
BREWS BREWERS MEDAG MEDIA AGENCIES
BUSUP BUSINESS SUPPORT MEDEQ MEDICAL EQUIPMENT & SUPPLIES
CHEMS CHEMICALS - COMMODITY MINES OTHER MINING
CHMAV CHEMICALS - ADVANCED MATERIALS MISFI OTHER FINANCIAL
CHMSP CHEMICALS - SPECIALITY MORTF MORTGAGE FINANCE
CLTHG CLOTHING & FOOTWEAR MTUTL MULTI-UTILITIES
CMPSV COMPUTER SERVICES MULTI RETAILERS - DEPARTMENT STORES
CNELE CONSUMER ELECTRONICS NOFMS NON-FERRECIOUS METALS
CNFIN CONSUMER FINANCE OILEP OIL & GAS EXPORT & PRODUCER
COMMV COMMERCIAL VEHICLES OILIN OIL INTEGRATED
COMPH COMPUTER HARDWARE OILSV OIL SERVICES
DEFEN DEFENCE OTHCN OTHER CONSTRUCTION
DELSV DELIVERY SERVICES OTHCR OTHER HEALTH CARE
DISTV DISTILLERS & VINTNERS OTHIN OTHER INSURANCE
DIVIN DIVERSIFIED INDUSTRIALS PAPER PAPER
DSCST DISCOUNT & SPECIALITY STORES PHOTO PHOTOGRAPHY
DSVHL VEHICLE DISTRIBUTION PHRMC PHARMACEUTICALS
EDUTR EDUCATION & TRAINING PRNSL PERSONAL PRODUCTS
ELECT ELECTRICITY PUBLS PUBLISHING & PRINTING
ELEQP ELECTRICAL EQUIPMENT REINS RE-INSURANCE
ELETR ELECTRONIC EQUIPMENT REITS REAL ESTATE INVESTMENT TRUSTS
ENGCO ENGINEERING CONTRACTORS RESTS RESTAURANTS & PUBS
ENGFA ENGINEERING FABRICATORS RLDEV REAL ESTATE DEVELOPMENT
ENGIN ENGINEERING GENERAL RROAD RAIL, ROAD & FREIGHT
ERETL RETAILERS - E-COMMERCE SEMIC SEMICONDUCTORS
FDPRD FOOD PROCESSORS SHPNG SHIPPING & PORTS
FDRET FOOD & DRUG RETAILERS SOFTD SOFT DRINKS
FMFSH FARMING & FISHING SOFTG RETAILERS - SOFT GOODS
FORST FORESTRY SOFTW SOFTWARE
FURFL FURNITURE & FLOOR COVERINGS STEEL STEEL
GAMNG GAMBLING SUBEN SUBSCIPTION ENTERTAINMENT
GASDS GAS DISTRIBUTION TELEQ TELECOM EQUIPMENT
GOLDS GOLD MINING TELFL TELECOM - FIXED LINE
HAPPL HOUSEHOLD APPLIANCES TELWR TELECOM – WIRELESS
HARDL RETAILERS - HARDLINE TEXOT TEXTILES & LEATHER
HMORG HEALTH MAINTENANCE ORGANISATIONS TOBAC TOBACCO
HOSPM HOSPITAL MANAGEMENT TRPAY TRANSACTION + PAYROLL SERVICES
HOTEL HOTELS TVRFE TV, RADIO & FILM
HOUSE HOUSE BUILDING WASTE ENVIRONMENTAL CONTROL
HSEPR HOUSEHOLD PRODUCTS WATER WATER
Table 10: Datastream Industry Classifications (Level 6)

Research Design and Methodology 73
3.7. Research Methodology and Data Analysis
3.7.1. Research Methodology Discussion
It is generally acknowledged that the real world is too amorphous - and thus the nature of scientific
research too diverse - to justify a single best scientific method (National Academy of Science 1989).
The nature of scientific research itself is subject to diverging categorizations and definitions. Black
(1999) distinguishes between empirical and non-empirical approaches as basis for understanding
and decision making in social sciences. He stresses the value of systematic observations to reach
more valid explanations and theoretically supported decision-making. The general categorization
for scientific research methodologies has been the distinction between quantitative research and
qualitative research. However, Miles and Huberman (1994) stress the importance of a linkage of
both approaches in order to achieve more valid overall results, thus following the objective of
contributing to theory. This study is mainly based on empirical tests through quantitative analysis,
but following Miles and Huberman (1994), it seeks to include a high degree of qualitative
discussion around the observed results.
The choice of research methodology depends on the research question (Bortz and Döring 1995;
Flick, von Kardorff et al. 2000). The research question in turn is determined by the current state of
research in the chosen research area. Along these lines, Yin (1994) has emphasized the dependency
of the research strategy on three conditions, including the type of research question, the level of
researcher control and the extent of focus on contemporary versus historical events. According to
Bortz and Döring (1995), it can generally be distinguished between explanatory and exploratory
research questions. The latter especially applies to un- or less researched areas as the initial goal is
to give exploratory orientation to the research field, rather than following specific hypotheses
(Bortz and Döring 1995). The question of testing hypotheses can therefore be considered
“secondary” in very exploratory studies. The first research question in this study is clearly a “what”
question and features exploratory character. It asks for the detailed characteristics – value creation
drivers – that have led to the actual events (buyout performance). The second research question is
of similar nature, specifying the key areas of focus in this study. In order to answer these questions,
both qualitative and quantitative methods would be applicable to gain insights in relationships and
independent variables. The focus to answer these questions in this study will be on quantitative
analysis as the author believes that this methodology allows narrowing down the relative
importance of constructs and variables and thereby opens the door for potentially more in-depth
future (qualitative) research. The third research question is designed to take the causality chain
further and to interpret the findings with respect to recommendations to practice. The question
involves both a “what” and “how” part and is therefore of both exploratory and explanatory nature.
This question therefore recommends an in-depth analysis of the results across all three parts of the
study from a practitioner view.

Research Design and Methodology 74
Quantitative data analysis generally serves as a mean in understanding basic patterns and
relationships across a large “quantity” of cases. By concentrating on a large number of cases, the
peculiarities of individual phenomena are traded off against a purified image and a condensed
pattern for generalization. However, as laid out by the research model, this study is designed to be
“inquisitive” to the extent possible through quantitative research by following a macro to micro
approach in analysis. On the macro level, exogenous factors of value creation such as market and
industry conditions are analyzed. On a more micro level, the role of the GP firm will be tested with
respect to understanding the extent to which it is able to take advantage of market situations and
through what characteristics it may contribute to the value creation process. On the most micro
level in this study, strategic actions on a reduced number of cases are tested. The dependent
variable IRR as measure for buyout performance and proxy for value creation in this study remains
the same and represents the object of the investigation (effect) throughout all three parts, while the
independent variable(s) that are defining the cause of the variation in the dependent variable differ
and are grouped according to the test settings in each part.
A lower number of independent variables usually increase the validity of generalization and the
ultimate goal of any quantitative analysis is to measure high correlation to describe a pattern of
covariation between two measurable variables. However, this study is intended to be a conceptual
framework to describe sources of value creation; hence the amount of variables is intentionally
high. However, the grouped test settings as well as the variable and data reduction steps serve to
achieve this goal. The overriding objective of any quantitative research design is also to achieve
high reliability and validity in the results. Firstly, concerning the study’s reliability with respect to
choice of (quantitative) research instrument, the results of this study are considered to be replicable
with a similar population of buyout transactions and under a similar methodology any time.
Secondly, in order to be replicable and merited for generalizations in a theory-building process,
validity of the quantitative analysis is crucial (Brinberg and McGrath 1982). The study’s internal
validity with respect to achieving a clear causal relationship and control of all potential contributing
variables has been ensured through Private Equity industry expert interviews, in which the test
settings were discussed and variable reduction achieved. Proof of external validity is more
complicated. The sample under investigation has been analyzed under neutral conditions, i.e. the
data has been collected, codified in the database and was subsequently tested. In addition, the ex-
post view, also of the broadly used public market data, ensures a neutral setting. The second
condition of external validity, in which the study’s sample should be representative and stable in
situation and time (Black 1999), can overall be agreed to as well. It must be acknowledged,
however, that historical trends for leveraged buyouts found for the period under investigation,
1980-2003, may not equally hold in the future given the fundamental changes in the Private Equity
industry at this time. Construct validity prevails if one measure is correlated with another in the
same construct, thus entailing generalizability of the construct across measures or methods (Weber
1994). Each construct tested in the outlined research model contains a selective group of variables.
As the empirical results and correlation matrices will demonstrate, there is a high level of construct
validity prevailing: the selection of variables is at the outset often highly correlated within a

Research Design and Methodology 75
construct, so in order to obtain meaningful statistical results and to avoid multicollinearity effects,
variables have subsequently been further reduced.
Waters (1998) sees the inherent justification of the role of statistics in the social sciences within the
fact that most real world situations are not deterministic in nature, but are rather determined by
uncertainty and have a stochastic and probabilistic character. Similar to the large field of study of
merger and acquisition performance, the study of leveraged buyouts is a classic example of high
degree of uncertainty and complexity of contributing factors. As a consequence, this study to a
large extent applies multivariate statistical data analysis. In accordance with Hair, Anderson et al.
(1998), multivariate analysis generally refers to all statistical methods that simultaneously analyze
multiple measurements on each individual or object under investigation. It is the logical extension
of uni- and bi-variate quantitative research, which is more suitable for a limited amount of variables.
Through this chosen methodology and its complex research design, the author seeks to conduct
theoretically significant research and to evaluate the effects of naturally occurring parametric
variations (i.e. buyout returns) in the context in which they normally occur (to the extent possible).
3.7.2. Approach to Data Analysis
The structure of this study and the approach to data analysis conceptually follows the research
model. The empirical part commences with an analysis of the Venture Economics dataset, which is
considered as a proxy for the total population of buyout funds. It therefore serves as a cross
reference point to the subsequent analysis of individual buyout transactions. The first part of the
study then continues with an analysis of exogenous, market driven and acquisition setting related
factors on buyout returns, including an analysis of industry financials (left pillar of research model).
There will be an in-depth analysis of the various control variables that will continue to be used
throughout the study. The first part will conclude with a value attribution analysis on a sub-sample
of buyouts, as developed in section 3.5.4. The second part extends the analysis for a sub-sample of
transactions by examining characteristics of buyout managers and buyout firms in order to establish
what the role of the buyout firm is in the value creation process and which attributes facilitate it
(middle pillar of the research model). Finally, the third part will explore on a small sub-sample of
deals with high degree of data density and variables, which strategic actions and decisions at the
buyout target led to value creation (right pillar of the research model). The following flow chart
summarizes the data analysis approach of the study, including sub-level guiding “research
questions”:

Research Design and Methodology 76
Do Buyouts in general
create Value? –
Analysis of Control Group
Fund Population (VE)
Do Buyouts in general
create Value? –
Analysis of Control Group
Fund Population (VE)
What are the less obvious
long-term Trends? –
Analysis of acquisition-
related (Control) Effects
What are the less obvious
long-term Trends? –
Analysis of acquisition-
related (Control) Effects
What Effect do Market
Trading Conditions have? –
Index Analysis
by Industry Sector
What Effect do Market
Trading Conditions have? –
Index Analysis
by Industry Sector
What are the obvious
long-term Trends? –
Analysis of general
(Control) Effects
What are the obvious
long-term Trends? –
Analysis of general
(Control) Effects
What is the Performence on
the Buyout Company Level –
Introduction and
Comparison of Primary
Sample of Buyouts
What is the Performence on
the Buyout Company Level –
Introduction and
Comparison of Primary
Sample of Buyouts
What Effect do Industry
Financial Conditions have?
Is there a financial Value
Creation Pattern? –
Value Attribution Analysis
What Effect do Industry
Financial Conditions have?
Is there a financial Value
Creation Pattern? –
Value Attribution Analysis
ST
UD
Y P
AR
T I
MA
RK
ET
&
F
INA
NC
IAL
DR
IVE
RS
ST
UD
Y P
AR
T I
MA
RK
ET
&
F
INA
NC
IAL
DR
IVE
RS
What impact do
Characteristics of the acting
Deal Investment Manager
have on Performance? –
Manager Profile Analysis
What impact do
Characteristics of the acting
Deal Investment Manager
have on Performance? –
Manager Profile Analysis
Does the Experience Track
Record of Buyout Firms
Have an Impact on IRR? –
Analysis of GP Firm
Deal Experience
Does the Experience Track
Record of Buyout Firms
Have an Impact on IRR? –
Analysis of GP Firm
Deal Experience
What Impact do GP Firm/
Team Characteristics have
on Performance? –
Buyout Firm Analysis
What Impact do GP Firm/
Team Characteristics have
on Performance? –
Buyout Firm Analysis
ST
UD
Y P
AR
T I
I
MA
NA
GE
R /
GP
FIR
M E
FF
EC
T
ST
UD
Y P
AR
T I
I
MA
NA
GE
R /
GP
FIR
M E
FF
EC
T
Which operational and
Strategic Measures have
proven successful? –
Analysis of Value Creation
Implementation Plans
Which operational and
Strategic Measures have
proven successful? –
Analysis of Value Creation
Implementation Plans
What is the Impact of
Operational and Organi-
zational Characteristics
on IRR? – Analysis
of Business Strategies
and Market Approach
What is the Impact of
Operational and Organi-
zational Characteristics
on IRR? – Analysis
of Business Strategies
and Market Approach
Do GP Firm/Management
Deal Decisions determine
Buyout Success? –
Analysis of Stakeholder
Motivations
Do GP Firm/Management
Deal Decisions determine
Buyout Success? –
Analysis of Stakeholder
Motivations
ST
UD
Y P
AR
T II
I
BU
YO
UT
ST
RA
TE
GIE
S
ST
UD
Y P
AR
T II
I
BU
YO
UT
ST
RA
TE
GIE
S
Motivation that Financial and Control Variables
are not sufficient to explain Value Creation
Motivation to examine Buyout Strategies in more Depth
if some Buyout Firms seem to consistently outperform
Conclusions, Findings and Future Research Milestones
on the Path to further Understanding Value Creation in Buyouts
Conclusions, Findings and Future Research Milestones
on the Path to further Understanding Value Creation in Buyouts
Figure 12: Conceptual Approach to Data Analysis in the Study

4. Empirical Part I – Market and
Financial Value Drivers
4.1. Introduction
Part one of the empirical results in this study follows the first research question and first pillar of
the chosen research model, focusing on the market and financial drivers that may impact value
creation in buyouts. The chapter commences with a detailed descriptive overview of the universe of
Private Equity funds, based on the Venture Economics (“VE”) dataset. The data presentation is
important as a benchmark and control group population to put into perspective the primary buyout
deal data set in subsequent sections.56 The VE dataset focuses on the description of historical
Private Equity, Venture Capital and Buyout fund investment and (fund as well as proxy deal) return
trends mainly between 1983 and 2002. In addition, the transformation of the underlying
investments into industry groups (using the same methodology as for the primary sample of deals)
and analysis according to investment stages represents so far unpublished results on the VE
database.
The subsequent four sections in this chapter focus on results of both descriptive and statistical
analysis of the collected primary dataset of leveraged buyout transactions. The explicit first of these
four sub-sections, Leveraged Buyout Deal Performance, provides an introduction and broad
overview of a large set of general market and acquisition related control variables that could impact
the dependent variable buyout performance. These variables are tested group-wise (and later
combined) through multivariate regressions. Based on these initial findings on tested variables, a
group of control variables will be selected for more advanced empirical tests in this study. The
second sub-section on the primary sample will compare the buyout deal performance with public
market performance on a detailed industry level. This analysis allows drawing conclusions,
whether buyout deals – over the exact same investment horizon and in the exact same industry –
are able to outperform public markets. The latter analysis introduces buyout indices across time,
which could serve as a new benchmark for buyout investments on the deal level. The third sub-
section on the primary sample tests the impact of the buyout target’s industry financial environment
on buyout success. Linear regression models will demonstrate which entry and exit condition
metrics will eventually indicate superior value creation potential in buyout transactions. The fourth
56 The mean comparison test in section 3.6.4. has demonstrated that the introduction of the control population
is particularly important here. The VE secondary dataset provides an overview of actual, absolute historical buyout fund performance levels. The analysis on the primary dataset focuses on making explicit the sources of value creation that lead to a certain level of performance, neglecting emphasis on the actual level of returns of focal buyouts under review.

Empirical Part I – Market and Financial Value Drivers 78
and final sub-section on the primary data sample will analyze the financial performance of a sub-
sample of buyouts, indicating potential financial performance patterns beyond the influence of
industry financial performance. This section will involve an application of the value attribution
formula, developed in section 3.5.4.
Each of the above sections (except for the VE data) will provide a description of tested variables, a
discussion of tested “variable hypotheses” with respect to the variable’s potential impact on buyout
performance, detailed statistical multivariate regression analysis and summary interpretation of
results.
4.2. Control Population Overview
The Venture Economics database used in this study contains information on 134,640 “investment
events”, occurring in 64,490 transactions among 27,739 companies world-wide, mainly in the U.S.
and Europe. This dataset can therefore be considered as the most complete, worldwide available
total population of Private Equity transactions. The dataset also provides performance return
information on more than 800 buyout funds, measured by exact cash flows recorded between the
general and Limited Partners. However, the information on the above mentioned individual
investments does not allow calculating internal rates of return on investment. As a consequence, the
fund return will represent the main focus in this section, and will also be used as a proxy to infer
conclusions between funds and their underlying investments. Among other detail on individual
investments, the dataset in particular contains vast information on global Private Equity
fundraising, which will be the introductory topic discussed in the next section.
4.2.1. Private Equity, Venture Capital and Buyout Market Historical Fundraising
4.2.1.1. Overview of Historical Private Equity Fundraising
The success and failure of Private Equity fundraising is influenced by both, the track record (or
potential) of the Private Equity firm as well as the economic, regulatory and capital market
conditions. The list of factors that have been studied in economic literature focus on (i) the state of
the market for initial public offerings (IPOs), (ii) GDP growth, (iii) expected yield returns to
investors, (iv) capital gains taxation and pension fund regulation, (v) growth of overall market
capitalisation, (vi) rigidity of labor markets and (vii) reliability of accounting procedures (Marti and
Balboa 2001; Dresdale 2002). Among these factors, the IPO market has been seen as one of the
most important factors to influence fundraising.57 Due to the favorable regulatory and legal changes
57 Black and Gilson (1999) find a significant relationship between the number of venture-backed IPOs and
new capital commitments to Venture Capital funds in the subsequent year. The volume of IPOs therefore

Empirical Part I – Market and Financial Value Drivers 79
and access to new sources of capital (see Fenn, Liang et al. 1996), a sizable number of large new
Private Equity partnerships were created in the early 1980s. In 1983, 63 new Private Equity funds
were raised, totaling US$ 3.6 billion, of which five funds were buyout funds, totaling US$ 1.1
billion, and 57 were Venture Capital funds, totaling US$ 2.5 billion.58
0
20.000
40.000
60.000
80.000
100.000
120.000
140.000
1983 1984 1985 1986 1987 1988 1989 1990 1991 1992 1993 1994 1995 1996 1997 1998 1999 2000 2001 2002
To
tal
Fu
nd
s R
ais
ed
US
$ (
mm
)
VC Funds LBO Funds Total Private Equity Funds
Figure 13: Total Global Venture Capital, LBO and Private Equity Funds Raised (US$ mm) by Year
Source: Venture Economics data, analyzed by author.
The number and average amount of capital raised by buyout funds increased sharply in the period
of 1987-1989. This was due to a strong track record of the pioneer Private Equity and buyout funds
in the late 1970s/early 1980s and the heightened boom in buyout transactions in the mid-1980s.
This trend was further enhanced by the development of the high yield debt (“junk bond”) market
(Altman 1983; Altman 1987; Asquith, Mullins Jr et al. 1989; Altman 1992). Driven by investment
banks such as Drexel Burnham Lambert, these debt instruments allowed for higher leverage at
target companies and thus led to higher investment yields to investors. In 1989, the Private Equity
market saw 93 new funds raising capital, of which 34 were buyout funds and 58 were Venture
Capital funds, totaling commitments of US$ 18.9 billion, US$ 14.1 billion and US$ 4.7 billion
respectively. The average fund size of buyout funds had doubled from US$ 217 million to 415
million between 1983 and 1989.
affects not only the supply of capital, but also its demand (Jeng and Wells, 2000). Potential fund investors especially scrutinize Private Equity funds during fundraising due diligence with respect to the Private Equity firm’s unrealized portfolio companies. A track record of successful recent exits, preferably via the IPO market, is seen as crucial when evaluating a Private Equity firm’s track record and influences the firm’s ability to attract the desired target fund capital.
58 For clarification on consistency, this section presents data of the total Private Equity fund industry, the buyout fund industry and the Venture Capital fund industry. The figures shown for buyout and Venture Capital do not add up to total Private Equity figures, as the author has omitted small – but negligible for this study – figures referring to Mezzanine funds, Fund of Funds, or other Private Equity funds tracked in the Venture Economics Database.

Empirical Part I – Market and Financial Value Drivers 80
0
20
40
60
80
100
120
140
160
180
200
1983 1984 1985 1986 1987 1988 1989 1990 1991 1992 1993 1994 1995 1996 1997 1998 1999 2000 2001 2002
Nu
mb
er
of
Fu
nd
s R
ais
ed
VC Funds LBO Funds Total Private Equity Funds
Figure 14: Total Global Venture Capital, LBO and Private Equity Funds Raised (No. of Funds) by Year
Source: Venture Economics data, analyzed by author.
The global stock markets crash in October 1989 and the recessionary economic development until
the end of the first Iraq war in 1992 prompted an abrupt end to the positive and growing
fundraising climate. The turbulent equity and credit markets triggered a series of high-level
bankruptcies of buyout targets. These companies in most cases were over-levered from the outset
of the transaction compared to their actual, much lower theoretical debt capacities, which would
have been able to withstand adverse economic and market conditions. The series of buyout defaults
and encompassing public and bureaucratic outcry about an “irresponsible destruction of prior
healthy American companies” led to the collapse of the junk bond market at the end of the 1980s,
which in subsequent years depressed the financing capabilities of buyout funds for new
transactions considerably.
With the economic recovery in 1993, the accompanying increase in activity in the market for IPOs
and the slow rebirth of a more moderate, but sophisticated high yield bond market, the investment
and fundraising climate for Private Equity equally improved. By 1996, it reached a similar level in
terms of number of funds raised compared to 1989. Between 1996 and 2000, the Private Equity
market saw a spectacular rise in activity driven by the information technology and stock market
boom. Total Private Equity fundraising almost increased by a factor of five from US$ 27.0 billion
in 1996 to US$ 126.7 billion in 2000. Likewise, buyout fundraising more than quadrupled from
US$ 19.6 billion in 1996 to US$ 82.6 billion in 2000. A total of 173 new Private Equity funds were
raised in 2000 compared to only 92 in 1996, as well as 76 buyout funds in 2000 compared to 47 in
1996.

Empirical Part I – Market and Financial Value Drivers 81
0
200
400
600
800
1.000
1.200
1.400
1983 1984 1985 1986 1987 1988 1989 1990 1991 1992 1993 1994 1995 1996 1997 1998 1999 2000 2001 2002
Avera
ge F
un
d S
ize (
US
$ m
m)
VC Funds LBO Funds Total Private Equity Funds
Figure 15: Average Fund Size of Total Global Venture Capital, LBO and all Private Equity Funds Raised (US$ mm) by Year
Source: Venture Economics data, analyzed by author.
More significantly, the average fund size increased sharply, resulting in ample capital for
investment in gradually larger transactions. The average size of buyout funds tripled from US$ 420
million in 1996 to a record US$ 1.3 billion in 2001. Over the same period, Venture Capital funds
more than quadrupled in average size from US$ 118 million in 1996 to US$ 508 million in 2001.
The burst of the information technology & internet bubble since March 2000 and the sharp
economic downturn had subdued fundraising substantially in 2002. Total fundraising of Private
Equity funds dropped by 84% to US$ 19.9 billion between 2000 and 2002, while buyout
fundraising dropped by 80% to US$ 16.4 billion. After a series of write-offs in their information
technology portfolios and considerable value destruction of investors’ funds, Venture Capital
fundraising dropped by 95% to US$ 2.3 billion in 2002 compared to its 2000 peak.
4.2.1.2. A Global View on Private Equity Fundraising
The global Private Equity fundraising market has historically been dominated by the U.S. and the
United Kingdom. Between 1983 and 2002, a total of 1,316 Private Equity funds with committed
capital of US$ 498.6 billion have been raised in the U.S. Among these, 440 buyout funds with
US$ 322.9 billion, or 65 per cent of the total as well as 807 Venture Capital funds with
commitments of US$ 183.8 billion were founded.

Empirical Part I – Market and Financial Value Drivers 82
0
50.000
100.000
150.000
200.000
250.000
300.000
350.000
400.000
450.000
500.000
USA
Unite
d Kingd
om
Franc
e
Net
herla
nds
Swed
en
Hon
g Kon
gIta
ly
Ger
man
y
Finland
Luxe
mbo
urg
Spain
Switz
erland
Singa
pore
Irela
nd
To
tal F
un
ds R
ais
ed
US
$ (
mm
)
VC Funds LBO Funds Total Private Equity Funds
Figure 16: Total Global Venture Capital, LBO and all Private Equity Funds Raised (US$ mm) by Country
Source: Venture Economics data, analyzed by author.
The United Kingdom has historically been one of the most active and significant buyout markets
outside the United States. Private Equity fundraising in Europe began to gain pace during the late
1980s, mostly driven by U.S. funds entering the less developed, yet less competitive European
Private Equity market. Between 1983 and 2002, a total of 349 Private Equity funds with committed
capital of US$ 145.3 billion have been raised in the United Kingdom. Among these, 187 buyout
funds with US$ 121.6 billion, or 84 per cent of the total as well as 157 Venture Capital funds with
commitments of US$ 22.3 billion were founded. The immaturity of the European Venture Capital
industry compared to the U.S. is highlighted by a significantly lower ratio of Venture Capital funds
(15 per cent) in the United Kingdom compared to the U.S. (30 per cent).59 The early dominance of
the United Kingdom for European Private Equity fundraising is mainly based on the similarity of
its jurisdiction to the Anglo-American legal system, its regulatory framework supporting (U.S.)
fund investor protection as well as the highest developed capital markets in Europe at that time.
59 Structural differences in the funding system of entrepreneurial activity between the US (capital market
driven) and Europe (government driven) are contributing to a less developed Venture Capital industry in Europe.

Empirical Part I – Market and Financial Value Drivers 83
0
200
400
600
800
1.000
1.200
1.400
USA
Uni
ted
Kingd
om
Franc
e
Finland
Ger
man
y
Net
herla
nds
Swed
en
Spa
in
Switz
erland Ita
ly
Irela
nd
Luxe
mbo
urg
Hon
g Kon
g
Singa
pore
Nu
mb
er
of
Fu
nd
s R
ais
ed
VC Funds LBO Funds Total Private Equity Funds
Figure 17: Total Global Venture Capital, LBO and all Private Equity Funds Raised (No. of Funds Raised) by Country
Source: Venture Economics data, analyzed by author.
Other European countries have been slow to implement a favorable fundraising environment in
their jurisdictions. France and Germany have become the most active buyout markets behind the
United Kingdom in the late 1990s, having raised US$ 8.0 billion (total of 67 funds, of which 27
were buyout funds and 39 Venture Capital funds) and US$ 2.2 billion (total of 25 funds, of which 2
were buyout funds and 23 Venture Capital funds) of total Private Equity capital until 2002.
Fundraising in the Netherlands attracted US$ 5.3 billion (total of 22 funds, of which 15 were
buyout funds and 6 Venture Capital funds) by 2002, driven by a favorable jurisdiction with
significant tax incentives. Due to rapid development of the Scandinavian information technology
industry and a strong buyout market, the Finnish and Swedish Private Equity fundraising market
grew to a total of US$ 7.0 billion (total of 46 funds, of which 27 were buyout funds and 11 Venture
Capital funds).60
4.2.1.3. Private Equity Investment Allocation by Industries
The allocation of Private Equity capital according to industries is of particular importance as it
reveals the investment focus of buyout and Venture Capital funds, i.e. where these funds consider
finding the most attractive investment opportunities. The classification of all 64,490 Private Equity
transactions recorded by Venture Economics 61 has been performed according to the industry
categorization of Thompson Financial Datastream (see detailed overview in section 3.6.5.)62.
60 Data collected by Venture Economics for the European Private Equity market is less complete than for the
US Private Equity industry. Presented figures should be considered as trends only. 61 Recorded from January 1, 1980, until December 31, 2002. 62 Venture Economics utilizes over 500 industry classifications in their Venture Economics Industry
Classification (VEIC). These industries have been transformed to the Datastream Level 6 classification scheme utilizing a transformation key. This classification in turn allowed for the direct aggregation of the presented Level 3 and Level 4 industry categories. The industries have been assigned according to the

Empirical Part I – Market and Financial Value Drivers 84
4.2.1.3.1. Level 3 Industry Classification
On the most aggregated industry classification, the results highlight the key investment areas of
Private Equity funds in the global economy. The information technology industry is the most
invested industry sector, having received US$ 227 billion of Private Equity fund investments.63 The
sector is dominated by Venture Capital funds with US$ 194 billion of investment, but also buyout
funds invested in this sector (US$ 26 billion).64 The second largest industry sector is the cyclical
services industry with US$ 95 billion of total Private Equity investment (US$ 42 billion of buyout
and Venture Capital investments each), followed by the non-cyclical consumer goods sector with
US$ 83 billion of total Private Equity investment (US$ 27 billion of buyout and US$ 51 billion of
Venture Capital investment) as well as general industries with US$ 53 billion of total Private
Equity investment (US$ 18 billion of buyout and US$ 27 billion of Venture Capital investment).
The apparent key investment focus of buyout funds in cyclical services, which is six times higher
than in the non-cyclical services industry, is a surprising result. Based on theory (see table 1),
buyout firms seek to avoid industries with high cyclicality. Their investment focus on cyclical
services can be interpreted as being more attractive from a returns perspective. Service businesses
often demonstrate attractive margins; hence buyout firms are likely to be tracking the industry
cycle of cyclical services firms and are buying at attractive (low) enterprise values in a down-cycle.
Other important industries for buyout funds are cyclical and non-cyclical consumer goods as well
as general and basic industries. The latter two sectors generally represent very mature companies
with stable business models and financials, but low growth prospects.
author’s best knowledge, but the potential for a limited subjective bias with respect to this transformation/ re-classification has to be acknowledged.
63 “Investment” here is defined as the sum of total equity investment in all deals with this industry classification (Venture Economics classification: “Estimated Round Total”). With respect to consistency of presented data, the author needs to point out that adding all investments across industries, e.g. by VC funds, leads to higher US$ investment amount than actual VC funds raised (see section above). The reason is twofold. First, the above presented fundraising data refers to the period from 1983-2002, while the aggregated data here refers to investments recorded by Venture Economics from 1980 to 2002. Also, there is no fund size data provided for all Private Equity funds in the Venture Economics database, therefore understating the actual funds raised. Secondly, the invested amount (“Estimated Round Total”) may also include investments from other parties than Private Equity funds, e.g. management, other individuals, companies or institutions. It represents an estimated figure by Venture Economics for the total equity investment in the transaction (the estimated round total is approximately 30% higher for all Private Equity funds, 20% for buyout funds and 40% for Venture Capital funds than the sum of recorded fund equity investment data). Nevertheless, the chosen presentation can be considered to be the most accurate with respect to analyzing Private Equity transactions as it represents all equity funds flown into a deal.
64 Especially during the information technology boom between 1997 and 2000, buyout funds diversified their investments towards this non-traditional (i.e. with respect to their general focus on mature, stable companies) industry segment.
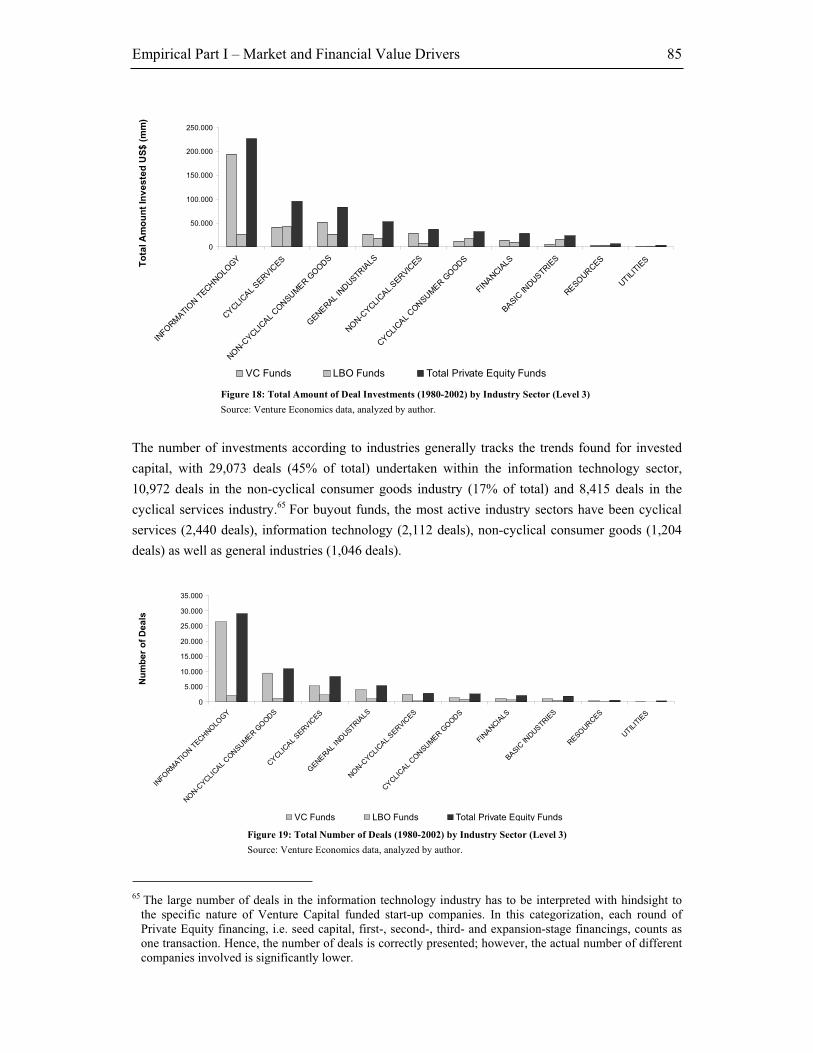
Empirical Part I – Market and Financial Value Drivers 85
0
50.000
100.000
150.000
200.000
250.000
INFO
RM
ATION T
ECHNO
LOGY
CYCLI
CAL
SER
VIC
ES
NO
N-C
YCLI
CAL
CONSU
MER
GO
ODS
GEN
ERAL
INDUSTR
IALS
NO
N-C
YCLI
CAL.
SER
VICES
CYCLI
CAL
CONSU
MER G
OODS
FINANCIA
LS
BASIC
INDUSTR
IES
RESO
URCES
UTIL
ITIE
STo
tal A
mo
un
t In
ve
ste
d U
S$
(m
m)
VC Funds LBO Funds Total Private Equity Funds
Figure 18: Total Amount of Deal Investments (1980-2002) by Industry Sector (Level 3)
Source: Venture Economics data, analyzed by author.
The number of investments according to industries generally tracks the trends found for invested
capital, with 29,073 deals (45% of total) undertaken within the information technology sector,
10,972 deals in the non-cyclical consumer goods industry (17% of total) and 8,415 deals in the
cyclical services industry.65 For buyout funds, the most active industry sectors have been cyclical
services (2,440 deals), information technology (2,112 deals), non-cyclical consumer goods (1,204
deals) as well as general industries (1,046 deals).
0
5.000
10.000
15.000
20.000
25.000
30.000
35.000
INFO
RM
ATI
ON T
ECHNO
LOGY
NO
N-C
YCLI
CAL
CONSU
MER
GO
ODS
CYCLI
CAL
SER
VIC
ES
GEN
ERAL IN
DUSTR
IALS
NO
N-C
YCLI
CAL.
SERVIC
ES
CYCLI
CAL
CONSU
MER G
OODS
FINANCIA
LS
BASIC
INDUSTR
IES
RESO
URCES
UTIL
ITIE
S
Nu
mb
er
of
De
als
VC Funds LBO Funds Total Private Equity Funds
Figure 19: Total Number of Deals (1980-2002) by Industry Sector (Level 3)
Source: Venture Economics data, analyzed by author.
65 The large number of deals in the information technology industry has to be interpreted with hindsight to
the specific nature of Venture Capital funded start-up companies. In this categorization, each round of Private Equity financing, i.e. seed capital, first-, second-, third- and expansion-stage financings, counts as one transaction. Hence, the number of deals is correctly presented; however, the actual number of different companies involved is significantly lower.

Empirical Part I – Market and Financial Value Drivers 86
The average deal size varies significantly between industries. The highest average deal size (and
with the lowest variance) can be observed in the financial services sector with an average deal size
of US$ 13.2 million for all Private Equity funds. Given the high number of investments in the
information technology sector, the average deal size is much lower at US$ 7.8 million. Across all
industry sectors, buyout deals are considerably larger than Venture Capital deals. The highest
average deal size of buyout funds is in basic industries (US$ 25.7 million), utilities (US$ 25.2
million), non-cyclical consumer goods (US$ 22.0 million) and non-cyclical services (US$ 21.8
million). The high average investment amount in the basic industry and utility sector is likely to be
driven by relatively high asset prices of these acquisitions. Also, the high average deal amount in
both the non-cyclical consumer goods and non-cyclical services sectors (compared to the cyclical
counterparts) points to the fact that buyout funds, acknowledging the lower risk of cyclical
downturns, are willing to put more capital at risk in these industry sectors.
0
5
10
15
20
25
30
FINANCIA
LS
NO
N-C
YCLI
CAL.
SER
VICES
CYCLI
CAL
CONSU
MER G
OODS
BASIC
INDUSTR
IES
CYCLI
CAL
SER
VIC
ES
RESO
URCES
UTIL
ITIE
S
GEN
ERAL IN
DUSTR
IALS
INFO
RM
ATION T
ECHNO
LOGY
NO
N-C
YCLI
CAL
CONSU
MER G
OODS
Av
era
ge
De
al
Siz
e (
$ m
m)
VC Funds LBO Funds Total Private Equity Funds
Figure 20: Average Deal Size (1980-2002) by Industry Sector (Level 3)
Source: Venture Economics data, analyzed by author.
The average deal size by industry has to be put into context of the overall development of average
deal size among buyout and Venture Capital funds. Overall, average deal sizes have grown from
US$ 1.4 million in 1980 to US$ 16.5 million in 2002 among all Private Equity funds. The average
deal sizes grew rapidly during the 1980s, reaching a preliminary maximum in 1989 with US$ 5.3
million and – after a period of more conservative investment behavior between 1990 and 1991 –
continued to grow progressively to US$ 15.9 million in 2000. The average deal size growth among
buyout funds was even stronger, yet also more volatile. Surprisingly, the low maturity of the
buyout industry in the early 1980s, between 1980 and 1984, is exemplified by the fact that the
average deal size of buyout deals was consistently lower than Venture Capital deals, which they
first surpassed in 1985 with US$ 3.6 million. Supported by various mega-buyout deals, including
the takeover of RJR Nabisco by Kohlberg Kravis Roberts & Co. in 1989, which involved a record
equity injection of approximately US$ 3.7 billion, led to an upsurge in average deal sizes to US$ 25
million by 1990. After a period of consolidation between 1991 and 1994, average deal sizes of
leveraged buyout transactions grew to US$ 24.5 million in 1999. The lower average level of deal

Empirical Part I – Market and Financial Value Drivers 87
sizes in 2000 and 2001 was a result of (i) more conservative investment climate due to the
economic downturn, and (ii) significantly lower asset prices following the falloff in global stock
markets. Average deal sizes more than doubled between 2001 and 2002, reaching US$ 35 million.
The record average deal sizes are (i) a clear indicator that buyout funds were expecting an
economic recovery and seeking to take full advantage by buying large assets cheaply in advance,
and (ii) provide evidence of the large amounts of un-invested capital among buyout funds.66
0
5
10
15
20
25
30
35
40
1980 1981 1982 1983 1984 1985 1986 1987 1988 1989 1990 1991 1992 1993 1994 1995 1996 1997 1998 1999 2000 2001 2002
Av
era
ge
De
al S
ize
($
mm
)
VC Funds LBO Funds Total Private Equity Funds
Figure 21: Average Private Equity Deal Sizes (1980-2002) by Year
Source: Venture Economics data, analyzed by author.
4.2.1.3.2. Level 4 Industry Classification
The industry classification on a less aggregated level 67 , allows for deeper insights into the
attractiveness for investment of particular industries. It should be pointed out though that the lower
aggregation level on the one side does offer greater depth, however, at the same time is
accompanied by lower average frequencies among the individual categories, which adds volatility
to returns. This to some extent should be taken into account for the interpretation of results.
66 The year 2002 saw a range of mega-deals both in Europe and the US, including the €4.9 billion buyout of
Legrand, the €3.2 billion public to private transaction of Jefferson Smurfit and the €1.7 billion buyout of DEMAG in Europe as well as the US$ 7.1 billion buyout of Qwest in the US.
67 Datastream Level 4 industry categorization consists of 35 industries. Datastream Level 6, which includes 96 different industry categorizations, has been omitted here for brevity of presentation.

Empirical Part I – Market and Financial Value Drivers 88
0 20.000 40.000 60.000 80.000 100.000 120.000 140.000 160.000 180.000
FOOD & DRUG RETAILERS
MINING
ELECTRICITY
AEROSPACE & DEFENCE
FORESTRY & PAPER
PERSONAL CARE & HOUSEHOLD APPLICATIONS
BEVERAGES
OTHER UTILITIES
INVESTMENT COMPANIES
REAL ESTATE
BANKS
OIL & GAS
CONSTRUCTION & BUILDING MATERIALS
DIVERSIFIED INDUSTRIALS
INSURANCE
AUTO & PARTS
SPECIALITY & OTHER FINANCE
TRANSPORT
LEISURE + HOTELS
SUPPORT SERVICES
CHEMICALS
FOOD PRODUCER/PROCESSORS
ELECTRONIC & ELECTRICAL EQUIPMENT
RETAIL, GENERAL
HOUSEHOLD GOODS & TEXTILES
ENGINEERING & MACHINERY
PHARMACEUTICALS & BIOTECHNOLOGY
HEALTH
MEDIA & ENTERTAINMENT
TELECOM SERVICES
INFORMATION TECHNOLOGY & HARDWARE
SOFTWARE & COMPUTER SERVICES
Total Amount Invested US$ (mm)
VC Funds LBO Funds Total Private Equity Funds
Figure 22: Total Amount of Deal Investments (1980-2002) by Industry Sector (Level 4)
Source: Venture Economics data, analyzed by author.
First, the results of this analysis, which are logically linked to the results shown for Level 3,
provide further clarification of the most heavily invested industry – the information technology
sector. Deals in the software and computer services sector, totaling US$ 170 billion of total Private
Equity investment (US$ 20 billion of buyout and US$ 146 billion of Venture Capital investment)
by far outweighs the information technology and hardware sector with US$ 57 billion of total
Private Equity investment (US$ 6 billion of buyout and US$ 49 billion of Venture Capital
investment). In line with the above (Level 3) findings on the attractiveness of the general service
sector(s), Private Equity funds appear to avoid the risk of rapid technological change in the
hardware sector, directing the majority of investment towards the more “adaptive” software and
services sector.
With regard to buyout funds, other key focus industry sectors include the media & entertainment
sector (US$ 15 billion), the household goods & textiles industries (US$ 12 billion), the food
producer and processor sector (US$ 12 billion), the chemicals industry (US$ 11 billion), the
engineering and machinery sector (US$ 10 billion) as well as healthcare and general retail sectors
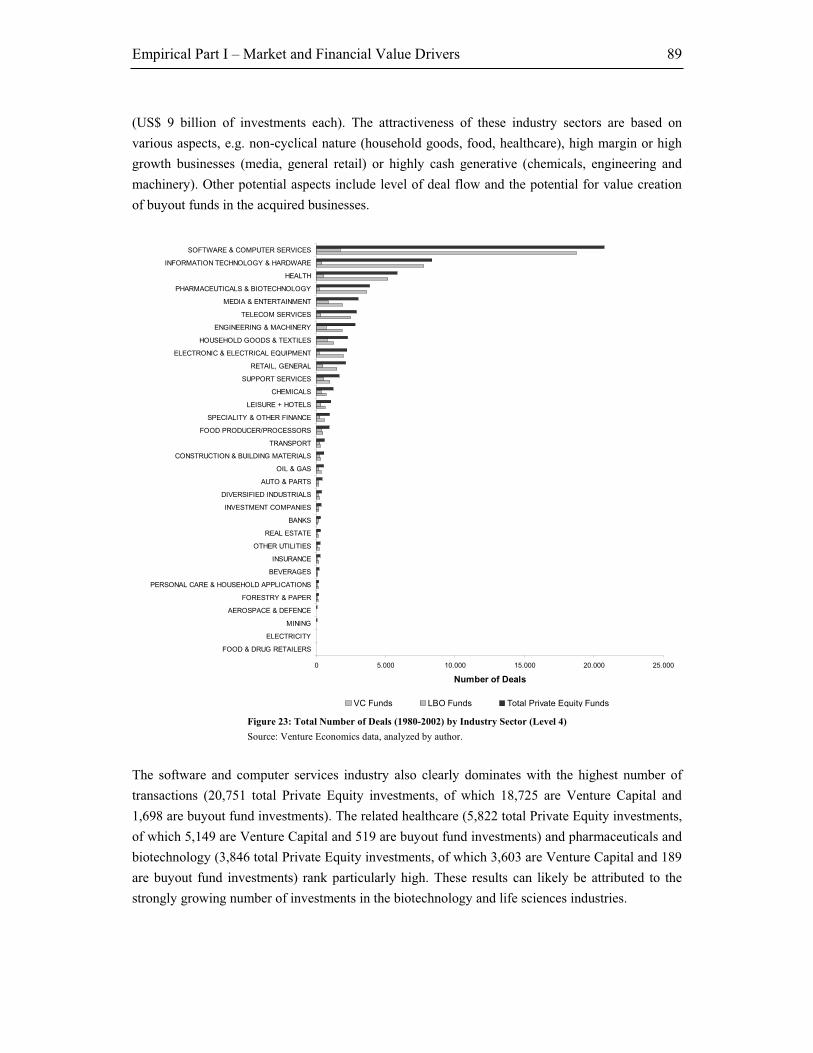
Empirical Part I – Market and Financial Value Drivers 89
(US$ 9 billion of investments each). The attractiveness of these industry sectors are based on
various aspects, e.g. non-cyclical nature (household goods, food, healthcare), high margin or high
growth businesses (media, general retail) or highly cash generative (chemicals, engineering and
machinery). Other potential aspects include level of deal flow and the potential for value creation
of buyout funds in the acquired businesses.
0 5.000 10.000 15.000 20.000 25.000
FOOD & DRUG RETAILERS
ELECTRICITY
MINING
AEROSPACE & DEFENCE
FORESTRY & PAPER
PERSONAL CARE & HOUSEHOLD APPLICATIONS
BEVERAGES
INSURANCE
OTHER UTILITIES
REAL ESTATE
BANKS
INVESTMENT COMPANIES
DIVERSIFIED INDUSTRIALS
AUTO & PARTS
OIL & GAS
CONSTRUCTION & BUILDING MATERIALS
TRANSPORT
FOOD PRODUCER/PROCESSORS
SPECIALITY & OTHER FINANCE
LEISURE + HOTELS
CHEMICALS
SUPPORT SERVICES
RETAIL, GENERAL
ELECTRONIC & ELECTRICAL EQUIPMENT
HOUSEHOLD GOODS & TEXTILES
ENGINEERING & MACHINERY
TELECOM SERVICES
MEDIA & ENTERTAINMENT
PHARMACEUTICALS & BIOTECHNOLOGY
HEALTH
INFORMATION TECHNOLOGY & HARDWARE
SOFTWARE & COMPUTER SERVICES
Number of Deals
VC Funds LBO Funds Total Private Equity Funds
Figure 23: Total Number of Deals (1980-2002) by Industry Sector (Level 4)
Source: Venture Economics data, analyzed by author.
The software and computer services industry also clearly dominates with the highest number of
transactions (20,751 total Private Equity investments, of which 18,725 are Venture Capital and
1,698 are buyout fund investments). The related healthcare (5,822 total Private Equity investments,
of which 5,149 are Venture Capital and 519 are buyout fund investments) and pharmaceuticals and
biotechnology (3,846 total Private Equity investments, of which 3,603 are Venture Capital and 189
are buyout fund investments) rank particularly high. These results can likely be attributed to the
strongly growing number of investments in the biotechnology and life sciences industries.

Empirical Part I – Market and Financial Value Drivers 90
0 20.000 40.000 60.000 80.000 100.000 120.000
HEALTH
INFORMATION TECHNOLOGY & HARDWARE
PHARMACEUTICALS & BIOTECHNOLOGY
FORESTRY & PAPER
OTHER UTILITIES
SOFTWARE & COMPUTER SERVICES
SUPPORT SERVICES
ELECTRONIC & ELECTRICAL EQUIPMENT
SPECIALITY & OTHER FINANCE
ENGINEERING & MACHINERY
BEVERAGES
PERSONAL CARE & HOUSEHOLD APPLICATIONS
RETAIL, GENERAL
OIL & GAS
CONSTRUCTION & BUILDING MATERIALS
HOUSEHOLD GOODS & TEXTILES
FOOD & DRUG RETAILERS
MEDIA & ENTERTAINMENT
INVESTMENT COMPANIES
CHEMICALS
TELECOM SERVICES
LEISURE + HOTELS
BANKS
REAL ESTATE
AUTO & PARTS
DIVERSIFIED INDUSTRIALS
TRANSPORT
MINING
FOOD PRODUCER/PROCESSORS
INSURANCE
AEROSPACE & DEFENCE
ELECTRICITY
Average Deal Size ($ mm)
VC Funds LBO Funds Total Private Equity Funds
Figure 24: Average Deal Size (1980-2002) by Industry Sector (Level 4)
Source: Venture Economics data, analyzed by author.
An analysis of the average deal size on the Level 4 industry classification produces significantly
dissimilar, yet surprising results compared to the above findings.68 The aerospace and defense
sector, in which only 41 Private Equity transactions (10 buyout fund and 29 Venture Capital fund
transactions) have been executed between 1980-2002, by far shows the top average deal size
among buyout funds of US$ 110 million. On the one hand, this result may be related to the scarcity
of deals in this sector. On the other hand, the substantial visibility of future cash flows in this
industry sector, driven by the long-term and often government-backed nature of its revenue stream,
reduces investment risk and allows for large equity fund investments.69 Large average deal sizes of
buyout funds in other industry sectors, such as electricity (US$ 63 million), mining (US$ 34
million), food producers and processors (US$ 32 million), chemicals (US$ 31 million), diversified
industries (US$ 30 million) or insurance (US$ 29 million) are to some extent based on relatively
high enterprise values, i.e. acquisition prices, for investments in these sectors. These sectors are
68 The average deal size of industry sectors is broadly defined through buyout fund activity. 69 Private Equity firm Carlyle is the leading Private Equity investor in this sector (compare footnotes 14, 18).
Empirical Part I – Market and Financial Value Drivers 91
either relatively consolidated (electricity, mining) or exceptionally asset- and capital-intensive
(chemicals, diversified industries, insurance).
4.2.1.4. Summary of Findings
This first section has provided an overview of the historical development and accompanying
dynamics of Private Equity fundraising activity. The growth in Private Equity fundraising has been
enormous since the early 1980s, growing from US$ 3.6 billion in 1983 to a record US$ 126.7
billion in 2000. Among the total Private Equity investment asset class, buyout focused funds grew
from US$ 1.1 billion in 1983 (five funds) to US$ 82.6 billion (76 funds) in 2000. The Private
Equity industry’s average fund size also grew consistently, except for a slowdown in the late 1980s
following several high profile bankruptcies, triggered by the stock and junk bond markets’ crash.
The most active jurisdiction for fundraising has historically been the U.S., followed by the United
Kingdom. The majority of total Private Equity fundraising was invested in the information
technology sector, specifically in the software and computer services segment. Buyout funds
heavily invested in sectors such as the cyclical services sector, non-cyclical consumer goods or
general industrials. The average deal sizes also varied considerably according to industry sector:
the asset and/or capital intensive basic industries and utility sectors showed high average
investment levels. However, the non-cyclical segments of both consumer goods and services also
allowed buyout funds to invest greater sums, potentially due to the lower (perceived) risk profiles.

Empirical Part I – Market and Financial Value Drivers 92
4.2.2. Private Equity, Venture Capital and Buyout Market Historical Fund Performance
The expected level of return to fund investors of Private Equity as an investment asset class, its
specific return characteristics as well as developments across time and industries are critical to
understand drivers and mechanisms for value creation. Private Equity investments are highly
illiquid and represent a volatile, risky investment asset class. Its specific risk profile and
corresponding low correlation with other asset classes makes it attractive for portfolio
diversification (Bance 2002). Several authors have shown that in order to compensate for risk and
illiquidity, investors anticipate to receive an illiquidity premium on their investment, compared to
public market investments (Gottschalg, Phalippou et al. 2003; Kaplan and Schoar 2003; Ljungqvist
and Richardson 2003). Overall performance was found to be slightly above or similar to public
market performance. Results in section 4.2.1. have shown that commitment to Private Equity funds
– most notably to buyout funds – had increased strongly during the 1980s and late 1990s. This
section presents results of the analysis on performance of Private Equity funds from 1980 to 2002,
emphasizing the level of returns generated by buyout funds.
-50%
-40%
-30%
-20%
-10%
0%
10%
20%
30%
40%
50%
60%
1983 1984 1985 1986 1987 1988 1989 1990 1991 1992 1993 1994 1995 1996 1997 1998 1999 2000 2001 2002
Av
era
ge
Ne
t F
un
d R
etu
rn (
%)
VC Funds LBO Funds Total Private Equity Funds
Figure 25: Non-weighted Average Net Fund Returns by Year and by Fund Type (1983-2002)
Source: Venture Economics data, analyzed by author.

Empirical Part I – Market and Financial Value Drivers 93
4.2.2.1. Overall Private Equity Fund Performance
The interpretation of the return profile leads to surprising results. Average net fund returns of
Private Equity funds have almost constantly been increasing between 1983 (average net fund IRR
of 9.7%) and 1995 (average net fund IRR of 28.2%). This trend stagnated only briefly for funds
raised in 1990 and 1991, which were exposed to an adverse capital market and financing
environment (post the 1989 market turmoil) and a recessionary environment. Post 1995, the high
degree of unrealized investments through the “J-curve effect”70 leads to a deterioration of overall
fund returns, which decline to -14.7% and -34.1% average net fund IRR for Private Equity Funds
raised in 2000 and 2002 respectively. Despite the fact that this negative return profile was to be
expected of these recently raised funds, which have significant amounts of capital uninvested or
only recently invested (cash outflows), it is questionable whether the expected gains will over-
compensate these upfront cash outflows over the life of most funds in a similar way as traditionally.
The economic downturn characterized by very low growth between 2000 and 2003 and the
historically high amounts of outstanding uninvested fund capital may affect the traditional J-curve
by shifting cash inflows further into the future and lowering expected net fund returns. In essence,
this chart could be an indication of a halt of the historic trend of growing Private Equity returns.
-60%
-40%
-20%
0%
20%
40%
60%
80%
1983 1984 1985 1986 1987 1988 1989 1990 1991 1992 1993 1994 1995 1996 1997 1998 1999 2000 2001 2002
We
igh
ted
Av
era
ge
Ne
t F
un
d R
etu
rn (
%)
VC Funds LBO Funds Total Private Equity Funds
Figure 26: Weighted Average Net Fund Returns by Year and by Fund Type (1980-2003)
Source: Venture Economics data, analyzed by author.
70 The curve realized by plotting the returns generated by a Private Equity fund against time (from inception
to termination). The common practice of paying the investment, start-up and management fee costs out of the first draw-down does not produce an equivalent book value. As a result, a Private Equity fund will initially show (at times highly) negative returns. When the first realizations are made, the fund returns start to rise quite steeply. After about three to five years, the interim IRR will give a reasonable indication of the definitive IRR. This period is generally longer for buyout funds than for early-stage and expansion funds. See Chambers (1998), Bance (2002) or the case study by Chaplinsky and Perry (2004) for details.

Empirical Part I – Market and Financial Value Drivers 94
4.2.2.2. Buyout Fund Performance
Buyout fund performance was particularly high in the early eighties with weighted average net
fund returns of 29.9% in 1983, 26.6% in 1984 and a record 40.2% in 1985. This can be attributed to
(i) low amounts of Private Equity capital raised in the early 1980s, which kept competition for
transactions low, (ii) the favorable changes to the legal system and regulatory reforms and tax
incentives (SBA 1977; Fenn, Liang et al. 1996; Gompers and Lerner 2002) and (iii) advantageous
investment timing due to low asset prices in the early 1980s with a subsequent steep economic
recovery. The latter effect can also be confirmed for other years of relative economic weakness,
such as 1990 following the stock market crash (16.8% weighted average net fund return) or 1992
following the 1st Iraq war (28.6% weighted average net fund return). The early 1980s also offered
the greatest opportunities for corporate change, efficiency gains and in turn improved financial
performance through (i) the application of standard cost and cash management tools and business
rationalization initiatives, and (ii) the introduction of strong managerial incentives (Jensen and
Meckling 1976; Baker and Wruck 1989; Muscarella and Vetsuypens 1990; Fenn, Liang et al. 1996;
Weir and Laing 1998; Cotter and Peck 2001; Rosen and Rodrick 2001; Frisch 2002).
Buyout fund returns were depressed until 1988, declining to 11.4% weighted average net IRR, as
new capital inflows into buyout funds grew rapidly between 1986 and 1989. Furthermore, rising
valuation levels as well as structural and managerial changes in corporations, which more
effectively defended themselves against the threat of hostile takeovers through balance sheet and
corporate restructurings, brought about change in terms of type and number of available buyout
fund investment opportunities. The early 1990s intensified this change, as the managerial focus
shifted towards enabling technology-driven efficiency gains, cash flow generation and shareholder-
oriented balance sheet management, including capital structure optimization. Consequently,
operational focus also became the key determining element to create value in buyouts. Moreover,
the structural change in the economy during the 1990s, which was increasingly dominated by high
technological product and service firms, e.g. telecommunications and information technology as
well as professional services firms – often characterized by an absence of hard assets – narrowed
the number of traditional buyout targets. Weighted returns for buyout funds raised between 1995
and 1997 ranged between 11.2% and 7.5% respectively. Due to low levels of cash inflows (J-curve
effect) and adverse exit conditions for the less mature funds, buyout fund weighted IRRs declined
to -5.0% in 1998, -3.8% in 2000 and -32.8% in 2002.
4.2.2.3. Venture Capital Fund Performance
Venture Capital fund performance also increased consistently between the mid-1980s and the mid-
1990s, with weighted average net Venture Capital fund returns growing from 11.9% in 1986 to
22.3% in 1990 and to stellar 50.0% and 59.4% in 1995 and 1996 respectively. Thereafter, returns
constantly decreased and reached a low point with -37.5% in 2002. The enormous returns of
Venture Capital funds raised between 1995 and 1997 must be interpreted to the extent that these
funds were able to invest their fund capital rapidly and took full advantage of the stock market

Empirical Part I – Market and Financial Value Drivers 95
boom to exit their investments between 1998 and 2000. Given the shorter average investment
holding period in Venture Capital, the J-curve effect among Venture Capital funds has an average
shorter maturity than among buyout funds.
-60%
-40%
-20%
0%
20%
40%
60%
80%
1983 1984 1985 1986 1987 1988 1989 1990 1991 1992 1993 1994 1995 1996 1997 1998 1999 2000 2001 2002
Ne
t V
en
ture
Ca
pit
al
Fu
nd
Re
turn
(%
)
Weighted Average Net IRR Average Net IRR
Figure 27: Weighted and Unweighted Net Venture Capital Fund Returns by Year (1980-2003)
Source: Venture Economics data, analyzed by author.
4.2.2.4. Weighted and Unweighted IRR
Another surprising result becomes evident by comparing weighted and unweighted average net
fund returns. Between 1983 and 2002, weighted returns are – with few exceptions – higher for
nearly all fundraising years. As a consequence, it can be concluded that larger Private Equity funds
are outperforming smaller funds. By comparing weighted and unweighted returns in buyout and
Venture Capital funds in more detail, this finding becomes particularly visible among Venture
Capital funds. Among Venture Capital funds, the spread between weighted and unweighted returns,
i.e. between smaller and larger funds, ranges between 3-5% for most years, reaching up to 12%
between 1994 and 1997. By comparison, among buyout funds, the spread ranges between 1-3% for
most years, reaching up to 6% in 1990 and 1992.

Empirical Part I – Market and Financial Value Drivers 96
-50%
-40%
-30%
-20%
-10%
0%
10%
20%
30%
40%
50%
60%
1983 1984 1985 1986 1987 1988 1989 1990 1991 1992 1993 1994 1995 1996 1997 1998 1999 2000 2001 2002
Ne
t B
uy
ou
t F
un
d R
etu
rn (
%)
Weighted Average Net IRR Average Net IRR
Figure 28: Weighted and Unweighted Net Buyout Fund Returns by Year (1980-2003)
Source: Venture Economics data, analyzed by author.
This finding imparts far-reaching scope for interpretation. Among the key concerns of Private
Equity investors nowadays are the ever-increasing average fund sizes. Naturally, more available
capital must either lead to larger transactions or to higher deal frequency. The large-cap deal
market is, however, considerably smaller than the small- and mid-cap deal markets, hence the
investors’ concern is that competition for large-cap deal eventually must deteriorate returns. This
comparison at least to some extent may proof skeptics wrong, as the larger Private Equity funds
appear to be more successful over time, i.e. generating higher returns, than their smaller
counterparts. A sensible explanation could be a “survival of the fittest” theory71 among Private
Equity funds, which – when applied to Private Equity – would imply that those funds with the best
(investment return) track record are also those that are able to attract the largest amounts of capital
for their new funds and are in turn flexible to enlarge fund sizes as well as continue delivering out-
performance accordingly.
4.2.2.5. Private Equity Risk and Return Development
Acquisition performance per se is highly volatile and distribution of returns wide72, so is Private
Equity fund performance. The diversification effect through a balanced portfolio of companies
already levels a fund’s overall return, but extraordinarily successful deals as well as large
investment write-offs can affect fund returns significantly. Consequently, Private Equity fund
71 After Darwin (1859). 72 See section 2.6. for discussion.

Empirical Part I – Market and Financial Value Drivers 97
returns between 1983 and 2002 were at times characterized by high levels of volatility, measured as
standard deviation of average net fund returns (see figures 29 and 30). The high returns of buyout
funds observed between 1983 and 1985 were also associated with high levels of volatility, which
can be interpreted as either risky investment environment, or seen as “pioneer years”, i.e. showing
a high dispersion of either extremely successful or failing funds. By contrast, despite slightly
elevated volatility, Venture Capital fund returns were minimal at 2.4% of average net IRR,
compared to 40.2% among buyout funds. Between 1986 and 1991 Private Equity fund raising and
investment rose sharply, while both returns and volatility remained almost constant, ranging around
10% to 15% average net IRR. This homogeneous risk and return profile supports the learning
hypothesis, i.e. that General Partners seem to have adopted similar acquisition techniques. Also, the
fact that neither “lemons” are able to raise new funds nor “highflyers” are able to outperform
competition substantiates the idea of a developing sophistication among the Private Equity industry
and its investors.
-40%
-20%
0%
20%
40%
60%
80%
100%
120%
1983 1984 1985 1986 1987 1988 1989 1990 1991 1992 1993 1994 1995 1996 1997 1998 1999 2000 2001 2002
LB
O F
un
d R
etu
rn a
nd
Vo
lati
lity
(%
)
Weighted Average Net IRR
Standard Deviation of Average Net IRR
Figure 29: Weighted Net Buyout Fund Returns and Volatility by Year (1980-2003)
Source: Venture Economics data, analyzed by author.
Between 1992 and 1995, volatility of buyout returns increased constantly and had doubled to
29.8% compared to the prior reference period. There are two explanations for this phenomenon.
First, fundraising activity in the buyout industry rose sharply from 1992 onwards, with higher total
capital raised, number of new funds and average deal size. Furthermore, the early 1990s saw an
increasing specialization of buyout funds according to geographical73 and sector specific criteria
73 In addition to its Pan-European funds, Private Equity firm Apax Capital Partners for instance raised 23
country-specific funds between 1980 and 2000, including funds in Germany, U.K., France, Israel, the United States and Japan.

Empirical Part I – Market and Financial Value Drivers 98
(Raschle 2001; Bance 2002). As a consequence, the standard deviation increased consistently
alongside. Secondly, the specialization within the buyout industry was a reaction to bigger
competition and the above mentioned structural changes in the economy. These posed new
challenges for buyout funds to clearly identify areas for value creation in leveraged buyout
transactions. Between 1999 and 2001, volatility rose sharply from 35.0% to 116.4% respectively.
The interpretation of these recent results can be only immature as the majority of investments made
by buyout funds during this time are unrealized investments. However, the high volatility between
positive and negative returns is likely to depend to some extent on the amount of investments made
by buyout funds in the information technology sector (and thus the number of portfolio company
write-downs or exits).
-40%
-20%
0%
20%
40%
60%
80%
100%
120%
1983 1984 1985 1986 1987 1988 1989 1990 1991 1992 1993 1994 1995 1996 1997 1998 1999 2000 2001 2002
Ve
ntu
re C
ap
ita
l F
un
d R
etu
rn a
nd
Vo
lati
lity
(%
)
Weighted Average Net IRR
Standard Deviation of Average Net IRR
Figure 30: Weighted Net Venture Capital Fund Returns and Volatility by Year (1980-2003)
Source: Venture Economics data, analyzed by author.
By comparison, the risk and return profile of the Venture Capital industry is characterized by
virtually constantly increasing volatility and returns between 1986 and 1994, followed by the
“internet boom”, which saw standard deviation peaking at 112.5% in 1998. The steady increase in
volatility was to a much lesser extent driven by increases in fund size, number of funds – which
remained roughly equal between 1986 and 1996 – and average fund sizes. The risk and return
profile is therefore more likely to be linked to the constantly gaining pace of development in the
information technology and communication sector and the increasing gap of success in
commercialization of these new products and services. A curious result is that despite Venture
Capital investments continued heavily until after the decline in stock market valuations in 2000, the
standard deviation of average net Venture Capital fund IRR already dropped significantly, by
88.5%, to 24.0% in 1999. In essence, the volatility of returns was low as it was more certain that

Empirical Part I – Market and Financial Value Drivers 99
the vast majority of Venture Capital funds would be losing money on their investments from 1999
onwards.
4.2.2.6. Performance Trends by Industry Sector
4.2.2.6.1. Level 3 Industry Classification
From a practitioner’s point of view, it is crucial to understand which industry sectors of Private
Equity investment have in the past – and may also in the future – lead to superior returns. The
presented data has been calculated based on Venture Economics’ fund performance data. In the
ideal case, the average returns would be calculated on a deal basis, but this data is not available.
Instead, each deal’s return was analyzed according to which fund it belonged to. Therefore, the
respective fund return serves as a proxy for the deal’s performance. The justification is that (i)
although each deal only impacts overall fund returns marginally through the diversification effect,
it does have a directional impact, and (ii) given the high amount of 36,117 deals, of which this
proxy performance data has been calculated, the results at least serve as a valid trend indicator.74
The results in figure 31 show that on average for all Private Equity funds, the information
technology sector has produced the highest average net fund returns of 15.6%, followed by non-
cyclical consumer goods with 14.7% as well as resources, financial services (12.6% each) and non-
cyclical services (12.3%). These results are in line with the above findings that the information
technology sector has also received the highest amount of funding (and the non-cyclical consumer
goods sector the third highest amount of funding). Conversely, it is imperative to make a
distinction between buyout and Venture Capital funds. Among buyout funds, the information
technology was the third heaviest invested sector, but average returns of buyout funds that invested
in this industry were low at only 1.9%, which stands in sharp contrast to the 16.6% average IRR
generated by Venture Capital funds. Even if this low result is influenced by the fact that to some
extent buyout funds primarily invested in information technology deals during the height of the
technology boom (1998-2000) and hence these funds have low maturities and low average returns
(J-curve effect), it supports the hypothesis that buyout funds should avoid investing in the
information technology industry sector.
74 The total amount of deals in the underlying Venture Economics database as of December 31, 2002, is
64,490. However, fund performance data has not been available for all transactions, hence the lower size of the sub-sample is 36,117 deals.

Empirical Part I – Market and Financial Value Drivers 100
0%
2%
4%
6%
8%
10%
12%
14%
16%
18%
INFO
RM
ATION
TECHNO
LOGY
NO
N-C
YCLI
CAL
CONSU
MER G
OODS
RESO
URCES
FINANCIA
LS
NO
N-C
YCLI
CAL.
SER
VICES
CYCLI
CAL
CONSU
MER G
OODS
BASIC
INDUSTR
IES
CYCLI
CAL
SER
VIC
ES
UTIL
ITIE
S
GEN
ERAL
INDUSTR
IALS
Av
era
ge
Ne
t F
un
d R
etu
rn (
%)
of
Inv
es
tme
nts
ma
de
in
In
du
str
y S
ec
tor
VC Funds LBO Funds Total Private Equity Funds
Figure 31: Average Net Fund Return of Investments made (1983-2003) by Level 3 Industry Sector (Proxy Trend)
Source: Venture Economics data, analyzed by author.
As illustrated in figure 31, the highest average buyout fund returns are resulting from investments
in the financial service industry (15.4% average net fund return), basic industries (11.7% average
net fund return), cyclical consumer goods (10.2% average net fund return), resources (10.1%
average net fund return) as well as non-cyclical services and consumer goods (9.2% average net
fund return each). The utilities sector has proven to be less attractive with only 5.3% average net
fund return. The attractiveness of the financial services industry is surprising, as the deal flow in
this industry is relatively limited (due to national interests and regulatory hurdles few investment
opportunities have become available in the past). The same fact is true for basic industries and
resources – both show strong performance, but even lower deal flow than the financial sector. The
interpretation of this result is that either there is a scarcity of deals in these attractive sectors or
buyout fund manager have given these sectors lower attention than deserved from a return
perspective.

Empirical Part I – Market and Financial Value Drivers 101
-
10.000
20.000
30.000
40.000
50.000
CYCLI
CAL
SER
VIC
ES
NO
N-C
YCLI
CAL
CONSU
MER G
OODS
INFO
RM
ATION T
ECHNO
LOGY
GEN
ERAL IN
DUSTR
IALS
CYCLI
CAL
CONSU
MER G
OODS
BASIC
INDUSTR
IES
FINANCIA
LS
NO
N-C
YCLI
CAL.
SER
VICES
RESO
URCES
UTIL
ITIE
S
Fu
nd
s I
nves
ted
($ m
m)
0%
2%
4%
6%
8%
10%
12%
14%
16%
18%
Avera
ge N
et
Fu
nd
Retu
rn (
%)
of
Inves
tme
nts
mad
e i
n I
nd
us
try S
ecto
r
Capital Invested by LBO Funds Average Net IRR
Figure 32: Average Net Buyout Fund Return of Investments made (1983-2003) by Industry Sector (Proxy Trend) vs. Total
Amount of Deal Investments (1980-2002) by Industry Sector (Level 3)
Source: Venture Economics data, analyzed by author.
Among Venture Capital funds, average net fund returns for investments in the information
technology sector, the key area of investment, have resulted into 16.6% average net IRR. The
second highest average returns have been generated in the non-cyclical consumer goods sector
(15.5% average net fund return), followed by resources (14.7% average net fund return) and non-
cyclical services (12.9% average net fund return). A significant result from this analysis is that with
the exception of non-cyclical services and resources (potential scarcity of deals), the Venture
Capital return profile reflects the amount of capital invested in all industry sectors. In other words,
capital allocation within the Venture Capital industry appears to be more efficient compared to the
buyout sector, as Venture Capital managers are more proficient to identify sectors with the best
investment opportunities and predict expected returns. One explanation for this phenomenon is
likely to be linked to the nature of Venture Capital investing, in which investment opportunities are
evaluated at an early stage of the investment target’s life cycle. Venture capitalists can take a
shorter view on the target’s potential for commercial success compared to buyout investment
managers, thus potentially increasing their level of predictability.75
75 On the contrary, Venture Capital investments and fund returns have demonstrated to have a higher
volatility of returns.

Empirical Part I – Market and Financial Value Drivers 102
-
25.000
50.000
75.000
100.000
125.000
150.000
175.000
200.000
225.000
INFO
RM
ATION T
ECHNO
LOGY
NO
N-C
YCLI
CAL
CONSU
MER G
OODS
CYCLI
CAL
SER
VIC
ES
NO
N-C
YCLI
CAL.
SER
VICES
GEN
ERAL IN
DUSTR
IALS
FINANCIA
LS
CYCLI
CAL
CONSU
MER G
OODS
BASIC
INDUSTR
IES
RESO
URCES
UTIL
ITIE
S
Fu
nd
s I
nveste
d (
$ m
m)
0%
2%
4%
6%
8%
10%
12%
14%
16%
18%
Avera
ge N
et
Fu
nd
Retu
rn (
%)
of
Investm
en
ts m
ad
e i
n I
nd
ustr
y S
ecto
r
Capital Invested by VC Funds Average Net IRR
Figure 33: Average Net Venture Capital Fund Return of Investments made (1983-2003) by Industry Sector (Proxy Trend) vs.
Total Amount of Deal Investments (1980-2002) by Industry Sector (Level 3)
Source: Venture Economics data, analyzed by author.
4.2.2.6.2. Level 4 Industry Classification
Results of the return analysis of the Level 4 industry classification offer deeper insights into the
attractiveness of various industry subsectors. The most profitable investment area of total Private
Equity funds has been the health sector, with an average net fund IRR of 17.0%. This high return
was primarily enhanced by successful investments of Venture Capital funds, which achieved an
average net fund IRR of 18.0% in this segment. The healthcare sector has thus demonstrated to
have favorable long-term industry dynamics. It has traditionally been a stable and growing industry,
driven for example by constantly increasing levels of healthcare spending in the major developed
economies and the advancements in the medical field. The second most attractive subsector has
been banks, with an average net fund IRR of 15.9%. Also, average net fund returns for the
specialty and other finance subsector were 12.3%. Despite a low level of deal flow in these
subsectors, based on these findings the financial services industry in general should be given higher
attention by the Private Equity community in the search for investment opportunities. Other
attractive returns can be registered for funds that invested in software and computer services
(15.9% average net fund IRR), information technology and hardware (15.0% average net fund
IRR), beverages and mining (each 13.0% average net fund IRR) and the oil and gas subsector
(12.6% average net fund IRR).
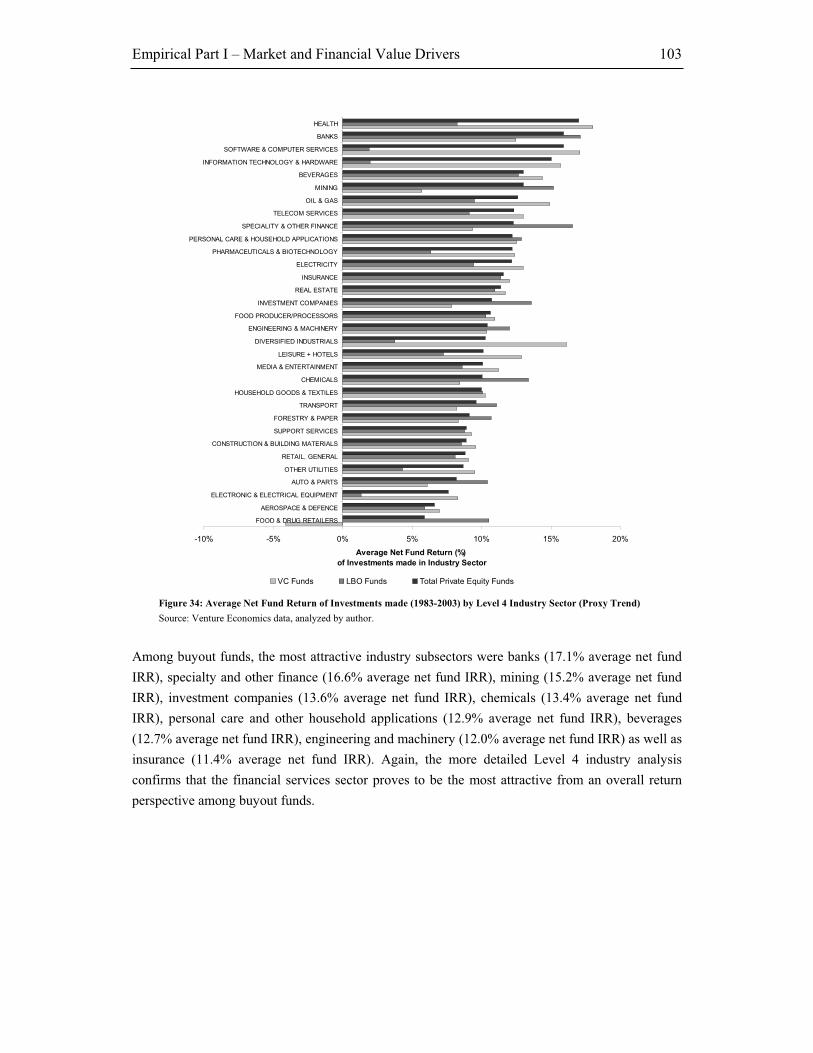
Empirical Part I – Market and Financial Value Drivers 103
-10% -5% 0% 5% 10% 15% 20%
FOOD & DRUG RETAILERS
AEROSPACE & DEFENCE
ELECTRONIC & ELECTRICAL EQUIPMENT
AUTO & PARTS
OTHER UTILITIES
RETAIL, GENERAL
CONSTRUCTION & BUILDING MATERIALS
SUPPORT SERVICES
FORESTRY & PAPER
TRANSPORT
HOUSEHOLD GOODS & TEXTILES
CHEMICALS
MEDIA & ENTERTAINMENT
LEISURE + HOTELS
DIVERSIFIED INDUSTRIALS
ENGINEERING & MACHINERY
FOOD PRODUCER/PROCESSORS
INVESTMENT COMPANIES
REAL ESTATE
INSURANCE
ELECTRICITY
PHARMACEUTICALS & BIOTECHNOLOGY
PERSONAL CARE & HOUSEHOLD APPLICATIONS
SPECIALITY & OTHER FINANCE
TELECOM SERVICES
OIL & GAS
MINING
BEVERAGES
INFORMATION TECHNOLOGY & HARDWARE
SOFTWARE & COMPUTER SERVICES
BANKS
HEALTH
Average Net Fund Return (%)
of Investments made in Industry Sector
VC Funds LBO Funds Total Private Equity Funds
Figure 34: Average Net Fund Return of Investments made (1983-2003) by Level 4 Industry Sector (Proxy Trend)
Source: Venture Economics data, analyzed by author.
Among buyout funds, the most attractive industry subsectors were banks (17.1% average net fund
IRR), specialty and other finance (16.6% average net fund IRR), mining (15.2% average net fund
IRR), investment companies (13.6% average net fund IRR), chemicals (13.4% average net fund
IRR), personal care and other household applications (12.9% average net fund IRR), beverages
(12.7% average net fund IRR), engineering and machinery (12.0% average net fund IRR) as well as
insurance (11.4% average net fund IRR). Again, the more detailed Level 4 industry analysis
confirms that the financial services sector proves to be the most attractive from an overall return
perspective among buyout funds.

Empirical Part I – Market and Financial Value Drivers 104
-
5.000
10.000
15.000
20.000
25.000
BANKS
SPECIA
LITY &
OTH
ER
FINANCE
MIN
ING
INVE
STMENT
COM
PANIE
S
CHEM
ICALS
PERSO
NAL
CAR
E &
HOUSEH
OLD
APPLIC
ATI
ONS
BEVE
RAG
ES
ENGIN
EER
ING
&M
ACHIN
ERY
INSU
RANCE
TRAN
SPO
RT
REAL
ESTATE
FORESTR
Y &
PAPER
FOOD &
DRUG
RET
AILER
S
AUTO
& P
ARTS
FOOD P
RO
DUCER/P
RO
CESSO
RS
HO
USEHOLD
GOO
DS &
TEXTI
LES
OIL
& G
AS
ELECTR
ICIT
Y
TELE
CO
M S
ERVIC
ES
SUPPO
RT S
ERVIC
ES
MED
IA &
ENTER
TAIN
MENT
CO
NSTR
UCTIO
N &
BUIL
DIN
G M
ATERIA
LS
HEALT
H
RETAIL
, GEN
ERAL
LEIS
URE +
HOTELS
PHAR
MACEU
TICALS
& B
IOTEC
HNO
LOGY
AERO
SPACE
&DEFEN
CE
OTH
ER
UTIL
ITIE
S
DIV
ERSIF
IED IN
DUSTR
IALS
INFO
RM
ATIO
NTEC
HNO
LOGY &
HARDW
ARE
SOFT
WAR
E & C
OM
PUTE
R S
ERVIC
ES
ELECTR
ONIC
& E
LECTR
ICAL
EQ
UIP
MENT
Fu
nd
s I
nv
es
ted
($
mm
)
0%
2%
4%
6%
8%
10%
12%
14%
16%
18%
Av
era
ge
Ne
t F
un
d R
etu
rn (
%)
of
Inv
es
tme
nts
ma
de
in
In
du
str
y S
ec
tor
Capital Invested by LBO Funds Average Net IRR
Figure 35: Average Net Buyout Fund Return of Investments made (1983-2003) by Industry Sector (Proxy Trend) vs. Total
Amount of Deal Investments (1980-2002) by Industry Sector (Level 4)
Source: Venture Economics data, analyzed by author.
The above findings that average returns of buyout funds that invested in the information technology
sector are dismal, finds further evidence. Electronic and electrical equipment (1.3% average net
fund IRR), software and computer services (1.9% average net fund IRR) and information
technology and hardware (2.0% average net fund IRR) confirm that buyout fund investment in
these areas should be avoided. Investments in the diversified industry subsector only returned 3.8%
average net fund IRR. This result is surprising, because diversified industries have traditionally
been preferred takeover targets of buyout funds as they offered scope to eliminate conglomerate
discounts by selling off individual divisions. This result is even more puzzling if the average net
fund IRR of 16.1% achieved by Venture Capital funds in diversified industrial groups is considered.
On average, venture investments therefore appear to be more successful in this subsector.
Among Venture Capital funds, the health (18.0% average net fund IRR), software and computer
services (17.1% average net fund IRR), diversified industrials (16.1% average net fund IRR),
information technology and hardware (15.7% average net fund IRR), oil and gas (14.9% average
net fund IRR), beverages (14.4% average net fund IRR) and electricity (13.0% average net fund
IRR) subsectors post the highest returns. Again, the more detailed Level 4 industry analysis
confirms that Venture Capital funds are more efficient than buyout funds with respect to capital
allocation to industries with high return perspectives (see figure 36).

Empirical Part I – Market and Financial Value Drivers 105
-
25.000
50.000
75.000
100.000
125.000
150.000
175.000
HEALT
H
SOFT
WAR
E &CO
MPUTE
R S
ERVIC
ES
DIV
ERSIF
IED
INDUSTR
IALS
INFO
RM
ATION T
ECHNO
LOGY &
HARDW
ARE
OIL
& G
AS
BEVER
AG
ES
ELE
CTR
ICIT
Y
TELE
CO
M S
ERVIC
ES
LEIS
URE +
HOTELS
PERSO
NAL
CAR
E &
HOUSEH
OLD
APPLIC
ATIONS
BANKS
PHAR
MACEU
TICALS
& B
IOTE
CHNO
LOGY
INSU
RANCE
REAL
ESTATE
MED
IA&
ENTER
TAIN
MEN
T
FOOD P
RO
DUCER
/PRO
CES
SORS
ENGIN
EERIN
G &
MAC
HIN
ERY
HO
USEHOLD
GOO
DS &
TEXTIL
ES
CO
NSTR
UCTIO
N &
BUIL
DIN
G M
ATERIA
LS
OTH
ER U
TILIT
IES
SPEC
IALI
TY &OTHER
FIN
ANCE
SUPPO
RT S
ERVIC
ES
RETAIL
, GEN
ERAL
CHEM
ICALS
FORESTR
Y &
PAPER
ELE
CTR
ONIC
& E
LECTR
ICAL
EQ
UIP
MEN
T
TRANSPO
RT
INVE
STMENT
COM
PANIE
S
AERO
SPACE
&DEFEN
CE
AUTO
& P
ARTS
MIN
ING
FOOD &
DRUG R
ETAIL
ERS
Fu
nd
s I
nv
es
ted
($
mm
)
-5%
0%
5%
10%
15%
20%
Avera
ge N
et
Fu
nd
Retu
rn (
%)
of
Investm
en
ts m
ad
e in
In
du
str
y S
ecto
r
Capital Invested by VC Funds Average Net IRR
Figure 36: Average Net Venture Capital Fund Return of Investments made (1983-2002) by Industry Sector (Proxy Trend) vs.
Total Amount of Deal Investments (1980-2002) by Industry Sector (Level 4)
Source: Venture Economics data, analyzed by author.
4.2.2.7. Private Equity Returns across Countries
Due to the highly mature Private Equity market in the U.S., attention of Private Equity investment
has progressively shifted towards Europe in recent years as fierce competition among Private
Equity funds is eroding overall returns. The results of average fund returns of Private Equity funds
on a country basis show that two European countries illustrate that this trend is valid. Average
Private Equity returns for Sweden are 19.5%, followed by Italy (12.1% average fund return). The
U.S. and Luxembourg rank third with 9.5% average fund return, with lower average fund returns
for Finland (7.6% average fund return) and the United Kingdom (7.4% average fund return).
-15%
-10%
-5%
0%
5%
10%
15%
20%
25%
30%
Swed
en Italy
USA
Luxe
mbo
urg
Finland
Uni
ted
Kingd
omSpa
in
Franc
e
Net
herla
nds
Hon
g Kon
g
Switz
erland
Ger
man
y
Singa
poreA
vera
ge
Fu
nd
Re
turn
(%
)
VC Funds LBO Funds Total Private Equity Funds
Figure 37: Average Net Fund Returns (1983-2002) by Country
Source: Venture Economics data, analyzed by author.
Due to the fact that the data is to some extent biased by the number, mix and maturity of underlying
funds, the results of this analysis do not provide sufficient evidence for significant European

Empirical Part I – Market and Financial Value Drivers 106
dominance among Private Equity fund returns. This result will be presented in the next section by
comparing U.S. and European returns across years. Amongst buyout funds, the Scandinavian
countries exhibit peak buyout fund performance with Sweden (24.8% average fund return) and
Finland (13.9% average fund return), while Italy (12.1% average fund return) and Luxembourg
(11.4% average fund return) are also strong buyout markets. Average fund returns in other central
European key buyout markets Germany (2.1% average fund return), France (4.5% average fund
return) and the United Kingdom (8.2% average fund return) are bleak.76 Also, the immaturity of the
European Venture Capital market is underlined by the overall low returns.
4.2.2.8. Private Equity Returns by Geography
As mentioned above, the analysis across countries is somewhat biased by the incomparable number,
mix and maturity of investments and their underlying funds. The following three figures reveal the
performance of investments according to geography, made by buyout funds, Venture Capital funds
as well as all Private Equity funds.77
-20%
-10%
0%
10%
20%
30%
40%
50%
1980 1981 1982 1983 1984 1985 1986 1987 1988 1989 1990 1991 1992 1993 1994 1995 1996 1997 1998 1999 2000 2001 2002
Av
era
ge
Ne
t F
un
d R
etu
rn (
%)
of
Inv
es
tme
nts
ma
de
in
Ye
ar
European PE Deals US PE Deals Total PE Deals
Figure 38: Average Net Private Equity Fund Returns (1980-2002) of Investments made by Year and by Region (Fund’s
jurisdiction)
Source: Venture Economics data, analyzed by author.
However, the large number of Venture Capital deals in this sub-sample skews the results for
average net fund IRRs by year for the total of all Private Equity deals towards the results of the
Venture Capital deals.
76 It should be noted that in Europe, a large number of Private Equity firms (especially US funds) operate out
of the United Kingdom, where they may also raise funds, and invest across Europe. Hence, average fund returns by country do not necessarily reflect the geographical investment focus of Private Equity firms.
77 Transactions are categorized as “US” region, if the investing fund is raised in the US or Canada, and categorized “European” if the investing fund is raised in the United Kingdom, Germany, France, Italy, Spain, Switzerland, Luxembourg, Belgium, the Netherlands, Ireland, Denmark, Finland, Norway or Sweden.

Empirical Part I – Market and Financial Value Drivers 107
Figure 39 shows average net fund returns of Venture Capital funds raised either in the U.S. or
Europe.78 The results highlight the major trends in Venture Capital fund returns since 1980. The
early 1980s are characterized by high average net fund returns that ranged between 25.6% in 1980
to 17.8% in 1982. Between 1983 and 1987, Venture Capital returns fell sharply to 6.6% in 1987.
From 1988, the rise of information technology and telecommunication investments led to a
consistent growth of average returns to Venture Capital funds, reaching 46.5% in 1998 at the height
of the technology and internet boom. The most significant finding of these results is that European
Venture Capital returns have been consistently lower than in the U.S. This gap has been in the
range of 2-3 percentage points between 1988 and 1993, but has widened substantially by 1998,
when average fund returns of U.S. investments were more than twice as high (50.9%) than
European investments (22.6%). Therefore, if this clear historic trend remains valid, Private Equity
fund investors on average should generate higher returns with U.S. Venture Capital funds. This
result may also support the fact that the European Venture Capital industry is by far more
underdeveloped compared to the U.S.
-20%
-10%
0%
10%
20%
30%
40%
50%
60%
1980 1981 1982 1983 1984 1985 1986 1987 1988 1989 1990 1991 1992 1993 1994 1995 1996 1997 1998 1999 2000 2001 2002Av
era
ge
Ne
t F
un
d R
etu
rn (
%)
of
Inv
es
tme
nts
ma
de
in
Ye
ar
European VC Deals US VC Deals All VC Deals
Figure 39: Average Net Venture Capital Fund Returns (1980-2002) of Investments made by Year and by Region (Fund’s
jurisdiction)
Source: Venture Economics data, analyzed by author.
By contrast, average fund returns of investments made by European buyout funds have consistently
been higher than in the U.S., with spreads in the range of 5% and up to 10% in single years. In
1989, European funds appear to have been less affected by the stock market shock, yielding
average net fund returns on investments in this year of 25.7% compared to U.S. average returns of
13.8%. The apparent higher resistance to external shocks, e.g. fall in stock markets or economic
downturns, is also confirmed in 1992, when average net funds returns on European investments
were 20.9% compared to 12.8% in the U.S., as well as more recently in 2002, when average net
funds returns on European investments were -1.1% compared to -9.6% in the U.S. The results of
78 It is assumed here that the majority of investments across all funds are also made in the country (region) of
the fund’s jurisdiction, i.e. a fund raised in the US is on average investing in the US.
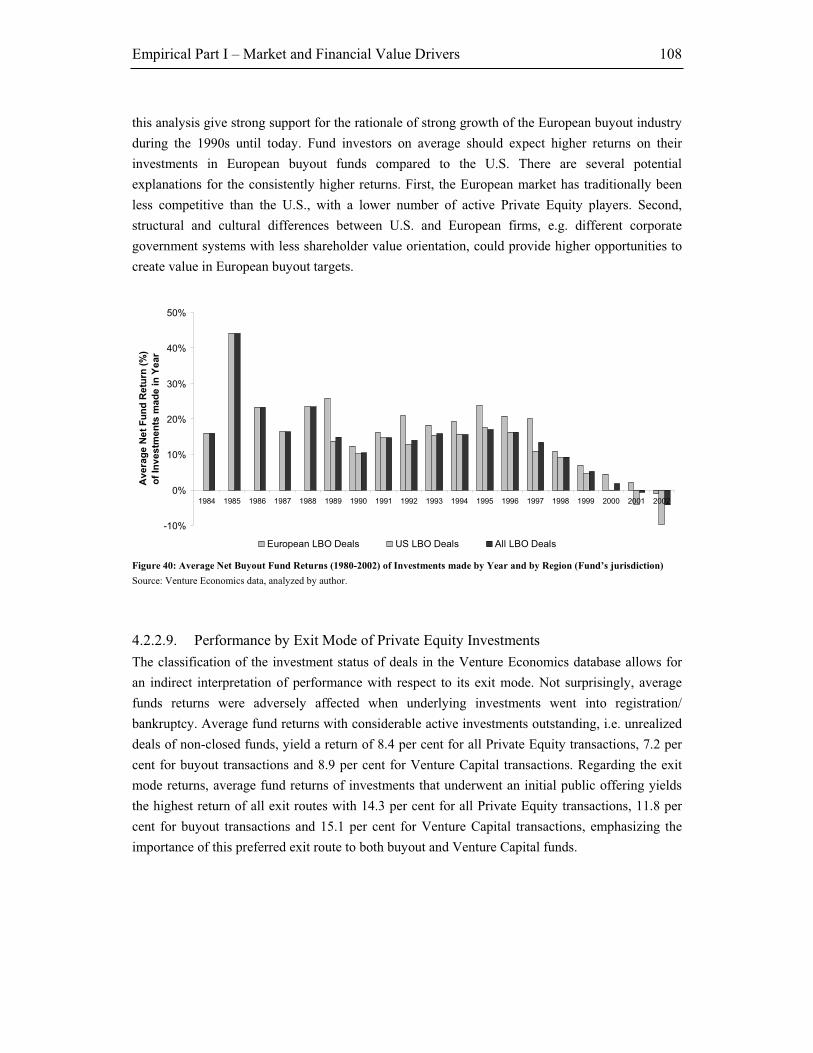
Empirical Part I – Market and Financial Value Drivers 108
this analysis give strong support for the rationale of strong growth of the European buyout industry
during the 1990s until today. Fund investors on average should expect higher returns on their
investments in European buyout funds compared to the U.S. There are several potential
explanations for the consistently higher returns. First, the European market has traditionally been
less competitive than the U.S., with a lower number of active Private Equity players. Second,
structural and cultural differences between U.S. and European firms, e.g. different corporate
government systems with less shareholder value orientation, could provide higher opportunities to
create value in European buyout targets.
-10%
0%
10%
20%
30%
40%
50%
1984 1985 1986 1987 1988 1989 1990 1991 1992 1993 1994 1995 1996 1997 1998 1999 2000 2001 2002
Av
era
ge
Ne
t F
un
d R
etu
rn (
%)
of
Inv
es
tme
nts
ma
de
in
Ye
ar
European LBO Deals US LBO Deals All LBO Deals
Figure 40: Average Net Buyout Fund Returns (1980-2002) of Investments made by Year and by Region (Fund’s jurisdiction)
Source: Venture Economics data, analyzed by author.
4.2.2.9. Performance by Exit Mode of Private Equity Investments
The classification of the investment status of deals in the Venture Economics database allows for
an indirect interpretation of performance with respect to its exit mode. Not surprisingly, average
funds returns were adversely affected when underlying investments went into registration/
bankruptcy. Average fund returns with considerable active investments outstanding, i.e. unrealized
deals of non-closed funds, yield a return of 8.4 per cent for all Private Equity transactions, 7.2 per
cent for buyout transactions and 8.9 per cent for Venture Capital transactions. Regarding the exit
mode returns, average fund returns of investments that underwent an initial public offering yields
the highest return of all exit routes with 14.3 per cent for all Private Equity transactions, 11.8 per
cent for buyout transactions and 15.1 per cent for Venture Capital transactions, emphasizing the
importance of this preferred exit route to both buyout and Venture Capital funds.

Empirical Part I – Market and Financial Value Drivers 109
0% 2% 4% 6% 8% 10% 12% 14% 16%
Bankruptcy - Chapter 7
Other
Bankruptcy - Chapter 11
In Registration
Active Investment
LBO
Defunct
Merger
Acquisition
Went Public
Weighted Average Fund Returns on Deals with above indicated Investment Status (%)
VC Funds LBO Funds Total Private Equity Funds
Figure 41: Weighted Average Net Fund Returns of Funds based on Investment Status
Source: Venture Economics data, analyzed by author.
With respect to non-public market exit routes, strategic acquisitions follow the public market route
as the most attractive exit mode. Average fund returns on strategic acquisitions are 12.8 per cent for
all Private Equity transactions, 11.3 per cent for buyout transactions and 13.3 per cent for Venture
Capital transactions. The apparently high average purchase price paid by strategic acquirers to the
funds points to potentially attractive perceived synergies in these deals. As a consequence, potential
synergies in merger transactions are more equally shared between acquirer and seller (the fund),
which leads to average fund returns of investments that underwent mergers to be in the lower at
approximately 10.5 per cent.
The (secondary) leveraged buyout as an exit route of an investment on average ranks behind both
the public market as well as the other corporate acquisition modes, yielding 9.3 per cent of average
fund return on these transactions. However, for buyout funds, this exit route is significantly higher,
yielding 11.7 per cent of average fund returns, which is comparable to the most attractive exit via
an initial public offering. This underscores that buyout funds are able to create considerably higher
value from secondary buyouts than other Private Equity funds (i.e. Venture Capital funds). One
possible explanation could be seen in the extensive experience of buyout firms with this type of
transaction. Through in-depth insider knowledge of the investment, the ability to evaluate the
investment company’s debt capacity coupled with a negotiation advantage over the acquiring fund,
the buyout firm appears to make a correct and informed judgment in such a way that by choosing a
secondary buyout as exit mode it extracts the maximum possible value from the disposal. This
supports similar evidence of an experience effect in leveraged buyout transactions.79
79 Compare analysis in section 5.3. in the second empirical chapter.

Empirical Part I – Market and Financial Value Drivers 110
4.2.2.10. Performance by Investment Stage of Private Equity Investments
The classification of the investment stage or financing round of deals in the Venture Economics
database allows for an indirect interpretation of performance with respect to optimal timing of
investment during the lifetime of a company. The overall picture shows no dominant trend with
respect to favorable investment timing. Against often cited opposing statements in the Private
Equity industry, seed (14.5% average fund IRR) and startup (9.8% average fund IRR) financing
display very solid average fund returns. The high returns for the seed and startup stages must be
considered, however, as the investor’s compensation for an extremely high level of risk involved in
these initial funding rounds. Returns on early stage (6.1% average fund IRR), first (8.7% average
fund IRR) and second (7.9% average fund IRR) round financing are less attractive than later
financing stages in the maturity of a company such as third stage (9.9% average fund IRR),
expansion (9.9% average fund IRR) and other later stage (10.3% average fund IRR) financing.
Bridge loan profits (5.2% average fund IRR) are lower than (equity) bridges (12.5% average fund
IRR) due to the lower level of risk.80
0% 2% 4% 6% 8% 10% 12% 14% 16% 18%
Seed
Startup
Early Stage
First Stage
Second Stage
Third Stage
Expansion
Other Later Stage
Bridge Loan
Bridge
Acquisition
Acq. for Expansion
Open Market Purchase
LBO
Turnaround
Investm
en
t S
tag
e b
y M
atu
rity
of
Co
mp
an
y
Weighted Average Fund Returns on Deals with above indicated Investment Stage (%)
VC Funds LBO Funds Total Private Equity Funds
Figure 42: Weighted Average Net Fund Returns of Funds based on Investment Stage
Source: Venture Economics data, analyzed by author.
80 In general, bridge loans are secured with share pledges and asset collateral. They can therefore be almost
considered as a debt financing instrument.

Empirical Part I – Market and Financial Value Drivers 111
Open market purchase transactions (13.8% average fund IRR), especially executed by buyout funds,
(16.8% average fund IRR), exhibit very high average returns. These deals generally involve buying
a controlling stake in underpriced publicly listed companies and forcing management to implement
radical changes. LBO deals, which on average returned 8.1% to funds, show the lowest variance
between Venture Capital and buyout funds. The average fund return of turnaround investments is
low (4.4% of average IRR) and – given the high level of risk involved in these transactions – does
not reflect an adequate compensation for risk. Interestingly, Venture Capital funds are more
successful (5.1% of average IRR) than buyout funds (3.7% of average IRR). This could potentially
be interpreted in such a way that the more entrepreneurial or operationally weighted skill set of
Venture Capitalists provides a higher rate of success in turnaround situations.
4.2.2.11. Summary of Findings
This section has provided detailed Private Equity, Buyout and Venture Capital fund performance
information based on the secondary control population dataset from Venture Economics. From a
historical perspective, buyout funds that were raised in the early “golden years” of the 1980s, i.e.
between 1983 and 1985, performed exceptionally well. Funds raised between 1986 and 1991
performed more volatile, with conditions improving notably between 1992 to 1994. From 1995
onwards, the j-curve effect led to a natural decline in average buyout fund returns. One key finding
from the dataset was the fact that weighted returns were consistently higher than non-weighted
returns, which effectively means that larger funds always performed better. This result proves
skeptics of the ever-increasing Private Equity fund sizes wrong and supports a theory of “survival
of the fittest” (i.e. largest) among Private Equity firms. The high observed historical returns have
been accompanied by equally high, varying levels of risk, measured as standard deviation of fund
returns. This could especially be detected for funds raised in the early 1980s, which could be
interpreted as a time of “professionalization” and early consolidation of the industry. Not
surprisingly given the equity market conditions, fund return volatility between 1999 and 2002 was
also exceptionally high, but on average complemented with low levels of return. With respect to
most attractive industry sectors for investment, the fund approximation of investment returns
showed that the information technology sector produced the highest overall returns. However,
buyout funds investing in this sector were found to perform substantially worse than Venture
Capital funds, which led to the conclusion that buyout funds should not diversify into early stage
investments. By contrast, buyout funds were successful investors in industries such as financial
services and basic industries. However, while Venture Capital funds directed most of their capital
into industry sectors that produced high returns for them, especially into IT, buyout funds directed
most of their capital ill-fated, i.e. without a logical expected ROI pattern.
The comparison of Private Equity returns between countries showed two distinctive trends: first,
Venture Capital investing in Europe was dismal, while performing strongly in the U.S.; secondly,
buyout fund investing in Europe, by contrast, was significantly more attractive from a return
perspective than in the U.S., which supports theories of Europe as a less competitive buyout
Empirical Part I – Market and Financial Value Drivers 112
investment landscape. Among individual countries, Scandinavia (Sweden and Finland), Italy, the
United Kingdom and Luxembourg proved to reward buyout funds raised in these jurisdictions with
above average (and above U.S.) returns. Finally, the analysis of exit methods of investments in the
Venture Economics database exhibited that initial public offerings had the most beneficial impact
on fund returns, followed by strategic sales. On the entry side, public-to-private transactions
undertaken by buyout funds demonstrated to be highly lucrative, while Venture Capital investment
showed exceptional returns on the seed capital and later-stage financing events for their investing
funds.

Empirical Part I – Market and Financial Value Drivers 113
4.3. Leveraged Buyout Deal Performance
The performance of Private Equity as an investment asset class has historically been an under-
researched field, mainly because of a general lack of access to data of these private transactions.
Several authors have contributed more recently to lift some of the mystery around cash flow, return
and risk characteristics. Kaplan and Schoar (2003) using a data set of individual fund returns
collected from Venture Economics, the Private Equity industry information provider, investigate
performance of Private Equity partnerships and find that average returns net of fees approximately
equal the S&P 500 performance over the sample period, although there is a large degree of
heterogeneity. By contrast, Ljungqvist and Richardson (2003) using actual cash flow information
show that Private Equity generates excess returns on the order of five plus per cent per annum
relative to the aggregate public equity market, which they interpret as a compensation to investors
for holding a 10-year highly illiquid investment.
However, despite these new insights in the return dynamics of Private Equity investment, both
papers focus on net fund level returns to Limited Partners. They lack the critical link to each
underlying portfolio company and their respective performance and gross contribution to the fund.
Moreover, no information has been available for them to analyze, what the actual drivers of value
creation (or value destruction) had been for each individual investment. On the fund level, they
have not provided important descriptive information about return characteristics of certain industry
segments and across time. Therefore, based on the primary sample, the following sections of the
first empirical part of this study seek to provide more in-depth answers to the following questions:
1. Do Private Equity Funds, especially LBO Funds, and in particular individual
LBO transactions create value, i.e. do they provide (market-adjusted) 81
abnormal returns for investors? If so, how does this performance compare to
performance of public market indices in the exact same industries over the
exact same time horizon?
2. How do we explain this performance on the LBO deal-level? Which intrinsic
and extrinsic factors are driving the underlying value creation mechanisms
that determine the observed performance?
This first section will study buyout deal performance on the company level and focus on question
two of the above by examining some of the market and acquisition related value drivers in detail.
The subsequent section will then compare buyouts to public market performance and explores
industry financial drivers in more detail.
81 Market-adjusted means returns after deducting returns achieved by comparable investments in public
market securities (stocks, indices) over the same time period. Note that the return comparison is not risk-adjusted.
Empirical Part I – Market and Financial Value Drivers 114
4.3.1. Test Setting
The results from the control group analysis in section 4.2. have provided a first illustration that
there is a range of general trends in buyout returns across time and industries. In order to make
these trends more explicit as well as to control for these effects and other market and acquisition
related effects throughout this study, each of these trends and potential impacts is being tested for
statistical significance with respect to buyout returns. The groups of variables tested in this section
include:
- Realized vs. Unrealized buyout deals
- U.S. vs. European buyout deals
- Buyout deals by country of origin
- Buyout deals by industry classification
- Buyout deals by percentage of ownership stake acquired
- Buyout deals by deal size
- Buyout deals by investment holding period
- Buyout deals by entry mode
- Buyout deals by exit mode
- Buyout deals by entry type
- Buyout deals by exit type
- Buyout deals by General Partner
Descriptive results on the primary sample according to these dimensions will be presented in a
similar way as for the control group sample of Venture Economics data. In addition, each group of
variables is tested through multivariate regression models. The test section ends with a combined
regression among all of the above outlined variables in order to illustrate the combined explanatory
power of these “control” variables.
4.3.1.1. Tested Variables and Hypotheses
In the following, several testable hypotheses for the above outlined variable groups are presented,
based on (i) findings from the control group, (ii) literature findings, and (iii) pre-study industry
expert interviews.
The investment status of the buyout target under review is likely to determine the average level of
reported gross performance. As observed in section 4.2.2.1. of the control sample analysis, the J-
curve effect necessarily leads to low return characteristics of recently, non-exited investments. It is
therefore expected that
H1.) Gross buyout deal performance of unrealized transactions is lower than for realized
buyout deals.

Empirical Part I – Market and Financial Value Drivers 115
As observed in section 4.2.2.2. of the VE dataset, there have been exceptionally high returns for
some transaction years, especially in the early 1980s and during the information technology boom
(and accompanying stock market rally). Accordingly, it is expected that
H2.) Gross buyout deal performance for transactions undertaken during the early 1980s
as well as during the internet boom and stock market rally between 1997 and 2000 is
higher than for other years under review.
As observed in the control sample in figure 38 in section 4.2.2.8., the geographic location seems to
have an impact on buyout fund return. European buyout funds have performed significantly better
than their comparable U.S. funds. From an industry point of view, this is supported by the overall
trend of U.S. funds to set foot in Europe and/or to invest in European transactions. In line with the
results for buyout funds, it is expected that
H3.) Gross buyout deal performance of European transactions is higher than for U.S.
target companies.
The country/region of the buyout target might have an effect on performance due to country-
specific (tax) laws and regulation or volatility and growth of GDP. The results for buyout net fund
returns according to country in section 4.2.2.7. underlined the above finding that funds based on
European jurisdictions, e.g. Scandinavia, have been more successful than their U.S. counterparts.
Accordingly, it is also expected that
H4.) Gross buyout deal performance for transactions undertaken in European nations are
by and large higher than for U.S. target companies.
The industry of the buyout target might affect buyout performance, as each industry relies on its
specific growth dynamics, business cycles, competition, etc. Less volatile industries, e.g. utilities,
food & beverage, commodities offer greater stability, but also less growth potential, which may
determine the success of the buyout. The VE dataset analysis revealed that several industries,
including the financial services and information technology sector have demonstrated attractive
returns overall, but investments by buyout funds in the information technology sector have been
dismal. However, these results have been based on a proxy measure of fund return. Based on the
primary sample of LBOs, this trend will therefore be verified. It is therefore expected that
H5.) Gross buyout deal performance for investments undertaken in the information
technology sector has been lower than in other industries.
The percentage of ownership stake acquired is to some extent directly impacting the level of
influence of the acquiring General Partner and its ability to exercise control over management
decisions. La Porta, Lopez de Silanes et al. (1999) in their analysis of corporate ownership around
the world found that minority shareholders are systematically expropriated. The dynamics in the
private market for buyouts may be similar, i.e. minority investments of buyout firms are dependent
on decisions of the majority control holders. It is therefore expected that

Empirical Part I – Market and Financial Value Drivers 116
H6.) Gross buyout deal performance for minority investments in buyout targets is lower than
transactions, in which the General Partner has majority control (defined as more than
75%).
The size of the buyout target might be an indicator for buyout performance. However, as financial
information is only available for a smaller sample of buyouts, the amount of capital invested
serves as a proxy for the size of the business. An acquisition of a smaller target could have
advantages for faster deal execution and implementation of value enhancing strategies. Section
4.2.2.6.1. has shown that capital allocation by Venture Capital funds was more efficient across
industries than buyout funds. However, section 4.2.1. provided initial evidence that the rise in
average fund sizes could be related to the fact that larger funds (with therefore larger investments)
achieved higher returns, i.e. outperform. Based on the LBO deal sample, it is therefore expected
that
H7.) Gross buyout deal performance for larger investments in buyout targets is higher than
for transactions with low investment.
Based on the theoretical computation of the IRR formula (see section 3.5.3.), the longer the time
between investment into the company and exit, i.e. the investment’s holding period, the higher
must be the gain at the time of exit to generate meaningful IRRs. The exit is conditional on the
speed with which the sponsor is able to implement its value creation strategy and to some extent on
capital market conditions. It is therefore expected that
H8.) Gross buyout deal performance is lower the longer the holding period of the investment
is.
As mentioned above, the entry and exit conditions of buyout transactions are expected to be
important explanatory variables of performance. The entry mode into the buyout company can
have several different forms for the buyout firm. Possible entry modes include (i) an outright
acquisition of the target by the sponsor or through a third party (i.e. resulting into a minority
investment in the latter case), (ii) a participation in an acquisition financing, i.e. either through
investment in equity, preferred equity or a high yielding debt instrument by the sponsor, (iii)
growth capital, in which a buyout fund either participates in a venture-type financing or supports a
buyout’s growth strategy at a later stage than at the time of the original acquisition, and (iv) a
recapitalization of the company, in which the target is being re-levered with debt to allow a special
dividend to the sponsor. The former two options are therefore investments at the time of the initial
buyout, while the latter two at a later stage. It is therefore expected that
H9.) Gross buyout deal performance is higher for initial acquisitions than for later stage
financing injections as the potential for value creation is likely to be higher at the time
of the original buyout.
Section 4.2.2.9. of the VE control sample has established that the public market exit mode has
performed better than private market exits, i.e. strategic sale or secondary LBO. Especially in

Empirical Part I – Market and Financial Value Drivers 117
favorable equity market conditions, buyout firms may be able to generate a premium from initial
public offerings of their portfolio companies. It is therefore expected that
H10.) Gross buyout deal performance is higher for transactions exited through initial public
offerings than through private exit transactions.
Not only may the entry and exit mode from a capital market condition point of view affect buyout
performance, but also the surrounding negotiations at entry and exit of the investment. There are
several entry type options to gain control over a buyout target: a negotiated sale between target
shareholders and buyout firm through direct engagement, a “brokered” deal through a buy-side
intermediary, such as an investment bank or business broker, or through an auction process
initiated by the shareholders of the buyout target. In general, the less competitive the bidding
process is, the higher the probability to negotiate an attractively low entry premium for the target.
Hence, the negotiated sale should be preferred to brokered deals and competitive auctions. It is
therefore expected that
H11.) Gross buyout deal performance is higher for transactions with less competitive entry
types.
Conversely, the exit type alternatives equally include a negotiated sale, a brokered deal through a
sell-side intermediary, a competitive auction process or – an initial public offering. The commonly
more competitive of the available exit types, i.e. the auction and public offering (effectively a type
of auction), should on average guarantee a higher payoff to the sponsor. It is therefore expected that
H12.) Gross buyout deal performance is higher for transactions with more competitive exit
types.
Although less a market than an acquisition related variable, the General Partner seeking to
purchase a buyout target may be a direct determinant of the buyout’s success. Efficient market
theory would suggest that no investor (here: General Partner) should be able to generate abnormal
returns on a consistent basis. In other words, statistical analysis should demonstrate that buyout
firms cannot be an explanatory variable to describe buyout returns. However, the goal of this study
is to examine whether there is a “GP effect” in leveraged buyouts, based on the GP’s experience
profile and investment track record. Should this hypothesis be rejected, there will be some first
evidence to further study the “GP effect” in buyouts:
H13.) Gross buyout deal performance is not significantly better or worse for any individual
buyout firm, based on efficient market theory.
4.3.1.2. Methodology and Data
Data in this study from this section onwards are based on a new primary dataset (“Limited
Partners’ data”), gathered by the author, based on 3,009 leveraged buyout transactions undertaken
by 84 General Partners and drawn from 252 funds between 1973 and 2003 that were collected from
due diligence material and Private Purchasing Memoranda (PPMs) from several large institutional

Empirical Part I – Market and Financial Value Drivers 118
investors (Limited Partners). However, the dataset is highly heterogeneous with respect to depth of
data for each individual buyout transaction, as General Partners differ in their reporting approach.
In spite of this, the data offers several distinct advantages: (i) the analysis focuses on deal level
gross performance, while the above presented secondary data from Venture Economics is based on
net fund performance82, which has been used as a proxy for deal level analysis, (ii) the broad
underlying information permits that more aspects of individual transactions (i.e. variables) than for
the uniform Venture Economics data can be defined. However, the various variables are overall
based on lower sample (and subsample) size compared to the Venture Economics data, which
implies higher variance in results.83 Therefore, the following tests of the above defined variable
groups had to be run on different sample sizes. Nevertheless, due to the large initial sample size,
each test overall ensures that the sub-sample also carries a sufficient number of transactions in
order to make reasonable generalizations and to draw meaningful conclusions.
When interpreting the presented data, it is essential to analyze the statistical significance of both the
variables under examination (as well as control variables in later tests). The statistical analysis is
intended to substantiate the interpretation and validity of the presented descriptive primary data and
therefore adds to the level of detail from observation of the VE dataset. For those variables under
review, which are found to be statistically significant, theory-building can be supported through an
affirmed acceptance or rejection of the above outlined operational variable and general hypotheses.
First, descriptive statistics, Pearson’s correlations and linear regression for each variable under
consideration will be reported. Some of these variables may later represent control variables that
will subsequently be utilized in advanced regressions. Secondly, multivariate regression models
will estimate the combined explanatory power of (the significant) variables towards the variance in
the dependent variable gross IRR performance.
82 “Gross” deal performance is defined as absolute return on invested (fund) capital, after fees and expenses,
but before carried interest. In other words, it represents the true underlying performance of the particular buyout investment. This view is critical for any analysis of value creation in leveraged buyouts, as the focus is on the target’s performance and its drivers rather than net returns to fund investors (Limited Partners). By contrast, net fund performance is defined as actual net cash inflows received by the Limited Partner from the General Partner for each realized investment (unrealized investments may be valued at market prices), after deduction of fees, expenses and carried interest. Consequently, gross performance in this presentation will always be higher than net performance. When interpreting gross IRR data, it should also be kept in mind that the required minimum target IRR for investments considered by buyout firms ranges between 25-35%. Also, the sample does not contain first time funds, which results in an indirect survivorship bias towards the more successful buyout funds (see section 3.6.4. for detail). Finally, in several instances, the analysis focuses on realized transactions, which naturally post higher returns compared to unrealized deals.
83 In general, results are based on a minimum sample size of ten transactions (mainly in empirical part 3 – strategy), with few exceptions, to allow for diversification of individual transaction performances and validity and generalizability of results. This section generally tests several hundred buyouts for each variable.

Empirical Part I – Market and Financial Value Drivers 119
4.3.2. Buyout Performance by Year
4.3.2.1. Overview of Buyout Performance by Year
Overall gross deal performance of the Limited Partners’ data shows a similar trend as the Venture
Economics data (see section 4.2.2.2.). Buyout performance of the Limited Partners sample reached
record levels in the early 1980s, growing from 22.3% average gross IRR in 1981 to an average
gross IRR of 114.1% in 1984.84 Increasing competition among buyout firms already led to slightly
lower returns in 1985 and 1986 of approximately 75% average gross IRR, but dropped to a much
larger extent when fundraising activity accelerated in 1987 (compare section 4.2.1.). Between 1987
and 1996, average gross IRRs among all buyout deals balanced out between more modest 40-45%
with the exception of a smaller setback in 1989 and 1990, following the stock market crash and
weaker economic environment. Between 1997 and 1999, returns began to fall from 32.3% to 26.0%
average gross IRR, reaching -1.2% average gross IRR in 2000.
-50%
-30%
-10%
10%
30%
50%
70%
90%
110%
130%
1981 1982 1983 1984 1985 1986 1987 1988 1989 1990 1991 1992 1993 1994 1995 1996 1997 1998 1999 2000 2001 2002Av
era
ge
Gro
ss
Re
turn
(%
)
Unrealised Deals Realised Deals All Deals
Figure 43: Average Gross Returns of Buyout Deals by Investment Status and by Year (1981-2002)
Source: INSEAD Buyout Database, analyzed by author (Deal N=3,051).
4.3.2.2. Realized vs. Unrealized Buyout Performance by Year
These results have to be interpreted with respect to the differentiation of realized and unrealized
transactions85, and their (valuation) influence on total average performance. In 1989, the year after
the stock market crash, the average IRR of unrealized deals plummeted to -38.7% on the back of a
range of buyout bankruptcies, which led to considerable fund portfolio write-offs. 86 In other
instances, these underperforming transactions were carried along in the General Partner’s portfolios
84 Note that only realized transactions have been reported and recorded for the years between 1981 to 1987. 85 Note to the reader: the presentation of performance results on all Limited Partner data from this section
onwards will generally be according to two major splits, between (i) realized, unrealized and across all transactions, and/or (ii) between US, European and transactions across both (all) geographies.
86 Treated as an internal rate of return of -100% for the respective buyout in the database.

Empirical Part I – Market and Financial Value Drivers 120
for a prolonged period, as no attractive exit opportunities at justifiable valuations were available.
This trend of substantially underperforming unrealized deals, albeit at a lower level than in 1989,
continued throughout the adverse and volatile investment period between 1989 and 1993 (global
recession and 1st Iraq war). The period from 1996 to 1999 was characterized by increasingly strong
returns for realized buyout deals, reaching 103.8% average gross IRR in 1999. The high returns
were enhanced by an exceptionally favorable stock market environment, resulting in high exit
valuations. Despite sharply declining stock markets from March 2000 onwards, General Partners
were still able to exit a range of investments at attractive valuations, confirmed by an average gross
realized deal IRR of 41.9% for the year.
In 2001, only six transactions in our sample were exited (hence low scope for generalizability), yet
at a high average gross realized deal IRR of 83.2%. Despite this low number of realized deals in
2001 and although there have not been any realized deals in 2002, the high average valuation of
87.9% for 2001 and 98.5% for 2002 of average gross deal IRR is a unexpected result, when
compared to the broader average fund performance in the VE dataset in section 4.2.2.2. This result
has to be scrutinized with respect to potentially overstated or over-optimistic performance
expectations by General Partners at that time. It is largely driven by unrealized transactions and
may root in the accounting and valuation policy of the respective buyout funds. In most cases and
according to market practice, General Partners hold their unrealized investments at cost for up to
ca. 18 months, which may either under- or overstate actual performance of the underlying
investment. Buyout funds that were disclosing their Private Purchasing Memoranda between 2000
and 2003, which have been included in this sample, may have chosen not to keep unrealized
investments at cost and valued them at market prices (or above with a view on fundraising
marketing purposes). The high valuations attributed to 2002 (and the negative cash flow-based fund
return profile for this period derived from the VE dataset) raise serious doubts that these expected
unrealized investment returns will eventually materialize. One supporting argument though for
these high expected returns could be seen in the attractively low asset valuations, at which buyout
funds were able to execute acquisitions in 2001 and 2002.
4.3.2.3. European vs. U.S. Buyout Performance by Year
The sample distribution results for realized gross deal performances by geographic region U.S. vs.
Europe illustrate an analogous picture of the overall performance by year, characterized by strong
performance in the early 1980s and late 1990s.87 However, in contrast to the results of the Venture
Economics dataset in section 4.2.2.8. (figure 40), showing consistently stronger returns for
European funds, the deal level data presents mixed outcomes with respect to geographic region:
87 Note with respect to correct graphical interpretation that not all deals in the INSEAD buyout database
could be assigned to a geographic region, hence the average IRR of all deals includes US deals, European deals and non-assigned deals, which are either based in one of the former or in the rest of the world. Data for (European) transaction years with less than eight transactions per year has been omitted, i.e. prior to 1989.

Empirical Part I – Market and Financial Value Drivers 121
average European deal performance is only higher in four of the twelve comparable years. The
contradiction in favor of the U.S. especially holds true for 1989, with average gross realized IRR of
12.9% for European deals and 72.7% for U.S. deals, as well as 1992, with average gross realized
IRR of 30.0% and 61.3% respectively. The Venture Economics fund performance data had shown
that European deals led to higher results in these “external shock” years. Between 1994 and 1998,
performance among European deals was higher or broadly similar to U.S. deals. Also, on the
contrary to the Venture Economics data, European gross buyout deal performance was significantly
lower in 1999 and 2000 compared to U.S. deals, even when using weighted average returns. One
possible explanation could be that exit conditions in Europe have been more volatile and
deteriorated earlier than in the U.S.
-10%
10%
30%
50%
70%
90%
110%
130%
150%
170%
190%
1981 1982 1983 1984 1985 1986 1987 1988 1989 1990 1991 1992 1993 1994 1995 1996 1997 1998 1999 2000
Av
era
ge
Gro
ss
Re
turn
(%
)
European Deals US Deals All Deals
Figure 44: Average Gross Returns of Realized Buyout Deals by Region and by Year (1981-2002)
Source: INSEAD Buyout Database, analyzed by author (Deal N=1,679).
4.3.2.4. Regression Results
As reflected in the above trends, the entry (exit) year of the buyout transaction may affect the value
creation potential, i.e. the performance of the dependent variable IRR, through various external
factors, e.g. (i) industry financial performance and growth expectations, (ii) stock market
performance and asset valuations, (iii) investment climate, changes in the regulatory environment
or legislation.
4.3.2.4.1. Descriptive Statistics
The descriptive statistics on the sample of 1,746 realized buyouts shows that three entry years –
1984, 1998 and 1999 – are significantly positively correlated at the 0.01 level (2-tailed) with the
dependent variable IRR. Among exit years, the years 1988 and 1989 are positively correlated at the
0.01 level (2-tailed), and the exit year 1987 is positively correlated at the 0.05 level (2-tailed). Also,
the exit year 2001 is negatively correlated with acquisition performance at the 0.01 level (2-tailed).

Empirical Part I – Market and Financial Value Drivers 122
Descriptive and Correlation StatisticsVariable (Dummy) Tested
N(1) Minimum Maximum Sum(2) Mean Std. Deviation
Pearson Correlation
Sig. (2-tailed)
Entry Year 1980 1746 0 1 3 0 0,041 -0,028 0,249
Entry Year 1981 1746 0 1 12 0,01 0,083 -0,026 0,27
Entry Year 1982 1746 0 1 12 0,01 0,083 0,025 0,304
Entry Year 1983 1746 0 1 19 0,01 0,104 0,005 0,825
Entry Year 1984 1746 0 1 27 0,02 0,123 0,088** 0
Entry Year 1985 1746 0 1 33 0,02 0,136 0,015 0,527
Entry Year 1986 1746 0 1 64 0,04 0,188 0,046 0,055
Entry Year 1987 1746 0 1 58 0,03 0,179 -0,025 0,299
Entry Year 1988 1746 0 1 83 0,05 0,213 -0,015 0,54
Entry Year 1989 1746 0 1 59 0,03 0,181 -0,036 0,133
Entry Year 1990 1746 0 1 92 0,05 0,223 -0,043 0,07
Entry Year 1991 1746 0 1 105 0,06 0,238 -0,032 0,175
Entry Year 1992 1746 0 1 103 0,06 0,236 -0,044 0,068
Entry Year 1993 1746 0 1 145 0,08 0,276 -0,046 0,054
Entry Year 1994 1746 0 1 151 0,09 0,281 -0,042 0,081
Entry Year 1995 1746 0 1 176 0,1 0,301 -0,031 0,188
Entry Year 1996 1746 0 1 159 0,09 0,288 -0,003 0,891
Entry Year 1997 1746 0 1 166 0,1 0,293 0,025 0,298
Entry Year 1998 1746 0 1 117 0,07 0,25 0,072** 0,003
Entry Year 1999 1746 0 1 89 0,05 0,22 0,103** 0
Entry Year 2000 1746 0 1 44 0,03 0,157 0,041 0,086
Entry Year 2001 1746 0 1 7 0 0,063 0,045 0,059
Entry Year 2002 1746 0 0 0 0 0
Exit Year 1985 1746 0 1 7 0 0,063 -0,003 0,914
Exit Year 1986 1746 0 1 25 0,01 0,119 0,029 0,233
Exit Year 1987 1746 0 1 23 0,01 0,114 0,054* 0,025
Exit Year 1988 1746 0 1 37 0,02 0,144 0,119** 0
Exit Year 1989 1746 0 1 29 0,02 0,128 0,084** 0
Exit Year 1990 1746 0 1 23 0,01 0,114 0,017 0,468
Exit Year 1991 1746 0 1 43 0,02 0,155 0,011 0,642
Exit Year 1992 1746 0 1 45 0,03 0,159 -0,005 0,847
Exit Year 1993 1746 0 1 88 0,05 0,219 -0,017 0,488
Exit Year 1994 1746 0 1 83 0,05 0,213 0,001 0,951
Exit Year 1995 1746 0 1 108 0,06 0,241 -0,02 0,414
Exit Year 1996 1746 0 1 127 0,07 0,26 -0,02 0,393
Exit Year 1997 1746 0 1 159 0,09 0,288 -0,01 0,664
Exit Year 1998 1746 0 1 190 0,11 0,312 -0,012 0,629
Exit Year 1999 1746 0 1 169 0,1 0,296 0,021 0,373
Exit Year 2000 1746 0 1 320 0,18 0,387 0,031 0,199
Exit Year 2001 1746 0 1 127 0,07 0,26 -0,075** 0,002
Exit Year 2002 1746 0 1 59 0,03 0,181 0,004 0,88
Exit Year 2003 1746 0 1 12 0,01 0,083 0,039 0,103
Valid N (listwise) 1746
(1) Total sample size of tested cases (all realized transactions). Includes years not specified. (2) Number of cases where dummy variable = 1, i.e. number of transactions per year. ** Correlation is significant at the 0.01 level (2-tailed). * Correlation is significant at the 0.05 level (2-tailed).
Table 11: Descriptive and Correlation Statistics on Entry and Exit Years
The positive correlations indicate that those years were characterized by very favorable entry and
exit conditions. Exits from buyout transactions in 2001, in the midst of the technology bubble burst,
were significantly unprofitable. The following two tables summarize the entry and exit year
descriptive, correlation, coefficient and collinearity statistics.

Empirical Part I – Market and Financial Value Drivers 123
Coefficients(a)
Model Unstandardized Coefficients
Standardized Coefficients
t Sig. Collinearity Statistics
B Std. Error Beta Tolerance VIF
1 (Constant) ,605 ,391 1,545 ,123
Entry Year 1980 -1,031 1,130 -,023 -,912 ,362 ,882 1,134
Entry Year 1981 -,382 ,659 -,017 -,580 ,562 ,652 1,535
Entry Year 1982 ,761 ,659 ,034 1,155 ,248 ,652 1,535
Entry Year 1983 ,304 ,575 ,017 ,528 ,597 ,542 1,843
Entry Year 1984 1,520 ,527 ,101 2,884 ,004 ,456 2,193
Entry Year 1985 ,413 ,505 ,030 ,818 ,414 ,408 2,453
Entry Year 1986 ,649 ,454 ,065 1,430 ,153 ,266 3,766
Entry Year 1987 -,040 ,460 -,004 -,088 ,930 ,284 3,516
Entry Year 1988 ,087 ,440 ,010 ,198 ,843 ,220 4,546
Entry Year 1989 -,149 ,459 -,014 -,324 ,746 ,281 3,557
Entry Year 1990 -,133 ,436 -,016 -,305 ,760 ,204 4,909
Entry Year 1991 -,029 ,430 -,004 -,068 ,945 ,184 5,426
Entry Year 1992 -,116 ,431 -,015 -,269 ,788 ,187 5,347
Entry Year 1993 -,076 ,420 -,011 -,181 ,857 ,144 6,961
Entry Year 1994 -,043 ,419 -,007 -,103 ,918 ,139 7,184
Entry Year 1995 ,034 ,415 ,006 ,083 ,934 ,124 8,093
Entry Year 1996 ,190 ,418 ,029 ,456 ,648 ,134 7,478
Entry Year 1997 ,353 ,417 ,056 ,848 ,397 ,129 7,733
Entry Year 1998 ,710 ,427 ,095 1,665 ,096 ,170 5,895
Entry Year 1999 1,037 ,437 ,122 2,374 ,018 ,209 4,788
Entry Year 2000 ,686 ,479 ,058 1,431 ,153 ,342 2,924
Entry Year 2001 1,537 ,797 ,052 1,930 ,054 ,762 1,313
2 (Constant) -,215 ,216 -,999 ,318
Exit Year 1985 ,954 ,725 ,032 1,316 ,188 ,915 1,093
Exit Year 1986 1,471 ,425 ,094 3,463 ,001 ,753 1,328
Exit Year 1987 1,895 ,438 ,116 4,323 ,000 ,768 1,302
Exit Year 1988 2,531 ,370 ,196 6,839 ,000 ,675 1,482
Exit Year 1989 2,241 ,402 ,154 5,567 ,000 ,725 1,379
Exit Year 1990 1,310 ,438 ,080 2,989 ,003 ,768 1,302
Exit Year 1991 1,160 ,353 ,096 3,289 ,001 ,642 1,558
Exit Year 1992 ,977 ,348 ,083 2,809 ,005 ,632 1,583
Exit Year 1993 ,895 ,291 ,105 3,079 ,002 ,474 2,110
Exit Year 1994 1,042 ,295 ,119 3,535 ,000 ,488 2,050
Exit Year 1995 ,888 ,278 ,115 3,188 ,001 ,426 2,345
Exit Year 1996 ,894 ,270 ,125 3,310 ,001 ,390 2,563
Exit Year 1997 ,968 ,260 ,150 3,725 ,000 ,343 2,916
Exit Year 1998 ,968 ,253 ,162 3,822 ,000 ,308 3,243
Exit Year 1999 1,151 ,258 ,183 4,469 ,000 ,331 3,023
Exit Year 2000 1,151 ,239 ,239 4,820 ,000 ,225 4,447
Exit Year 2001 ,529 ,270 ,074 1,960 ,050 ,390 2,563
Exit Year 2002 1,066 ,321 ,103 3,316 ,001 ,569 1,758
Exit Year 2003 1,905 ,571 ,084 3,338 ,001 ,863 1,159
(a) Dependent Variable: Gross IRR Performance
Table 12: Coefficients and Collinearity Statistics on Entry and Exit Years
The collinearity statistics on entry years, and especially exit years, show several elevated variance
inflation factors (VIF), which could indicate potential multicollinearity problems between variables
(here: years). According to Neter, Wasserman et al. (1985), the appropriate rule of thumb for an
acceptable level of tolerance of multicollinearity in applied linear regression models – depending
on the test setting – represents a maximum VIF factor of 10, before serious multicollinearity
problems occur and interpretation of results could be directionally wrong to a severe extent. This
study follows this general guideline, nevertheless at all times endeavoring to keep VIF factors as
low as possible in any of the presented regression models through an elimination of variables with
high collinearity.

Empirical Part I – Market and Financial Value Drivers 124
4.3.2.4.2. Regression Model
The linear regression models on entry and exit years illustrate the explanatory power of these
obvious market related control variables. Entry years generate an adjusted R square of 3.0% and
exit years produce and adjusted R square of 3.6%. Both regression models show a significant F
change. In other words, entry and exit years will represent important control variables for more
advanced regression models.
Linear Regression Model Summary Change Statistics Model R R Square Adjusted
R Square Std. Error
of the Estimate
R Square Change
F Change df1 df2 Sig. F Change
1 ,206(a) ,042 ,030 1,835706 ,042 3,465 22 1723 ,000
2 ,216(b) ,047 ,036 1,830001 ,047 4,445 19 1726 ,000
(a) Predictors: (Constant), 2001, 1980, 1982, 1981, 1983, 1984, 1985, 2000, 1987, 1989, 1986, 1988, 1999, 1990, 1992, 1991, 1998, 1993, 1994, 1996, 1997, 1995
(b) Predictors: (Constant), X2003, X1985, X1990, X1987, X1986, X1989, X1988, X1991, X1992, X2002, X1994, X1993, X1995, X2001, X1996, X1997, X1999, X1998, X2000
Table 13: Linear Regression Model on Entry and Exit Year Dummy Variables
4.3.2.5. Summary of Findings
The year of entry and exit of buyout transactions has been identified as an important value driver.
The linear regression model confirmed that these variables are adding explanatory strength to the
analysis of buyouts with up to 3.6% of R square for the exit year. Variable hypotheses H1 and H2
can be accepted. Unrealized transactions as expected performed worse than realized deals.88 Also,
with a high significance at the 0.01 level, it can be stated that buyouts undertaken in the years 1984,
1998 and 1999 were anticipated to demonstrate exceptionally high performance from the outset
according to the Limited Partners’ dataset.
88 As demonstrated by the graphical description. Statistical proof omitted here.
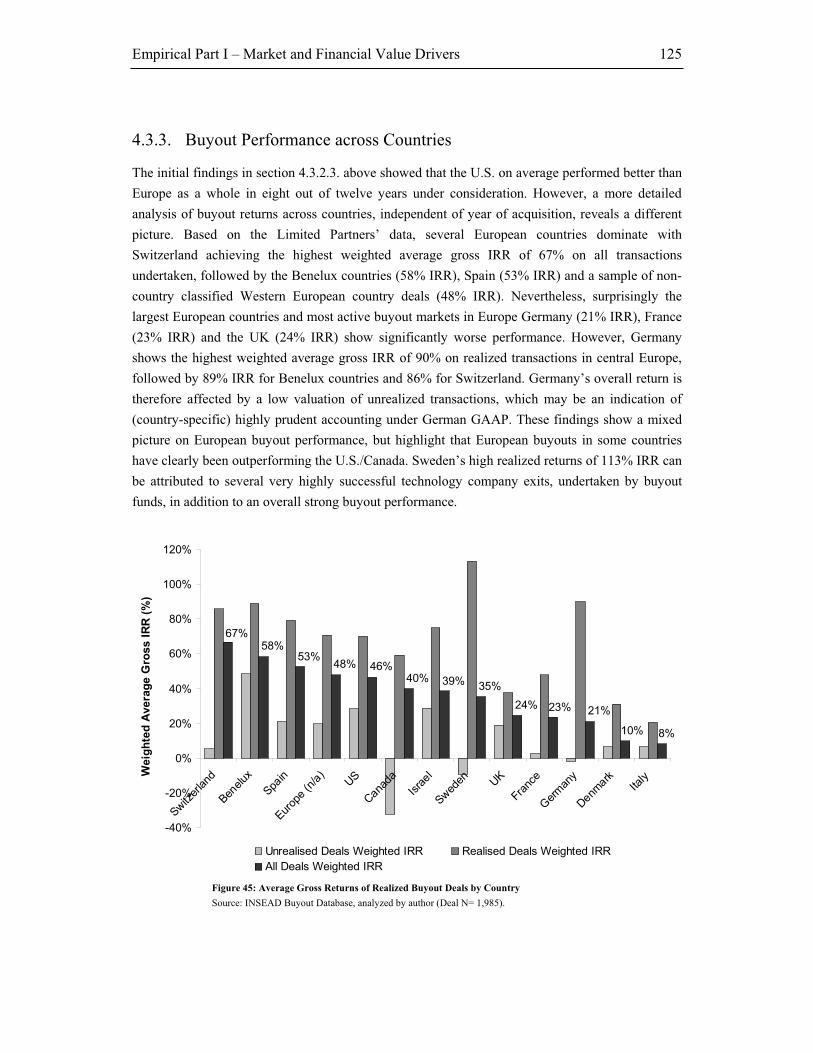
Empirical Part I – Market and Financial Value Drivers 125
4.3.3. Buyout Performance across Countries
The initial findings in section 4.3.2.3. above showed that the U.S. on average performed better than
Europe as a whole in eight out of twelve years under consideration. However, a more detailed
analysis of buyout returns across countries, independent of year of acquisition, reveals a different
picture. Based on the Limited Partners’ data, several European countries dominate with
Switzerland achieving the highest weighted average gross IRR of 67% on all transactions
undertaken, followed by the Benelux countries (58% IRR), Spain (53% IRR) and a sample of non-
country classified Western European country deals (48% IRR). Nevertheless, surprisingly the
largest European countries and most active buyout markets in Europe Germany (21% IRR), France
(23% IRR) and the UK (24% IRR) show significantly worse performance. However, Germany
shows the highest weighted average gross IRR of 90% on realized transactions in central Europe,
followed by 89% IRR for Benelux countries and 86% for Switzerland. Germany’s overall return is
therefore affected by a low valuation of unrealized transactions, which may be an indication of
(country-specific) highly prudent accounting under German GAAP. These findings show a mixed
picture on European buyout performance, but highlight that European buyouts in some countries
have clearly been outperforming the U.S./Canada. Sweden’s high realized returns of 113% IRR can
be attributed to several very highly successful technology company exits, undertaken by buyout
funds, in addition to an overall strong buyout performance.
8%10%
21%23%24%
35%39%40%46%48%
53%58%
67%
-40%
-20%
0%
20%
40%
60%
80%
100%
120%
Switz
erland
Benelux
Spain
Europ
e (n/a
)US
Cana
da
Isra
el
Swed
en UK
Franc
e
Ger
man
y
Denm
arkIta
ly
Weig
hte
d A
vera
ge G
ross I
RR
(%
)
Unrealised Deals Weighted IRR Realised Deals Weighted IRR
All Deals Weighted IRR
Figure 45: Average Gross Returns of Realized Buyout Deals by Country
Source: INSEAD Buyout Database, analyzed by author (Deal N= 1,985).

Empirical Part I – Market and Financial Value Drivers 126
4.3.3.1. Regression Results
As reflected in the above trends, the country of origin of the focal buyout transaction may affect the
value creation potential, i.e. the performance of the dependent variable IRR, through various
external factors, e.g. (i) state of the economy, e.g. GDP growth and interest rate environment, (ii)
favorable jurisdiction, tax and regulatory environment, (iii) pool of resources, level of education
and relative strength of some industries.
4.3.3.1.1. Descriptive Statistics
The correlation statistics for the country groupings show that only the “U.S./Canada” country
variable is (positively and) significantly correlated at the 0.01 level (2-tailed) with the dependent
variable IRR. Among other countries, Scandinavia is significant only at the 0.1 level (2-tailed),
with a positive Pearson correlation. France has a negative correlation, however, is only significant
at the 0.15 level (2-tailed). Overall, these results are unsatisfying for European LBO transactions,
as it cannot be statistically validated that there is superiority of returns for some of the European
countries.89 Instead, the U.S./Canada region statistically performs better in the Limited Partners
sample.90
Descriptive and Correlation StatisticsVariable (Dummy) Tested
N(1) Minimum Maximum Sum(2) Mean Std. Deviation
Pearson Correlation
Sig. (2-tailed)
Countries/Regions
Germany/Austria/ Switzerland
1746 0 1 16 ,01 ,095 ,022 ,357
France 1746 0 1 50 ,03 ,167 -,034 ,150
Rest Of Europe 1746 0 1 231 ,13 ,339 ,014 ,546
Rest Of World 1746 0 1 10 ,01 ,075 ,000 ,999
Scandinavia 1746 0 1 44 ,03 ,157 ,044 ,065
UK/Ireland 1746 0 1 35 ,02 ,140 -,028 ,238
U.S./Canada 1746 0 1 748 ,43 ,495 ,074(**) ,002
Valid N (listwise) 1746
(1) Total sample size of tested cases (all realized transactions). Includes countries not specified. (2) Number of cases where dummy variable = 1, i.e. number of transactions per year. ** Correlation is significant at the 0.01 level (2-tailed). * Correlation is significant at the 0.05 level (2-tailed).
Table 14: Descriptive and Correlation Statistics on Country Variables
The relatively high standardized coefficient Betas for the U.S./Canada proof that on average doing
deals in this region has a positive impact on buyout returns. Although coefficients are not
significant, doing deals in France and the UK/Ireland on average has directionally an adverse effect
on performance. Undertaking transactions in the rest of Europe, Scandinavia and
Germany/Austria/Switzerland does create value for investors, although only validated by slightly
lower confidence intervals (Scandinavia at the 0.05 level, Rest of Europe at the 0.1 level). The
collinearity statistics show very high tolerances (i.e. very modest variance inflation factors); hence
89 Please note that for sampling reasons the categorization was aggregated for some countries. Also note the
significantly higher sample size of deals classified “U.S./Canada”. 90 It should be highlighted that the sample overall includes more deals from the US/Canada, especially for the
early 1980s, where only few European deals were recorded.

Empirical Part I – Market and Financial Value Drivers 127
multicollinearity does not appear to be a problem among country variables in this bivariate model
context, i.e. transactions in different countries are statistically independent.
Coefficients(a)
Model Unstandardized Coefficients
Standardized Coefficients
t Sig. Collinearity Statistics
B Std. Error Beta Tolerance VIF
1 Countries
(Constant) ,577 ,127 4,554 ,000
Germany/Austria/ Switzerland
,665 ,481 ,034 1,381 ,167 ,939 1,065
France -,137 ,292 -,012 -,469 ,639 ,835 1,197
Rest Of Europe ,307 ,176 ,056 1,743 ,082 ,556 1,800
Rest Of World ,238 ,601 ,010 ,397 ,692 ,961 1,041
Scandinavia ,749 ,307 ,063 2,439 ,015 ,852 1,174
UK/Ireland -,130 ,338 -,010 -,385 ,701 ,878 1,139
U.S./Canada ,396 ,144 ,105 2,755 ,006 ,391 2,560
(a) Dependent Variable: Gross IRR Performance
Table 15: Coefficients and Collinearity Statistics on Country Variables
4.3.3.1.2. Regression Model
The linear regression model describing the explanatory strength of the industry classification
variables is fairly weak and an expression of the low significance levels found for the individual
countries/regions. The adjusted R square is 0.8%. The F value for the model’s fit is 2.708 and is
highly significant (p<.01). The result overall shows that buyout deal making across countries is
similar, and that the difference in buyout performance is not country driven. A considerably higher
sample size (than the already sizeable 1,134 buyout country sample), especially with more recorded
transactions outside of North America (currently 66% of country variables) may in the future allow
a more in-depth country comparison. Likewise, an even higher sample size could lead to an
increase in significance levels for European countries and could therefore affirm their
(descriptively) observed superior performance.
Linear Regression Model Summary Statistics Model R R Square Adjusted
R Square Std. Error
of the Estimate
R Square F Value df1 df2 Sig. F
1 ,111(a) ,012 ,008 1,856754 ,012 2,708 8 1737 ,006
(a) Predictors: (Constant), U.S./Canada, Rest Of World, Germany/Austria/Switzerland, United Kingdom/Ireland, Scandinavia, France, Rest Of Europe
Table 16: Linear Regression Model on Country Variables
4.3.3.2. Summary of Findings
The country of origin of buyout transactions has overall not been identified as an important value
driver. The linear regression model has confirmed that these variables are adding minor
explanatory strength to the analysis of buyouts with up to 0.8% of R square on the sample on
review. Variable hypotheses H3 and H4 cannot be accepted, as although realized returns of some
European countries descriptively appear higher, they lack statistical significance to confirm

Empirical Part I – Market and Financial Value Drivers 128
generalizability. In fact, it was established that deals undertaken in the U.S./Canada (also highest
sub-sample size) statistically outperform with significance at the 0.01 level and a strong positive
standardized Beta coefficient.
4.3.4. Buyout Performance by Industry Sector
4.3.4.1. Level 3 Industry Classification
The classification of transactions in the INSEAD Buyout database generally has been carried out
according the Datastream industry classification on Level 6 (see overview in section 3.6.5.). This
classification in sequence allows for an automatic aggregation of gross buyout performance on
Level 3, which is presented below.91
0%
20%
40%
60%
80%
100%
120%
NON-C
YCLI
CAL.
SERVIC
ES
FINAN
CIA
LS
INFO
RM
ATION
TECHNOLO
GY
GEN
ERAL
INDUSTR
IALS
NO
N-C
YCLI
CAL
CONSU
MER
GOODS
BASIC
INDUSTR
IES
CYC
LICAL
SERVIC
ES
RESO
URCES
CYC
LICAL
CONSU
MER
GO
ODS
UTIL
ITIE
S
Av
era
ge
Gro
ss
IR
R (
%)
Unrealized Deals Realized Deals All Deals
Figure 46: Average Gross Returns of Buyout Deals by Industry Sector and Investment Status (1980-2002)
Source: INSEAD Buyout Database, analyzed by author (Deal N=2,348)
The most attractive industry sector in the Limited Partners’ data sample has been the non-cyclical
services industry with 79.3% average gross IRR, followed by the financial services industry
(65.1% average gross IRR), information technology (57.1% average gross IRR) and general
industrials (48.4% average gross IRR). These results show both similarities and differences when
compared to the Venture Economics control population. In both samples, the financial services
91 The presentation of Level 3 and Level 4 results is based on a minimum underlying industry sample size of
ten transactions (exception: utilities sample size of only six transactions), and sub-sample size of five-seven transactions to allow for a minimum degree of diversification and generalizability of results.

Empirical Part I – Market and Financial Value Drivers 129
industry ranks very high. However, information technology deals in the Limited Partners sample
have performed substantially better than in the Venture Economics sample, where buyout funds
clearly demonstrated poor performance in this sector. Utilities (17.1% average gross IRR)
demonstrate to be an unattractive industry sector in both samples.
-20%
0%
20%
40%
60%
80%
100%
120%
NON-C
YCLI
CAL.
SER
VIC
ES
FINANCIA
LS
INFO
RM
ATION
TECHNOLO
GY
GENER
AL
INDUSTR
IALS
NON-C
YCLI
CAL
CONSUM
ER G
OODS
BAS
ICIN
DUSTR
IES
CYCLI
CAL
SERVIC
ES
RESO
URCES
CYCLI
CAL
CONSU
MER
GOO
DS
UTI
LITI
ES
Av
era
ge
Gro
ss
IR
R (
%)
European Deals US Deals All Deals
Figure 47: Average Gross Returns of Buyout Deals by Industry Sector and by Region (1980-2002)
Source: INSEAD Buyout Database, analyzed by author (Deals N=2,348).
The split according to region of geographic investment focus – U.S. or Europe – confirms above
findings that average gross performance of European buyout targets on average lacks behind their
U.S. counterparts in this study’s sample.92 The difference is particularly stark in the information
technology industry, where U.S. deals averaged 99.1% gross return against only 42.9% for
European deals. In line with prior findings on the VE control population data (see section 4.2.2.8.)
on the return dominance of U.S. Venture Capital, this result further confirms that this phenomenon
is also valid on the basis of deal level performance93. Moreover, European average gross deal
performance in the financial services industry significantly lacks behind U.S. deals, with 79.5%
and 34.8% of average gross IRR respectively. There could be several explanations for this
phenomenon, including (i) the European financial services industry is considerably more
fragmented, hence lacking economies of scale when compared to the U.S. and consequently
operates less efficient, (ii) nationalistic interests and other barriers to entry inhibit pan-European
consolidation and/or build-up strategies.
92 The results remain unchanged when only considering realized deals in the US and Europe. 93 The assumption is made that the majority of Venture Capital investments are made in the information
technology sector, which appears legitimate when considering number of deals and invested capital in this industry based on the Venture Economics data.

Empirical Part I – Market and Financial Value Drivers 130
4.3.4.2. Level 4 Industry Classification
The analysis of average gross IRR performance on the more detailed level 4 industry classification
reveals the dominance of three sectors. First, the new technologies sector – with information
technology and hardware (81.7% average gross IRR), telecom services (91.5% average gross IRR),
software and computer services (58.4% average gross IRR) and electronic and electrical equipment
(60.5% average gross IRR) – dominate the ranking of industries with most attractive returns.
Despite an average sample size per sub-sector of 103 deals, this result is enhanced by several
particularly strong IRR performances in these industries. As mentioned for the Level 3 analysis,
this result is in contrast to the Venture Economics finding of a general unattractiveness of the
information technology sector for buyout funds. However, while the Limited Partners sample
contains only ca. 44% of unrealized deals, the Venture Economics sample contains ca. 60% of such
active investments. Given that large parts of transactions in the information technology have been
carried out between 1997 and 2000, the average buyout fund returns calculated with the Venture
Economics data are still depressed by the J-curve effect. Consequently, based on these actual
results on deal gross performances, the data could suggest that buyout fund investments in the
information technology sector could prove (considering some of the latest buyout fund maturities
to be in ca. 2010) to have been more successful than initially anticipated by interpreting the fund
return data from Venture Economics, which was based on proxy returns (see section 4.2.2.6.).
Nevertheless, this is to a large extent driven by successful realized transactions.
Secondly, the financial services sector, consisting of specialty and other finance (75.4% average
gross IRR), insurance (58.1% average gross IRR), investment companies (49.4% average gross
IRR) as well as banks (20.4% average gross IRR)94, performs equally strong as found for the
Venture Economics data sample. Thirdly, the aerospace and defense sector displays the highest
overall average gross performance with an IRR of 101.8%95. Among the Venture Economics fund
data, this industry sub-sector had only shown a mediocre 5.9% of average net fund IRR. This result
confirms the attractiveness of the aerospace and defense industry, which is characterized by (i)
stable long-term growth due to increasing passenger numbers in the global aerospace industry,
especially in Asia, (ii) constantly high U.S. aerospace and defense spending and (iii) high visibility
of cash flows due to long-term nature of aerospace and defense contracts.
94 Omitted in the graphical presentation due to sub-sample size of only four transactions. 95 Based on 20 transactions (ten realized, ten unrealized).
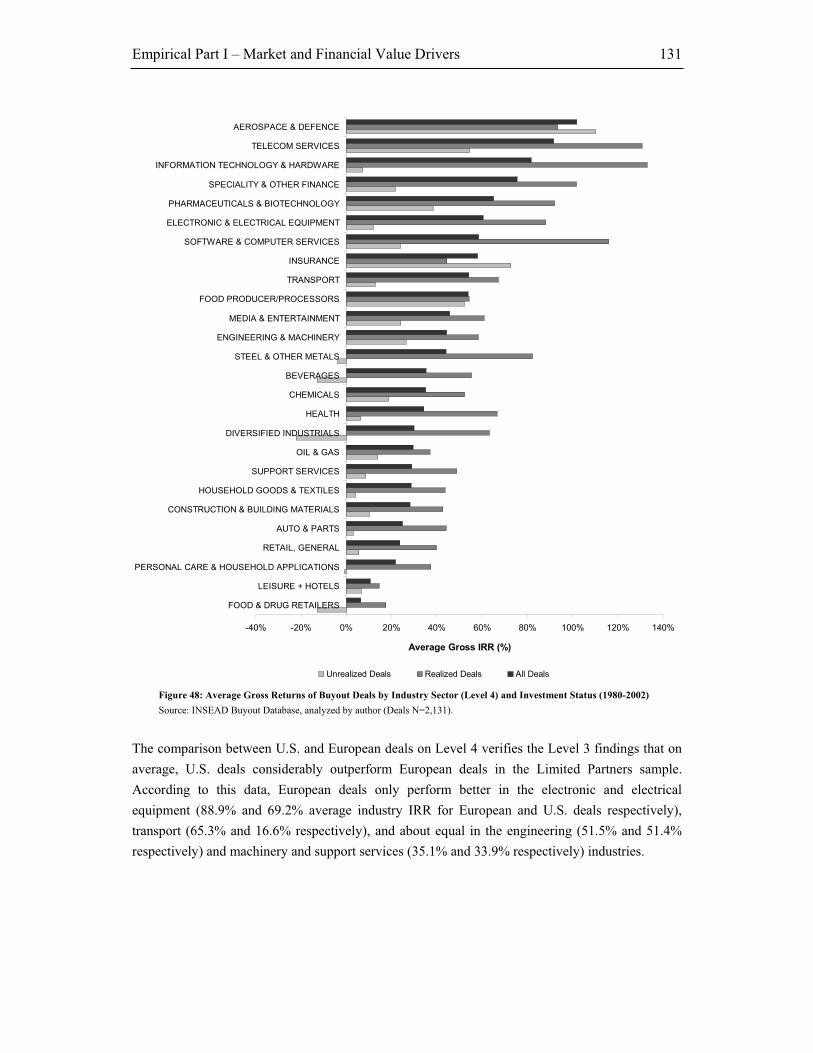
Empirical Part I – Market and Financial Value Drivers 131
-40% -20% 0% 20% 40% 60% 80% 100% 120% 140%
FOOD & DRUG RETAILERS
LEISURE + HOTELS
PERSONAL CARE & HOUSEHOLD APPLICATIONS
RETAIL, GENERAL
AUTO & PARTS
CONSTRUCTION & BUILDING MATERIALS
HOUSEHOLD GOODS & TEXTILES
SUPPORT SERVICES
OIL & GAS
DIVERSIFIED INDUSTRIALS
HEALTH
CHEMICALS
BEVERAGES
STEEL & OTHER METALS
ENGINEERING & MACHINERY
MEDIA & ENTERTAINMENT
FOOD PRODUCER/PROCESSORS
TRANSPORT
INSURANCE
SOFTWARE & COMPUTER SERVICES
ELECTRONIC & ELECTRICAL EQUIPMENT
PHARMACEUTICALS & BIOTECHNOLOGY
SPECIALITY & OTHER FINANCE
INFORMATION TECHNOLOGY & HARDWARE
TELECOM SERVICES
AEROSPACE & DEFENCE
Average Gross IRR (%)
Unrealized Deals Realized Deals All Deals
Figure 48: Average Gross Returns of Buyout Deals by Industry Sector (Level 4) and Investment Status (1980-2002)
Source: INSEAD Buyout Database, analyzed by author (Deals N=2,131).
The comparison between U.S. and European deals on Level 4 verifies the Level 3 findings that on
average, U.S. deals considerably outperform European deals in the Limited Partners sample.
According to this data, European deals only perform better in the electronic and electrical
equipment (88.9% and 69.2% average industry IRR for European and U.S. deals respectively),
transport (65.3% and 16.6% respectively), and about equal in the engineering (51.5% and 51.4%
respectively) and machinery and support services (35.1% and 33.9% respectively) industries.

Empirical Part I – Market and Financial Value Drivers 132
-20% 0% 20% 40% 60% 80% 100% 120% 140%
FOOD & DRUG RETAILERS
LEISURE + HOTELS
PERSONAL CARE & HOUSEHOLD APPLICATIONS
RETAIL, GENERAL
AUTO & PARTS
CONSTRUCTION & BUILDING MATERIALS
HOUSEHOLD GOODS & TEXTILES
SUPPORT SERVICES
OIL & GAS
DIVERSIFIED INDUSTRIALS
HEALTH
CHEMICALS
BEVERAGES
STEEL & OTHER METALS
ENGINEERING & MACHINERY
MEDIA & ENTERTAINMENT
INVESTMENT COMPANIES
FOOD PRODUCER/PROCESSORS
TRANSPORT
INSURANCE
SOFTWARE & COMPUTER SERVICES
ELECTRONIC & ELECTRICAL EQUIPMENT
PHARMACEUTICALS & BIOTECHNOLOGY
SPECIALITY & OTHER FINANCE
INFORMATION TECHNOLOGY & HARDWARE
TELECOM SERVICES
AEROSPACE & DEFENCE
Average Gross IRR (%)
European Deals US Deals All Deals
Figure 49: Average Gross Returns of Buyout Deals by Industry Sector (Level 4) and Region (1980-2002)
Source: INSEAD Buyout Database, analyzed by author (Deals N=2,143).
4.3.4.3. Regression Results
As reflected in the above trends, the industry of the focal buyout transaction to a significant degree
appears to affect the value creation potential, i.e. the performance of the dependent variable IRR.
This could be the result of various factors, e.g. (i) an industry’s specific customer demand or high
growth dynamics, as observed in the information technology sector in the late 1990s, (ii) maturity
and (global) competitiveness of an industry, which affects profitability and cash flow generation
potential, (iii) cyclicality and business cycle of an industry, and (iv) regulatory environment.

Empirical Part I – Market and Financial Value Drivers 133
4.3.4.3.1. Descriptive Statistics
The classification of industries allowed a sharp comparison of buyout performance and its
respective industry performance. It was established in the descriptive analysis section that certain
industries performed exceptionally well, but others underperformed on average compared to the
focal buyout deal. This section analyzes (i) the combined impact that industry performance has on
buyout performance, and (ii) which industries are performing better or worse based on statistical
significance. With respect to the latter analysis, we find that on industry classification Level 3, two
industries are performing significantly better (at the 0.01 level; 2-tailed): the information
technology sector as well as the non-cyclical services industry. Surprisingly, the cyclical services
industry, which posted strong returns among the VE dataset, performs worse than the rest of the
sample, with significance at the 0.05 level (2-tailed). These results support the descriptive findings
presented in section 4.3.4.1., i.e. that non-cyclical services and information technology show
highest performances. The strong performance of the financial services industry is non-significant.
The adverse indication about correlation of IRR with the cyclical services sector comes albeit a
positive average performance for this industry. Combined with the findings from the VE data, this
interpretation would generally recommend buyout firms to focus on the service sector due to its
highly attractive returns, but strictly to invest in non-cyclical service companies to avoid an adverse
return profile.
Descriptive and Correlation StatisticsVariable (Dummy) Tested
N(1) Minimum Maximum Sum(2) Mean Std. Deviation
Pearson Correlation
Sig. (2-tailed)
Level 3 Industries
CYSER 1746 0 1 306 ,18 ,380 -,058(*) 0,015
ITECH 1746 0 1 131 ,08 ,264 ,161(**) 0
NCYSR 1746 0 1 71 ,04 ,198 ,087(**) 0
Level 4 Industries
LESUR 1746 0 1 39 ,02 ,148 -,054(*) 0,023
SFTCS 1746 0 1 71 ,04 ,198 ,149(**) 0
TELCM 1746 0 1 59 ,03 ,181 ,109(**) 0
Level 6 Industries
CMPSV 1746 0 1 13 ,01 ,086 ,053(*) 0,026
COMMV 1746 0 1 3 ,00 ,041 ,059(*) 0,013
ENGFA 1746 0 1 27 ,02 ,123 ,053(*) 0,028
ERETL 1746 0 1 2 ,00 ,034 ,077(**) 0,001
SOFTW 1746 0 1 41 ,02 ,151 ,153(**) 0
TELFL 1746 0 1 14 ,01 ,089 ,072(**) 0,003
TELWR 1746 0 1 36 ,02 ,142 ,055(*) 0,022
Valid N (listwise) 1746
(1) Total sample size of tested cases (all realized transactions). Includes industries not specified. (2) Number of cases where dummy variable = 1, i.e. number of transactions per year. ** Correlation is significant at the 0.01 level (2-tailed). * Correlation is significant at the 0.05 level (2-tailed).
Table 17: Descriptive and Correlation Statistics on (significant) Industries
Among Level 4 industries, the software services and telecom services industries are positively
correlated to the dependent variable IRR (significant at the 0.01 level; 2-tailed). Investments in the
leisure and hotel industry are accompanied with negative returns to buyout investors (significant at
the 0.05 level). These correlation statistics support the previous findings on IRR by descriptive
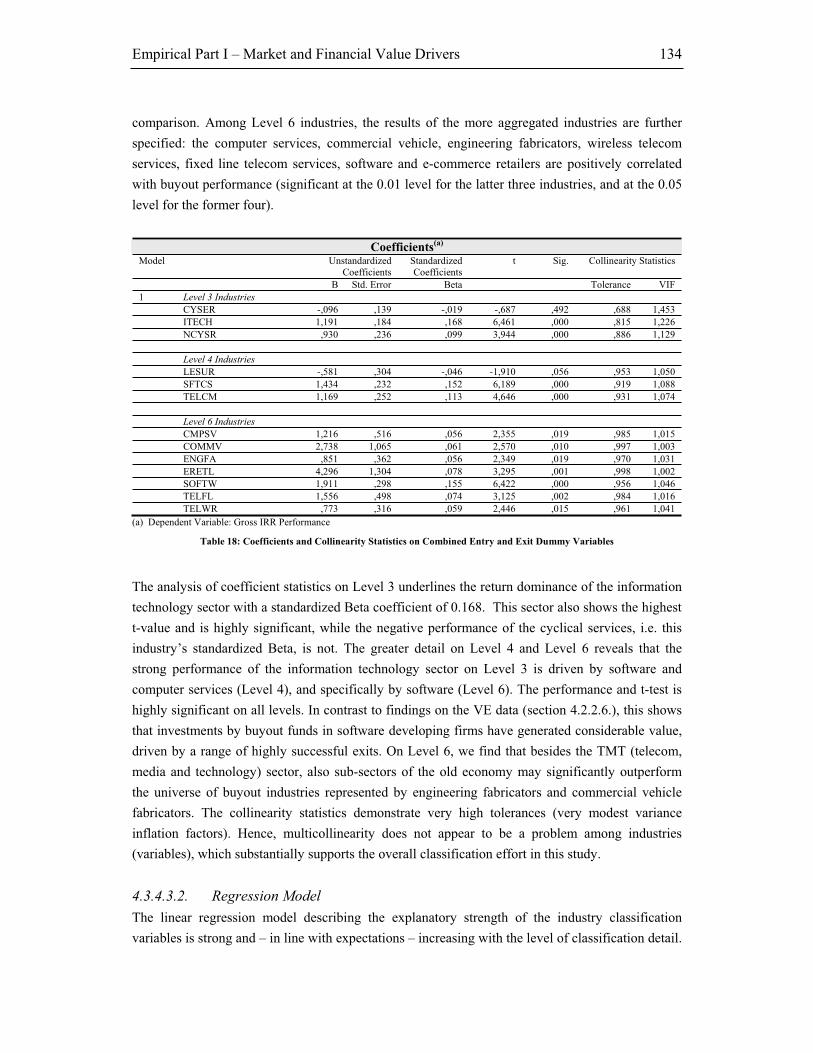
Empirical Part I – Market and Financial Value Drivers 134
comparison. Among Level 6 industries, the results of the more aggregated industries are further
specified: the computer services, commercial vehicle, engineering fabricators, wireless telecom
services, fixed line telecom services, software and e-commerce retailers are positively correlated
with buyout performance (significant at the 0.01 level for the latter three industries, and at the 0.05
level for the former four).
Coefficients(a)
Model Unstandardized Coefficients
Standardized Coefficients
t Sig. Collinearity Statistics
B Std. Error Beta Tolerance VIF
1 Level 3 Industries
CYSER -,096 ,139 -,019 -,687 ,492 ,688 1,453
ITECH 1,191 ,184 ,168 6,461 ,000 ,815 1,226
NCYSR ,930 ,236 ,099 3,944 ,000 ,886 1,129
Level 4 Industries
LESUR -,581 ,304 -,046 -1,910 ,056 ,953 1,050
SFTCS 1,434 ,232 ,152 6,189 ,000 ,919 1,088
TELCM 1,169 ,252 ,113 4,646 ,000 ,931 1,074
Level 6 Industries
CMPSV 1,216 ,516 ,056 2,355 ,019 ,985 1,015
COMMV 2,738 1,065 ,061 2,570 ,010 ,997 1,003
ENGFA ,851 ,362 ,056 2,349 ,019 ,970 1,031
ERETL 4,296 1,304 ,078 3,295 ,001 ,998 1,002
SOFTW 1,911 ,298 ,155 6,422 ,000 ,956 1,046
TELFL 1,556 ,498 ,074 3,125 ,002 ,984 1,016
TELWR ,773 ,316 ,059 2,446 ,015 ,961 1,041
(a) Dependent Variable: Gross IRR Performance
Table 18: Coefficients and Collinearity Statistics on Combined Entry and Exit Dummy Variables
The analysis of coefficient statistics on Level 3 underlines the return dominance of the information
technology sector with a standardized Beta coefficient of 0.168. This sector also shows the highest
t-value and is highly significant, while the negative performance of the cyclical services, i.e. this
industry’s standardized Beta, is not. The greater detail on Level 4 and Level 6 reveals that the
strong performance of the information technology sector on Level 3 is driven by software and
computer services (Level 4), and specifically by software (Level 6). The performance and t-test is
highly significant on all levels. In contrast to findings on the VE data (section 4.2.2.6.), this shows
that investments by buyout funds in software developing firms have generated considerable value,
driven by a range of highly successful exits. On Level 6, we find that besides the TMT (telecom,
media and technology) sector, also sub-sectors of the old economy may significantly outperform
the universe of buyout industries represented by engineering fabricators and commercial vehicle
fabricators. The collinearity statistics demonstrate very high tolerances (very modest variance
inflation factors). Hence, multicollinearity does not appear to be a problem among industries
(variables), which substantially supports the overall classification effort in this study.
4.3.4.3.2. Regression Model
The linear regression model describing the explanatory strength of the industry classification
variables is strong and – in line with expectations – increasing with the level of classification detail.

Empirical Part I – Market and Financial Value Drivers 135
Model 1 represents the most aggregated industry classification on Level 3, showing an adjusted R
square of 3.3%. The F value for the model’s fit is 7.037 and is highly significant (p<.001). Model 2
summarizes the “medium detail” industry classification on Level 4, exhibiting a slightly lower
adjusted R square of 3.2%. The F value for the model’s fit is 2.736 and is highly significant
(p<.001). Model 3 captures the most detailed industry classification on Level 6, displaying an
adjusted R square of 2.5%. The F value for the model’s fit is 1.494 and is highly significant
(p<.01). The decrease of adjusted R square is on first view not satisfactory, as a greater level of
detail would be expected to lead to higher explanatory power. The explanation for this effect is
twofold. First, this industry dummy variable analysis does not control for country or region of
transaction origin, i.e. whether the deal is from the U.S. or Europe. Due to the fact that European
and U.S. industries may not perform equally well, this may balance returns observed in either
region. Secondly, the number of observed cases per industry sub-sectors declines with increased
degree of detail and the increased number of (industry) variables decreases the degrees of freedom.
Linear Regression Model Summary Statistics Model R R Square Adjusted
R Square Std. Error
of the Estimate
R Square F Value df1 df2 Sig. F
1 ,197(a) ,039 ,033 1,832578 ,039 7,037 10 1735 ,000
2 ,224(b) ,050 ,032 1,834152 ,050 2,736 33 1712 ,000
3 ,276(c) ,076 ,025 1,840467 ,076 1,494 91 1654 ,002
4 ,216(d) ,047 ,032 1,834052 ,047 3,128 27 1718 ,000
5 ,277(e) ,077 ,037 1,829363 ,077 1,927 72 1673 ,000
6 ,370(f) ,137 ,045 1,821583 ,137 1,489 168 1577 ,000
(a) Predictors: (Constant), All generic Level 3 Industries (b) Predictors: (Constant), All generic Level 4 Industries (c) Predictors: (Constant), All generic Level 6 Industries (d) Predictors: (Constant), All Level 3 Industries for U.S., EU, and n/a countries (e) Predictors: (Constant), All Level 4 Industries for U.S., EU, and n/a countries (f) Predictors: (Constant), All Level 6 Industries for U.S., EU, and n/a countries
Table 19: Linear Regression Model on Industries Level 3, 4 and 6
Accordingly, models 4-6 replicate the above industry analysis, controlling for deal origin.96 The
adjusted R square of these three highly significant (at the 0.001 level; 2-tailed) models increases
from 3.2% for the Level 3, to 3.7% for the Level 4 and 4.5% for the Level 6 industry classification.
The increase in adjusted R square between the three industry classification levels, when controlling
for geographic deal origin, does provide the required evidence for the importance of industry sharp
comparisons of buyout transaction and market performance. In summary, the clear impact of
industry performance on success or failure of buyouts – in particular highly significant industries –
makes it obligatory to control for the industry effect in subsequent analysis.97
96 Categories are Europe, US, or not announced. Due to the fact that the number of observed industry
variables triples in this sub-analysis, further descriptive, correlation and coefficient statistics have been omitted.
97 As most subsequent analysis will relate to Level 4, only the highlighted industries on this aggregation level will be controlled for on a generic basis (i.e. no geographic control), unless otherwise stated.

Empirical Part I – Market and Financial Value Drivers 136
4.3.4.4. Summary of Findings
The industry of buyout transactions has been identified to be a very important value driver. The
above linear regression models have confirmed that industry classification variables are adding
extensive explanatory strength to the analysis of buyouts with up to 4.5% of R square on the
Limited Partners sample. Some of the key findings include that buyout funds in this sample have
successfully invested in the information technology sector. Among this broad sector, the software
sector has been identified – with very high statistical certainty – to produce the highest returns.
Although not a traditional (mature) area of investment for buyout firms, these results could support
a new approach. In addition, the service sector has also proven to be very attractive, but buyout
firms should focus on non-cyclical service investments. Based on these findings, variable
hypothesis H6 has to be rejected, as buyout funds in the Limited Partners’ dataset have performed
well with information technology investments. As a consequence, the VE dataset, which calculated
returns based on fund returns may not be a good indicator of actual performance of buyout funds in
this sector. This could be explained through (i) the high density of deals in this sector in recent
years, and (ii) the VE approach to assign very negative, cash flow driven returns to these
transactions on a fund basis, while the Limited Partners’ data assigns market values or keeps
investments at cost.
4.3.5. Ownership and Buyout Performance
The impact on performance of the level of ownership stake of management and/or the board in
acquisitions has long been discussed in academic research. Although there generally hardly
remains any doubt across most studies that a certain degree of managerial and board ownership
enhances return, there is variance in findings with respect to the level of ownership stake
percentages and board composition. Agrawal and Knoeber (1996) find that performance (Tobin’s
Q) increases significantly as insider ownership increases, but decreases significantly with board
outsiders, leverage, and corporate control activity. With respect to the level of ownership
percentages, Haiyang, Hexter et al. (1993) find that performance (Tobin’s Q) increases for
management ownership in the range [0-7%] and decreases in the range [7-12%]. Cho (1998)
confirms this trend for the ranges [0-7%] and [7%- 38%], Holderness, Kroszner et al. (1999) for the
ranges [0-7%] and [5-25%], Morck, Shleifer et al. (1988) for the ranges [0-5%] and [5-25%],
respectively. The results unambiguously suggest a roof-shaped (concave) relationship between
ownership and performance. However, there is also some evidence that beyond the [5-25%]
ownership range, profitability is increasing again as acquirers gain majority and thereby firm
control (Baker and Wruck 1989; Wruck 1989). Nonetheless, Holl (1975; 1977) had previously
commented in this respect that performance does not necessarily rely on the question whether the
firm is management- or ownership-controlled, but whether there exists an efficient market for
corporate control at the target company.

Empirical Part I – Market and Financial Value Drivers 137
Consequently, several authors find no difference in performance between majority controlled firms
and minority investments, as well as widely and more narrowly held firms (Holderness and
Sheehan 1988; Murali and Welch 1989; Denis and Denis 1994). More specific in relation to
buyouts, Kaplan (1989b) finds a significant increase in performance measures as average pre- to
post-buyout managerial ownership increases from 9% to 31%. Peck (1996b) finds that new
investors, even if only through a minority investment, significantly improve performances in
MBOs.
The analysis of the performance of investments of buyout firms according to the level of acquired
ownership percentage (and hence their accompanying voting and board representation), based on
the Limited Partners’ data, are somewhat surprising. The highest average gross IRR of 105% can
be found among control investments, i.e. in which buyout investors acquired between 75% and
100% of total equity (fourth quartile). Investments in the second and third quartile of ownership
percentages returned significantly lower IRRs, with 67% and 56% respectively. The result for the
second and third quartiles, when compared to the forth, could suggest that the lack of majority
control may inhibit strategic direction and managerial decision making, hence decreasing buyout
returns.
90%
67%
105%
56%
0%
20%
40%
60%
80%
100%
120%
0 - 25% 25 - 50% 50 - 75% 75 - 100%
Av
era
ge
Gro
ss
IR
R (
%)
All Realised Deals Polynomic Trend
Figure 50: Average Gross Returns of Realized Buyout Deals by Ownership Percentage Quartile
Source: INSEAD Buyout Database, analyzed by author (Deal N=227)
However, the returns in the first quartile between 0% and 25% of ownership also show a
surprisingly high, albeit lower than in the forth quartile, average gross IRR of 90%. This is in
contrast to the expectation from the above argument that minority investments would be the least
attractive from a return perspective, as the ability of strategic and managerial influence on the
buyout target through the General Partner is limited. There is a theoretical and practical explanation
for this phenomenon. Firstly, the strong minority investment return could be seen as further
evidence of the above discussed literature on managerial incentives and the merits of the market for

Empirical Part I – Market and Financial Value Drivers 138
corporate control (Holl 1975; Jensen and Meckling 1976; Holl 1977), in which the introduction of a
higher level of control through new ownership – even and in particular at low percentages –
increases firm performance. Secondly, one possible practical explanation could be seen in the
successful co-investment activity by buyout funds. The increasingly large size of buyout targets
and individual fund’s restrictions with respect to size of individual investments require buyout
funds to team up for individual large mega-deals.98 Another frequent aspect for co-investment
could be that the buyout firm’s specific expertise in an acquisition target’s industry is seen as
value-add to the overall execution and value generation process.99 As a result, despite the fact that
minority control per se from a management control perspective may not be advantageous, co-
investment activity represents a successful alternative to combine financial investment power with
industry expertise. Moreover, the minority control has to be considered from a different angle in
these cases, as the “group of buyout fund investors” actually may well have gained (majority)
control over the target from prior shareholders. The positive performance points to positive
collaboration among the investing funds.
90%
108%
54%
68%
0%
20%
40%
60%
80%
100%
120%
0 - 25% 25 - 50% 50 - 75% 75 - 100%
Av
era
ge
Gro
ss
IR
R (
%)
Realised US Deals Polynomic Trend
Figure 51: Average Gross Returns of Realized U.S. Buyout Deals by Ownership Percentage Quartile
Source: INSEAD Buyout Database, analyzed by author (Deal N=164).
However, these overall findings emerge differently when compared across geographic regions. The
trend in the U.S. mirrors the overall picture with the exception that the second quartile returns is
less (54% average gross IRR) than the third (68% average gross IRR). Except for the minority
98 Restrictions are outlined in the terms and conditions of the fund’s Private Purchase Memorandum and
support diversification of risk. Despite heterogeneous rules across industry, buyout funds are generally not allowed to invest more than 10% of committed capital in any one single transaction. Also, there are often limits on concentration of investments in any specific type of industry (except for several niche funds that may specifically focus on such a specific segment).
99 Expertise based co-investing is frequently observed in the information technology, telecommunications and media sector, where smaller specialized buyout funds team up with larger funds in their acquisitions.

Empirical Part I – Market and Financial Value Drivers 139
investments (0-25%), this finding is more in line with the prior expected linear relationship
between ownership stake and performance between 25% and 100% of ownership.
60%
187%
41%
101%
0%
20%
40%
60%
80%
100%
120%
140%
160%
180%
200%
0 - 25% 25 - 50% 50 - 75% 75 - 100%
We
igh
ted
Av
era
ge
Gro
ss
IR
R (
%)
Realised European Deals Polynomic Trend
Figure 52: Weighted Average Gross Returns of Realized European Buyout Deals by Ownership Percentage Quartile
Source: INSEAD Buyout Database, analyzed by author (Deal N=33).
By contrast, European deals display inverse performance results for the second and third quartile
compared to the U.S., with significantly lower returns in the third (sharply lower on normal
average).100 One explanation could be that the third quartile results into a “deadlock ownership
quartile”, in which the buyout firm lacks enough voting power (i.e. 75%) to implement, for
instance, radical restructuring programs. This could specifically be the case in Europe, in which
former shareholders or employees through their voting rights could block those measures if the
buyout fund fails to secure a controlling stake, which could in turn lead to a deterioration of
returns. The high return of 187% IRR exhibited for the forth quartile would suggest that gaining
majority control in buyout investments in Europe is particularly necessary, or effective, in order to
implement value creation strategies that lead to superior returns.
4.3.5.1. Regression Model
A simple one-factor linear regression between gross IRR and ownership percentage does not
provide significant results under the one, five or ten per cent confidence level. However, the
significance level of 0.411 is directionally pointing towards a relationship between ownership stake
and performance in leveraged buyouts. The overall result on significance is not surprising due to
the convex relationship between ownership and return, as the sample distribution is not linear.

Empirical Part I – Market and Financial Value Drivers 140
4.3.5.2. Summary of Findings
The ownership percentage acquired in buyout transactions has not been identified to be an
important value driver. The above descriptive and brief regression results have demonstrated that
there appears to be a convex relationship between ownership and buyout returns. Majority control
investments do perform best, which leads to acceptance of variable hypothesis H7. However, the
surprising finding on the Limited Partners sample is that minority investments, defined as less than
25%, to produce very attractive results, which could be explained through a successful co-
investment behavior among buyout funds. The 2nd and 3rd quartiles exhibit weaker average
performance.
4.3.6. Deal Size and Buyout Performance
The Private Equity industry’s, and especially the buyout industry’s, ongoing discussion regarding
the merits of buyout fund investment focus on particular (niche) industries as well as certain deal
size specialization (i.e. small-cap, mid-cap, large-cap) leads to the question about whether or not
there exists an optimal deal size. Given the large sample size of the Limited Partners’ dataset and a
normal distribution of returns, we should not expect a significant variance in returns.
31%
53%
141%
46%
47%
64%
48%
51%
124%
65% 67% 74%
0
50
100
150
200
250
300
350
0-1 1-2.5 2.5-5 5-7.5 7.5-10 10-15 15-20 20-30 30-50 50-100 100-
250
250+
Average Investment Size (US$ mm)
Fre
qu
en
cy o
f IR
R
0%
25%
50%
75%
100%
125%
150%
Weig
hte
d A
vera
ge I
RR
(%
)
Frequency of IRR Weighted Average Gross IRR
Weighted Average IRR
across all Deal Sizes: 68%
Figure 53: Weighted Average Gross Returns of Realized Buyout Deals by Average Investment Size Categories
Source: INSEAD Buyout Database, analyzed by author (Deal N=1,745).
However, the analysis of all realized LBO transactions illustrates that certain deal sizes on average
do perform better (historically). Most notably, small transactions of up to US$ 7.5 million, but
100 Due to lower sample size for European deals compared to US, returns have been weighted by invested
capital.

Empirical Part I – Market and Financial Value Drivers 141
especially the smallest deals with up to US$ 1 million of investment, perform exceptionally well
with returns ranging between 124% and 74%. This could be interpreted as a result of (i) superior
returns in the small-cap deal investment category, (ii) successful smaller co-investments of GPs in
larger transactions, add-on or Venture Capital type investments (especially during the technology
boom between 1997 and 2000), (iii) the time/return influence of historically high performing, small
investment deals, e.g. undertaken during the positive investment environment of the early 1980s.
Furthermore, we find that mid-cap sized deals, with an equity investment size between US$ 7.5 and
US$ 50 million on average perform weaker than small-cap deals at approximately 50% weighted
average gross IRR across these deal size categories. The large-cap deal category shows a very
diverse picture: deals with an equity investment of US$ 50 to US$ 100 million display the lowest
return among all realized transaction size categories. One potential interpretation could be that the
investment size represents a “stuck in the middle” investment size situation, which based on size
between mid- and large-cap segment, does not yet guarantee that industry leading firms can
commonly be acquired. The US$ 100 to US$ 250 million category of large-cap as well as the
higher than US$ 250 million investment category of “mega-deals” do support the hypothesis that
large-cap deals can be highly attractive. Assuming a 3:1 debt to equity ratio, the mega deal
category represents transactions of at least US$ 1 billion. The strong performance is at odds with
Private Equity industry experts’ view that large-cap transactions are those which attract the
maximum competition, and thus on average must have limited returns. As potential explanation for
the out-performance it could be stated that mega deals (i) are generally undertaken by the largest
and most successful buyout funds that have had a long and solid track record of investments in
smaller deal categories, (ii) most large transactions have been undertaken in recent years due to the
significant growth in fund sizes, and a range of those large deals have also been successfully exited
during a time that saw highly favorable market exit conditions (i.e. 1997 to 2000). It therefore
remains to be seen from future realized mega deals’ returns whether the strong downturn in stock
markets between March 2000 and October 2002 and the significantly less favorable exit
environment during that time have had an adverse effect and will bring mega deal returns in the
long run in line with the average return of 61% achieved across the other size categories (i.e.
excluding the mega deals).
4.3.6.1. Regression Results
As reflected in the above trends, the deal size of the focal buyout transaction appears to affect the
value creation potential, i.e. the performance of the dependent variable IRR. The relatively superior
performance of small investments could result from various factors, e.g. (i) superior returns in the
small-cap deal investment category, (ii) successful co-investment activity, (iii) the time/return
influence of historically high performing, small investment deals.
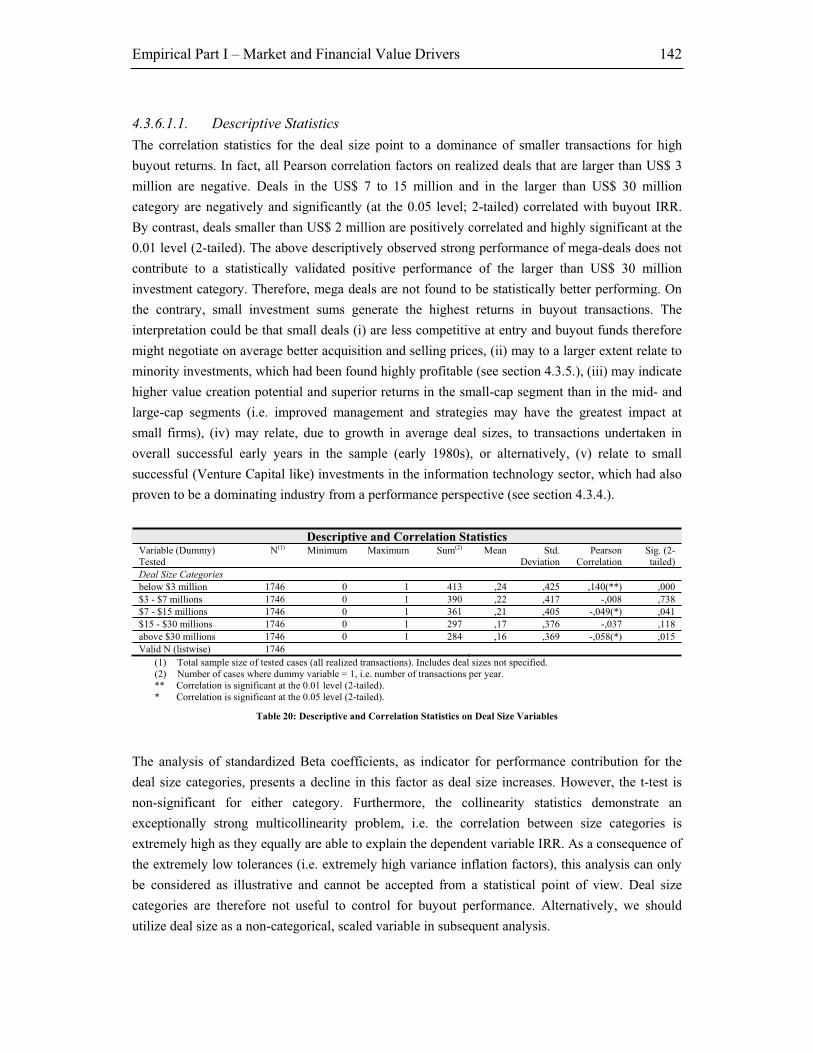
Empirical Part I – Market and Financial Value Drivers 142
4.3.6.1.1. Descriptive Statistics
The correlation statistics for the deal size point to a dominance of smaller transactions for high
buyout returns. In fact, all Pearson correlation factors on realized deals that are larger than US$ 3
million are negative. Deals in the US$ 7 to 15 million and in the larger than US$ 30 million
category are negatively and significantly (at the 0.05 level; 2-tailed) correlated with buyout IRR.
By contrast, deals smaller than US$ 2 million are positively correlated and highly significant at the
0.01 level (2-tailed). The above descriptively observed strong performance of mega-deals does not
contribute to a statistically validated positive performance of the larger than US$ 30 million
investment category. Therefore, mega deals are not found to be statistically better performing. On
the contrary, small investment sums generate the highest returns in buyout transactions. The
interpretation could be that small deals (i) are less competitive at entry and buyout funds therefore
might negotiate on average better acquisition and selling prices, (ii) may to a larger extent relate to
minority investments, which had been found highly profitable (see section 4.3.5.), (iii) may indicate
higher value creation potential and superior returns in the small-cap segment than in the mid- and
large-cap segments (i.e. improved management and strategies may have the greatest impact at
small firms), (iv) may relate, due to growth in average deal sizes, to transactions undertaken in
overall successful early years in the sample (early 1980s), or alternatively, (v) relate to small
successful (Venture Capital like) investments in the information technology sector, which had also
proven to be a dominating industry from a performance perspective (see section 4.3.4.).
Descriptive and Correlation StatisticsVariable (Dummy) Tested
N(1) Minimum Maximum Sum(2) Mean Std. Deviation
Pearson Correlation
Sig. (2-tailed)
Deal Size Categories
below $3 million 1746 0 1 413 ,24 ,425 ,140(**) ,000
$3 - $7 millions 1746 0 1 390 ,22 ,417 -,008 ,738
$7 - $15 millions 1746 0 1 361 ,21 ,405 -,049(*) ,041
$15 - $30 millions 1746 0 1 297 ,17 ,376 -,037 ,118
above $30 millions 1746 0 1 284 ,16 ,369 -,058(*) ,015
Valid N (listwise) 1746
(1) Total sample size of tested cases (all realized transactions). Includes deal sizes not specified. (2) Number of cases where dummy variable = 1, i.e. number of transactions per year. ** Correlation is significant at the 0.01 level (2-tailed). * Correlation is significant at the 0.05 level (2-tailed).
Table 20: Descriptive and Correlation Statistics on Deal Size Variables
The analysis of standardized Beta coefficients, as indicator for performance contribution for the
deal size categories, presents a decline in this factor as deal size increases. However, the t-test is
non-significant for either category. Furthermore, the collinearity statistics demonstrate an
exceptionally strong multicollinearity problem, i.e. the correlation between size categories is
extremely high as they equally are able to explain the dependent variable IRR. As a consequence of
the extremely low tolerances (i.e. extremely high variance inflation factors), this analysis can only
be considered as illustrative and cannot be accepted from a statistical point of view. Deal size
categories are therefore not useful to control for buyout performance. Alternatively, we should
utilize deal size as a non-categorical, scaled variable in subsequent analysis.

Empirical Part I – Market and Financial Value Drivers 143
Coefficients(a)
Model Unstandardized Coefficients
Standardized Coefficients
t Sig. Collinearity Statistics
B Std. Error Beta Tolerance VIF
1 Deal Size
(Constant) -1,000 1,847 -,542 ,588
below $3 million 2,282 1,849 ,520 1,234 ,217 ,003 316,072
$3 - $7 millions 1,786 1,849 ,399 ,966 ,334 ,003 303,663
$7 - $15 millions 1,636 1,849 ,356 ,885 ,376 ,003 287,153
$15 - $30 millions 1,660 1,850 ,335 ,897 ,370 ,004 247,309
above $30 millions 1,567 1,850 ,310 ,847 ,397 ,004 238,643
(a) Dependent Variable: Gross IRR Performance
Table 21: Coefficients and Collinearity Statistics on Deal Size Variables
4.3.6.1.2. Regression Model
The linear regression model describing the explanatory strength of the deal size category variables
is solid. The adjusted R square is 1.9%. The F value for the model’s fit is very high at 7.615 and is
highly significant (p<.001), yet the high VIF factors have to be acknowledged as mentioned above.
Overall, the result underlines that different deal sizes (categories) have a significant impact on
explaining buyout performance for reasons hypothesized above. Due to multicollinearity issues,
this effect will only be controlled for through a non-categorical deal size variable (“Initial
Investment in USD”) where applicable (a correlation/regression test of this variable with
performance shows a negative, yet not highly significant correlation for realized buyout
transactions).
Linear Regression Model Summary Statistics Model R R Square Adjusted
R Square Std. Error
of the Estimate
R Square F Value df1 df2 Sig. F
1 ,146(a) ,021 ,019 1,846590 ,021 7,615 5 1740 ,000
(a) Predictors: (Constant), below $3 million, above $30 millions, $15 - $30 millions, $7 - $15 millions, $3 - $7 millions
Table 22: Linear Regression Model on Deal Size Variables
4.3.6.2. Summary of Findings
The amount of capital invested by the buyout firm in the transactions has been identified to be a
valid value driver. The above descriptive and regression results exhibited that small transactions
have been particularly successful from a return perspective. Mega buyouts show unexpectedly high
returns, potentially based on several recent successful realizations, yet statistically this result cannot
be confirmed. Hence, variable hypothesis H7 has to be rejected, as small transactions outperform.
The test suffers from intense multicollinearity effects, which makes a final recommendation
obsolete. Due to these multicollinearity issues, the deal size effect will only be controlled for
through a non-categorical deal size variable (“Initial Investment in USD”) where applicable.

Empirical Part I – Market and Financial Value Drivers 144
4.3.7. Investment Holding Time and Buyout Performance
Buyout firms are frequently accused by skeptics of their short investment horizon. In essence, they
are blamed to acquire firms to generate a “quick buck” on some drastic short-sighted restructuring
measures, e.g. by reducing the workforce or slashing capital expenditures. These accusations are
rejected and also do not hold stereotypically. However, LBO firms do have a clear incentive to
create maximum value in the shortest possible period of time. The factor time is working against
General Partners as buyout returns (IRR) are normally declining over prolonged periods of time, as
a large amount of value creation at the target is often achieved shortly after the acquisition and/or
cannot be sustained over time. Hence, the marginal long-term improvements generally do not
justify holding on to the investment. In addition, a track record of fast payback benefits a fund’s
position during renewed fundraising efforts.
21%41%
27%25%36%37%
62%
78%
144%
252%
0
100
200
300
400
0-1 1-2 2-3 3-4 4-5 5-6 6-7 7-8 8-9 9+
Holding Period (Years)
Fre
qu
en
cy (
N)
0%
50%
100%
150%
200%
250%
300%
Avera
ge G
ross I
RR
(%
)
Frequency of IRR Average Gross IRR
Figure 54: Average Gross Returns of Realized Buyout Deals by Holding Period
Source: INSEAD Buyout Database, analyzed by author (Deal N=1,684).
The descriptive results based on the Limited Partners’ data clearly indicate the negative
relationship between holding period of the buyout investment and its return (IRR). In particular,
investments that can be exited within the first or second year post acquisition exhibited very high
returns of 252% and 144% average gross IRR respectively, constantly decreasing thereafter. The
only noteworthy break in this declining trend is a relatively stronger performance for investments
held between 8 and 9 years. One possible interpretation could be that despite the fact that buyout
funds may generally opt for quick exits, they could keep a few target companies in their portfolio
which consistently demonstrate a sustainable and high IRR. These consistent returns can be
achieved through (i) high debt capacity of the target that allows frequent recapitalizations and large

Empirical Part I – Market and Financial Value Drivers 145
equity dividends, (ii) extraordinary revenue and cash flow growth. Under these circumstances, high
amounts of fund equity exposed to consistently high returns are beneficial to the extent that the
opportunity cost of the exit are lower, and hence the exit decision is postponed as long as a certain
threshold level of returns is accomplished. Due to the fact that the fund’s commitment period is ten
years in general, these profitable long-term investments are then exited before the fund’s maturity,
i.e. on average between years 8 and 9.
4.3.7.1. Regression Results
As reflected in the above trends, the holding period of the focal buyout transaction appears to
significantly affect the value creation potential, i.e. the performance of the dependent variable IRR.
The consistent trend of falling performance over time is mainly linked to the mathematical
calculation of the IRR formula and the impact of time, but also due to the marginally decreasing
value creation potential at the target.
4.3.7.1.1. Descriptive Statistics
The correlation statistics for the holding period year groupings with the dependent variable IRR
demonstrate high levels of significance across most categories. The categories for 0-1 years, 1-2
years and 4-5 years are significant at the 0.001 level (2-tailed). Also, the first two categories are
positively correlated with performance, while all categories beyond 2 years of investment holding
period is negatively correlated with deal IRR. These results provide substantial support for the
descriptive graphical results of a negative relationship between holding period and buyout return.
Moreover, the change in Pearson correlation sign could suggest that buyout deals should preferably
be exited within 2 years post acquisition by buyout funds.
Descriptive and Correlation StatisticsVariable (Dummy) Tested
N(1) Minimum Maximum Sum(2) Mean Std. Deviation
Pearson Correlation
Sig. (2-tailed)
Holding Period (Years)
0-1 1746 0 1 147 ,08 ,278 ,278(**) ,000
1-2 1746 0 1 296 ,17 ,375 ,153(**) ,000
2-3 1746 0 1 355 ,20 ,403 -,009 ,722
3-4 1746 0 1 261 ,15 ,357 -,045 ,063
4-5 1746 0 1 212 ,12 ,327 -,089(**) ,000
5-6 1746 0 1 128 ,07 ,261 -,068(**) ,004
6-7 1746 0 1 95 ,05 ,227 -,073(**) ,002
7-8 1746 0 1 56 ,03 ,176 -,053(*) ,027
8-9 1746 0 1 35 ,02 ,140 -,031 ,198
9+ 1746 0 1 82 ,05 ,212 -,072(**) ,003
Valid N (listwise) 1746
(1) Total sample size of tested cases (all realized transactions). Includes holding periods not specified. (2) Number of cases where dummy variable = 1, i.e. number of transactions per year. ** Correlation is significant at the 0.01 level (2-tailed). * Correlation is significant at the 0.05 level (2-tailed).
Table 23: Descriptive and Correlation Statistics on Holding Period Variables
The analysis of standardized coefficients for the holding period categories compellingly verifies the
observed trend. The standardized coefficient Beta is constantly decreasing from an extremely high
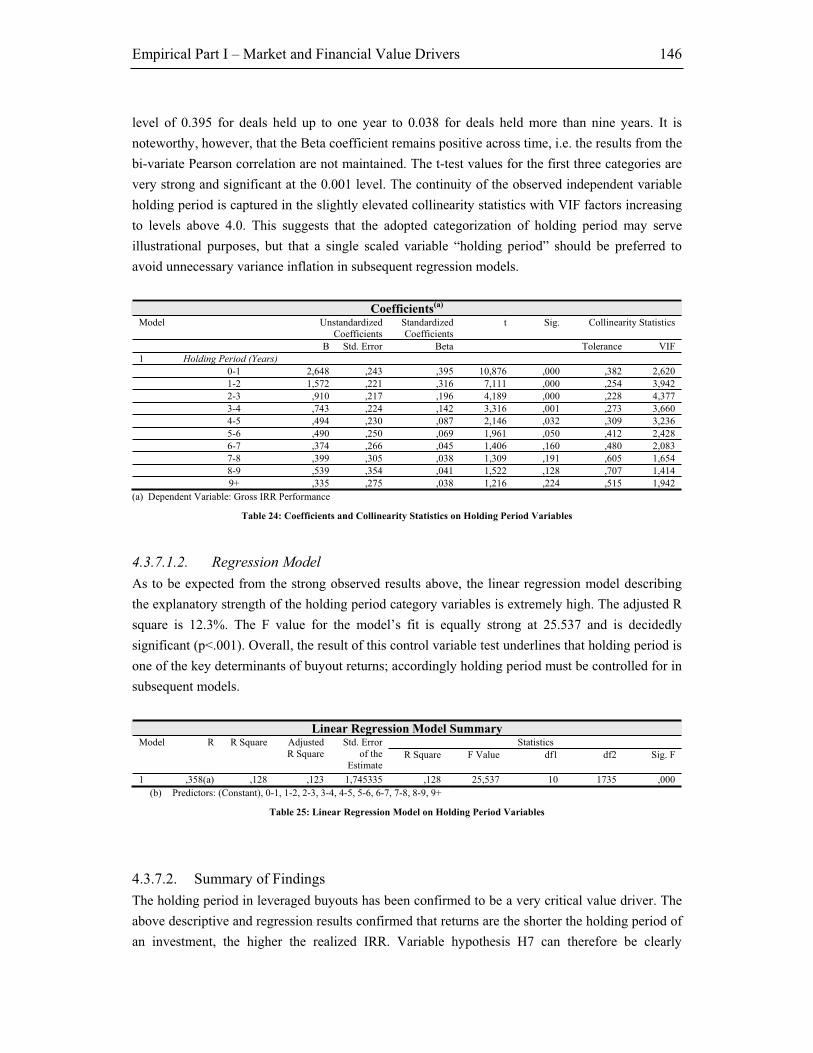
Empirical Part I – Market and Financial Value Drivers 146
level of 0.395 for deals held up to one year to 0.038 for deals held more than nine years. It is
noteworthy, however, that the Beta coefficient remains positive across time, i.e. the results from the
bi-variate Pearson correlation are not maintained. The t-test values for the first three categories are
very strong and significant at the 0.001 level. The continuity of the observed independent variable
holding period is captured in the slightly elevated collinearity statistics with VIF factors increasing
to levels above 4.0. This suggests that the adopted categorization of holding period may serve
illustrational purposes, but that a single scaled variable “holding period” should be preferred to
avoid unnecessary variance inflation in subsequent regression models.
Coefficients(a)
Model Unstandardized Coefficients
Standardized Coefficients
t Sig. Collinearity Statistics
B Std. Error Beta Tolerance VIF
1 Holding Period (Years)
0-1 2,648 ,243 ,395 10,876 ,000 ,382 2,620
1-2 1,572 ,221 ,316 7,111 ,000 ,254 3,942
2-3 ,910 ,217 ,196 4,189 ,000 ,228 4,377
3-4 ,743 ,224 ,142 3,316 ,001 ,273 3,660
4-5 ,494 ,230 ,087 2,146 ,032 ,309 3,236
5-6 ,490 ,250 ,069 1,961 ,050 ,412 2,428
6-7 ,374 ,266 ,045 1,406 ,160 ,480 2,083
7-8 ,399 ,305 ,038 1,309 ,191 ,605 1,654
8-9 ,539 ,354 ,041 1,522 ,128 ,707 1,414
9+ ,335 ,275 ,038 1,216 ,224 ,515 1,942
(a) Dependent Variable: Gross IRR Performance
Table 24: Coefficients and Collinearity Statistics on Holding Period Variables
4.3.7.1.2. Regression Model
As to be expected from the strong observed results above, the linear regression model describing
the explanatory strength of the holding period category variables is extremely high. The adjusted R
square is 12.3%. The F value for the model’s fit is equally strong at 25.537 and is decidedly
significant (p<.001). Overall, the result of this control variable test underlines that holding period is
one of the key determinants of buyout returns; accordingly holding period must be controlled for in
subsequent models.
Linear Regression Model Summary Statistics Model R R Square Adjusted
R Square Std. Error
of the Estimate
R Square F Value df1 df2 Sig. F
1 ,358(a) ,128 ,123 1,745335 ,128 25,537 10 1735 ,000
(b) Predictors: (Constant), 0-1, 1-2, 2-3, 3-4, 4-5, 5-6, 6-7, 7-8, 8-9, 9+
Table 25: Linear Regression Model on Holding Period Variables
4.3.7.2. Summary of Findings
The holding period in leveraged buyouts has been confirmed to be a very critical value driver. The
above descriptive and regression results confirmed that returns are the shorter the holding period of
an investment, the higher the realized IRR. Variable hypothesis H7 can therefore be clearly

Empirical Part I – Market and Financial Value Drivers 147
accepted. The statistical results do not support the slightly improved average performance for the
sample of long-term investments between years 8 and 9, as exhibited in figure 54. The central
takeaway for theory from this analysis should be that buyout firms should have a confirmed interest
for a quick investment turnover, not least due to the fact that they will eventually be measured on
their track record according to this dimension by their fund’s investors. From a buyout fund
practitioner perspective, investments with rather long-term value creation strategies should be
disadvantaged when compared to short opportunistic investments.
4.3.8. Leveraged Buyout Performance according to Entry and Exit Modes
4.3.8.1. Leveraged Buyout Performance according to Entry Mode
For a leveraged buyout fund, there are several options to invest in a target company from a
transaction-mode perspective. The most frequent is the outright acquisition of the buyout target,
which generally, but not necessarily, involves taking a majority stake and control. Other entry
modes are considering the transaction more from an “attractive financing opportunity” angle.
Acquisition financing captures transactions, in which the buyout fund has supported the deal by
injecting (preferred) equity, high yielding debt facilities (in- or excluding warrants on the equity) or
a hybrid of both. This type of mezzanine investing is particularly widespread in small- and mid-cap
transactions, which are financed privately without approaching capital markets or banks. In
general, buyout funds – along with the yield on the equity/debt products – receive sizeable amounts
of warrants that are converted into considerable equity stakes if the buyout succeeds.101
Growth capital either relates to additional equity financing into a buyout fund target for (external
or internal) expansion purposes, or alternatively, relates to a buyout fund’s early stage equity
(co)investments in venture-type deals. Recapitalizations are a financing event, in which an existing
buyout target is re-leveraged with the intention to (i) take out equity from the target through a
special dividend to the shareholders by substituting it in the capital structure with debt, (ii)
(re)increase the expected IRR. Recapitalizations commonly involve highly successful buyout
targets, which have generated significant cash to de-leverage the initial transaction debt financing.
Buyout funds may either recapitalize their own portfolio company or participate in another fund’s
recapitalization (e.g. through an above described debt instrument).
4.3.8.1.1. Entry Mode and Invested Capital
The performance results according to entry mode show that the outright acquisition yields the
highest average gross IRR with 54%, followed by growth capital (34% average gross IRR),
acquisition financing and recapitalization (19% average gross IRR each). These findings support
101 Yield may either be received through cash interest, or through pay in kind (PIK) interest, which is
accumulated and paid at maturity (or transaction exit) with the repayment of the principal, plus warrants on the target’s equity.

Empirical Part I – Market and Financial Value Drivers 148
the efficient market theory, as the higher risk involved in outright acquisitions is rewarded higher
than financing-like investments. Acquisition financings, whose (subordinated) debt facilities are
often secured by the assets of the buyout target, must therefore also yield less than the risk
premium received in an outright acquisition. Likewise, the recapitalization of a buyout target
means that the main value creation process has already largely materialized under the initial deal.
In a recapitalization deal, there is therefore limited scope on average to further enhance business
performance internally, thus the average gross return of 19% is rather based on “financial
(re)engineering” than operational improvements. However, it is noteworthy to mention the high
average gross IRR of 127% for realized recapitalizations. The high IRR is likely to be a result of
the typically very low amount of remaining equity in the company after the recapitalization and
must therefore be interpreted in conjunction with the initial deal’s IRR.
127%
54%
34%
19% 19%
87%
61%61%
39%
19%
-2%-17%
0
10
20
30
40
50
60
ACQUISITION GROWTH CAPITAL ACQUISITION FINANCING RECAPITALISATION
Avera
ge I
nveste
d C
ap
ital
($ m
m)
-20%
0%
20%
40%
60%
80%
100%
120%
140%
Weig
hte
d A
vera
ge G
ross I
RR
(%
)
All Deals Avg. Inv. Capital Realised Deals Avg. Inv. Capital
Unrealised Deals Avg. Inv. Capital All Deals Weighted Avg. IRR
Realised Deals Weighted Avg. IRR Unrealised Deals Weighted Avg. IRR
Figure 55: Weighted Average Gross Returns of Buyout Deals by Entry Mode, Average Invested Capital and Investment Status
Source: INSEAD Buyout Database, analyzed by author (Deals N=836).
The average invested capital in the entry mode sub-sample is comparable for acquisitions and
acquisition financings with US$ 22.1 million and US$ 22.5 million respectively. Although it may
be somewhat surprising that the average deal size for the less risky acquisition financings is not
higher, this should be seen in the context that the size of these investments is capped by the
conventionally lower overall transactions sizes in the small- and mid-cap segment102. Naturally,
investments in the growth capital sector only averaged US$ 7.1 million due to the smaller amounts
involved in follow-on equity capital injections or venture-type deals. The considerably higher
102 This is assuming that the above statement that these acquisition financing events are more frequent in
these segments holds.

Empirical Part I – Market and Financial Value Drivers 149
average invested capital in recapitalizations of US$ 40.8 million can be seen as a result of (i) the
lower risk involved in re-leveraging successful buyouts compared to investing in uncertain new
ones, (ii) the fact that the average deal size naturally must be higher as the recapitalization can be
seen as a “secondary buyout”, hence companies are more mature and larger than the initial/average
buyout. 103
4.3.8.1.2. Entry Mode and Holding Period
Consequently, the average holding period of recapitalizations is the lowest, with 2.3 years, as the
recapitalization is commonly intended to only shortly postpone the final exit from the investment.
Likewise, growth capital investments (2.5 years average holding period) in buyouts on average
occur later in the life cycle of a target and thus have a shorter holding period than outright
acquisitions and acquisition financings (3.4 and 3.5 years average holding period respectively).104
5%
10%
54%
13%
43%
40%
57%
-
1,0
2,0
3,0
4,0
5,0
ACQUISITION GROWTH CAPITAL ACQUISITION FINANCING RECAPITALISATION
Av
era
ge
Ho
ldin
g P
eri
od
(Y
ea
rs)
0%
10%
20%
30%
40%
50%
60%
We
igh
ted
Av
era
ge
Gro
ss
IR
R (
%)
US Deals Avg. Holding Period European Deals Avg. Holding Period
US Deals Weighted Avg. IRR European Deals Weighted Avg. IRR
Figure 56: Weighted Average Gross Returns of Buyout Deals by Entry Mode, Holding Period and Region
Source: INSEAD Buyout Database, analyzed by author (Deal N=823).
A comparison of returns and average holding period between U.S. and European deals uncovers the
lower average gross return for U.S. deals in any of the financing categories (i.e. growth capital,
acquisition financing and recapitalization). This is partially the result of higher average holding
periods before exit. However, the magnitude of the U.S.-European gap in this depiction must have
further causes. One possible explanation could be the more competitive U.S. market. The low level
103 Recapitalizations are common if other exit strategies are not available to the buyout fund, and can
therefore be seen as a secondary deal of the same company, postponing the final public or private exit.

Empirical Part I – Market and Financial Value Drivers 150
of deal flow and large amounts of un-invested buyout fund capital could force buyout fund
managers to broadly seek co-investment opportunities, which may (i) not be as selectively chosen,
(ii) are only available at less attractive (yield) terms. Although the main sample of the Limited
Partners’ dataset has shown that U.S. deals outperform European deals, this smaller entry mode
sub-sample points to somewhat higher returns on European acquisitions (57% of average gross
IRR). 105
127%
19%19%
34%
54%
61%61%
87%
-17%-2%
19%
39%
-
1,0
2,0
3,0
4,0
5,0
ACQUISITION GROWTH CAPITAL ACQUISITION
FINANCING
RECAPITALISATION
Avera
ge H
old
ing
Peri
od
(Y
ears
)
-20%
0%
20%
40%
60%
80%
100%
120%
140%
Weig
hte
d A
vera
ge G
ross I
RR
(%
)
All Deals Avg. Holding Period Realised Deals Avg. Holding Period
Unrealised Deals Avg. Holding Period All Deals Weighted Avg. IRR
Realised Deals Weighted Avg. IRR Unrealised Deals Weighted Avg. IRR
Figure 57: Weighted Average Gross Returns of Buyout Deals by Entry Mode, Holding Period and Investment Status
Source: INSEAD Buyout Database, analyzed by author (Deals N=836).
In addition to the three to six month shorter holding period for European investments, they also
demonstrate to have lower average deal sizes. In particular, acquisition financings just average US$
18.5 for European compared to US$ 24.7 million for U.S. deals. The gap could be either seen in a
greater conservativeness per investment of European buyout funds, which may have less
competitive pressure to invest large amounts of fund capital, or due to the greater openness of the
European banking sector to also (acquisition-)finance smaller transactions.
104 The same holds true for venture-type investments of buyout funds. 105 Please note that this analysis only holds for this sub-sample and no general conclusions on the
performance of European vs. U.S. deals is useful here, due to the smaller sample size of categorized realized deals.

Empirical Part I – Market and Financial Value Drivers 151
13%
54%
10%
5%
57%
40%
43%
0
10
20
30
40
50
ACQUISITION GROWTH CAPITAL ACQUISITION FINANCING RECAPITALISATION
Avera
ge In
veste
d C
ap
ital ($
mm
)
0%
10%
20%
30%
40%
50%
60%
Weig
hte
d A
vera
ge G
ross IR
R (
%)
US Deals Avg. Inv. Capital European Deals Avg. Inv. Capital
US Deals Weighted Avg. IRR European Deals Weighted Avg. IRR
Figure 58: Weighted Average Gross Returns of Buyout Deals by Entry Mode, Average Invested Capital and Region
Source: INSEAD Buyout Database, analyzed by author (Deal N=823).
4.3.8.2. Leveraged Buyout Performance according to Exit Mode
Results from the Venture Economics control dataset in section 4.2.2.9. had suggested that
investments that were exited through an initial public offering involved the highest average net
fund returns.106 This finding is supported by the deal level data from the Limited Partners’ database.
On average, the public exit route yielded a gross IRR of 103% across all deals (and countries) in
the sample. The private exit, which incorporates strategic sales, mergers and secondary buyouts,
only yielded an average gross IRR of 66%. For comparison, the average gross IRR of total realized
deals (independent of exit mode classification) of the Limited Partners’ data was 61%, and the
average IRR of unrealized deals was 26%.107 Buyout transactions that led to bankruptcies could
recover only very limited capital to buyout funds, generating a negative gross IRR of -92% on
average.
106 Fund returns served as proxy for each individual investment across a very large sample. 107 Averages refer to (i) all realized transactions, including the smaller sub-sample for which exit modes have
been codified, and (ii) only those unrealized transactions, which have been coded and are hence included in the exit mode sub-sample.

Empirical Part I – Market and Financial Value Drivers 152
103%
66%
26%
-92%
-50
-40
-30
-20
-10
0
10
20
30
40
50
PUBLIC EXIT PRIVATE EXIT UNREALISED BANKRUPTCY
Avera
ge I
nveste
d C
ap
ital
($ m
m)
-150%
-100%
-50%
0%
50%
100%
150%
Weig
hte
d A
vera
ge G
ross I
RR
(%
)
Average Invested Capital Weighted Average Gross IRR
Average
Realised IRR
Figure 59: Weighted Average Gross Returns of Buyout Deals by Exit Mode and Invested Capital
Source: INSEAD Buyout Database, analyzed by author (Deal N=847).
4.3.8.2.1. Exit Mode and Invested Capital
These exit mode performance findings can further be analyzed with respect to the capital that was
initially put at risk in the transaction. Transactions that led to an initial public offering had an
average buyout fund investment of US$ 32 million. This compares with only US$ 15 million for
private exit deals. There can be two important conclusions drawn from this higher capital allocation
to private exit deals: the average deal size for these deals is higher, because (i) at the outset of the
transaction, the public exit mode had a greater probability and/or due to the superior expected
returns, more capital was put at risk, (ii) companies that are destined to go public post-buyout need
a critical transaction size to attract equity market investors, hence the buyout fund either needs to
acquire larger companies from the outset or must build the required critical size by subsequent add-
on investments in order to float the buyout on the public market.
However, the potentially higher risk involved in larger average deal size transactions becomes
obvious, when interpreting the US$ 22 million of average invested capital in bankrupt deals. The
elevated average capital that was put at risk in bankrupt deals could represent (i) an overpayment
for the company at time of the acquisition (excessive equity and/or too aggressive leverage), (ii) the
result of additional equity that was injected in the already defaulting company by the buyout firm in
a rescue effort, (iii) a misinterpretation of exit opportunities. Although acknowledging a general
increase in average transaction size over time, the relatively high average deal size of US$ 25
million for unrealized deals in the sub-sample could therefore also be interpreted as an increase in
risk-taking behavior among buyout funds, which may not necessarily result in higher expected
returns, as seen by these findings.

Empirical Part I – Market and Financial Value Drivers 153
When comparing these results across geographic regions, the above described trend holds true for
U.S. buyout transactions, but not equally for European ones. The first distinct difference is that the
private exit mode in Europe with 106% average gross IRR is even more attractive than the public
exit mode with 90% average gross IRR.108 The average deal size for private exit deals remains
smaller than the one for public exit deals, thus making it more attractive for buyout funds – from a
capital and risk allocation perspective – to focus their investment on deals that are likely to exit via
the private route in Europe. The lower focus on public exit deals in Europe could also serve as an
explanation for the fact that average invested capital in public exit deals is only US$ 22 million,
compared to US$ 31 million for the U.S. The conservativeness in average capital allocation in
Europe can also be observed among unrealized transactions in the sub-sample, which is almost half
(US$ 17 million) compared to the U.S. (US$ 32 million).
24%
89%
58%
17%
90%106%
-
10,0
20,0
30,0
40,0
PRIVATE EXIT PUBLIC EXIT UNREALISED
Av
era
ge
In
ve
ste
d C
ap
ita
l ($
mm
)
0%
20%
40%
60%
80%
100%
120%
Weig
hte
d A
vera
ge G
ross I
RR
(%
)
US Average Invested Capital EU Average Invested Capital
US Weighted Average Gross IRR EU Weighted Average Gross IRR
Average
Realised IRR
Figure 60: Weighted Average Gross Returns of Buyout Deals by Exit Mode, Holding Period and Region
Source: INSEAD Buyout Database, analyzed by author (Deal N=741).
4.3.8.2.2. Exit Mode and Holding Period
Another important aspect is the time frame, in which buyout funds are able to realize their
investments. This time frame, i.e. the holding period of the investment, is generally either driven by
aspects of the value generation process at the buyout target or the exit environment. Nonetheless,
the attractiveness of the public exit route is confirmed by the Limited Partners’ data through a
shorter average holding period of 3.7 years compared to 4.3 years for the private exit route. The
108 Please note that the sample size of the categorization between U.S. and Europe is slightly smaller (due to
other countries and not announced). As a result, weighted averages differ slightly to the above depiction.

Empirical Part I – Market and Financial Value Drivers 154
shorter average payback time can to some extent be understood as compensation for the higher
average capital at risk in public exit deals. Moreover, another explanation for the shorter holding
period of public exits could be that due to the higher expected return through public exits, buyout
funds on average are likely to initially examine the IPO option before private exits. Therefore, as
the more successful deals, i.e. characterized by a shorter time frame for the same level of value
generation, are likely to opt for the former option, average returns are higher and average holding
periods shorter for the public exit mode.
103%
66%
26%
-92%
-5,0
-4,0
-3,0
-2,0
-1,0
-
1,0
2,0
3,0
4,0
5,0
PUBLIC EXIT PRIVATE EXIT UNREALISED BANKRUPTCY
Avera
ge I
nvestm
en
t H
old
ing
Peri
od
(Y
ears
)
-150%
-100%
-50%
0%
50%
100%
150%
Weig
hte
d A
vera
ge G
ross I
RR
(%
)
Average Holding Period Weighted Average Gross IRR
Average
Realised IRR
Figure 61: Weighted Average Gross Returns of Buyout Deals by Exit Mode and Holding Period
Source: INSEAD Buyout Database, analyzed by author (Deal N=847).
Another influencing factor of buyout performance according to exit mode becomes clear when
analyzing exit modes jointly with average holding periods and according to geographic region. The
above presented results that European buyout transactions perform better when exited through the
private market is supported by a significantly lower average holding period of 2.9 years, compared
to 4.7 years for the U.S. The effect is less clear for public exits, as both performances (89% and
90% average gross IRR for the U.S. and Europe respectively) and holding periods (3.9 and 3.7
years for the U.S. and Europe respectively) are almost analogous. Hence, the significantly shorter
payback period of European private exits also appears to influence the level of expected return. The
superiority of the private exit market in Europe could potentially be seen as a result of (i) a less
mature European market from a consolidation perspective in a range of industries, in which
strategic acquisitions (of buyout portfolio companies) – since the opening of the free trade zone in
Europe in 1993 – represent important means to strengthen a company’s competitive position on a
pan-European basis, and (ii) the traditionally less developed markets for initial public offerings in
Europe, which lack the comparable level of retail investor interest found in the U.S. and whose

Empirical Part I – Market and Financial Value Drivers 155
regulatory obstacles have been criticized to inhibit a more fervent IPO market (EU 2002; Gompers
and Lerner 2002).
58%
89%
24%
106%
90%
17%
-
1,0
2,0
3,0
4,0
5,0
PRIVATE EXIT PUBLIC EXIT UNREALISED
Avera
ge H
old
ing
Peri
od
(Y
ears
)
0%
20%
40%
60%
80%
100%
120%
Weig
hte
d A
vera
ge G
ross I
RR
(%
)
US Average Holding Period EU Average Holding Period
US Weighted Average Gross IRR EU Weighted Average Gross IRR
Average
Realised IRR
Figure 62: Weighted Average Gross Returns of Buyout Deals by Exit Mode, Holding Period and Region
Source: INSEAD Buyout Database, analyzed by author (Deal N=741).
4.3.8.3. Regression Results
As reflected in the above trends, the entry and exit mode of the focal buyout transaction to a
considerable degree appears to affect the value creation potential, i.e. the performance of the
dependent variable IRR. For the entry mode, it was established that higher risk (outright
acquisitions) is generally compensated with higher returns compared to, for example, acquisition
financing participation. For the exit mode, prior findings from the VE dataset were confirmed that
the public exit route is attractive. However, concrete differences between the U.S. and European
markets were found. These variables will now be tested with respect to statistical significance.
4.3.8.3.1. Descriptive Statistics
The entry mode correlation statistics show that only the “acquisition” entry mode variable is
(positively and) significantly correlated at the 0.01 level (2-tailed) with the dependent variable IRR.
Consequently, the comparatively higher average performance by buyout funds realized on
acquisitions suggests that the diversification into other entry modes, such as growth capital,

Empirical Part I – Market and Financial Value Drivers 156
acquisition financing and recapitalizations may not be recommended from a return perspective.109
Investors in buyout funds, who are expecting top quartile performance, should therefore scrutinize
General Partner plans to diversify their investment model towards lower yielding investments.
The exit mode correlation statistics show that bankruptcy is (negatively and) significantly
correlated at the 0.05 level (2-tailed), which is not very surprising as the statistics are simply
expressing that bankruptcies consistently lead to adverse performance. More importantly, among
the profitable exit modes the public exit is (positively and) significantly correlated at the 0.01 level
(2-tailed) with acquisition performance. This finding supports the above descriptive graphical
results, which illustrated that the public exit route on average is the more profitable exit route.
Also, although not significant, unrealized deals directionally are likely to have negative
performance, which expresses the initial cash out-flows and low valuation.
Descriptive and Correlation StatisticsVariable (Dummy) Tested
N(1) Minimum Maximum Sum(2) Mean Std. Deviation
Pearson Correlation
Sig. (2-tailed)
Entry Mode
ACQUISITION 1746 0 1 307 ,18 ,381 ,095(**) 0
GROWTH CAPITAL 1746 0 1 65 ,04 ,189 0,001 0,965
ACQUISITION FINANCING
1746 0 1 26 ,01 ,121 0,017 0,468
RECAPITALISATION 1746 0 1 9 ,01 ,072 0,013 0,576
Exit Mode
PRIVATE EXIT 1746 0 1 182 ,10 ,306 0,011 0,641
PUBLIC EXIT 1746 0 1 116 ,07 ,249 ,083(**) 0,001
BANKRUPTCY 1746 0 1 7 ,00 ,063 -,058(*) 0,015
UNREALISED 1746 0 1 11 ,01 ,079 -0,033 0,166
Valid N (listwise) 1746
(1) Total sample size of tested cases (all realized transactions). Includes entry and exit modes not specified. (2) Number of cases where dummy variable = 1, i.e. number of transactions per year. ** Correlation is significant at the 0.01 level (2-tailed). * Correlation is significant at the 0.05 level (2-tailed).
Table 26: Descriptive and Correlation Statistics on Entry and Exit Modes
The relatively high standardized coefficient Betas for acquisition and public exit underline the
positive performance impact of these entry and exit mode variables. The collinearity statistics show
very high tolerances (and very modest variance inflation factors), hence multicollinearity does not
appear to be a problem among these variables in the bivariate regression model context.
109 But could certainly be from a risk (-return) perspective. The Pearson correlation and coefficients remain
positive, indicating that no losses are made on average.

Empirical Part I – Market and Financial Value Drivers 157
Coefficients(a)
Model Unstandardized Coefficients
Standardized Coefficients
t Sig. Collinearity Statistics
B Std. Error Beta Tolerance VIF
1 Entry Mode
(Constant) ,719 ,051 14,164 ,000
ACQUISITION ,478 ,118 ,098 4,065 ,000 ,987 1,013
ACQUISITION FINANCING
,359 ,368 ,023 ,976 ,329 ,996 1,004
GROWTH CAPITAL ,105 ,236 ,011 ,447 ,655 ,991 1,010
RECAPITALISATION ,442 ,621 ,017 ,712 ,477 ,998 1,002
2 Exit Mode
(Constant) ,768 ,049 15,711 ,000
BANKRUPTCY -1,656 ,703 -,056 -2,355 ,019 ,999 1,001
PRIVATE EXIT ,107 ,146 ,018 ,734 ,463 ,991 1,009
PUBLIC EXIT ,627 ,179 ,084 3,500 ,000 ,991 1,009
(a) Dependent Variable: Gross IRR Performance
Table 27: Coefficients and Collinearity Statistics on Entry and Exit Modes
4.3.8.3.2. Regression Model
The linear regression model describing the explanatory strength of the entry mode construct is
surprisingly weak, with an adjusted R square of only 0.8%. However, the F value for the model’s
fit is 4.347 and highly significant. Model 2 summarizes the bivariate regression model for the key
three exit mode variables (excluding unrealized deals).110 Exit modes generate an adjusted R square
of 0.9%. The F value for the exit modes is higher than for entry modes at 6.112, and highly
significant. The direct comparison of the two models suggests that the entry mode of a buyout may
be less important than the way it is exited. Both constructs will be utilized as important control
variables in subsequent advanced regression models.
Linear Regression Model Summary Change Statistics Model R R Square Adjusted
R Square Std. Error
of the Estimate
R Square Change
F Change df1 df2 Sig. F Change
1 ,099(a) ,010 ,008 1,856899 ,010 4,347 4 1741 ,002
2 ,102(b) ,010 ,009 1,855871 ,010 6,112 3 1742 ,000
(a) Predictors: (Constant), RECAPITALISATION, ACQUISITION FINANCING, GROWTH CAPITAL, ACQUISITION (b) Predictors: (Constant), PUBLIC EXIT, BANKRUPTCY, PRIVATE EXIT
Table 28: Linear Regression Model on Entry and Exit Mode Dummy Variables
4.3.8.4. Summary of Findings
The analysis of entry and exit mode variables revealed significant findings for the dynamics of
value creation and buyout returns. The entry mode variable analysis has shown that the riskier
outright acquisition yields higher returns, driven by the more extensive potential for value creation.
Variable hypothesis H9 can therefore be accepted. However, other entry modes, such as
recapitalizations have demonstrated to yield attractive returns, on lower perceived risk as seen by
higher average capital investment. European exit modes on average performed better in this sub-

Empirical Part I – Market and Financial Value Drivers 158
sample, driven e.g. by lower average investment holding periods. The exit mode variable
confirmed that IPOs are statistically the preferred exit route from a return perspective. Variable
hypothesis H10 can therefore also be accepted. Again, a surprising difference between Europe and
the U.S. is, however, that the private exit market is relatively more attractive, enhanced by shorter
European holding periods on this exit route. This may lead to the conclusion that the private exit
market in Europe is also more active, e.g. driven through (necessary) pan-European consolidation.
4.3.9. Leveraged Buyout Performance according to Entry and Exit Types
4.3.9.1. Leveraged Buyout Performance according to Entry Type
The quality and quantity of deal flow substantially determines the success of buyout funds. Overall,
there are three main entry types to approach and eventually acquire a buyout target. First, potential
targets may be approached through a buy-side intermediary, i.e. either an investment bank or
business broker, and is then marketed or introduced to a few selective buyout funds. Buy-side
intermediaries receive a commission in case of one of their acquisition ideas materializes.
Secondly, companies that more actively seek an investor engage similar buy-side intermediaries,
more likely an investment bank that provides additional advice, for the purpose of holding a
competitive auction. These are generally held for larger, attractive businesses, in order to maximize
the transaction value to the seller. As a consequence, due to the higher competition among buyout
funds, it would be expected that returns on these auctions are lower on average according to
industry observers. Finally, the negotiated sale resembles the proprietary deal flow that is
originated by the buyout fund through direct approaches to target companies’ management and/or
shareholders. Due to the personally established contact and exclusive negotiations with the target,
these transactions are commonly thought to involve more favorable acquisition prices for buyout
funds.111
The initial descriptive findings support the hypothesis that the more exclusive, i.e. less competitive,
the negotiations with the buyout targets are held in a transaction, the higher the average expected
return on these investments. Therefore, the weighted average gross return on negotiated sales is
highest with 39%, followed by 36% for buy-side intermediary deals and 26% for competitive
auctions. However, the margin between negotiated sales and buy-side intermediary deals is
astonishingly low, suggesting that either (i) more attractive assets are brokered through
intermediaries, or (ii) intermediaries are not able to extract a considerable sale premium for the
seller. Most surprisingly when considering only realized deals, average gross returns for deals
entered through competitive auctions soar to 153%. The validity of this high return is further
substantiated by a lower standard deviation of 89% for auctions compared to negotiated sales
110 Throughout all regression models in this study, only realized deals will be analyzed, unless specially
mentioned. 111 As a consequence, investors in buyout funds consider the amount of proprietary deal flow as one of the
key criteria in their fund due diligence process.
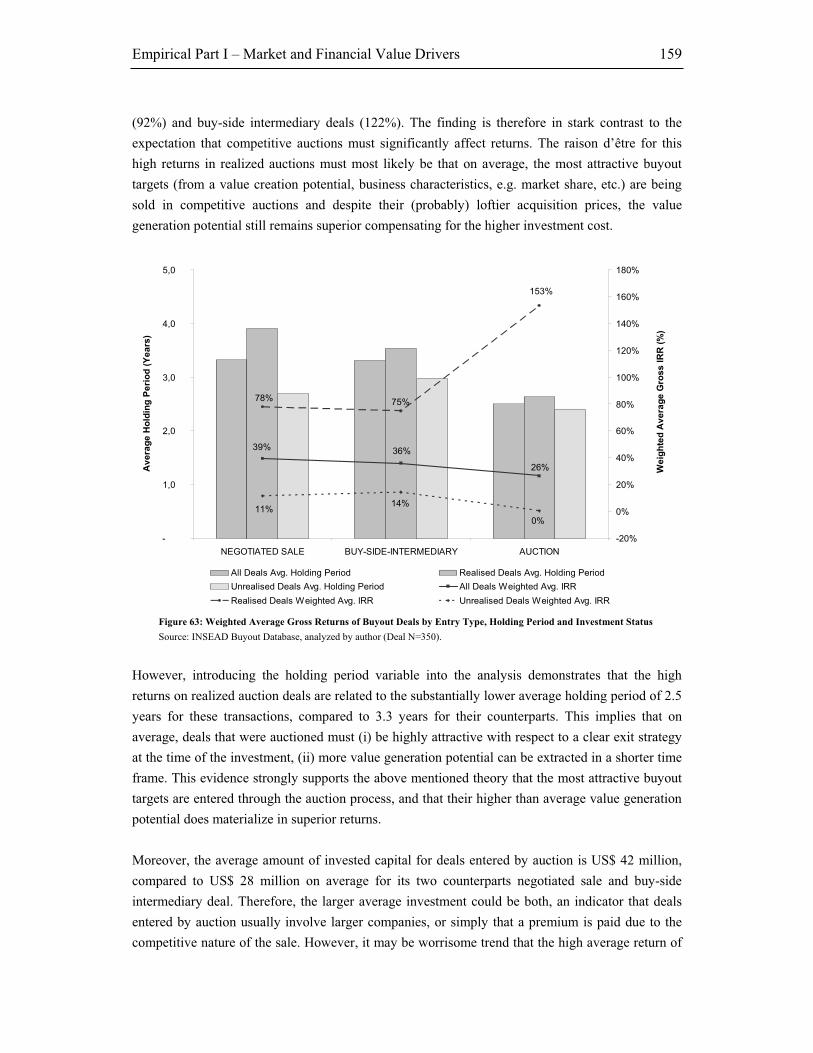
Empirical Part I – Market and Financial Value Drivers 159
(92%) and buy-side intermediary deals (122%). The finding is therefore in stark contrast to the
expectation that competitive auctions must significantly affect returns. The raison d’être for this
high returns in realized auctions must most likely be that on average, the most attractive buyout
targets (from a value creation potential, business characteristics, e.g. market share, etc.) are being
sold in competitive auctions and despite their (probably) loftier acquisition prices, the value
generation potential still remains superior compensating for the higher investment cost.
39% 36%
26%
78% 75%
153%
11%14%
0%
-
1,0
2,0
3,0
4,0
5,0
NEGOTIATED SALE BUY-SIDE-INTERMEDIARY AUCTION
Av
era
ge
Ho
ldin
g P
eri
od
(Y
ea
rs)
-20%
0%
20%
40%
60%
80%
100%
120%
140%
160%
180%
We
igh
ted
Av
era
ge
Gro
ss
IR
R (
%)
All Deals Avg. Holding Period Realised Deals Avg. Holding Period
Unrealised Deals Avg. Holding Period All Deals Weighted Avg. IRR
Realised Deals Weighted Avg. IRR Unrealised Deals Weighted Avg. IRR
Figure 63: Weighted Average Gross Returns of Buyout Deals by Entry Type, Holding Period and Investment Status
Source: INSEAD Buyout Database, analyzed by author (Deal N=350).
However, introducing the holding period variable into the analysis demonstrates that the high
returns on realized auction deals are related to the substantially lower average holding period of 2.5
years for these transactions, compared to 3.3 years for their counterparts. This implies that on
average, deals that were auctioned must (i) be highly attractive with respect to a clear exit strategy
at the time of the investment, (ii) more value generation potential can be extracted in a shorter time
frame. This evidence strongly supports the above mentioned theory that the most attractive buyout
targets are entered through the auction process, and that their higher than average value generation
potential does materialize in superior returns.
Moreover, the average amount of invested capital for deals entered by auction is US$ 42 million,
compared to US$ 28 million on average for its two counterparts negotiated sale and buy-side
intermediary deal. Therefore, the larger average investment could be both, an indicator that deals
entered by auction usually involve larger companies, or simply that a premium is paid due to the
competitive nature of the sale. However, it may be worrisome trend that the high average return of

Empirical Part I – Market and Financial Value Drivers 160
153% has been achieved on realized (i.e. investment was much further back in time) companies on
a substantially lower average investment size of US$ 18 million, and that the low (expected) return
on unrealized (i.e. more recent) deals of 0% relates to an average investment size of US$ 59
million. Consequently, the increasing trend towards auctions and the considerably larger capital
invested may in the future lead to significantly lower returns than observed historically for this
entry type.
26%
36%39%
153%
75%78%
0%
14%11%
0
10
20
30
40
50
60
NEGOTIATED SALE BUY-SIDE-INTERMEDIARY AUCTION
Avera
ge I
nveste
d C
ap
ital
($ m
m)
-20%
0%
20%
40%
60%
80%
100%
120%
140%
160%
180%
Weig
hte
d A
vera
ge G
ross I
RR
(%
)
All Deals Avg. Inv. Capital Realised Deals Avg. Inv. Capital
Unrealised Deals Avg. Inv. Capital All Deals Weighted Avg. IRR
Realised Deals Weighted Avg. IRR Unrealised Deals Weighted Avg. IRR
Figure 64: Weighted Average Gross Returns of Buyout Deals by Entry Type, Average Invested Capital and Investment Status
Source: INSEAD Buyout Database, analyzed by author (Deal N=350).
The hypothesis of a return corrosion among competitive auctions finds further evidence when
comparing auction returns in an international context (see figure 65)112. The European market,
depicted to be less mature and less competitive than the U.S. buyout market, displays higher
weighted average gross IRRs in each entry type, but particularly strong for European auctions. The
high average gross IRR of 55% found among European auctions could be seen as support for the
hypothesis that high quality assets, i.e. with strong value creation potential, are being auctioned in
Europe. The low return of -3% among U.S. auctions could by contrast be seen as an indication that
the more mature and competitive U.S. market has had an adverse effect on this entry type and
hence, U.S. auctions should be avoided by buyout funds.
112 Please note again that the sample size of the categorization between U.S. and Europe is slightly smaller
(due to other countries and not announced). As a result, weighted averages differ slightly to the above depiction.
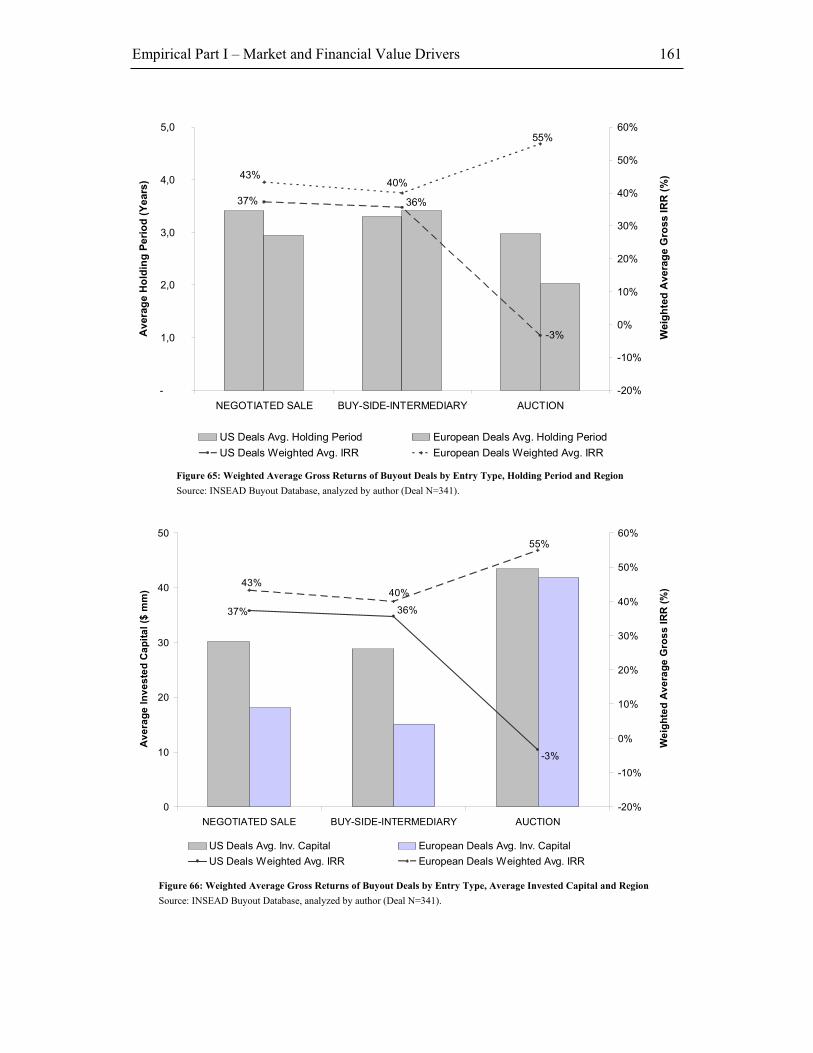
Empirical Part I – Market and Financial Value Drivers 161
-3%
36%37%
55%
40%43%
-
1,0
2,0
3,0
4,0
5,0
NEGOTIATED SALE BUY-SIDE-INTERMEDIARY AUCTION
Avera
ge H
old
ing
Peri
od
(Y
ears
)
-20%
-10%
0%
10%
20%
30%
40%
50%
60%
Weig
hte
d A
vera
ge G
ross IR
R (
%)
US Deals Avg. Holding Period European Deals Avg. Holding Period
US Deals Weighted Avg. IRR European Deals Weighted Avg. IRR
Figure 65: Weighted Average Gross Returns of Buyout Deals by Entry Type, Holding Period and Region
Source: INSEAD Buyout Database, analyzed by author (Deal N=341).
-3%
36%37%
55%
40%43%
0
10
20
30
40
50
NEGOTIATED SALE BUY-SIDE-INTERMEDIARY AUCTION
Av
era
ge
In
ve
ste
d C
ap
ita
l ($
mm
)
-20%
-10%
0%
10%
20%
30%
40%
50%
60%
We
igh
ted
Av
era
ge
Gro
ss
IR
R (
%)
US Deals Avg. Inv. Capital European Deals Avg. Inv. Capital
US Deals Weighted Avg. IRR European Deals Weighted Avg. IRR
Figure 66: Weighted Average Gross Returns of Buyout Deals by Entry Type, Average Invested Capital and Region
Source: INSEAD Buyout Database, analyzed by author (Deal N=341).
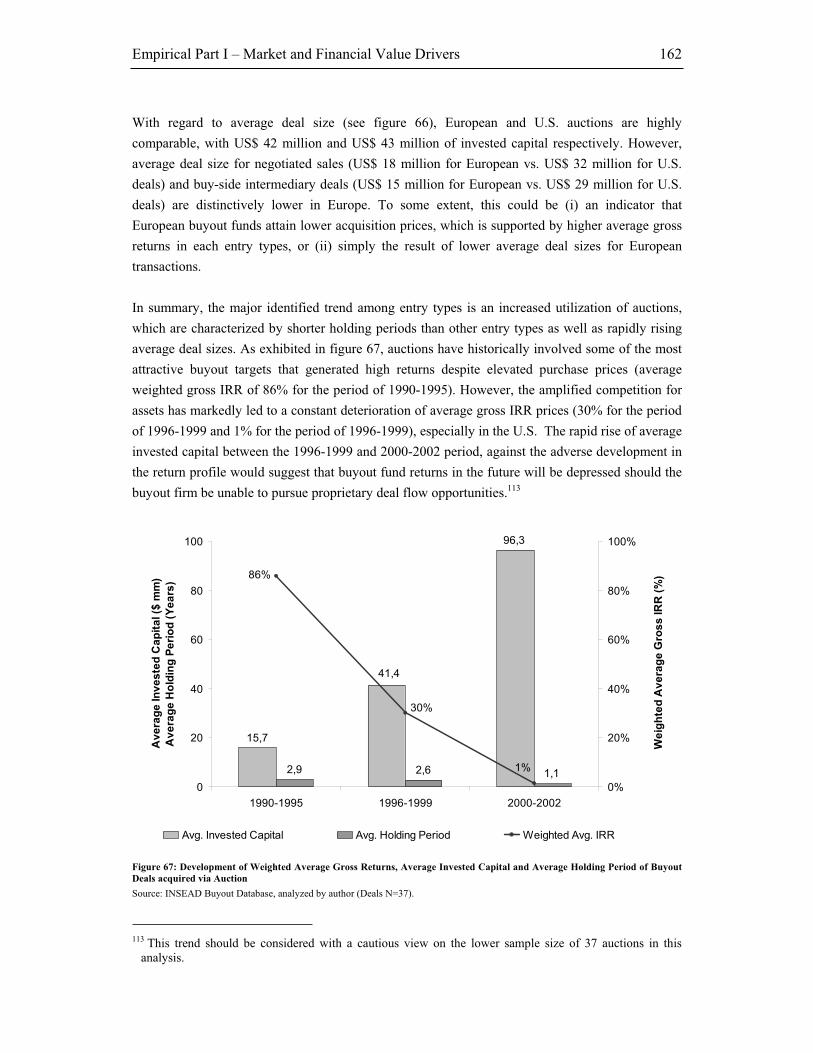
Empirical Part I – Market and Financial Value Drivers 162
With regard to average deal size (see figure 66), European and U.S. auctions are highly
comparable, with US$ 42 million and US$ 43 million of invested capital respectively. However,
average deal size for negotiated sales (US$ 18 million for European vs. US$ 32 million for U.S.
deals) and buy-side intermediary deals (US$ 15 million for European vs. US$ 29 million for U.S.
deals) are distinctively lower in Europe. To some extent, this could be (i) an indicator that
European buyout funds attain lower acquisition prices, which is supported by higher average gross
returns in each entry types, or (ii) simply the result of lower average deal sizes for European
transactions.
In summary, the major identified trend among entry types is an increased utilization of auctions,
which are characterized by shorter holding periods than other entry types as well as rapidly rising
average deal sizes. As exhibited in figure 67, auctions have historically involved some of the most
attractive buyout targets that generated high returns despite elevated purchase prices (average
weighted gross IRR of 86% for the period of 1990-1995). However, the amplified competition for
assets has markedly led to a constant deterioration of average gross IRR prices (30% for the period
of 1996-1999 and 1% for the period of 1996-1999), especially in the U.S. The rapid rise of average
invested capital between the 1996-1999 and 2000-2002 period, against the adverse development in
the return profile would suggest that buyout fund returns in the future will be depressed should the
buyout firm be unable to pursue proprietary deal flow opportunities.113
2,9 2,6
15,7
96,3
41,4
1,1
86%
30%
1%
0
20
40
60
80
100
1990-1995 1996-1999 2000-2002
Av
era
ge
In
ve
ste
d C
ap
ita
l ($
mm
)
Av
era
ge
Ho
ldin
g P
eri
od
(Y
ea
rs)
0%
20%
40%
60%
80%
100%
We
igh
ted
Av
era
ge
Gro
ss
IR
R (
%)
Avg. Invested Capital Avg. Holding Period Weighted Avg. IRR
Figure 67: Development of Weighted Average Gross Returns, Average Invested Capital and Average Holding Period of Buyout
Deals acquired via Auction
Source: INSEAD Buyout Database, analyzed by author (Deals N=37).
113 This trend should be considered with a cautious view on the lower sample size of 37 auctions in this
analysis.

Empirical Part I – Market and Financial Value Drivers 163
4.3.9.2. Leveraged Buyout Performance according to Exit Type
In the same way as seen in the above entry type performance categorization, there are also several
options available to the buyout fund to approach the exit of a buyout. In this case, though, a
decision has to be made by the buyout fund whether to employ a business broker (sell-side-
intermediary), to mandate investment bankers to initiate an auction or an initial public offering of
the company, or instead, to negotiate the sale of the portfolio exclusively and without external
advice.
2,9 3,4 3,9 4,32,7
4,5
34,2
29,1
14,9
32,8
20,3
7,8
-70%
-28%
134%130%
101%
63%
0
10
20
30
40
SELL-SIDE-
INTERMEDIARY
AUCTION IPO NEGOTIATED SALE UNREALISED BANKRUPTCY
Avera
ge I
nveste
d C
ap
ital
($ m
m)
Avera
ge H
old
ing
Peri
od
(Y
ears
)
-80%
-60%
-40%
-20%
0%
20%
40%
60%
80%
100%
120%
140%
Weig
hte
d A
vera
ge G
ross I
RR
(%
)
Average Holding Period Average Invested Capital Weighted Average IRR
Figure 68: Weighted Average Gross Returns of Buyout Deals by Exit Type, Average Invested Capital and Average Holding
Period
Source: INSEAD Buyout Database, analyzed by author (Deals N=700).
The findings on the performance of deals that were exited by either one of these options in the sub-
sample of this analysis are to some extent unanticipated. The highest weighted average gross IRR
of 134% was attained among deals that were sold with the help of a sell-side intermediary, closely
followed by an auction (130% average gross IRR) and the initial public offering (101% average
gross IRR). Markedly, all three categories have in common that external advice for the exit of the
buyout company is involved. By contrast, buyout exits that were self-negotiated by the buyout fund
only returned 63% of average gross IRR. This clear trend leads to the hypothesis that buyout firms
may be excellent investors, but poorer “salesmen” than would have been anticipated. However, the
clear trend of average holding period for these exit alternatives serves as an impending explanation
for this phenomenon. The shorter the holding period of the investment, the higher the average gross
return on the respective exit type. Intrinsically, this suggests that the relatively long average
holding period found for negotiated sales by the buyout fund may be a result of the fact that on
average, these companies are less successful buyouts that have not qualified for one of the more
attractive exit options earlier. To strengthen the assumption that these businesses may be less
attractive is the fact that external advisors, i.e. sell-side-intermediaries and investment bankers,

Empirical Part I – Market and Financial Value Drivers 164
constantly approach buyout funds with exit ideas and strategies. Assuming that these external
advisors thereby focus on the most attractive assets, it comes as no surprise that exactly these exit
types also dominate from a return perspective. From a managerial perspective, companies that are
approached directly by a buyout fund to negotiate a sale of a portfolio company may be advised to
act with caution and to intensely scrutinize the rationale for this transaction.
On the other hand, the choice of exit type by the sponsor also seems to be influenced by the size of
the portfolio company involved. Assuming that the invested capital at time of the acquisition is also
an indication of the size of the company at time of the exit, the largest portfolio companies are
disposed of through an initial public offering (US$ 32.8 million of invested capital), while medium-
size companies are exited through an auction (US$ 20.3 million of invested capital) and for the
smallest portfolio companies, a sell-side intermediary is employed to find a buyer. The average
deal size of negotiated exits is US$ 14.9 million, and may therefore be too small for an initial
public offering and auction. Given this evidence of a distinct return, holding period and average
deal size relationship profile, it can be concluded that buyout firms appear to be efficiently
optimizing their exit strategy with respect to highest achievable average IRR.
25,3
11,6
15,4
2,8 3,8 4,7 4,1
30,5
110%
94%
55%
82%
0
10
20
30
40
50
IPO NEGOTIATED SALE
Av
era
ge
In
ve
ste
d C
ap
ita
l ($
mm
)
Av
era
ge
Ho
ldin
g P
eri
od
(Y
ea
rs)
0%
20%
40%
60%
80%
100%
120%
We
igh
ted
Av
era
ge
Gro
ss
IR
R (
%)
EU Average Holding Period US Average Holding Period
EU Average Invested Capital US Average Invested Capital
EU Weighted Average Gross IRR US Weighted Average Gross IRR
Figure 69: Weighted Average Gross Returns of Buyout Deals by Exit Type, Average Invested Capital, Average Holding Period
and Region
Source: INSEAD Buyout Database, analyzed by author (Deals N=311).
However, the above observed facts appear to hold true for U.S. buyouts, but less so for European
deals. 114 As already monitored for the European private exit mode (see section 4.3.9.2.), the
114 Due to a too low sub-sample size for European sell-side intermediary and auction deals, only initial public
offerings and negotiated sales are compared here.

Empirical Part I – Market and Financial Value Drivers 165
negotiated sale in Europe appears to be substantially more successful from a return perspective than
in the U.S. (with 110% and 55% of average gross IRR for Europe and the U.S. respectively). On
the one hand, this better return is a result of a notably shorter holding period of 2.8 years in Europe
compared to 4.7 years for the U.S. Moreover, as alluded to in the exit mode discussion, the private
exit (and therefore also the negotiated sale) in Europe is more frequent due to the historically less
developed market for initial public offerings or auctions as an exit type.115 The short holding period
for negotiated deals in Europe may also be an indication of (i) better exit demand characteristics
through Pan-European consolidation, (ii) better ability of European buyout fund managers to
directly dispose of their portfolio companies, (iii) high average asset quality. Moreover, the
relatively greater unattractiveness of European initial public offerings as an exit type are exposed
by the one-year-longer average holding period for these investments (average of 3.8 years)
compared to negotiated deals (average of 2.8 years). The longer holding period could be a sign that
European companies struggle to exit through an IPO quickly, which potentially is enhanced
through regulatory obstacles, compliance issues with reporting requirements and/or less receptive
capital markets in the preparation phase of public market exits.
4.3.9.3. Regression Results
As reflected in the above trends, the entry and exit types of the focal buyout transaction appear to
affect the value creation potential, i.e. the performance of the dependent variable IRR. Among the
entry types, the least competitive entry type, negotiated sale, does appear to be the most profitable
one. By contrast, as an exit type, this route is not recommended to buyout firms. Auctions are a
preferred exit, but the trend towards increasing auction activity has led to a deterioration of returns.
These variables are now statistically tested with respect to their explanatory power of buyout
performance.
4.3.9.3.1. Descriptive Statistics
The entry type correlation statistics show that only the “auction” entry type variable is (positively
and) significantly correlated at the 0.05 level (2-tailed) with the dependent variable IRR. The
descriptive graphical results show that, on average, returns on buyouts that were entered via auction
performed worse. However, it was also established that (i) deals entered in European auctions are
significantly more profitable, (ii) the returns on auctioned deals had decreased substantially over
time, and (iii) there exists a high variance between realized and unrealized auction deal returns.
From a return perspective based on historical transactions, the performance of companies acquired
through this entry type is statistically proven still positive overall, which may support the theory
that the best assets are being auctioned. Despite this historical trend, the recent decline in auction
115 The statement should not imply that these markets are non-existent in Europe, as exemplified by several
large IPOs and auctions through buyout funds in recent years. Instead, the statement refers to the overall climate across the large majority of smaller deals in Europe, among which a public exit through (negotiated) trade sale is the most common exit type.

Empirical Part I – Market and Financial Value Drivers 166
deal performance, however, demonstrates that buyout funds may be advised to be highly
disciplined with respect to bidding in competitive auctions.
Descriptive and Correlation StatisticsVariable (Dummy) Tested
N(1) Minimum Maximum Sum(2) Mean Std. Deviation
Pearson Correlation
Sig. (2-tailed)
Entry Type
AUCTION 1746 0 1 16 ,01 ,095 ,051(*) 0,034
BUY-SIDE-INTERMEDIARY
1746 0 1 52 ,03 ,170 -0,008 0,746
NEGOTIATED SALE 1746 0 1 117 ,07 ,250 0,005 0,851
Exit Type
AUCTION 1746 0 1 9 ,01 ,072 0,014 0,566
BANKRUPTCY 1746 0 1 3 ,00 ,041 -0,035 0,149
SELL-SIDE-INTERMEDIARY
1746 0 1 4 ,00 ,048 0,014 0,563
NEGOTIATED SALE 1746 0 1 233 ,13 ,340 0,025 0,291
IPO 1746 0 1 99 ,06 ,231 ,098(**) 0
Valid N (listwise) 1746
(1) (1 Total sample size of tested cases (all realized transactions). Includes entry and exit types not specified. (2) Number of cases where dummy variable = 1, i.e. number of transactions per year. ** Correlation is significant at the 0.01 level (2-tailed). * Correlation is significant at the 0.05 level (2-tailed).
Table 29: Descriptive and Correlation Statistics on Entry and Exit Types
As previously observed for the exit mode, the exit type correlation statistics show that the IPO exit
type is strongly (positively and) significantly correlated at the 0.01 level (2-tailed), which
underlines the steadily higher potential for high returns achieved through this exit type. The results
do not prove statistical significance for the even stronger average returns found descriptively for
deals exited via a sell-side intermediary or through a competitive auction. It therefore cannot be
supported from the statistical findings to preferably follow these exit routes and buyout funds
should be advised to focus on the IPO exit route. With Pearson correlation significance of around
0.56 only, the presented findings for the two alternative exit routes may be ambiguous and are
sample driven, hence not statistically valid.
Coefficients(a)
Model Unstandardized Coefficients
Standardized Coefficients
t Sig. Collinearity Statistics
B Std. Error Beta Tolerance VIF
1 Entry Type
(Constant) ,805 ,047 17,062 ,000
AUCTION ,993 ,468 ,051 2,121 ,034 ,999 1,001
BUY-SIDE-INTERMEDIARY
-,073 ,263 -,007 -,277 ,782 ,997 1,003
NEGOTIATED SALE ,041 ,179 ,006 ,230 ,818 ,997 1,003
2 Exit Type
(Constant) ,741 ,050 14,932 ,000
AUCTION ,429 ,620 ,016 ,692 ,489 ,999 1,001
BANKRUPTCY -1,478 1,072 -,033 -1,379 ,168 1,000 1,000
SELL-SIDE-INTERMEDIARY
,612 ,929 ,016 ,659 ,510 ,999 1,001
IPO ,822 ,193 ,102 4,259 ,000 ,990 1,010
NEGOTIATED SALE ,194 ,131 ,035 1,475 ,140 ,989 1,011
(a) Dependent Variable: Gross IRR Performance
Table 30: Coefficients and Collinearity Statistics on Entry and Exit Modes

Empirical Part I – Market and Financial Value Drivers 167
The relatively high standardized coefficient Betas for auction and IPO underline the positive
performance impact of these entry and exit type variables. Astonishingly, the Beta coefficient for
the negotiated sale as exit type is higher than for sell-side intermediary or auction, which is in
contrast to the earlier findings. On average, therefore, buyout firms increase their returns more
likely through selling their portfolio companies without retaining external advisors. The
Collinearity statistics show very high tolerances (very modest variance inflation factors), hence
multicollinearity does not appear to be a problem among these variables in these bivariate model
context.
4.3.9.3.2. Regression Model
The linear regression model describing the explanatory strength of the entry type construct is very
weak, with an adjusted R square of only 0.1%. Also, the F value for the model’s fit is only 1.544
and not significant. Therefore, despite the significant entry type variable “auction”, the overall
contribution of the entry type variables under the bivariate model is negligible. Model 2
summarizes the bivariate regression model for the key three exit type variables (excluding
unrealized deals). Exit types generate an adjusted R square of 1.0%. The F value for the exit modes
is 4.408, and highly significant at the 0.01 level. Although the entry type model adds very limited
explanatory power, both constructs will be utilized with respect to the significant control variables
in subsequent regression models.
Linear Regression Model Summary Change Statistics Model R R Square Adjusted
R Square Std. Error
of the Estimate
R Square Change
F Change df1 df2 Sig. F Change
1 ,052(a) ,003 ,001 1,863136 ,003 1,544 3 1742 ,201
2 ,112(b) ,013 ,010 1,854971 ,013 4,408 5 1740 ,001
(a) Predictors: (Constant), NEGOTIATED SALE, AUCTION, BUY-SIDE-INTERMEDIARY (b) Predictors: (Constant), NEGOTIATED SALE, BANKRUPTCY, SELL-SIDE-INTERMEDIARY, AUCTION, IPO
Table 31: Linear Regression Model on Entry and Exit Type Dummy Variables
4.3.9.4. Summary of Findings
The analysis of entry and exit type variables revealed interesting from a practitioner point of view,
yet not statistically strong findings for the dynamics of value creation and buyout returns. The entry
type variable analysis has shown on an average return basis that the less competitive entry types
show high returns. However, based on realized transactions only and on statistical correlation tests,
the competitive auction counter-intuitively has historically been the entry type, which yielded
highest returns. This can be explained with the fact that (i) the most attractive assets from a value
creation or market position perspective are being auctioned, and (ii) auctioned deals also
demonstrate the shortest holding period and the quicker exit increases returns. The development of
recently declining returns for auctioned deals must be cautiously observed. Variable hypothesis
H11 must therefore be rejected. With respect to exit types, the IPO has maintained its position as
preferred exit route from a statistical validity perspective. Descriptive results had found that sell-

Empirical Part I – Market and Financial Value Drivers 168
side intermediaries and auctions generate equally higher returns. This can not be supported from
the regression tests, which directionally also show that negotiated sales by the buyout firm yield
better returns. Variable hypothesis H12 must therefore also be rejected. Overall, these results
therefore represent a mixed picture of what the preferred entry and exit type strategy is; the analysis
with respect to which entry and exit types drive value creation therefore remains subject to further
investigation in the future, preferably with even larger sample sizes.
4.3.10. Summary Tests
4.3.10.1. Test of Combined Entry and Exit Control Variables
The above sections in detail outlined the explanatory power of a range of entry and exit related
variables. The following regression model tests the combined contribution to explaining variation
in buyout performance. The combined explanatory power of all entry and exit type variables, i.e.
entry and exit years, entry and exit modes as well as entry and exit types, is highly significant.
Model 1 exhibits an adjusted R square for all entry and exit type control variables of 10.6%. The
model’s fit is described by an F value of 4.744, which is highly significant at the 0.001 level (2-
tailed). Consequently, we can argue that these control variables alone present a strong explanatory
basis for understanding value drivers in buyout performance and will be used in subsequent
analysis (regressions).
Linear Regression Model Summary Change Statistics Model R R Square Adjusted
R Square Std. Error
of the Estimate
R Square Change
F Change df1 df2 Sig. F Change
1 ,366(a) ,134 ,106 1,762889 ,134 4,744 55 1690 ,000
(a) Predictors: (Constant), NEGOTIATED SALE, BANKRUPTCY, ACQUISITION FINANCING, RECAPITALISATION, GROWTH CAPITAL, BANKRUPTCY, ACQUISITION, NEGOTIATED SALE, PRIVATE EXIT, AUCTION, BUY-SIDE-INTERMEDIARY, SELL-SIDE-INTERMEDIARY, PUBLIC EXIT, AUCTION, X1988, X1997, 1996, X1991, X1985, X1992, X1989, X1986, X2003, X1987, X1990, X1996, X2001, X2002, 1999, 1990, X1994, X1993, X1998, X2000, 1982, X1999, X1995, 1998, 2000, 1987, 1994, 1992, 2001, 1983, 1991, 1981, 1985, 1980, 1989, 1988, 1984, 1995, 1986, 1993, 1997
Table 32: Linear Regression Model on all combined Entry ad Exit Dummy Variables
The multivariate regression model on the combined control variables exhibits several changes to
significance levels of certain variables. Among entry years, the years 1980, 1981, 1987, 1999, 2000
and 2001 become significant (at either the 0.01 or 0.05 level). Moreover, the increase in deal
numbers per entry years the correlation with other entry and exit variables leads to high variance
inflation factors, although these remain below 10. The mean VIF is 4.914 for entry years; the
maximum is 9.275 for the entry year 1995. More drastically, all exit years from 1985 to 2000
become significant (at either the 0.01 or 0.05 level). This is most likely related to correlation with
exit type and exit mode variables. However, the collinearity tolerance remains high, with the mean
VIF reaching only 2.352. With respect to entry and exit mode/type dummy variables, acquisition,
buy-side intermediary, negotiated sales (entry), bankruptcy (mode) and public exit become
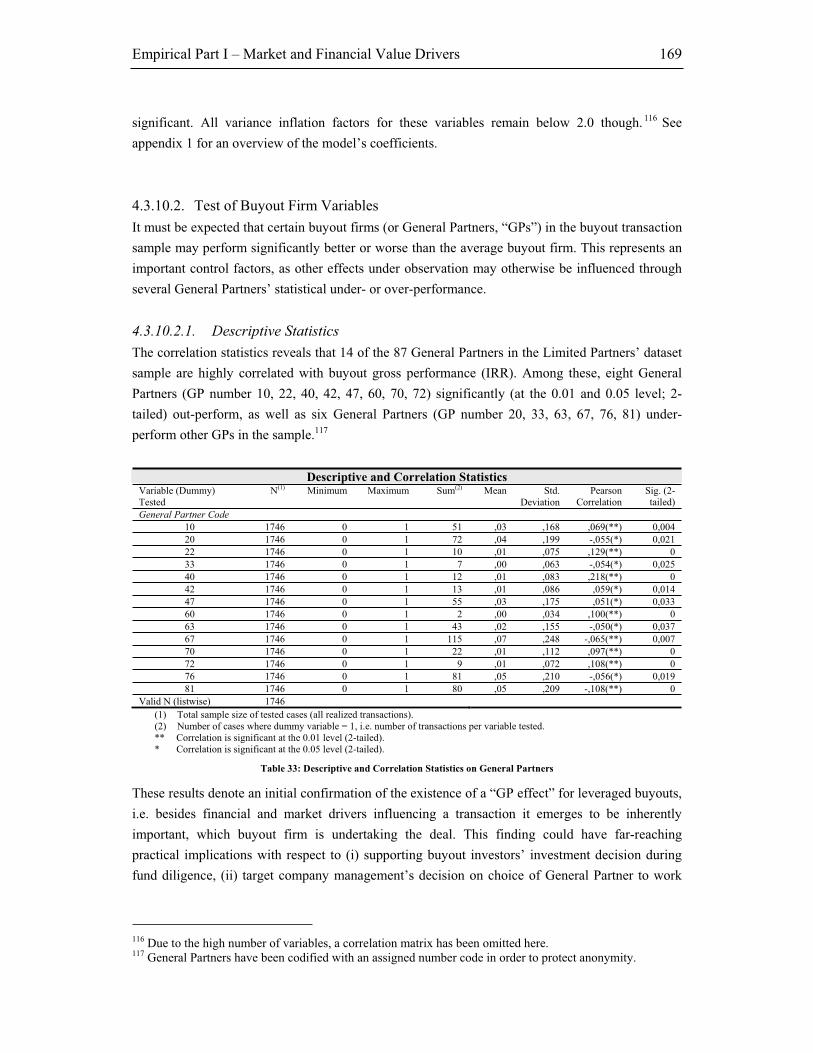
Empirical Part I – Market and Financial Value Drivers 169
significant. All variance inflation factors for these variables remain below 2.0 though. 116 See
appendix 1 for an overview of the model’s coefficients.
4.3.10.2. Test of Buyout Firm Variables
It must be expected that certain buyout firms (or General Partners, “GPs”) in the buyout transaction
sample may perform significantly better or worse than the average buyout firm. This represents an
important control factors, as other effects under observation may otherwise be influenced through
several General Partners’ statistical under- or over-performance.
4.3.10.2.1. Descriptive Statistics
The correlation statistics reveals that 14 of the 87 General Partners in the Limited Partners’ dataset
sample are highly correlated with buyout gross performance (IRR). Among these, eight General
Partners (GP number 10, 22, 40, 42, 47, 60, 70, 72) significantly (at the 0.01 and 0.05 level; 2-
tailed) out-perform, as well as six General Partners (GP number 20, 33, 63, 67, 76, 81) under-
perform other GPs in the sample.117
Descriptive and Correlation StatisticsVariable (Dummy) Tested
N(1) Minimum Maximum Sum(2) Mean Std. Deviation
Pearson Correlation
Sig. (2-tailed)
General Partner Code
10 1746 0 1 51 ,03 ,168 ,069(**) 0,004
20 1746 0 1 72 ,04 ,199 -,055(*) 0,021
22 1746 0 1 10 ,01 ,075 ,129(**) 0
33 1746 0 1 7 ,00 ,063 -,054(*) 0,025
40 1746 0 1 12 ,01 ,083 ,218(**) 0
42 1746 0 1 13 ,01 ,086 ,059(*) 0,014
47 1746 0 1 55 ,03 ,175 ,051(*) 0,033
60 1746 0 1 2 ,00 ,034 ,100(**) 0
63 1746 0 1 43 ,02 ,155 -,050(*) 0,037
67 1746 0 1 115 ,07 ,248 -,065(**) 0,007
70 1746 0 1 22 ,01 ,112 ,097(**) 0
72 1746 0 1 9 ,01 ,072 ,108(**) 0
76 1746 0 1 81 ,05 ,210 -,056(*) 0,019
81 1746 0 1 80 ,05 ,209 -,108(**) 0
Valid N (listwise) 1746
(1) Total sample size of tested cases (all realized transactions). (2) Number of cases where dummy variable = 1, i.e. number of transactions per variable tested. ** Correlation is significant at the 0.01 level (2-tailed). * Correlation is significant at the 0.05 level (2-tailed).
Table 33: Descriptive and Correlation Statistics on General Partners
These results denote an initial confirmation of the existence of a “GP effect” for leveraged buyouts,
i.e. besides financial and market drivers influencing a transaction it emerges to be inherently
important, which buyout firm is undertaking the deal. This finding could have far-reaching
practical implications with respect to (i) supporting buyout investors’ investment decision during
fund diligence, (ii) target company management’s decision on choice of General Partner to work
116 Due to the high number of variables, a correlation matrix has been omitted here. 117 General Partners have been codified with an assigned number code in order to protect anonymity.

Empirical Part I – Market and Financial Value Drivers 170
with in a contemplated buyout transaction. This study therefore endeavors to shed further light on
some of the potential explanations for the “GP effect” (see empirical chapters II and III).
The GP variable regression model’s standardized Beta coefficients demonstrate the extent of
“significant” performance of some of the General Partners under review: GP 40 carries the highest
standardized Beta with 0.237 and GP 81 the lowest standardized Beta with -0.052. The t-test shows
that several GPs become non-significant within the multivariate model’s context (GP numbers 20,
63, 76). These GPs all carry negative Beta coefficient, which is partially related to the lower
downside scale in the dependent variable IRR (i.e. maximum -100% loss) compared to the possible
“infinitely high” (i.e. higher than +100%) positive IRRs found for other GPs. As would be
expected for separately operating General Partner firms, collinearity is no issue among them.
Coefficients(a)
Model Unstandardized Coefficients
Standardized Coefficients
t Sig. Collinearity Statistics
B Std. Error Beta Tolerance VIF
1 General Partner Code
10 1,191 ,294 ,108 4,045 ,000 ,714 1,401
20 -,043 ,263 -,005 -,162 ,871 ,641 1,559
22 3,628 ,577 ,147 6,288 ,000 ,925 1,081
33 -1,125 ,681 -,038 -1,652 ,099 ,946 1,057
40 5,345 ,531 ,237 10,069 ,000 ,912 1,097
42 1,722 ,512 ,079 3,362 ,001 ,905 1,105
47 ,981 ,287 ,092 3,421 ,001 ,698 1,432
60 5,939 1,248 ,108 4,759 ,000 ,984 1,016
63 -,132 ,313 -,011 -,422 ,673 ,746 1,340
70 2,046 ,407 ,122 5,025 ,000 ,850 1,176
72 3,251 ,606 ,125 5,367 ,000 ,932 1,073
76 -,022 ,254 -,003 -,088 ,930 ,615 1,625
81 -,465 ,255 -,052 -1,825 ,068 ,618 1,618
(a) Dependent Variable: Gross IRR Performance
Table 34: Coefficients and Collinearity Statistics on General Partners
4.3.10.2.2. Regression Model
The linear regression model regression model describing the explanatory strength of the General
Partners’ firm dummy variables is very strong, with an adjusted R square of 11.9%. The F value for
the model’s fit is 4.014 and highly significant (p<.001). It is therefore particularly important to
control for the performance of significantly (positively or negatively) performing individual buyout
firms. These findings and the strength of the regression model on General Partner performance
therefore provide evidence towards a theory for a “GP effect” on performance in leveraged buyout
transactions, which will be developed further in the course of this study.
Linear Regression Model Summary Change Statistics Model R R Square Adjusted
R Square Std. Error
of the Estimate
R Square Change
F Change df1 df2 Sig. F Change
1 ,398(a) ,158 ,119 1,749868 ,158 4,014 78 1667 ,000
(a) Predictors: (Constant), 9, 66, 85, 74, 60, 36, 32, 71, 41, 39, 77, 61, 31, 2, 44, 78, 43, 33, 16, 12, 1, 52, 4, 27, 26, 72, 69, 59, 86, 84, 22, 18, 34, 3, 28, 53, 5, 40, 83, 8, 42, 73, 51, 50, 46, 79, 54, 48, 21, 82, 68, 6, 75, 65, 49, 19, 15, 7, 70, 58, 64, 29, 55, 25, 13, 38, 63, 56, 10, 47, 45, 80, 57, 20, 81, 76, 17, 24
Table 35: Linear Regression Model on General Partners

Empirical Part I – Market and Financial Value Drivers 171
4.3.10.3. Test of Combined Entry, Exit and GP Firm Variables
The broad analysis of the various variables affecting buyout performance in this chapter has
demonstrated the extent of market, acquisition and GP firm related factors influencing the
dependent variable IRR. The below nested multivariate regression models summarize this initial
analysis: model 1 carries all significant variables found in the analysis of entry and exit type, mode,
and years, significant industries (based on categorization Level 4), the significant investment
holding period variable as well as deal size (“Initial investment USD”). The model posts an
adjusted R square of 22.8%, with a strong F value for the model’s fit of 10.351 and is highly
significant at the 0.001 level (2-tailed). This relatively small set of significant variables therefore
explains over one fifth of the variance of leveraged buyouts in the Limited Partners’ primary
sample.
Linear Regression Model Summary Change Statistics Model R R Square Adjusted
R Square Std. Error
of the Estimate
R Square Change
F Value Change
df1 df2 Sig. F Change
1 ,502(a) ,252 ,228 1,159134 ,252 10,351 18 552 ,000
2 ,518(b) ,268 ,241 1,149040 ,016 5,870 2 550 ,003
3 ,631(c) ,398 ,304 1,100756 ,130 1,865 57 493 ,000
(a) Predictors: (Constant), 1984, 1998, 1999, X2001, X1987, X1988, X1989, ACQUISITION, PUBLIC EXIT, AUCTION, BANKRUPTCY, LESUR, SFTCS, INFOH, ENGEN, TELCM, Initial Investment USD, Holding Period
(b) Predictors: (Constant), as above, plus Market Performance, Industry Performance (c) Predictors: (Constant), as above, plus all GPs
Table 36: Linear Regression Model on Deal Size Variables
In order to put the significance of the so far identified value drivers into perspective, Model 2
introduces the control variables for each transaction’s comparable industry and equity market index
performance, which will be further discussed in the next sections of this chapter. The adjusted R
square improves only slightly to 24.1%, the change in F value is 5.870 and significant at the 0.01
level (2-tailed). Although the impact of public market performance and its financials will be
discussed in more detail in the following sections, it can already be noted at this stage that the
impact of public markets is marginal compared to the so far examined control variables. Model 3
introduces all GP variables. The adjusted R square rises to 30.4%, while the F value improves by
1.865 and is highly significant at the 0.001 level (2-tailed). The strong rise in adjusted R square
provides clear evidence of a “GP effect” in leveraged buyouts, i.e. that particular buyout firms are
performing substantially better or worse, and that this effect may be more significant than some
market related drivers. Variable hypothesis H13, which argued for a strict application of efficient
market theory to buyout investments, i.e. no buyout firm could outperform the market on a
continuous basis, therefore has to be rejected. The following sections will further test the influence
of market and financial drivers. The empirical part II will subsequently take a closer look at GP
firms and their team profiles and empirical part III will analyze various buyout strategies these
General Partners undertake, in order to establish what may explain this observed diversity in
performance.

Empirical Part I – Market and Financial Value Drivers 172
4.3.11. Summary of Test Results
The initial tests of leveraged buyout deal performance in this section have demonstrated the extent
of explanatory power of market, acquisition, and GP firm related control variables in explaining
variance in buyout performance and in identifying value drivers. It was established that the year a
buyout target has been acquired and exited may impact the buyout’s performance, as it indicates
general market and economic conditions. No final conclusion could be drawn with respect to a
country specific dominance of buyout returns, as several European countries descriptively
outperform, but the U.S./Canada statistically appear to provide for better returns. The industry in
which a buyout target is acquired is equally important, and several surprising findings when
compared to the Venture Economics control dataset could be found: the information technology
sector, and especially the software development segment, has been a successful area of investment
of buyout funds. Among the more traditional sectors, the service sector, particularly the non-
cyclical segment, as well as the financial service sector as a whole, have been recognized as a
source of strong buyout returns. The analysis of amount of capital invested showed that small
investments perform best, which may hint at successful co-investment activity of some buyout
funds. This theory received further support from the analysis of the size of ownership stake
acquired in a buyout, as besides the strong performance of the “full control” acquisitions also
minority investments performed exceptionally well. Large and mega-deals also performed
surprisingly well in the reviewed Limited Partners’ dataset. The holding period of a buyout
transaction demonstrated a clear adverse relationship with buyout performance. The optimal exit
time for buyouts has been established within the first two years, as subsequently the marginal value
creation potential at the target diminishes and does not justify to hold on to the investment for the
buyout firm.
The analysis of entry and exit mode and type variables did not proof to be strong from a statistical
point of view point, but offered valuable insights into the investment behavior of funds. The
outright acquisition has been identified as most rewarding entry mode, but also the less risky
recapitalization provided solid returns. The exit mode IPO was statistically significant, but
surprisingly, the private exit route appears to be the better alternative for Europe. A transaction
should be entered and exited with the least and highest competitive environment respectively in
general. Nevertheless, deals entered by auction historically proofed to be considerably more
successful than would have been anticipated by market observers. It was theorized that this could
be in relation to the comparatively higher quality of assets that enter auction processes, which are
most likely characterized as (i) larger businesses, (ii) with more value creation potential, (iii) that
are being exited faster, and hence provide superior returns to compensate for higher acquisition
prices through the auction process. Nevertheless, it was also found that the increase in auction
activity leads to a deterioration of returns. Finally, the General Partner firm undertaking the buyout
has statistically been verified as a potential significant source of value creation. This evidence is
seen as motivation to study the GP firm in more depth in the empirical chapters II and III.
Empirical Part I – Market and Financial Value Drivers 173
4.4. Leveraged Buyout Deal vs. Public Market & Industry
Financial Performance
4.4.1. Test Setting
The guiding test question for this chapter and especially for this section had been stated as follows:
Do Private Equity Funds, especially LBO Funds, as well as individual LBO
transactions create value, i.e. do they provide (market-adjusted) abnormal
returns for investors? If so, how does this performance compare to performance
of public market indices in the exact same industries over the exact same time
horizon?
The first and second section of the empirical test of market and financial drivers of value creation
has focused mainly on entry and exit conditions of the focal buyout transaction, as well as general
factors such as holding time, invested capital or industry classification. The latter factor will be
further developed in this test section, as the distinct industry classification of the Limited Partners
sample allows a sharp comparison between actual deal performance and the comparable public
market index over the exact same time horizon as the buyout firm held its investment. This analysis
therefore seeks to shed light on the actual “real value creation”, or excess performance of the focal
LBO over public markets. In addition, the aggregation of results across the large Limited Partners
sample allows drawing conclusions across industries and time. The value creation that is made
explicit is necessarily the result of better operating and financial performance, leverage and
strategic decisions, driven by the acquiring buyout firm. The financial performance will be further
scrutinized in this section by setting it in relation to industry development, and examined on the
buyout level in the next and final test section in this chapter. In summary, the main tests in this
section include:
- Value Creation compared to Industry Classifications
- Value Creation compared to Equity Markets
- Value Creation Performance Indices
- Value Creation and Industry Financial Performance Conditions
Descriptive graphical results on the primary Limited Partners sample will be presented. In addition,
the section features an extensive statistical evaluation of the observed trends with (nested)
multivariate regression models. The test section ends with a combined regression among all public
market and industry financial drivers in order to illustrate the combined explanatory power of these
variables.

Empirical Part I – Market and Financial Value Drivers 174
4.4.1.1. Variables and Hypotheses
Results of in-depth studies on performance of Private Equity as an investment asset class as well as
returns to investors has produced mixed results so far. Kaplan and Schoar (2003) find no significant
out-performance of Private Equity, with average returns net of fees approximately equal the S&P
500 performance over their sample period. Jones and Rhodes-Kropf (2003) use the same data set,
but focus in their paper on the pricing of idiosyncratic risk. Their results are qualitatively similar
for venture funds and slightly better for buyout funds. However, Ljungqvist and Richardson (2003)
study the returns on investments in 73 venture and buyout funds by one Limited Partner in funds
raised from 1981 to 1993 and find that the funds in their sample – 54 buyout funds and 19 Venture
Capital funds – outperform the equity market in the order of five plus per cent per annum. In
summary, results for buyout funds have been more ambiguous than those for venture funds, mainly
due to the more or less questionable general assumption that equity betas of buyout portfolio
companies are roughly equal to one. The focus in all of these studies, however, is on net (fund)
returns to investors (i.e. after fees) in order to create a benchmark for investment decisions. By
comparison, the Limited Partners’ dataset in this study provides performance information on the
individual deal level and is based on gross returns in order to compare actual underlying
performance between the focal investment and public equity markets. In the following, several
testable guiding hypotheses for the above outlined tests are developed, which are based on (i) initial
findings from the control group, (ii) literature findings, and (iii) industry expert interviews.
Assuming that Private Equity investors have strong incentives to choose investments that result in a
high gross internal rate of return (IRR) to provide for (ii) superior fund returns (compared to the
industry) in order to remain competitive, i.e. attract more capital in subsequent fundraising efforts,
and (ii) considerable personal compensation (through co-investment and participation through
carried interest), it is expected that
H14.) Gross returns on individual buyout transactions undertaken by General Partners are
significantly higher than in comparable public companies within the same industry
over the holding period of the buyout target firm.
Ljungqvist and Richardson (2003) and Gottschalg, Phalippou et al. (2003) show that Private Equity
investors demand a liquidity premium over public market indices for holding an illiquid investment
trough their fund commitment. As a consequence, buyout firms are not only required to ensure that
their investment(s) outperform(s) their respective industry index, which could at times be in a
cyclical downturn, but on average also to generate returns in excess of overall equity markets plus a
liquidity premium. It is therefore expected that
H15.) Gross returns on individual buyout transactions undertaken by General Partners are
significantly higher than the applicable broader equity market performance over the
holding period of the buyout target firm.
In addition, one of the key characteristics of Private Equity as an investment asset class is the low
correlation with public market returns, which is beneficial to diversification strategies in asset

Empirical Part I – Market and Financial Value Drivers 175
management. Bance (2002) provides an overview of correlation studies and finds that correlation
between Private Equity and equity and bond markets is low. It is therefore expected for the Limited
Partners sample that
H16.) Gross returns on individual buyout transactions undertaken by General Partners have a
low correlation with their respective industry indices’ performance.
Section 4.3.4. has demonstrated that buyout returns may be significantly explained by the industry
in which they are being undertaken. This leads to the assumption that the industry’s overall
financial performance over the time of the buyout is exceptionally well. Following the financial
value drivers of IRR, as developed in section 3.5.4., industry performance must therefore be
analyzed with respect to sales growth, margin expansion, multiple expansion and cash flow
generation, which benefits the de-leverage effect of the business, over the time of the investment.
The practical difficulty is that industry performance is only generated for year-end as an average of
all underlying industry players. It is therefore recommended to focus the observation of industry
financial performance on the fiscal entry and exit years of the transaction, and to infer from past
and expected performance at those times, what industry financial conditions were. It is therefore
expected that
H17.) Gross buyout deal performance is higher for transactions undertaken when (a) the
industry’s revenue growth prospects were high and (b) exited when the industry’s
revenue growth prospects were low.
H18.) Gross buyout deal performance is higher for transactions undertaken when (a) the
industry’s margin expansion prospects were high and (b) exited when the industry’s
margin expansion prospects were low.
H19.) Gross buyout deal performance is higher for transactions undertaken when (a) the
industry’s trading multiple expansion prospects were high and (b) exited when the
industry’s trading multiples had reached a peak.
H20.) Gross buyout deal performance is higher for transactions undertaken when (a) the
industry’s cash flow generation and de-leverage prospects were high.
4.4.1.2. Methodology and Data
Following a similar approach as Ljungqvist and Richardson (2003), the author is measuring relative
performance of LBO investments and LBO funds using excess IRRs, i.e. the difference between an
investment’s (or fund’s, respectively) IRR and the return on the public equity market. Due to the
fact that exact deal entry and exit dates are available, the relevant public equity market performance
can also be determined and aggregated on the fund level, receiving a precise investment-based fund
level IRR. In doing so, the author follows earlier studies, in which equity betas of buyout portfolio
companies are assumed to be equal to one (average market risk). This approach therefore discounts

Empirical Part I – Market and Financial Value Drivers 176
the impact of a higher leverage factor and does not make adjustments for its effect on risk and
performance.118
In order to determine whether leveraged buyouts create value at any given time and within any
given industry, their performance must be benchmarked against other companies and/or public
market indices. The industry classification of LBO transactions in this study has intentionally been
chosen from data provider Thomson Financial Datastream. There are detailed industry public
market indices available, generally reaching back into the early 1970s or whenever an industry was
“born”, e.g. in the high tech sector (see industry classification overview in section 3.6.5.). 119
Furthermore, Datastream also provides complete financial accounting data for the majority of the
industries it follows, which are based on the major publicly traded companies in that particular
sector. This unique dataset allows for far-reaching benchmarking opportunities of buyout deals as
(i) each buyout transaction’s performance can be compared to the public market performance of
highly similar companies, (ii) the impact of industry financial performance on the performance of
the buyout target can be analyzed, and (iii) a potential financial accounting benchmarking between
buyout target and the industry would allow for an evaluation of the impact of key financial value
drivers in each transactions, i.e. whether the buyout target performed better or worse than the
industry.120 The focus of tests in this section will be on the analysis of the buyout target’s main
industry financial developments – revenue growth, EBITDA (margin) growth, trading multiple
growth and change in financial (de)leverage – and their impact as value drivers for buyout
transactions.
4.4.2. LBO Value Creation by Industry Sector
A sub-sample of 637 realized buyout transactions, for which industry classifications were available,
has been analyzed with respect to the development of average gross IRR according to the major ten
industries. Furthermore, the respective public market performance in the industry sector for the
exact same time period (i.e. from acquisition date of the buyout target to exit) has been generated
from Datastream. Effectively, a comparison is made of whether the buyout firm should have
invested equity in the buyout target or simply should have bought into the comparable public
market index. The difference between average gross IRR per industry sector and average public
stock market performance per sector represents excess performance, or leveraged buyout driven
value creation beyond (or below) industry performance.
118 For a more in-depth discussion and approaches to measure risk in buyout funds, see Ljungqvist and
Richardson (2003), Kaplan and Schoar (2003), Jones and Rhodes-Kropf (2003). This literature shows that there is no consensus on estimating risk for buyout funds yet, but that CAPM-Betas are not significantly different from average market risk.
119 Several other frequently used security data provider such as Dow Jones, MSCI, S&P, MSDW, etc. could either not provide the necessary detail with respect to industry classification and/or time.
120 This comparison requires a sufficient set of financial accounting information for a sample of buyouts, which is specifically difficult to obtain. See section 4.5. of this study for an initial analysis.

Empirical Part I – Market and Financial Value Drivers 177
The results clearly point to significantly superior average value creation among buyout companies
compared to publicly traded companies. The average public industry index performance of all
realized buyouts (between 1980 and 2002) across all industries was 17%. The average LBO value
creation beyond public markets was calculated as 57%, hence the average gross IRR of all buyouts
was 74% in this sub-sample. However, the degree of value creation differs considerably between
industries. The strong average public market performance in the information technology industry of
37% was topped by an additional 102% of value creation among companies acquired through
buyout funds. Potentially more surprising, the financial services sector public markets on average
returned 22%, but an additional 96% of value was generated among the sample’s buyout targets. In
some industries, however, the value creation potential appears to be substantially lower, such as in
the resources (14% of public market, and 13% of additional value creation) and utilities (11% of
public market, and 18% of additional value creation) sectors. This underlines earlier findings that
the overall value creation potential in these often highly regulated commodity-type businesses is
very limited.
0%
20%
40%
60%
80%
100%
120%
140%
INFO
RM
ATION T
ECHNOLO
GY
FINAN
CIA
LS
NON-C
YCLI
CAL.
SERVIC
ES
GEN
ERAL
INDUSTR
IALS
NON-C
YCLI
CAL
CONSU
MER
GOODS
CYC
LICAL
SERVIC
ES
CYC
LICAL
CONSU
MER
GOODS
BASIC
INDUSTR
IES
UTIL
ITIE
S
RESO
URCES
Av
era
ge
Gro
ss
IR
R (
%)
Av
era
ge
In
du
str
y In
de
x R
etu
rn (
%)
Average Industry Performance LBO Value Creation beyond Industry Performance
Average LBO Value Creation
above Industry Performance = 57%
Average Industry Performance = 17%
Figure 70: Realized LBO Deals’ Value Creation vs. Industry Indices (Level 3)
Source: INSEAD Buyout Database, analyzed by author (Deal N=637).
By examining the more detailed Level 4 industry classification, it can be observed which individual
industries in the above indicated main industry segments are (or are not) creating superior value.121
Markedly, the aerospace and defense sector only returned 3% on public markets over the average
121 The Level 4 sub-sample consists of n=562 buyouts, which are n=75 less than on Level 3. The reason for
the lower sample is that (i) some companies could not be further specified according to more detailed industry sectors from the information obtained, (ii) several Level 4 sub-sectors have been omitted due to insufficient sample size. The minimum sample size is five, maximum 44 and mean is 22 buyouts per Level 4 industry sub-sector.

Empirical Part I – Market and Financial Value Drivers 178
time of the buyout transactions, while an extra 150% could be generated through buyout firms.
Despite a generally high deal flow in the buyout market in the retail sector, very low value was
generated in the Limited Partners sample relative to other industry sub-sectors. Fore example,
general retail returned 16% on public markets, while buyout firms could add another 12%. More
significantly, food and drug retailers returned a higher 23% on public markets, but value was
destroyed by an average -8% for transactions carried out by buyout firms in this sector. The low
value creation in the retail sector could potentially be linked to the extremely competitive character
and margin pressure in this sector.
-20%
0%
20%
40%
60%
80%
100%
120%
140%
160%
AERO
SPACE &
DEFEN
CE
SPEC
IALI
TY & O
THER
FIN
ANCE
INFO
RM
ATION T
ECHNO
LOGY &
HARDW
ARE
SOFTW
ARE &
CO
MPUTE
RSER
VICES
TELE
CO
M S
ERVIC
ES
ENGIN
EER
ING
&M
ACHIN
ERY
MED
IA &
ENTER
TAINM
ENT
BEVER
AGES
FOOD P
RO
DUCER
/PRO
CES
SORS
ELECTR
ONIC
&ELE
CTR
ICAL
EQUIP
MEN
T
HEALT
H
CO
NSTR
UCTIO
N& B
UIL
DIN
G M
ATERIA
LS
DIV
ERSIF
IED IN
DUSTR
IALS
SUPPO
RT S
ERVIC
ES
AUTO
& P
ARTS
HO
USEH
OLD
GOO
DS
& T
EXTIL
ES
TRAN
SPO
RT
CHEM
ICALS
STEEL & O
THER
META
LS
PERSO
NAL
CAR
E & H
OUSEH
OLD
APPLIC
ATIONS
PHAR
MACEU
TICALS
&BIO
TECHNO
LOGY
LEIS
URE
+HOTELS
OIL
& G
AS
RETAIL
, GEN
ERAL
FOOD &
DRUG R
ETAILER
S
INSU
RANCE
Av
era
ge
Gro
ss
IR
R (
%)
Av
era
ge
In
du
str
y In
de
x R
etu
rn (
%)
Average Industry Performance LBO Value Creation beyond Industry Performance
Average LBO Value Creation
above Industry Performance = 56%
Average Industry
Performance = 15%
Value Destruction = -12%
Figure 71: Realized LBO Deals’ Value Creation vs. Industry Indices (Level 4)
Source: INSEAD Buyout Database, analyzed by author (Deal N=562).
4.4.2.1. LBO Value Creation by Industry Sector and Region
The amount of value created in certain industries generally only differs slightly when comparing
U.S. and European transactions, except for two sectors. The average value creation in the
information technology sector in the U.S. is considerably higher with 136% compared to 76% in
Europe, which is in contrast to the higher underlying average European stock market performance
in this sector with 43% compared to 29% in the U.S. More drastically, value creation among non-
cyclical service firms in Europe is only 51%, less than half of the 115% of value generated by
buyout firms on top of the stock market return in the U.S.

Empirical Part I – Market and Financial Value Drivers 179
0%
20%
40%
60%
80%
100%
120%
140%
INFORMATION
TECHNOLOGY
NON-CYCLICAL
SERVICES
GENERAL
INDUSTRIALS
CYCLICAL
CONSUMER
GOODS
NON-CYCLICAL
CONSUMER
GOODS
CYCLICAL
SERVICES
BASIC
INDUSTRIES
Av
era
ge
Gro
ss
IR
R (
%)
Av
era
ge
In
du
str
y In
de
x R
etu
rn (
%)
US Average Industry Performance US LBO Value Creation beyond Industry Performance
European Average Industry Performance European LBO Value Creation beyond Industry Performance
Figure 72: Realized LBO Deals’ Value Creation vs. Industry Indices (Level 3) for selected Industries by Region
Source: INSEAD Buyout Database, analyzed by author (Deal N=545).
4.4.2.2. LBO vs. Equity Market Performance (by Industry)
Benchmarking LBO transactions against the broader equity markets allows for a direct comparison
of the performance of the buyout (Private Equity) investment asset class. Equally to the comparison
to specific industry indices, buyout transactions are benchmarked against the S&P 500 Composite
price index for U.S. transactions, against the MSCI Europe price index for European buyouts and
against the MSCI World price index for non-U.S. and non-European deals. The results, when
aggregated by industry sector show a similar albeit slightly higher average LBO value creation as
under the industry benchmarking. This is due to the fact that the average stock market performance
is considerably lower than the average of industry indices of certain industries. Nevertheless,
buyout firms appear to be able to generate significantly higher returns than can be achieved from
investment in the public equity market. Hence, by constructing a portfolio of companies that is
similar to the composition of the public market index, a Private Equity investor on average will
receive a 67% higher return than the 15% earned on public markets, based on this sample of
Limited Partners’ data.

Empirical Part I – Market and Financial Value Drivers 180
0%
20%
40%
60%
80%
100%
120%
140%
INFO
RM
ATION T
ECHNO
LOGY
NO
N-C
YCLI
CAL
SER
VICES
FINANCIA
LS
BASIC
INDUSTR
IES
GEN
ERAL
INDUSTR
IALS
NO
N-C
YCLI
CAL
CONSU
MER G
OODS
CYCLI
CAL
SER
VIC
ES
CYCLI
CAL
CONSU
MER
GO
ODS
RESO
URCES
UTIL
ITIE
S
Av
era
ge
Gro
ss
IR
R (
%)
Av
era
ge
Eq
uit
y M
ark
et
Re
turn
(%
)
Average Gross IRR
Average Equity Market Performance (S&P 500, MSCI Europe)
LBO Value Creation beyond Equity Market Performance
Average LBO Value Creation = 67%
Average Equity Market Performance = 15%
Figure 73: Realized LBO Deals’ Value Creation Index vs. Equity Market Performance (S&P 500, MSCI Europe/World)
grouped by Deal’s Industry Classification
Source: INSEAD Buyout Database, analyzed by author (Deal N=872).
These comparisons suggest that the risk of a buyout portfolio and a pubic market firm portfolio is
the same. However, the literature on Private Equity investments is divided on the risk profile with
which buyout investments need to be assessed. Risk and volatility in Venture Capital is
acknowledged to be considerably higher than both market and buyout risk. The evaluation of risk
for Venture Capital and buyout funds in not consensual: CAPM-betas for venture (buyout) funds
are estimated to be 1.8 (0.7) by Jones and Rhodes-Kropf (2003), 1.1 (1.1) by Ljungqvist and
Richardson (2003), and 1.7 (0.5) by Kaplan and Schoar (2003). It is also generally assumed that the
CAPM holds and that betas on assets are the same within each industry (Gottschalg, Phalippou et
al. 2003).122 As a consequence of the still divided opinions in the field of finance, this study does
not seek to explore the risk characteristics of buyout funds in greater depth and treats buyout
investments to be in line with market risk (Beta of 1.0). Furthermore, no risk-related adjustments
are being made for individual industries, as on average, the Limited Partners sample should
represent the overall market. Despite this assumption, it is acknowledged though that the strong
performance of several industries, e.g. of the information technology sector, may be driven to some
extent by above market risk (see section 4.2.2.5. for a general return vs. risk analysis). Under these
assumptions, the out-performance of a portfolio of buyout investments over public markets
highlights the superior value creation capabilities and corporate governance effectiveness of buyout
firms over their publicly traded peers.
122 As assets are not traded continuously, the CAPM does not hold, in theory, in the context of Private Equity
investments.

Empirical Part I – Market and Financial Value Drivers 181
4.4.3. A Buyout Performance Index over Time
The large amount of buyout transactions, which is similar in nature to a market portfolio as it is
captured across all industries over a prolonged time period from the Limited Partners’ data, allows
for an indexation of the underlying transactions according to deal (entry or exit) year. This resulting
index, if further developed, could eventually serve as an useful benchmarking tool for buyout deals
at any given time, employed by both buyout firms and their investors during fundraising due
diligence. Any value creation presented by a buyout firm on a fund or portfolio company basis
could instantly be brought into context with the overall trend in the portfolio’s underlying
industries. The need for an effective benchmarking index has especially been postulated by Private
Equity industry experts and academia for some time (Loos, Gottschalg et al. 2004). There are
generally two perspectives to construct an LBO Performance index, either by year of acquisition or
year of exit of the transaction. Both viewpoints are valuable as they offer aggregated insights into
the entry or exit conditions for buyout transactions at any given time. Probably the more important
among the two alternatives, the entry date index allows drawing conclusions of whether external
conditions at the time of entry could have been determining the value creation potential of the
buyout target.
4.4.3.1. The Buyout Performance Entry Date Index
The depiction of a buyout performance index according to entry date as shown in figure 74 allows
for several interpretations, when comparing index performance to underlying economic climate.
-40%
-20%
0%
20%
40%
60%
80%
100%
120%
140%
160%
180%
1988 1989 1990 1991 1992 1993 1994 1995 1996 1997 1998 1999 2000
Av
era
ge
Gro
ss
IR
R (
%)
Av
era
ge
In
du
str
y In
dic
es
Re
turn
(%
)
Average Gross IRR
Average Industry Indices Performance
LBO Value Creation beyond Industry Performance
Figure 74: Realized LBO Deals’ Value Creation Index vs. Industry Indices Performance (Level 6) by Buyout Acquisition Year
Source: INSEAD Buyout Database, analyzed by author (Deal N=486).

Empirical Part I – Market and Financial Value Drivers 182
Buyout transactions that were entered in 1988 and 1989 resulted in average LBO value creation of
68%, despite lower and volatile average stock market returns of 13% and 11% respectively. The
crash of the high yield bond market between 1989 and 1991 led to a substantially worse financing
environment for buyout transactions. Partially as a result of this trend, average value creation
dropped to 23% for deals entered in 1991.
As one of the important initial observations from the illustration, the anti-cyclical return
characteristics nature of the buyout (Private Equity) investment asset class becomes evident for the
years 1992 and 1993. These were characterized by difficult external economic conditions through a
looming global recession. As a result, buyout firms were able to acquire assets at very attractive
valuations and consequently average excess value creation beyond comparable industry indices
soared to 46% for buyout transactions that were entered in 1993. From 1995 onwards, the
information technology boom led to vast value creation opportunities for buyout funds, especially
due to highly favorable stock market (exit) conditions, which increased the gap between public
market and buyout returns. With average stock market returns ranging between 20% and 25%,
average LBO value creation peaked for deals entered in 1999 at 159%. This peak return in 1999,
however, must be considered in relation to the nature of the sample, which only consists of realized
deals. As a consequence, most realized deals that were entered in 1999 were also successfully
exited within a very short time frame, i.e. most likely before the markets crashed in 2000.
1,41,7
2,1
2,6
2,9
3,7
4,3
3,8
4,4
5,4
5,95,95,6
0%
20%
40%
60%
80%
100%
120%
140%
160%
1988 1989 1990 1991 1992 1993 1994 1995 1996 1997 1998 1999 2000
Av
era
ge
Gro
ss
IR
R (
%)
-
1,0
2,0
3,0
4,0
5,0
6,0
7,0
Av
era
ge
Ho
ldin
g P
eri
od
(Y
ea
rs)
LBO Value Creation beyond Industry Performance Average Holding Period
Figure 75: Realized LBO Deals’ Value Creation Index vs. Average Holding Period of Deals by Buyout Acquisition Year
Source: INSEAD Buyout Database, analyzed by author (Deal N=486).
Accordingly, an index based on entry date of realized acquisitions will ultimately have a profile in
which average holding periods are decreasing. From this perspective, it appears as if the average
holding time of all investments had decreased consistently, which is not necessarily true. Therefore,
in order to determine actual holding periods per year, it is more useful to analyze an index based on

Empirical Part I – Market and Financial Value Drivers 183
exited buyout transactions (see further below). Another finding from the entry date buyout
performance index is that it may be trailing public markets by up to 12 months: while the average
public market return had decreased to -28% in 2000, average realized gross buyout performance
was still positive, even though considerably lower than at its 1999 peak, at an IRR of 61%.
Moreover, the above discussed effect of anti-cyclical acquisition activity (“bargain shopping”) by
buyout firms may also lessen the extent of the buyout index’s retraction.
-40%
-20%
0%
20%
40%
60%
80%
100%
120%
140%
160%
1988 1989 1990 1991 1992 1993 1994 1995 1996 1997 1998 1999 2000
Av
era
ge
Gro
ss
IR
R (
%)
Av
era
ge
In
du
str
y C
AG
R (
%)
Average Industry Revenue CAGR Average Industry EBITDA CAGR
LBO Value Creation beyond Industry Performance Average Industry Multiple Expansion CAGR
Figure 76: Realized LBO Deals’ Value Creation Index vs. Average Industry Performance Driver CAGRs by Acquisition Year
Source: INSEAD Buyout Database, analyzed by author (Deal N=486).
Another consideration in the analysis of the buyout performance index is the development of
economic drivers of value creation, i.e. the average target industries’ financial development, which
can be uncovered under the entry date perspective. The timing of the acquisition will directly
determine whether the buyout will be subject to a positive or negative industry growth climate over
its holding time, measured by the CAGR of industry financial performance metrics from entry to
exit year of the focal buyout. The question of how much each buyout’s value creation process is
affected from these external factors remains. For instance, the interpretation of results in figure 76
show that deals that were entered in 1991 will – on average – not see multiples expand over the
holding period of the deal, they will, however, see margins and revenues grow slightly, which on a
net basis will not result in strong value creation. By contrast, deals acquired in 1993 will see strong
revenue and margin growth until exit, which according to the average holding period of 3.8 years
should be in 1997. The results in the graph also reveal that the strong value creation increase from
1996 to 1999 is mainly driven by (i) actual strong underlying average revenue growth prospects in
the various industry sectors at the time of acquisition, (ii) considerable increases in trading
multiples and therefore valuation prospects through the stock market boom. Interestingly, the

Empirical Part I – Market and Financial Value Drivers 184
valuations reached in 1998 do not suggest further trading multiple expansion, while prospects for
amplified revenue growth came to an end in 1999, one year earlier than the actual stock market
decline.
4.4.3.2. The Buyout Performance Exit Date Index
The exit date buyout index allows for an ex-post analysis of deal performance. In contrast to the
entry date buyout index, which highlighted the acquisition environment and its influence on the
value creation potential at the target, the exit date buyout performance index creates the link
between timing of the exit and its external environment. The results are to a large extent
counterintuitive when weighed against entry conditions.
-20%
0%
20%
40%
60%
80%
100%
120%
1991 1992 1993 1994 1995 1996 1997 1998 1999 2000 2001 2002
Av
era
ge
Gro
ss
IR
R (
%)
Av
era
ge
In
du
str
y In
dic
es
Re
turn
(%
)
Average Gross IRR
Average Industry Indices Performance
LBO Value Creation beyond Industry Performance
Figure 77: Realized LBO Deals’ Value Creation Index vs. Industry Indices Performance (Level 6) by Buyout Exit Year
Source: INSEAD Buyout Database, analyzed by author.
In 1993, deals that were exited had seen their comparable public market industry indices rise on
average by 23% p.a. over the holding period of the deal. Despite this sign of a reviving stock
market in 1993, the average gross IRR and LBO value creation was relatively low with 51% and
28% respectively. Consequently, the year 1993 was very favorable from an entry perspective, but
not for exits. What were the reasons? First, the average holding period of 3.2 years for deals in
1993 actually was shorter than in other years (see figure 79), and therefore did not adversely affect
returns through a longer holding period. Nevertheless, the average financial industry performance
(see figure 78) reveals that deals exited in 1993 had been exposed to three of the most difficult
economic years between 1991 and 1993, during which industry financial performance and trading
valuations had been affected by decline.

Empirical Part I – Market and Financial Value Drivers 185
The average holding period grew to 3.5 years in 1994, which indicates that several buyout firms
may have postponed their exit decision to await a stronger revival in the stock markets.
Remarkably, the year 1994 showed the highest average value creation from exited deals with 103%
compared to a public market return of only 6%. This could be interpreted in such a way that buyout
investors had bought assets very cheaply during the years from 1990 to 1993 (the steeply falling
valuation levels can be observed in figure 78). In 1994, economic conditions improved
substantially as exhibited by strong average revenue and profit margin growth, and hence the
“turnaround” of those cheaply acquired buyout investments could be completed.
-40%
-20%
0%
20%
40%
60%
80%
100%
120%
1991 1992 1993 1994 1995 1996 1997 1998 1999 2000 2001 2002
Av
era
ge
Gro
ss
IR
R (
%)
Av
era
ge
In
du
str
y C
AG
R (
%)
Average Industry Revenue CAGR Average Industry EBITDA CAGR
LBO Value Creation beyond Industry Performance Average Industry Multiple Expansion CAGR
Figure 78: Realized LBO Deals’ Value Creation Index vs. Average Industry Performance Driver CAGRs by Buyout Exit Year
Source: INSEAD Buyout Database, analyzed by author.
Moreover, although the technology boom years from 1997 to 1999 had been the most successful
from a value creation perspective according to the entry date buyout index, the extent of value
creation is relatively smaller from an exit date perspective. Value creation in 1999 reached 72% on
the back of a strong average CAGR in the industries’ drastic multiple expansions of 39%. The
value creation of 69% maintained in 2000, however, was largely driven by the strong underlying
average CAGR in the industry’s revenue growth that averaged 40% (considerably influenced
through technology driven revenue growth). At the same time, the declining markets in 2000 had
already reduced average industry valuations. The massive extent of the collapse in average industry
revenue growth and operating profitability becomes visible in 2001, which is accompanied by the
decline in LBO value creation.

Empirical Part I – Market and Financial Value Drivers 186
2,3
3,5
3,23,5 3,4
3,9 3,9
3,63,4
3,8
4,8
5,4
0%
20%
40%
60%
80%
100%
120%
140%
160%
1991 1992 1993 1994 1995 1996 1997 1998 1999 2000 2001 2002
Av
era
ge
Gro
ss
IR
R (
%)
-
1,0
2,0
3,0
4,0
5,0
6,0
Av
era
ge
Ho
ldin
g P
eri
od
(Y
ea
rs)
LBO Value Creation beyond Industry Performance Average Holding Period
Figure 79: Realized LBO Deals’ Value Creation Index vs. Average Holding Period of Deals by Buyout Exit Year
Source: INSEAD Buyout Database, analyzed by author.
Another significant finding becomes transparent when examining the average holding period of
buyout transactions from an exit year perspective, i.e. how long did buyout firms keep their buyout
target company in their portfolio before divestment. Despite volatile economic conditions between
1992 and 1995, average holding periods were low, ranging between 3.2 and 3.5 years, suggesting
that exit routes were still open to buyout firms. The average holding periods in 1996 and 1997
under the exit date perspective was 3.9 years each and must therefore relate to transactions acquired
in 1992 and 1993. Apparently, it took buyout firms on average slightly more time to turn around
these recession-time investments, potentially because of the quality of acquired assets.123
Average holding periods continued to decline between 1996 and 1999, reaching 3.4 years. This
trend was clearly stimulated by the favorable exit opportunities brought about through the booming
equity markets, i.e. buyout firms sought to take advantage by exiting their investments as long as
the market environment was advantageous. From 2000 to 2002, a sweeping increase in average
holding periods for buyout deals to 5.4 years can be observed. This trend is a direct consequence of
the almost completely shut IPO exit market as well as low M&A activity during this time124. Due to
123 Conversely, the expected average holding periods for these years from an entry date perspective had been
4.4 and 5.4 years. The difference relates to the different sample distribution of the entry and exit date indices. As mentioned above, the entry date perspective is less useful, as its ex-ante nature is skewed towards an apparent decrease in holding periods, which is not based on fundamental actual holding periods. It is rather a result of the fact that most private purchasing memoranda, from which the Limited Partner data had been extracted, were published between 2000 and 2003, and hence the time-induced frontier for realized deals leads to a decrease in average holding periods. The buyout exit date index better reflects average holding period reality.
124 M&A activity is seen as a tentative indicator for openness of the public exit route here. The public exit markets were essentially closed – even more so when compared to the private exit (M&A) markets, in which corporate managers and shareholders focused on profitability and balance sheet management, instead of engaging in additional risky M&A activity.

Empirical Part I – Market and Financial Value Drivers 187
the substantially longer average holding periods observed among these deals, average gross returns
were equally adversely affected.
4.4.4. LBO Value Creation, Equity Market Return and Correlation
One of the key aspects for a Private Equity investor during the decision-making process of a buyout
fund investment – besides risk and return – relates to the evaluation of correlation of buyout funds
with public markets and the investor’s portfolio. In general, introducing Private Equity into a
balanced portfolio of assets can further improve overall diversification (Bance 2002). Although the
extent of correlation of returns between Private Equity and public market classes is widely debated,
the results presented in the table below, based partly on unrealized gains, do indicate a lower
correlation. As a result, adding Private Equity to a balanced portfolio can reduce volatility and
contribute to an overall improvement in risk profile. This would allow higher targeted returns for
the same level of calculated risk, or a reduction to the level of risk in the portfolio whilst preserving
the target rate of return (Bance 2002).
Equity Markets (%) Bond Markets (%)
Long-term Short-term Long-term Short-term
European Private Equity
Quarterly125 0.16 0.42 - - 0.24
Venture Economics
Annual126 0.48 to 0.63 0.27 to 0.51 -0.06 to -0.23 -0.36 to -0.48
Quarterly127 0.31 to 0.37 0.41 to 0.47 -0.07 to -0.14 -0.20 to -0.23
Other Sources
Annual128 -0.46 - -0.47 -
Table 37: Overview of Correlation Tests between Private Equity and Market Returns
Source: Bance (2002).
One key problem with correlation studies between Private Equity returns and public markets is that
comparable industry indices lack the sufficient level of detail. The comparison is frequently made
on a macro level between overall stock markets (as measured by MSCI or S&P indices) and Private
Equity fund returns. By contrast, the Limited Partners’ dataset in this study, which has been
classified on the transaction level, can be directly linked to the industry specific public market
index and therefore more direct comparison with its underlying industry dynamics.
125 Long-term horizon 22 years; short-term horizon 10 years. Source: Venture Economics, MSCI, JP Morgan. 126 Long-term horizon 28 years; short-term horizon 16 years. Correlation ranges for large and small cap
stocks; Treasury bills and bonds and corporate bonds. Source: Venture Economics, Ibbotson Associates. 127 Long-term horizon 24 years, short-term horizon 14 years. Correlation ranges for large and small cap
stocks; Treasury bills and bonds and corporate bonds. Source: Venture Economics, Ibbotson Associates. 128 Long-term horizon 20 years. Source: Venture Economics, Ibbotson Associates, Wilshire, Salomon, MSCI.

Empirical Part I – Market and Financial Value Drivers 188
4.4.4.1. Regression Analysis
A statistical test on a sub-sample of 523 realized buyout deals on the most detailed Datastream
Level 6 industry classification reveals a low, but significant correlation between IRR of the focal
transaction and the comparable industry performance over the same time period, as shown in the
following correlation matrix.
Correlations
Buyout IRR Industry Performance
Buyout IRR Pearson Correlation 1
Sig. (2-tailed) .
N 523
Industry Performance Pearson Correlation ,125(**) 1
Sig. (2-tailed) ,004 .
N 523 523
** Correlation is significant at the 0.01 level (2-tailed).
Table 38: Correlation Table on Buyout Correlation with Industry Performance
The Pearson correlation between the buyout’s IRR and the industry’s performance is 0.125 and
significant at the 0.01 level. Contrary to the findings of (Bance 2002), the correlation of the
Limited Partners sample is at the low end of the spectrum. This is surprising, as it would have been
expected that through a closer comparison of buyout performance and industry sharp public market
benchmarks, a higher correlation could be observed.
Model Summary
Change Statistics
Model R R Square
Adjusted
R Square
Std. Error
of the
Estimate
R Square Change
F Change df1 df2 Sig. F Change
1 ,125(a) ,016 ,014 1,34784 ,016 8,253 1 521 ,004
a Predictors: (Constant), Industry Performance.
Table 39: Linear Regression Model on Buyout Correlation with Industry Performance
As a consequence of the relatively low correlation, the regression model’s R square remains low
with 1.4%. The model’s fit is high with 8.253 and significant at the 0.01 level. Nevertheless,
although the analysis on the Limited Partners’ data demonstrates that buyout performance is
influenced by industry performance, the extent is very minor. The result therefore substantiates that
buyout investments perform independent to public markets and the investment asset class can
contribute favorably to asset portfolio diversification.
4.4.4.2. Additional Descriptive Findings
As a consequence of the low but significant correlation between buyout investments and public
markets, it is not surprising to find a general descriptive graphical relationship between LBO value
creation on the one side, as well as industry and general equity markets on the other side. The

Empirical Part I – Market and Financial Value Drivers 189
following graph mirrors the rise in the S&P 500 composite price index between January 1, 1988
and December 31, 2000, as well as the average LBO value creation entry date index, as described
in section 4.4.3.1.
-20%
0%
20%
40%
60%
80%
100%
120%
140%
160%
180%
1988 1989 1990 1991 1992 1993 1994 1995 1996 1997 1998 1999 2000
Av
era
ge
Gro
ss
IR
R (
%)
Av
era
ge
In
du
str
y In
dic
es
an
d P
ub
lic
Ma
rke
t R
etu
rn (
%)
-
100
200
300
400
500
600
700
Average Gross IRR Average Industry Indices Performance
LBO Value Creation beyond Industry Performance S&P 500 Composite Price Index (Base 01.01.1988)
Figure 80: Realized LBO Deals’ Value Creation Index vs. Average Industry Indices Performance (Level 6) and S&P 500
Composite Price Index by Buyout Acquisition Year
Source: INSEAD Buyout Database, analyzed by author.
A general correlation between indexed equity market returns and indexed average gross IRR of
buyout transactions can be observed. The decline in stock markets in 1990 as a result of the gulf
war and in 2000 following the end of the technology boom, as well as the technology-driven rise in
stock markets between 1995 and 1999 is similarly followed by the LBO entry index performance.
4.4.5. Statistical Tests
The key finding from the above sections with respect to identifying drivers of value creation of
buyout transactions was that the impact of the respective target industry’s financial performance
and trading levels play a fundamental role. Through systematical analysis of the financial entry and
exit conditions of buyouts in any given industry at any given time, it should be possible to identify
industry conditions that are supportive of successful buyout transactions. First, this statistical
section will therefore shed light on the financial conditions in the buyout’s entry and exit (fiscal)
year, and more specifically, up to two years before and afterwards. The backward and forward
looking aspect provides additional valuable information, i.e. what the recent industry financial
history of each transaction looked like and what the prospects with respect to financial performance

Empirical Part I – Market and Financial Value Drivers 190
developments were. Secondly, these findings – in conjunction with control variables developed in
prior sections – will be utilized to explain industry out-performance and the underlying external
financial value creation mechanisms.
4.4.5.1. Financial Industry Conditions at Deal Entry
The correlation statistics for the industry financial conditions at the time of the acquisition of the
buyout target reveal significant findings, which support the motivations for buyout managers to
enter into a particular target company in a specific industry at that particular time.
4.4.5.1.1. Descriptive Statistics
First, the bivariate correlation matrix reveals that the industry financial performance, either one
year (n-1) or two years (n-2) before the acquisition date (n), measured by the compounded annual
growth rate (CAGR) of sales and margin, does not have a significant effect on buyouts. In other
words, there generally is no significant sales and margin growth in an industry prior to the General
Partner’s buyout target acquisition. However, from a forward looking perspective, we find highly
significant (at the 0.01 level; 2-tailed) sales growth for both, one year (n+1) and two years (n+2)
post acquisition, in the buyout target’s industry. Hence, we can conclude that the General Partner
on average has developed a capability to enter a buyout company exactly at a point in time, when
its respective industry is at the beginning of a cyclical upturn. We further pinpoint this exact deal
timing proficiency of the General Partner with the fact that in case he would buy into an industry
after the upturn had started, the backward looking sales CAGR (e.g. n-1) would be more
significantly correlated. Instead, this latter variable is highly insignificant. In addition, we also find
that industry profitability, measured as margin CAGR two years post acquisition (n+2) is on the a
cyclical upswing as well. The margin CAGR (n+2) is highly significant at the 0.01 level.
Consequently, it can be theorized that buyout funds on average are investing into companies, who
are expected to grow and increase profitability significantly two years after the acquisition, which
points to buyout fund’s ability to take advantage of industry cycles.
Secondly, no significant effect with respect to the industry’s valuation, measured by the trading
multiple Enterprise Value/EBITDA (EV/EBITDA), can be established. It could have been assumed
that asset valuations at the time of entry of the General Partner are fairly moderate. However, the
significance level for this variable is approaching the 0.1 significance level (0.137), which means
that the target valuation is definitely not likely to be under-priced. In other words, not only the
buyout firm is aware of the cyclical upturn of a particular industry, but sellers are as well. Asset
prices – assuming efficient markets – have to some extent priced in this positive outlook already.
Thirdly, no significant correlation for the industry’s profitability at time of entry, measured by the
industry’s average EBITDA margin, is found in the Pearson correlation context. However, in the
below regression model context, the variable becomes significant. This finding would indicate that
buyouts perform better when the target’s industry EBITDA margin is high. It may be assumed that

Empirical Part I – Market and Financial Value Drivers 191
on average, a high industry EBITDA also contributes positively to operating cash flows at the
target, which in turn supports quick de-leverage of the acquisition debt. This would also be in line
with the hypothesis that buyout firms prefer cash generative businesses. Nevertheless, a high
EBITDA margin must not (necessarily) be understood in such a way that the industry is at a
profitability peak (as underlined by the positive and significant margin growth prospects).
Descriptive StatisticsVariable (Dummy) Tested
N(1) Minimum Maximum Sum(2) Mean Std. Deviation
Pearson Correlation
Sig. (2-tailed)
Entry Conditions
EBITDA Margin Entry Date_Ind
694 -,025 697,313 1376,992 1,984 34,135 ,003 ,944
EV/EBITDA at Entry Date_Ind
725 -7,613 154,971 7613,815 10,502 10,735 ,055 ,137
Sales CAGR n-2 666 -,453 4,519 75,894 ,114 ,318 ,004 ,911
Sales CAGR n-1 666 -,589 23,153 117,788 ,177 1,064 ,015 ,708
Sales CAGR n+1 667 -,589 5,118 90,692 ,136 ,396 ,125(**) ,001
Sales CAGR n+2 667 -,713 3,780 83,059 ,125 ,261 ,101(**) ,009
Margin CAGR n-2 660 -,320 1,124 16,144 ,0245 ,144 ,010 ,799
Margin CAGR n-1 665 -,594 3,262 23,798 ,036 ,254 ,041 ,291
Margin CAGR n+1 666 -,770 3,142 16,261 ,024 ,235 ,002 ,951
Margin CAGR n+2 666 -,534 3,378 16,966 ,025 ,204 ,104(**) ,007
Valid N (listwise) 660
(1) Total sample size of tested cases (all realized transactions). (2) Number of cases where dummy variable = 1, i.e. number of transactions per year. ** Correlation is significant at the 0.01 level (2-tailed). * Correlation is significant at the 0.05 level (2-tailed).
Table 40: Descriptive Statistics on Industry Financial Entry Conditions
There is a range of significant inter-correlations of forward and backward looking variables.
Backward (forward) looking sales are significantly (at the 0.01 level) correlated with backward
(forward) looking margins. Moreover, margins and sales are also correlated among each other
across time. In summary, the inter-correlations are not surprising due to the fact that an industry’s
sales growth and margin levels may differ slightly according to economic cycles, but practically
vary in pre-defined ranges over time.
The interpretation of the regression model’s coefficients demonstrates the above mentioned high
and positive standardized coefficient Beta for the EBITDA margin at entry date (0.116 in model 1)
verifies that an attractive EBITDA margin – on average for any industry – is significantly
contributing to deal performance. Also, high industry sales growth in the year after the buyout is an
important contributor to performance. In model 1, the trading multiple EV/EBITDA becomes
significant at the 0.1 level, indicating that rising valuations in an industry is positive for buyout
deals. This finding is to some extent counter-intuitive, as higher valuations generally lead to higher
acquisition prices. However, it could be argued that higher valued firms generally also provide
above average growth prospects and cash flows, so the acquisition is rather a question of a
favorable price. Collinearity statistics show very high tolerances (i.e. very modest variance
inflation factors), hence multicollinearity is fully under control in these nested models. In summary,
the results underline that these variables for industry financial conditions at the time of entry into
an acquisition do have explanatory power with respect to variance in buyout returns.

Empirical Part I – Market and Financial Value Drivers 192
Coefficients(a)
Model Unstandardized Coefficients
Standardized Coefficients
t Sig. Collinearity Statistics
B Std. Error Beta Tolerance VIF
Entry Conditions
1 (Constant) ,351 ,127 2,766 ,006
EBITDA Margin Entry Date_Ind 1,964 ,655 ,116 2,999 ,003 ,998 1,002
EV/EBITDA at Entry Date_Ind ,008 ,005 ,070 1,808 ,071 ,998 1,002
2 (Constant) ,377 ,131 2,888 ,004
EBITDA Margin Entry Date_Ind 1,686 ,683 ,100 2,467 ,014 ,908 1,101
EV/EBITDA at Entry Date_Ind ,006 ,006 ,053 1,106 ,269 ,646 1,548
Sales CAGR n-2 -,111 ,185 -,029 -,600 ,549 ,632 1,583
Sales CAGR n-1 ,027 ,054 ,024 ,499 ,618 ,644 1,552
Sales CAGR n+1 ,330 ,154 ,109 2,139 ,033 ,575 1,738
Sales CAGR n+2 -,020 ,254 -,004 -,079 ,937 ,490 2,040
Margin CAGR n-2 -,212 ,433 -,025 -,488 ,625 ,556 1,797
Margin CAGR n-1 ,057 ,262 ,012 ,217 ,828 ,499 2,005
Margin CAGR n+1 -,284 ,241 -,055 -1,181 ,238 ,674 1,485
Margin CAGR n+2 ,591 ,303 ,100 1,953 ,051 ,566 1,766
(a) Dependent Variable: Gross IRR Performance Note: “n” depicts entry deal year.
Table 41: Coefficients and Collinearity Statistics on Entry Condition Variables
4.4.5.1.2. Regression Models
The multivariate regression models describing the explanatory strength of the industry financial
conditions around the deal entry year are significant. Model 1, based on industry valuation and
profitability predictors at entry, exhibits an adjusted R square of 1.5%. The F value for the model’s
fit is 5.903 and is highly significant (p<.01). Model 2 introduces the sales and EBITDA growth
variables prior and after the focal deal and the adjusted R square rises to 2.4%. The model’s F
change significance is valid at the 0.1 level, while the standalone model’s (i.e. non-change model)
significance is highly significant at the 0.01 level.
Linear Regression Model Summary Change Statistics Model R R Square Adjusted
R Square Std. Error
of the Estimate
R Square Change
F Value Change
df1 df2 Sig. F Change
1 ,133(a) ,018 ,015 1,199909 ,018 5,903 2 657 ,003
2 ,197(b) ,039 ,024 1,194266 ,021 1,778 8 649 ,078
(a) Predictors: (Constant), EV/EBITDA at Entry Date_Ind, EBITDA Margin Entry Date_Ind (b) Predictors: (Constant), EV/EBITDA at Entry Date_Ind, EBITDA Margin Entry Date_Ind, Sales CAGR n-1, Sales CAGR n+1,
Sales CAGR n+2, Sales CAGR n-2, Margin CAGR n+1, Margin CAGR n-1, Margin CAGR n-2, Margin CAGR n+2
Table 42: Linear Regression Model on Entry Condition Variables
In summary, the results can be considered as an important contribution to understanding the way
General Partners utilize industry financial information to substantiate their respective deal
decisions at the time of entry into a leveraged buyout. Specifically, industry profitability has been
identified as an important value driver of buyout transactions.
4.4.5.2. Financial Industry Conditions at Deal Exit
The correlation statistics for the industry financial conditions at the time of exit from the buyout
target reveal further significant and intuitive findings, which further verify the theory developed in
Empirical Part I – Market and Financial Value Drivers 193
the above section that buyout investment managers are educated investors who time their
acquisitions wisely.
4.4.5.2.1. Descriptive Statistics
First, we find the opposite development of sales and margin growth, when compared to entry
conditions. Both the sales CAGR, measured from two years (x-2) before the exit, as well as margin
CAGR for one and two years before the exit are positively and highly significantly (at the 0.01
level) correlated with acquisition performance. In other words, at the time of exit, the industry (and
assumingly equally the target company) had grown its sales and its profitability over the last two
years. This substantiates and complements the finding that General Partner do benefit from the
positive prospects they encountered when entering the buyout target (see entry conditions) through
higher buyout performance. A topic for further investigation would therefore be whether the
General Partner is able to demonstrate an ability to create superior “financial” value at the buyout
target, i.e. beyond industry driven financial growth. If this would be the case, this could be
understood as additional evidence for positive acceptance of a “GP effect” to value creation in
buyouts (compare section 4.5.).
Secondly, it is noteworthy to briefly interpret the non-significant correlations with performance at
the exact time of exit. In line with the entry conditions, EBITDA margin at exit shows a non-
significant Pearson correlation to buyout performance. However, likewise to the entry conditions
the variable’s coefficient becomes significant in the regression context (see below). Similarly, the
industry’s trading multiple at the time of the exit is equally not significantly correlated, although
directionally approaching the 0.1 significance level. In other words, a high asset valuation level in
an industry does not significantly support buyout performance. This could be interpreted in such a
way that (i) buyout firms are less dependent on favorable exit conditions than assumed, or more
likely (ii) the different trading levels observed across the various industries make a comparison
obsolete. 129 Thirdly, it is not surprising that the correlation table reveals highly positive and
significant correlations between acquisition performance as well as industry CAGRs on the
variables sales, EBITDA and trading multiples over the holding time of the investment: an increase
in each variable has a direct impact on the valuation of the business at exit.130 Notably, the
valuation impact of the EBITDA CAGR appears to be highest. Accordingly, buyout funds should
incorporate this finding in their analysis of appropriate target industries for investment, i.e. the
industry should demonstrate room for an increase in average profitability. As observed for the entry
condition analysis, similar significant inter-correlation effects between industry financial variables,
both between sales and margin variables (backward and forward looking), as well as within the
same variable (sales or margin) across time.
129 It must be considered that different industries are examined here. Naturally, these industries are trading at
different multiple ranges. Hence, from a statistical point of view buyout performance on a relative industry basis is less likely to be dependent on exit valuation multiples.
130 Refer to the deduction of the IRR formula in section 3.5.4. for details.

Empirical Part I – Market and Financial Value Drivers 194
Descriptive StatisticsVariable (Dummy) Tested
N(1) Minimum Maximum Sum(2) Mean Std. Deviation
Pearson Correlation
Sig. (2-tailed)
Exit Conditions
EBITDA Margin Exit Date_Ind
695 ,000 1636,979 1820,195 2,619 62,124 ,008 ,832
EV/EBITDA at Exit Date_Ind
726 ,706 71,297 8927,697 12,297 10,283 ,055 ,139
Sales CAGR Industry 679 -,713 5,118 87,457 ,129 ,276 ,091(*) ,018
EBITDA Margin CAGR Industry
674 -,770 3,142 22,505 ,033 ,184 ,127(**) ,001
Multiple Expansion CAGR Industry
704 -,780 1,557 40,596 ,0577 ,189 ,095(*) ,012
Deleverage Industry 728 -20,874 ,780 -273,947 -,376 1,804 ,058 ,115
Sales CAGR x-2 653 -,713 1,994 88,305 ,135 ,209 ,114(**) ,004
Sales CAGR x-1 653 -,917 5,118 120,190 ,184 ,453 ,012 ,765
Sales CAGR x+1 654 -1,000 82,867 176,605 ,270 3,282 ,007 ,849
Sales CAGR x+2 654 -1,000 2,578 74,421 ,114 ,206 -,046 ,241
Margin CAGR x-2 629 -,478 ,990 26,068 ,041 ,177 ,122(**) ,002
Margin CAGR x-1 629 -,770 3,142 63,922 ,102 ,521 ,116(**) ,004
Margin CAGR x+1 629 -,864 3,142 9,797 ,016 ,283 ,053 ,187
Margin CAGR x+2 626 -,686 3,378 51,153 ,082 ,555 ,067 ,092
Valid N (listwise) 611
(3) Total sample size of tested cases (all realized transactions). (4) Number of cases where dummy variable = 1, i.e. number of transactions per year. ** Correlation is significant at the 0.01 level (2-tailed). * Correlation is significant at the 0.05 level (2-tailed).
Table 43: Descriptive Statistics on Industry Financial Exit Conditions
In summary, as long as the industry financial performance has been positive prior to exit, a good
exit price/valuation appears attainable in different environments. On the other hand, the data
indirectly suggests that the General Partner is timing its portfolio company disposal wisely: the
forward looking sales and EBITDA CAGR variables at the time of the divestment do not indicate
that the sponsor is selling when any additional high growth is expected (contrary to entry
conditions). Therefore, is can be assumed that the sponsor may not consider holding the asset any
longer, because growth prospects have become rather mediocre, or are potentially already
worsening (e.g. cyclical down-swing). Consequently, it could be theorized that buyout funds on
average are making highly efficient decisions with respects to entry and exit timing in leveraged
buyouts.
The high and positive standardized coefficient Beta for the EBITDA margin at exit date underlines
that an attractive EBITDA margin – on average for any industry – is significantly contributing to
deal performance. Other coefficients are not significant in the deal exit context. Collinearity
statistics show very high tolerances (i.e. very modest variance inflation factors), except for Model
2, where the introduction of the sales and margin CAGR one and two years prior (x-1, x-2) and
after (x+1, x+2) the exit leads to small multicollinearity effects, e.g. with the industry EBITDA
margin at exit date. Several variables, especially to the more sensitive margins, have been removed.
Consequently, the maximum VIF remains below 2.0 and thus is under control in these nested
models.

Empirical Part I – Market and Financial Value Drivers 195
Coefficients(a)
Model Unstandardized Coefficients
Standardized Coefficients
t Sig. Collinearity Statistics
B Std. Error Beta Tolerance VIF
Exit Conditions
1 (Constant) ,350 ,110 3,180 ,002
EBITDA Margin Exit Date_Ind 1,887 ,452 ,166 4,173 ,000 ,998 1,002
EV/EBITDA at Exit Date_Ind ,007 ,005 ,053 1,326 ,185 ,998 1,002
2 (Constant) ,380 ,112 3,401 ,001
EBITDA Margin Exit Date_Ind 1,651 ,464 ,146 3,559 ,000 ,941 1,062
EV/EBITDA at Exit Date_Ind ,003 ,006 ,022 ,543 ,588 ,922 1,084
Sales CAGR x-2 ,832 ,311 ,138 2,676 ,008 ,591 1,692
Sales CAGR x-1 -,315 ,154 -,104 -2,048 ,041 ,609 1,642
Sales CAGR x+1 -,002 ,085 -,001 -,029 ,977 ,978 1,023
Margin CAGR x+1 ,215 ,175 ,051 1,223 ,222 ,907 1,103
3 (Constant) ,362 ,112 3,243 ,001
EBITDA margin Exit Date_Ind 1,893 ,475 ,167 3,983 ,000 ,890 1,123
EV/EBITDA at Exit Date_Ind -,001 ,006 -,008 -,190 ,850 ,827 1,209
Sales CAGR x-2 ,702 ,316 ,117 2,225 ,026 ,570 1,753
Sales CAGR x-1 -,271 ,155 -,090 -1,754 ,080 ,599 1,670
Sales CAGR x+1 -,052 ,088 -,024 -,591 ,555 ,914 1,095
Margin CAGR x+1 ,221 ,175 ,053 1,266 ,206 ,906 1,103
Multiple Expansion CAGR Industry
,630 ,287 ,098 2,196 ,028 ,779 1,284
4 (Constant) ,430 ,116 3,708 ,000
EV/EBITDA at Exit Date_Ind -,002 ,006 -,018 -,405 ,686 ,818 1,222
EBITDA margin Exit Date_Ind 1,814 ,475 ,160 3,816 ,000 ,885 1,130
Sales CAGR x+1 -,059 ,087 -,028 -,680 ,497 ,912 1,097
Sales CAGR x-1 -,246 ,155 -,081 -1,592 ,112 ,595 1,680
Margin CAGR x+1 ,196 ,175 ,047 1,122 ,263 ,902 1,109
Sales CAGR x-2 ,691 ,315 ,115 2,195 ,029 ,570 1,754
Multiple Expansion CAGR Industry
,650 ,286 ,101 2,271 ,024 ,778 1,285
Deleverage Industry ,263 ,124 ,085 2,110 ,035 ,966 1,035
(a) Dependent Variable: Gross IRR Performance Note: “x” depicts deal exit year.
Table 44: Coefficients and Collinearity Statistics on Exit Condition Variables
4.4.5.2.2. Regression Model
The multivariate regression models describing the explanatory strength of the industry financial
conditions around the deal’s exit year are significant. Model 1, which summarizes the state of
industry valuations and industry profitability at exit, exhibits an adjusted R square of 2.8%. The F
value for the model’s fit is high with 9.859 and is highly significant (p<.001). Model 2 introduces
the sales and margin growth variables measured as one/two years prior and post-exit and the
adjusted R square increases to 3.5%. The model’s F change is low at 2.170 and only significant at
the 0.1 level. Models 3 and 4 introduce the industry’s multiple expansion growth variable and the
industry’s deleverage variable, as an indicator for cash flow generation, measured over the period
of investment of the focal deal, which leads to a further increase in R square to 4.2% and 4.7%
respectively, while both model’s improvement is significant at the 0.05 level.
Due to very strong collinearity, sales and margin growth over the investment period had been
excluded. Considering each model individually as standalone model (i.e. non-change model), each
sample of predictors is highly significant at the 0.001 level. In summary, the findings confirm that
the overall explanatory power of exit conditions rely on only few financial indicators, i.e. mainly
related to the industry EBITDA margin and growth dynamics herein. Another important

Empirical Part I – Market and Financial Value Drivers 196
contribution could be made through the fact that buyout firms tend to sell their targets exactly at a
point in time when the industry’s financial outlook deteriorates, i.e. no superior growth is expected.
Furthermore, it was established – in line with findings on the entry conditions – that buyout targets
had experienced strong sales and profitability growth in their respective industries prior to exit.
These findings strongly underline buyout firms’ apparent deal-making capabilities and are
therefore in support of a theory of a GP effect in leveraged buyouts.
Linear Regression Model Summary Change Statistics Model R R Square Adjusted
R Square Std. Error
of the Estimate
R Square Change
F Value Change
df1 df2 Sig. F Change
1 ,177(a) ,031 ,028 1,181907 ,031 9,859 2 611 ,000
2 ,212(b) ,045 ,035 1,177406 ,014 2,170 4 607 ,071
3 ,229(c) ,052 ,042 1,173715 ,008 4,823 1 606 ,028
4 ,244(d) ,059 ,047 1,170385 ,007 4,453 1 605 ,035
(a) Predictors: (Constant), EBITDA Margin Exit Date_Ind, EV/EBITDA at Exit Date_Ind (b) Predictors: (Constant), same as above, plus Sales CAGR x+1, Sales CAGR x-1, Sales CAGR x-2, Margin CAGR x+1 (c) Predictors: (Constant), same as above, plus Multiple Expansion CAGR Industry (d) Predictors: (Constant), same as above, plus Deleverage Industry
Table 45: Linear Regression Model on Exit Condition Variables
4.4.5.3. Modeling Buyout Performance vs. Benchmark Industry and Equity Market
Performance
Having established the impact of industry financial conditions at the time of entry into and exit
from the buyout target, the information will be utilized to explain buyout performance in a further
developed regression model based on (i) applicable industry index performance over the time
period of investment, and (ii) industry financial performance. Industry index performance relates to
the public market development in each respective industry sector, measured on classification levels
3, 4 or 6 from the exact acquisition date to the exact disinvestment date of the focal deal(s).
Furthermore, the impact of equity market performance on buyout performance will also be
examined in this context.
For the industry benchmarking analysis, over 70 variables concerning financial performance were
defined. The summary table of descriptive statistics (table 70 in appendix 2) provides an overview
into the diversity of financial classification. The table only summarizes those variables, which are
(i) at least significant at the 0.05 level (2-tailed), or (ii) are utilized in the subsequent regression
models to explain variance in performance. Level 3 and Level 4 offer the largest number of
significant industry financial variables. This is to some extent surprising, as it would have been
expected that the more detailed Level 6 financials are the best predictors of performance. However,
due to the lower amount of realized transactions encoded on the most detailed level, the slight
decrease in average sample size from Level 3 to Level 6 diminishes the available degrees of

Empirical Part I – Market and Financial Value Drivers 197
freedom. Furthermore, we can expect lower coding selection bias on industry classifications on
Level 4.131
4.4.5.3.1. Descriptive Statistics
For all three industry levels, both industry index performance and equity market performance is
highly correlated with buyout performance, with significance at the 0.001 level (except for the
industry performance on Level 6) (see appendix 2 for descriptive and Pearson correlation
overview).132 First, these results on the buyout deal level indicate that buyout transactions are
correlated to public market performance (with Pearson correlations ranging between 0.125 and
0.180 for Level 6 to Level 3). Likewise, also the market-adjusted value creation index, as measured
by the difference between public market return and gross buyout return, is highly significant at the
0.01 level (2-tailed). 133 The high Pearson correlation is simply a result of the fact that the
subtraction between IRR and industry performance must necessarily be correlated close to 100%.
In summary, the relatively low correlations compared to the findings from Bance (2002) appear to
be a result of the deal level analysis and contribute to the discussion of diversification through
Private Equity as an investment asset class.
As observed in section 4.4.3. for the entry and exit financial industry conditions of buyouts, there
continues to be strong evidence that EBITDA (margin), as an indicator of industry profitability and
cash flow generation potential, is a highly significant predictor variable for buyout returns.
Similarly but to a lower extent, revenue growth potential may be an important value driver, as
observed for Level 4 sales compounded annual growth rates (n+1; n+2). The correlations do not
suggest that there is a meaningful impact of industry trading multiple valuations (except for Level 3
entry multiple), as measured by EV/EBITDA, at the time of entry and exit. However, an increase in
average industry valuations, as measured by the industry multiple expansion CAGR, is
significantly (at the 0.05 level; 2-tailed) contributing to buyout performance. This effect is referred
to as “multiple riding” in the buyout industry and refers to the General Partner’s ability to buy an
asset cheaply when industry valuations are low, and sell it at a (much) higher multiple when market
valuations have increased.134 This finding further substantiates a theory first developed around
entry and exit conditions, by which investment managers can be considered sophisticated investors
to the extent that they enter a target (and its industry) at a point when a multiple expansion over the
holding period of the asset can be expected.
131 The Level 4 industry classification is therefore advantageous for most models due to its balanced degree
of detail and aggregation power. It will therefore be the standard for further analysis throughout this study. 132 As mentioned, the lower significance level may indicate minor selection bias during industry
classification. 133 The value creation index is also referred to as “Excess Return over Index” in the statistics reference tables. 134 This refers only the external market-driven multiple expansion effect. In addition, the sponsor may also
buy an asset below its market price (i.e. at a discount) and sell it above market price (i.e. at a premium). This effect is intrinsically driven by the General Partner and could be attributed to superior negotiation skills.
Empirical Part I – Market and Financial Value Drivers 198
Furthermore, another indication of correct market timing on behalf of buyout investment managers
is associated to an industry’s level of indebtedness. The variable “deleverage industry” refers to the
change in the focal buyout deal’s industry peers’ average indebtedness, as measured by the
difference in Enterprise Value / Net Debt (i.e. percentage of debt in total enterprise value, a proxy
for capital structure). This variable is significant at the 0.05 level (2-tailed) on Level 3 industries,
and approaching 0.1 level significance for Level 4. In essence, this finding suggests that the focal
deal’s industry peers are generating surplus cash over the time of the investment by the buyout fund
in the target company, and are able to deleverage their balance sheets. This means that overall cash
generation conditions must be positive at the time of the acquisition, which is quintessential for a
General Partner when evaluating a leveraged buyout transaction. In other words, General Partners
are not only “multiple-riding”, but also “(de)leverage-riding” between entry and exit.
4.4.5.3.2. Coefficient Statistics
Each of the subsequent five nested regression models for each industry level has been set up in a
similar way; however, the explanatory financial variables differ slightly. The selection has been
made according to the following criteria: (i) highest significance of correlation between the
independent variable with the dependent variable IRR (deal gross performance), (ii) lowest
multicollinearity effect with other variables in the model. Naturally, the various financial variables
are highly correlated among each other, e.g. the sales growth, EBITDA growth and multiple
expansion variables are linked. Accordingly, it was opted to reduce explanatory power of the
nested models, measured by R square as well as the significance of the F value change, in favour of
high tolerance values in the collinerarity statistics. Consequently, for the Level 3 industry financial
variables, the variance inflation factor does not exceed 1.5 (see Appendix 2 for and overview of
coefficients for Levels 3, 4 and 6).
An analysis of the standardized Beta coefficients reveals that the independent variable “industry
EBITDA margin at Entry Date” displays very high results. This finding mirrors our earlier
discovery among the deal entry and exit conditions and underlines that a high average industry
EBITDA margin is the single most important financial contributor to buyout performance. The
importance of industry profitability and profitability expansion is also highlighted by the EBITDA
related compounded annual growth variables (margin CAGRs), measured both from entry and exit
date. We also find strong standardized Beta coefficients for the above discussed industry multiple
expansion effect as well as industry sales growth (prospects).
The Level 4 industry classification model confirms to be highly significant. It therefore
intentionally also carries the largest amount of independent variables. As a side effect, the analysis
of the collinearity statistics exhibits higher levels of variance inflation factors, especially relating to
the industry EBITDA margin (at entry), but also to sales growth. The VIF factor for the most
complex model 5 remains under 3 for all variables except for the industry EBITDA margin CAGR
(3.923). The explanatory strength of the influence of industry financial performance is summarized
in the Level 4 regression model below.

Empirical Part I – Market and Financial Value Drivers 199
Due to the high level of detail in the Level 6 industry classification context, multicollinearity
between industry financial variables is exceedingly high. In addition, as observed in the review of
correlation statistics, the significance of the Level 6 variables is low, with only two variables being
significant at the 0.05 level (2-tailed). The presented Level 6 model therefore only incorporates a
reduced amount of variables, which in turn leads to high tolerance factors.
4.4.5.3.3. Regression Models
The nested linear regression models have been developed in order to illustrate the stepwise impact
of (i) industry public market index performance, as well as (ii) various subsequently added industry
financial variable groups.135
Linear Regression Model Summary(f)
Change Statistics Model R R Square Adjusted R Square
Std. Error of the
Estimate R Square
Change F Value Change
df1 df2 Sig. F Change
Level 3
1 ,137(a) ,019 ,017 1,152211 ,019 10,633 1 556 ,001
2 ,185(b) ,034 ,031 1,144135 ,015 8,877 1 555 ,003
3 ,221(c) ,049 ,044 1,136562 ,014 8,421 1 554 ,004
4 ,262(d) ,069 ,057 1,128512 ,020 2,983 4 550 ,019
5 ,273(e) ,075 ,060 1,127014 ,006 1,732 2 548 ,178
Level 4
6 ,110(a) ,012 ,010 1,180245 ,012 5,830 1 479 ,016
7 ,155(b) ,024 ,020 1,174256 ,012 5,899 1 478 ,016
8 ,184(c) ,034 ,026 1,170873 ,010 2,383 2 476 ,093
9 ,233(d) ,054 ,036 1,164465 ,021 2,051 5 471 ,070
10 ,272(e) ,074 ,052 1,154697 ,020 5,001 2 469 ,007
Level 6
11 ,170(a) ,029 ,027 1,158292 ,029 13,865 1 466 ,000
12 ,179(b) ,032 ,028 1,157593 ,003 1,563 1 465 ,212
13 ,180(c) ,033 ,026 1,158581 ,000 ,207 1 464 ,650
14 ,192(d) ,037 ,026 1,158525 ,004 1,023 2 462 ,360
15 ,245(e) ,060 ,046 1,146960 ,023 5,682 2 460 ,004
(a) Predictor: (Constant), Industry Performance (b) Predictors: (Constant), (a) plus Industry EBITDA Margin (c) Predictors: (Constant), (b) plus Industry Trading Valuation (d) Predictors: (Constant), (c) plus Sales and Margin Growth Factors around Entry and Exit Date (e) Predictors: (Constant), (d) plus Industry Deleverage, Industry Multiple Expansion (f) Dependent Variable: Gross IRR Performance Note: Predictors represent summarized predictor groups; see coefficient tables for all individual regression model predictors.
Table 46: Nested Linear Regression Models on Industry Financial Performance Drivers (Level 3/4/6)
Industry Performance Impact
Model 1 (as well as 6 and 11 for Level 4 and Level 6 respectively) represents a bivariate regression
model between buyout and industry performance. Model 1 shows an adjusted R square of 1.7% for
Level 3 (highly significant at the 0.01 level), 1.0% for Level 4 (model 6; significant at the 0.05
level) and 2.7% for Level 6 (model 11; highly significant at the 0.001 level). The explanatory
power on Level 6 is most solid, when compared to Level 3 and Level 4, due to the superior level of
familiarity of buyout target and industry sub-group categorization.136
135 Independent variables are exhibited in the coefficient tables and have been omitted here intentionally. 136 Accordingly, Level 4 should present better results than Level 3. Lower sample size may be responsible for
the adverse effect.

Empirical Part I – Market and Financial Value Drivers 200
Industry Profitability Impact
Model 2, and Models 7 and 12 accordingly, introduce the industry EBITDA margin at entry (Level
3 and Level 4) or exit (Level 6), indicating the industry’s profitability and attractiveness from a
cash generation capability point of view. The model’s change is significant at the 0.01 level (2-
tailed) for Level 3, at the 0.05 level for Level 4 and insignificant for Level 6. Likewise, the F value
change for Level 3 is highest at 8.421, and very low at 0.207 on Level 6. The R square increases to
3.1% and 2.0% and decreases to 2.8% respectively. In essence, these results suggest that a high
industry margin is a particularly strong predictor for buyout performance; if it can be assumed that
the buyout target’s profitability is similar to the industry on average, it can be stated that the higher
the industry EBITDA margin, the greater the cash generation potential and hence stronger debt
capacity that can be found at the target (i.e. higher leveragability reduces the equity investment
amount of the General Partner and thus positively supports gross returns).
Industry Trading Valuation Impact
Model 3, and Models 8 and 13 accordingly, introduce the industry trading valuation variable at
entry (Level 3 and Level 4) or exit (Level 4 and Level 6), indicating the asset pricing environment
of the buyout target. The model’s change is significant at the 0.01 level (2-tailed) for Level 3, at the
0.05 level for Level 4 and insignificant for Level 6. Likewise, the F value for Level 3 is highest at
8.877, and lowest at 1.563 on Level 6. The R square increases to 4.4%, 2.6% and decreases to 2.8%
respectively. These results are to some extent counter-intuitive. It was expected that high trading
valuations in the industry at the deal’s exit positively affects buyout returns, as the sponsor is able
to divest the asset at elevated prices. However, we also find a strong indication that high industry
trading valuations at the time of deal entry are contributing positively to buyout returns. However,
this could be interpreted in that respect that higher market-driven trading valuations are at least
partially a result of higher expected free cash flows, which in turn largely depend on operating cash
flows (generated through solid EBITDA). Therefore, high industry valuations can be understood to
have an indirect relationship to high EBITDA margins, and thus support returns via the free cash
flow argument. Relative asset pricing in fact is lower, as discussed in model 5.
Industry Financials Growth Factor Impact
Model 4, and Models 9 and 14 accordingly, introduce variables relating to industry sales growth
and margin growth for both entry and exit date of the acquisition. These variables may explain
buyout performance on three fronts: (i) industry financial performance before the acquisition may
offer conclusions about the motivation for the buyout, (ii) strong industry financial performance
during the buyout holding period should equally support the buyout company’s performance, and
(iii) industry financial performance post-exit may imply reasons for the timing of disinvestment.
The model’s change is significant at the 0.05 level (2-tailed) for Level 3, at the 0.1 level for Level 4
and insignificant for Level 6. Likewise, the F value for Level 3 is highest at 2.983, and lowest at
1.023 on Level 6. The R square increases to 5.7%, 3.6% and is maintained at 2.6% respectively.
Overall, it can be observed that the impact of EBITDA margin growth rates is more significant than

Empirical Part I – Market and Financial Value Drivers 201
sales growth, the latter being noteworthy on Level 3. Model 9 on Level 6 only utilizes sales and
EBITDA growth rates over the holding period, as multicollinearity is particularly high. As
previously discussed for the buyout entry and exit conditions, the development of financials in an
industry appears to be very closely watched by General Partners in the search of investment
opportunities. There is strong evidence that deals are generally entered at the beginning of a
cyclical upturn and are disposed of when growth prospects diminish. Remaining with the above
employed metaphor, it can therefore be asserted that General Partners are also “financial-growth-
riding”.
Multiple Expansion and Deleverage Impact
Model 5, and Models 10 and 15 accordingly, introduce the two remaining key variables relating to
industry multiple expansion, i.e. change in trading valuations, over the buyout holding period as
well as industry deleverage, i.e. change in average industry indebtedness. The former variable
contributes to explaining buyout performance through the multiple riding effect, i.e. that target
assets are bought at cheap valuation levels and sold when industry valuations had risen. The latter
variables adds explanatory strength due to the fact that decreasing industry indebtedness is linked
to an environment of superior cash generation, which enhances quick deleverage and thus seeds the
basis for strong returns at the buyout target. The model’s change is insignificant for Level 3, but
highly significant at the 0.01 level (2-tailed) for Level 4 and Level 6. Equally, the F value for Level
3 is lowest at 1.732, and highest at 5.682 for Level 6. The R square sharply increases to 6.0%, 5.2%
and 4.6% respectively. Overall, the impact of multiple expansion is thus highly significant for
Level 4 and Level 6, i.e. towards a higher level of detail in industry classification. The impact,
which is equal to the explanatory strength of industry EBITDA margins, is therefore another key
identified value driver utilized by General Partners to generate compelling buyout returns. It further
adds to the set of value creation capabilities attributed to buyout firms, which appear to
systematically take advantage of low- or under-priced industry environments to acquire businesses
and sell them at higher valuations. To a lower extent from observed significance levels, the
deleverage factor in an industry may more be regarded as a beneficial side effect by the General
Partners; that is, it may not count as a key determinant to support an investment decisions into a
certain industry in a similar fashion as margin and multiple expansion do.
In summary, this combined statistical analysis found that both broad equity market and specific
industry performance contribute to explaining variance in buyout returns. Furthermore, it was
established that a small set of defined industry financial indicators has the potential to significantly
explain further (positive) buyout variance. In summary, the in-depth analysis of buyout target
industries with respect to index and financial driver performance in this study, supported by the
above regressions, therefore contributed meaningfully to the overall process of understanding value
creation as developed in this study.

Empirical Part I – Market and Financial Value Drivers 202
4.4.6. Summary of Test Results
The advanced tests of leveraged buyout deal performance in this section have demonstrated the
extent of explanatory power of the focal buyout deal’s underlying industry (i) public market trading
performance, and (ii) financial developments, in explaining variance in buyout performance and in
identifying value drivers.
The descriptive findings at the beginning of the section made explicit that the Limited Partners’
dataset is clearly outperforming both equity and industry benchmark indices: measured on Level 3
industry performance, average industry performance amounted to 17%, while excess value creation
generation through all buyout deals in the sample was 57%. Variable hypotheses H14 and H15 can
therefore be accepted. The degree of value creation in the information technology, financial and
non-cyclical services industries was highest, in line with prior findings, and lowest for the utilities
and resources sectors. Based on the dataset, a buyout performance index according to entry and exit
year was developed, which demonstrated the trend of value creation across time. Trends in relation
to buyout holding time and various industry financial metrics were compared and set into
relationship with performance. These performance indices, if developed further and based on even
larger samples, have in the future the potential to become a prime benchmark tool to evaluate
buyouts (e.g. in investors’ buyout fund due diligence).
Through a range of statistical tests, it was confirmed that buyouts are driven by overall industry
benchmark performance. However, the Limited Partners sample was found to exhibit a lower
correlation with public equity markets than observed in previous studies using fund data, e.g. by
Bance (2002). Variable hypothesis H16 can therefore be accepted, as the correlation is statistically
highly significant, but unusually low. In order to make further explicit what the link between
industry index and buyout performance is, financial metrics of the respective target’s industry at
the time of entry and exit were examined. A high EBITDA margin at the time of entry, as indicator
for profitability and cash flow generation potential, was found to be the key factor influencing
buyout returns. Equally, at the time of the acquisition, industry sales and profitability on average
were set to increase at least in the first two years following the acquisition. This finding supports a
theory by which buyout firms have developed a proficiency of entering buyout targets at the exact
time when industry growth prospects in the particular target industry were high (“investment
timing capability”). This theory is further substantiated by the fact that industry growth and
profitability prior to entry has not been positive. A surprising finding is that industry valuations at
the time of entry were not necessarily low, i.e. the assumingly efficient markets had priced in the
expected positive financial developments accordingly. In other words, buyout targets were acquired
with good growth prospects, but not at a bargain. However, variables for growth in trading
multiples (“multiple expansion/riding”) correlated very positively with buyout performance, while
industry deleverage as an indication of increased cash generation proofed statistically non-
significant. Variable hypothesis H19 can therefore be accepted, but H20 has to be rejected due to
lack of statistical validity.

Empirical Part I – Market and Financial Value Drivers 203
With respect to exit conditions, it was demonstrated that the buyout firm’s investment timing
capability finds additional evidence. First, at the time of exit, industry financials had performed
well over the two years prior to exit. However, the financial outlook suggested that sales and
margin growth would halt. As a consequence, buyout firms on average also make correct
divestment decisions, as they sell target companies at the height of industry financial development,
and before industry financial conditions worsen (e.g. cyclical downturns). Variables hypotheses
H17 and H18 can therefore be accepted, as the buyout firm does appear to be correctly timing its
in-/divestment decisions. In conjunction with the findings from section 4.3., this evidence is seen as
motivation to study the GP firm in more depth in the empirical chapters II and III.

Empirical Part I – Market and Financial Value Drivers 204
4.5. Leveraged Buyout Value Attribution Analysis
So far, it was established in the prior sections that entry and exit conditions of the focal buyout
target’s industry with respect to its financial profile, i.e. general industry profitability and growth
prospects as well as financial market trading levels, can influence buyout returns. The remaining
question to be answered concerns a comparison of the financial developments at the focal buyout
compared to its industry. From this comparison, insights can we drawn with regard to the relative
impact the buyout firm has on the profitability of the company, i.e. whether and in which areas it is
able to outperform the industry. If found to be superior, this finding would further contribute to a
theory of the existence of a positive GP effect in leveraged buyouts.
4.5.1. Test Setting
Based on the various tests in the previous sections regarding market, financial and acquisition
related value drivers from an industry perspective, the existence of a GP effect in the buyout value
creation process could already be demonstrated in several instances. The results had shown that on
average the performance in excess of industry indices was remarkable. This out-performance
should therefore most likely be equally represented in the underlying financial performance of
target companies. When analyzing the potential impact that the General Partner firm may have on
relative buyout performance, a comparison of the key financial metrics will also reveal the
financial sources of value creation in any particular buyout. In section 3.5.4., the value attribution
formula was introduced, which allows making explicit the financial sources of value creation in
any particular buyout. On a specifically recorded small sub-sample of buyouts, for which financial
information could be gathered, this formula will be applied equally to the focal buyout transactions
and industry comparable companies. In addition, conclusions are intended to be drawn with respect
to differing value creation dynamics and buyout firm strategies in various industry sectors.
Accordingly, descriptive results on this sub-sample of the Limited Partners’ dataset will be
presented in a similar graphical way as in prior sections. Furthermore, the financial performances
will be tested through an extension of the industry financial variables linear regression model (from
section 4.4.5.) in order to illustrate the combined explanatory power of buyout performance
through both the target and industry related variables. The section concludes with a discussion of
the observed effects.
4.5.1.1. Tested Variables and Hypotheses
The range of testable financial variables is limited in two ways. First, the amount of financial
information provided by the General Partner, either made available through their Private Purchase
Memoranda or extractable during additional fund due diligence, remains sparse. The presented and

Empirical Part I – Market and Financial Value Drivers 205
utilized key financial metrics are those inherent in the value attribution formula, i.e. sales,
EBITDA, purchase and sales multiples and deleverage. Information about other cash flow items
such as capital expenditure or working capital over the time of the investment can already be
considered a “disclosure rarity”. Secondly, the depth of financial information available on the
publicly traded industry peers is theoretically larger due to their public financial reporting
requirements, however, will be limited to the key metrics on growth and profitability discussed in
earlier sections. Section 4.4. has demonstrated that buyout performance on average is higher than at
comparable companies. In the following, several testable hypotheses are being presented.
How do we explain this performance on the deal level? Which intrinsic and extrinsic financial
factors are driving the underlying value creation that determines this performance? From the
literature review, several drivers of value creation (and destruction) have been identified. On the
operational side, generating growth in leveraged buyouts either organically or through external
acquisitions is a key strategy of LBO firms. LBO firms are known for their aggressive growth-
oriented business plans, raising the standards for managerial performance (Baker and Montgomery
1994; Butler 2001). Thereby, LBO firms are indirectly forcing portfolio company managers to
much more adhere to high performance goals and make budgets pay off, thereby widely
eliminating some of the perceived managerial inefficiencies (Easterwood, Seth et al. 1989; Smith
1990b; Anders 1992). Therefore, it can be expected that
H21) Gross buyout deal performance is higher than at comparable companies in the
industry, as considerably higher revenue growth at buyout targets can be achieved
through the influence of the buyout firm.
Further literature had shown that buyout transactions have a positive effect on the operational
performance of target companies (Baker and Wruck 1989; Bull 1989; Jensen 1989a; Kaplan 1989b;
Lichtenberg and Siegel 1990; Muscarella and Vetsuypens 1990; Singh 1990; Smith 1990a; Long
and Ravenscraft 1993c; Ofek 1994; Smart and Waldfogel 1994; Phan and Hill 1995; Holthausen
and Larcker 1996; Weir and Laing 1998). Kaplan (1989b) provides early evidence of management
buyouts’ strong improvements in operating performance, even after adjustments for industry-wide
changes. Therefore, it can therefore be expected that
H22) Gross buyout deal performance is higher than at comparable companies in the
industry, as considerably higher profitability gains at buyout targets can be achieved
through the influence of the buyout firm.
Another important way to increase cash flow generation is to make more efficient use from
corporate assets (Bull 1989). Following the buyout, management swiftly starts to tighten the
control on corporate spending (Anders 1992; Holthausen and Larcker 1996). Kaplan (1989b) and
Smith (1990b) report significant increases in operating cash flows, which allows a quick de-
leverage and increases return. Therefore, it is expected that

Empirical Part I – Market and Financial Value Drivers 206
H23) Gross buyout deal performance is higher than at comparable companies in the
industry, as considerably higher operating cash flow generation at buyout targets can
be achieved through the influence of the buyout firm.
Besides the operational improvements, value can be created (and hence IRR increased) before
signing the share purchase agreement, since a lot of value can be captured during the acquisition
and negotiation process. Butler (2001) showed for the chemical industry sector that financial
buyers consistently paid less for their acquisitions than did trade buyers during the 1990s. One
explanation that is being offered is that compared to strategic buyers, these investors follow a
dispassionate, more objective approach, as they often screen dozens of targets before an eventual
acquisition. The second explanation is that LBO firms have developed excellent deal negotiation
skills, which may allow them to achieve on average favourable transaction multiples. It is therefore
expected that
H24) Gross buyout deal performance is higher than at comparable companies in the
industry, as buyout firms on average are able to acquire targets at a discount to
industry valuations and are able to sell them at a premium.
4.5.1.2. Methodology and Data
The sub-sample consists of 500 buyout transactions, of which 272 (54.4%) have been realized, for
which financial data could be collected. As mentioned above, the amount of available financial
information on buyout transactions is very sparse and generally restricted to the key financial
metrics only by the General Partners. As observed from the relatively low number of realized
transactions in the sub-sample, the dynamics of financial reporting in PPMs through buyout firms
involves that the focus is on unrealized transactions. General Partners are by and large under
pressure to convince potential investors that their current portfolio of unrealized investments will
lead to positive returns. As a result, a more detailed financial development is presented at a specific
valuation point of time when the PPM is prepared. In addition, the PPM often involves case studies
of (successful) realized transactions. These dynamics lead to two major conclusions: first, a higher
degree of unrealized transactions has been included in the sample due to the broader depth of
financial information, yet their deal performance (IRR) as dependent variable must be considered
as “preliminary”, i.e. based on current valuations. Although on average the sample’s average IRR
for unrealized transactions is lower, it has to be acknowledged that the degree of conservatism in
disclosure is partially dependent on the General Partner. Secondly, the presented realized
transaction case studies potentially are subject to a certain degree of selection bias. Finally, the
amount of financial information is very heterogeneous; hence some of the outlined value
contributing variables were tested on different sample sizes. Nevertheless, as the focus of attention
is not the level of performance but the relative impact of value drivers, the approach remains
methodologically sound. Financial information for industry comparable companies has been
provided on the most accurate level of classification detail from Datastream (i.e. industry Level 6;
see section 3.6.5. for classification details). The average IRR of the sub-sample of 500 buyouts

Empirical Part I – Market and Financial Value Drivers 207
with financial data is 54.0% (average IRR of 76.5% for realized transactions), with a standard
deviation of 110.2%.
4.5.2. Test Results
4.5.2.1. Descriptive Results
4.5.2.1.1. Financial Performance Comparison
The findings from the descriptive comparison of average financial performance of buyout targets
compared to their industry peers over the holding period of the investment overall supports the
hypothesis that buyout targets exhibit a significantly stronger performance. First, revenue growth
on average is more than twice as high with a CAGR of 22.5% for buyout targets against only
10.6% for average industry growth. This finding is in support of variable hypothesis H21 that LBO
firms put considerable emphasis on achieving revenue growth in leveraged buyouts, either
organically or through external acquisitions. The introduction of new strategies endorsed by the
buyout firm and their aggressive growth-oriented business plans therefore provide incentive for
target management to raise performance above industry growth levels.
21,1%
63,5%
22,5%
6,9%
-3,1%
10,6%
-10%
0%
10%
20%
30%
40%
50%
60%
70%
Sales CAGR EBITDA CAGR EBITDA Margin CAGR
Buyouts Industry Comparables
Figure 81: Revenue, Cash Flow and Profitability Development for Buyout Deals vs. Industry Comparables
Source: INSEAD Buyout Database, analyzed by author (Deal N=75/120).
Secondly, in line with prior research findings and in support of variable hypothesis H22, the buyout
target’s profitability, as measured by growth in EBITDA margin, rises by a CAGR of 21.1%
compared to a slight decline of -3.1% CAGR in EBITDA margin for the comparable industry
group. This result is particularly impressive given the average industry decline and leads to the
hypothesis that buyout firms successfully follow “outpacing strategies” by combining operational
improvements and product cost awareness with higher product value, innovation and growth
(Gilbert and Strebel 1987). Their dual approach also validates that buyout firms are not exclusively

Empirical Part I – Market and Financial Value Drivers 208
focusing on cost cutting strategies, which is in line with Porter (1996), who states that “constant
improvements in operational effectiveness to achieve superior profitability is necessary in order to
achieve superior performance and value creation, but usually not sufficient”. Finally, as a result of
the efficiency gains also the absolute level of EBITDA at buyout targets rises, which positively
impacts operating cash flows and supports deleverage of acquisition debt. Consequently, variable
hypothesis H23 can be accepted as operating cash flows – as proxied by EBITDA generation – rise
by a CAGR of 63.5% over the holding period of the investment, while only at a rate of 6.9% p.a.
for comparable industry peers.
7,3x
10,8x
2,5x
4,2x
10,7x
1,4x 1,5x
7,3x
194%
28%
89%82%
-
2,0x
4,0x
6,0x
8,0x
10,0x
12,0x
EV/EBITDA
Entry
EV/EBITDA Exit Net Debt/
EBITDA Entry
Net Debt/
EBITDA Exit
Equity/EV Entry Equity/EV Exit
0%
25%
50%
75%
100%
125%
150%
175%
200%
Buyouts Industry Comparables
Buyouts Industry Comparables
Figure 82: Entry and Exit Conditions for Buyout Deals vs. Industry Comparables
Source: INSEAD Buyout Database, analyzed by author (Deal N=272).
The strong financial performance is resembled in the leverage profile of the buyout targets under
review: on average, the leverage of buyout targets at time of the acquisition was 4.2x EBITDA,
compared to 1.5x as industry average.137 By the time of exit, leverage levels have decreased to
2.5x, while the industry leverage remained nearly unchanged at 1.4x. Even more impressive
evidence of the cash flow generation achieved by buyout targets in this sub-sample is demonstrated
by the average equity contributions: buyout targets at the time of entry only had an equity cushion
of 28% compared to an industry average of 82%. By the time of exit, the equity to enterprise value
ratio has risen to 194% for the target group, while the industry average improved to 89%. This
leads to two important conclusions. First, the level of 194% of equity value is an indication that the
buyout firm has significantly increased the market value of the equity. As seen by the maintained
high leverage levels, large parts of this equity (net cash position) may have been distributed back to
137 The ratio Net Debt/EBITDA is the most common indicator of financial leverage in the buyout industry.
The leverage is determined by the individual debt capacity of the focal buyout target, but also depends on the capital market’s view on risk of default. Leverage levels have decreased significantly from the levels seen during the 1980s, which had seen leverage levels of up to 10.0x, to a more moderate 3.0-6.0x range, depending on the financial strength of the target. By comparison, investment grade companies infrequently carry leverage levels beyond 2.0x in order to maintain investment grade credit ratings.

Empirical Part I – Market and Financial Value Drivers 209
the investing fund through dividends. Secondly, the improvements of equity contribution (and
slightly in the leverage levels) also point to the fact that the industry is improving its financial
condition. This adds to the findings from section 4.4.3., which displayed that buyout firms exhibit a
deal timing capability, benefiting to some extent from positive cyclical upswings.
As a final observation point, the results demonstrate support for variable hypothesis H24 that
buyout firms are systematically extracting value through acquisition multiple arbitrage. At the time
of entry, industry valuations of buyout targets averaged 10.7x of EV/EBITDA; yet General
Partners only paid an average of 7.3x for their targets, immediately capturing value from the selling
parties. By the time of exit, industry valuations have declined on average. This outcome is in line
with findings from section 4.4.5.2., which highlighted that growth prospects of the industry at the
time of exit were declining, i.e. the end of a cyclical upturn has been reached, which is resembled
in decreasing trading valuations. Nevertheless, buyout firms were able to capitalize on their relative
value play and sell their portfolio companies at an average 10.8x EV/EBITDA, against an industry
average of only 7.3x.138 However, is should be acknowledged that part of the increased valuation of
buyout targets is linked to the extraordinary financial performance with respect to sales growth and
efficiency improvements, as outlined further above.139 Nevertheless, the findings are adding to
Butler (2001), who had previously shown that financial buyers consistently paid less for their
acquisitions than trade buyers. In summary, the dispassionate, objective approach followed by
buyout firms in evaluating investments as well as their excellent deal negotiation skills appear to
allow them on average to achieve highly favourable transaction multiples.
4.5.2.1.2. Value Attribution
The deduction of the value attribution formula based on the Dupont equation, as outlined in section
3.5.4., highlighted the possibility to attribute the observed return of focal buyouts into their intrinsic
value drivers – revenue growth, margin expansion, multiple expansion and deleverage (the latter
being deduced). The breadth of available data in the sub-sample is especially limited with respect
to multiple expansion, which led to the decision to focus on the former two value drivers revenue
growth and margin expansion and to combine the latter two variables as plug. The resulting
formula can in simplistic terms be expressed as follows:
IRR (Equity) = Revenue growth effect (on IRR) + EBITDA margin effect (on IRR)
+ [Multiple expansion effect (on IRR) + Leverage Effect (on IRR)]
The same methodology has been applied to the comparable industry companies’ returns and their
respective financials. The results reinforce the above findings on the underlying financial
development at the targets. For the total sample of buyouts, the leverage and multiple arbitrage
138 Besides the price earnings ratio, EV/EBITDA serves as a common valuation multiple, especially in the
non-public markets. 139 Another theory would be that buyout firms often acquire companies in financial difficulties and are hence
able to implement such observed improvements in performance/valuation.

Empirical Part I – Market and Financial Value Drivers 210
effect contributed 83% of the value that led to an average sample IRR of 78.2%. The efforts to
increase revenues added another 25% in value, while the observed margin improvements had a
negative effect of -8% on a relative basis.140 The comparison with the industry in turn illustrates
that comparable companies generated significantly less value from both revenue growth and
margin improvements and even more so depended on an increase in market valuation levels (since
leverage remained largely unchanged) in order to achieve its average IRR of 14.3%.
Buyout Sample
Revenue Effect
25%
Margin Effect
-8%
Leverage and
Multiple Effect
83%
Industry Comparables
Revenue Effect
-13%
Margin Effect
-24%
Leverage and
Multiple Effect
137%
Figure 83: Value Attribution of All Buyout Deals vs. Industry Comparables
Source: INSEAD Buyout Database, analyzed by author (Deal N=57; mean IRR=78%).
However, it can be presumed that there are broad differences with respect to value creation
strategies, and hence resulting value attribution profiles according to the target’s respective
industry. Each industry also offers a different potential for growing revenues, cutting costs or to
benefit from multiple arbitrage. For example, the consumer goods sector for the sample of
comparable industry peers shows that over the investment horizon, the industry had benefited from
a rise in valuation, which was partially supported by strengthening margins, but weak revenue
growth on a relative basis. By contrast, besides benefiting from the industry revaluation (47%),
buyout firms were able to substantially – and equally strong from a value attribution perspective –
grow revenues (42%) and reduce costs (11%) to achieve an average IRR of 49.6% vs. 11.7% for
the consumer goods industry. The strong relative growth in revenues is likely to be the result of an
external growth strategy, i.e. through one or several add-on acquisitions.
Buyout Sample
Leverage and
Multiple Effect
47%Margin Effect
11%
Revenue Effect
42%
Industry Comparables
Leverage and
Multiple Effect
222%
Margin Effect
1%
Revenue Effect
-123%
Figure 84: Value Attribution of Buyout Deals vs. Industry Comparables – Consumer Goods Sector
Source: INSEAD Buyout Database, analyzed by author (Deal N=14; mean IRR=50%).
However, there are also examples in which the buyout firm has more limited scope to gain from
sales and cost enhancements. The results for a sub-sample of basic industry and general industrial
140 It must be highlighted that this presentation only makes relative statements on which value drivers
contributed more or less to the observed returns. As seen in the prior section, the EBITDA improvement

Empirical Part I – Market and Financial Value Drivers 211
companies demonstrates that buyout firms in these sectors are likely to more heavily rely on (i)
correct investment timing with respect to industry upward cycles to benefit from multiple
expansion, and (ii) stable levels of cash flow to delever the business. As observed below, the
leverage and multiple expansion effects, which also dominated the peer group’s return, accounted
for ca. 80% of attributable value to the average IRR of 79.7%.
Buyout Sample
Revenue Effect
11%
Margin Effect
8%
Leverage and
Multiple Effect
80%
Industry Comparables
Revenue Effect
-8%
Margin Effect
-36%
Leverage and
Multiple Effect
145%
Figure 85: Value Attribution of Buyout Deals vs. Industry Comparables – Basic Industries and General Industrials
Source: INSEAD Buyout Database, analyzed by author (Deal N=22; mean IRR=80%).
Furthermore, investments in the information technology sector provided evidence to be highly
dependent on trading multiple expansion to generate value.141 Revenue growth, which is commonly
very strong for information technology businesses, plays a minor role on a relative basis. However,
improvements in profitability appear to be a second important area for value gains for buyout firms
as well as at the industry’s comparable companies. Since strong revenue growth is often
accompanied by weak profitability and high cash burn rates, profitability enhancements may serve
as a critical mean to reassure investors in publicly listed information technology companies, but
also for buyout targets destined to eventually exit on public markets, about their business plan
validity. In spite of the fact that weaker profitability has been a justifiable trend during growth
years, the observed value attribution highlights the apparent benefits of focusing on cost control.
Buyout Sample
Leverage and
Multiple Effect
114%
Margin Effect
5%
Revenue Effect
-19%
Industry Comparables
Leverage and
Multiple Effect
155%
Margin Effect
28%
Revenue Effect
-83%
Figure 86: Value Attribution of Buyout Deals vs. Industry Comparables – Information Technology Sector
Source: INSEAD Buyout Database, analyzed by author (Deal N=5; mean IRR=270%).
In summary, the value attribution analysis has shown how buyout firms in different industries – on
a relative basis – are able to generate returns above industry returns. Although these findings will
have to be verified on much larger sample sizes in the future, one key finding from this
examination is that buyout firms are, on the one side, certainly benefiting from multiple expansion
was meaningful, but also partially benefited from the large increase in revenues. 141 The use of leverage in this segment can be assumed to be very moderate, as financing is difficult to raise
due to rapid changes in technology, which adds to volatility in earnings and cash flows.
Empirical Part I – Market and Financial Value Drivers 212
in their chosen industries. On the other side, however, they are on average also more effective in
implementing both growth and cost reduction strategies in their portfolio companies when
compared to the overall industry.
4.5.2.2. Regression Test
The test of the buyout target company financial development as a source of value creation through
a linear regression model has produced unsatisfactory results and hence is omitted here. This is
mainly the result of the large heterogeneity of the collected financial information. In order for the
regression model to be effective, i.e. for a comprehensive explanation of buyout performance
though multivariate factors, financial information for each of the tested categories need to be
available to a sufficient degree. The unsatisfactory regression results could therefore potentially be
overcome by a much larger dataset, with improved completeness in all financial dimensions, which
most likely would have to be collected in cooperation with one or several General Partner firms.142
However, it should be noticed that the Pearson correlations – for all and realized transactions only
– in the sub-sample did not produce highly significant correlations, although directionally
supportive of the above findings, e.g. high sales and EBITDA growth are naturally positively
correlated to performance. One possible interpretation of this phenomenon could be that, in actual
fact, the General Partner involvement on a relative basis (compared to the industry) produces very
meaningful results. However, due to the observed broad differences in value attributions across
industries, which are based on different value creation strategies by buyout firms, a statistical test
may be less useful since the effects monitored within each of the various industries are blended in
such a way that statistical trends become equalized. As a consequence, according to the author’s
opinion, the data analysis would critically need to concentrate on specific industry sectors, which
makes the appropriate data collection even more challenging (due to the required sample size). An
alternative explanation could be seen in the sub-sample’s potential selection bias, as mentioned in
the data overview section above.
4.5.2.3. Summary of Test Results
This section has introduced the concept of value attribution to leveraged buyout transactions and
applied the formula developed in section 3.5.4. to a sub-sample of buyout transactions. First, the
findings for the financial development of buyout targets vis-à-vis industry peers clearly indicated
that financial sponsors are outperforming industry comparable companies with respect to revenue
growth, profitability enhancements and cash flow generation. In addition, buyout firms prove to be
successful multiple arbitrageurs, entering companies at a discount to market valuations and exiting
at a premium. These results can therefore be seen as an important factor in the explanation of the
superior observed performance of gross leveraged buyout performance compared to comparable
companies, as observed in section 4.4.2. The value attribution analysis substantiated that buyout

Empirical Part I – Market and Financial Value Drivers 213
firms – on a relative basis – are also less dependent than industry comparable companies on
improvements in industry valuations, but rather take vigorous action to enhance revenue growth
and profitability in order to maximize value generation. However, differences in value creation
strategies become transparent when evaluating different industries: each industry emerges to carry
its own value creation dynamics, i.e. offers more or less room for revenue and profitability
enhancements. This finding will be put into further perspective in the empirical chapter three,
which attempts to shed more light on the various alternative value creation strategies available to
buyout firms and their context conditionality.
4.6. Conclusions
Following the first research question, this study’s first chapter of empirical results has tested and
provided an in-depth analysis of exogenous, systematic drivers of value creation, which represent
the fist pillar of this study’s research model. Important answers to the first research question could
be presented.
First, the analysis of the secondary (control population) dataset from Venture Economics provided
an overview of historical Private Equity fundraising trends and performance. The strong growth of
Private Equity fundraising (from US$ 3.6 billion in 1983 to a record US$ 126.7 billion in 2000),
especially driven by buyout funds, were a result of strong abnormal returns for funds raised during
the early 1980s, which led to an influx of capital into this investment asset class. With respect to
performance, the myth and fear of increasing funds sizes was demonstrated to by without reason, as
traditionally larger funds outperformed the industry. The findings also confirmed that European
buyout investing is more profitable (notably for funds raised in the U.K., Scandinavia or
Luxembourg), yet the U.S. exhibits substantially better performance in Venture Capital investment.
In addition, Venture Capitalists have been more successful in their allocation of capital to the
highest yielding industries, mainly to the information technology sector. By contrast, buyout funds
have demonstrated a desolate track record in this industry sector, which led to the conclusion that
they should “stick to their knitting”, i.e. focus on pure buyout investment activity.
The subsequent sections introduced the primary Limited Partners’ dataset sample of individual
transactions into the study. The initial tests resembled the analysis of the control population;
however, each group of (control) variables was tested statistically for its contribution to explaining
buyout performance. The observed abnormally strong performance of certain years in the Private
Equity industry was confirmed for deals that were entered in 1984, 1998 and 1999. The country of
origin of buyout transactions has overall not been identified as an important value driver: a linear
regression model has confirmed that these variables are only adding minor explanatory strength to
142 Access to this detailed financial information will be dependent on the financial sponsors’ willingness to
provide this information, which is most likely bound to confidentiality agreements.

Empirical Part I – Market and Financial Value Drivers 214
the analysis of buyouts with up to 0.8% of R square on the sample under review. With respect to
the U.S.-European comparison, although realized returns of some European countries had higher
mean returns, this trend was statistically non-significant. Since significance for U.S. deals could be
found, no valid conclusions could be drawn from this sample.
The industry of buyout transactions has been identified to be a very important value driver. The
associated linear regression model confirmed that industry classification variables are adding
extensive explanatory strength to the analysis of buyouts with up to 4.5% of R square on the
Limited Partners sample. Some of the key findings include that in contradiction to the fund-based
results from the Venture Economics data, the buyout funds in the Limited Partners’ dataset sample
have actually successfully invested in the information technology sector. Among the more
traditional sectors, the service sector has proven to be very attractive from a return perspective, in
line with the findings of the control population. Consequently, it can be concluded that industry
dynamics play an important role with respect to successful buyout fund capital allocation.
With respect to market and financial value drivers that relate to entry, exit or investment period, the
holding period, i.e. length of the buyout firm investment at the target, was highly negatively and
significantly affecting buyout returns. The central takeaway for theory from this result must be that
buyout firms should have a confirmed interest for a quick investment turnover, not least due to the
fact that they will eventually be measured on their track record according to this dimension by their
fund’s investors. From a buyout fund practitioner perspective, investments with rather long-term
value creation strategies should be disadvantaged when compared to short opportunistic
investments. The results from the analysis of deal size and buyout performance produced mixed
results. Overall, smaller deals statistically proved to perform better, although also strong returns for
mega deals could be observed (yet statistically not confirmed). The mid-cap segment also showed
slightly lower returns. In summary, no meaningful trend that would support a firm recommendation
could be made on this variable. Equally, the ownership percentage acquired in buyout transactions
has not been identified to be an important value driver from a statistical standpoint. This is partially
the result of the convex relationship between ownership and performance, i.e. majority control
investments performed best as expected, but the surprising finding on the Limited Partners sample
is that minority investments, defined as less than 25%, produce very attractive results, which could
be explained through a successful co-investment behavior among buyout funds. The 2nd and 3rd
quartiles exhibited weaker average performance.
The analysis of entry and exit mode variables further revealed significant findings for the dynamics
of value creation and buyout returns. The entry mode variable analysis has shown that the riskier
outright acquisition yields higher returns than other entry modes, such as recapitalizations.
European exit modes on average performed better in this sub-sample, partially driven by lower
average investment holding periods. The exit mode variable confirmed that IPOs are statistically
the preferred exit route from a return perspective, in line with findings on the Venture Economics
control population. A surprising difference between Europe and the U.S. was, however, that the

Empirical Part I – Market and Financial Value Drivers 215
private exit market is relatively more attractive, enhanced by shorter European holding periods on
this exit route. This has led to the conclusion that the private exit market in Europe is more active
than in the U.S., potentially driven by the less advanced (Pan-)European consolidation in most
industries. The analysis of entry and exit type variables revealed further interesting results from a
practitioner point of view, yet not all statistically significant. Counter-intuitively, the “competitive”
auction has historically been the entry type that yielded highest returns. Based on this phenomenon,
conclusions were made that (i) the most attractive assets from a value creation or market position
perspective are being sold through competitive auctions, and (ii) auctioned deals on average
demonstrated to show the shortest holding period and hence are attractive as the quicker exit
increases returns. However, the development of recently declining returns for auctioned deals was
made explicit and must be cautiously observed. Finally, the General Partner firm undertaking the
buyout has statistically been verified as a potential significant source of value creation. This
evidence must be seen as the main motivation to study the GP firm in more depth in the subsequent
empirical chapters II and III. A summary regression model on all of the above outlined control
variables, posting an adjusted R square of 30.4%, confirmed that important value drivers in the
value creation process have been identified.
The third sub-section on the primary Limited Partners’ dataset examined gross buyout deal
performance compared to public stock markets and put this into context of industry financial
developments. The findings made explicit that the Limited Partners’ dataset is clearly
outperforming both equity and industry benchmark indices: measured on Level 3 industry
performance, average industry performance amounted to 17%, while excess value creation
generation through all buyout deals in the sample was 57%. The degree of value creation in the
information technology, financial and non-cyclical services industries was highest, in line with
prior findings, and lowest for the utilities and resources sectors. Based on the dataset, a buyout
performance index according to entry and exit year was developed, which demonstrated the trend
of value creation across time. Through a range of statistical tests, it was confirmed that buyouts are
driven by overall industry benchmark performance. However, the Limited Partners sample was
found to exhibit a lower correlation with public equity markets than observed in previous studies
using fund data, e.g. by (Bance 2002).
In order to make further explicit what the link between industry index and buyout performance is,
financial metrics of the respective target’s industry at the time of entry and exit were examined. A
high EBITDA margin at the time of entry, as indicator for profitability and cash flow generation
potential, was found to be the key factor influencing buyout returns. Equally, at the time of the
acquisition, industry sales and profitability on average were set to increase at least in the first two
years following the acquisition. This finding supports a theory by which buyout firms have
developed a proficiency of entering buyout targets at the exact time when industry growth
prospects in the particular target industry were high (“investment timing capability”). This theory is
further substantiated by the fact that industry growth and profitability prior to entry has not been
positive. A surprising finding is that industry valuations at the time of entry were not necessarily

Empirical Part I – Market and Financial Value Drivers 216
low, i.e. the assumingly efficient markets had priced in the expected positive financial
developments accordingly. In other words, buyout targets were acquired with good growth
prospects, but not at a bargain. However, variables for growth in trading multiples (“multiple
expansion/riding”) correlated very positively with buyout performance, while industry deleverage
as an indication of increased cash generation proofed statistically non-significant. With respect to
exit conditions, it was demonstrated that the buyout firm’s investment timing capability finds
additional evidence. First, at the time of exit, industry financials had performed well over the two
years prior to exit. However, the financial outlook suggested that sales and margin growth would
halt. As a consequence, buyout firms on average also make correct divestment decisions, as they
sell target companies at the height of industry financial development, and before industry financial
conditions worsen (i.e. cyclical downturns).
Finally, the first empirical chapter ended with a comparative analysis between the above mentioned
industry financial conditions and actual buyout target financial performance. The financial
development of buyout targets vis-à-vis their direct industry peers clearly indicated that buyout
target companies are outperforming industry comparable companies with respect to revenue
growth, profitability enhancements and cash flow generation. In addition, buyout firms prove to be
successful multiple arbitrageurs, entering companies at a discount to market valuations and exiting
at a premium. These results can therefore be seen as an important contribution for the explanation
of the above discussed excess returns over public markets. The application of the value attribution
formula developed in this study to the sub-sample of buyouts then substantiated that buyout firms –
on a relative basis – are also less dependent than industry comparable companies on improvements
in industry valuations, as they rather take vigorous action to enhance revenue growth and
profitability in order to maximize value generation. However, differences in value creation
strategies followed by buyout firms become transparent when evaluating different industries. As a
consequence, in conjunction with the above findings, this evidence serves as direct motivation to
study the buyout firm, its characteristics and followed strategies in more depth in the empirical
chapters II and III.

5. Empirical Part II – The GP Firm and
Manager Effect
5.1. Introduction
In the first chapter of empirical results, it was established that leveraged buyouts as part of the
Private Equity investment asset class do create superior value when compared to public markets.
This finding was achieved based on (i) the control population dataset from Venture Economics,
which included fund return data, as well as (ii) the Limited Partners’ primary dataset of individual
buyout transactions. The analysis further highlighted under which exogenous, i.e. market and
acquisition related, conditions buyout transactions were more likely to be successful. Moreover, an
analysis of the key financial accounting patterns both on the target company level and with respect
to its underlying industry financial dynamics at the time of deal entry and exit revealed, where the
value creation in buyout transactions stems from. From both the Venture Economics fund return
analysis as well as the deal level findings, it became evident that the variance of success between
individual deals, funds and the various General Partners was considerable. As a consequence, this
second empirical chapter seeks to shed light on the non-financial, human factor “Buyout firm and
its Investment Professionals”, as this factor is expected to be a key driver in the value creation
process and may eventually determine success and failure of a buyout transaction.
First, the chapter commences by outlining characteristics and profile of buyout firm investment
team professionals. Secondly, characteristics and profile of buyout firms as an organization and its
team structure will be discussed. Thirdly, performance of different buyout firms will be presented
and put into context to their respective team characteristics. Fourthly, direct links to the managing
partners and other investment professionals that worked on particular buyout deals will be analyzed,
and finally, statistics should reveal which characteristics of investment managers/ teams is likely to
influence success. Specifically, the question will be answered (i) whether there is an experience
effect of buyout firms in executing transactions, and (ii) whether a focused investment strategy
followed by the buyout firm with respect to type of deal leads to superior value creation.
For the above outlined tests in this chapter, there will be a prior description of tested variables and
brief discussion of tested “variable hypotheses” with respect to the variable’s potential impact on
buyout performance, detailed statistical regression analysis as well as summary interpretation of
results.
Empirical Part II – Buyout Firm and Manager Value Drivers 218
5.2. Investment Manager and General Partner Firm
Characteristics
5.2.1. Test Setting
Based on the various tests in the previous chapter regarding market, financial and acquisition
related value drivers, the existence of a GP effect in the buyout value creation process could be
demonstrated in several instances. When analyzing the potential impact that the General Partner
firm as an institution has on buyout performance, both the characteristics of the individual
investment managers as well as of the buyout firm as an “organization” could be relevant. The
descriptive and statistical exploratory analysis in this first section will therefore analyze these
characteristics according to the following main constructs:
- Investment Manager / GP Firm team time related experience profile
- Investment Manager / GP Firm team educational experience profile
- Investment Manager / GP Firm team professional experience profile
- Investment Manager / GP Firm team diversity and hierarchy profile
- Investment Manager / GP Firm team homogeneity profile
According to these dimensions, descriptive results on a specifically recorded sub-sample of the
Limited Partners’ dataset, for which these GP firm related characteristics where available, will be
presented in a similar way as in the first empirical chapter. Furthermore, the above constructs, each
of which include a larger set of variables, will be tested through a complex linear regression model
in order to illustrate the combined explanatory power of buyout performance by these General
Partner related variables. The section concludes with a discussion of the observed effects.
5.2.1.1. Tested Variables and Hypotheses
The range of testable variables with respect to characteristics of buyout investment managers and
buyout firms is theoretically almost infinite. The below discussed constructs represent several key
due diligence areas, which Private Equity fund of funds industry experts consider as highly
relevant. At the same time, the amount of information provided by the General Partner about their
organization is commonly sparse. The presentation of buyout investment managers is in general
limited to educational and professional experience, but the presentation of this information is
highly heterogeneous. Additional due diligence into team characteristics, especially the track
record of individual key members of the buyout firm, performed by Limited Partners added
significant value to this analysis. 143
143 Some of the sophisticated Private Equity fund of funds investors in the industry maintain advanced
databases, in which they track biographies and performance of the key investment manager figures at the major Private Equity funds.
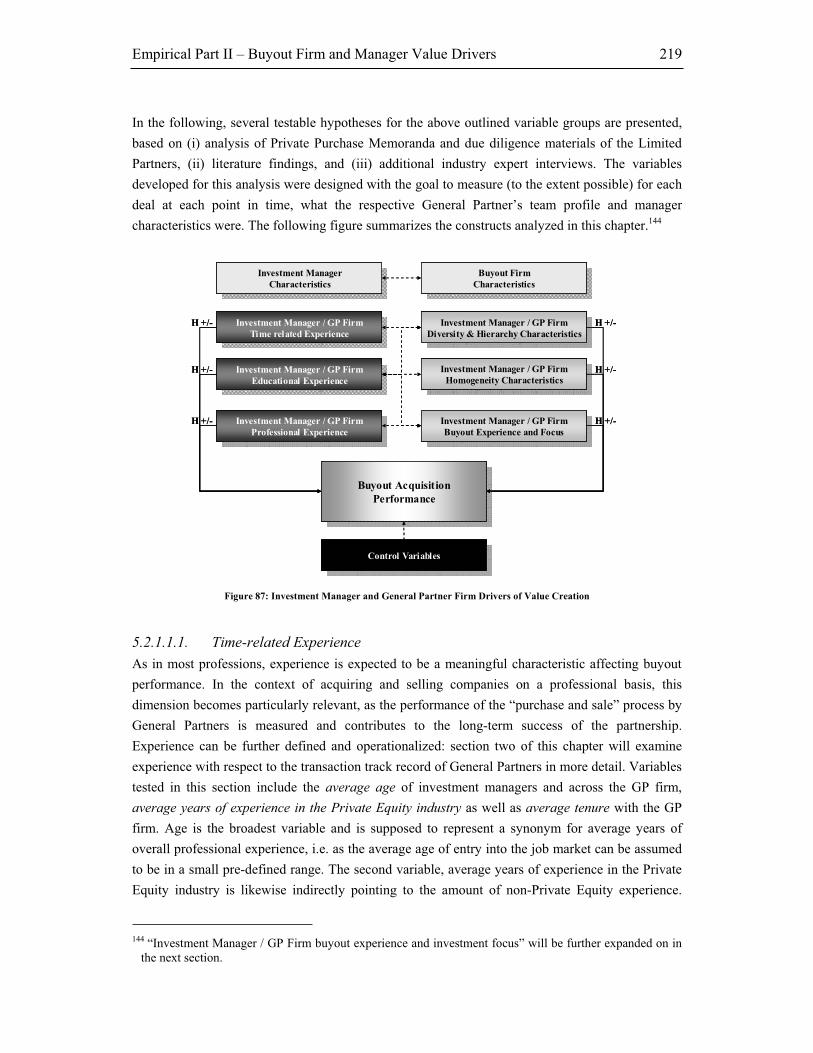
Empirical Part II – Buyout Firm and Manager Value Drivers 219
In the following, several testable hypotheses for the above outlined variable groups are presented,
based on (i) analysis of Private Purchase Memoranda and due diligence materials of the Limited
Partners, (ii) literature findings, and (iii) additional industry expert interviews. The variables
developed for this analysis were designed with the goal to measure (to the extent possible) for each
deal at each point in time, what the respective General Partner’s team profile and manager
characteristics were. The following figure summarizes the constructs analyzed in this chapter.144
Investment Manager
Characteristics
Investment Manager
CharacteristicsBuyout Firm
Characteristics
Buyout Firm
Characteristics
Investment Manager / GP Firm
Time related Experience
Investment Manager / GP Firm
Time related Experience
Investment Manager / GP Firm
Educational Experience
Investment Manager / GP Firm
Educational Experience
Investment Manager / GP Firm
Professional Experience
Investment Manager / GP Firm
Professional Experience
Investment Manager / GP Firm
Diversity & Hierarchy Characteristics
Investment Manager / GP Firm
Diversity & Hierarchy Characteristics
Investment Manager / GP Firm
Buyout Experience and Focus
Investment Manager / GP Firm
Buyout Experience and Focus
Buyout Acquisition
Performance
Buyout Acquisition
Performance
Control VariablesControl Variables
H +/-
H +/-
H +/-
H +/-
H +/-
Investment Manager / GP Firm
Homogeneity Characteristics
Investment Manager / GP Firm
Homogeneity CharacteristicsH +/-
Investment Manager
Characteristics
Investment Manager
CharacteristicsBuyout Firm
Characteristics
Buyout Firm
Characteristics
Investment Manager / GP Firm
Time related Experience
Investment Manager / GP Firm
Time related Experience
Investment Manager / GP Firm
Educational Experience
Investment Manager / GP Firm
Educational Experience
Investment Manager / GP Firm
Professional Experience
Investment Manager / GP Firm
Professional Experience
Investment Manager / GP Firm
Diversity & Hierarchy Characteristics
Investment Manager / GP Firm
Diversity & Hierarchy Characteristics
Investment Manager / GP Firm
Buyout Experience and Focus
Investment Manager / GP Firm
Buyout Experience and Focus
Buyout Acquisition
Performance
Buyout Acquisition
Performance
Control VariablesControl Variables
H +/-
H +/-
H +/-
H +/-
H +/-
Investment Manager / GP Firm
Homogeneity Characteristics
Investment Manager / GP Firm
Homogeneity CharacteristicsH +/-
Figure 87: Investment Manager and General Partner Firm Drivers of Value Creation
5.2.1.1.1. Time-related Experience
As in most professions, experience is expected to be a meaningful characteristic affecting buyout
performance. In the context of acquiring and selling companies on a professional basis, this
dimension becomes particularly relevant, as the performance of the “purchase and sale” process by
General Partners is measured and contributes to the long-term success of the partnership.
Experience can be further defined and operationalized: section two of this chapter will examine
experience with respect to the transaction track record of General Partners in more detail. Variables
tested in this section include the average age of investment managers and across the GP firm,
average years of experience in the Private Equity industry as well as average tenure with the GP
firm. Age is the broadest variable and is supposed to represent a synonym for average years of
overall professional experience, i.e. as the average age of entry into the job market can be assumed
to be in a small pre-defined range. The second variable, average years of experience in the Private
Equity industry is likewise indirectly pointing to the amount of non-Private Equity experience.
144 “Investment Manager / GP Firm buyout experience and investment focus” will be further expanded on in
the next section.

Empirical Part II – Buyout Firm and Manager Value Drivers 220
Tenure with the GP firm demonstrates how long the investment professional or the team has been
working together. A low number would suggest a young, expanding team or high turnover. Tenure
therefore also serves as an indicator on how well experience and tacit knowledge could be shared
within the GP firm team. Firm tenure heterogeneity has been found to be an important factor in
related studies, as it influences the degree to which top management team (TMT) members use
their different networks effectively (Athanassiou and Nigh 1999). In general, time-related
experience as measure for tacit knowledge is expected to have a positive effect on buyout
performance, hence it can be stated that
H25/26/27.) Gross buyout deal performance is higher for transactions, in which the average
age, Private Equity experience and tenure of investment managers and the GP
firm team is high.
5.2.1.1.2. Educational Experience Profile
Along Aristotle’s line that “the roots of education are bitter, but its fruits are sweet”, the education
of Private Equity investment managers could be considered as an early principal driver for
subsequent success in the buyout industry. Related studies have found that “top management team
educational heterogeneity is pertinent, because it provides an indicator of the diversity of skills and
cognitive processes, as well as basic knowledge, embedded in the TMT” (Bantel and Jackson 1989;
Wiersema and Bantel 1992; Boeker 1997). Limiting the definition of education to university
studies in this study, several dimensions will be considered. First, the type of degree studied, e.g.
business, law, engineering, arts or other degrees, determine the type of acquired knowledge and
skill set of the investment manager. It could be assumed that business and/or law studies are the
more adequate preparation for the required skill set of investment managers (with respect to
achieving higher performance). The level of degree, e.g. bachelor, master, MBA or PhD/JD degree,
determines the depth, with which a specific subject has been studied. Similarly, the number of
(different) degrees studied points to the diversity and intensity of knowledge acquired. Finally, the
university, at which the degree was earned, may be of differing quality and hence could influence
the level of education of the investment professional. It can therefore be expected that Gross buyout
deal performance is higher for transactions, in which on average
H28.) more investment managers had a business or law degree.
H29.) more investment managers had a higher than bachelor degree.
H30.) investment managers had a higher number of total degrees.
H31.) investment managers attended top ranked universities.
5.2.1.1.3. Professional Experience Profile
Private Equity investment managers have very diverse professional backgrounds (see examples in
section 5.2.2.3.). One of the frequent topics of discussion among Private Equity industry experts
and fund managers is which type of professional experience profile contributes most value to the
buyout firm team. The broad literature on the experience/diversity profile of top management teams
(TMT) and/or board of directors suggests that a mix of complementary backgrounds leads to better

Empirical Part II – Buyout Firm and Manager Value Drivers 221
firm performance. Based on their assertion that organizations are “reflections of the values and
cognitive bases of powerful actors,” Hambrick and Mason (1984) proposed that “organizational
outcomes – strategic choices and performance levels – are partially predicted by managerial
background characteristics”. Subsequent upper echelons research has drawn on a variety of
theories, and indicates that the demographic characteristics of firms’ top executives are indeed
related to a range of important organizational outcomes (Bantel and Jackson 1989; Wiersema and
Bantel 1992). For instance, it has been argued that background diversity or heterogeneity is
indicative of TMTs’ sociocognitive diversity, their skill sets, and the breadth of their social and
professional ties (Finkelstein and Hambrick 1990; Finkelstein and Hambrick 1996). This
heterogeneity of cognitions, skills, and ties is said to provide top management teams with diverse
inputs and helps them be more responsive to environmental complexity and change (Bantel and
Jackson 1989; Jackson 1992; Carpenter and Fredrickson 2001). Diverse backgrounds and skill sets
have also been associated to successful board supervision in the context of effective corporate
governance (Malik 1999; Macus 2002; Hilb 2002a), and to help TMTs to overcome the
information overload, complexity, and domestic myopia that typically hamper globalization efforts
(Ohmae 1989; Sanders and Carpenter 1998; Hilb 2002b).
Professional experience can only be considered as a proxy for the above described diversity. It is,
however, also a very broad term as such, which includes more than the common definition of an
employment relationship. Professional experience in the context of this study is therefore defined
as the investment manager’s network, since it not only includes professional experience in
accounting, banking, consulting, legal counsel or Private Equity, but also includes experience
gained as manager, board member, in industry associations, in the public sector or in academia.
Consequently, these “network categories” more adequately reflect the important cognitions, skills
and relationships built by the investment manager prior to his engagement in Private Equity, which
could prove highly beneficial when originating and executing buyout transactions. Among the
various professional experience fields, some may be closer and more relevant to the buyout
investment manager profession, e.g. experience in the financial services industry or elsewhere in
Private Equity. It can therefore be expected that
H32.) Gross buyout deal performance is higher for transactions, in which the average
size of the investment manager’s / GP firm team’s network (professional experience) is
high.
H33.) Gross buyout deal performance is higher for transactions, in which on average more
investment managers of the GP firm team have acquired professional experience in the
financial services industry or elsewhere in Private Equity.
5.2.1.1.4. Diversity and Hierarchy Profile
So far, diversity with respect to professional and educational experience of investment managers
has been discussed. However, from an organizational point of view, the hierarchical structure of the
buyout firm, i.e. how many hierarchical layers does it include and what is the ratio of partners to
other investment professionals, could play an important role. In general, flat structures also support

Empirical Part II – Buyout Firm and Manager Value Drivers 222
a more fluid dissemination of information and knowledge, which benefits organizational learning.
Hence, smaller organizations characterized by a lower number of investment managers may
contribute to closer and more effective working relationships. Equally, the average history of the
GP firm team, i.e. the time it has worked together, should produce important personal relationships
among team members that benefit team culture and work processes alike. The latter argument is
supported by research arguing that demographic similarity or homogeneity promotes behavioral
integration among members of a team (O'Reilly, Snyder et al. 1993), while diversity could be a
likely source of conflict and a deterrent to productive group functioning (Wagner, Pfeffer et al.
1984; O'Reilly, Snyder et al. 1993; Carpenter and Fredrickson 2001). However, others have argued
that the selection and socialization processes common among TMTs are likely to dampen such
conflict (Bantel and Jackson 1989). It can therefore be expected that
H34.) Gross buyout deal performance is higher for transactions, in which the average
number of hierarchies of the investment managers / GP firm team involved in a
transaction is low.
H35.) Gross buyout deal performance is higher for transactions, in which the average
number of junior investment manager professionals in the GP firm deal team involved
in a transaction is high.
H36.) Gross buyout deal performance is higher for transactions, in which the average
number of investment manager professionals in the GP firm is low.
H37.) Gross buyout deal performance is higher for transactions, in which the average
joint deal history of the investment manager professionals in the GP firm deal team
involved in a transaction is high.
5.2.1.1.5. Homogeneity Profile
As an opposing element to the benefits of diversity theory, investment professionals – as any
human beings – are naturally more likely to favor colleagues with very similar experience
backgrounds and/or age, as they can more easily establish interpersonal bonds. Homogeneity of
management teams has also been found to be a factor directly related to managerial turnover
(Wagner, Pfeffer et al. 1984). Although homogeneity can have important positive implications on
team culture through stronger behavioral integration (O'Reilly, Snyder et al. 1993), it could also
potentially be counter-productive with respect to diversity in thinking and a team’s work approach,
i.e. frequent repetition promotes development of organizational routines (Nelson and Winter 1982),
which lead to quasi-automatic behavior, reducing the level of attention. The net effect between
homogeneity and diversity, i.e. the impact on buyout value creation, could be an important
indicator towards the way, in which buyout firms could be designing their recruitment strategy of
investment professionals. This study has therefore developed homogeneity variables for all of the
above discussed variables, based on the Hirfendahl index method. Results for these homogeneity
variables will shed some light on the inherent contradiction between benefits of diversity and
homogeneity. Based on the above discussion, it can therefore be expected that

Empirical Part II – Buyout Firm and Manager Value Drivers 223
H38-46.) Gross buyout deal performance is higher for transactions, in which the
homogeneity of investment manager professionals / GP firm deal team involved in a
transaction with respect to age, Private Equity experience, tenure, history with the
team, type, level and number of degree(s), universities and hierarchies, is high.
5.2.1.2. Methodology and Data
Data in this section is based on the primary dataset (“Limited Partners data”), gathered by the
author, based on 3,009 leveraged buyout transactions undertaken by 84 General Partners and drawn
from 252 funds between 1973 and 2003 that were collected from Private Purchasing Memoranda
(PPMs) and due diligence material several large institutional investors (Limited Partners). However,
the dataset is highly heterogeneous with respect to depth of data, as General Partners differ in their
reporting approach. The biographies, although very heterogeneous, contain information on
education and degrees, professional and other relevant experience, Private Equity experience, age,
and tenure with the firm. The aggregation of this data offers far-reaching room for analysis of
investment managers’ profiles, but the required information for this analysis regarding
characteristics of individual investment managers and buyout firms is particularly sparse. First,
investment manager biographies are by and large never complete for the above outlined categories.
Secondly, the critical link between an investment manager, or team of managers, to a particular
buyout is generally only rarely reported in PPMs, which provides the link between independent
characteristics variables and the dependent variable IRR. Nevertheless, there will be results
presented based on individual investment manager’s performance.
As a result of the above information gaps, an alternative methodological approach in this section
will be to establish GP firm team profiles at the exact entry time of the focal buyout, i.e. based on
the presented information on age, tenure, Private Equity experience, etc. from the PPM reporting
year, it can be intrapolated what the experience profile of the investment manager team and its
members was several years back. It should be noted that this approach neglects historical turnover
among the team, if not reported in the PPM. However, turnover for senior members in Private
Equity firms is commonly low. Following on this point, the reported biographies commonly are
less detailed for junior investment manager professionals, if presented at all. As a consequence, in
order to establish correct and critical team size data, additional desk research was performed on the
buyout firm teams in order to strengthen the data validity. 145 The resulting sub-sample dataset for
the analysis in this section consists of N=1,422 realized buyout transactions, for which one or more
145 The biographies sometimes mention all employees at a buyout fund. The sample does therefore not
include any support staff (secretaries, etc.). It does, however, include professionals that carry out corporate functions for the fund, such as CFO, treasurer, etc., as these professionals are generally at the same time senior investment professionals. Selectively, the author has included senior professionals that are responsible for investor relations or other marketing roles, as he considers this an important function that impacts the success of a fund (e.g. indirectly through collecting capital during fundraising). However, the latter represent less than 1% of the sample. A few included investment professionals are considered “counsel”, and have a looser yet constant affiliation with the firm (e.g. consultants, advisors, legal counsel).

Empirical Part II – Buyout Firm and Manager Value Drivers 224
of the above variables is available. The database contains codified information on 1,282 investment
professionals, working for 85 leveraged buyout funds, based on the Limited Partners’ data. First,
descriptive graphical results will be presented with respect to the sample of investment managers
and buyout firms. Secondly, these characteristics will be linked to buyout performance. Finally, a
complex regression model will estimate the combined explanatory power of the constructs
summarized in table 47 towards variance in the dependent variable IRR performance.
Constructs Explanatory Variables Operationalization
Definition
Manager/ Time Experience
Average Age
Average Tenure
Average Private Equity Experience
The average years of “experience” acquired by the buyout firm investment manager team prior to the year of the focal buyout
Manager/Team Professional Experience
Sum of Network
Share of Academia, Accounting, Administrative and Public
Sector, Association involvement, Banking, Board
memberships, Consulting, Law, Management functions, Private Equity, Other
The percentage share of professional experience within the buyout team acquired by the buyout firm investment manager team until one year prior to the focal buyout
Manager/Team Education Background
Sum of Degree Type
Share of Arts, Business, Engineering, Law and Other Degrees
Sum of Degree Level
Share of Bachelor, Master, MBA, PhD/JD and Other Degrees
Sum of Degree Order
Share of 1st, 2nd, 3rd Degree
Sum of Unis
Share of individual Unis attended (not listed here)
The percentage share of educational experience within the buyout team acquired by the buyout firm investment manager team until one year prior to the focal buyout
Manager/Team Diversity and Hierarchy
Average History with Team
Sum of Hierarchies
Share of Partner, Senior, Junior Professionals on Deal
Number of Managers
The percentage share of investment professionals by hierarchy in the buyout firm one year prior to the focal buyout
Manager/Team Homogeneity
Homogeneity of Age
Homogeneity of PE Experience
Homogeneity of Tenure
Homogeneity of History with Team
Homogeneity of Network
Homogeneity of Degree Type
Homogeneity of Degree Order
Homogeneity of Degree Level
Homogeneity of Unis
Homogeneity of Hierarchy
The homogeneity of buyout manager experience (as defined above) and team hierarchy structure within the buyout firm one year prior to the focal buyout
Table 47: Operationalization of Buyout Team Characteristics Explanatory Variables

Empirical Part II – Buyout Firm and Manager Value Drivers 225
5.2.2. Investment Manager Characteristics
5.2.2.1. Age, Tenure with the Firm and Private Equity Experience
The average age of buyout fund investment professionals calculated on a sub-sample of n=800
investment managers was 39.5 years146. The minimum age relates to a junior investment analyst at
the age of 23 years, the maximum age is 71 and is attributed to a buyout fund’s partner, who joined
his firm in 1983, and the standard deviation is 10.2 years.147 Naturally, the distribution peaks
around the more numerous junior investment professionals, approximately at the age of 33, and
declines quickly from the age of 40, a time when mid-level fund professionals are either promoted
to partner status or leave the firm. Between 49 and 58 years, the distribution remains constant,
indicating that the partner promotion selection processes stops after the age of 48 on average, and
that the number of successful partners that remain in their position does not fluctuate very much.
Retirement more or less gradually begins from year 59 onwards.
0
5
10
15
20
25
30
35
40
45
23 28 33 38 43 48 53 58 63 68
Age (Years)
Fre
qu
en
cy
Frequency of Age of Buyout Fund Professionals Polynomic Trend
Average Age = 39.5 yrs
Figure 88: Distribution of Age of Buyout Fund Investment Professionals
Source: INSEAD Buyout Investment Manager Database, analyzed by author (N=800).
The distribution of tenure of investment professionals at buyout funds naturally follows the trend
observed for the age frequencies. The average tenure of 7.6 years for buyout fund investment
professionals is calculated on a sub-sample of n=914 investment managers, as of 2003. The
minimum tenure was zero and must therefore relate to junior investment analysts hired in 2003.
146 Due to the heterogeneous dataset on the 1,282 investment managers, sub-sample sizes will differ
throughout this section. 147 Due to the confidentiality agreements between the data providing Limited Partner as well as the author
and the INSEAD Buyout Centre, no names of individual General Partners or investment professionals will be used in this study. Furthermore, it is clearly intended by the author to avoid making any specific references and to present non-aggregated findings that could identify either specific firms or individuals.

Empirical Part II – Buyout Firm and Manager Value Drivers 226
The maximum tenure of 33 years is attributed to a veteran European buyout fund partner, who
joined his firm in 1970. The standard deviation is 5.6 years. The distribution reveals that (i) there
are few remaining early founders of the buyout business that started before 1980, (ii) there was a
steady increase in the number of buyout professionals during the 1980s, and (iii) there was a
particular strong hiring of (junior) investment professionals between 1995 and 2000. As the tenure
information results from the same funds over time, this strong increase in recent years can be
interpreted as a reaction of (i) increased fund sizes, deal activity and average deal sizes that require
more investment professionals to execute transactions, and (ii) a professionalization of buyout
organizations, which traditionally were characterized as lean, non-hierarchic organizational
structures.
0
20
40
60
80
100
120
140
0 1 2 3 4 5 6 7 8 9 10 11 12 13 14 15 16 17 18 19 20 21 22 25 26 28 29 30 31 32 33
Tenure with Buyout Fund (Years)
Fre
qu
en
cy
Frequency of Tenure of Buyout Fund Professionals Polynomic Trend
Average Tenure = 7.6 yrs
Figure 89: Distribution of Tenure of Buyout Fund Investment Professionals
Source: INSEAD Buyout Investment Manager Database, analyzed by author (N=914).
Likewise, the distribution of the total years of experience in the Private Equity industry is very
similar to the tenure of investment professionals at buyout funds, as shown in figure 90. The
average years of Private Equity experience among buyout fund investment professionals was 8.4
years, calculated on a sub-sample of n=914 investment managers, as of 2003. The minimum
experience was zero again while the maximum experience rests with a veteran U.S. buyout fund
partner, who starting working in the Private Equity industry in 1969. The standard deviation of
experience is 6.0 years. In summary, we can conclude from the comparison of distribution and
average tenure with distribution and average experience of buyout fund professionals that the
turnover in this industry has traditionally been very low.148
148 To clarify the interpretation, Private Equity experience does not necessarily need to equal at least tenure
with the firm, since as a result of the turnover of professionals and senior experienced hires, the two

Empirical Part II – Buyout Firm and Manager Value Drivers 227
0
20
40
60
80
100
120
0 1 2 3 4 5 6 7 8 9 10 11 12 13 14 15 16 17 18 19 20 21 22 23 25 26 28 29 30 31 32 33 34
Private Equity Experience (Years)
Fre
qu
en
cy
Frequency of PE Experience of Buyout Fund Professionals Polynomic Trend
Average Private Equity Experience = 8.4 yrs
Figure 90: Distribution of Private Equity Experience of Buyout Fund Investment Professionals
Source: INSEAD Buyout Investment Manager Database, analyzed by author (N=914).
5.2.2.2. Education of Buyout Fund Investment Professionals
The level of education, professional qualification and overall personal skill set that is necessary to
enter and succeed in the Private Equity industry is extraordinarily high compared to other
industries. This is a result of the variety of tasks and roles that investment professionals need to
cope with in day to day business. On the one side, strong analytical and financial skills and
business judgment are compulsory to search for acquisition targets, execute transactions and
monitor their performance subsequently. On the other side, strong interpersonal and negotiation
skills are required to deal with the various parties – lawyers, bankers, accountants, consultants,
portfolio company management and its shareholders – involved in transactions. Furthermore,
specific industry knowledge may be mandatory if the buyout fund is specializing on specific
industry sectors, such as media, telecom and technology, luxury goods or aerospace and defense.149
Consequently, requirements and competition for investment manager positions is intense. The
following results summarize the educational profile of buyout fund investment managers to provide
an overview of their skill set.
distributions can vary. Consequently, the comparison of the two distributions hints at potential hiring and turnover trends.
149 US Private Equity firm Veronis, Suhler & Co. is specializing on media transactions, Providence Capital Partners on cable and telecommunications deals, the Italian Opera Fund focuses on buyouts in the luxury goods sector and Carlyle is famous for its expertise in the aerospace and defence sector.
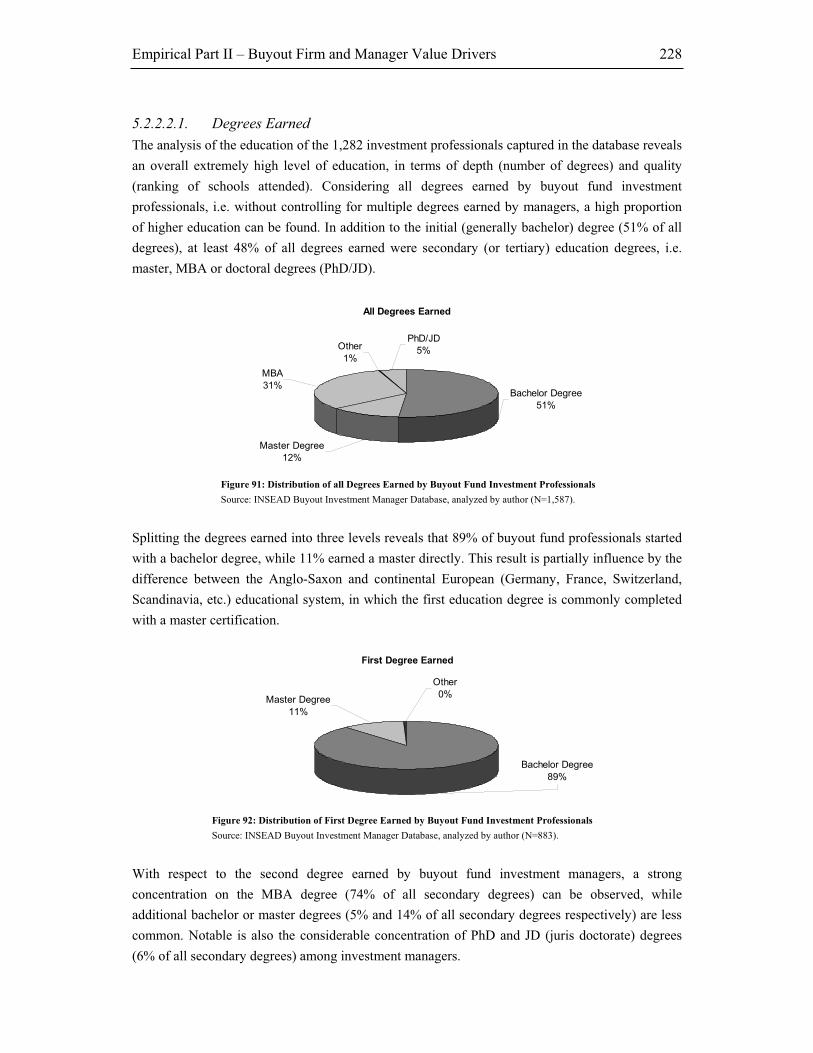
Empirical Part II – Buyout Firm and Manager Value Drivers 228
5.2.2.2.1. Degrees Earned
The analysis of the education of the 1,282 investment professionals captured in the database reveals
an overall extremely high level of education, in terms of depth (number of degrees) and quality
(ranking of schools attended). Considering all degrees earned by buyout fund investment
professionals, i.e. without controlling for multiple degrees earned by managers, a high proportion
of higher education can be found. In addition to the initial (generally bachelor) degree (51% of all
degrees), at least 48% of all degrees earned were secondary (or tertiary) education degrees, i.e.
master, MBA or doctoral degrees (PhD/JD).
All Degrees Earned
MBA
31%
Master Degree
12%
Bachelor Degree
51%
PhD/JD
5%Other
1%
Figure 91: Distribution of all Degrees Earned by Buyout Fund Investment Professionals
Source: INSEAD Buyout Investment Manager Database, analyzed by author (N=1,587).
Splitting the degrees earned into three levels reveals that 89% of buyout fund professionals started
with a bachelor degree, while 11% earned a master directly. This result is partially influence by the
difference between the Anglo-Saxon and continental European (Germany, France, Switzerland,
Scandinavia, etc.) educational system, in which the first education degree is commonly completed
with a master certification.
First Degree Earned
Bachelor Degree
89%
Master Degree
11%
Other
0%
Figure 92: Distribution of First Degree Earned by Buyout Fund Investment Professionals
Source: INSEAD Buyout Investment Manager Database, analyzed by author (N=883).
With respect to the second degree earned by buyout fund investment managers, a strong
concentration on the MBA degree (74% of all secondary degrees) can be observed, while
additional bachelor or master degrees (5% and 14% of all secondary degrees respectively) are less
common. Notable is also the considerable concentration of PhD and JD (juris doctorate) degrees
(6% of all secondary degrees) among investment managers.

Empirical Part II – Buyout Firm and Manager Value Drivers 229
Second Degree Earned
MBA
74%
Master Degree
14%
Bachelor Degree
5% PhD/JD
6%
Other
1%
Figure 93: Distribution of Second Degree Earned by Buyout Fund Investment Professionals
Source: INSEAD Buyout Investment Manager Database, analyzed by author (N=618).
The analysis of the tertiary degree earned shows that both the MBA and PhD/JD degree dominate
on this level (40% of all tertiary degrees respectively). Buyout fund investment managers had prior
typically earned at least one bachelor/master degree. However, the total number of degrees on the
tertiary level is only n=86, hence the most common educational profile of fund investment
managers involves a bachelor/master and MBA combination.
Third Degree Earned
PhD/JD
40%
Bachelor Degree
7%
Master Degree
13%
MBA
40%
Figure 94: Distribution of Third Degree Earned by Buyout Fund Investment Professionals
Source: INSEAD Buyout Investment Manager Database, analyzed by author (N=86).
5.2.2.2.2. Additional Professional Qualifications
The analysis of the buyout fund investment manager’s educational background also captured non-
university qualifications. These professional qualifications are generally completed during pre-
buyout fund manager professions in banking or auditing. Eight per cent of investment managers
hold a qualification as chartered public accountant (CPA) and one per cent are chartered financial
analysts (CFA). The CPA qualification is an indication of the high level of financial analysis
capabilities that buyout fund managers must bring to the job. The CFA qualification has become a
very frequent among related types of asset management professionals; hence the low frequency
among buyout fund professionals is a somewhat surprising result.

Empirical Part II – Buyout Firm and Manager Value Drivers 230
Professional Qualifications
No extra
Qualification
91%
Chartered
Financial Analyst
Qualification
1%
Chartered Public
Accountant
Qualification
8%
Figure 95: Additional Professional Qualifications Earned by Buyout Fund Investment Professionals
Source: INSEAD Buyout Investment Manager Database, analyzed by author (N=1,153).
5.2.2.2.3. Fields of Degrees Earned
The analysis of the field of educational background of investment managers clearly indicates the
focus on business, commerce, finance and accounting education (60% of all degrees earned) as key
preparation for the Private Equity job. Technical knowledge, represented through 9% of
engineering degrees earned, appears to be less critical for investment managers. Despite a strong
component of negotiations and contract-making with financing banks and target sellers, the law
degree (6% of all degrees earned) is also not very frequent among investment managers.
Field of All Degrees Earned
Engineering
Degree
9%
Business,
Commerce,
Finance and
Accounting
Degree
60%
Arts Degree
6%
Other Degree
19%
Law Degree
6%
Figure 96: Field of all Degrees Earned by Buyout Fund Investment Professionals
Source: INSEAD Buyout Investment Manager Database, analyzed by author (N=1,303).
However, examining the fields of education separately on the primary, secondary and tertiary level
demonstrates that the diversity is far larger for the first degree. The arts degree (11% of all primary
degrees), engineering degree (14% of all primary degrees) and high level of other degrees (35% of
all primary degrees) indicate that two thirds of buyout fund managers also have a non-business
background, which points to a broader than initially anticipated level of expertise in other (social)
studies or technical expertise.

Empirical Part II – Buyout Firm and Manager Value Drivers 231
Field of First Degree Earned
Law Degree
2%
Other Degree
35%Arts Degree
11%
Business,
Commerce,
Finance and
Accounting
Degree
38%
Engineering
Degree
14%
Figure 97: Field of first Degree Earned by Buyout Fund Investment Professionals
Source: INSEAD Buyout Investment Manager Database, analyzed by author (N=631).
The second degree is clearly dominated by business studies, as previously shown by the high
frequency of MBA degrees earned. It therefore becomes clear that in contrast to the observed
greater diversity on the initial degree, the subsequent completion of a business related degree can
almost be considered as prerequisite for a career as buyout fund investment manager.
Field of Second Degree Earned
Engineering
Degree
3%
Business,
Commerce,
Finance and
Accounting
Degree
85%
Arts Degree
1% Other Degree
4%
Law Degree
7%
Figure 98: Field of second Degree Earned by Buyout Fund Investment Professionals
Source: INSEAD Buyout Investment Manager Database, analyzed by author (N=597).
As demonstrated in the above degree analysis, the third degree earned is dominated by the MBA
degree as well as (business, engineering, arts) PhDs and law doctorates (JDs), thus the business
(58% of all tertiary degrees) and law degree (24% of all tertiary degrees) dominate the results for
the third degree.
Field of Third Degree Earned
Law Degree
24%
Other Degree
5%
Arts Degree
5%
Business,
Commerce,
Finance and
Accounting
Degree
58%
Engineering
Degree
8%
Figure 99: Field of third Degree Earned by Buyout Fund Investment Professionals
Source: INSEAD Buyout Investment Manager Database, analyzed by author (N=75).

Empirical Part II – Buyout Firm and Manager Value Drivers 232
5.2.2.2.4. Buyout Investment Manager University Ranking
In addition to a great depth and frequency of higher education among buyout fund investment
professionals, also the average quality of institutions visited by active professionals is at an
extremely high level in this industry. Hence, the general notion that “only the best and brightest”
business study professionals will receive the opportunity to follow a career in the buyout industry is
substantiated by the analysis of universities attended. The below chart summarizes the frequencies
of degrees earned at specific institutions. Over 14% of degrees earned by buyout fund professionals
(globally) were therefore completed at Harvard University.150 This is followed by Wharton (7.5%
of all degrees), Stanford (4.2% of all degrees) and Columbia (3.2% of all degrees). The most
frequently visited European universities and/or business schools were Cambridge University (1.4%
of all degrees), Oxford University (1.0% of all degrees) and INSEAD (1.0% of all degrees). At the
University of St. Gallen, buyout fund investment managers earned 0.6% of the total degrees earned
(globally).
0,6%
0,6%
0,6%
0,7%
0,7%
0,7%
0,8%
0,8%
0,8%
0,9%
0,9%
0,9%
1,0%
1,0%
1,1%
1,1%
1,1%
1,3%
1,3%
1,4%
1,5%
1,8%
1,8%
1,9%
2,0%
2,0%
2,2%
3,2%
4,2%
7,5%
14,3%
0% 2% 4% 6% 8% 10% 12% 14% 16%
University of St. Gallen
Colgate Darden Business School / Uni Virginia
London Business School
University of Illinois at Urbana-Champaign
Amherst College
University of Texas
London School of Economics
Duke
Queen's University
MIT
Stockholm School of Economics
INSEAD
Cornell
Oxford University
Brown University
NYU/Stern
University of Notre Dame
Georgetown
University of Virginia
Cambridge University
Amos Tuck School of Business Administration
University of Chicago
Yale University
Kellogg, Northwestern University
UCLA
Princeton University
Michigan
Columbia
Stanford
Wharton
Harvard
Degrees Earned by Uni (%)
Figure 100: Top 31 Universities – All Degrees Earned by Buyout Fund Investment Professionals
Source: INSEAD Buyout Investment Manager Database, analyzed by author (N=1,581).
150 Includes all faculties and degree levels, i.e. in this case Harvard Business School, Harvard Law School,
Harvard Kennedy School of Governance and Harvard University. The same holds true for all other Universities.

Empirical Part II – Buyout Firm and Manager Value Drivers 233
These results have to be put into perspective to the underlying sample, which includes a majority of
U.S. domiciled rather than European domiciled buyout funds and is therefore to some extent
skewed towards U.S. schools. 151 However, also European buyout investment professionals
frequently gain U.S. degrees, especially due to the higher density of top U.S. universities/ business
schools that offer MBA courses. On the other side, the higher proportion of U.S. schools it is also
enhanced through the effect that the average U.S. investment professional gains his undergraduate
and (post)graduate (MBA or PhD/JD) degrees at different universities, while under the
(continental) European education system investment professionals are more inclined to receive
their undergraduate (if existent) and (post)graduate (master or PhD/JD) degrees from the same
university.152
5.2.2.2.5. Buyout Investment Manager Business School Ranking
The importance of receiving an MBA qualification for a career as buyout investment manager
appears to be crucial, as demonstrated above. The results of the analysis with respect to which top
business schools were attended by buyout fund investment professionals is very much comparable
to the frequently publicized official business school rankings.153 Most strikingly, the frequency
ranking shows that more than a third (33.9% of all MBAs earned) of buyout investment
professionals has gained their MBA at Harvard Business School. The clear dominance of the
“Harvard Club” in the buyout industry is followed by Wharton (8.9% of all MBAs earned),
Stanford (7.3% of all MBAs earned), Columbia (6.7%) and University of Chicago (4.7%). Among
European business schools, INSEAD takes position six with 3.0% of all MBAs earned and London
Business School (LBS) with 1.0%.
1,0%
1,0%
1,2%
1,8%
2,2%
2,4%
3,0%
4,7%
6,7%
7,3%
8,9%
33,9%
0% 10% 20% 30% 40%
London Business School
MIT
UCLA
Amos Tuck School of Business Administration
NYU/Stern
Kellogg, Northwestern University
INSEAD
University of Chicago
Columbia
Stanford
Wharton
Harvard
MBA Degrees Earned by Uni (%)
Figure 101: Top 12 Universities – MBA Degrees Earned by Buyout Fund Investment Professionals
Source: INSEAD Buyout Investment Manager Database, analyzed by author (N=492).
151 Expressed as a split of underlying transactions, the ratio is approximately 60/40 for U.S./Europe. 152 For example, the master degree earned at the University of St. Gallen should count double (as
undergraduate and master degree) in an international comparison. 153 For example, the Financial Times or Newsweek business school rankings.

Empirical Part II – Buyout Firm and Manager Value Drivers 234
The dominance of Harvard Business School MBAs in the buyout industry certainly deserves
further scrutiny. Explanations for this high density could either be seen in (i) HBS’s most complete
curriculum and/or superior faculty as preparation for a career in the buyout industry, or (ii) an
unparalleled network system among Harvard alumni, which to a great extent participated in the
early foundation of the buyout industry in the 1970s, and new graduates that gives recruiting
preference to MBAs from this institution.154
5.2.2.3. Professional Experience and Network of Buyout Investment Managers
In addition to a high quality academic education, buyout fund investment professionals have
assembled far-reaching experience on the job. They received professional training with the world’s
leading financial institutions, law firms, consultancies and in the industry. In addition, they
developed strong political ties to the public sector and government agencies by assuming important
positions. They also strengthen the link to academia to have first hand access to research as well as
engage strongly in non-profit, social and charitable organizations. The following chart (figure 102)
summarizes all of the nearly 4,800 positions held currently or in the past by buyout investment
managers in the sample.155
Accounting
3%Other
3%
Positions in
Academia
3%
Public and
Political Positions
2%
Law
2%
Positions in
Associations
4%
Private Equity
10%
Banking &
Finance
17%Chairman or
Member of Board
42%
Consulting
4%
Management
Positions
10%
Figure 102: Network, Professional Experience and Current Positions of Buyout Fund Investment Professionals by Sector
Source: INSEAD Buyout Investment Manager Database, analyzed by author (N=4,768).
154 Examples of well-known Harvard Business School MBA graduates that acted as founders of the buyout
industry include Stephen A. Schwarzman, co-founder of The Blackstone Group, Sir Ronald Cohen, Chairman of Apax Partners and Daniel A. D’Aniello, co-founder of Carlyle. Joseph L. Rice III., co-founder of Clayton, Dubilier & Rice (CD&R) graduated from Harvard Law School.
155 The data collection process from the Limited Partner data prohibited a strict differentiation between prior and current professional positions of investment managers, as many of these cannot be assigned to either period (e.g. engagement in industry associations and academia). Generally speaking, it is sensible to say that law, banking and finance, consulting positions were held in the past before joining the fund. So were most of the top management positions in corporations. Active portfolio management of the fund should not be considered as operational management on the company level, but rather supervision through board directorship. The board positions therefore include both, key board positions held in the past as well as positions held at (current) portfolio companies of the fund.

Empirical Part II – Buyout Firm and Manager Value Drivers 235
The majority of “Chairman or Member of the Board” positions held (42% of all positions held) are
related to current and some of the major board directorship positions accepted prior to joining the
fund. In general, several senior buyout fund investment managers gain board responsibilities (and
chairmanship) at the time of the acquisition of the target. However, they may also sit on a range of
boards at companies that are not portfolio companies of their fund. Management positions account
for 10% of all positions (previously) held by investment managers, which mainly consist of
positions of founder, president, chief executive officer (CEO), chief financial officer (CFO), chief
operating officer (COO) as well as other top management positions, such as group or divisional
heads.
Category Sample Positions Sample Firms/Institutions Banking and
Finance
Financial Analyst M&A and Financial Sponsor Coverage Head of M&A Department German M&A Team Private Equity Team Managing Director Partner Investment Analyst Head of Specialised and Acquisition Finance Member
Glodman, Sachs & Co Morgan Stanley Svenska Handelsbanken WestLB Panmure Donaldson, Lufkin & Jenrette Drexel Burnham Lambert Inc. Lazard Freres & Co. Mutual Asset Management Ltd. Hong Kong and Shanghai Banking Corp. (HSBC) J.P. Morgan Investment Management
Private Equity Associate Managing Director Associate Board of Directors Associate Director European Head Head of Country Office Vice President Vice President
The Carlyle Group Thomas H. Lee Company The Blackstone Group AFIC Clayton Dubilier & Rice INVESCO Ventures Goldman Sachs Mezzanine Partners 3iCiticorp Venture Capital DLJ Merchant Banking Partners
Consulting Senior Engagement Manager Manager Managing Director Partner Co-head of Financial Service Practice Partner
McKinsey & Company, Inc Boston Consulting Group Booz, Allen & Hamilton, Inc Monitor & Company Bain & Company Anderson Consulting
Accounting Chartered Accountant Partner Member of Turnaround Team CEO and President Transaction Services Group
Price Waterhouse Coopers & Lybrand Arthur Andersen & Co. Deloitte Ernst & Young
Law Partner Lawyer Managing Director Associate Law Clerk to Justice
Simpson, Thacher & Bartlett Fried Frank Harris Shriver and Jacobson Weil, Gotshal & Manges LLP. Gibson, Dunn & Crutcher United States Supreme Court
Table 48: Examples of Positions and Institutions of Buyout Fund Investment Managers by Profession
Source: INSEAD Buyout Investment Manager Database, analyzed by author.
With respect to professional background, the large majority of investment managers have worked
in the financial services industry (17% of all positions held) before joining the buyout fund. To a
very large extent, the main global investment banks dominate as former employers, but also
regional (and European) and boutique corporate finance houses as well as some fund management
and insurance companies served as grounds to gain professional experience. Furthermore, a
significant number of buyout fund professionals have gained prior Private Equity experience before
joining their fund (10% of all positions held). These prior Private Equity positions, on the one hand,
Empirical Part II – Buyout Firm and Manager Value Drivers 236
include other buyout funds, which supports the hypothesis that there is a certain amount of turnover
in the industry. On the other hand, this category comprises a range of Venture Capital fund
positions, suggesting that investment managers are also switching from the entrepreneurial start-up
and venture investment side to the buyout investment business, which focuses on more mature
companies. This category also contains positions held within the merchant banking operations of
the large investment banks, which has been a natural hiring area for buyout firms.
The positions held by investment managers in the consulting industry (4% of all positions held)
mainly concern the main global strategy consultancies such as McKinsey & Co., The Boston
Consulting Group, Bain & Company, etc. Similarly, the key accounting positions (4% of all
positions) were held at the “Big Four (Five, Six before mergers/bankruptcy)” accounting firms such
as Price Waterhouse, Coopers & Lybrand, (former) Arthur Andersen, KPMG, Deloitte & Touche
and Ernst & Young. By contrast, the diversity among prior positions held among the universe of
law firms (2% of all positions) is very large. Table 48 provides further examples of positions and
institutions, indicating the professional backgrounds of buyout investment managers.
The hypothesis that their strong network assists buyout fund professionals to enhance their
competitive position, i.e. to originate superior proprietary deal flow of attractive target companies
and/or to negotiate transactions favourably, finds evidence in the vast diversity of positions held –
currently and in the past – in the non-financial community. First, investment managers have steady
relations to the public sector and with government agencies (2% of all positions).156 They held
and/or maintain positions at high-ranking government committees, counsels and boards of directors
of the (U.S.) Congress and Senate, government departments (trade, industry, and foreign relations),
the central bank, the national stock exchanges, etc. Buyout fund professionals are therefore well-
positioned to lobby their (investment) interests politically and may also contribute to initiate new
legislation. Table 49 provides examples of positions and institutions of the corporate background
and further network of buyout investment managers.
Furthermore, buyout firms sustain relationships with the academic world, generally through
connections created at business schools (3% of all positions). They sponsor faculties and
institutions and also engage in the curriculum themselves as lecturers. They frequently are
appointed to the board of trustees of top universities’ funds. They are therefore at the forefront of
research in the field of Private Equity, Venture Capital and Leveraged Buyouts and at the same
time receive prime access to potential new hires. Finally, investment professionals actively
maintain key positions in Private Equity industry associations or in national industry associations
(4% of all positions held), thus retaining a platform to actively express and lobby their interests. In
addition, it should be highlighted that this category also contains a large number of affiliations of
buyout fund professionals, which relate to (personal and/or via fund) sponsorships of social,
cultural, communal and charitable organizations.
156 This category also includes former members of the armed forces (mostly in the US).

Empirical Part II – Buyout Firm and Manager Value Drivers 237
Category Sample Positions Sample Firms/Institutions Board of
Directors
Member of the Board of Directors (Vice) Chairman of the Board
n/a
Management President and CEO Chief Operating Officer Co-Founder CFO of Italian Subsidiary Executive Vice President Managing General Partner Vice President of Development
n/a
Public and
Political
Secretary of Commerce Member of the Legal Advisory Member National co-chair Counsellor to the President U.S. Ambassador Head of Department Board Member Assistant Secretary for Financial Market Head of Energy Division Captain Commander Chairman
Nixon White House New York Stock Exchange President Clinton’s cabinet Privatization Council President Clinton’s Administration United Nations French Ministry of Industry St. Louis Federal Reserve Board U.S. Treasury World Bank U.S. Air Force U.S. Navy Steering Committee of the President’s Working Group on Financial Markets
Academia Member of the Board of Trustees Visiting Scholar Regular Lecturer Faculty Advisory Board Member Advisor in Research Studies
Rockefeller University Harvard Law and Business School University of Chicago Princeton University National Economic Research Institute University of Munich
Associations Director Advisory Board Member Board of Directors Member President President and CEO Member of the Board of Directors Trustee Secretary
National Venture Capital Association European Venture Capital Association District of Columbia Bar National Financial Partners Corporation The Business Council Metropolitan Museum of Art J. Paul Getty Trust Hirshhorn Museum London Philharmonic Orchestra Swiss Private Equity & Corporate Finance Association
Table 49: Examples of Positions and Institutions of Buyout Fund Investment Managers by Profession or Affiliation
Source: INSEAD Buyout Investment Manager Database, analyzed by author.
5.2.3. General Partner Firm Characteristics
5.2.3.1. Average Buyout Firm Team Size and Hierarchy
Buyout funds are well-known to have very small, effective teams and flat hierarchies. In general,
between one and two junior buyout professionals, analyst and/or associate, work(s) together with
one senior buyout professional, either a director or partner, on a specific investment opportunity.
The deal team is expanded according to the amount of due diligence work involved in a transaction
and also depends on the deal’s execution status, but even multi-billion dollar transactions are
frequently handled by only a very small team of up to four or five buyout professionals. These
extremely effective and efficient flat team structures allow an unproblematic flow of information
between team members. The split of tasks within these teams is not necessarily defined narrowly,
as even senior buyout professionals may get deeply involved in financial and business due
diligence. Nonetheless, their main area of expertise is focused on generating deal flow, pitching
ideas about potential transactions to senior corporate management and their shareholders,

Empirical Part II – Buyout Firm and Manager Value Drivers 238
networking within the financial community and to lead negotiations. Junior members are
responsible for the in-depth analysis of potential targets. It is not unusual that annually up to 200
investment opportunities are evaluated for investment in depth by buyout firms and several
hundred more are closely followed with respect to their financial performance and corporate events
in order to make an eventual opportunistic approach successful.157
In general, a buyout fund’s hierarchical structure consists of three levels, plus one level of fund
support functions. The lowest level consists of junior investment professionals. Analysts are
generally hired with 2-3 years of professional experience (mainly in banking and finance, but also
consulting, etc.). They may either remain with the fund (more frequent in Europe), but often leave
for business school (more frequent in the U.S.) after approximately three years. Associates are
hired with top MBA degrees and similar experience. After three to four years, the first major
promotion decision is taken with respect to investment director status.158 While the analytical and
execution tasks characterize the analyst and associate junior level, the director status involves
management activities, including active deal origination, negotiations and transaction execution
responsibility. After at least another five years, the buyout fund’s partners decide about promotion
to partner status. Partners are actively involved with deal origination and negotiations and they take
ultimate decisions on opportunities through the fund’s investment committee. Moreover, they also
play an important role in representing the buyout fund towards current and potential new investors.
Chief Financial Officer (CFO), Controller, Treasurer, Group President, Vice Presidents for
Finance/Administration/Operations/Debt Financing, Marketing Associate, Solicitor & Head of Legal Affairs, Head of
Human Resources, Director for Portfolio Management/European Development, Finance/Investor Relations
Director, Non-Executive, Consultant, Advisory Board
AVERAGE NON-EXECUTIVE BUYOUT PROFESSIONALS: 2.6
(Business) Analyst, (Senior) Associate, Investment Manager, Investment Executive
AVERAGE JUNIOR EXECUTIVE BUYOUT PROFESSIONALS: 3.8
Director, Associate Director, Investment Director,
Vice President, Principal, Partner
AVERAGE SENIOR EXECUTIVE BUYOUT PROFESSIONALS: 5.2
(Co-) Founding Principal/Partner,
(Vice/Executive) Chairman,
(Managing) Chief Executive Officer,
Managing Partner/Director, Senior
Partner/Director/Principal
AVERAGE BUYOUT FUND OWNER: 6.5
Figure 103: Typical Buyout Fund Hierarchy and Functions with Average Number of Investment Professionals per Level
Source: INSEAD Buyout Investment Manager Database, analyzed by author (N=650).
157 Source: expert interview with major U.S. Buyout Fund. 158 Hierarchical position names vary across the Private Equity industry, see figure 103 below for an overview.

Empirical Part II – Buyout Firm and Manager Value Drivers 239
Besides the executive investment professionals, there is a range of management functions that
support the fund. The extent of these functions may depend on the fund size and investment
complexity, but frequent positions found include a group CFO, controller or portfolio (company)
manager as well as a marketing and investor relations manager. With respect to staffing levels, the
typical buyout fund resembles an inverse pyramid. On average, a buyout fund has 6.5 partners, 5.3
directors, 3.8 junior investment professionals and 2.6 corporate functions. 159 These numbers
underline the high efficiency with which buyout organisations are operating.
The growth (in deal sizes), competition (by more players) and professionalization (e.g. seller’s
motivation and use of sell-side advice) in the buyout industry have increased the overall complexity
of undertaking transactions. The emergent trend of auctions (compare section 4.3.9.1.) has reduced
the overall success rate and ratio of acquired vs. targeted transactions for individual buyout funds.
In addition, the supply and demand structure for buyout transactions has shifted unfavourably
towards larger deal sizes. However, the market for small- and mid-cap transactions remains far
larger than the large-cap and public to private market. The rapidly increasing fund sizes and
therefore larger amount of capital to be invested has led buyout investment managers to constantly
(i) target an ever-increasing number of acquisition opportunities, (ii) target larger deals to put more
of the fund’s money “at work”. It should also be acknowledged that there is a materialistic
incentive for investment managers to increase overall fund and deal sizes, as they equally
participate in this growth through larger fund management fees and carried interests. These factors
have made the recruitment of more junior and senior buyout fund professionals compulsory (as
seen in the recent large increases in the graphs for age, tenure and Private Equity experience).
22
32
13 13
7
15
24
62
17
24
33
42
2,5
0,7
1,3
1,6
0
10
20
30
40
50
60
70
1 - 10 11 - 20 21 - 30 31<
Fre
qu
en
cy a
nd
Avera
ge T
eam
Siz
e
Avera
ge D
eal
Siz
e (
US
$ m
m)
0
0,5
1
1,5
2
2,5
Avera
ge D
eal
Siz
e p
er
Pro
fessio
nal
(US
$ m
m)
Number of GPs in Category Average GP Team Size
GP Average Deal Size Average Deal Size per Buyout Professional
Figure 104: Average GP Team Size and Size Category Frequency vs. Average Deal Size of Buyout Funds
Source: INSEAD Buyout Investment Manager Database, analyzed by author (GP N=80).
159 The average buyout fund team size is approximately 22, hence the missing 4 individuals in this
presentation could not be statistically assigned due to lack of more detailed information. In general, these are more likely to be junior or support staff, as the underlying Limited Partner data source of Private Purchasing Memoranda tends to be more complete on biographies of the buyout fund’s senior professionals.

Empirical Part II – Buyout Firm and Manager Value Drivers 240
The overall average buyout fund team has 22 buyout professionals. The majority of buyout funds
have even smaller teams: among all buyout funds, 28% have between 1-10 professionals (average
of 7) and 40% of all funds have between 11-20 professionals (average of 15). Only 16% of all
funds have between 21-30 (average of 24) and 31 and more employees (average of 62). The latter
category shows that in contrast to the on average small teams, some large funds have assembled
significantly larger, more professionalized teams.
The illustration proofs the hypothesis that larger deal teams also execute larger transactions. The
average deal size undertaken by Buyout teams that are larger in size than 31 individuals was
US$ 42 million of committed equity capital, which compares to only US$ 17 million among teams
that consist of up to 10 buyout professionals. However, the average deal size per investment
professional is steadily decreasing with increasing deal team size. This could potentially have far-
reaching implications on remuneration of buyout fund professionals, as in contrast to expectations
that through increasing fund and transaction sizes more rewards can be earned, the spread of those
rewards across a larger number of professionals may not guarantee more absolute returns for the
partners. In order to preserve their share, buyout fund partners may be inclined to distribute carry
only to more senior employees. This expected response by large and heavily recruiting buyout
funds can currently be observed through compensation trends in the industry, by which junior
professionals only receive a fixed salary and capped performance based boni.
5.2.4. Performance of Buyout Firms
In the first empirical chapter, it was established from the Limited Partners’ data that buyouts appear
to create superior value when compared to public market indices. On a more detailed view, some
industries have demonstrated to offer more value creation potential and buyout returns are to some
extent also dependent on economic cycles and industry dynamics. Moreover and to the latter point,
there is clear evidence that financial accounting performance in the respective buyout deal’s
industry also determines the success of buyouts. Based on the Venture Economics dataset, overall
(net) fund returns to investors of a large sample of buyout funds were also examined. However, so
far, the question of how much value the General Partner (GP), i.e. the buyout organization with its
team of investment professionals, is able to contribute to the value creation process remains
unanswered. The next sections will therefore answer what the “GP effect” during the value creation
process is, what the distribution of GP returns is and which of the GP’s characteristics are driving
superior returns.
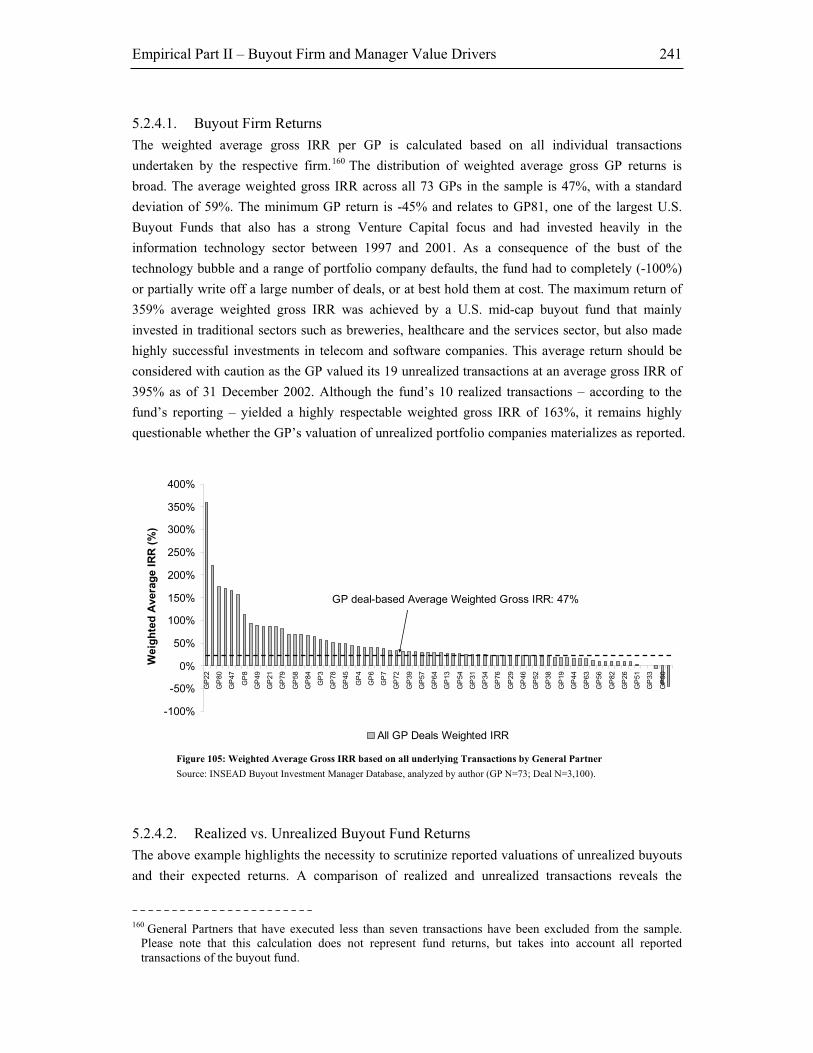
Empirical Part II – Buyout Firm and Manager Value Drivers 241
5.2.4.1. Buyout Firm Returns
The weighted average gross IRR per GP is calculated based on all individual transactions
undertaken by the respective firm.160 The distribution of weighted average gross GP returns is
broad. The average weighted gross IRR across all 73 GPs in the sample is 47%, with a standard
deviation of 59%. The minimum GP return is -45% and relates to GP81, one of the largest U.S.
Buyout Funds that also has a strong Venture Capital focus and had invested heavily in the
information technology sector between 1997 and 2001. As a consequence of the bust of the
technology bubble and a range of portfolio company defaults, the fund had to completely (-100%)
or partially write off a large number of deals, or at best hold them at cost. The maximum return of
359% average weighted gross IRR was achieved by a U.S. mid-cap buyout fund that mainly
invested in traditional sectors such as breweries, healthcare and the services sector, but also made
highly successful investments in telecom and software companies. This average return should be
considered with caution as the GP valued its 19 unrealized transactions at an average gross IRR of
395% as of 31 December 2002. Although the fund’s 10 realized transactions – according to the
fund’s reporting – yielded a highly respectable weighted gross IRR of 163%, it remains highly
questionable whether the GP’s valuation of unrealized portfolio companies materializes as reported.
-100%
-50%
0%
50%
100%
150%
200%
250%
300%
350%
400%
GP
22
GP
80
GP
47
GP
8
GP
49
GP
21
GP
79
GP
58
GP
84
GP
3
GP
78
GP
45
GP
4
GP
6
GP
7
GP
72
GP
39
GP
57
GP
64
GP
13
GP
54
GP
31
GP
34
GP
76
GP
29
GP
46
GP
52
GP
38
GP
19
GP
44
GP
63
GP
56
GP
82
GP
26
GP
51
GP
33
GP
50
Weig
hte
d A
vera
ge I
RR
(%
)
All GP Deals Weighted IRR
GP deal-based Average Weighted Gross IRR: 47%
Figure 105: Weighted Average Gross IRR based on all underlying Transactions by General Partner
Source: INSEAD Buyout Investment Manager Database, analyzed by author (GP N=73; Deal N=3,100).
5.2.4.2. Realized vs. Unrealized Buyout Fund Returns
The above example highlights the necessity to scrutinize reported valuations of unrealized buyouts
and their expected returns. A comparison of realized and unrealized transactions reveals the
160 General Partners that have executed less than seven transactions have been excluded from the sample.
Please note that this calculation does not represent fund returns, but takes into account all reported transactions of the buyout fund.

Empirical Part II – Buyout Firm and Manager Value Drivers 242
different level of return expectations of General Partners. Exceptionally high expected returns from
unrealized transactions should generally be questionable. Even under conditions that there is solid
evidence that exits may be highly profitable, the observed high valuations still point to aggressive
accounting practices of some funds. There is an overall lack of detailed regulation with respect to
valuation of unrealized transactions by either an U.S. or European regulator. However, a
commission set up by the American National Venture Capital Association (NVCA) and the
European Venture Capital Association (EVCA) in the early 1990s led to the publication of some
generally accepted accounting guidelines for Private Equity transactions in 1993. Following the
burst of the technology bubble (and alongside Private Equity portfolios’ over-valuation), these
initial guidelines were substantially expanded and/or further refined with the objective to create a
common code of conduct, governing principles, valuation and reporting guidelines (EVCA 2003).
In addition, in the U.S. the Private Equity Industry Guidelines Group (PEIGG), an independent
organization consisting of General Partners, Limited Partners, accountants and other
representatives, was formed in February 2002. Similar to EVCA, the group seeks to promote
greater transparency and operating efficiency in the transfer of information among participants in
the U.S. Private Equity sector by establishing a set of standard guidelines for the content,
formatting and delivery of information (PEIGG 2004a). Their published valuation guidelines have
been strongly endorsed by the U.S. industry association NVCA (PEIGG 2004b). Under the new
guidelines, unrealized transactions shall generally be held at cost, unless a new financing round
involves a market revaluation of the asset. In addition, comparable company analysis and/or market
valuation guidelines allow assets to be marked to market when strong evidence is given that a
lower or higher valuation according to market trading or transaction values may be more
appropriate. This valuation exercise should at least be carried out twice a year and audited at least
once.
-100%
-50%
0%
50%
100%
150%
200%
250%
300%
350%
400%
GP43
GP49
GP61
GP5
GP2
GP46
GP9
GP73
GP7
GP58
GP64
GP24
GP6
GP10
GP68
GP15
GP13
GP19
GP3
GP45
GP34
GP76
GP82
GP42
GP48
GP27
GP65
GP67
GP29
GP38
GP63
GP21
GP51
GP32
GP81
Weig
hte
d A
vera
ge I
RR
(%
)
Realised GP Deals Weighted IRR Unrealised GP Deals Weighted IRR
GP Realised Deal Average
Weighted Gross IRR: 72%
GP Unrealised Deal Average
Weighted Gross IRR: 30%
Figure 106: Realized vs. Unrealized deal-based Weighted Average Gross IRR by General Partner
Source: INSEAD Buyout Investment Manager Database, analyzed by author (GP N=69; Deal N=3,015).

Empirical Part II – Buyout Firm and Manager Value Drivers 243
However, as mentioned, the adoption of these guidelines is neither enforced by a regulator nor
made compulsory by investors yet, which leads to a certain amount of residual uncertainty on the
investor side when “unaudited” buyout fund data is presented. Nevertheless, assuming that some
“generally accepted Private Equity accounting principles” were imposed by a regulatory or industry
body and/or demanded by investors at some stage, and thus commonly implemented by buyout
funds, the apparently high standard deviation of unrealized transaction valuations by various funds
should diminish and would lead to a better overall transparency and comparability of returns.
The comparison of realized and unrealized transactions across all GPs underlines the variance in
accounting procedures and hence IRR (see figure 106). The weighted average gross IRR of all
realized and unrealized deals was 72% and 30% respectively, with a standard deviation of 149%
and 94% respectively. The largest variance, and hence most aggressive accounting, relates to the
above mentioned GP22 buyout fund, who values its unrealized deals at an average gross IRR at
395%, compared to 163% for his realized transactions. By contrast, the GP43 buyout fund has
gained an average IRR of 373% on seven highly successfully realized transactions, but
conservatively values its five unrealized deals at a modest 28% IRR.
5.2.4.3. General Partner Team Size and Performance
In section 5.2.3.1. it was established that there is a positive relationship between a GP team’s size
and its average investment size in transactions. However, a negative relationship of average deal
size per buyout fund professional with increasing team size was found, i.e. the average deal size
grew slower than the respective teams. This led to the assumption that, given similar return
assumptions, the average return per employee is likely to be lower for larger funds.
55%
103%
48%44%
71%
78%
92%87%
6%
21%
5%
12%11%
28%
18%
28%
53%
22%26%
49%
58% 56%51%
-1%
-20%
0%
20%
40%
60%
80%
100%
120%
1 - 10 11 - 20 21 - 30 31+
GP Team Size Category
(We
igh
ted
) A
ve
rag
e G
ros
s IR
R (
%)
Realised Deals Weighted Average IRR Realised Deals Average Gross IRR
Unrealised Deals Weighted Average IRR Unrealised Deals Average Gross IRR
All Deals Weighted Average IRR All Deals Average Gross IRR
Figure 107: Weighted Average Gross IRR on Realized Deals by Buyout Firm Team Size
Source: INSEAD Buyout Investment Manager Database, analyzed by author (GP N=80; Deal N=1,962).

Empirical Part II – Buyout Firm and Manager Value Drivers 244
The analysis of average returns to buyout funds according to team size finds significantly higher
returns – when considering realized deals on a weighted average basis – of 103% for GP teams that
have a team size between 11 and 20 buyout professionals, while returns of larger teams (with at
least 31 professionals) are decreasing to 44%. This finding hints at the fact that there may
potentially be an optimal team size for buyout funds. The most successful GP team size based on
the historical Limited Partners’ data therefore on average consists of 15 buyout professionals,
undertaking transactions with an average investment size of US$ 24 million (assuming a 3 to 1 debt
to equity ration, this implies an average transaction size of US$ 100 million, i.e. larger mid-cap
deals). As an explanation for the high success of teams in the 11 to 20 buyout professional
category, it could be argued that the higher complexity of larger organizations may adversely affect
communication and flexibility within buyout teams.
However, another earlier finding was that team size correlates with average deal size. The analysis
of average deal size categories had suggested that transactions between US$ 20 and US$ 30 million
generate an average return of 48% (see section 4.3.6.). Given the significantly higher (weighted and
non-weighted) average returns for teams with 11 to 20 professionals that undertake transactions
with an average investment size of US$ 24 million, it can be argued that these teams must be
significantly more successful than their peers across a wider spectrum of deals (and deal size). The
standard deviation on the team size sample’s most successful (second) category is 176%, while the
standard deviation on the most successful deal size category is 122%.
The results also hold true when considering all – realized and unrealized – transactions on a
weighted basis. Nevertheless, on a non-weighted basis, buyout teams in the two larger categories
with 21 to 30 as well as 30 and more professionals appear to out-perform their smaller competitors
for realized deals (92% and 87% realized average gross IRR for the larger teams, compared to 71%
and 78% for the two smaller teams). This, however, implies that they are less successful in
undertaking mega-deals as the weighted IRR figure is lower. This is counter-intuitive as it would
be expected that larger teams earn their credit (i.e. for being larger) by performing well on mega-
deals. The contrary appears to hold true – buyout teams in the 11 to 20 professionals category
display a much higher weighted than non-weighted return on realized transactions, which indicates
that they are better placed to execute large transactions and generate superior value.
In summary, these findings have indicated that there could be an optimal team size for buyout firms
from an organizational point of view, which is superior from a return perspective and to a large
extent independent of the average investment size. From a theoretical point of view, the evidence
shows that a non-hierarchical, flat and flexible team structure could be a clear value driver when
executing buyout transactions, or in other words, buyout firm “professionalization” and constantly
growing team sizes are not necessarily a guarantee factor for higher returns for buyout funds.

Empirical Part II – Buyout Firm and Manager Value Drivers 245
5.2.5. Performance of Investment Managers
In addition to the above analysis of General Partner buyout teams on the firm-wide level, the
codification of the 1,282 individual investment professionals, working for 85 leveraged buyout
funds, equally offers scope to analyze the performance impact of their education, experience and
other personal characteristics, as outlined in the detailed biographies in the Private Purchasing
Memoranda of the Limited Partners’ data. In order to establish such an analysis, the data had to be
screened with respect to an allocation of responsibilities by buyout fund professionals across the
fund’s portfolio companies. Although very heterogeneous in nature, the data offers insight into
which buyout team member (generally partner or director) has led a certain transaction.
Alternatively, information is provided on the board seats of investment managers in portfolio
companies.161 Nevertheless, this information is limited and could only be collected for 234 buyout
investment professionals, overseeing 478 different portfolio companies.
There are two alternatives to establish the performance-characteristics relationship between
managers. On the one hand, an average weighted and non-weighted return for each investment
manager on all transaction in which the professional was involved can be calculated and compared
to personal characteristics. This method avoids double counting, but strongly aggregates the actual
universe of dependent and independent variables. Alternatively, a factor multiplication (of
company return, multiplied with number of involved investment managers as well as number of
characteristics) produces a non-aggregated explanation by all underlying independent variables. 162
5.2.5.1. Buyout Performance by Education
5.2.5.1.1. Degree Level and Buyout Performance
This section reveals which level, type and source of education of buyout investment managers is
linked to higher returns in leveraged buyout transactions. The analysis could have implications for
the recruitment strategy of buyout professionals, as it can statistically be predicted (based on these
161 It is common practice that those members of the buyout fund that were responsible for leading the
transaction subsequently also sit on its board of directors, hence the information of board seats can be interpreted with deal responsibility, or at least, a meaningful control function with respect to the company’s financial and eventually deal performance (IRR) according to the equity business plan.
162 Due to the fact that some buyout funds allocate more than one investment manager to portfolio companies, the number of data points increases to 874 portfolio companies. Although this implies a double counting on 396 portfolio companies’ returns, i.e. of the dependent variable IRR, across several managers, the focal object of this analysis would be the individual manager’s education, experience and other characteristics profile, which is diverse for each manager. Hence, in order to preserve this diversity of personal characteristics, it could be justified to take all returns into consideration individually to gain a better picture of the overall characteristics-return profile of buyout managers. In essence, each company’s IRR would be linked to (i) several investment managers, which have (ii) at least one, but in some instances several valid cases for the characteristic under review. Hence, the dependent variable IRR would therefore be explained and captured by all possible independent variables, i.e. characteristics of the various managers. However, it is generally relied upon the former presentation here, unless otherwise mentioned.

Empirical Part II – Buyout Firm and Manager Value Drivers 246
historical findings) how well different education profiles of investment managers are performing.163
Despite the fact that education is linked to individual performance here, these findings also have to
be interpreted within the larger buyout team context instead of standalone, as certain characteristics
may be altered through the team environment and certain team configurations, e.g. team structures
based on high diversity may be more successful (see team performance analysis in section
5.2.6.1.4.). The analysis shows that all investment managers in the sample have at least earned a
bachelor degree. This degree level displays the highest weighted average gross IRR with 88%.
Those managers, who have also gained an MBA degree, achieved an average return of 68% on
their transactions, while PhD/JDs achieved 62% and master degree graduates 43% of weighted
average gross IRR.164 These findings are highly counter-intuitive as they imply that additional
education actually diminishes returns accomplished on buyout transactions. With respect to
differentiation between realized and unrealized returns, we (unfortunately) find that PhD/JDs
display the lowest realized return with 63% and master degree graduates the highest post-
undergraduate realized return of 95%. In addition, master degree graduates – given their strong
performance on realized deals – also are highly conservative on their valuation of unrealized
investments. A large majority of these successful non-MBA master degree graduates are engineers
(but also other social science degrees), which leads us to a more in-depth analysis of degree type.
88%
68%62%
43%
122%
81%
63%
95%
47% 49%
71%
26%
0%
20%
40%
60%
80%
100%
120%
140%
Bachelor Degree MBA PhD/JD Master Degree
Weig
hte
d A
ve
rag
e G
ros
s I
RR
(%
)
All Deals Weighted Average IRR Realised Weighted Average IRR
Unrealised Weighted Average IRR
Figure 108: Weighted Average Gross IRR on Deals by Individual Buyout Investment Professionals by Degree Level
Source: INSEAD Buyout Investment Manager Database, analyzed by author (Degree N=273).
163 The sample of investment managers, which demonstrates control (and return) responsibilities, is to some
extent limited by the heterogeneity of the underling data, i.e. either the characteristic under review or potentially a return profile, calculated on executed transactions of the investment manager, may not be disclosed in the Limited Partner data.
164 The sample of realized and unrealized transactions intentionally includes the same investment managers and is differentiated only by their underlying return profile’s investment status (hence, if a manager has both realized and unrealized transactions, he is represented in both samples). Consequently, realized and unrealized samples in one category may not net each other off, as seen for PhD/JDs, where the average return of all transactions is lower than both of its sub-samples.

Empirical Part II – Buyout Firm and Manager Value Drivers 247
5.2.5.1.2. Degree Type and Buyout Performance
The above strong results for master degree graduates, which to a large extent consist of engineering
degrees, are supported by the findings on degree type returns. The engineering degree graduates in
this sub-sample strongly outperform their peers with 227% of realized weighted average gross IRR,
followed by business degree with 97% of realized IRR. Both law degree graduates (65% of realized
IRR) and arts degree graduates (57% of realized IRR) perform worse.
The apparent return dominance of engineers is surprising, as this indicates that neither legal and
negotiation skills nor business and financial analysis are the main driver for buyout success.
Instead, the potentially deeper understanding of corporate (value chain) processes and technical
product knowledge by engineers may be a success factor. Again, it also appears that engineers are
inclined to value their unrealized investments (11% of weighted average gross IRR) in a highly
conservative manner, either because their track record on realized investments allows them to
conservatively reflect prospects for these investments, or because they are simply more risk averse
in their evaluation of unrealized transactions than for instance business and law graduates.
128%
106%
82%66%
49%
227%
68%57%
97%
65%
11%
102%
74%
39% 39%
0%
50%
100%
150%
200%
250%
Engineering Degree Other Degree Arts Degree Business,
Commerce, Finance
and Accounting
Degree
Law Degree
Weig
hte
d A
vera
ge G
ross I
RR
(%
)
All Deals Weighted Average IRR Realised Weighted Average IRR
Unrealised Weighted Average IRR
Figure 109: Weighted Average Gross IRR on Deals by Individual Buyout Investment Professionals by Degree Type
Source: INSEAD Buyout Investment Manager Database, analyzed by author (Degree N=221).
5.2.5.1.3. Universities and Buyout Performance
Not only may the level of education and type of degree studied affect the skill set of investment
managers and ultimately buyout performance, but also its quality. Hence, there could potentially
exist a link between visited institution and performance of investment managers, e.g. if certain
institutions are more specialized in the education of future investment managers than others. The
investment manager distribution characteristics had shown that nearly a third of all MBA graduates
working as buyout fund investment professionals have gained their degree from Harvard Business
School. However, taking into account all universities, the picture is slightly different.

Empirical Part II – Buyout Firm and Manager Value Drivers 248
The analysis of returns on all degrees earned across universities reveals that two universities, which
are generally attended for undergraduate and master degrees, show the highest performance: Brown
University (242% of weighted average IRR) and Princeton University (222% of weighted average
IRR). These universities, together with the Northwestern University (182% IRR), UCLA (147%)
and Oxford University (131%), demonstrate why bachelor degrees perform in this exceptionally
strong manner (as seen in prior analysis above). Considering all degrees, the most frequent
institution in the sample, Harvard University, only ranks thirteenth with 31% average weighted
gross IRR. Nevertheless, the above analysis must be considered with regard to the sample size,
which consists of N=180 degrees earned by investment managers. The average graduate number
per University is 10.6, with a minimum of 4 graduates (NYU/Stern) and a maximum of 50
graduates (Harvard University). The average number of transactions per University is 31.1, with a
minimum of 5 deals (Amos Tuck) and a maximum of 113 deals (Harvard University).
1%
11%
18%
31%
33%
45%
46%
66%
85%
85%
99%
131%
147%
182%
222%
242%
-5%
-50% 0% 50% 100% 150% 200% 250% 300% 350%
Queen's University
Michigan
Williams College
Stockholm School of Economics
Harvard
NYU/Stern
University of Notre Dame
Columbia
Yale University
Wharton
Amos Tuck
Stanford
Oxford University
UCLA
Kellogg, Northwestern University
Princeton University
Brown University
All Deals Weighted Average IRR
Figure 110: Weighted Average Gross IRR on Deals by Individual Buyout Investment Professionals by attended University
Source: INSEAD Buyout Investment Manager Database, analyzed by author (Uni N=180).
5.2.5.1.4. Business Schools and Buyout Performance
Even more important for potential hiring decisions at buyout funds is the distribution of returns
across Business Schools. The findings show that Wharton MBA graduates have gained the highest
weighted average gross IRR of 202%, followed by Stanford MBAs with 102% IRR and Columbia
MBAs with 59% IRR. Harvard Business School graduates in this sample only gained an average
return on their buyout investments of 23%. This demonstrates that despite the fact that Harvard
graduates dominate the buyout industry by number, they cannot claim credit for their high
frequency with above average returns. Wharton’s leading global position for supreme finance

Empirical Part II – Buyout Firm and Manager Value Drivers 249
education and finance MBA specialization to graduates wishing to work in the financial services
industry is validated by these findings.
However, even more than the university rankings, the above findings from a statistical point of
view can only be seen as indicative, as much larger sample sizes and longitudinal studies are
required to further confirm these initial directional results (please refer to the statistics section
5.2.6.1.3. for statistical validation). 165
202%
39%24% 23% 20% 16% 15% 10%
46% 37%
59%
102%
37
2223
223
27
13
5
0%
50%
100%
150%
200%
250%
Wha
rton
Stanf
ord
Colu
mbia
Uni
vers
ityof N
otre
Dam
e
NYU/S
tern
Kellogg,
Nor
thwes
tern
Unive
rsity
Univ
ersity
of W
isco
nsin
-Mad
ison
Harv
ard
Univ
ersity
of C
hica
go
INSE
AD
Amos
Tuck
Institu
to d
e Em
presa
of M
adrid
Weig
hte
d A
vera
ge G
ross I
RR
(%
)
0
10
20
30
40
Fre
quency
All Deals Weighted Average IRR Frequency of MBA
Figure 111: Weighted Average Gross IRR on Deals by Individual Buyout Investment Professionals by attended Business School
Source: INSEAD Buyout Investment Manager Database, analyzed by author (MBA N=80).
5.2.5.2. Professional Experience, Network and Buyout Performance
Having received indications on which type of education at which preferred university could
influence achieving a higher average return on buyout investments, the remaining question is what
type of professional education as well as additional involvement in institutions further enhances
buyout performance.
With respect to professional background, investment managers that joined their current buyout
fund and had previous experience in Private Equity lead the ranking with a weighted average gross
IRR on all transactions undertaken of 96%. This is followed by banking and finance professionals
with 62%, lawyers with 48%, consultants with 38% and accountants with 1% average IRR.
165 A minimum of two MBA students and transactions are used here to limit the sample. At least N=15 would
guarantee a sufficient level of diversification; hence, these results can only be considered for illustrative purposes.

Empirical Part II – Buyout Firm and Manager Value Drivers 250
However, taking into account only realized transaction, professional experience as consultant
yields the highest return with 118%. The relatively low performance of investment managers with
an accounting background is unexpected. This may indicate that a successful skill set of investment
professionals must be considerably broader, i.e. may require more than strong financial analysis
and due diligence/auditing capabilities – stereotypically – found among accountants.
In addition, operational management experience as well as training as a member or chairman of the
board of directors of companies imparts superior returns on transactions undertaken by those
investment managers, with 59% and 56% of weighted average gross IRR respectively. The
comprehensive monitoring and control tasks of investment managers for portfolio companies, as
well as strategic and operational influence on portfolio companies’ management are likely to make
these prior and/or current professional positions a positive contributor to buyout success. Moreover,
positions in academia and/or industry (and social) associations are less effective to increase buyout
returns. On a relative basis, investment managers holding these positions yield less return with 30%
and 29% of weighted average IRR respectively. These lower returns could hypothetically be
interpreted in such as way that these extraordinary engagements may take away valuable time from
investment managers, which could otherwise be used on the search, execution and control of
buyout investment. However, it is not evident if these engagements may have a positive moderating
role on some of the other categories, e.g. board positions.
39%
81%
78%
118%
119%
91%
98%
109%
111%
103%
-26%
1%
96%
62%
59%
29%
30%
48%
38%
46%
56%
54%
-29%
-18%
-21%
18%
7%
24%
-17%
28%
-40% -20% 0% 20% 40% 60% 80% 100% 120%
Accounting
Positions in Associations
Positions in Academia
Consulting
Public and Political Positions
Law
Chairman or Member of
Board
Management Positions
Banking & Finance
Private Equity
Weighted Average Gross IRR (%)
All Deals Weighted Average IRR Realised Weighted Average IRR
Unrealised Weighted Average IRR
Figure 112: Weighted Average Gross IRR on Deals by Individual Buyout Investment Professionals by Position
Source: INSEAD Buyout Investment Manager Database, analyzed by author (Position N=570).

Empirical Part II – Buyout Firm and Manager Value Drivers 251
By contrast, professional experience and/or contacts to political committees and the public sector
do have a positive influence on buyout returns. This category shows the highest return on realized
transactions with 119% of weighted average IRR. This particular strong performance could be
explained in that sense that political connection may provide for preferential treatment in public
sector auctions as well as exclusive, high-yielding proprietary deal flow.
5.2.5.3. Experience and Buyout Performance
The learning curve effect has been found applicable in a range of fields in economic studies. The
concept of accumulation and standardization of similar processes may also be a success factors for
buyout performance. In section 5.3. this experience effect will be analyzed extensively for the
buyout organization on the firm level. In this section, some initial findings for the sample of
individual buyout managers are presented with respect to the impact of time-dependent experience
variables on performance.
5.2.5.3.1. Private Equity Experience and Buyout Performance
How many years of experience are required to generate high returns in buyout transactions? First,
the years of experience of the buyout investment manager sample were categorized into for
categories.166 These categories should not uniquely be interpreted in a hierarchical manner as
investment manager positions in the buyout industry can also be entered on higher hierarchical
levels, e.g. as an associate or investment director.
The results are counter-intuitive to the learning curve idea. Considering realized returns only, they
show a strong performance of 187% weighted average gross IRR for buyout investment managers
that have up to three years of experience in the Private Equity industry. The returns are declining
thereafter, with senior investment professional (partners) that have more than 13 years of Private
Equity experience only showing a return of 55% on realized transactions. The underlying
predictability of buyout returns can be considered high when comparing the small variance in
realized, unrealized and total returns, ranging between 52% and 59% IRR across categories.
Nonetheless, these results also have to be judged against the timing of this analysis and the
economic cycle. The strong performance on realized buyout transactions of investment managers in
the 0 to 3 year category can directly be related to the fact that these individuals have worked on
particularly successful transactions (“stock market boom”) between 1997 and 2003, as most
Limited Partners’ data was collected between 2000 and 2003. Hence, realized transactions yielded
exceptional returns during this time, benefiting the first experience category.
166 For simplicity, the categorization was made according to a general hierarchy of buyout funds – 0 to 3
years for analyst and associate positions, 4 to 7 years for associate positions, 8 to 12 years for director and 13 and more years for partner positions. Note that this is not an analysis of experience by hierarchy though.

Empirical Part II – Buyout Firm and Manager Value Drivers 252
83%
59%
187%
84% 82%
55%
7%
29%
52%
73%
39%
59%
3843
46
12
0%
25%
50%
75%
100%
125%
150%
175%
200%
0-3 4-7 8-12 13+
Private Equity Experience (Years)
Weig
hte
d A
vera
ge G
ross I
RR
(%
)
0
10
20
30
40
50
Fre
quency
All Deals Weighted Average IRR Realised Weighted Average IRR
Unrealised Weighted Average IRR Frequency of Private Equity Experience
Figure 113: Weighted Average Gross IRR on Deals by Individual Buyout Investment Professionals by Years of Private Equity
Experience
Source: INSEAD Buyout Investment Manager Database, analyzed by author (Private Equity Experience N=139).
5.2.5.3.2. Buyout Firm Tenure and Buyout Performance
The analysis of tenure of buyout fund professionals and their transactions performance produces a
very similar picture to the prior analysis of Private Equity experience, as most investment managers
have gained this experience with only one buyout firm, indicating the general low turnover of
buyout professionals. Neglecting the above discussed potential influence of economic and stock
market cycles on performance, the high performance (81% weighted average IRR on all deals) of
investment managers with tenure of 0 to 3 years could also be interpreted in such as way that these
managers are extremely motivated when joining the buyout firm and seek to prove their deal-
making capabilities. Having established themselves at the fund for more than 3 years without
redundancy, their performance suddenly declines to 41% weighted average gross IRR. This return
could either relate to senior investment managers or to associates (when interpreted according to
hierarchies), who are set to receive greater deal responsibility as directors. Following the
hierarchical path, the increase in deal performance of investment managers with tenure of 8 to 12
years could be related to (i) increased intrinsic motivation through higher or full transaction
responsibility, (ii) increased extrinsic motivation as investment directors are compensated with
carried interest on the transactions they undertake, (iii) increased awareness and reputation building
against peers for partner promotion prospects.
The performance of buyout investment professionals with 13 and more years of experience drops
significantly thereafter to an average weighted IRR of 55%. On the one hand, this could be
interpreted from a hierarchical standpoint that partners in buyout funds may have lower pressure to
perform well from a promotion perspective, as their position is (almost) safe. On the other hand, as

Empirical Part II – Buyout Firm and Manager Value Drivers 253
owners of the firm their extrinsic motivation should be highest. Consequently, the performance of a
buyout fund may to a great extent rely on the motivation and incentive structure, as well as the
contributions of other senior members (directors) in the team with low tenure, but high ambitions.
81%
55%
187%
77%
58%
5%
33%44%41%
79%
84%
65%
12
53
34
33
0%
25%
50%
75%
100%
125%
150%
175%
200%
0-3 4-7 8-12 13+
Tenure (Years)
Weig
hte
d A
vera
ge G
ross I
RR
(%
)
0
25
50
75
Fre
quency
All Deals Weighted Average IRR Realised Weighted Average IRR
Unrealised Weighted Average IRR Frequency of Tenure
Figure 114: Weighted Average Gross IRR on Deals by Individual Buyout Investment Professionals by Years of Tenure
Source: INSEAD Buyout Investment Manager Database, analyzed by author (Tenure N=132).
5.2.5.3.3. Buyout Firm Hierarchy and Buyout Performance
The above findings on tenure finds further support by analyzing the transaction performance of
buyout fund investment managers according to their hierarchy level. The results support the above
finding that senior professionals in the buyout fund (i.e. investment directors/vice presidents)
produce the highest weighted average return of 87%, when considering all transactions. However,
their performance is bolstered by high valuations for their unrealized transactions (96% of
weighted average gross IRR). Partners perform slightly less (76% average IRR) when considering
all transactions, in line with the above findings on tenure. However, they demonstrate significantly
higher returns on their realized transactions (117% average IRR). This could be the result of a (i)
long investment history with a strong track record, (ii) learning curve of buyout transaction
execution.167
However, it is noteworthy to mention the low return on unrealized transactions for partners of only
29%, especially compared to their senior investment professional colleagues. This piece of
evidence could either relate to a more long-term investment history on the partner level, or be an
indication of a more volatile and risk-oriented investment attitude of buyout partners. In support of
167 With respect to the former argument, it has to be considered that most buyout funds under consideration in
the Limited Partner data have a long track record of investments (no first time funds), in some instances dating back to the early 1980s or 1970s, in which return levels were potentially higher.
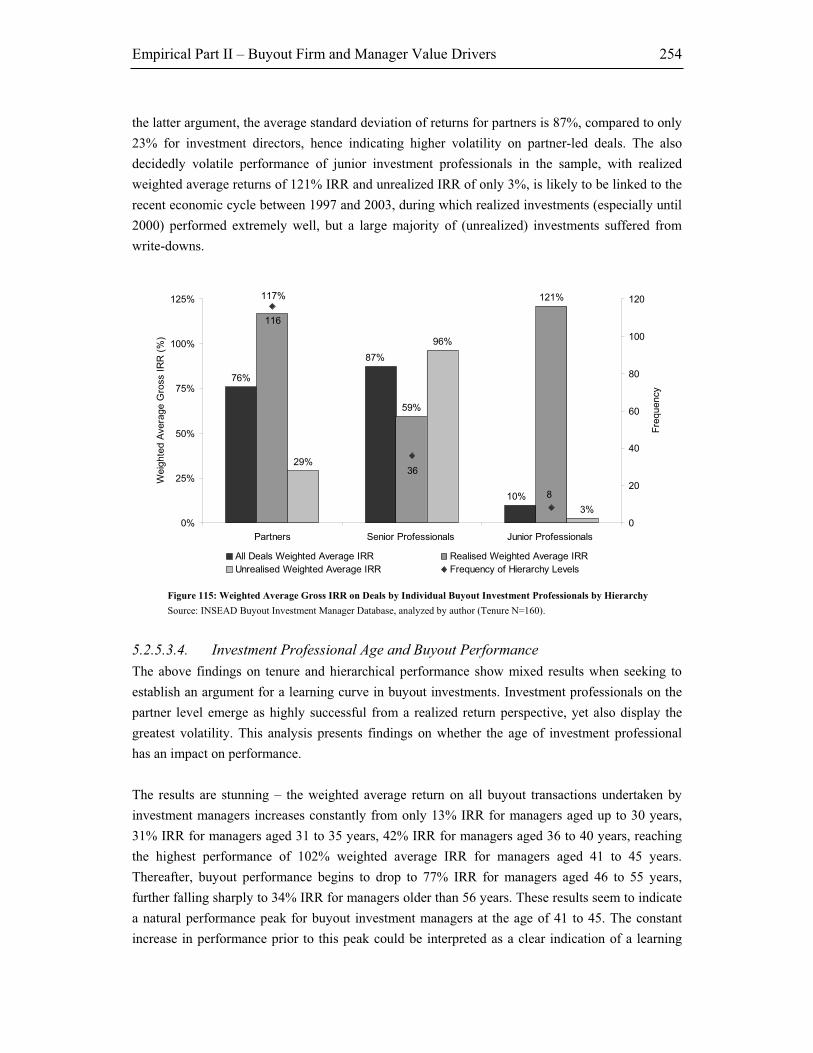
Empirical Part II – Buyout Firm and Manager Value Drivers 254
the latter argument, the average standard deviation of returns for partners is 87%, compared to only
23% for investment directors, hence indicating higher volatility on partner-led deals. The also
decidedly volatile performance of junior investment professionals in the sample, with realized
weighted average returns of 121% IRR and unrealized IRR of only 3%, is likely to be linked to the
recent economic cycle between 1997 and 2003, during which realized investments (especially until
2000) performed extremely well, but a large majority of (unrealized) investments suffered from
write-downs.
76%
59%
121%
29%
96%
10%
87%
117%
3%
8
36
116
0%
25%
50%
75%
100%
125%
Partners Senior Professionals Junior Professionals
Weig
hte
d A
vera
ge G
ross I
RR
(%
)
0
20
40
60
80
100
120
Fre
quency
All Deals Weighted Average IRR Realised Weighted Average IRR
Unrealised Weighted Average IRR Frequency of Hierarchy Levels
Figure 115: Weighted Average Gross IRR on Deals by Individual Buyout Investment Professionals by Hierarchy
Source: INSEAD Buyout Investment Manager Database, analyzed by author (Tenure N=160).
5.2.5.3.4. Investment Professional Age and Buyout Performance
The above findings on tenure and hierarchical performance show mixed results when seeking to
establish an argument for a learning curve in buyout investments. Investment professionals on the
partner level emerge as highly successful from a realized return perspective, yet also display the
greatest volatility. This analysis presents findings on whether the age of investment professional
has an impact on performance.
The results are stunning – the weighted average return on all buyout transactions undertaken by
investment managers increases constantly from only 13% IRR for managers aged up to 30 years,
31% IRR for managers aged 31 to 35 years, 42% IRR for managers aged 36 to 40 years, reaching
the highest performance of 102% weighted average IRR for managers aged 41 to 45 years.
Thereafter, buyout performance begins to drop to 77% IRR for managers aged 46 to 55 years,
further falling sharply to 34% IRR for managers older than 56 years. These results seem to indicate
a natural performance peak for buyout investment managers at the age of 41 to 45. The constant
increase in performance prior to this peak could be interpreted as a clear indication of a learning

Empirical Part II – Buyout Firm and Manager Value Drivers 255
curve effect in executing buyout transactions. Moreover, the constant drop in performance after the
peak in the age category of managers aged 41 to 45 years indicates that increasing age could have
an adverse effect on buyout deal-making. Especially the sharply increasing volatility for older
investment managers, exhibited through the high negative returns on unrealized transactions, could
be comprehended as a sign of misjudgment of investment opportunities, i.e. increasing failure rates
(defaults), overpaying through “senior gut-decisions” rather than sufficient reflection on business
fundamentals, or false and over-estimation of value creation potential at the buyout target. This
declining trend in performance also holds true when only considering realized transactions.
121%
65%
47%
136%
104%
95%
-11%
13%
77%
102%
31%
42%
34%
1%
26%21%
29%
-15%
22
8
3536
31
22
-25%
0%
25%
50%
75%
100%
125%
150%
23-30 31-35 36-40 41-45 46-55 56+
Age (Years)
We
igh
ted
Ave
rag
e G
ross IR
R (
%)
0
10
20
30
40
Fre
qu
en
cy
All Deals Weighted Average IRR Realised Weighted Average IRR
Unrealised Weighted Average IRR Frequency of Age
Polynomic Experience(Age)-Return Curve
Figure 116: Weighted Average Gross IRR on Deals by Individual Buyout Investment Professionals by Age
Source: INSEAD Buyout Investment Manager Database, analyzed by author (Age N=154).
In summary, this evidence supports a hypothesis of a direct impact of an investment manager’s
education and experience profile on deal performance. Moreover, a learning effect in buyout
transactions, based on the experience, tenure and age profile of the buyout professional, is
influencing the value creation dynamics of this industry. These findings will now be further
investigated through statistical analysis on the General Partner firm level.
Empirical Part II – Buyout Firm and Manager Value Drivers 256
5.2.6. Modeling the Buyout Firm and Team Manager Effect
In the previous section, the tested constructs (see overview in section 5.2.1.2.) have been exhibited
and interpreted on a descriptive and graphical basis. The sample for the statistical analysis in this
section consists of 1,422 realized and unrealized buyout transactions with a mean gross IRR
performance of 44.8%.168 The examination of the bivariate Pearson correlation matrix between the
dependent variable IRR and the various independent buyout firm experience variables leads to
several surprising results, which are discussed below.169
5.2.6.1. Descriptive Statistics
5.2.6.1.1. Manager/ Time Experience Effect
Both the average tenure and average Private Equity experience of the investment manager team one
year prior to the acquisition of the focal deal is significantly (at the 0.05 level; 2-tailed) and
negatively correlated with buyout performance. This finding is, at first sight, counterintuitive to the
results of the previous section, which had suggested that there exists an experience effect in
leveraged buyouts. In the descriptive section to this chapter, it was established that there exits a
concave relationship between age and performance, and that performance for high tenures and
Private Equity experience categories are decreasing. Furthermore, it was established that senior
investment professionals, aged 41-45, with 8-12 years of tenure or Private Equity experience and
aspiring to become partner, demonstrate the best performance. This statistical result can therefore
be interpreted as further evidence that the performance of buyout firm partners decreases after
several years in the business. As a consequence, it could be inferred from the statistics that buyout
firm partners are subject to (i) decreasing marginal extrinsic motivation, (ii) decreasing attention to
the focal deal’s idiosyncratic characteristics and myopic learning effects.
Moreover, both the tenure and Private Equity homogeneity variables are significantly (at the 0.01
level; 2-tailed) and negatively correlated. As they are calculated based on Herfindahl indices, i.e.
the higher the Hirfendahl index value the more homogeneous is the variable under consideration, it
can be concluded that diversity of team members with a different number of years of experience is
enhancing buyout returns. In conjunction with the above presented findings regarding average
tenure and Private Equity experience in this direction, this finding would provide further evidence
that the more successful teams also include junior and mid-level buyout professionals, hence
supporting prior research on the benefits of heterogeneity and diversity among management teams
(Bantel and Jackson 1989; Finkelstein and Hambrick 1990; Jackson 1992; Finkelstein and
Hambrick 1996; Carpenter and Fredrickson 2001).
168 Previous analysis on the financial aspects of value creation throughout this study was limited to realized
transactions. However, in this context of analyzing the team profile effect of buyout firms on their transactions, it is essential to include all transactions to ensure a complete picture. The lower average (valuation) return of unrealized deals reduces the sample’s mean IRR.
169 An analysis of the various control variables in the regressions is omitted here. See empirical chapter one for a general discussion of the market, acquisition and financial control variable effects.

Empirical Part II – Buyout Firm and Manager Value Drivers 257
5.2.6.1.2. Manager/Team Professional Experience Effect
Which professional experience of investment managers within the team context enhances buyout
returns? The results substantiate the earlier descriptive findings that a high share of professional
background in Private Equity as well as management functions among teams of buyout investment
managers significantly (at the 0.01 level; 2-tailed) and positively affects buyout returns. This
finding demonstrates that successful buyout firms recruit investment professionals that have a
proven track record as an excellent corporate manager.
That this skill set appears to be fundamentally stronger becomes even clearer when assessing
alternative prior jobs of buyout managers: accountants are the worst performers, i.e. have a
negative impact on performance of deals, in buyout firms, with highly significant (p<0.01) and
negative influence on the dependent variable IRR. Likewise, bankers and consultants are also
adversely affecting buyout firm results, however, only significant at the 0.1 level. The negative
performance impact of bankers is surprising, as their returns on a graphical description were
positive. One way of interpreting this finding is that bankers as such may be successful from a
return perspective, but a high share of bankers in buyout firm teams might cause negative side
effects. In other words, despite the fact that bankers on average create solid returns when analyzed
individually, they may disfunction in the team context. Several explanations could be found, e.g.
team infighting, overconfidence on deals, etc, but would require further analysis.
5.2.6.1.3. Manager/Team Education Background Effect
Does education matter with respect to buyout performance? The results to this question are mixed.
First, there are more confirmative results – compared to the descriptive IRR results – with respect
to which level of degree is positively correlated with deal IRR. Bachelor degrees are significantly
(p<0.05) and positively correlated with buyout performance. This is not only in line with the robust
descriptive results, but freely interpreted only makes sense as every investment professional at least
has one bachelor degree and the sample mean IRR is solidly positive. However, there is also
evidence that master degree graduates within the buyout team context are highly significant (at the
0.01 level; 2-tailed) and negatively affecting deal IRR. Both MBA and PhD/JD degrees are
statistically non-significant, however, positively correlated with performance.
With regard to degree types, opposite results than observed in the descriptive section for individual
investment manages are obtained. Both engineering and business degrees are significantly (at the
0.01 and 0.05 level respectively) and negatively affecting IRR within the team context. Weighed
against the descriptive results on individual managers, business graduates are in line with lower
performance, however, engineering graduates had performed best when analyzed on an individual
basis. Their negative impact within the team context gives rise to potential further hypotheses
regarding intra-team communication and (adverse) inter-buyout-manager relationships. Potential
explanations may either be connected to the type of transactions (or buyout funds), i.e. in which
engineers are predominately involved, or to personal characteristics associated with engineering
graduates that affect team performance. With respect to the latter argument, potential conflicts

Empirical Part II – Buyout Firm and Manager Value Drivers 258
between or difficulties in decision making among business-/financially-trained and engineering-
trained managers would be only one hypothetical example.
Descriptive and Correlation StatisticsVariable (Dummy) Tested N(1) Mini-
mum Maxi-mum
Sum(2) Mean Std. Deviation
Pearson Correlation
Sig. (2-tailed)
Manager/ Time Experience
Average Age 1104 21,0 56,0 39656,9 35,921 5,3153 0,023 0,453
Homogeneity of Age (StDev) 907 ,00 16,86 4694,45 5,17 2,81 -0,019 0,564
Average Tenure 1422 0 19 7599 5,34 3,222 -,057(*) 0,03
Homogeneity of Tenure (StDev) 1185 0 10 5072 4,28 2,317 -,105(**) 0
Average PE Experience 1422 0 23 7966 5,60 3,226 -,052(*) 0,048
Homogeneity of PE Exp (StDev) 1185 0 10 5217 4,40 2,301 -,096(**) 0,001
Manager/Team Professional Experience
Sum of Network 1422 1 108 29227 20,55 16,866 -0,014 0,59
Share of Academia, 1422 ,00 ,50 15,21 ,010 ,039 0,013 0,615
Share of Accounting 1422 0 1 72 ,05 ,091 -,093(**) 0
Share of Adm. and Public Sector 1422 0 0 17 ,01 ,024 0,018 0,495
Share of Association Involvement 1422 ,00 ,50 71,15 ,05 ,076 -0,028 0,294
Share of Banking 1422 ,00 1,00 270,41 ,19 ,19 -0,045 0,093
Share of Board memberships 1422 ,00 ,83 441,53 ,3105 ,29376 0,011 0,675
Share of Consulting 1422 0 1 148 ,10 ,121 -0,047 0,079
Share of Law 1422 0 1 21 ,01 ,077 -0,026 0,321
Share of Management Functions 1422 ,00 1,00 94,828 ,066 ,126 ,171(**) 0
Share of Other 1422 ,00 1,00 119,16 ,083 ,133 -,069(**) 0,009
Share of Private Equity 1422 ,000 1,000 152,561 ,107 ,145 ,073(**) 0,006
Homogeneity of Network (Herf) 1422 ,154 1,00 552,114 ,388 ,173 -0,01 0,715
Manager/Team Education Background
Sum of Degree Level 1422 1 50 14087 9,91 7,216 -0,011 0,674
Share of Bachelor Degree 1422 ,000 1,000 565,652 ,397 ,217 ,056(*) 0,035
Share of Master Degree 1422 0 1 215 ,15 ,167 -,093(**) 0
Share of MBA 1422 ,000 1,00 514,394 ,361 ,178 0,003 0,898
Share of Other 1422 0 0 31 ,02 ,073 0,01 0,713
Share of PhD/JD 1422 0 1 96 ,07 ,099 0,021 0,422
Homogeneity of Deg. Lev. (Herf) 1422 ,254 1,000 624,683 ,439 ,181 0,006 0,832
Sum of Degree Types 1422 1 41 13665 9,61 7,099 -0,037 0,159
Share of Arts Degrees 1422 0 1 102 ,07 ,137 -0,01 0,713
Share of Business Degrees 1422 ,00 1,00 844,35 ,5938 ,20323 -,054(*) 0,043
Share of Engineering Degrees 1422 0 1 157 ,11 ,148 -,072(**) 0,006
Share of Law Degrees 1422 0 1 51 ,04 ,085 0,049 0,066
Share of Other Degrees 1422 ,00 1,00 267,04 ,1878 ,19127 ,098(**) 0
Homogeneity of Deg Type (Herf) 1422 ,250 1,000 757,084 ,53241 ,195653 -0,041 0,124
Sum of Degree Order 1422 1 51 15483 10,89 7,890 -0,022 0,407
Share of 1st Degrees 1422 ,0 1,0 689,8 ,485 ,1365 -0,003 0,912
Share of 2nd Degrees 1422 ,0 1,0 618,3 ,435 ,1144 -0,033 0,214
Share of 3rd Degrees 1422 0 1 114 ,08 ,100 0,042 0,115
Homogeneity of D. Order (Herf) 1422 ,3 1,0 671,7 ,472 ,1152 -0,024 0,358
Manager/Team Diversity and Hierarchy
Sum of Hierarchies 1422 1 28 8180 5,75 4,070 -0,047 0,075
Share of Partners 1422 0 1 890 ,63 ,343 ,116(**) 0
Share of Senior Professionals 1422 0 1 472 ,33 ,346 -,095(**) 0
Share of Junior Professionals 1422 0 1 60 ,04 ,116 -,057(*) 0,032
Homogeneity of Hierarchy Level (Herf)
1422 0 1 1072 ,75 ,230 ,094(**) 0
Number of Managers 1422 1 28 8180 5,75 4,070 -0,047 0,075
Average History with Team 1422 -3 17 367 ,26 1,195 0,014 0,609
Homogeneity of Average History with Team (StDev)
1185 0 10 723 ,61 1,300 -0,047 0,108
(1) Total sample size of tested cases (all realized transactions). (2) Number of cases where dummy variable = 1, i.e. number of transactions per variable tested. ** Correlation is significant at the 0.01 level (2-tailed). * Correlation is significant at the 0.05 level (2-tailed).
Table 50: Descriptive and Correlation Statistics on Buyout Firm Deal Experience Variables

Empirical Part II – Buyout Firm and Manager Value Drivers 259
The latent influence of an investment manager’s education on team atmosphere is further
highlighted by the significantly (at the 0.1 level) and positively correlated performance of law
graduates. Lawyers had shown the worst average returns when benchmarked on an individual’s
deal basis. However, within the team context, lawyers appear to have a positive influence on
buyout returns, which could be either seen in their professional or their positive contribution to
team culture, e.g. their expertise during transactions (negotiations), or their potentially more
mitigating and consensus-driven team behavior. The homogeneity variable of degree type is non-
significant (close to the 0.1 level; 2-tailed), however, it also directionally points to the fact that
greater diversity among educational backgrounds in buyout teams is positively inspiring buyout
returns. This is also further substantiated by the fact that the degree order variable, i.e. the number
of degrees earned, for the 3rd degree is positively correlated with performance, albeit slightly below
the 0.1 significance level. In other words, buyout managers who have earned more than average
(i.e. three) degrees, potentially in different fields, positively contribute to buyout returns. The result
can, in the same fashion, be understood as either a direct beneficial (professional) impact of a
broader skill set and expertise of those managers, or within the team context, the ability through the
broader background to better communicate with a larger group of different graduates.
Finally, the variable average history with team variable is calculated by taking the difference
between total Private Equity experience and tenure with the firm. The resulting value measures to
what extent the team consists of outsiders, i.e. investment professionals that have gained experience
at another Private Equity fund before. The variable is positively correlated, which would suggest
that adding outside professionals increases returns, however, the variable is non-significant. The
homogeneity variable on average history with the team is negatively correlated and slightly above
significance at the 0.1 level (2-tailed). The Hirfendahl-index-based variable reinforces the prior
underlying variable, as it advocates that investment manager teams that only consist of members
that started their career at the fund (e.g. “founder club”) are less successful than those funds that
also recruit outside investment professionals with additional valuable skills.
Only for illustrative reasons in this context, the correlation matrix also reveals significance levels
between buyout performance and the various universities the buyout professionals in this sample
have attended. Although these results have to be considered within the context of too small sample
sizes, there is statistical significance for positive out-performance of the following universities:
Georgetown (p<0.01), Uni Michigan (p<0.01), MIT (p<0.01) and Uni Virginia (p<0.05). By
contrast, the number of significantly negative performing universities is high: Uni Cambridge
(p<0.01), HEC (p<0.1), INSEAD (p<0.01), Institut d’Etudes Politiques Paris (p<0.05), NYU/Stern
(p<0.1), Oxford University (p<0.05) and Stockholm School of Economics (p<0.1). These results
are surprising for two reasons. First, most of the leading universities from a performance
perspective that were exhibited in the descriptive section (on an individual investment manager
performance basis), e.g. Brown, Princeton or Kellogg/Northwestern University, are non-significant.
Furthermore, Oxford University is statistically significantly negatively correlated, but had above
average returns on the descriptive section that was based on individual managers. These mixed

Empirical Part II – Buyout Firm and Manager Value Drivers 260
results suggest that they can only be seen as illustrative and that there is no clear picture regarding
dominance of universities with respect to buyout performance.170
Descriptive and Correlation StatisticsVariable (Dummy) Tested N(1) Mini-
mum Maxi-mum
Sum(2) Mean Std. Deviation
Pearson Correlation
Sig. (2-tailed)
Manager/Team Education Experience – Unis
Sum of Unis 1422 0 44 10152 7,14 5,744 0,016 0,549
Homogeneity of Unis (Herf) 1391 ,120 1,000 535,157 ,38473 ,245661 -0,001 0,97
Share of Amherst College 1391 0 0 2 ,00 ,010 -0,03 0,257
Share of Amos Tuck School 1391 0 1 24 ,02 ,068 0,012 0,653
Share of Brown University 1391 0 1 27 ,02 ,072 -0,004 0,881
Share of Cambridge University 1391 0 1 110 ,08 ,122 -,086(**) 0,001
Share of Colgate Darden 1391 0 1 8 ,01 ,043 -0,002 0,93
Share of Columbia 1391 ,0 1,0 93,2 ,067 ,1422 0,007 0,803
Share of Cornell 1391 ,00 ,50 17,19 ,0124 ,04965 0,008 0,769
Share of Duke 1391 0 0 7 ,01 ,027 -0,033 0,215
Share of Georgetown 1391 0 1 34 ,02 ,052 ,146(**) 0
Share of Harvard 1391 0 1 275 ,20 ,240 0,006 0,816
Share of HEC 1391 0 1 25 ,02 ,103 -0,048 0,072
Share of INSEAD 1391 0 1 76 ,05 ,136 -,095(**) 0
Share of Institut d’Etudes 1391 0 1 69 ,05 ,132 -,057(*) 0,034
Share of Kellogg, Northwestern 1391 0 1 35 ,02 ,073 0,027 0,308
Share of LSE 1391 0 1 16 ,01 ,060 -0,042 0,121
Share of Michigan 1391 0 1 28 ,02 ,079 ,190(**) 0
Share of MIT 1391 0 1 79 ,06 ,166 ,125(**) 0
Share of NYU/Stern 1391 0 0 1 ,00 ,013 -0,048 0,071
Share of Oxford University 1391 0 1 86 ,06 ,138 -,061(*) 0,023
Share of Princeton University 1391 0 0 7 ,01 ,027 -0,018 0,511
Share of Queen’s University 1391 0 0 8 ,01 ,037 -0,012 0,662
Share of Stanford 1391 0 1 60 ,04 ,102 -0,012 0,651
Share of Stockholm School of Ec. 1391 0 1 20 ,01 ,083 -0,05 0,063
Share of UCLA 1391 0 1 6 ,00 ,040 0,042 0,116
Share of University of Chicago 1391 0 1 37 ,03 ,108 0,007 0,808
Share of Uni Illinois (Urb-Ch.) 1391 0 0 7 ,01 ,027 0,019 0,487
Share of Notre Dame 1391 ,00 1,00 41,61 ,0299 ,11777 0,013 0,63
Share of University of Texas 1391 0 1 25 ,02 ,122 0,008 0,759
Share of University of Virginia 1391 0 1 30 ,02 ,078 ,061(*) 0,024
Share of Wharton 1391 0 1 91 ,07 ,115 -0,023 0,388
Share of Williams College 1391 0 0 11 ,01 ,035 0,026 0,334
Share of Yale 1391 0 1 33 ,02 ,093 -0,022 0,407
(1) Total sample size of tested cases (all realized transactions). (2) Number of cases where dummy variable = 1, i.e. number of transactions per variable tested. ** Correlation is significant at the 0.01 level (2-tailed). * Correlation is significant at the 0.05 level (2-tailed).
Table 51: Descriptive and Correlation Statistics on Buyout Firm Deal Experience Variables (Unis)
5.2.6.1.4. Manager/Team Diversity and Hierarchy Effect
Which of member buyout teams is contributing most to buyout success and is there an optimal
team size? First, by investigating team size, the results suggest that the number of investment
managers in a buyout firm team is significantly (at the 0.1 level; 2-tailed) and negatively correlated
with IRR. This finding has two implications: overstaffed buyout firms and/or overstaffed deal
teams lead to negative buyout returns. This trend would be similar to findings in section 5.2.3.1.
170 The sample size is regarded sufficient for some of the top universities that have a high number of cases.
Nonetheless, it needs to be acknowledged that despite the same set of investment managers, this statistical

Empirical Part II – Buyout Firm and Manager Value Drivers 261
(and 5.2.4.3.) that average returns per buyout professional (and according to deal team size) are
decreasing with increasing buyout fund size (team size). Secondly, the correlations show that a
high share of buyout fund partners in a deal is significantly (p<0.01) and positively, while a high
share of senior and junior investment managers is significantly (p<0.01) and negatively correlated
with deal IRR. These results are partially in contradiction to the above findings on tenure and
Private Equity experience, which showed that these variables are negatively correlated with
performance. Based on this trend, it was inferred that junior and senior investment managers may
play an important role in value generation (based on the homogeneity variable). By contrast here,
from a hierarchical and team composition point of view remains critical to have a high partner
share involvement to guarantee deal success. This finding speaks in favor of the learning curve
hypothesis by which the partners’ higher frequency of repetitive deal-making leads to positive
experience curve and performance effects. Also, the fact that partner involvement is positive does
not contradict the fact that very long tenure and experience is negative; what could well be
imagined is that “young” partners’ involvement is positive, “old” partners’ is not.
However, the homogeneity of hierarchy variable suggests that the more homogeneous a deal team
is from a hierarchical point of view, and based on the prior finding the higher the ratio of partners
to junior and senior investment professionals is, the better the deal performance. This could be
understood as a counter-argument to diversity theory. The ideal deal team therefore appears to be a
small team of young partners and senior investment managers. With respect to juniors, the findings
can be understood as evidence why it may take a long time for junior buyout fund investment
professionals to gain responsibility in transaction decision-making: their initial impact on the team
during their “learning years” appears to affect the team’s deal performance with lower returns.
5.2.6.2. Coefficient Statistics Analysis
The coefficient statistics provide a complete overview of all variables utilized in the regression
model. A range of control variables for entry and exit year, type and mode, as well as for countries
and industries are introduced, in order to control for the various significant value creation effects
found throughout the first empirical chapter.171 These will not be further discussed at this point.
With respect to the focal buyout team characteristics variables in this examination, a range of
(significant) variables has been excluded from the regression model due to strong multicollinearity
effects between them. Variables have therefore been added selectively, according to their bivariate
significance levels. The remaining tolerances observed in the collinearity statistics are notably
analysis differs from the descriptive section as is designed to capture buyout team characteristics, while the descriptive section is based on individual managers.
171 Note that due to the smaller sample size available for the variables utilized in this regression analysis model, control variables may have changed slightly to the previous findings on the complete sample. The variables have been identified according to their significance and correlation with the dependent variable IRR in a bivariate correlation matrix (complete matrix omitted here). Please note that General Partner control variables are omitted here, as they are highly correlated with the variables under review. In other words, since the “GP effect” is being analyzed in detail in this section, it cannot be controlled for.

Empirical Part II – Buyout Firm and Manager Value Drivers 262
higher than in earlier regressions in this study, but are considered acceptable in this specific context
as the various characteristics of investment managers regarding their education (degrees,
universities), professional (prior jobs), and time (age, tenure, etc) experience profiles are naturally
correlated to a certain degree. It was endeavored to cap variance inflation factors of the variable
coefficients at 5.0 (maximum VIF is 4.683), well below the allowable cap of 10.0 suggested by
Neter, Wassermann et al. (1985).
Coefficients(a)
Model Unstandardized Coefficients
Standardized Coefficients
t Sig. Collinearity Statistics
B Std. Error Beta Tolerance VIF
7 Dummy Variables
(Constant) ,243 ,349 ,696 ,486
Entry Year 1983 1,943 ,799 ,069 2,431 ,015 ,795 1,258
Entry Year 1984 2,547 ,990 ,074 2,572 ,010 ,776 1,288
Entry Year 2000 ,088 ,118 ,023 ,746 ,456 ,686 1,457
Entry Year 2001 ,820 ,212 ,113 3,873 ,000 ,751 1,332
Exit Year 1989 2,126 ,807 ,075 2,634 ,009 ,780 1,283
Exit Year 1990 2,343 ,978 ,068 2,396 ,017 ,796 1,256
Exit Year 2001 -,294 ,119 -,090 -2,478 ,013 ,480 2,082
Exit Year 2002 ,101 ,147 ,022 ,688 ,491 ,618 1,617
SFTCS ,333 ,126 ,073 2,647 ,008 ,842 1,188
SPFIN ,997 ,280 ,093 3,561 ,000 ,941 1,063
U.S./Canada ,152 ,142 ,053 1,074 ,283 ,266 3,763
ACQUISITION ,270 ,110 ,086 2,459 ,014 ,521 1,919
BANKRUPTCY (Mode) -1,865 ,520 -,093 -3,586 ,000 ,941 1,062
PRIVATE EXIT ,394 ,233 ,061 1,689 ,091 ,482 2,073
PUBLIC EXIT ,970 ,210 ,131 4,625 ,000 ,799 1,252
UNREALISED (Mode) -,454 ,110 -,145 -4,134 ,000 ,518 1,931
NEGOTIATED SALE -,047 ,216 -,008 -,217 ,828 ,431 2,318
UNREALISED (Type) ,029 ,173 ,006 ,168 ,867 ,504 1,986
GP Characteristics Variables
Number of Managers -,005 ,015 -,013 -,341 ,733 ,416 2,406
Homogeneity of Tenure (SD) ,011 ,031 ,018 ,352 ,725 ,253 3,953
Share of Junior Professionals -1,615 ,425 -,132 -3,799 ,000 ,525 1,905
Homogeneity of Average History with Team (StDev)
-,026 ,041 -,024 -,650 ,516 ,460 2,172
Average Tenure ,010 ,019 ,021 ,506 ,613 ,358 2,792
Share of Law Degrees ,056 ,748 ,003 ,075 ,940 ,389 2,573
Share of Other Degrees ,736 ,453 ,089 1,625 ,104 ,214 4,683
Homogeneity of Degrees -,940 ,377 -,098 -2,496 ,013 ,417 2,400
Share of 3rd Degrees ,861 ,700 ,051 1,229 ,219 ,366 2,733
Share of Bachelor Degrees -,138 ,377 -,019 -,367 ,714 ,235 4,255
Share of Engineering Degr. ,503 ,521 ,044 ,964 ,335 ,301 3,326
Share of Accounting -,457 ,806 -,029 -,566 ,571 ,246 4,067
Share of Private Equity ,219 ,616 ,018 ,356 ,722 ,242 4,133
Share of Management Funct. 3,689 ,741 ,220 4,977 ,000 ,325 3,075
Share of Banking -,350 ,354 -,036 -,990 ,323 ,494 2,026
Share of Georgetown ,939 1,191 ,033 ,788 ,431 ,371 2,693
Share of INSEAD ,304 ,356 ,031 ,854 ,393 ,485 2,062
Share of Institut d’Etudes Pol.
-,096 ,582 -,009 -,165 ,869 ,217 4,605
Share of Uni Michigan 2,173 ,585 ,131 3,715 ,000 ,513 1,950
Share of MIT ,660 ,931 ,036 ,708 ,479 ,252 3,975
Share of NYU/Stern -2,972 2,737 -,029 -1,086 ,278 ,895 1,117
Share of Oxford University ,371 ,546 ,033 ,679 ,497 ,275 3,639
Share of Uni Virginia 3,078 ,667 ,145 4,615 ,000 ,651 1,536
(a) Dependent Variable: Gross IRR Performance
Table 52: Coefficients and Collinearity Statistics on Buyout Firm Team Experience Variables

Empirical Part II – Buyout Firm and Manager Value Drivers 263
The analysis of the buyout team characteristics variables shows that significance levels are
considerably lower for several of the variables that had shown high Pearson correlations. The
standardized Beta coefficient for a high share of junior professionals in a buyout firm (p<0.01)
team is related to a negative performance impact on IRR. The homogeneity of degrees standardized
Beta coefficient is negative and significant in the model (p<0.05) which suggests that a greater
diversity of degree types, i.e. business, engineering, law, arts and other degrees, are associated with
higher buyout performance. The standardized Beta for a high share of management function
experience is 0.22, and therefore the single most important General Partner characteristic variable
to explain buyout performance (significant at the 0.001 level). This finding entails a strong
recommendation to the recruitment strategy of buyout funds: the common pools consisting of
numerous bankers, consultants and lawyers at LBO firms would benefit from adding corporate
managers, who have gained operational and industry specific knowledge, to their investment
manager teams.
5.2.6.3. Linear Regression Models Analysis
The linear regression model describing the explanatory strength of the buyout firm team
characteristics variables is strong. Considered individually, all individual regression models are
highly significant (p<.001), with F values ranging between 9.093 for model 5 to 11.901 for model 3
(models omitted here). When considering the change statistics of the nested models 1-7, it can be
observed that the stepwise introduction of control variables in all models 1-7 is highly significant
(p<.01), reaching a total adjusted R square of 24.9% in model 7. In other words, this regression
model explains about one quarter of all variance in buyout returns. The combined control variables
in this analysis, as exhibited in model 3, reach 14.3%.172 Therefore, the total contribution to the
model’s explanatory strength through the GP characteristic variables is 10.6% (in this sample).
Model 4 introduces the first set of GP characteristic variables, consisting of the GP time-
dependent/experience, hierarchical, team size and team structure variables. The introduction leads
to a small improvement of adjusted R square by 0.8% to 15.1%. The change in F value of 3.267 is
significant at the 0.01 level (2-tailed). This underlines that the organization structure of buyout
funds, their team structure configuration and buyout experience profile have a small, but significant
impact in itself on the value generation process carried out by the fund’s investment professionals.
Model 5 introduces the GP team education background variables, which leads to an improvement
of adjusted R square by a further 1.5% to 16.6%. The change in F value of 4.476 is highly
significant at the 0.001 level (2-tailed). This result provides important evidence for both the
General Partner’s recruitment activities and Limited Partner’s due diligence scope: the education
profile of investment managers is important to the extent that the level and number of degrees
earned, the type of degree (major), and most critically, the combination of different education

Empirical Part II – Buyout Firm and Manager Value Drivers 264
backgrounds (diversity) is quintessential for a buyout fund’s success. For instance, the low
frequency of law, arts and other degree graduates compared to business (and engineering)
graduates in the buyout industry is not justified from a return standpoint.
Linear Regression Model Summary Change Statistics Model R R Square Adjusted
R Square Std. Error
of the Estimate
R Square Change
F Change df1 df2 Sig. F Change
1 ,253(a) ,064 ,058 1,381353 ,064 10,008 8 1168 ,000
2 ,311(b) ,096 ,088 1,359048 ,032 13,884 3 1165 ,000
3 ,395(c) ,156 ,143 1,317386 ,060 11,693 7 1158 ,000
4 ,410(d) ,168 ,151 1,310986 ,012 3,267 5 1153 ,006
5 ,432(e) ,187 ,166 1,299288 ,019 4,476 6 1147 ,000
6 ,497(f) ,247 ,225 1,252608 ,060 22,771 4 1143 ,000
7 ,525(g) ,275 ,249 1,232958 ,029 5,590 8 1135 ,000
(a) Predictors: (Constant), Entry and Exit Year Dummies. (b) Predictors: (Constant), above, plus Industry and Country Dummies. (c) Predictors: (Constant), above, plus Entry and Exit Type/Mode Dummies. (d) Predictors: (Constant), above, plus Homogeneity of History with team, Average Tenure, Homogeneity of Tenure, Share
Junior Investment Professionals, Number of Managers. (e) Predictors: (Constant), above, plus Share of Engineering Degrees, Share of Law Degrees, Share of Other Degrees, Share of
Bachelor Degrees, Homogeneity of Degree Type (f) Predictors: (Constant), above, plus Share of Management Functions, Share of Banking, Share of Accounting, Share of Private
Equity (g) Predictors: (Constant), above, plus Universities: Share of NYU/Stern, Share of University of Virginia, Share of Michigan,
Share of INSEAD, Share of Georgetown, Share of Oxford University, Share of MIT, Share of Institut d’Etudes Politiques de Paris.
Table 53: Linear Regression Model on Buyout Firm Deal Experience Variables
Model 6 introduces the professional experience variables of investment manager teams, which
leads to a very high improvement of adjusted R square by 5.9% to 22.5%. The immense change in
F value of 22.771 is significant at the 0.001 level (2-tailed). The large improvement in the
explanatory strength of the overall GP characteristics regression model in this 6th step emphasizes
the magnitude of buyout manager’s professional experience on success in leveraged buyouts. As
highlighted in the correlation and coefficient analysis, deal performance depends to a large extent
on prior professions, e.g. accountants demonstrated an adverse effect in the team context, while
corporate managers and investment professionals from other Private Equity funds clearly seem to
add value. From a practical standpoint, some of these findings, if developed further, could be
embraced as recruitment recommendations for buyout funds.
Finally, Model 7 introduces the variables on (significant) attended universities by investment
managers, which leads to a further substantial improvement of adjusted R square by 2.4% to
24.9%. The change in F value of 5.590 is significant at the 0.001 level (2-tailed). The improvement
in the explanatory strength of the overall GP characteristics regression model in this 7th step
suggests that universities have an influence on buyout returns. However, no logical pattern could be
observed from this small sample of universities in the sample.173
172 The combined explanatory strength of control variables is lower here than in section 4.3.10.3., as GP
control variables have been omitted as these indirectly represent the focal variables in this analysis. 173 The low number of universities in the regression model compared to the available universe of variables
relates to strong multicollinearity effects between universities and other GP characteristic variables, i.e.

Empirical Part II – Buyout Firm and Manager Value Drivers 265
The introduction of each group of buyout firm characteristics variables in this nested multivariate
regression model led to a significant improvement in (i) the explanatory strength (R square) and (ii)
the model’s fit (F value) towards an elucidation of leveraged buyout performance. Combined with
the findings in the following section 5.3. on buyout experience and learning (curve) processes at
General Partners, it can be concluded that buyout performance is clearly driven by a “GP effect”.
Besides the market, financial and acquisition related control variables introduced in this study in
order to control for entry and exit conditions and (industry) financial performance, future analysis
of leveraged buyouts should equally focus on the human factor as key lever. As shown by these
exploratory results, by means of systematically analyzing and understanding the dynamics of
buyout firms and their investment managers, a great extent of variance in leveraged buyout
performance can be explained.
5.2.7. Summary of Findings
This section has shown important findings with respect to investment manager and buyout firm
characteristics, and their impact on performance. First, education has been identified as one area
through which buyout professionals can differentiate themselves and the return characteristics of
the fund. Buyout professionals typically undertake a combination of undergraduate degree and an
MBA from one of the leading business schools, although there is also a high frequency of triple
degree, including PhDs and JDs. Among most frequently visited institutions, Harvard University
clearly dominates the Private Equity industry with most graduates (14.3% of all degrees and 33.9%
of all MBAs). From a return perspective (within the team context), results are very mixed, but the
bivariate correlations suggest that both a high share of business and engineering degrees in a
buyout team are adversely affecting returns, while law and other degrees have a positive impact.
Business degrees were expected to perform well alongside with lawyers in the team context, hence
variable hypothesis H28 has to be rejected. The homogeneity variable substantiates the fact that
educational diversity among buyout teams is benefiting returns. Also, the correlation suggest that
master degree graduates appear to perform worse than other graduates in the team context,
however, viewed from an individual buyout professional perspective, both engineers and master
graduates do achieve high returns. Since only bachelor degrees performed significantly and
positively, it cannot be stated that higher education generally has a positive effect on returns, hence
variable hypothesis H29 has to be rejected. Also, variable hypothesis H30 has to be rejected as a
higher number of degrees was statistically not clearly favorable. Nevertheless, the 3rd degree
category was the only one to demonstrate positive correlations and was slightly below the
significance level of 0.1 (2-tailed).174 Variable hypothesis H31 can generally be accepted, as both
the descriptive and statistical test made explicit that managers attended the world’s top universities
most universities had to be excluded. Moreover, coefficients are non-significant, hence, no recommendation such as to answer the question of which universities represent the best educational basis for successful buyout managers can be made at this point in time.
174 The third degree consisted of 40% MBA and PhD/JD degrees each.

Empirical Part II – Buyout Firm and Manager Value Drivers 266
when compared to frequently published university rankings. However, the still limited sample size
could not offer firm conclusions with respect to which universities would be recommendable for
buyout manager education.
With respect to the professional experience of investment managers it can be stated that the
diversity is immense and that they receive professional training from the world’s leading financial
services, consulting, accounting and law firms. The analysis also reveals that investment managers
have created a network across academia, industry associations, government-linked bodies and even
charitable organizations. From a returns perspective, on an individual basis, investment
professionals with prior Private Equity, banking and finance or corporate management experience
perform well. Within the buyout firm team context, a higher share of Private Equity and
management experience continue to show very positive correlations with performance, but
banking, consulting and especially accounting perform dismal. Variable hypothesis H33 therefore
has to be rejected, as banking experience did not prove to be buyout return enhancing. This leads to
the conclusion that recruiting strategies of buyout funds may not be optimal, i.e. that a lack of
diversity within the team affects returns. However, the variable for size of network showed that
broad professional experience in the team was negatively correlated and not significant, hence
variable hypothesis H32 has to be rejected. Practically this result could imply that buyout firms not
necessarily rely on an excessively large network, but probably rather “the right one”.
The time experience variables age, tenure and Private Equity experience, have produced results
contradictory to expectations. From the descriptive findings, it could be established that after a
certain age of buyout partners, their acquisition performance declines consistently. For tenure and
years of industry experience, it appears as if senior investment professionals, aspiring to become
partner, as well as young partners perform better than more experienced partners. This may lead to
the assumption that both intrinsic and extrinsic motivation, as described by Amabile (1988) and
Amabile, Hill et al. (1994), does have a certain peak. Within the team context, the correlation
statistics support the fact that those partners with longest tenure and Private Equity experience
adversely affect returns. Hence, variable hypotheses H25-H27 have to be rejected, which had
suggested that higher experience would lead to higher returns. However, the team hierarchy and
diversity correlations revealed that a high share of junior professionals has an adverse effect, a
higher share of partners a positive effect on performance. Variable hypothesis H35 therefore has to
be rejected. In line with this finding, deals performed better when there was a lower amount of
different hierarchies involved, which in conjunction with the prior finding speaks against junior
professionals. Variable hypothesis H34 can thus be accepted.
The descriptive findings demonstrated that there may be an optimal buyout firm team size.
Historically, the most successful GP team size based on the Limited Partners’ data on average
consisted of 15 buyout professionals, undertaking transactions with an average investment size of
US$ 24 million (assuming a 3 to 1 debt to equity ration, this implies an average transaction size of
US$ 100 million, i.e. larger mid-cap deals). This is substantiated by the fact that buyout firm teams

Empirical Part II – Buyout Firm and Manager Value Drivers 267
with a high number of investment managers perform worse, which leads to acceptance of variable
hypothesis H36. However, it can be reasoned that the increase of fund sizes may shift the “optimal
deal team size” to a larger number in the future. There appears to be no clear argument for team
diversity according to age or position. However, there was directional statistical evidence that the
impact of new members to the team with prior Private Equity experience resulted in a positive
performance effect, but this result was non-significant, which leads to rejection of variable
hypothesis H37.
The homogeneity construct led to mixed results as well. In contrast to the above mentioned positive
influence of a lower, i.e. more homogenous, amount of hierarchies, non-homogenous tenure and
years of Private Equity experience are favorable. Hence, this does support a certain degree of
diversity of professionals in the team, but due to the findings for experience, successful teams
should rather consist of younger than older partners. As a consequence, all variable hypotheses
regarding homogeneity have to be rejected, expect for H46.
The linear regression analysis suffered from high multicollinearity between the investment
manager and GP firm characteristics variables, and hence, the explanatory power was inhibited due
to the fact that a very limited amount of variables could be introduced. Nevertheless, in
combination with a range of control variables, a quarter of variation in buyout performance could
be explained. Among the constructs, especially professional experience appears to affect
performance and only to a lower extent education, team structure, time experience and team
homogeneity.
Empirical Part II – Buyout Firm and Manager Value Drivers 268
5.3. Modeling the Buyout Firm Experience Effect
In the first empirical part of this study, it was established that market and acquisition related, as
well as several financial drivers, especially with respect to entry and exit conditions of buyouts,
have an effect on the value creation process of leveraged buyout transactions. The initial analysis of
General Partner performances had shown that (i) there is a great variance in returns between
different General Partners, (ii) some General Partners are significantly performing better (or worse)
than their peers (see section 5.2.1.). In this chapter, it was so far highlighted that the factors “GP
team” and “Buyout Investment Manager” are both contributing to explaining buyout performance
through a set of personal and firm-wide characteristics. Despite some mixed findings, it was
generally recognized that the assembled experience of investment managers, especially partners, in
buyout firms is a critical determinant of buyout success or failure. In this section, a further
statistical test will be performed in order to further understand the buyout firm’s “deal experience”
construct. The deal-making capability of buyout firms will be tested by introducing several “buyout
experience” variables designed to capture the respective buyout firm’s investment history relative
to its success. This test is eventually designed to receive a better understanding of investment
strategies of buyout firms and to demonstrate which strategies potentially add the highest value.
5.3.1. Test Setting
This section intends to analyze whether buyout firms undergo a learning curve effect on their
various leveraged buyout acquisitions, i.e. whether buyout firms with more transaction experience
achieve higher returns, and if they do, under which conditions. Yelle (1979) has introduced the
notion of the learning curve effect, which has been studied in a range of areas in the social sciences.
However, learning-by-doing in the sense of the common learning-curve effect vitally depends on
the characteristics of the task to be mastered. In order for the learning-curve effect to be successful,
both a sufficient frequency and similarity of the task under review – may it be production
processes, corporate acquisitions or leveraged buyouts – are a necessary prerequisite to accrue tacit
knowledge and develop competencies within the respective organization that can be effectively
reapplied. As a consequence, the learning curve development may be inhibited if the characteristics
of the task require overly complex organizational capabilities, which are especially necessary in
strategic acquisitions that are exposed to far-reaching organizational change and integration
processes.
By contrast, leveraged buyouts represent a distinctive type of corporate acquisition. In comparison
to strategic acquisition, buyout firms undertake acquisitions at a far larger rate (as this is their
“task”). Organizational change in these standalone acquisitions, e.g. in form of restructuring, cost
reduction or growth strategies, is generally designed to create and monetize value for the investing
fund over a short and limited time horizon. By contrast, strategic acquisitions usually require a

Empirical Part II – Buyout Firm and Manager Value Drivers 269
range of long-term and complex organizational integration activities in order to extract synergies
that merit the acquisition per se. The long-term nature of strategic mergers and acquisitions through
the accompanying integration processes also makes it more difficult to assess their performance.
However, the performance of buyouts can straight-forwardly and objectively be evaluated through
the consistently employed dependent variable IRR in this study. Leveraged buyouts therefore
represent an ideal test setting to analyze whether the high frequency of deal-making of buyout
funds leads to learning curve effects and better performance.
Three main constructs will be measured to assess the learning experience and investment behavior
effect among buyout firms. First, the buyout acquisition experience magnitude of buyout firms will
be examined, i.e. the frequency of prior buyout transactions according to total number of deals,
number of deals in a certain industry, number of deals in a certain deal-size class, number of deals
in a certain geographic region/country and number of deals that used a certain exit route. This
procedure allows expanding the scope of analysis into the investment behavior of buyout funds.
Alongside, it can also be investigated to what degree the current focal transaction is similar (i.e.
homogeneity of focal buyout) or dissimilar (novelty of focal buyout) compared to all prior
investments that a buyout fund has executed, again within the deal characteristic categories set out
above. The results are expected to provide valuable recommendations for practitioners – buyout
firms and their investors – with respect to which investment strategies and what type of focus leads
to superior returns.
5.3.1.1. Tested Variables and Hypotheses
With respect to the construct of buyout acquisition experience magnitude, it would be expected –
according to the traditional learning-curve argument – that a higher amount of previous deal
experience, measured by total number of executed deals or according to specific deal types, will
have a positive direct effect on the available “acquisition knowledge” in buyout firms.
Consequently, it can be expected that
H47a.) Gross buyout deal performance is higher for transactions, in which there is a larger
number of previous transaction experiences of the buyout firm with relevant prior
buyout deals, as there is a larger stock of available applicable knowledge in the firm.
Conversely, it needs to be considered that a large buyout acquisition experience magnitude could
also have adverse effects. Frequent repetition promotes development of organizational routines
Nelson and Winter (1982), which lead to quasi-automatic behavior, reducing this level of attention.
A low level of attention in turn increases the risk of superstitious learning and inaccurate
application of insights gained from prior buyout deal experiences. This leads to the expectation
that buyout acquisition experience magnitude at buyout firms may also have a negative impact on
performance:

Empirical Part II – Buyout Firm and Manager Value Drivers 270
H47b.) Gross buyout deal performance is lower for transactions, in which there is a larger
number of previous transaction experiences of the buyout firm with relevant prior
deals due to the lower level of attention to the idiosyncratic characteristics of the focal
buyout deal.
The amount of applicable knowledge and the level of attention do not only depend on the sheer
quantity of prior buyout deal experiences, but also on their quality, namely the similarity between
past transactions and the focal deal as well as the homogeneity with past experiences. With respect
to the degree of novelty of the focal deal, it can be expected – according to learning curve theory –
a ceteris paribus negative impact, as the present amount of applicable knowledge in the buyout firm
developed through prior deal experiences differs and hence should be negatively related to task
performance:
H48a.) Gross buyout deal performance is lower for transactions, in which there is a
greater degree of novelty of the focal deal compared to previous deal experience
of the buyout firm, as there is a smaller stock of available relevant transaction
knowledge.
On the other side, novelty of the focal deal could also have a beneficial effect. The more obvious
the differences are between the focal deal and previous deal experiences, the greater the probability
that the buyout firm will recognize these differences and pay attention to the particularities of the
focal deal. Hence, transaction novelty may increase ceteris paribus the level of attention to the deal
and reduces the danger of suboptimal performance due to superstitious learning or the inaccurate
application of insights gained from prior deal experiences:
H48b.) Gross buyout deal performance is higher for transactions, in which there is a
greater degree of novelty of the focal deal compared to previous deal experience
of the buyout firm, as there is a higher level of attention to the idiosyncratic
characteristics of the focal buyout deal.
Likewise, it is expected that the degree of similarity of prior buyout deals is an important
determinant of complex organizational capabilities. Homogeneous task experiences, i.e. the
repeated execution of various similar deals in the buyout context, facilitate the accumulation of
knowledge (March, Sproull et al. 1991). Therefore, it would ceteris paribus be expected to find a
positive relationship between buyout deal experience homogeneity and deal performance:
H49a.) Gross buyout deal performance is higher for transactions, in which there is a
greater degree of homogeneity between the focal deal and previous deal
experiences in the buyout firm, as there is a larger stock of available applicable
knowledge within the firm for similar buyout deals.
Again, the potential opposite effect of deal experience homogeneity needs to be acknowledged.
Deal experience homogeneity contributes ceteris paribus to the rapid development of
organizational routines (Nelson and Winter 1982), but may also lower the level of attention to the

Empirical Part II – Buyout Firm and Manager Value Drivers 271
idiosyncratic characteristics of the focal deal, which in turn could have a detrimental impact on task
performance.
H49b.) Gross buyout deal performance is lower for transactions, in which there is a
greater degree of homogeneity between the focal deal and previous deal
experiences in the buyout firm, as there is lower attention to the idiosyncratic
characteristics of the focal buyout deal.
In summary, it has been established that buyout acquisition experience magnitude, homogeneity
and novelty of the focal deal can all exert a positive or negative (direct) effect on acquisition
performance. The reason for this apparent paradox lies in the differential influence that each of
these three variables has on the two components of complex organizational capabilities: the
applicable stock of “deal-making knowledge” and the level of attention to the idiosyncratic
characteristics of the focal buyout deal.
5.3.1.2. Methodology and Data
Contrary to previous sections in this study, this section will not present data on a descriptive
graphical basis, as this is less useful in this context. Instead, the test relies exclusively on regression
analysis.
Explanatory Variable Operationalization Definition
Overall Experience Magnitude The number of buyouts completed by the buyout association prior to the year of the focal buyout
Experience Magnitude within Industry Category
The number of buyouts completed by the buyout association prior to the year of the focal buyout in the same industry category as the focal buyout.
Experience Magnitude within CountryThe number of buyouts completed by the buyout association prior to the year of the focal buyout in the same country as the focal buyout.
Experience Magnitude within Size
Category
The number of buyouts completed by the buyout association prior to the year of the focal buyout in the same size category as the focal buyout.
Experience Magnitude within Exit ModeThe number of buyouts completed by the buyout association prior to the year of the focal buyout in the same exit mode as the focal buyout.
Novelty of IndustryThe percentage of buyouts completed by the buyout association prior to the year of the focal buyout that took place in a different Industry category.
Novelty of CountryThe percentage of buyouts completed by the buyout association prior to the year of the focal buyout that took place in a different country category.
Novelty of SizeThe difference between the size of the focal buyout and the average size of all buyouts completed by the buyout association prior to the year of the focal buyout.
Novelty of Exit ModeThe percentage of buyouts completed by the buyout association prior to the year of the focal buyout that took place with a different exit mode.
Industry HomogeneityThe sum across all industry categories of the squared percentages of buyouts completed in each industry category by the buyout association prior to the focal buyout.
Country HomogeneityThe sum across all country categories of the squared percentages of buyouts completed in each country category by the buyout association prior to the focal buyout.
Size HomogeneityThe standard deviation of the size of all buyouts completed by the buyout association prior to the focal buyout.
Exit Mode HomogeneityThe sum across all exit mode categories of the squared percentages of buyouts completed in each exit mode category by the buyout association prior to the focal buyout.
Table 54: Operationalization of Explanatory Variables

Empirical Part II – Buyout Firm and Manager Value Drivers 272
The above discussed homogeneity and novelty variables for buyout transactions have been
developed by calculating Hirfendahl indices, whose resulting values range between 0 (not
homogeneous; completely novel) and 1 (completely homogeneous; not novel). In some instances,
also standard deviations, i.e. the required degree of variance from the mean, have been utilized to
measure these constructs on the respective variables. The sample for this analysis consists of 1,130
realized and unrealized buyout transactions with a mean gross IRR performance of 61.4%.175
Several control variables that were developed in empirical part one will be introduced in the test.
Table 54 summarizes the above developed independent variables to measure the hypotheses in the
regression model.
5.3.2. Test Results
5.3.2.1. Descriptive Statistics
The examination of the bivariate Pearson correlation matrix between the dependent variable IRR
and the various independent buyout firm experience variables leads to some surprising and
controversial results. First, the number of previous deals is negatively and significantly (at the 0.1
level; 2-tailed) correlated with gross IRR performance. Moreover, the number of previous exits, i.e.
the realized transactions among all prior deals, is negatively and highly significantly (at the 0.01
level; 2-tailed) correlated with the dependent variable IRR.
Descriptive and Correlation StatisticsVariable (Dummy) Tested N(1) Mini-
mum Maxi-mum
Sum(2) Mean Std. Deviation
Pearson Correlation
Sig. (2-tailed)
Experience Variables (only)
Previous Deals Number 1130 0 243 35431 31,35 42,916 -0,052 0,079
Previous Exits Number 1130 0 207 26360 23,33 36,222 -,091(**) 0,002
Same Country Number 1130 0 155 18371 16,26 22,145 0,043 0,151
Same Industry Number 1130 0 55 5139 4,55 8,530 -0,03 0,32
Same Exit Mode Number 1130 0 191 9393 8,31 28,626 -,065(*) 0,029
Same Size Number 1130 0 90 16431 14,54 22,270 -,096(**) 0,001
Novelty Country (Percentage) 1130 0 1 1 ,00 ,030 0,017 0,574
Novelty Industry (Percentage) 1130 0 1,8 558,5 ,494 ,4095 0,024 0,414
Novelty Exit Mode (Percentage) 1130 0 1 115 ,10 ,302 ,094(**) 0,002
Novelty Size 1130 0 275,32 12365,55 10,94 21,75 ,075(*) 0,012
Homogeneity Country 1130 0 4 657 ,58 ,516 ,116(**) 0
Homogeneity Industry 1130 0 1,0 291,7 ,258 ,2883 0,016 0,597
Homogeneity Exit 1130 0 3 690 ,61 ,500 -0,003 0,917
Homogeneity Investment(3) 1130 0 103,28 12370,27 10,94 15,46 -0,004 0,884
Valid N (listwise) 1130
(1) Total sample size of tested cases (all realized transactions). (2) Number of cases where dummy variable = 1, i.e. number of transactions per variable tested. (3) Measured as Standard Deviation of Initial Investment. ** Correlation is significant at the 0.01 level (2-tailed). * Correlation is significant at the 0.05 level (2-tailed).
Table 55: Descriptive and Correlation Statistics on Buyout Firm Deal Experience Variables
175 Previous analysis throughout this study did not include unrealized transactions. However, in this context
of analyzing the experience of buyout firms, it is essential to include all transactions to ensure a complete experience profile.

Empirical Part II – Buyout Firm and Manager Value Drivers 273
Also, a high number of prior deals in the same size as well as same exit mode categories display
negative correlations with the dependent variable, significant at 0.01 and 0.05 levels (2-tailed)
respectively. Likewise, the opposite novelty variables for using different (novel) exit routes and
executing transactions in various (novel) deal sizes is positively and highly significantly (at the
0.01 and 0.05 level respectively) correlated with buyout performance. Finally, there is a strong and
significant (p<.01) correlation for country homogeneity of buyout deals, which implies that
focusing on one geographical region may be advantageous from a return perspective.
5.3.2.2. Coefficient Statistics
The coefficient statistics provide a complete overview of all variables utilized in the regression
model. As pointed out above, a range of control variables are introduced, e.g. for entry and exit
year, type and mode, as well as for countries, industries and General Partners, in order to control
for the various significant value creation effects found throughout empirical chapter one.176 These
will not be further discussed at this point. With respect to the focal experience variables in this
examination, two variables – number of previous total exited deals and number of previous same
exit deals – have been excluded from the regression model due to the strong multicollinearity
effects caused by them. The remaining tolerances observed in the collinearity statistics are
acceptable, with variance inflation factors generally below two. Noticeable but tolerable exceptions
are found among the experience variable, e.g. same size (VIF 3.3) and number of total previous
transactions (VIF 2.8).
The analysis of these experience variables shows that the number of prior transactions undertaken
by a buyout fund has a positive and significant (at the 0.05 level) impact on performance on the
current deal (high standardized Beta coefficient of 0.097). This is directionally opposite to the
Pearson correlation results and must be attributed to the importance of introducing the control
variables. This finding in general provides support for variable hypothesis H47a and rejects
variable hypothesis H47b, suggesting that a learning effect among leveraged buyouts as a special
type of corporate acquisitions exists. However, the variable’s coefficient measuring the number of
prior deals in the same size category is significantly (at the 0.05 level) and negatively affecting
buyout performance. This result is counter-intuitive to the widespread industry expert opinion, as it
implies that buyout fund should not focus all their deals on one specific deal size segment (e.g.
mid-caps). However, this result can also be interpreted in a more straight-forward way. As the
variable suggests that different deal sizes are favorable, it simply reflects what most successful
buyout firms would do anyhow – they constantly raise larger funds and enter into larger deals. In
other words, those funds that did not have an outperforming track record would also be unable to
raise larger funds at the same pace and can only invest in more similar sized deals. Assuming that
176 Note that due to the smaller sample size available for the variables utilized in this regression analysis
model, control variables may have changed slightly to the previous findings on the complete sample. The variables have been identified according to their significance and correlation with the dependent variable IRR in the bivariate correlation matrix (complete matrix omitted here).

Empirical Part II – Buyout Firm and Manager Value Drivers 274
the latter funds’ performance lacks behind those funds that are able to attract more capital and
quickly raise larger funds, the statistical direction of this variable is comprehensible.
Coefficients(a)
Model Unstandardized Coefficients
Standardized Coefficients
t Sig. Collinearity Statistics
B Std. Error Beta Tolerance VIF
7 Control Variables
(Constant) ,370 ,095 3,918 ,000
Exit Year 2002 -,745 ,206 -,104 -3,619 ,000 ,823 1,215
Entry Year 1998 ,478 ,143 ,094 3,333 ,001 ,845 1,184
Entry Year 1983 ,618 ,327 ,050 1,892 ,059 ,956 1,046
Exit Year 1989 1,290 ,267 ,128 4,832 ,000 ,960 1,042
Entry Year 1985 ,504 ,247 ,056 2,037 ,042 ,908 1,102
Entry Year 1984 ,758 ,272 ,075 2,790 ,005 ,928 1,078
Exit Year 2001 -,395 ,136 -,084 -2,897 ,004 ,810 1,235
Entry Year 1996 ,331 ,124 ,073 2,670 ,008 ,905 1,106
Entry Year 1999 ,552 ,182 ,086 3,029 ,003 ,840 1,190
Entry Year 2001 1,782 ,731 ,067 2,437 ,015 ,881 1,135
Entry Year 1997 ,243 ,123 ,056 1,979 ,048 ,851 1,175
Industry SPFIN ,542 ,239 ,061 2,264 ,024 ,934 1,071
Industry INFOH ,683 ,231 ,079 2,962 ,003 ,938 1,066
Industry SFTCS ,845 ,178 ,128 4,740 ,000 ,928 1,077
Industry FSTPA ,996 ,549 ,049 1,815 ,070 ,940 1,064
Industry TELCM ,573 ,202 ,078 2,833 ,005 ,893 1,119
GP 56 1,565 ,849 ,048 1,843 ,066 ,980 1,021
GP 12 ,968 ,460 ,056 2,104 ,036 ,957 1,045
GP 75 2,043 ,861 ,063 2,373 ,018 ,953 1,050
GP 42 1,880 ,417 ,123 4,503 ,000 ,906 1,104
GP 2 ,960 ,558 ,047 1,719 ,086 ,909 1,101
GP 22 3,443 ,473 ,199 7,284 ,000 ,907 1,102
GP 70 ,872 ,286 ,085 3,049 ,002 ,877 1,140
GP 81 -1,268 ,217 -,236 -5,832 ,000 ,411 2,434
BANKRUPTCY (Type) -1,559 ,700 -,059 -2,228 ,026 ,962 1,040
Germany/Austria/ Switzerland
1,030 ,374 ,074 2,755 ,006 ,927 1,079
PUBLIC EXIT ,326 ,149 ,068 2,188 ,029 ,704 1,420
ACQUISITION ,310 ,098 ,096 3,153 ,002 ,732 1,365
Tested Variables
Homogeneity Industry -,280 ,167 -,059 -1,681 ,093 ,540 1,850
Homogeneity Exit -,099 ,104 -,036 -,950 ,342 ,459 2,180
Homogeneity Investment -0,00 ,003 -,001 -,031 ,975 ,597 1,676
Homogeneity Country ,036 ,094 ,013 ,378 ,705 ,532 1,881
Previous Deals Number ,003 ,001 ,097 2,259 ,024 ,362 2,759
Same Country Number ,003 ,002 ,042 1,078 ,281 ,455 2,198
Same Industry Number -,002 ,006 -,014 -,386 ,699 ,509 1,966
Same Size Number -,006 ,003 -,105 -2,217 ,027 ,299 3,339
Novelty Country (Percentage)
,176 1,215 ,004 ,145 ,885 ,955 1,047
Novelty Industry (Percentage)
-,052 ,117 -,016 -,442 ,659 ,546 1,831
Novelty Exit Mode (Percentage)
-,128 ,146 -,028 -,874 ,382 ,641 1,560
Novelty Size ,006 ,002 ,089 2,910 ,004 ,721 1,388
(a) Dependent Variable: Gross IRR Performance
Table 56: Coefficients and Collinearity Statistics on Buyout Firm Deal Experience Variables
The above finding is further enhanced through the size novelty variable, which is highly significant
(p<.01) and displays a strong positive standardized Beta coefficient of 0.089. These results lead to
the rejection of variable hypothesis H48a and to the acceptance of variable hypothesis H48b. In
other words, the introduction of novel, changing (generally increasing) deal sizes leads to a higher

Empirical Part II – Buyout Firm and Manager Value Drivers 275
level of attention of the buyout firm to the idiosyncratic characteristics of each deal, and therefore
leads to higher buyout performance. This is also logical from a practical view point, as the intrinsic
motivation of buyout investment managers is likely to be higher when they are more or less
constantly allowed to work on the “new largest deal” for their buyout firm.
With respect to the homogeneity variables, it can be established that homogeneity of industry, i.e.
how similar is the focal deal’s industry to prior deals’ industries of the buyout firm. The
standardized Beta coefficient for this variable is negative (-0.059) and significant at the 0.1 level. In
essence, this finding supports variable hypothesis H49b and rejects variable hypothesis H49a. By
only focusing on one certain, or a small group of related industries, the buyout firm risks losing
attention to deal specific characteristics. As a consequence, it may tend to feel over-confident about
a particular transaction due to its strong sector expertise, which could lead it (i) to make unrealistic
assumptions about real value generation potential, (ii) to pursue relatively less attractive targets
than it would with a neutral industry perspective, or (iii) to overpay. However, this finding to some
extent contradicts current buyout industry trends of larger funds, which set up industry teams on
selective target industries in order to assemble strong industry expertise. It is also contradictory to
the emergence of industry specialist funds177. As a consequence, the specialization trend may only
be appropriate if the group of chosen target industries by the buyout firm is large enough to be able
to invest opportunistically into industries that demonstrate the highest potential at any given time.
As a reminder, in section 4.4., it was clearly established that favorable entry conditions for buyouts
are industry-dependent, hence investing only in a too narrow group of industries limits
opportunistic choice.
5.3.2.3. Linear Regression Models Analysis
The linear regression model describing the explanatory strength of the buyout firm experience
variables is very strong. Considered individually, all individual regression models are highly
significant (p<.001), with F values ranging between 13.851 for model 7 to 19.267 for model 3
(individual models omitted here). When considering the change statistics of the nested models 1-7,
it first can be observed that the stepwise introduction of control variables in models 1-4 is highly
significant (p<.001) on each level, reaching an adjusted R square of 22.5% in model 4. As observed
in several tests beforehand and in the expanded control variable analysis in section 4.3.10.3., the
control group already explains more than a fifth of all variance in buyout returns (22.5% in this
sample). Model 5 introduces the homogeneity variables, which leads to an improvement of
adjusted R square by 0.4% to 22.9%. The change in F value of 2.599 is significant at the 0.05 level
(2-tailed). Model 6 introduces the experience variables (except for same exit and number of exited
deals, due to multicollinearity considerations), which leads to an improvement of adjusted R square
by a further 0.5% to 23.4%. The change in F value of 2.760 is significant at the 0.05 level (2-
tailed). Finally, model 7 introduces the novelty variables, which leads to a further improvement of
177 Compare footnote 149.

Empirical Part II – Buyout Firm and Manager Value Drivers 276
adjusted R square by 0.4% to 23.8%. The change in F value of 2.475 is significant at the 0.05 level
(2-tailed). The introduction of each group of buyout firm experience variables in the nested
multivariate regression model therefore led to a significant improvement in (i) the explanatory
strength (R square) and (ii) the model’s fit (F value) towards an elucidation of leveraged buyout
performance.
Linear Regression Model Summary Change Statistics Model R R Square Adjusted
R Square Std. Error
of the Estimate
R Square Change
F Change df1 df2 Sig. F Change
1 ,271(a) ,073 ,064 1,315968 ,073 8,049 11 1118 ,000
2 ,335(b) ,112 ,099 1,291024 ,039 9,724 5 1113 ,000
3 ,470(c) ,221 ,204 1,213440 ,109 19,359 8 1105 ,000
4 ,494(d) ,244 ,225 1,197879 ,023 8,224 4 1101 ,000
5 ,501(e) ,251 ,229 1,194415 ,007 2,599 4 1097 ,035
6 ,508(f) ,258 ,234 1,190601 ,007 2,760 4 1093 ,027
7 ,515(g) ,265 ,238 1,187401 ,007 2,475 4 1089 ,043
(a) Predictors: (Constant), Entry and Exit Year Dummies. (b) Predictors: (Constant), above, plus Industry Dummies. (c) Predictors: (Constant), above, plus GP Dummies. (d) Predictors: (Constant), above, plus Entry and Exit Type/Mode as well as Country Dummies. (e) Predictors: (Constant), above, plus Industry Homogeneity, Exit Homogeneity, Investment Homogeneity, Country
Homogeneity. (f) Predictors: (Constant), above, plus Same Industry Number, Same Country Number, Previous Deals Number, Same Size
Number (g) Predictors: (Constant), above, plus Novelty Country (Percentage), Novelty Size, Novelty Exit Mode (Percentage), Novelty
Industry (Percentage)
Table 57: Linear Regression Model on Buyout Firm Deal Experience Variables
5.3.3. Summary of Findings
The analysis has shown that several variables relating to acquisition experience of buyout firms has
statistically proven to impact buyout performance. First, in the regression context the number of
previous deals undertaken by buyout firms has a positive influence on IRR. The findings generally
support the hypothesis that learning (curve) processes on the General Partner firm level constitutes
an important factor in the value creation process in leveraged buyouts. In simpler terms, it
indirectly supports the fact that buyout funds that have been in the business for longer are also the
more successful ones. Likewise, the finding that transactions in the same deal size category are
adversely affecting returns is in support of the fact that successful buyout funds are over time
constantly increase their fund and deal sizes. From this perspective are frequently voiced concerns
in the Private Equity industry regarding exacerbating growth in fund sizes to be rejected.178
The other key finding from the analysis is that an investment focus strategy by buyout funds on a
narrow range of industries can not be recommended, as this adversely affects the level of returns.
178 However, there are other factors, such as lower deal flow in the large cap segment as well as more
frequent use of auctions that may inhibit return growth in the future. Also, compare results in empirical chapter one.

Empirical Part II – Buyout Firm and Manager Value Drivers 277
As demonstrated in earlier results in empirical chapter one, buyout funds successfully take
advantage of industry financial and entry and exit conditions. As a consequence, by limiting the
investment choice to fewer industries, opportunistic investing is replaced through more gradual
investment along the industry cycles, which deteriorates the average level of returns. In addition,
investment criteria may be lowered for acquisition targets in a certain industry as buyout firms may
become over-confident with respect to their value creation strategies. Moreover, in the bivariate
correlations, investment in one geographic region was established to be favorable. In summary,
these results contributed to accepting the main hypothesis of this study that there is a “GP effect” in
leveraged buyouts, which positively influences buyout returns.
5.4. Conclusions
The second empirical chapter in this study has explored a so far nearly un-researched field in
Private Equity research – the characteristics and performance of individual investment managers as
well as buyout firms. The research model of this study had been designed, partially based on
industry expert views, in order to reflect – besides the crucial investment track record – also the
buyout firm team as one of the main drivers of value creation. The results in this chapter validate
the model’s design: among the investment manager professionals, several key characteristics were
established that led to higher performance. Education with respect to level, type and number of
degrees as well as the institution, at which the degrees were gained, demonstrated to be significant
factors. Professional experience had an even higher impact in the regression tested model, in
specific with very positive influence of investment managers who had worked at another Private
Equity fund beforehand or, more unexpectedly, were active as corporate managers at some stage
before joining the team. Other prior experience, especially accounting, but also banking and
consulting surprisingly proved to have adverse return effects on average. Besides the investment
manager characteristics, it was found that also the firm’s structure and team composition plays a
crucial role. The distribution of returns suggested that there may be an optimal team size, as larger
teams performed weaker. Within the teams, junior professionals did not contribute positively to
team performance and overstaffed teams were also disadvantageous. Instead, small, non-
hierarchical and effective teams with a (younger) investment management partner demonstrated to
be the optimal structure. There were clear indications that older buyout professionals after a certain
age, tenure and/or years of experience, have an adverse effect on performance. This finding led to
the conclusion that the intrinsic and extrinsic motivation of younger buyout professionals is higher.
In general, team diversity with respect to education, professional experience, and years of outside
Private Equity experience appears to be directionally leading to higher buyout returns. However,
significance levels could not support the diversity argument to the desired extent.
In addition to the investment manager and firm characteristics, the second major test in this chapter
examined the question whether a positive learning effect exists in buyout firms from their deal-
making activity. The findings spoke in favor of the learning curve theory, i.e. a larger amount of
Empirical Part II – Buyout Firm and Manager Value Drivers 278
deals as well as an increasing (non-homogenous) deal size contributes positively to performance.
This has been interpreted as being consistent with the reality of buyout fundraising activity, as
successful funds tend to be in the industry for a longer period, and have been able to continuously
increase capital commitments, which eventually led to increased deal sizes. The second key
conclusion from the General Partners’ investment track record was that their investment focus
should not be narrowed to a low number of industries, as this limits the buyout managers in their
ability to act opportunistically according to most favorable, relative industry conditions. The
existence of sector-focused funds would therefore not be supported or encouraged through this
analysis.
This empirical chapter has commenced the analysis of the “GP effect” in leveraged buyouts.
Having so far established the “characteristics” and “experience” components of buyout firms and
their managers, the final analysis in this study will now scrutinize the “strategic” component of the
GP effect on a more micro perspective at the buyout target company level. Consequently, the third
and final empirical chapter will focus both on the operational characteristics of acquired target
companies and will further explore the various strategic levers with respect to value creation taken
by buyout firms.

6. Empirical Part III – Buyout Strategies
6.1. Introduction
In the first chapter of empirical results, it was established that leveraged buyouts as part of the
Private Equity investment asset class do create superior value when compared to public markets.
This finding was achieved based on (i) the control population dataset from Venture Economics,
which included fund return data, as well as (ii) the Limited Partners’ primary dataset of individual
buyout transactions. The analysis further highlighted under which exogenous (i.e. market and
acquisition related) conditions buyout transactions were more likely to be successful. Moreover, an
analysis of the key financial accounting patterns – both on the target company level and with
respect to its underlying industry financial dynamics at the time of deal entry and exit – had
revealed where the value creation in buyout transactions stems from. From both the Venture
Economics fund return analysis as well as the deal level findings, it became evident that the
variance of success between individual deals, funds and the various General Partners was
considerable.
In the second chapter of empirical results, it was established that value creation potential in
leveraged buyouts is not only financially driven, but also depends to a large extent on the buyout
firm and its team of investment mangers that are undertaking the transaction. Consequently, the
chapter had shed light on the non-financial, human factor “Buyout firm and its Investment
Professionals” in more detail. This factor proofed to be an equally important driver in the buyout
value creation process as the performance results of General Partners differ considerably. Clear
links were established between buyout performance and certain (i) characteristics and profile of
buyout firm investment team professionals, (ii) characteristics and profile of buyout firms as an
organization and its team structure. In essence, investment managers’ education, professional and
age/deal experience profile, their position as well as the firm’s organizational structure in general
influences buyout success. Moreover, the existence of an experience-based learning effect of
buyout firms in executing transactions was tested successfully. This led to initial conclusions with
respect to the question whether a focused investment strategy followed by the buyout firm
regarding type of deal leads to superior value creation.
However, the findings on the “GP effect” in the value creation process gained from the second
empirical chapter are only the first step: the GP effect must also be analyzed with respect to
particular strategic actions taken by the investment managers and their firm during buyout
transactions. In other words, the buyout target’s characteristics, the buyout firm’s distinctive
strategies taken at the time of entry and exit of the acquisition as well as over the holding period
will eventually determine value generation accomplishments in each deal. The third empirical
chapter will therefore analyze these strategic decisions in more depth. The goal is to gain further

Empirical Part III – Buyout Strategy Value Drivers 280
insight towards answering the question of which buyout investment focus/strategies are the most
successful.
6.1.1. Test Setting
Similar to the investment manager and GP firm characteristics analyzed in the second empirical
chapter, the quantity of possible strategic and managerial decisions and hence universe of value
drivers and testable variables is almost infinite. This study has identified and focuses on three key
areas that may influence value creation:
- Target Company Characteristics
- Deal Decisions and Characteristics
- Acquisition Process and Strategic Events
This chapter therefore represents the closest, micro-level perspective to an examination of drivers
of value creation in this study. For the above outlined areas of analysis in this chapter, there will in
the following be a description of tested variables and brief discussion of “variable hypotheses” with
respect to the variable’s potential impact on buyout performance, followed by detailed statistical
regression analysis as well as summary interpretation of results.
6.1.1.1. Tested Variables and Hypotheses
The below discussed constructs on the one side represent some of the key due diligence areas,
which Private Equity fund of funds industry experts consider as relevant when analyzing the value
contribution of General Partners. In addition, several variables have exclusively been developed
based on the literature review on value creation in section 2.5. of this study and will be discussed
within this context. The amount of information provided by the General Partners about their
transactions is highly heterogeneous and remains generally sparse. The presentation of buyouts in
private purchase memoranda mainly serves marketing purposes and must therefore be considered
as biased at least to a certain degree. Additional due diligence of these transactions performed by
Limited Partners, especially highlighting some of the negative deal attributes, added significant
value to this analysis.
In the following, several exploratory hypotheses for the above outlined variable groups are
presented, based on (i) analysis of Private Purchase Memoranda and due diligence materials of the
Limited Partners, (ii) literature findings, and (iii) additional industry expert interviews. The
variables developed for this analysis were designed with the goal to measure (to the extent
possible) which target company characteristics, deal decisions and post-acquisition management
processes contribute to value creation. The following figure summarizes the constructs analyzed in
this chapter.

Empirical Part III – Buyout Strategy Value Drivers 281
Target Company
Characteristics
Target Company
Characteristics
Deal Decisions
and Characteristics
Deal Decisions
and Characteristics
Acquisition Process
and Strategic Events
Acquisition Process
and Strategic Events
Buyout Acquisition
Performance
Buyout Acquisition
Performance
Control VariablesControl Variables
H +/-
H +/-
H +/-Target Company
Characteristics
Target Company
Characteristics
Deal Decisions
and Characteristics
Deal Decisions
and Characteristics
Acquisition Process
and Strategic Events
Acquisition Process
and Strategic Events
Buyout Acquisition
Performance
Buyout Acquisition
Performance
Control VariablesControl Variables
H +/-
H +/-
H +/-
Figure 117: Strategic Drivers of Value Creation
6.1.1.1.1. Target Company Characteristics
In the first empirical chapter, buyout targets were classified according to their respective industries,
which offered initial insights about key targeted industries by buyout firms. Nevertheless, no
further insights about the specific company characteristics with respect to business strategy, market
position, etc. have been analyzed so far. However, it can be expected that buyout firms in their
evaluation of target companies pay particular attention to company specific characteristics in
support of their investment decisions. The following variables have therefore been developed in
order to examine key business characteristics from an investor perspective.
How international should a successful buyout target company be operating? From a buyout
investor perspective, the more global the operations of a target company are, (i) the higher could be
the potential for organic growth through greater penetration of (new) foreign markets with the
company’s products and services, however, (ii) the greater also the volatility/risk through increased
exposure to fundamentally different market cycles/dynamics, accompanied by a higher degree of
complexity required for due diligence, monitoring, control and strategic direction in certain
countries. It can therefore be expected that
H50.) Gross buyout deal performance is higher for target companies, which are operating on
a global basis due to their ability to penetrate more markets with their products and
services, thus reducing their dependency on a single domestic market.
Which type of goods do successful buyout targets sell? Although the answer to this question is to a
large extent dependent on the respective industry the company is operating in, the “LBO strategy
deal data sub-sample” in this chapter should demonstrate similar trends as observed both among the
control population dataset (compare section 4.2.2.6.), as well as the Limited Partners’ dataset
(compare section 4.3.4.). These sections had shown a general trend by which the service sector
performed best, followed by the consumer and industrial sectors. It is therefore expected that
H51.) Gross buyout deal performance is higher for target companies, which are operating in
the service sector than for companies in the consumer and industrial product sectors.

Empirical Part III – Buyout Strategy Value Drivers 282
Do companies operating in stable industries guarantee buyout success? The industry cycle
dynamics of buyout targets is one of the most scrutinized factors in due diligence by buyout
investors and their financing parties. Highly cyclical industries are frequently avoided as highly
leveraged companies face a substantial risk of default when exposed to cyclical downturns. During
the recession of the late eighties and early nineties, a range of corporate defaults were triggered due
to inadequate capital structures, i.e. an imbalance between assumed risk exposure and ability to
withstand sudden cyclical decline in business, stock market and industry performance. On the
contrary, as seen from the results in section 4.4., clever acquisition timing by buyout managers at
the beginning of a cyclical recovery imparts above average returns. It can therefore be expected
that
H52.) Gross buyout deal performance is higher for target companies, whose business
environment is more cyclical, as – according to efficient market theory – a higher
compensation for risk is required to compensate investors, and buyout firms may be
able to take better advantage of cyclical upturns.
Does higher market share necessarily lead to better performance? Porter (1985) has demonstrated
that there are several business strategy options in order to secure a competitive advantage in an
industry: (i) a high growth strategy to gain economies of scale allows companies to move into the
cost leadership position, taking significant market share, (ii) a diversification strategy that relies on
high quality, customer-tailored products and services, or (iii) a niche strategy, by which a
company’s business strategy is aimed at achieving a unique position in a segment, almost free from
competition. A non-defined and not well-pursued strategy approach may lead to a “stuck in the
middle” position. However, buyout firms frequently refer to their desire to acquire “industry
leaders” as these targets are perceived to enjoy highly defensive and stable characteristics. It is
therefore expected that
H53.) Gross buyout deal performance is higher for target companies, which have gained
a higher market share in their respective industry/markets.
Which generic business strategy leads to the highest buyout returns? Based on the above market
share hypothesis, it could follow that the relationship between market share and return may also be
dependent on business strategy. However, according to Porter, no generic business strategy can be
considered superior to another despite the fact that niche strategy target companies tend to have
small market shares, while diversifying and especially low cost producing companies aim for
higher market shares and/or industry leadership. As ceteris paribus no strategic option should be
superior, it is therefore expected that
H54.) Gross buyout deal performance is not significantly higher for target companies,
independent of their chosen generic business strategy.
How fragmented and competitive should an industry of a potential buyout target be in order to
generate superior returns? The target company’s industry structure and its overall competitiveness,
e.g. determined by the number of industry players and entry barriers, could be important indicators

Empirical Part III – Buyout Strategy Value Drivers 283
of buyout returns. As traditional micro-economics theory would suggest, a non-concentrated
market structure with intense competition is less likely to attain return levels found in monopolistic
or oligopolistic market structures. It is therefore expected that
H55.) Gross buyout deal performance is higher for target companies, whose industry
structure is characterized as non-concentrated, i.e. with a lower number of active
industry players.
How broad should a buyout target’s product range be to support high returns? In general, it could
be assumed that a broader product range would attract a larger customer base and therefore easily
lead to higher potential revenues. However, larger product ranges also inherit elevated cost bases
for research and development, marketing and sales and production, as only lower economies of
scale can be realized across the numerous variants. On the other hand, although the production and
marketing cost structure position of firms with single/small and similar product assortments is
favourable, it may be more vulnerable to fluctuations in customer demand and preference.
Pioneering work by Chandler (1962) and Ansoff (1965) established the motivations for corporate
diversification and the general nature of the diversified firm. Rumelt first investigated the
relationships among diversification strategy, organizational structure, and economic performance,
highlighting differences in performance according to the degree of “relatedness” (of products,
markets, etc.) (Rumelt 1974; Rumelt 1977). Nathanson and Cassano (1982) were among the first to
find that increasing product diversity was negatively correlated with performance, which
contributed to initiate the subsequent discussion during the late 1980s and early 1990s on firm’s
core competencies. It can therefore be expected that
H56.) Gross buyout deal performance is higher for target companies, whose product and
service portfolio is limited and focused, as the benefits of product diversification
do not outweigh the associated diversification costs.
How diversified should a buyout target’s customer base be from a return perspective? The size of a
company’s customer base is commonly reliant on the firm’s product portfolio and chosen generic
business strategy. According to Porter (1985), strong bargaining power from customers can
adversely affect an industry’s attractiveness; and therefore the buyout target’s ability to generate
attractive returns. Consequently, the larger and broader a company’s customer base, the better its
ability to break into numerous markets with its products and services, and hence, the lower the
expected bargaining power of individual customers. However, sales, marketing and distribution
costs would ceteris paribus be higher. Also, single or few customers could guarantee a more in-
depth relationship between both parties, with a healthy level of inter-dependencies. In line with
Porter (1985), it is expected for the strategy buyout sample that
H57.) Gross buyout deal performance is higher for target companies, whose customer
base is broad, as the bargaining power and dependency on individual customers is
moderate.

Empirical Part III – Buyout Strategy Value Drivers 284
Does a multiple distribution channel approach pay off for buyout targets? The majority of
industries are defined through their unique distribution systems, which may involve wholesale
intermediaries, retailers, external or direct sales forces. In many industries, new distribution
channels such as business-to-consumer and business-to-business internet-enabled sales channels as
well as direct marketing activities, such as call centres, have gained importance to reach new
customer groups. It is therefore expected that
H58.) Gross buyout deal performance is higher for target companies, who use multiple
distribution channels in order to reach a maximum amount of customers.
Which prior organizational structure increases the value creation potential post acquisition? There
are arguments that both organizational structures, standalone businesses and businesses out of
larger entities, could be beneficial. Buyout targets that were standalone businesses often represent
“less complicated” acquisition targets with respect to degree of organizational change: since the
business has been operating as a standalone business, it is ensured that a minimum of functional
organizational structure is in place at the time of acquisition. On the contrary, buyout targets that
were part of a larger entity, i.e. dependent on a larger corporate parent company, are more likely to
face far-reaching organizational change post buyout: several critical corporate functions such as IT,
human resources, finance/banking relationships, financial reporting and controlling, etc. may have
to be improved or newly implemented post acquisition by the new shareholders and their
management team. Nevertheless, despite these organizational hurdles, corporate spin-offs offer
significant potential for value creation. The new organizational structure at the buyout target with
more direct and open interaction between owners and governance presents managers of post-
buyout companies with an atmosphere, which is less constrained with corporate bureaucracy and
centralism (Lowenstein 1985; Jensen 1989a; Hoskisson and Turk 1990; Taylor 1992; Butler 2001;
Wright 2001)179. “Buyouts provide the imagery as a creative way to reintroduce an entrepreneurial
drive in the publicly held firm” (Singh 1990), as managements feels and acts as entrepreneurs
under the new organization, relieved from constraints of a corporate headquarters and thus
encouraged to make independent decisions (Bull 1989; Jensen 1989a; Houlden 1990; Kester and
Luehrman 1995; Weir 1996). It is therefore expected that
H59.) Gross buyout deal performance is higher for target companies, which had been
part of a larger entity, as the value creation potential and introduction of an
entrepreneurial spirit should outweigh extra organizational improvement efforts.
Which prior corporate governance structure supports a higher potential for value creation in
leveraged buyout transactions? Buyout firms are active investors that bring about radical change in
their acquired target companies. Jensen (1989a) describes an “active investor” as a person or party
who “monitors management, sits on boards, is sometimes involved in dismissing management, is
179 Wright et al. (2001) highlighted that managers of pre-buyout organizations felt discouraged if their
business division frequently provided profitable and innovative investment opportunities, which were in turn given low attention and the management was provided with limited discretion, because their division was not regarded of central importance to the parent organization (see also Weir 1996, Beaver 2001).

Empirical Part III – Buyout Strategy Value Drivers 285
often intimately involved in the strategic direction of the company and on occasion even manages”.
The greater concentration of equity in the hands of active investors therefore encourages closer
monitoring and leads to a more active representation in the board of directors compared to pre-
buyout governance structures (Lowenstein 1985; Jensen 1989a; Jensen 1989b; Smith 1990a). The
monitoring of management and the increased involvement by members of the board offers the
opportunity to obtain direct access to confidential company information. Essentially, portfolio
companies’ management is generally being evaluated on a regular basis (Palepu 1990; Anders
1992; Cotter and Peck 2001). Therefore, it could be argued that the more radical the change in
corporate governance at a buyout target is with respect to monitoring and control, the larger should
also be the potential for value creation through interest alignment according to agency theory. It
can therefore be expected that
H60.) Gross buyout deal performance is higher for target companies, which had a lower
degree of monitoring and shareholder activism prior to the buyout.
To what extent does the prior ownership structure of a buyout target determine the transaction’s
value creation potential under new buyout firm ownership? The problem of ownership
concentration and management control was first discussed by Berle and Means in their image of
ownership in a modern corporation (Berle and Means 1932). It was further developed for the field
of corporate finance by Jensen and Meckling (1976) and Grossman and Hart (1982) by showing
that the intrinsic problem of separation of ownership and control may also have far-reaching
corporate performance implications. More recently, La Porta, Lopez-de-Silanes et al. (1998) find in
their study on ownership concentration across 27 of the wealthiest countries that ownership
concentration is widespread, i.e. that corporations are not generally widely held, and that this
ownership concentration must be seen as a risk for exploitation of minority shareholders.
Previously more widely held targets should thus demonstrate on average better performance than
targets with insufficient separation of management and control. It can therefore be expected that
H61.) Gross buyout deal performance is higher for target companies, which had a more
widely held ownership structure before acquisition, as the closer supervision of
management may have instilled more effective shareholder values.
6.1.1.1.2. Deal Decisions and Characteristics
Following the buyout firms’ evaluation of target companies according to company-specific
characteristics (as outlined above) and a general verdict to pursue the acquisition, each deal
involves distinctive strategic decisions and rationales both from the buyer, but also (implicitly) by
the seller. The following variables have therefore been developed in order to examine some of
these motivations both from an investor and prior owner perspective in more detail.
What is the appropriate portfolio company management incentive strategy in order to maximize
returns for the buyout firm? According to Cotter and Peck (2001), buyout transactions “provide a
“carrot” and a “stick” mechanism to ameliorate agency costs”. Buyout associations conduct
changes in the ownership and governance structure to provide incentives (the “carrot”) in order to

Empirical Part III – Buyout Strategy Value Drivers 286
align the interests of all parties involved and to reduce agency costs after the buyout (Bull 1989;
Jensen 1989b; Lichtenberg and Siegel 1990). Managers are encouraged (if not forced) to increase
their share in equity ownership in the company to a significant level (Muscarella and Vetsuypens
1990).180 It is expected that this increase in the equity stake of the management directly increases
the personal costs of inefficiency (Smith 1990b) and reduces their incentive to shirk (Jensen and
Meckling 1976; DeAngelo, DeAngelo et al. 1984; Smith 1990a; Weir and Laing 1998).
Furthermore, the change in status, from manager to co-owner could increase financial performance
because it gives managers a positive incentive to look for efficiency gains and smart strategic
moves (Phan and Hill 1995; Weir and Laing 1998).
On the contrary, increased managerial ownership in equity can result in a decrease in financial
performance due to managerial risk aversion and the potential under-diversification of the
managers’ wealth (Fama and Jensen 1985; Morck and Shleifer 1988; Holthausen and Larcker
1996). Furthermore, Demsetz (1983) and Fama and Jensen (1983a) argue that if managerial equity
ownership is concentrated, the manager may have effective control over the organization and
disciplining mechanisms such as the market for corporate control and managerial labour markets
may be rendered ineffective, which could result in a decline in performance as well (Holthausen
and Larcker 1996). However, it is questionable whether this so-called entrenchment hypothesis also
holds for management in buyout companies, as it remains doubtful whether the buyout firm’s
dominant influence over the target and its focus on financial performance can be undermined by
management’s entrenchment. It is therefore expected that
H62.) Gross buyout deal performance is higher for target companies, at which buyout
firms have implemented significant changes in the ownership and governance
structure, specifically through a substantial usage of management co-ownership.
As a consequence, how much equity should a General Partner offer to its buyout target’s
management, if deciding to offer equity participation? There are several studies on ownership and
performance of both board members and management. Morck, Shleifer et al. (1988) evaluated the
relationship between board ownership and market valuation (proxied by Tobin’s Q) in a sample of
371 Fortune 500 firms. They found that Tobin’s Q rises as board ownership increases from 0 to 5%,
falls as ownership rises further to 25%, and then continues to rise, although much more slowly, as
board ownership rises beyond 25%. One interpretation of these results is that in general the
alignment of interests between the management and shareholders via board ownership is positively
appreciated by the capital markets. However, between 5 to 25 % board ownership the positive
effects emanating from the convergence of interest hypothesis is offset by incremental negative
entrenchment effects (Morck, Shleifer et al. 1988; Dahmen 2001). Chang and Mayers (1992) could
overall confirm these empirical findings when analyzing the effects on shareholders’ wealth
180 Managers are commonly offered a substantial stake in the equity of the company at favourable conditions
(“sweet equity”). As a consequence, due to the high amount of the total investment compared to their personal net worth, managers usually have to take big financial risks to participate in the buyout (“pain equity”) (Kitching 1989, Wright et al. 1992a, Beaver 2001, Samdani et al. 2001).

Empirical Part III – Buyout Strategy Value Drivers 287
through an increase in managerial voting rights. The results suggest that shareholders reap the
largest incremental benefits when managers and directors initially control between 10% and 20%
of the outstanding votes. The benefits appear to be smaller when initial control is less than 10% or
more than 20%. When managers or directors control 40% or more of the outstanding share, a
negative market reaction to the announcement of executive stock ownership programs could be
registered (Chang and Mayers 1992). It could, again, be argued that beyond 40 % of managerial
control the entrenchment costs outweigh the benefits of a stronger alignment of interests between
shareholders and management (Dahmen 2001). It is therefore expected that
H63.) Gross buyout deal performance is higher for target companies, whose management
receives approximately between 10% and 20% of initial total equity in the
transaction.
Is there evidence that managers exploit their information asymmetry advantage in buyouts?
Leveraged Buyouts have been widely accused to simply exploit insider information to create value
in the transaction (DeAngelo, DeAngelo et al. 1984; Lowenstein 1985; Wright and Coyne 1985;
DeAngelo 1986; Lehn and Poulsen 1989; Opler 1992; Wright, Robbie et al. 1998). In the eyes of
critics, value is created merely through the exploitation of private information that induces a market
correction in the value of the assets involved (Singh 1990). However, there are various arguments
to support the fact that information asymmetries cannot be a major source of value creation in
buyouts, but rather contribute to managers’ motivation to initiate a buyout (Lee 1992). Kaplan
(1989b) in his early landmark study on management buyouts found that the majority of transactions
are not completed by the existing management team.181 It is therefore expected that
H64.) Gross buyout deal performance is not significantly higher for target companies,
independent of whether the transaction represents a MBI or MBO, with the latter
case accusingly representing an opportunity to exploit asymmetric information.
Does proactive deal sourcing lead to higher returns? A similar analysis in the first empirical
chapter (section 4.3.9.1.) on entry types had revealed that negotiated sales, i.e. exclusively
negotiated transactions, performed best followed by deals offered through buy-side intermediaries.
Deals entered by auction performed worst on average. The analysis in this section separates the
variable “negotiated sales” further into three categories: (i) proactive deals, in which buyout fund
managers opportunistically approach acquisition targets on their own behalf, (ii) deals sourced
through the GP management network, i.e. through their existing network established through board
representations, management contacts, industry associations, portfolio company management, etc.,
(iii) deals sourced through the GP parent’s network, which applies to those buyout funds that are
part of larger (financial) institutions and receive acquisition ideas internally.182 Based on these
181 See section 2.3.5.1. for a detailed discussion. 182 Most of the world’s major financial institutions maintained merchant banking arms. A range of these
banks, including Deutsche Bank and UBS, have recently (after shareholder and analyst pressure) disposed of their Private Equity portfolios due to the burdensome impact on earnings from asset write-downs during the cyclical downturn that commenced in 2000. Some of the largest financial institutions and investment

Empirical Part III – Buyout Strategy Value Drivers 288
circumstances, LBO firm professionals could therefore have more direct and timely access to
critical information through their network and are able to interpret it faster than the average market
participant, hence enabling them to make quick decisions regarding acquisitions (Fox and Marcus
1992). Therefore, attractive target companies can be identified and approached before other
potential bidders are alerted about this specific acquisition opportunity (Wright and Robbie 1996).
The alternative category includes all transactions generated through buy-side intermediaries, such
as business brokers and investment banks, which frequently “shop” their ideas with several buyout
firms. It is therefore expected that
H65.) Gross buyout deal performance is higher for target companies, which have been
acquired as a result of a negotiated sales process, i.e. through proactive
approaches or by leveraging existing relationships maintained by the general
partner or its management team.
Who are the sellers of more profitable buyout transactions? The implication of this question is
twofold. First, a certain category of sellers may actually be the source of superior assets, which
offer the largest potential for the acquiring buyout fund to create value. Secondly, a certain
category of seller may sell their companies on average at more attractive prices, which allows the
buyout fund to capture significant value already at the outset of the deal. Considering the latter
point, LBO firms have proven to have developed excellent deal negotiation skills. A study shows
that financial buyers consistently paid less for their acquisitions than did trade buyers during the
1990s (Butler 2001). As a consequence, it can be assumed that the less experienced and
sophisticated the buyout firm’s counterparty is in negotiations, the higher the potential value
creation benefit from the negotiation phase. Especially when the real asset value is difficult to
determine, e.g. in conglomerate spin-offs, favourable prices may be achievable. It is therefore
expected that
H66.) Gross buyout deal performance is higher for target companies, which have been
acquired from less sophisticated, non-financial institutions, as these may lack a
comparable level of negotiation skills or educated view on disposable asset values.
Do additional investors add to or inhibit value creation in buyout transactions? Buyout investors
frequently team up when pursuing investment opportunities. This behaviour can be the result of the
fact that (i) the predicted total transaction size is too large for a single buyout fund, as equity
commitments in any specific investment are limited by the fund’s terms and conditions for the
purpose of diversification of risk, (ii) a team of buyout funds sees a higher chance of success to win
the targeted asset (e.g. in competitive auctions) by teaming up, (iii) a combination of financial
and/or industry specific expertise is required for particularly complex industries. 183 The
involvement of strategic co-investors may also offer a clear exit strategy. The results in section
banks that continue to operate Private Equity investment arms include J.P. Morgan Chase, Credit Suisse First Boston, Goldman Sachs, Morgan Stanley and Merrill Lynch.

Empirical Part III – Buyout Strategy Value Drivers 289
4.3.5. regarding buyout performance according to acquired ownership percentage had shown that
minority (and majority control) investments performed very well, leading to an overall convex
relationship. However, the advantages through an amalgamation of expertise and financial power
may also be reduced to some extent through additional communication needs and consensus-
building among General Partners. In other words, quick decision-making could be hampered if
there are numerous co-investing parties involved in a transaction. Nevertheless, it is expected that
H67.) Gross buyout deal performance is higher for target companies, which benefit from
a single or limited number of co-investors, due to an amalgamation of expertise
and superior combined financial power.
Is it beneficial for the buyout target when the previous owner stays involved in the business? On
the one side, the previous owner’s involvement could guarantee a certain degree of continuity for
the business; the valuable tacit knowledge bound to individual owner-manager(s) or director(s)
would not be lost immediately (Barney 1986). Moreover, if the previous owner was a corporation,
an existent indispensable business relationship on the supply or demand side as well as other
organizational corporate inter-dependencies could be worth strengthening going forward. On the
other side, the continued involvement of previous owners, especially in management, could restrain
the required level of organizational change, strategic redirection and effectiveness of value creation
measures. As a consequence, a continued involvement by the seller through equity participation
could be more constructive than an active operational/managerial influence. It is therefore expected
that
H68.) Gross buyout deal performance is higher for target companies, which do not retain
a significant involvement of prior owners as managers, as the value creation
implementation process may be inhibited by resistance for radical corporate
change.
What is the seller’s rationale for disposing from a business, and which implications does this have
on acquisition performance? The reasons why shareholders may decide to dispose of a company
could be plentiful, including strategic redirection of the business, financial problems, succession
issues and regulatory requirements. The overriding question is why should a seller dispose of a
good business (unless for a good price)? It could be argued that the higher the internal or external
pressure for the seller to dispose of a business (quickly), the less favourable the realized price, and
in turn, the larger the upside potential for the acquiring buyout firm. It could therefore be expected
that
H69.) Gross buyout deal performance is higher for target companies, which have been
acquired by the buyout firm while the seller was under divestment pressure.
183 It can frequently be observed that large buyout funds team up with smaller specialized funds in highly
knowledge-intensive transactions, e.g. in the telecommunication, technology and media sector. These smaller co-investing funds would generally seek holding a minority stake (up to 25% of equity).

Empirical Part III – Buyout Strategy Value Drivers 290
How do buyout funds evaluate a transaction opportunity and which target characteristics ensure
strong returns on investment? There exists a range of factors that can support an investment
decision. First, according to the hypothesis of the “market for corporate control” (Manne 1965;
Jensen and Ruback 1983), different management teams compete for the control over companies.
Based on agency theoretical considerations, this view sees corporate takeovers primarily as a mean
to exchange inefficient management teams and to improve the company’s performance by putting
in control a more efficient management team. Secondly, with respect to cost-cutting potential, a
substantial literature has developed that shows that buyout transactions have a positive effect on the
operational performance of target companies (Baker and Wruck 1989; Bull 1989; Jensen 1989a;
Kaplan 1989b; Lichtenberg and Siegel 1990; Muscarella and Vetsuypens 1990; Singh 1990; Smith
1990a; Long and Ravenscraft 1993c; Ofek 1994; Smart and Waldfogel 1994; Phan and Hill 1995;
Holthausen and Larcker 1996; Weir and Laing 1998). Thirdly, constant improvements in
operational effectiveness to achieve superior profitability is necessary, but usually not sufficient
(Porter 1996). Hence, LBO firms not only rely on operational improvements to increase value in
buyout investments, but also aggressively seek to boost revenues. Fourthly, (Butler 2001) found
that financial buyers consistently paid less for their acquisitions than did trade buyers during the
1990s. One explanation is that LBO firms have developed excellent deal negotiation skills. They
are tough negotiators and tend to negotiate downward from a price that had earlier been accepted in
principle during the due-diligence phase: once they find themselves the sole bidder, they are skilled
at discovering problems (for instance off-balance sheet liabilities, such as environmental liabilities,
outdated equipment that requires higher capital investment, etc.) in the seller’s business offer
(Butler 2001). Finally, in section 4.4.5., it was demonstrated that buyout firms are also successful
anti-cyclical investors, taking advantage of business cycles in target industries. It can therefore be
expected that
H70.) Gross buyout deal performance is higher for target companies, for which buyout
firms have been able to identify management or operational inefficiencies, lucid
growth strategies or benefits from favorable external market conditions at the time
of the acquisition.
6.1.1.1.3. Acquisition Process and Strategic Events
It has so far been discussed how the target company’s business characteristics, the relationship
between General Partners and its portfolio company management (based on incentive, ownership
or management structure) as well as decisions around the planning and execution of the leveraged
buyout transaction may influence acquisition performance. However, the final set of defined
variables captures actual value creation strategies implemented by the buyout fund post acquisition,
which are fundamentally determining the extent to which the business can be improved. This
section discusses which key strategic decisions may lead to superior performance.
What are the core strategic and organizational decisions in a buyout transaction and what
influence do they have on performance? Firstly, the LBO firm plays an important role in re-
establishing or reinforcing the strategic focus of the buyout target. LBO firms work with buyout

Empirical Part III – Buyout Strategy Value Drivers 291
managers to make decisions that increase the strategic distinctiveness and eventually improve the
competitive positioning of the company. They put emphasis on restoring strategic focus and on an
overall reduction of complexity (Seth and Easterwood 1993; Phan and Hill 1995). Decisions are
made with respect to markets to operate in and products to compete with, conducting changes in
pricing, product quality, customer mix and customer service as well as on the reorganization of
distribution channels if required (Muscarella and Vetsuypens 1990). Secondly, in section 6.3.1.8., it
is established that the motivation to purchase a company due to observed inefficiencies caused by
the existing management team had produced high returns on investment. If the hypothesis of the
market for corporate control (Manne 1965; Jensen and Ruback 1983) holds, it should in this
analysis be observed that turnover of inefficient management leads to superior returns in buyouts.
The abolition of existing stark management inefficiencies and a sweeping strategic redirection may
therefore offer a far larger degree of value creation potential than incremental improvements, e.g.
to the company’s marketing strategy. It is therefore expected that
H71.) Gross buyout deal performance is higher for target companies, in which senior
management is exchanged and aggressive strategic change is implemented.
What type of actual strategy implementation leads to superior results in buyouts? Firstly, as an
important feature to reduce agency costs and to generate value, buyout firms make considerable use
of top management incentive plans and co-ownership in order to align management’s interest.
Equity holdings of top managers increase the cost of shirking and consuming perquisites for them
(Smith 1990a). Leveraged buyouts specifically, with their limited life and foreseeable liquidation of
the investment, create a situation in which equity holdings of top managers are better suited to align
interests between managers and shareholders and thus to enforce shareholder-wealth-maximizing
behavior than otherwise possible (Baker and Montgomery 1994). The introduction of new
incentive systems is therefore expected to be among the most important strategic implementations
when measured with a view on buyout returns. Secondly, as discussed above, the introduction of
new marketing and pricing strategies, as well as improvements in R&D, IT and reporting systems,
may offer considerable scope to improve the acquired business. In line with variable hypothesis
H71 regarding an assumed supremacy of radical abolition of management inefficiencies, it is
therefore also expected that
H72.) Gross buyout deal performance is relatively higher for target companies, in which
buyout firms implement an effective incentive plan through equity participation and
co-ownership.
Which acquisition and disposal activities of target assets and resources represent value enhancing
strategies? Among the principal ways to increase cash flow generation in leveraged buyouts is to
make more efficient use from corporate assets (Bull 1989). Following the buyout, management
swiftly starts to tighten the control on corporate spending (Anders 1992; Holthausen and Larcker
1996). Kaplan (1989b) and Smith (1990b) report significant increases in operating cash flows. On
the one hand, capital productivity is improved through adjustments in the management of working
capital, i.e. via an acceleration of the collection of receivables, a reduction in the inventory holding

Empirical Part III – Buyout Strategy Value Drivers 292
period and in some instances through an externsion of the payment period to suppliers (Baker and
Wruck 1989; Muscarella and Vetsuypens 1990; Singh 1990; Smith 1990b; Long and Ravenscraft
1993a; Kester and Luehrman 1995; Samdani, Butler et al. 2001). On the other hand, according to
the free cash flow theory, the incentive realignment will lead managers to divest low-synergy assets
and to cease spending cash on poor investment decisions (Grossman and Hart 1982; Jensen 1986;
Jensen 1989a). Hence, buyout management slashes unsound investment programs and disposes of
assets that are unnecessary or underutilized (Phan and Hill 1995). There are several options for
asset and capacity optimization available. First, through facility consolidation programs, buyout
funds are close down unprofitable operations, thereby reducing slack capacity and/or rebuilding the
necessary capacity at more profitable sites. Secondly, instead of a facility consolidation program,
the General Partner may opt for a relocation of facilities to low cost sites (or countries).
Thirdly, the human resource factor intensity can be substantially reduced in buyout transactions.
Shleifer and Summers (1988) argue that hostile takeovers and other control transactions can
transfer value to shareholders from employees by breaking implicit contracts, i.e. by firing workers
and/or reducing their wages, with those employers. However, Kaplan (1989b) showed that the
median change in employment after buyouts is only 0.9%, and for a sub-sample of buyouts that do
not make any divestitures, employment actually increases 4.9%. Similarly, employment growth in
the KKR portfolio of companies has increased from 2.3% per annum prior to the buyout to 4.2%
after the buyout (KKR 1989). Fourthly, the General Partner may decide not only to close down
particular facilities, but to dispose of entire parts or divisions of the buyout target, which he
considers non-core (or not profitable enough). These asset disposals can also be regarded as partial
exits, as they may lead to a substantial cash inflow that is either utilized to decrease leverage or
could be distributed back to the buyout fund through a special dividend.184
Alternatively, instead of merely downsizing the business, buyout funds have a range of options to
create value in leveraged buyouts by expanding the target’s business reach. Muscarella and
Vetsuypens (1990) outlined the complexity of strategic growth options and marketing drivers
available to the buyout firm – including the decision regarding geographic scope of the firm, i.e.
the question of which markets to compete in. Through their diverse network of portfolio
companies, with global operations and in-depth knowledge and experience of business
development, General Partners are able to apply best practices to acquisition targets and expand the
business geographically. Furthermore, the General Partner can employ joint ventures and strategic
alliances to further enhance geographical reach on the one side, and to acquire new skills and
capabilities on the other.
184 During the leveraged buyout boom of the 1980s, one frequently employed strategy of financial investors
was “asset stripping”, in which an undervalued target firm (often a conglomerate) was acquired and subsequently sold “in pieces”, as the acquiring investor (e.g. buyout fund) assumed that the value of the sum of the parts was higher than the combined entity (“conglomerate discount effect”). This strategy can be rarely observed anymore nowadays (partially due to the development of “Buyout management ethics”).

Empirical Part III – Buyout Strategy Value Drivers 293
As another growth strategy, LBO firms may decide to undertake add-on acquisitions of either new
lines of business or to expand business scope in such areas in which distinctive competences and
resources are strong compared to competition (Easterwood, Seth et al. 1989; Liebeskind and
Wiersema 1992; Seth and Easterwood 1993). Some buyout transactions are intended from the
beginning to accomplish a “buy-and-build” strategy, in which LBO firms undertake an initial
buyout investment in a fragmented and/or sub-scale market to build a nucleus (Samdani, Butler et
al. 2001). Several LBO firms have focused on buy-and-build strategies, thereby leveraging their
industry know-how in successive acquisitions, which may lead to a consolidation in that market
segment (Seth and Easterwood 1993; Baker and Montgomery 1994; Allen 1996; Wright 2001).
Although both value creation strategies – divestment/asset disposals and resource reductions vs.
investment/add-on acquisitions and expansionary activity – are in apparent contrast, it is not
obvious that either strategy may be superior, e.g. based on their equal observed frequencies in the
buyout industry; thus it can therefore be expected that
H73.) Gross buyout deal performance is not significantly higher for target companies,
independent of whether the buyout firm’s pursued value creation strategy is based
on a “add-on/expansionary” or “disposal/cut-back” strategy and its respective
accompanying measures.
6.1.1.2. Methodology and Data
The complexity of required analysis and statistical data codification of strategic decisions in
leveraged buyout transactions (or any merger or acquisition) is particularly multifaceted and
tedious. Each transaction in this study’s “strategy” sub-sample of 478 (274 realized and 204
unrealized) leveraged buyouts has been evaluated and screened for its specific characteristics and
strategic actions undertaken by the buyout fund, according to the above outlined variables. The
Limited Partners’ dataset offers information provided directly by the General Partner through
Private Purchasing Memoranda, as well as – to a smaller extent – additional information gathered
by the Limited Partners during fund due diligence. This data has been codified into a specific
database developed for this purpose in order to supply a unanimous platform for the diverse
information (see details on the strategy database in appendix 4).
It should be acknowledged that this data is highly heterogeneous, as (i) the level of available detail
is largely at the discretion of the General Partner, (ii) each transaction features different
characteristics perceived as important to investors. Furthermore, the focus of analysis lies on the
strategic, not financial impact in this section; not all deals in the sub-sample had explicit financial
information, e.g. on invested capital available, hence generally non-weighted gross IRR is used as
dependent variable in this section. Only realized transactions have been considered in this section.
Nevertheless, despite the relatively small sample size and over 180 defined variables with varying
level of detail, these exploratory test results serve as an important first step towards a better
understanding of the impact of strategic actions in buyout transactions. The average IRR of the

Empirical Part III – Buyout Strategy Value Drivers 294
complete strategy sub-sample of 478 companies is 74.3%, with a (high) standard deviation of
162.8%. However, due to the ex-post evaluation of buyouts and methodological nature of this
analysis, the analysis will mostly focus on realized transactions in this section, unless otherwise
noted. The average IRR of the 274 realized transactions is 84.8%, with a (hence lower) standard
deviation of 131.1%. All results of the individual variables must therefore be benchmarked against
these overall sample statistics in order to determine over- or underperformance. As mentioned, due
to a low number of data points for certain variables, the author wishes to stress the fact that in some
instances the presented descriptive results are valuable, but at the same time must be interpreted as
directional only and do remain subject to future, more in-depth studies on larger samples.
6.2. Target Company Characteristics
6.2.1. Test results
The analysis of buyout target characteristics in the first empirical section was so far limited to the
company’s industry and transactions size. No information with respect to the target company’s
products and services, markets in which it is active, its market positions – in short, its overall
business strategy – has been analyzed. This first section seeks to shed some light on the relatively
more attractive buyout target characteristics from a return perspective.
6.2.1.1. Geographic Scope and Buyouts Performance
How international should a successful buyout target company be operating? The performance
results according to geographic scope of the target company indicate that buyouts that aim to
penetrate global markets do perform worst with 63% of average gross IRR. By contrast, companies
that focus their distribution channels on a few (2 to 5) selective international countries only are the
second most successful with 80% of average gross IRR. This could be interpreted in such a way
that fully globally operating companies may face considerably higher costs through amplified
communication needs, higher capital expenditures and sales, marketing and distribution costs,
hence reducing the cash flow of the business and affecting returns. Variable hypothesis H50
therefore has to be rejected.
From a risk-return perspective, measured (indicatively) by the standard deviation of IRR, the
higher diversification among globally operating companies is substantiated through lower volatility
of returns with a standard deviation of 50%, compared to the much higher volatility of returns
observed for internationally operating buyout targets. On the national level, regional players
perform worse, with 67% of average IRR, while companies operating nationwide perform strongest
among all categories, with 96% average IRR. Although there does not seem to be a clear trend
between “national/regional vs. global/international”, the strong returns found for nationally focused

Empirical Part III – Buyout Strategy Value Drivers 295
companies is in line with buyout funds’ often stated preference for targeting national champions
and/or industry leaders as buyout targets. A strong domestic position appears to ensure stability and
a platform for controlled expansion into a few new (international) markets. Companies focusing on
regional markets, may hold strong local positions, as exemplified by the low volatility, but may
lack scale and growth prospects when compared to national players.
4076087
96%
80%
67% 63%
36%
50%
140% 144%
0
25
50
75
100
National International Regional Global
Fre
qu
en
cy (
N)
0%
20%
40%
60%
80%
100%
120%
140%
160%
Avera
ge G
ross I
RR
Frequency of IRR Average Gross IRR Standard Deviation of IRR
Figure 118: Buyout Deal Performance by Level of Geographic Scope of Operations
Source: INSEAD Buyout Strategy Database, analyzed by author (Deal N=194; mean IRR=76%).
6.2.1.2. Type of Goods and Buyouts Performance
Which type of goods do successful buyout targets market? Although the answer to this question is
to a large extent dependent on the industry the company is operating in, the strategy company sub-
sample substantiates the general trend found through the analysis of most attractive industries,
which showed that non-cyclical and financial services industries performed well (compare sections
4.2.2.6. and 4.3.4.). As mentioned before, the overall strong performance of the service sector (82%
average IRR) could be explained with commonly higher barriers to entry in the service industry;
successful services companies may have a competitive edge that is based on proprietary knowledge
and human capital, which is more difficult to imitate than e.g. more-commodity-type or consumer
products.

Empirical Part III – Buyout Strategy Value Drivers 296
3670 70
82%
69%
58%
164%
71%
137%
0
25
50
75
100
Services Industrial Consumer
Fre
qu
en
cy (
N)
0%
20%
40%
60%
80%
100%
120%
140%
160%
180%
Avera
ge G
ross I
RR
Frequency of IRR Average Gross IRR Standard Deviation of IRR
Figure 119: Buyout Deal Performance by Type of Goods
Source: INSEAD Buyout Strategy Database, analyzed by author (Deal N=176; mean IRR=70%).
6.2.1.3. Industry Cyclicality and Buyouts Performance
Do companies operating in stable industries guarantee buyout success? The findings on industry
cyclicality and buyout return reflect the classic risk-return relationship. The highest return of 96%
average IRR is achieved by buyout target operating in cyclical industries, yet at the cost of a high
volatility of returns (standard deviation of 156%). Variable hypothesis H52 can therefore be
accepted. By comparison, seasonal businesses generated an average IRR of 66%, about a third less
than cyclical businesses, but with almost half of the volatility. The frequently stated main target
group for most buyout firms – stable businesses – are in fact the worst performing LBO targets
with an average IRR of 49% for these deals. The relative unattractiveness is further highlighted
through an apparently similar risk profile when compared to seasonal targets’ return volatility. The
relatively lower performance could be a result from various reasons: (i) low overall growth and/or
lack of organic growth opportunities, (ii) elevated acquisition prices due to “attractiveness and ease
of evaluation of stable assets” to financial buyers and thus higher competition, or (iii) limited value
creation potential through strategic actions post acquisition.
The services sector also proves to be attractive from a risk-return perspective in this sample, due to
a lower standard deviation and higher return than the second ranked industrial sector. Variable
hypothesis H51 can therefore be accepted, as the service sector again ascertains its superior return
profile in this indicative sample analysis.

Empirical Part III – Buyout Strategy Value Drivers 297
43127 20
96%
66%
49%
156%
78%79%
0
25
50
75
100
125
150
Cyclical Seasonal Stable
Fre
qu
en
cy
(N
)
0%
20%
40%
60%
80%
100%
120%
140%
160%
180%
Av
era
ge
Gro
ss
IR
R
Frequency of IRR Average Gross IRR Standard Deviation of IRR
Figure 120: Buyout Deal Performance by Cyclicality of Industry
Source: INSEAD Buyout Strategy Database, analyzed by author (Deal N=190; mean IRR=70%).
6.2.1.4. Market Share and Buyouts Performance
Does higher market share necessarily lead to better performance? The findings on performance of
leveraged buyout transactions according to their market position/share remarkably do not reveal
supremacy of a certain market position category.
7653 81
87%84%84%
141%
124%
105%
0
25
50
75
100
125
Top Rank 2-5 Small
Fre
qu
en
cy (
N)
0%
20%
40%
60%
80%
100%
120%
140%
160%
Avera
ge G
ross I
RR
Frequency of IRR Average Gross IRR Standard Deviation of IRR
Figure 121: Buyout Deal Performance by Market Share Position
Source: INSEAD Buyout Strategy Database, analyzed by author (Deal N=210; mean IRR=85%).
Buyout targets that are considered as industry leaders achieve an average IRR of 84%, but also
firms that are ranked two to five in their respective industry appear to maintain comfortable enough
market positions to generate high economic rents, equally matching the 84% IRR return on those

Empirical Part III – Buyout Strategy Value Drivers 298
transactions. Buyout targets with smaller market shares even perform slightly better with 87%
average IRR, potentially driven by the higher increased risk associated with higher volatility in
returns. Along the lines of Porter (1985), the equally strong performance of the small market share
buyout targets could well be interpreted as successful niche businesses rather than companies that
are “stuck in the middle”. Variable hypothesis H53 and buyout firms’ often stated preference for
market leaders as buyout targets has to be rejected based on these findings.
6.2.1.5. Generic Business Strategy and Buyouts Performance
Which generic business strategy leads to highest buyout returns? From the above market share
analysis, no dominating relationship between market share and return could be discovered.
However, the following analysis specifically intends to uncover buyout returns according to
Porter’s generic business strategies, which overall are independent from market shares, though
indirectly related: niche companies tend to have small market shares while successful diversifying
or low cost producing companies aim for higher market shares and industry leadership.
833 12
114%
68%
48%
76%68%
160%
0
10
20
30
40
Niche Low cost Premium
Fre
qu
en
cy (
N)
0%
20%
40%
60%
80%
100%
120%
140%
160%
180%
Avera
ge G
ross I
RR
Frequency of IRR Average Gross IRR Standard Deviation of IRR
Figure 122: Buyout Deal Performance by Generic Business Strategy
Source: INSEAD Buyout Strategy Database, analyzed by author (Deal N=53; mean IRR=77%).
The findings are surprising as they show that buyout firms following the generic “niche product”
business strategy achieve the highest return of 114% average gross IRR. Returns generated by
buyout targets that follow a low cost or premium strategy are lower, with 68% and 48% of average
gross IRR respectively. The strong performance of niche strategy companies could be explained
through one major buyout firm investment rationale: buyout firms frequently acquire a range of
niche businesses in an industry roll-up consolidation in order to create a new company with critical
size. While niche businesses may originally not be attractive targets for strategic investors, their
subsequent potential for more meaningful size, product offering and market position may make
them more appealing investment targets. A strategic sale (or flotation) could therefore specifically

Empirical Part III – Buyout Strategy Value Drivers 299
generate substantial returns for the sponsor, who may have had comparatively small initial capital
investment (and purchase multiples, i.e. “small firm valuation discount”) in each of the individual
businesses. Another strategy could be to aggressively develop niche businesses through organic
growth. By contrast, potentially more established companies, i.e. low cost or premium strategy
buyout targets, are likely to command on average considerably higher acquisition multiples, hence
limiting the return upside to the sponsor. However, the considerably lower volatility highlights that
these targets may be lower risk investments. 185 As a result of the significantly higher observed
returns for niche strategy companies as leveraged buyout targets, variable hypothesis H54 has to be
rejected. The results are also striking when interpreted in combination with the market share
analysis – according to these findings niche companies may not necessarily lack notable market
shares.186
6.2.1.6. Market Structure and Buyouts Performance
How competitive/fragmented should the industry of a potential buyout target be in order to
generate superior returns? The findings are in line with microeconomic theory: buyout targets that
have maintained an industry monopoly position accomplished the highest average IRR with 114%
for their fund.
18 11431
114%
101%
76%
184%
124%124%
0
25
50
75
100
125
Monopoly Oligopoly Non-concentrated
Fre
qu
en
cy
(N
)
0%
25%
50%
75%
100%
125%
150%
175%
200%
Av
era
ge
Gro
ss
IR
R
Frequency of IRR Average Gross IRR Standard Deviation of IRR
Figure 123: Buyout Deal Performance by Market Structure Position
Source: INSEAD Buyout Strategy Database, analyzed by author (Deal N=163; mean IRR=97%).
Targets operating in oligopolistic market structures also exhibit high, albeit lower than for
monopolies, returns of 101% IRR. However, the standard deviation for an oligopolistic market
structure surprisingly is notably lower with 124%. As expected, buyout targets operating in highly
185 The lower sample size for these tested variables should also be taken into consideration. 186 For example, speciality chemical companies have traditionally been attractive buyout targets, as they
exhibit both – a unique niche product offering and regularly high (global) market shares.

Empirical Part III – Buyout Strategy Value Drivers 300
fragmented markets are confronted with a high degree of competition, hence buyout returns on
these companies reach a relatively lower 76% of average IRR. The frequency distribution also
indicates that monopolistic or oligopolistic market structures are far less common than non-
concentrated market environments. Following the above findings on generic strategies, it could be
argued that – especially in fragmented industry conditions – adopting a generic business strategy
alternative becomes crucial to establish a competitive advantage. Variable hypothesis H55 can
therefore be accepted, as industry competitiveness and returns are clearly negatively correlated.
6.2.1.7. Product Diversification and Buyouts Performance
How broad should a buyout target’s product range be to ensure high returns? The performance
results for the product diversification variables confirm theory as well as variable hypothesis H56
that increased product diversity is adversely correlated to performance. A single/similar product
offering generated an average IRR of 88% versus 73% for target companies with diversified
product ranges. However, there is support for a theory on the beneficial merits of product
diversification from a risk perspective: buyout targets offering single/similar products exhibit a
twice has high standard deviation in returns of 137%, which could be the result of higher volatility
in customer demand and preference. As a consequence, these companies explicitly need to
emphasize offering a unique “commodity product” that reaches the maximum common
denominator of customer choice.
242 22
73%88%
137%
70%
0
50
100
150
200
250
Single/similar products Diversified products
Fre
qu
en
cy
(N
)
0%
20%
40%
60%
80%
100%
120%
140%
160%
Av
era
ge
Gro
ss
IR
R
Frequency of IRR Average Gross IRR Standard Deviation of IRR
Figure 124: Buyout Deal Performance by Product Diversification of Buyout Target
Source: INSEAD Buyout Strategy Database, analyzed by author (Deal N=264, mean IRR=80%).
6.2.1.8. Customer Base and Buyout Performance
How diversified should a buyout target’s customer base be from a return perspective? The results
are in stark contrast to expectations. Returns for buyout companies with a highly diversified

Empirical Part III – Buyout Strategy Value Drivers 301
customer base are lowest with 77% average gross IRR, closely followed by buyout targets with a
limited number of customers (87% average gross IRR). Variable hypothesis H57 and Porter’s
argument of adverse effects of a strong bargaining power of customers do not hold true in this
context. The low available sample size for the variable of single customer-based companies does
not allow making founded and generalizable arguments. However, the high average IRR of 276%
for single customer-based buyout targets is based on few, but consistently strong performing
transactions. For that reason, should this trend of higher returns for single-customer buyout targets
be also substantiated on larger samples, it would be a surprising result.
716955
77%87%
276%
123%105%
262%
0
50
100
150
200
Single A few Many
Fre
qu
en
cy (
N)
0%
50%
100%
150%
200%
250%
300%
Av
era
ge
Gro
ss
IR
R
Frequency of IRR Average Gross IRR Standard Deviation of IRR
Figure 125: Buyout Deal Performance by Size of Customer Base of Buyout Target
Source: INSEAD Buyout Strategy Database, analyzed by author (Deal N=231; mean IRR=147%).
Possible interpretations are based on the fact that single-customer buyout targets must have very
high visibility of earnings and cash flows in order to (i) justify and make the investment from a
buyout fund attractive, and (ii) ensure an adequate level of bank financing (which is based on the
credit risk profile of the target). For example, companies operating in the (aerospace and) defence
sector often benefit from very long-standing relationships with their single most important
customer(s) – government(s) – and are habitually characterized by very long-term, contract-based
business models. Consequently, the “safe” cash flow generation of such buyout targets is highly
attractive to investors and may lead to great scope for leveragability and thus superior returns.
6.2.1.9. Distribution Channels and Buyout Performance
Does an aggressive marketing strategy via multiple distribution channels pay off for buyout
targets? The findings clearly highlight the superiority of returns, with 88% of average IRR, for
buyout firms that focus on only one major distribution channel. By contrast, buyout targets that
have established or put in place multiple distribution channel strategies reach returns of only 60%
average IRR. An explanation could be linked to overall higher marketing and associated

Empirical Part III – Buyout Strategy Value Drivers 302
distribution costs, as well as further indirect costs positions, such as overhead costs (e.g. as a result
of increased communication needs), additional capital expenditures and personnel costs (for IT-
enabled systems, call centers, etc.). These increased costs are apparently not outweighed through
higher revenues and cash flow generation in the leveraged buyout context. Variable hypothesis H58
therefore has to be rejected. As a consequence, based on these results buyout funds may be advised
not to seek growth through introduction of new distribution systems, but to focus on growth and
efficiency enhancements at existing channels.
37 13
88%
60%
73%
141%
0
10
20
30
40
One Multiple
Fre
qu
en
cy (
N)
0%
25%
50%
75%
100%
125%
150%
Avera
ge G
ross I
RR
Frequency of IRR Average Gross IRR Standard Deviation of IRR
Figure 126: Buyout Deal Performance by Distribution Channel of Buyout Target
Source: INSEAD Buyout Strategy Database, analyzed by author (Deal N=50; mean IRR=74%).
6.2.1.10. Prior Organizational Structure and Buyout Performance
Which prior organizational structure increases the value creation potential post acquisition? The
findings for buyout targets in the strategy dataset sub-sample are in support of research suggesting
that the decentralisation from a corporate parent may lead to a renewed entrepreneurial drive with
lower constraints for corporate managers, entailed by a positive performance impact.
Buyouts performed significantly stronger at an average IRR of 112% when spun off as part of a
larger entity. Buyout targets that were standalone businesses at the time of the acquisition only
returned 77% of average gross IRR to investors. Accordingly, corporate spin-offs emerge to be the
prime targets for superior value creation, however, the risk involved with their far-reaching
corporate transformation does becomes visible when considering the notably higher volatility in
returns (standard deviation of 171% compared to 113% for standalone businesses). Variable
hypothesis H59 can therefore be accepted.187
187 Alternative interpretations of these results are equally valid, for instance, from an agency theoretical
viewpoint corporate spin-offs are also expected to generate higher returns due to the greater scope for

Empirical Part III – Buyout Strategy Value Drivers 303
87 138
77%
112%
113%
171%
0
20
40
60
80
100
120
140
Part of a larger entity Stand-alone business
Fre
qu
en
cy (
N)
0%
50%
100%
150%
200%
Avera
ge G
ross I
RR
Frequency of IRR Average Gross IRR Standard Deviation of IRR
Figure 127: Buyout Deal Performance by Organizational Structure of Buyout Target
Source: INSEAD Buyout Strategy Database, analyzed by author (Deal N=225; mean IRR=94%).
6.2.1.11. Prior Corporate Governance Structure and Buyout Performance
Which prior corporate governance structure supports a higher potential for value creation in
leveraged buyout transactions? In line with agency theoretical considerations (Lowenstein 1985;
Jensen 1989a; Jensen 1989b; Smith 1990a), the findings demonstrate that buyout targets that were
state-owned prior to their acquisition are performing best with an average IRR of 239%. This is a
clear signal that the almost complete lack of incentive systems in state-owned enterprises and
frequently uneconomic, bureaucratic monitoring and control structures offer the greatest scope for
improvement and returns for buyout funds. On the private business side, secondary buyouts from
another buyout fund should ceteris paribus represent the smallest change in corporate governance
system, as the previous fund most likely has implemented an efficient system; yet these targets also
only displayed the second lowest average IRR of 82%.
Family-owned private companies yielded the lowest average IRR of 68%. Effectively, these low
average returns could be interpreted such that family-owned buyout targets either (i) already have
relatively efficient corporate governance and incentive structures in place and hence offer less
room for value creation through a change in corporate governance (Reeb and Anderson 2004;
Villalonga and Amit 2004), or (ii) family business deals may involve other complicating factors,
e.g. based on family-linked management issues, continued equity participation in the business or
involvement of family members in the board. The strong performance of public-to-private buyouts
with an average IRR of 104% could be explained by the fact that generally only those publicly
traded companies become subject to a takeover via tender offer, whose management is unable to
create sufficient value for its shareholders. The market for corporate control and the rise of
generating rents from an alignment of interest compared to standalone businesses (compare Gottschlag 2003).

Empirical Part III – Buyout Strategy Value Drivers 304
corporate “raiders” has only come into existence, because existing corporate governance,
monitoring and control or management incentive structures of publicly listed companies were
inefficient and offered superior rent generation for outside “active investors” (Manne 1965; Jensen
and Ruback 1983). Nevertheless, in addition to the demonstrated relatively stronger performance of
secondary buyouts, the degree of shareholder activism would have been expected to be higher in
publicly listed companies, and hence, variable hypothesis H60 has to be rejected.
715 11551
239%
104% 82%
68%
112%
61%
179%
186%
0
20
40
60
80
100
120
State-owned Public Private/Financial
(Private Equity)
Private/Family
Business
Fre
qu
en
cy (
N)
0%
40%
80%
120%
160%
200%
240%
Avera
ge G
ross I
RR
Frequency of IRR Average Gross IRR Standard Deviation of IRR
Figure 128: Buyout Deal Performance by Corporate Governance Structure of Buyout Target
Source: INSEAD Buyout Strategy Database, analyzed by author (Deal N=188; mean IRR=123%).
6.2.1.12. Prior Ownership Structure and Buyout Performance
To what extent does the prior ownership structure of a buyout target determine the transaction’s
value creation potential under new buyout firm ownership? The frequency distribution of the
n=123 transactions reveals that most buyout targets in the sample did not have a fragmented,
widely held ownership structure prior to acquisition. This could be interpreted in two ways: (i)
either the actual overall percentage of fragmented ownership among target companies is low, or
more probable (ii) widely-held corporations are less likely to become buyout targets, because this
ownership structure on average ensures superior returns. Following the latter hypothesis, the high
frequency of dominant ownership firms in the sample may conversely point to dismal prior
performance for its single shareholder. The results support the theory on separation of ownership
and control, as the fragmented ownership firms perform best post-buyout with 94% of average IRR.
Returns on dominant owner firms reach an average IRR of 83%. Compared to its prior ownership,
the more diverse new board expertise (Hilb 2002a), potentially new incentive system and
empowerment of management provides for strong returns, even though volatility of returns
increases. Despite a low number of cases for two categories, variable hypothesis H61 can be
accepted, as buyout targets with a widely-held ownership structure and/or diverse board
composition represent the comparatively more attractive buyout targets.

Empirical Part III – Buyout Strategy Value Drivers 305
1011 102
70%83%
94%
41%
117%
96%
0
20
40
60
80
100
120
Fragmented Single/Dominant Owner Few large Shareholders
Fre
qu
en
cy (
N)
0%
20%
40%
60%
80%
100%
120%
140%
Avera
ge G
ross I
RR
Frequency of IRR Average Gross IRR Standard Deviation of IRR
Figure 129: Buyout Deal Performance by Corporate Governance Structure of Buyout Target
Source: INSEAD Buyout Strategy Database, analyzed by author (Deal N=123; mean IRR=82%).
6.3. Deal Decisions and Characteristics
6.3.1. Test results
In the first section, it was established what some of the key characteristics of successful buyout
target companies were and specifically, which trends regarding their impact on performance over
the acquisition period could be observed. The following second bloc of characteristic variables
under review focuses on two areas. Firstly, specific decisions and motivations taken by the buyer
and seller at the time of the acquisition will be made explicit; secondly, the General Partner’s
relationship with its portfolio company management teams will be examined; more specifically,
what stance for instance does the General Partner choose with respect to granting equity
participation incentives to its management teams and what impact on performance can be observed
given that chosen strategy.
6.3.1.1. Management Incentives through Equity Participation and Buyout Performance
What is the appropriate portfolio company management incentive strategy in order to maximize
returns for the buyout firm? The findings on the impact of equity participation by management in
leveraged buyout transactions are surprising. Management equity participation does not seem to be
a major influence on the performance of buyouts in the underlying sample, as average IRR reaches
almost an equal level of 85.1% with, and 84.7% without these incentives. This is in contradiction to
the principal agency theory, which would suggest higher performance for buyouts with

Empirical Part III – Buyout Strategy Value Drivers 306
management co-ownership (Jensen and Meckling 1976; DeAngelo, DeAngelo et al. 1984; Smith
1990a; Phan and Hill 1995; Weir and Laing 1998; Cotter and Peck 2001).
86 188
129%
85,1% 84,7%
136%
0
50
100
150
200
Management Equity Participation No Management Equity Participation
Fre
qu
en
cy (
N)
0%
25%
50%
75%
100%
125%
150%
Avera
ge G
ross I
RR
Frequency of IRR Average Gross IRR Standard Deviation of IRR
Figure 130: Buyout Deal Performance by GP’s Management Incentive Strategy of Buyout Target
Source: INSEAD Buyout Strategy Database, analyzed by author (Deal N=274; mean IRR=85%).
There are several possible explanations. First, as only 31% of buyout target management received
equity in this sample, it can be theorized that General Partners are strategically more selective in
their inducement approach than previously anticipated; General Partners may not see the necessity
to grant equity co-ownership for management in all situations/transactions, potentially because they
do not see the principal-agent problem arise to a worrisome extent in leveraged buyout transactions.
It could be argued that due to many buyout funds’ opted strategy of far-reaching managerial and
operational involvement by investment managers in their portfolio companies, they are effectively
in control of the company’s strategic direction and hence are less concerned about management
“misbehavior”. Due to their decidedly active commitment, buyout firms appear to “save” the
valuable equity stake (otherwise envisaged for management), thus generating more attractive
returns for the fund and themselves. However, instead of equity, management could in these cases
still be compensated through generous cash compensation packages.188 On the other hand, if a
General Partner’s involvement and potential to contribute meaningfully in the target company’s
operations is limited or if the fund opts for a passive approach to portfolio company management, it
will more heavily rely on the target’s management to generate value, and thus ensures their
commitment by surrendering part of the equity to them.
Secondly, the dataset in this analysis largely depended on self-reporting by General Partners. The
data may therefore be biased to the degree that the actual level of equity participation is higher, yet
188 The adverse impact on the reported IRR for the focal transactions by granting equity to the target’s
management should generally be higher than compensating managers with generous cash bonus packages, and hence represents an incentive for avoidance for General Partners.

Empirical Part III – Buyout Strategy Value Drivers 307
not reported. However, as both extremities center on the sample mean for this analysis, the impact
should be marginal. Variable hypothesis H62 therefore has to be rejected, as for this sample there is
no clear indication that an incentivation through equity ownership of target management increases
buyout returns.
As a consequence, how much equity should a General Partner offer to its buyout target’s
management, if deciding to offer equity participation? The findings on equity ownership of
managers in buyout companies confirm the results shown by Chang and Mayers (1992) for public
market firms. Buyout performance is largest for equity participation between 5 to 10% (127%
average IRR) and 10 to 20% (114% average IRR). Consequently, the alignment of interest between
principal (the buyout fund) and agent (the portfolio company management) also provides for
superior returns in the private sector for buyout targets. For management participation beyond 20%
of the company’s equity, the average IRR drops to 73%. This is in accordance with the findings by
Chang and Mayers (1992) that beyond a certain equity participation benchmark (here 20% of
managerial control), the entrenchment costs outweigh the benefits of alignment of interests. Hence,
as previously shown by studies on public markets (Fama and Jensen 1985; Morck and Shleifer
1988; Holthausen and Larcker 1996), increased managerial ownership in leveraged buyout
companies can also result in a decrease in financial performance (here measured by IRR) due to
managerial risk aversion and the potential under-diversification of the portfolio company
managers’ wealth.
1112 3118
73%
114%127%
95%
86%
142%
181%
201%
0
10
20
30
40
50
0 -5% 5 -10% 10 - 20% 20+%
Fre
qu
en
cy (
N)
0%
25%
50%
75%
100%
125%
150%
175%
200%
225%
Avera
ge G
ross I
RR
Frequency of IRR Average Gross IRR Standard Deviation of IRR
Figure 131: Buyout Deal Performance by Percentage of Target Management Equity Participation
Source: INSEAD Buyout Strategy Database, analyzed by author (Deal N=72; mean IRR=102%).
Minor management equity participation between 0 and 5% in buyout companies only leads to an
average IRR of 95%, which could be an indication that the investment is too low to initiate an
effective alignment of interest. In summary, buyout firms are therefore advised to design their
management equity incentive plan with at least 5 to 10% of the company’s equity, but not more

Empirical Part III – Buyout Strategy Value Drivers 308
than 20%. However, another interesting aspect from the results is the constant decrease of volatility
in returns with an increase in management equity ownership. This could also add to the
recommendation that from a risk-return perspective, an increased level of ownership may ensure
good buyout performance on a more consistent basis. Variable hypothesis H63 can therefore be
directionally accepted, as the 5-20% corridor indeed delivered best returns and higher and lower
percentages were lower, in line with prior literature findings.
6.3.1.2. MBO vs. MBI and Buyout Performance
Is there evidence that managers exploit their information asymmetry advantage in buyouts? The
findings demonstrate that only small, albeit non-significant evidence can be found to support a
hypothesis of insider information exploitation through management. The average return for
management buyouts (MBO) of 87% average IRR is only marginally better than the average IRR
of 78% from management buy-ins (MBI).
168 46
87%78%
97%
144%
0
50
100
150
200
MBO MBI
Fre
qu
en
cy (
N)
0%
50%
100%
150%
200%
Av
era
ge G
ros
s I
RR
Frequency of IRR Average Gross IRR Standard Deviation of IRR
Figure 132: Buyout Deal Performance by Role of Management in Deal Origination
Source: INSEAD Buyout Strategy Database, analyzed by author (Deal N=214; mean IRR=82%).
There are two general scenarios: first, in a MBO situation, in which a buyout firm acquires a target
company, the sponsor may be relying on current management to remain in place. During a
transaction’s negotiation phase, buyout fund managers in this case could seek to convince current
management to take a less positive stance on earnings outlook (business plan), thereby indirectly
depressing the transaction price and capturing immediate value. However, as an increasing amount
of buyout deals are entered through competitive auctions and shareholders become more active,
this opportunity is infrequent. Secondly, in a MBO situation, in which the target’s management
initiates the buyout, it may be able to (mis)use its information advantage. In the MBI example, the
buyout firm acquires a buyout target and appoints a new management team. However, Barney
(1986) suggests that the expertise and social capital of members of the top management team

Empirical Part III – Buyout Strategy Value Drivers 309
constitute the most valuable resource a company. Consequently, the lower observed average IRR of
78% for MBI transactions in the sample supports the resource-based view on management turnover
(compared to the market for corporate control theory), which would expect a negative performance
impact on replacements in the top management team. Hence, these findings are also in line with
prior studies relating managerial turnover to performance in a general acquisition context, which
found that managerial turnover reduces acquisition performance (Cannella and Hambrick 1993;
Krishnan, Miller et al. 1997; Zollo and Singh 2000). In summary, albeit only marginally different,
variable hypothesis H64 has to be rejected, which gives rise to minor concerns about misuse of
information in buyouts on the one side, and directionally supports the resource-based view on
management turnover on the other side.
6.3.1.3. Deal Source and Buyout Performance
Does proactive deal sourcing lead to higher returns? The findings are directionally not fully
consistent. First, in line with expectations, by far the highest return with 112% average IRR was
achieved by buyout funds through proactive deal sourcing. This finding is in support of (i) the
apparent early-mover advantage in buyout transactions advocated by Fox and Marcus (1992) and
Wright and Robbie (1996), as well as from a practical perspective (ii) the keen attention shown by
Private Equity fund investors on a buyout fund’s ability to generate proprietary deal flow, i.e.
transactions that were sourced opportunistically. However, more surprisingly is the result that
transaction leads obtained via the GP’s existing (management and portfolio) network performed
mediocre with 57% of average IRR. Moreover, deals sourced internally through a financial
institution performed worst on a relative basis with 45% average IRR.
5635 41 8
45%57%
72%
112%
29%
89%
77%
174%
0
10
20
30
40
50
60
Proactive Intermediary GP Management
Network
GP Parent Network
Fre
qu
en
cy (
N)
0%
25%
50%
75%
100%
125%
150%
175%
200%A
vera
ge G
ross I
RR
Frequency of IRR Average Gross IRR Standard Deviation of IRR
Figure 133: Buyout Deal Performance by Deal Source
Source: INSEAD Buyout Strategy Database, analyzed by author (Deal N=140; mean IRR=72%).

Empirical Part III – Buyout Strategy Value Drivers 310
These findings hint at the possibility that investment managers may not be resistant to network-
based “political” advances, i.e. attempts to persuade buyout investment professionals to do
comparatively less attractive deals. In other words, buyout firms may conceivably become
predisposed and/or indoctrinated and thus carry out less objective analysis of transactions (than
they otherwise would), when these are pitched via the GP’s network. They consequently undertake
transactions with lower value creation potential. Despite the proven superiority of proactive deal
sourcing, as a consequence of the relative attractiveness of deals conveyed to the buyout firm
through intermediaries, variable hypothesis H65 has to be rejected.
6.3.1.4. Seller Type and Buyout Performance
Who are the sellers of more profitable buyout transactions? The results are confirmatory to
expectations. Companies sold by the government, e.g. full or partial privatizations generated the
highest average IRR of 257%.189 As shown in section 6.2.1.11., state-owned assets had proven to
offer the largest value creation potential for buyout funds, as the introduction of a non-public sector
shareholder structure (and values), i.e. with an inherent focus on profitability in a more competitive
environment, leads to an optimization of resources. By contrast, as shown by Butler (2001),
financial investors are considered a tough negotiation counter-party; hence acquiring funds on
average appear to be unable to negotiate meaningful discounts in purchase prices (compared to
market value), which in turn limits their return upside through multiple expansion.190
4410 832
257%
86% 84% 55%
42%
189%
251%
99%
0
10
20
30
40
50
Government Strategic Owner Conglomerate Financial/PE investor
Fre
qu
en
cy (
N)
0%
50%
100%
150%
200%
250%
300%
Avera
ge G
ross I
RR
Frequency of IRR Average Gross IRR Standard Deviation of IRR
Figure 134: Buyout Deal Performance by Seller Type
Source: INSEAD Buyout Strategy Database, analyzed by author (Deal N=94; mean IRR=120%).
189 Please note the low frequency of cases for “government” and “financial/PE investor” in this interpretation. 190 Another reason for lower performance of secondary buyouts compared to primary buyouts could be seen
in the already widely implemented value creation strategies in the business by the initial owner (buyout fund), which leaves little room for further value creation through operational improvements.

Empirical Part III – Buyout Strategy Value Drivers 311
Buyout transactions sourced from strategic owners and conglomerates produce similar returns of
86% and 84% of average IRR respectively. The similar level of return for conglomerates is to some
extent unforeseen when compared to the results in section 6.2.1.10. for transactions resulting from
“a larger entity”. It could have been anticipated that returns from conglomerate spin-offs would be
higher, when assuming a superior value creation potential achievable through decentralization from
a larger conglomerate parent company, as well as introduction of new incentive systems and
entrepreneurial spirit. In light of the findings from section 6.2.1.10., is could be concluded that “a
larger entity” may therefore equally relate to conglomerates or other multi-division standalone
businesses. In summary, the results are in support of variable hypothesis H66, acknowledging that
other factors may equally contribute to the above results.
6.3.1.5. Co-Investors and Buyout Performance
Do additional investors add to or inhibit value creation in buyout transactions? Figure 135 shows
that the most frequent type of co-investor of buyout funds represents financial co-investors, e.g.
other buyout funds, individuals, or financial institutions. Strategic co-investors are less common.
The rationale for strategic co-investor involvement could be that (i) these companies seek to
manoeuvre themselves into the favourable position of preferred bidder in order to acquire the
business at the buyout fund’s eventual exit,191 while in the meantime participating in the target’s
value creation process, or (ii) the equity investment warrants a continued strategic co-operation
between those businesses. The average returns of 102% and 95% for strategic and financial co-
investors respectively both exceed the overall strategy sample mean of 84.8%, highlighting the
beneficial effect. Sample hypothesis H67 can therefore be accepted in general.
7 59
102%
95%
160%
64%
0
25
50
75
Strategic Co-Investor Financial Co-Investor
Fre
qu
en
cy (
N)
0%
25%
50%
75%
100%
125%
150%
175%
200%A
vera
ge G
ross I
RR
Frequency of IRR Average Gross IRR Standard Deviation of IRR
Figure 135: Buyout Deal Performance by Type of Co-Investor
Source: INSEAD Buyout Strategy Database, analyzed by author (Deal N=66; mean IRR=99%).
191 The strategic co-investor may receive a call option to acquire the business at pre-determined price ranges/
terms.

Empirical Part III – Buyout Strategy Value Drivers 312
The results in section 4.3.5. on buyout performance according to percentage of acquired ownership
stake had revealed a convex relationship, in which control investments (75-100% of equity) as well
as minority investment equity stakes (0-25% of equity) had displayed the highest IRR figures. The
categorization of number of co-investors per transaction in the underlying strategy buyout sample
offers some additional insights192: the highest buyout performance of 177% average gross IRR can
be observed among companies with three or more equity co-investors. This could be interpreted as
evidence that (i) the additional expertise brought into the transaction by the several parties is
optimizing the decision and value creation processes, (ii) the teaming up for larger deals reduces
overall competition and thus lowers the average acquisition price paid, benefiting IRR. However,
there does not appear to be a consistent trend between number of co-investors and performance, as
the one co-investor category in the sample led to an average IRR of 100%, while two co-investors
generated 63% on average. One possible explanation for the lower performance in the two co-
investor scenario could be that consensus-building may be more challenging among three investing
parties.
1034 13
100%
63%
177%179%
176%
72%
0
5
10
15
20
25
30
35
1 2 3+
Fre
qu
en
cy (
N)
0%
50%
100%
150%
200%
250%
Avera
ge G
ross I
RR
Frequency of IRR Average Gross IRR Standard Deviation of IRR
Figure 136: Buyout Deal Performance by Number of Co-Investors
Source: INSEAD Buyout Strategy Database, analyzed by author (Deal N=57; mean IRR=115%).
6.3.1.6. Further Involvement of Previous Owner and Buyout Performance
Is it beneficial for the buyout target when the previous owner stays involved in the business? The
results on this small sample for previous owner involvement underline that a continued connection
to the prior owner has adverse effects to buyout performance. Compared to the sample mean of
84.8% for the entire strategy sample both alternatives lead to underperformance of the focal
transaction. Especially the continued owner involvement as part of the management team leads to
192 The low frequency of cases for two of the three categories should be taken into consideration.

Empirical Part III – Buyout Strategy Value Drivers 313
below average performance with an IRR of 31%193. This finding, if proven on a larger sample,
provides evidence that buyout firms may be inhibited to implement more radical value creation
strategies due to the prior owner’s potential managerial influence and/or veto powers, which are
affecting returns. Variable hypothesis H58 can therefore be accepted, while the resource-based
view, expecting adverse acquisition performance effects through the loss of tacit knowledge
following managerial turnover (Cannella and Hambrick 1993; Krishnan, Miller et al. 1997; Zollo
and Singh 2000), does not find evidence in the leveraged buyout context. Similarly, despite higher
returns exhibited for owner involvement through equity ownership, this option can equally not be
recommended to buyout firms.
21 7
31%
74%
91%
18%
0
5
10
15
20
25
30
Equity Investor Part of Management
Fre
qu
en
cy (
N)
0%
20%
40%
60%
80%
100%
Avera
ge G
ross I
RR
Frequency of IRR Average Gross IRR Standard Deviation of IRR
Figure 137: Buyout Deal Performance by Involvement of Previous Owner
Source: INSEAD Buyout Strategy Database, analyzed by author (Deal N=28; mean IRR=53%).
6.3.1.7. Seller’s Motivation and Buyout Performance
What is the seller’s rationale for disposing from a business, and which implications does this have
on acquisition performance? The results for selling rationales imply that except for buyouts
resulting from privatizations, the majority of collected transactions in this sub-sample are
underperforming post acquisition (compared to the main strategy sample mean IRR of 85%)194.
The high return of 186% average IRR observed for buyouts from privatizations demonstrates that
the seller (in this case the public authorities) may perhaps offer assets too cheaply. However, the
high volatility of returns also highlights the higher than average risk involved in privatization deals.
Divestments of non-core business appear to be accompanied by lower risk for the acquirer, but
returns of 70% average IRR are below sample mean.
193 This low performance is substantiated by a very low standard deviation of returns of just 18%. However,
the low frequency of cases this category should be taken into consideration. 194 The low frequency of cases for three of the six categories should be taken into consideration.

Empirical Part III – Buyout Strategy Value Drivers 314
The following results should be seen as indicative, due to low number of cases for these variables:
Transactions resulting from family succession issues led to average returns of 72% IRR. Greater
pressure to divest among family firms, arising from unresolved succession issues, could be
exploited by the buyout fund through negotiating a favourable acquisition price. By contrast, sellers
that stated that they had considered the buyout fund’s offer as attractive, may indeed have received
a price above market value for their asset, since the average IRR of those buyouts only reached
55%, i.e. representing a potential indication for over-payment. Secondary buyouts as a result of a
primary fund’s pressure to exit may directionally point to reasonable value creation potential
during the negotiation phase, as target company average IRR reaches 69% (on this small number of
cases). Furthermore, companies sold (under pressure) due to financial problems are highly likely to
continue to show problems thereafter. According to these results, buyout funds must on average be
judged unsuccessful at turnarounds, as the average IRR only reached 36%. In summary, pressure to
divest could be seen in categories two, three, four and especially six (counted in graph from the
left), however, the return profile does not support variable hypothesis H69, which is therefore
rejected.
2810 7 1037
186%
72% 70% 69%
55%
36%
19%
47%
31%
118%
45%
177%
0
10
20
30
40
Opp
ortu
nity fr
om P
rivat
izat
ion
Family
/Suc
ession
Issu
es
Dives
tmen
t of N
on-c
ore
Busin
ess
Buyout
Fun
d Requ
ired
to E
xit
Favor
able
Pric
e Offe
red
Finan
cial P
roblem
s
Fre
qu
en
cy (
N)
0%
50%
100%
150%
200%
Avera
ge G
ross I
RR
Frequency of IRR Average Gross IRR Standard Deviation of IRR
Figure 138: Buyout Deal Performance by Seller Motivation
Source: INSEAD Buyout Strategy Database, analyzed by author (Deal N=65; mean IRR=81%).
6.3.1.8. Buyer’s Motivation and Buyout Performance
How do buyout funds evaluate a transaction opportunity and which target characteristics ensure
strong returns on investment? The results for buyer’s motivation for leveraged buyout activity
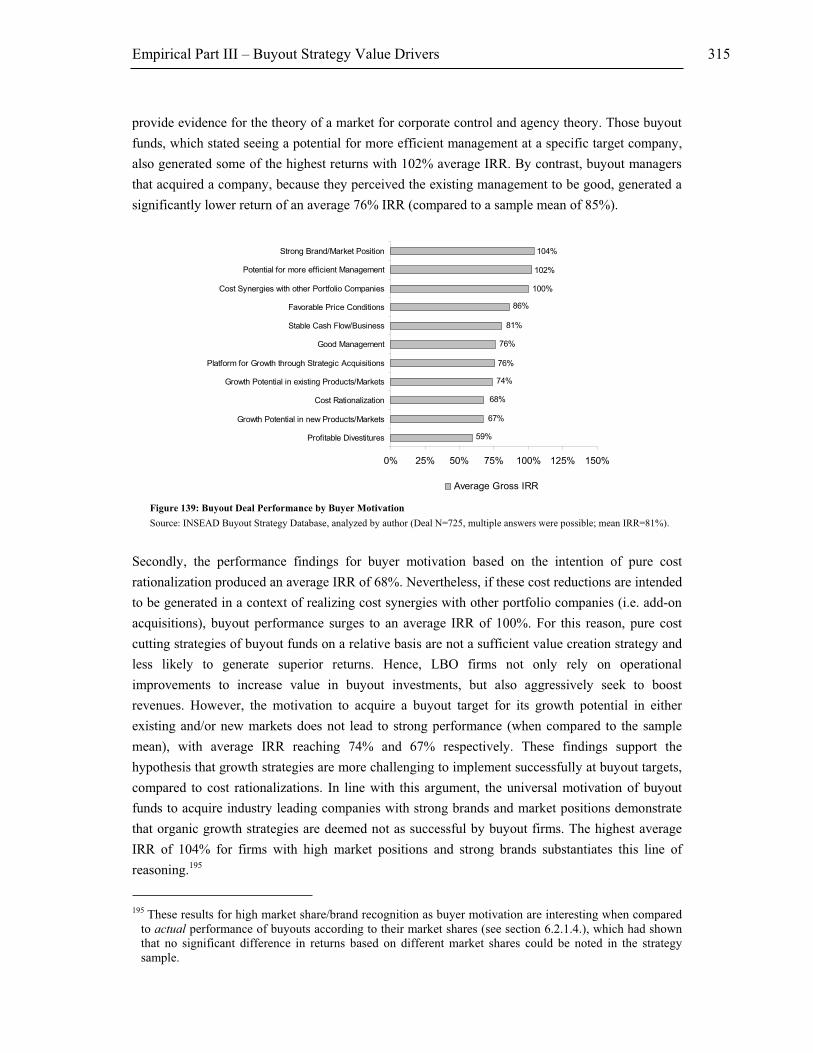
Empirical Part III – Buyout Strategy Value Drivers 315
provide evidence for the theory of a market for corporate control and agency theory. Those buyout
funds, which stated seeing a potential for more efficient management at a specific target company,
also generated some of the highest returns with 102% average IRR. By contrast, buyout managers
that acquired a company, because they perceived the existing management to be good, generated a
significantly lower return of an average 76% IRR (compared to a sample mean of 85%).
102%
104%
76%
76%
74%
68%
67%
100%
86%
81%
59%
0% 25% 50% 75% 100% 125% 150%
Profitable Divestitures
Growth Potential in new Products/Markets
Cost Rationalization
Growth Potential in existing Products/Markets
Platform for Growth through Strategic Acquisitions
Good Management
Stable Cash Flow/Business
Favorable Price Conditions
Cost Synergies with other Portfolio Companies
Potential for more efficient Management
Strong Brand/Market Position
Average Gross IRR
Figure 139: Buyout Deal Performance by Buyer Motivation
Source: INSEAD Buyout Strategy Database, analyzed by author (Deal N=725, multiple answers were possible; mean IRR=81%).
Secondly, the performance findings for buyer motivation based on the intention of pure cost
rationalization produced an average IRR of 68%. Nevertheless, if these cost reductions are intended
to be generated in a context of realizing cost synergies with other portfolio companies (i.e. add-on
acquisitions), buyout performance surges to an average IRR of 100%. For this reason, pure cost
cutting strategies of buyout funds on a relative basis are not a sufficient value creation strategy and
less likely to generate superior returns. Hence, LBO firms not only rely on operational
improvements to increase value in buyout investments, but also aggressively seek to boost
revenues. However, the motivation to acquire a buyout target for its growth potential in either
existing and/or new markets does not lead to strong performance (when compared to the sample
mean), with average IRR reaching 74% and 67% respectively. These findings support the
hypothesis that growth strategies are more challenging to implement successfully at buyout targets,
compared to cost rationalizations. In line with this argument, the universal motivation of buyout
funds to acquire industry leading companies with strong brands and market positions demonstrate
that organic growth strategies are deemed not as successful by buyout firms. The highest average
IRR of 104% for firms with high market positions and strong brands substantiates this line of
reasoning.195
195 These results for high market share/brand recognition as buyer motivation are interesting when compared
to actual performance of buyouts according to their market shares (see section 6.2.1.4.), which had shown that no significant difference in returns based on different market shares could be noted in the strategy sample.
Empirical Part III – Buyout Strategy Value Drivers 316
Thirdly, transactions that were entered with the motivation to acquire a platform for external
growth through strategic acquisitions displayed an average IRR of 76%, below the sample mean. In
section 4.4.5., it was demonstrated that buyout firms are successful anti-cyclical investors. As a
consequence, “favourable price conditions” as motivation for acquisitions also shows an above
average return of 86% average IRR. The analysis of returns according to buyer motivation
demonstrates that the motivation “stable cash flow business” criterion (81% of average IRR) is
equally not sufficient to generate superior buyout returns as is the simple cost rationalisation
argument or growth potential. In summary, identifying weakly managed businesses, with strong
brands and market shares and taking advantage of synergies among portfolio companies may prove
to lead to best results for buyout funds. Variable hypothesis H70 can therefore be accepted in
general.
6.4. Acquisition Process and Strategic Events
6.4.1. Test results
It has so far been demonstrated that the buyout target’s business characteristics, the relationship
between General Partners and its portfolio company management as well as decisions and
motivations around the planning and execution of the leveraged buyout transaction may influence
acquisition performance. However, the remaining analysis in this section casts light on the actual
operational strategies implemented post acquisition, which are fundamentally determining the
extent to which the business can be improved.
6.4.1.1. Key Strategic Reorientation/Organizational Events and Buyout Performance
What are the core strategic and organizational decisions in a buyout transaction and what
influence do they have on performance? In section 6.3.1.8., it was established that the motivation to
purchase a company due to observed inefficiencies caused by the existing management team had
produced high returns on investment. The findings in this section – what actually happened – on
strategy confirms agency theoretical thoughts around a market for corporate control with respect to
management turnover – the average IRR of buyout companies, which had undergone a radical
change in management during buyout fund ownership, produced an average IRR of 89%, well
above the sub-sample mean of 79%. This result is in line with agency theory and contradicts
findings supporting the resource-based view (Cannella and Hambrick 1993; Krishnan, Miller et al.
1997; Zollo and Singh 2000), which stated that managerial turnover reduces acquisition
performance in a general acquisition context.

Empirical Part III – Buyout Strategy Value Drivers 317
64 16 3434 55
54%
69%85%
89%97%
63%
57%
159% 163%
141%
0
10
20
30
40
50
60
70
Expansion of
Product Lines
Replacements in
Managment Team
Strategic
Reorientation
GP Managers
Intervention
Organizational
Restructuring
Fre
qu
en
cy (
N)
0%
50%
100%
150%
200%
Avera
ge G
ross I
RR
Frequency of IRR Average Gross IRR Standard Deviation of IRR
Figure 140: Buyout Deal Performance by Key Strategic Reorientation/Organizational Event
Source: INSEAD Buyout Strategy Database, analyzed by author (Deal N=203, multiple answers were possible; mean IRR=79%).
The performance results from the strategy firm sample are also in support of prior literature (Seth
and Easterwood 1993; Phan and Hill 1995), proving that strategic redirection through the LBO firm
is not only vital in buyout transactions, but also leading to superior returns, as demonstrated by an
average IRR of 85%. Variable hypothesis H71 can be therefore be accepted. In section 6.3.1.8., it
was established that a financial buyer’s rationale for acquiring a company for reasons of expanding
existing or new products/markets had produced relatively low returns. However, there appears to
be a surprising imbalance between motivation and actual performance: from the post-acquisition
event point of view, there is clear evidence that the expansion of product lines has been a
successful mean to create value in buyout transactions, with strong returns of 97% average IRR
ranging well above the sample mean.
On the contrary, if major organizational restructurings have to be carried out by the General Partner
post acquisition, or GP managers have to intervene actively in business operations (voluntarily or
due to risk of default), the average IRR for these transactions remains sub-optimal with 54% and
69% respectively. This finding is in concordance with the finding from section 6.3.1.7., showing
particularly low returns when the seller disposes of an asset because of financial problems. It could
be conjectured that buyout funds may be reasonably successful in punctual cost cutting
improvements, but not in major turnaround or restructuring situations, which as a consequence
should be avoided.
6.4.1.2. New Sub-Strategy Implementation Events
What type of actual strategy implementations lead to positive results in buyouts? Agency theory
finds further support through the sample’s descriptive results in the sub-strategy analysis: the
introduction of new incentive plans for top management (and other employees) produces very

Empirical Part III – Buyout Strategy Value Drivers 318
robust returns of 172% average IRR. However, the standard deviation of results is particularly high
with 273%, which points to the fact that the use of incentive systems generates several
exceptionally strong (and few weak) returns, increasing volatility in this case. Variable hypothesis
H72 can therefore be accepted, as management incentivation appears to be the most important
strategic measure on a relative basis.
820 24 1396
41%
172%
92%
91%90%
70%65%
69%
273%
59%
98%
83%
0
5
10
15
20
25
New incentive
Plans
New Pricing
Strategy
New IT System New R&D
Strategy
New Marketing
Approach
New Reporting
System
Fre
qu
en
cy (
N)
0%
50%
100%
150%
200%
250%
300%
Avera
ge G
ross I
RR
Frequency of IRR Average Gross IRR Standard Deviation of IRR
Figure 141: Buyout Deal Performance by New Sub-Strategy Implementation Events
Source: INSEAD Buyout Strategy Database, analyzed by author (Deal N=80, multiple answers were possible; mean IRR=96%).
The results with respect to marketing strategy are twofold. The findings from the sample’s
descriptive statistics illustrate that a complete new marketing approach for the buyout target cannot
be generally recommended as it does not lead to above average performance. The average IRR for
this measure only reaches 70%, which is below the main and sub-sample means of 85% and 96%
repectively. However, instead of an entire new marketing strategy, the introduction of a new
pricing strategy only may be correlated with significantly higher returns (average IRR of 92%)196.
These results should be interpreted in conjunction with the results from section 6.4.1.1. above,
which had shown that the (actual) expansion of product lines was a successful value creation
strategy. Therefore, the joint positive impact on performance through product expansion and new
pricing system may be the result of (i) potential cost savings generated at the buyout target, which
offered room for a more flexible and/or lower average product pricing, which led to higher
revenues and cash flow generation, (ii) a product portfolio mix review/revaluation led to a decision
for a differentiated pricing strategy, e.g. with multiple brands and segements (i.e. expansion of
product lines), independent of prior static strategic customer relationships.
Buyout transcations that had undergone an implementation of new IT systems or an enhanced R&D
activity could recognize a slightly positive effect on performance, with an average IRR of 91% and
196 The low number of cases (below 10) for three of the six categories in this analysis of tested variables
should also be taken into consideration.

Empirical Part III – Buyout Strategy Value Drivers 319
90% respectively, ranging above the sample mean IRR of 85%. However, the costs involved with
putting a new reporting system into service may outweigh the actual benefits, with only 65%
average IRR for this strategic measure. In any case, these exploratoy findings have be read with
consideration to the low numbers of variable cases though and need further validation.
6.4.1.3. Capacity, Resource Planning and (Dis)Investment Activities
6.4.1.3.1. Disinvestment Activities and Buyout Returns
Which acquisition and disposal activities of target assets and resources represent value enhancing
strategies? With regard to asset and capacity optimization, there are several options available to the
buyout firm: first, through facility consolidation programs, buyout funds may close down
unprofitable operations, thereby reducing slack capacity and/or rebuilding the necessary capacity at
more profitable sites. The average performance of buyout companies undergoing a site
consolidation strategy in this sub-sample is only 60% of average IRR, thereby exhibiting the worst
overall return. One reason for this low yield could be that site consolidations could be considered
as a rather drastic restructuring measure and potentially provide evidence of a turnaround situation
rather than a healthy, profitable buyout target. As displayed in section 6.4.1.1., returns on
turnaround situations were dismal.
33 2165 1166 8
66%
83%
88%
101%
103%
60%
137%
66%73%
136%
174%
110%
83%
44%
0
10
20
30
40
50
60
70
Layoffs Geographic
Expansion
Increased Use of
Outsourcing
Add-on
Acquisitions
Relocation of
Facilities
Joint Ventures Consolidation of
Facilities
Fre
qu
en
cy (
N)
0%
50%
100%
150%
200%
Avera
ge G
ross I
RR
Frequency of IRR Average Gross IRR Standard Deviation of IRR
Figure 142: Buyout Deal Performance by Capacity, Resource Planning and (Dis)Investment Activities
Source: INSEAD Buyout Strategy Database, analyzed by author (Deal N=150; multiple answers were possible mean IRR=91).
By contrast, instead of a facility consolidation program, General Partners may opt for a relocation
of facilities to low cost sites (or countries). This commonly well-prepared strategy is more likely to
result out of a position of financial and competitive strength at the buyout target; hence the
accompanying average returns found with this alternative are also notably higher at 83% average
IRR. As a third alternative, an increased use of outsourcing may free capital from the balance sheet.
The average IRR on this indirect capacity reduction option was 101%, and thus implying that

Empirical Part III – Buyout Strategy Value Drivers 320
outsourcing may be a more advantageous, less disruptive strategic alternative in the leveraged
buyout context.197 Furthermore, the human resource factor intensity can be substantially reduced in
buyout transactions. The results for the strategy dataset exhibit an average IRR of 137% for buyout
transactions that were characterized by substantial layoffs. This finding – if further validated on a
larger sample – provides robust support for the line of argumentation of Shleifer and Summers
(1988), i.e. that leveraged buyouts involve a wealth transfer from employees to fund investors.
65 9
88%
59%
136%
33%
0
10
20
30
40
50
60
70
Add-on Acquisitions Divestitures
Fre
qu
en
cy (
N)
0%
25%
50%
75%
100%
125%
150%
Avera
ge G
ross I
RR
Frequency of IRR Average Gross IRR Standard Deviation of IRR
Figure 143: Buyout Deal Performance by Acquisition and Divestiture Activity
Source: INSEAD Buyout Strategy Database, analyzed by author (Deal N=74; mean IRR=73%).
More drastically, the General Partner may decide not only to close down particular facilities, but to
dispose of entire parts or divisions of the buyout target, which he considers non-core (or not
profitable enough). 198 These asset disposals can also be regarded as partial exits, as they may lead
to a substantial cash inflow that is either utilized to decrease leverage and/or could be distributed to
the buyout fund through a special dividend. However, the performance of buyout transactions that
used divestitures to streamline their asset utilization is well below the sample mean with an average
IRR of 59%. This could be interpreted in a similar fashion as the negative performance found for in
transactions that had undergone a consolidation of facilities, i.e. divestitures may be an indication
of major restructurings and/or turnaround situations, which had previously demonstrated to be
unprofitable for buyout funds. However, the returns generated by the divestiture may also be
dependent on the quality of the asset sold.199
197 Please note the limited validity of conclusions due to the restricted number of cases (below 10) in the
latter variable, as well as two further categories in this analysis. 198 During the leveraged buyout boom of the 1980s, one frequently employed strategy of financial investors
was “asset stripping”, in which an undervalued target firm (often a conglomerate) was acquired and subsequently sold “in pieces”, as the acquiring investor (e.g. buyout fund) assumed that the value of the sum of the parts was higher than the combined entity (“conglomerate discount effect”). This strategy can rarely be observed nowadays.
199 Exploratory findings for the sub-sample indicate a trend that transactions that disposed of non-core businesses generated considerably lower returns than buyout companies that sold parts of their core

Empirical Part III – Buyout Strategy Value Drivers 321
6.4.1.3.2. Investment Activities and Buyout Returns
On the other side, instead of merely downsizing the business, buyout funds have a range of options
to create value in leveraged buyouts by expanding the target’s business reach. The high average
return of 103% IRR on the strategy company sub-sample highlights that geographic expansion
could be a key value creation strategy available to buyout funds. However, the associated high
volatility measured as standard deviation of returns also insinuates the inherent risks in this
expansion strategy. Furthermore, the General Partner could employ joint ventures and strategic
alliances to further enhance geographical reach on the one side, and to acquire new skills and
capabilities on the other. Nonetheless, the average IRR of just 66% on the limited observed cases
that engaged in joint ventures suggests that this method of expansion is far less effective than
geographic expansion, which could for instance be the result of a lower degree of managerial
control in these relationships.
As an alternative growth strategy, LBO firms may decide to undertake add-on acquisitions of either
new lines of business or to expand business scope in such areas in which distinctive competences
and resources are strong compared to competition (Easterwood, Seth et al. 1989; Liebeskind and
Wiersema 1992; Seth and Easterwood 1993). The performance results collected on the strategy
dataset sample suggest that buyout companies that engaged in add-on acquisitions on average
returned 88% IRR, slightly above the main sample mean of 85%. Interpretations for the positive
performance effect of buy-and-build strategies is that by aggressively creating critical mass through
add-on acquisitions, target companies (i) are able to extract synergies and to create favourable cost
positions and organic growth platforms, (ii) may contribute to consolidation of the market, thereby
reducing competition and extracting supplementary rents, (iii) gain the necessary size to exit via
public markets or become a more attractive acquisition target for strategic buyers. The value seen
in the extraction of synergies between portfolio company and add-on acquisition (see section
6.3.1.8.) is substantiated by the distribution of acquisition types: 83% of add-on acquisitions in the
relevant sub-sample were horizontal acquisitions that most likely offered considerable synergies.
The remaining 17% represents diversifying acquisitions, whose value for the platform company
could be found in areas such as new product lines, technologies, distribution channels or markets.
The average IRR on either acquisition type does not differ substantially.200
business. This could imply that the non-core business may not only have limited appeal to the seller, but potentially also to the acquiring party, and hence realized prices on disposal are low, i.e. do not positively affect returns. A detailed analysis is omitted here due to insufficient sample size.
200 Note that the sample size for this specification is lower than the total number of add-on acquisition cases due to heterogeneity of underlying data, i.e. not all General Partners offered details on acquisition type.

Empirical Part III – Buyout Strategy Value Drivers 322
8 39
83%85%
170%
62%
0
10
20
30
40
Diversifying Acqusition Horizontal Acquisition
Fre
qu
en
cy (
N)
0%
50%
100%
150%
200%
Avera
ge G
ross I
RR
Frequency of IRR Average Gross IRR Standard Deviation of IRR
Figure 144: Buyout Deal Performance by Type of Add-on Acquisition
Source: INSEAD Buyout Strategy Database, analyzed by author (Deal N=47; mean IRR=84).
Having established that add-on acquisitions may present an important value driver for buyout
returns, the question remains whether there is a value-optimizing number of add-on acquisitions to
be undertaken by the General Partner. The findings in section 6.3.1.8. had suggested the beneficial
nature of extracting synergies from add-on/portfolio companies. This is generally in line with
strategic management theory on “related acquisitions”, which is based on a perspective of
acquisitions according to the resource-based view of the firm (Rumelt 1984; Wernerfelt 1984;
Barney 1988; Dierickx and Cool 1989). Empirical work in this area has used the resource
perspective of the firm in order to test the impact of “resource relatedness” on the performance of
these transactions (Chatterjee 1986; Lubatkin 1987; Singh and Montgomery 1987; Shelton 1988;
Seth 1990; Chatterjee, Lubatkin et al. 1992; Healy, Palepu et al. 1992). However, results with
respect to acquisition performance have been very mixed. 201 As a consequence, it could be
expected in relation to leveraged buyouts that the more add-ons are executed, the higher the amount
of overall extractable synergy potential available to the platform company, and the stronger the
target’s gained market position. However, there are also target search, transaction execution,
integration and synergy extraction implementation costs. Furthermore, the created imbalance in the
company’s resource configuration due to the constant organizational change, especially the bound
managerial focus, may have adverse effects.
The results on the strategy sub-sample display that one add-on acquisition is clearly the superior
option for buyout funds, with average IRR reaching 128%. Thereafter, returns deteriorate to 69%
average IRR for two add-on acquisitions and 74% average IRR for three or more add-ons. These
findings may suggest that the extra value added through extraction of synergies in each additional
add-on acquisition after the first one are over-compensated by the accompanying integration costs.
201 See Zollo and Singh (2000) for a detailed discussion.

Empirical Part III – Buyout Strategy Value Drivers 323
1120 21
74%
69%
128%
100%
40%
227%
0
5
10
15
20
25
One Add-on Two Add-ons Three or more Add-ons
Fre
qu
en
cy (
N)
0%
50%
100%
150%
200%
250%
Avera
ge G
ross I
RR
Frequency of IRR Average Gross IRR Standard Deviation of IRR
Figure 145: Buyout Deal Performance by Number of Add-on Acquisitions
Source: INSEAD Buyout Strategy Database, analyzed by author (Deal N=52; mean IRR=90).
In summary, variable hypothesis H73 can be accepted, as both of the discussed value creations
strategies – “investment” and “disinvestment” activities – demonstrate to be equally apt to generate
solid returns. However, the above results have also demonstrated that for each alternative, several
strategic options are more favourable than others.
6.5. Modelling Buyout Characteristics, Decisions and Strategic
Events
The prior section has descriptively discussed a range of variables designed to capture strategic
considerations in buyout transactions. In this section, each bloc of variables will be tested
statistically in order to strengthen some of the above findings and to examine the combined
explanatory power of buyout strategy related variables. Correlation tables and a nested multivariate
regression model is presented to highlight the importance to include strategic characteristics in an
analysis of buyout value creation processes.
6.5.1. Test results
6.5.1.1. Descriptive Statistics
It should be noted again that due to the scarcity of strategic information provided in PPMs by
Limited Partners this analysis has been performed on a considerably lower sample size compared to
all other parts of this study; hence statistical significance is limited to a fewer number of variables
and often based on a low number of valid cases. Nevertheless, the examination of the bivariate
Pearson correlation matrix between the dependent variable IRR and the various independent buyout

Empirical Part III – Buyout Strategy Value Drivers 324
strategy variables confirms some of the earlier findings. First, the key finding with respect to target
characteristics is that a stable industry is negatively and significantly (at the 0.05 level; 2-tailed),
while a cyclical industry environment is positively, but non-significantly correlated with gross IRR
performance. This result is in line with the descriptive findings, but contrary to industry beliefs that
investments in stable industry environment yield high returns. Despite the considerably more
elevated associated variance of returns in cyclical industries, from a statistical point of view
investments in cyclical businesses may yield higher returns202. The Pearson correlation for diversity
of customer base confirms the descriptive trend that buyout transactions involving a profitable
single customer outperform large customer base deals. The variable is highly positively and
significantly (at the 0.01 level; 2-tailed) correlated to acquisition performance; the low number of
cases must be taken into consideration here though. As Transactions whose prior organizational
structure was part of a larger entity validate to be positively and significantly (at the 0.05 level; 2-
tailed) linked to strong IRRs compared to buyout targets that had been standalone businesses. This
finding in particular underlines the value creation opportunity resulting from conglomerate and
larger business divisional spin-offs. With respect to prior corporate governance structures, the
Pearson correlation displays high, statistically significant (at the 0.01 level; 2-tailed) returns for
buyout targets that had been state-owned prior to acquisition. This finding supports agency
theoretical expectations that the introduction of a more shareholders-oriented, incentivized new
management team, which is closely monitored and controlled by the buyout firm owners, is able to
lift significant value creation potential.
Secondly, among the deal decision and motivation variables, the seller type government exhibits a
highly positive and significant (at the 0.001 level; 2-tailed) correlation with IRR, which is in line
with the above findings for prior state-owned corporate governance structure. Equally related and
in line is the finding that the seller divestment rationale opportunity from privatization is positively
and significantly (at the 0.05 level; 2-tailed) correlated with performance. Among the buyer’s
motivations to acquire the target, the acquisition rationale cost rationalization does attest to deliver
negative and significant (at the 0.05 level; 2-tailed) returns to General Partners. This finding is
underlining the descriptive comparison of buyer motivations, which had demonstrated that the
acquisition rationale cost rationalization only showed an average IRR of 68% and thus does not
guarantee superior returns in the leveraged buyout context compared to other available alternatives.
This finding is therefore in support of the theory that constant improvements in operational
effectiveness to achieve superior profitability is necessary, but usually not sufficient (Porter 1996).
Although statistically non-significant in this sample, the potential for more efficient management is
positively correlated to acquisition performance, which would be in support that the theory of a
market for corporate control (Manne 1965; Jensen and Ruback 1983) equally applies to the
leveraged buyout context. A surprising finding is the statistical significance (at the 0.05 level; 2-
tailed) for choosing three or more co-investors for transactions.
202 This result is thereby also in line with efficient market theory, compensating higher levels of risk with
higher returns.

Empirical Part III – Buyout Strategy Value Drivers 325
If proven on larger samples, this development could be interpreted as evidence that the
combination of buyout firm expertise and financial power leads to (i) a higher success rate to win
targeted assets, (ii) less competitive and hence more attractive prices, and (iii) more successful
transaction execution and decision-making. To the latter point, the additional ‘checks and balances’
introduced through further investors could be seen as an indication that even for players highly
active in the market for corporate control, there may be benefits for themselves (and buyout
performance) through the scrutiny of a “board of corporate control” consisting of equally-minded
and empowered buyout firm peers.
Descriptive and Correlation StatisticsVariable (Dummy) Tested N(1) Mini-
mum Maxi-mum
Sum(2) Mean Std. Deviation
Pearson Correlation
Sig. (2-tailed)
Control Variables
Deal Exit Status – Bankruptcy 274 0 1 9 ,03 ,179 -,220(**) 0
Deal Country – Scandinavia 274 0 1 17 ,06 ,242 ,198(**) ,001
Deal Country – USA 274 0 1 71 ,26 ,439 ,079 ,192
Deal Country – Italy 274 0 1 17 ,06 ,242 -,087 ,152
Deal Country – Spain 274 0 1 20 ,07 ,261 -,097 ,110
Target Characteristics Variables
Industry Cyclicality – Stable 274 0 1 43 ,16 ,364 -,119(*) 0,049
Industry Cyclicality – Cyclical 274 0 1 127 ,46 ,500 0,08 0,189
Business Strategy – Niche 274 0 1 33 ,12 ,326 0,084 0,166
Customer Base – Many 274 0 1 169 ,62 ,487 -0,078 0,199
Customer Base – Single 274 0 1 7 ,03 ,158 ,236(**) 0
Prior Corporate Governance – Private/Family business
274 0 1 115 ,42 ,494 -0,11 0,07
Prior Corporate Governance – State-owned
274 0 1 7 ,03 ,158 ,191(**) 0,001
Prior Organizational Structure – Part of a larger entity
274 0 1 87 ,32 ,466 ,140(*) ,021
Deal Decision Variables
Seller’s Motivation – Opportunity from Privatization
274 0 1 10 ,04 ,188 ,151(*) 0,012
Buyer’s Motivation – Potential for more efficient Management
274 0 1 72 ,26 ,441 0,081 0,183
Buyer’s Motivation – Growth Potential in ex. Products/ Markets
274 0 1 150 ,55 ,499 -0,09 0,135
Buyer’s Motivation – Cost Rationalization
274 0 1 139 ,51 ,501 -,132(*) 0,028
Seller Type – Government 274 0 1 10 ,04 ,188 ,256(**) ,000
Deal Source – GP Management Network
274 0 1 56 ,20 ,404 -0,108 0,075
Deal Source – Proactive 274 0 1 35 ,13 ,334 0,079 0,193
Deal Source – Public deal 274 0 1 5 ,02 ,134 ,136(*) 0,025
Number of Co-Investors – More than two Co-investor
274 0 1 10 ,04 ,188 ,138(*) 0,023
Strategic Event Variables
Key Strategic Events – Organizational Restructuring
274 0 1 34 ,12 ,330 -0,089 0,143
Sub-Strategy Implementation – New Incentive Plans
274 0 1 20 ,07 ,261 ,186(**) 0,002
Valid N (listwise) 274
(1) Total sample size of tested cases (all realized transactions). (2) Number of cases where dummy variable = 1, i.e. number of transactions per variable tested. ** Correlation is significant at the 0.01 level (2-tailed). * Correlation is significant at the 0.05 level (2-tailed).
Table 58: Descriptive and Correlation Statistics on Buyout Firm Strategy Variables

Empirical Part III – Buyout Strategy Value Drivers 326
Finally, the strategic event variables overall displayed very low significance levels. The clear
exception represents the sub-strategy implementation of new incentive systems at the buyout target,
which is highly positively and significantly (at the 0.01 level; 2-tailed) linked to gross buyout deal
performance. In line with earlier research, the finding is in unambiguous support of the validity of
agency theory (Berle and Means 1932; Jensen and Meckling 1976; Fama 1980; Fama and Jensen
1983a; Fama and Jensen 1983b; Jensen 1986), which is also applying to the leveraged buyout
context (Smith 1990a). A consistently beneficial key source of value creation in leveraged buyouts
can therefore (relatively) effortlessly be established by buyout firms through the introduction of
managerial equity co-ownership and/or other incentive plans. Although statistically non-significant,
the results also directionally confirm that major organizational restructuring at buyout targets is
linked to adverse performance. This finding must be interpreted to the extent that on average, target
companies that for instance involve profound turnaround/restructuring situations do not sufficiently
compensate buyout firms – also in light of the high turnaround risk involved – and thus should
possibly be avoided as an investment opportunity from a statistical (historical return) standpoint.
6.5.1.2. Coefficient Statistics
The coefficient statistics provide a complete overview of all variables utilized in the subsequent
regression model. Although the strategy sample was generally not designed to carry a range of
control variables, there are two main control variables introduced, including Deal Exit Status and
Deal Country.203 Consequently, deals that led to bankruptcy, as well as several highly successful
transactions exited in Scandinavia and to a lower extent in the U.S. have been controlled for. It
should be noted again that the analysis (so far) only involves realized transactions, so the statistical
test controls for unrealized deals as well.
With respect to the focal buyout strategy variables in this examination, several variables had to be
excluded from the regression model due to the strong multicollinearity effects caused by them.
Among the target characteristics, two variables – Stable Industry Cyclicality and state-owned prior
Corporate Governance – have been excluded from the regression model. Among deal decisions,
the seller’s motivation Opportunity from Privatization was removed, with the latter two variables
by definition strongly correlating with the deal source government. The remaining tolerances
observed in the collinearity statistics are acceptable, with variance inflation factors generally below
a VIF factor of 2.0 at all times.
The coefficient analysis of the strategy variables shows that among target characteristics, the
variable single customer for buyouts target has a very positive and significant (at the 0.01 level)
impact on performance on the current deal (high standardized Beta coefficient of 0.178). Although
all other coefficients in this category are non-significant, they exhibit a similar trend as observed in
the correlation statistics (except for number of customers – many). It is noteworthy to point out

Empirical Part III – Buyout Strategy Value Drivers 327
again that there is statistical validation from the regression model for the fact that buyout targets
entered in particularly stable industries display a negative standardized Beta coefficient of -2.3%.
Buyouts acquired out of larger entities, however, contributed 8.4% to mean IRR. Among deal
decisions and rationales, the seller government on average generates a very positive and significant
(p<.01) impact on buyout performance (high standardized Beta coefficient of 0.196). On the
negative side, the buyer’s motivation to acquire a target for cost rationalization purposes on
average leads to value destruction of -13.6% (standardized Beta coefficient impact on mean IRR;
p<.05). Finally, the introduction of an incentive system at the buyout target contributes to a high
standardized Beta coefficient of 0.182, significant at the 0.001 level.
Coefficients(a)
Model Unstandardized Coefficients
Standardized Coefficients
t Sig. Collinearity Statistics
4 B Std. Error Beta Tolerance VIF
Control Variables
(Constant) ,726 ,231 3,139 ,002
Deal Exit Status – Bankruptcy -1,506 ,404 -,205 -3,726 ,000 ,933 1,072
Deal Country – Italy -,201 ,312 -,037 -,645 ,520 ,857 1,167
Deal Country – Scandinavia ,932 ,345 ,172 2,700 ,007 ,699 1,431
Deal Country – USA ,341 ,203 ,114 1,682 ,094 ,612 1,634
Deal Country – Spain -,207 ,300 -,041 -,691 ,490 ,795 1,258
Target Characteristics Variables
Customer Base – Single 1,481 ,471 ,178 3,142 ,002 ,876 1,142
Customer Base – Many ,045 ,190 ,017 ,236 ,814 ,566 1,766
Business Strategy – Niche ,164 ,228 ,041 ,716 ,475 ,877 1,140
Industry Cyclicality – Stable -,081 ,205 -,023 -,396 ,693 ,870 1,149
Prior Corporate Governance – Private/Family business
,092 ,198 ,035 ,463 ,644 ,506 1,977
Prior Organizational Structure – Part of a larger entity
,235 ,190 ,084 1,240 ,216 ,621 1,610
Deal Decision Variables
Deal Source – Public deal ,194 ,611 ,020 ,317 ,752 ,723 1,383
Deal Source – Proactive ,195 ,246 ,050 ,792 ,429 ,717 1,394
Deal Source – GP Management Network
-,253 ,192 -,078 -1,318 ,189 ,811 1,233
Seller Type – Government 1,368 ,429 ,196 3,192 ,002 ,750 1,334
Buyer’s Motivation – Potential for more efficient Management
,112 ,196 ,038 ,575 ,566 ,653 1,530
Buyer’s Motivation – Growth Potential in ex. Products/ Markets
-,075 ,154 -,029 -,488 ,626 ,826 1,211
Buyer’s Motivation – Cost Rationalization
-,356 ,149 -,136 -2,399 ,017 ,878 1,139
Number of Co-Investors – More than two Co-investor
,333 ,407 ,048 ,819 ,414 ,833 1,201
Strategic Event Variables
Sub-Strategy Implementation – New Incentive Plans
,917 ,280 ,182 3,274 ,001 ,913 1,095
Key Strategic Events – Organizational Restructuring
-,370 ,231 -,093 -1,603 ,110 ,835 1,198
(a) Dependent Variable: Gross IRR Performance
Table 59: Coefficients and Collinearity Statistics on Buyout Strategy Variables
203 For a more in-depth analysis of these and further control variables with respect to their varying degree of
influence on value creation, please refer to the first empirical chapter.

Empirical Part III – Buyout Strategy Value Drivers 328
6.5.1.3. Linear Regression Models Analysis
The linear regression model describing the explanatory strength of the buyout firm strategy
variables is very robust. Considered individually, all individual regression models are highly
significant (p<.001), with F values ranging between 4.469 for model 3 to 6.508 for model 1
(individual models omitted here). When considering the change statistics of the nested models 1-4,
it first can be observed that the stepwise introduction of variables in models 1-4 is highly
significant (p<.01) on each level, reaching an adjusted R square of 22.8% in model 4. As observed
in several tests beforehand and in the expanded control variable analysis in section 4.3.10., the
small group of control variables in model 1 already explains a significant portion of all variance in
buyout returns (adjusted R square of 9.2% in this strategy sub-sample). Model 2 introduces the
variables describing the buyout target’s strategic and operational configurations (except for the
two variables excluded as a result of multicollinearity considerations), which leads to a solid
improvement of adjusted R square by 5.1% to 14.3%. The change in F value of 3.691 is highly
significant at the 0.01 level (2-tailed). The following Model 3 then introduces the strategic deal
decision and motivation variables, which leads to a further improvement of adjusted R square by
5.1% to 19.4%. The change in F value of 3.084 is again highly significant at the 0.01 level (2-
tailed).
Linear Regression Model Summary Change Statistics Model R R Square Adjusted
R Square Std. Error
of the Estimate
R Square Change
F Change df1 df2 Sig. F Change
1 ,329(a) ,108 ,092 1,24984 ,108 6,508 5 268 ,000
2 ,422(b) ,178 ,143 1,21381 ,069 3,691 6 262 ,002
3 ,501(c) ,251 ,194 1,17695 ,073 3,084 8 254 ,002
4 ,536(d) ,288 ,228 1,15191 ,037 6,581 2 252 ,002
(a) Predictors: (Constant), Country and Exit Control Variables (Bankruptcy procedures, Scandinavia, USA, Spain, Italy) (b) Predictors: (Constant), above, plus Target Characteristics (Customers – Single/Many, Business Strategy – Niche, Prior Org.
Structure – Part of a larger Entity, Cyclicality of industry – Stable, Prior Corporate Governance – Private/Family Business) (c) Predictors: (Constant), above, plus Deal Decisions and Motivations (More than two Co-investors, Buyer’s motivations: Potential
for more efficient Management/Cost Rationalization/Growth Potential in ex. Products/ Markets, Deal Source: GP Management Network/Public deal/Proactive, Seller Type – Government)
(d) Predictors: (Constant), above, plus Strategic Events (New Incentive Plans, Organizational Restructuring) (e) Dependent Variable: IRR
Table 60: Linear Regression Model on Buyout Firm Strategy Variables
Finally, model 4 introduces the two variables exhibiting highest significance levels with respect to
strategic events, which leads to a further improvement of adjusted R square by 3.4% to 22.8%. The
change in F value of 6.581 is particularly significant again at the 0.01 level (2-tailed). The
introduction of each group of buyout firm strategy variables in the nested multivariate regression
model therefore led to a significant improvement in (i) the explanatory strength (R square) and (ii)
the model’s fit (F value) towards an elucidation of leveraged buyout performance. The importance
of controlling for unrealized leveraged buyouts when analyzing strategy variables becomes
decidedly transparent through an associated test of all of the 478 strategy dataset’s transactions,
which besides the 274 realized buyouts also carries information about 204 unrealized transactions.
Through a goal-seeking linear regression model optimization routine, the maximum adjusted R

Empirical Part III – Buyout Strategy Value Drivers 329
square achievable with the complete, mixed transaction dataset only reached 10.1%, i.e. exhibiting
less than half of the explanatory power of the above presented regression model.204
6.5.2. Summary of Findings
The analysis of buyout strategy variables in this chapter represents a first exploratory attempt to
reveal – on the micro-level of buyout transactions – what the strategic drivers in buyout value
creation are. Each sub-category demonstrated affirmative, controversial and surprising results that
may be further explored through future research. In the following, based on the key findings from
the descriptive (and statistical) analysis, results will be summarized through a typology of the
“perfect leveraged buyout target/transaction”. The typology is based on attributes, which had
demonstrated the highest average IRR for the underlying strategy sub-sample in the mentioned
dimensions.
The first group of variables described the buyout target’s strategic and operational configuration, its
business strategy and source of competitive advantage. According to this category, the most
successful buyout target from a return perspective would be a national champion, who preferably
operated in a cyclical industry that allows taking advantage of upward business cycles, e.g. the
cyclical service sector. The market share of the target would be irrelevant and the company was
rather a niche player with a distinctive, limited product and service offering. The company may
have benefited from a near monopoly position in its sector and/or had a very important single
customer, with whom it maintained a very strong long-term relationship and had excellent visibility
on future revenues/cash flows. The buyout target preferred to limit its marketing efforts to that
extent that it chose to focus on one type of distribution channel. Prior to its buyout, the business
had been part of a larger entity, a diversified conglomerate or potentially a division of a major
corporate with fragmented ownership, potentially even a state-owned business, which offers
significant value creation potential to the investing General Partner.
Secondly, taking into account the strategic deal decisions in the typology of the “perfect buyout
target”, the target company has been sourced by the financial sponsor proactively, i.e. without
external recommendations or approaches, and again, buying it from the public sector would clearly
be advantageous. Besides the public sector wishing to privatize the target, family and succession
issues could also serve as an excellent opportunity for the buyout firm to become active, i.e. to
approach the target. Equally, the buyout firm may decide to invest in the target as it has either
identified a strong potential for more efficient management or has hard evidence of strong brands
and market positions that justify their commitment. In its approach to the target, the General
Partner firm is well advised to involve one co-investor in the transaction for his added value
204 Further details regarding these additional statistics on the full strategy sample has been omitted
intentionally here.

Empirical Part III – Buyout Strategy Value Drivers 330
through expertise and/or financial power. The co-investor could especially also be a strategic
investor, who takes a minority stake and receives a call option to acquire the full business, e.g. in a
pre-determined time frame according to a previously agreed performance-linked purchase price
matrix. The prior owner should preferably not stay involved at all in the business. In case strategic
reasons make this unavoidable, equity participation is highly recommended to the buyout firm,
instead of allowing any continued managerial role of the prior owner, which could inhibit radical
strategic change and harm the value creation process.
Finally, the post-acquisition strategic actions available to the buyout firm in order to generate the
maximum value from the target should involve a replacement of management team, as on average a
new management team brings new valuable competences to the target business and is more apt to
execute change management. Instead of spending too much time on cost cutting alternatives, the
investing General Partner should directly focus on growth strategies for the business, e.g. through
an expansion of the target’s product lines, alongside a complete product portfolio review that
especially focuses on the target’s pricing strategy. In addition, the implementation of a new
incentive (co-ownership) system for management and/or throughout the business is absolutely
quintessential with a view on aligning managers’ goals with the investor and stressing the
accomplishment of the business plan’s financial targets. Having the alternative options to either
downsize or expand the target’s business, the latter choice should be recommended to the buyout
firm. Although cost cutting measures, such as layoffs to increase efficiency is indisputably adding
value, the buyout firm should refrain from major “asset stripping”, e.g. divesting major parts of the
business. Either geographic expansion or one smart add-on acquisition, which could either be
horizontal or vertical, will contribute far better to repositioning the company favorably and to
achieve an improved exit valuation.
The above outlined typology of the perfect buyout target/deal and the various variables implicitly
discussed therein have subsequently been tested statistically in a multiple regression model.
Although a range of variables did not confirm their descriptive trends through sufficient statistical
significance levels, several definite conclusions in each strategy variable category could be
established. As a general caveat, the limited sample size compared to the large number of degrees
of freedom necessary in order to execute this type of complex strategic analysis highlights the
limitations of the dataset. Nevertheless, the model overall posted an adjusted R square of 22.8%
and therefore contributes very meaningfully to the analysis of sources of value creation, further
supporting the chosen research design of this study.

Empirical Part III – Buyout Strategy Value Drivers 331
6.6. Conclusions
The “GP effect” in the value creation process of leveraged buyouts has been discussed in two
dimensions now. In the second empirical chapter, the analysis of investment managers and buyout
firms contributed to explaining why some General Partners may perform better on average than
others. First, their personal and firm characteristics were made explicit, and secondly, their
investment behaviour and track record was assessed statistically. The third empirical chapter took
the analysis of the GP effect on step further, by analyzing the particular actions, motivations and
decisions taken by the buyout firm before, at the time and after the focal buyout transaction. The
period before the acquisition is reserved for an in-depth evaluation of the buyout target’s
characteristics. The results in this chapter demonstrated that the buyout firm can increase its
probability to gain above average returns by focusing on certain business characteristics. At the
time of the acquisition, the buyout firm and the selling party each need to take distinctive decisions,
e.g. whether to involve co-investors or prior owners going forward. They also need to determine
what the overall rationale/motivation for the acquisition is. The findings in this regard indicated
that (i) several prior stated deal motivations perform unsatisfactory when evaluated post buyout
exit, (ii) some sellers and deal sources are more attractive than others and (iii) that the involvement
of co-investors may generally add value, while continued prior owner involvement frequently
destroys value. Finally, the available toolset of strategic measures available to buyout firms to
implement changes at the buyout target is diverse, yet some measures are clearly more
advantageous. In addition, the general decision for the General Partner between a more
expansionary activity and contraction/downsizing of the business should be answered in favour of
the former strategy, based on the performance results in this chapter of empirical results.
Nevertheless, despite these far-reaching insights into the strategic decision processes that
complement the GP effect in buyouts, no final conclusion or affirmative recommendation can be
given to General Partners yet. More research on even larger samples than the 274 realized buyout
transactions that had been analyzed in great detail will be needed in order to validate these initial
exploratory findings. In addition, the limits of quantitative analysis become evident here in to the
extent that the different nature of buyout situations may require a case by case analysis to make
valid recommendations. Any quantitative research must therefore eventually be supplemented by
further qualitative, e.g. case study, research on leveraged buyouts. This, however, should be the
mission of future research on the strategic aspects of this topic.

7. Summary and Conclusions
7.1. Summary of Study’s Key Findings
Due to the exploratory nature of the presented study, the amount of findings is extensive and hence
will in the following be presented in form of condensed summary tables, which (i) indicate all
tested variable hypotheses throughout this study, (ii) acceptance and rejection thereof, and (iii)
levels of statistical significance. The latter category is particularly important with respect to the
subsequent discussion and generalizability of results, in other words, their potential degree of
contribution to theory building. Despite a considerably larger amount of overall findings, only
results with sufficient statistical validity can be acknowledged, in line with the chosen research
methodology based on a quantitative approach.
7.1.1. Summary Findings on Market & Financial Related Value Creation Drivers
Following the first research question, the study’s first chapter of empirical results has tested and
provided an in-depth analysis of exogenous, systematic drivers of value creation, which represented
the fist pillar of this study’s research model. Important answers to the first research question and
towards the first general hypothesis (GH1) were presented. The initial tests on the primary Limited
Partners’ dataset sample of leveraged buyout transactions in this study were designed to (i) identify
the principal control variables surrounding buyout acquisitions, which were used throughout this
study, and (ii) to benchmark results against the control population. Each of these initial tests on the
various groups of (control) variables included formulation of variable hypotheses (“H”) with
respect to expected test outcomes, descriptive and graphical presentation and discussion of results
as well as statistical tests to assess the variable’s contribution towards explaining buyout
performance. In the following, these initial findings are summarized (compare table 61).
First, the observed abnormally strong performance of certain acquisition entry years in the Private
Equity industry was confirmed for deals that were entered in 1984, 1998 and 1999 (H2). The
country of origin (H4) of buyout transactions has overall not been identified as an important value
driver: the linear regression model has established that country variables are only adding minor
explanatory strength to the analysis of buyouts with up to 0.8% of R square on the sample under
review, which in other words means that buyout success is in general not dependent on
geography.205

Summary and Conclusions 333
Hypo-
thesis #
Tested
Variable
Variable Hypothesis Description Test Result / Key
Findings
Acceptance
or Rejection
Statistical
Validity
H1 Buyout Deal Investment
Status
Gross buyout deal performance of unrealized transactions is lower than for
realized buyout deals.
J-curve effect leads to lower returns for
unrealized deals.
Acceptance 0.01 (2-tailed)
H2 Buyout Deal
Transaction
Year
Gross buyout deal performance for
transactions undertaken during the
early 1980s as well as during the
internet boom and stock market rally
between 1997 and 2000 is
higher than for other years under
review.
Abnormal returns could
be recognized for the
entry years 1984, 1998
and 1999 as well as exit
years 1987, 1988, 1989
and 2001 (negative)
Acceptance 0.01
(2-tailed)
H3 Buyout Deal
Geographic
Origin
Gross buyout deal performance of
European transactions is higher than for
U.S. target companies.
European deals
demonstrated higher
means, yet no sufficient
statistical significance
Rejection N/A
H4 Buyout Deal
Country
Origin
Gross buyout deal performance for
transactions undertaken in European
nations are by and large higher than for
U.S. target companies.
Several countries/regions
outperformed the U.S.,
e.g. Scandinavia
Acceptance Scandi-
navia:
0.1
(2-tailed)
H5 Buyout Deal
Industry
Gross buyout deal performance for
investments undertaken in the
information technology sector has been
lower than in other industries.
Performance was found
to be higher, contrary to
the control population
Rejection 0.001
(2-tailed)
H6 Ownership
stake
acquired in
target
Gross buyout deal performance for
minority investments in buyout targets is
lower than transactions, in which the
General Partner has majority control
(defined as more than 75%).
Performance was highest
for majority control, but
convex relationship also
led to strong results for
minority investments
Rejection 0.411
non-
significant,
convex
distrib.
H7 Amount of
capital
invested
Gross buyout deal performance for
larger investments in buyout targets is
higher than for transactions with low
investment.
Mixed results – smaller
deals/investments
performed best, but also
mega-deals showed high
means
Rejection 0.126
(2-tailed)
for
invested
capital
H8 Holding
Period
Gross buyout deal performance is lower
the longer the holding period of the
investment is.
Clearly confirmed –
adverse impact for longer
investment horizons
Acceptance 0.01
(2-tailed)
H9 Entry Mode Gross buyout deal performance is
higher for initial acquisitions than for
later stage financing injections as the
potential for value creation is likely to
be higher at the time of the original
buyout.
Outright acquisitions
performed better than
other forms, e.g.
recapitalizations
Acceptance 0.001
(2-tailed)
H10 Exit Mode Gross buyout deal performance is
higher for transactions exited through
initial public offerings than through
private exit transactions.
IPO yields highest
returns, but in Europe
private exit through
strategic sale attractive
Acceptance 0.001
(2-tailed)
H11 Entry Type Gross buyout deal performance is
higher for transactions with less
competitive entry types.
Surprisingly, auctions
historically proved to
yield highest returns, but
returns are decreasing
Rejection 0.05
(2-tailed)
H12 Exit Type Gross buyout deal performance is
higher for transactions with more
competitive exit types.
IPO confirmed highest
returns, but
Acceptance 0.001
(2-tailed)
H13 Buyout Firm Gross buyout deal performance is not
significantly better or worse for any
individual buyout firm, based on
efficient market theory.
Several Buyout Firms
systematically out- or
under-perform the market
(GP effect motivation)
Rejection 0.001
(2-tailed)
Table 61: Summary Findings – Buyout Deal Performance and Entry and Exit (Control) Variables
With respect to the U.S.-European comparison (H3), although realized returns of some European
countries had higher average returns, this trend was statistically non-significant. Since significance
for U.S. deals could be found, no valid conclusions could be drawn from this sample.
205 “Geography” implicitly also includes factors such as legal, tax, financial market, labour market, etc.

Summary and Conclusions 334
The industry of buyout transactions (H5) has been identified to be a very important value driver.
The associated linear regression model confirmed that industry classification variables are adding
extensive explanatory strength to the analysis of buyouts with up to 4.5% of R square on the
Limited Partners sample. Some of the key findings include that in contradiction to the fund-based
results from the Venture Economics dataset, the buyout funds in the Limited Partners’ dataset
sample have actually successfully invested in the information technology sector. Among the more
traditional sectors, the service sector has proven to be very attractive from a return perspective, in
line with the findings of the control population. Consequently, it can be concluded that industry
dynamics play an important role with respect to successful buyout fund capital allocation.
With respect to market and financial value drivers that relate to entry, exit or investment period, the
holding period, i.e. length of the buyout firm investment (H8) at the target, was highly negatively
and significantly affecting buyout returns. The central takeaway for theory from this result must be
that buyout firms should have a confirmed interest for a quick investment turnover, not least due to
the fact that they will eventually be measured on their track record according to this dimension by
their fund’s investors. From a buyout fund practitioner perspective, investments with rather long-
term value creation strategies should be disadvantaged when compared to short opportunistic
investments. The results from the analysis of deal size (H7) and buyout performance produced
mixed results. Overall, smaller deals statistically proved to perform better, although also strong
returns for mega deals could be observed (yet statistically not confirmed). The mid-cap segment
also showed slightly lower returns. In summary, no meaningful trend that would support a firm
recommendation could be made on this variable. Equally, the ownership percentage acquired in
buyout transactions (H6) has not been identified to be an important value driver from a statistical
standpoint. This is partially the result of the convex relationship between ownership and
performance, i.e. majority control investments performed best as expected, but the surprising
finding on the Limited Partners sample is that minority investments, defined as less than 25%,
produce very attractive results, which could be explained through a successful co-investment
behavior among buyout funds. The 2nd and 3rd quartiles exhibit weaker average performance.
The analysis of entry and exit mode variables further revealed significant findings for the dynamics
of value creation and buyout returns. The entry mode variable analysis (H9) has shown that the
riskier outright acquisition yields higher returns than other entry modes, such as recapitalizations.
European exit modes on average performed better in this sub-sample, partially driven by lower
average investment holding periods. The exit mode variable (H10) confirmed that IPOs are
statistically the preferred exit route from a return perspective, in line with findings on the Venture
Economics control population. A surprising difference between Europe and the U.S. was, however,
that the private exit market is relatively more attractive in Europe, enhanced by shorter European
holding periods on this exit route. This has led to the conclusion that the private exit market in
Europe is more active than in the U.S., driven by the less advanced (Pan-)European consolidation
in most industries. The analysis of entry (H11) and exit (H12) type variables revealed further
interesting results from a practitioner point of view, yet not all statistically significant. The

Summary and Conclusions 335
“competitive” auction counter-intuitively has historically been the entry type, which yielded the
highest returns. Based on this phenomenon, conclusions were made that (i) the most attractive
assets from a value creation or market position perspective are being sold through competitive
auctions, and (ii) auctioned deals on average demonstrated to show the shortest holding period and
hence are attractive as the quicker exit increases returns. However, the development of recently
declining returns for auctioned deals was made explicit and must be cautiously observed. Finally,
the General Partner firm (H13) undertaking the buyout has statistically been verified as a potential
significant source of value creation. This evidence could be seen as the main motivation to study
the GP firm in more depth in the subsequent empirical chapters II and III. A summary regression
model on all of the above outlined control variables, posting an adjusted R square of 30.4%,
confirmed that a set of important value creation drivers has been identified.
The next major analysis on the primary Limited Partners’ dataset examined gross buyout deal
performance compared to public stock markets and put this into context with underlying industry
financial developments (see summary table 62). The findings made explicit that the Limited
Partners’ dataset is clearly outperforming both equity (H15) and industry (H14) benchmark indices:
measured on Level 3 industry performance, average industry performance amounted to 17%, while
excess value creation generation through all buyout deals in the sample was 57%. The degree of
value creation in the information technology, financial and non-cyclical services industries was
highest, in line with prior findings, and lowest for the utilities and natural resources sectors. Based
on the dataset, a buyout performance index according to entry and exit year was developed, which
demonstrated the trend of value creation across time. Through a range of statistical tests, it was
confirmed that buyouts are driven by overall industry benchmark performance. However, the
Limited Partners sample was found to exhibit a lower correlation with public equity markets (H16)
than observed in previous studies using fund data, e.g. by Bance (2002).
In order to make explicit further what the link between industry index and buyout performance is,
financial metrics of the respective buyout target’s industry at the time of entry and exit were
examined. A high EBITDA margin at the time of entry (H18a), an indicator for profitability and
cash flow generation potential, was found to be the key factor influencing buyout returns. Equally,
at the time of the acquisition, industry sales (H17a) and profitability (H18a) on average were set to
increase at least in the first two years following the acquisition. This finding supports a theory by
which buyout firms have developed a proficiency of entering buyout targets at the exact correct
time when industry growth prospects in the particular target industry were high (“investment
timing capability”). This theory is further substantiated by the fact that industry growth and
profitability prior to entry has not been positive. A surprising finding is that industry valuations at
the time of entry were not necessarily low, i.e. the assumingly efficient markets had priced in the
expected positive financial developments accordingly. In other words, buyout targets on average
were acquired with good growth prospects, but not at a bargain.

Summary and Conclusions 336
Hypo-
thesis #
Tested
Variable
Variable Hypothesis Description Test Result / Key
Findings
Acceptance
or Rejection
Statistical
Validity
H14 Buyout Deal Gross
Performance
compared to
Comparably
Companies
Gross returns on individual buyout transactions undertaken by General
Partners are significantly higher than in
comparable public companies within the
same industry over the holding period of
the buyout target firm.
Buyout sample on average performed
significantly better than
comparable companies
Acceptance 0.01 (2-tailed)
H15 Buyout Deal
Gross
Performance
compared to
Equity
Markets
Gross returns on individual buyout
transactions undertaken by General
Partners are significantly higher than
the applicable broader equity market
performance over the holding period of
the buyout target firm.
Buyout sample on
average performed
significantly better than
the broader stock markets
Acceptance 0.01
(2-tailed)
H16 Correlation
with public
markets
Gross returns on individual buyout
transactions undertaken by General
Partners have a low correlation with
their respective industry indices’
performance.
Correlation on the deal
level proved lower than
previous studies on
buyout fund returns
Acceptance 0.01
(2-tailed)
H17a
H17b
Impact of
Industry
Revenue
Growth
Gross buyout deal performance is
higher for transactions undertaken when
(a) the industry’s revenue growth
prospects were high and (b) exited when
the industry’s revenue growth prospects
were low.
Both hypotheses were
confirmed, i.e. sponsors
prove to have a good
investment timing
capability with respect to
revenue growth
Acceptance
Acceptance
0.01/0.01
(2-tailed)
H18a
H18b
Impact of
Industry
Profitability
Gross buyout deal performance is
higher for transactions undertaken when
(a) the industry’s margin expansion
prospects were high and (b) exited when
the industry’s margin expansion
prospects were low.
Both hypotheses were
confirmed, i.e. sponsors
prove to have a good
investment timing
capability with respect to
profitability growth
Acceptance
Acceptance
0.01/0.01
(2-tailed)
H19a
H19b
Impact of
Industry
Valuation
Gross buyout deal performance is
higher for transactions undertaken when
(a) the industry’s entry trading multiple
expansion prospects were high and (b)
exited when the industry’s trading
multiples were at a peak.
First hypothesis
confirmed, valuations on
average were high at deal
entry already, but further
multiple expansion, not
significant for exit
Acceptance
Rejection
0.05/0.139
(2-tailed)
H20 Impact of
Industry
Leverage/
Cash
Generation
Gross buyout deal performance is
higher for transactions undertaken when
the industry’s cash flow generation and
de-leverage prospects were high
Directionally confirmed,
but statistically
deleverage had no
significant impact
Rejection 0.115
(2-tailed)
Table 62: Summary Findings – Buyout Performance vs. Industry Performance and Financials
However, variables for growth in trading multiples (“multiple expansion/riding”) (H18a) correlated
very positively with buyout performance, while industry deleverage (H20) as an indication of
increased cash generation proofed statistically non-significant. With respect to exit conditions, it
was demonstrated that the buyout firm’s investment timing capability finds additional evidence.
First, at the time of exit, industry financials had performed well over the two years prior to exit.
However, the financial outlook suggested that sales and margin growth would halt (H17b, H18b).
As a consequence, buyout firms on average also make correct divestment decisions, as they sell
target companies at the height of their respective industry’s financial development (“cycle peak”),
and before industry financial conditions worsen (e.g. cyclical downturns).
Finally, the first empirical chapter ended with a comparative analysis between the above mentioned
industry financial conditions and actual buyout target financial performance. The financial
development of buyout targets vis-à-vis their direct industry peers clearly indicated that buyout
target companies are outperforming industry comparable companies with respect to revenue
growth, profitability enhancements and cash flow generation (see summary table 63).

Summary and Conclusions 337
Hypo-
thesis #
Tested
Variable
Variable Hypothesis Description Test Result / Key
Findings
Acceptance
or Rejection
Statistical
Validity
H21 Buyout Target
Revenue
Growth
Gross buyout deal performance is higher than at comparable companies in
the industry, as considerably higher
revenue growth at buyout targets can be
achieved through the influence of the
buyout firm.
Target companies demonstrated on average
significantly higher
revenue growth than
comparable companies
Acceptance Not tested
H22 Buyout
Target
Profitability
Gross buyout deal performance is
higher than at comparable companies in
the industry, as considerably higher
profitability gains at buyout targets can
be achieved through the influence of the
buyout firm.
Target companies
demonstrated on average
significantly better
profitability
improvements than
comparable companies
Acceptance Not tested
H23 Buyout
Target Cash
Flow
Generation
Gross buyout deal performance is
higher than at comparable companies in
the industry, as considerably higher
operating cash flow generation at
buyout targets can be achieved through
the influence of the buyout firm.
Target companies
demonstrated on average
significantly better cash
flow generation than
comparable companies
Acceptance Not tested
H24 Acquisition
and Sale
Multiples
Gross buyout deal performance is
higher than at comparable companies in
the industry, as buyout firms on average
are able to acquire targets at a discount
to industry valuations and are able to
sell them at a premium.
Confirmed that buyout
firms on average manage
to acquire firms at a
discount and sell at a
premium
Acceptance Not tested
Table 63: Summary Findings – Buyout vs. Industry Financial Performance
In addition, buyout firms prove to be successful multiple arbitrageurs, entering companies at a
discount to market valuations and exiting at a premium. These results can therefore be seen as an
important contribution for the explanation of the above discussed observable excess returns over
public markets. The application of the value attribution formula developed in this study to the sub-
sample of buyouts then substantiated that buyout firms – on a relative basis – are also less
dependent than industry comparable companies on improvements in industry valuations, as they
rather take vigorous action to enhance revenue growth and profitability in order to maximize value
generation. However, differences in value creation strategies followed by buyout firms do become
transparent when evaluating different industries.
In summary, the results of the first empirical chapter on market and financial drivers provided
substantial support for the first general hypothesis (GH1) of this study, i.e. that favorable market,
industry, entry and exit conditions surrounding buyout acquisitions are positively and significantly
correlated with buyout returns. The first pillar of the presented research model on sources of value
creation in leveraged buyouts is therefore considered to be validated.

Summary and Conclusions 338
7.1.2. Summary Findings on Buyout Firm and Investment Manager Related Value Creation Drivers
Following the second research question, the study’s second chapter of empirical results has shifted
the emphasis on the indigenous, non-systematic drivers of value creation, which represent the
second major pillar of this study’s research model. Important answers to the second research
question and towards the second general hypothesis (GH2) were presented and formulated the basis
for a theory on the existence of a “GP effect” in the value creation process of leveraged buyouts. In
the following, the chapter’s key findings are summarized (compare table 64).
The analysis of the GP firm commenced with exploratory and descriptive tests on typical
investment manager and buyout firm characteristics, which were subsequently probed with regard
to their impact on performance. First, education has been identified as one area through which
buyout professionals can differentiate themselves and influence the return profile of their fund.
Buyout professionals typically undertake a combination of undergraduate degree and an MBA from
one of the leading business schools, although there is also a high frequency of triple degrees,
including PhDs and JDs. Among the most frequently visited institutions, Harvard University
clearly dominates the Private Equity industry with most graduates (14.3% of all degrees and 33.9%
of all MBAs). From a return perspective (within the team context), results were very mixed, but the
bivariate correlations suggest that both a high share of business and engineering degrees in a
buyout team are adversely affecting returns, while law and other degrees have a positive impact
(H28).
The homogeneity variable substantiates the fact that educational diversity (H42) among buyout
teams is benefiting returns. Also, the correlations suggested that master degree graduates appear to
perform worse than other graduates within the team context that only had a bachelor degree (H29).
Nevertheless, the 3rd degree category was the only one to demonstrate positive correlations (H30)
and was slightly below the significance level of 0.1 (2-tailed). Investment managers were clearly
found to attend the world’s top universities, but no firm conclusions with respect to which
universities would be recommendable for buyout manager education could be made (H31).
With respect to the professional experience of investment managers it can be stated that the
observed diversity of backgrounds is immense and that they receive professional training from the
world’s leading financial services, consulting, accounting and law firms. The analysis also reveals
that investment managers have created a network across academia, industry associations,
government-linked bodies and even charitable organizations. From a returns perspective, on an
individual basis, investment professionals with prior Private Equity, banking and finance or
corporate management experience perform well. Within the buyout firm team context, a higher
share of Private Equity and management experience continue to show very positive correlations
with performance, but banking, consulting and especially accounting backgrounds perform dismal.
This led to the conclusion that recruiting strategies of buyout funds may not be optimal, i.e. that a

Summary and Conclusions 339
lack of “the right” diversity within the LBO firm’s investment manager team adversely affects
returns.
Hypo-
thesis #
Tested
Variable
Variable Hypothesis Description Test Result / Key
Findings
Acceptance
or Rejection
Statistical
Validity
H25
H26
H27
Investment
Manager Age,
PE Exp.,
Tenure
Gross buyout deal performance is
higher for transactions, in which the
average Age, Private Equity Experience
and Tenure of investment managers and
the GP firm team is high.
Surprisingly, higher
experience in any of the
three measures led to an
adverse impact on returns
Rejection
Rejection
Rejection
0.453
0.05
0.05
(2-tailed)
H28
H29
H30
H31
Investment
Manager
degree field,
total number
of degrees,
higher
education
degree, top
University
Gross buyout deal performance is
higher for transactions, in which on
average
H28.) more investment managers had a
business or law degree.
H29.) more investment managers had a
higher than bachelor degree.
H30.) investment managers had a
higher number of total degrees.
H31.) investment managers attended
top ranked universities.
H28) Business degrees
performed negatively, law
degrees positively
H29) Higher degrees did
not prove beneficial
H30) Teams with third
degrees performed better,
but non-significant
H31) High variance in
results, no conclusive
trend
Rejection
Rejection
Rejection
Rejection
0.05
0.01
0.115
N/A
(2-tailed)
H32 Investment
Managers’
Extent of
Professional
Network
Gross buyout deal performance is
higher for transactions, in which the
average size of the investment
manager’s / GP firm team’s network
(professional experience) is high.
A large network did not
prove to be important
Rejection 0.59
(2-tailed)
H33 Investment
Managers’
Type of
Professional
Experience
Gross buyout deal performance is
higher for transactions, in which on
average more investment managers of
the GP firm team have acquired
professional experience in the financial
services industry or elsewhere in Private
Equity.
Banking tended to
adversely affect returns
(non-significant), while
prior Private Equity
experience showed a very
positive impact
Rejection/
Acceptance
0.093
0.01
(2-tailed)
H34 Buyout Firm
Hierarchy
Gross buyout deal performance is
higher for transactions, in which the
average number of hierarchies of the
investment managers / GP firm team
involved in a transaction is low.
A leaner buyout team
from a perspective of
involved hierarchies
performs better
Acceptance 0.1
(2-tailed)
H35 Buyout Firm
Team Age
Diversity
Gross buyout deal performance is
higher for transactions, in which the
average number of junior investment
manager professionals in the GP firm
deal team involved in a transaction is
high.
The adverse effect takes
place, junior investment
managers tend to
adversely affect returns
Rejection 0.05
(2-tailed)
H36 Buyout Firm
Team Size
Gross buyout deal performance is
higher for transactions, in which the
average number of investment manager
professionals in the GP firm is low.
Smaller buyout teams are
more successful
Acceptance 0.1
(2-tailed)
H37 Buyout Firm
Team
Knowledge/
Joint
Experience
Gross buyout deal performance is
higher for transactions, in which the
average joint deal history of the
investment manager professionals in the
GP firm deal team involved in a
transaction is high.
Directionally positively
correlated, but non-
significant
Rejection 0.609
(2-tailed)
H38-46 Homogeneity
of Buyout
Firm Team
Gross buyout deal performance is
higher for transactions, in which the
homogeneity of investment manager
professionals / GP firm deal team
involved in a transaction with respect to (i) age, (ii) Private Equity experience,
(iii) tenure, (iv) history with the team,
(v) type, (vi) level and (vii) number of
degree(s), (viii) universities and (ix)
hierarchies, is high.
(i) Diversity negative
(ii) Diversity negative
(iii) Diversity negative
(iv) Non-significant
(v) Non-significant (vi) Non-significant
(vii) Non-significant
(viii) No clear trend
(ix) Diversity negative
(i) Rejection
(ii) Rejection
(iii) Rejection
(iv) Rejection
(v) Rejection (vi) Rejection
(vii) Reject.
(viii) Reject.
(ix) Accept.
0.564
0.001
0.001
0,609
0.124 0.832
0.358
N/A
0.001
(2-tailed)
Table 64: Summary Findings – Investment Manager and GP Firm Characteristics

Summary and Conclusions 340
The time experience variables age (H25), tenure (H27) and Private Equity (H26) experience, have
produced results contradictory to expectations. From the descriptive findings, it could be
established that after a certain age of buyout partners, their acquisition performance declines
consistently. For tenure and years of industry experience, it appears as if senior investment
professionals, aspiring to become partner, as well as young partners perform better than more
experienced partners. This led to the postulation that both intrinsic and extrinsic motivation may
have a certain peak. Within the team context, the correlation statistics support the fact that those
partners with longest tenure and Private Equity experience adversely affect returns (H26, H27).
However, the team hierarchy and diversity correlations revealed that a high share of junior
professionals (H35) has an adverse effect and a higher share of partners has a positive effect on
performance. In line with this finding, deals performed better when there was a lower amount of
different hierarchies involved (H34), which in conjunction with the aforementioned finding
implicitly also “criticizes” the role of junior professionals at LBO firms.
The descriptive findings demonstrated that there may be an optimal buyout firm team size.
Historically, the most successful GP team size based on the Limited Partners’ data on average
consisted of 15 buyout professionals, undertaking transactions with an average investment size of
US$ 24 million (assuming a 3 to 1 debt to equity ratio, this implies an average transaction size of
US$ 100 million, i.e. the larger mid-cap deal segment). This is substantiated by the fact that buyout
firm teams with a high number of investment managers perform worse (H36). However, it can be
reasoned that the increase of fund sizes may shift the “optimal deal team size” to a larger number in
the future. There appears to be no clear argument for team diversity according to age (H38) or
position (H41). However, there was directional statistical evidence that the impact of new members
to the team with prior Private Equity experience resulted in a positive performance effect, but this
result was non-significant (H37). The homogeneity construct further led to mixed results. In
contrast to the above mentioned positive influence of a lower, i.e. more homogenous, amount of
hierarchies (H34, H46), homogenous tenure and years of Private Equity experience are favorable.
The linear regression analysis suffered from high multicollinearity between the investment
manager and GP firm characteristics variables, and hence, the explanatory power was inhibited due
to the fact that a very limited amount of variables could be introduced. Nevertheless, in
combination with a range of control variables, approximately one quarter of variation in buyout
performance could be explained through the GP firm characteristics variables. Among the
constructs, especially professional experience appears to affect performance and only to a lower
extent education, team structure, time experience and team homogeneity. Overall, these results are
in firm support of the second general hypothesis (GH2) of this study and substantiate the applied
research model and industry expert claims, i.e. that non-financial metrics relating to the buyout
firm’s team are quintessential in an assessment of value creation in leveraged buyouts.
The second major analysis relating to the GP firm as a potential contributor to value generation has
shown that several variables relating to acquisition experience of buyout firms statistically proved

Summary and Conclusions 341
to impact buyout performance (see summary table 65). First, in the regression context the number
of previous deals undertaken by buyout firms had a positive influence on IRR (H47a). The findings
generally support the hypothesis that learning (curve) processes on the General Partner firm level
constitutes an important factor in the value creation process in leveraged buyouts. In simpler terms,
it indirectly supports the fact that on average buyout funds that have been in the business for longer
are also the more successful ones. Likewise, the finding that transactions in the same deal size
category are adversely affecting returns (H47b) highlights the fact that thriving buyout funds are
over time constantly increasing their fund and deal sizes. Based on this perspective – frequently
voiced concerns in the Private Equity industry regarding exacerbating growth in fund sizes can be
rejected.206
Hypo-
thesis #
Tested
Variable
Variable Hypothesis Description Test Result / Key
Findings
Acceptance
or Rejection
Statistical
Validity
H47a
H47b
Magnitude of
similar
Buyout
Experience
compared to
focal Buyout
Gross buyout deal performance is
higher (lower) for transactions, in which
there is a larger number of previous
transaction experiences of the buyout
firm with relevant prior buyout deals, as
there is a larger stock of available
applicable knowledge in the firm (due to
the lower level of attention to the
idiosyncratic characteristics of the focal
buyout deal).
There was a positive
standardized Beta
contribution for higher
experience with (i)
number of deals, (ii) same
country deals (non-sign.),
and negative for (iii)
same deal size and (iv)
same industry (non-sign.)
(i) H47a
Acceptance
(ii) H47a
Rejection
(iii) H47b
Acceptance
(iv) H47b
Rejection
0.05
0.281
0.05
0.699
(2-tailed,
coeff.)
H48a
H48b
Novelty of
focal Buyout
compared
with Buyout
Experience
Gross buyout deal performance is lower
(higher) for transactions, in which there
is a greater degree of novelty of the
focal deal compared to previous deal
experience of the buyout firm, as there is
a smaller stock of available relevant
transaction knowledge (a higher level of
attention to the idiosyncratic
characteristics of the focal buyout deal).
There was a positive
Pearson correlation for
higher novelty with (i)
industry, (ii) exit, (iii)
investment and positive
for (iv) country (non-
sign.)
(i) H48b
Rejection
(ii) H48b
Acceptance
(iii) H48b
Acceptance
(iv) H48b Rejection
0.659
0.01
0.05
0.574 (2-tailed)
H49a
H49b
Homogeneity
of focal
Buyout
compared
with Buyout
Experience
Gross buyout deal performance is
higher (lower) for transactions, in which
there is a greater degree of homogeneity
between the focal deal and previous
deal experiences in the buyout firm, as
there is a larger stock of available
applicable knowledge within the firm for
similar buyout deals (lower attention to
the idiosyncratic characteristics of the
focal buyout deal).
There was a positive
standardized Beta
contribution for higher
homogeneity with (i)
industry, (ii) exit (non-
sign.), (iii) investment and
positive Pearson for (iv)
country
(i) H49a
Acceptance
(ii) H49b
Rejection
(iii) H49b
Rejection
(iv) H49a
Acceptance
0.1
0.342
0.975
0.01
(2-tailed)
Table 65: Summary Findings – GP Firm Buyout Experience Profile
The other important finding from the analysis of the buyout firm’s experience profile is that an
investment focus strategy by buyout funds on a narrow range of industries can not be
recommended (H47b, H48b), as this adversely affects the level of returns. As demonstrated in
earlier results in empirical chapter one, buyout funds successfully take advantage of industry
financial entry and exit conditions. As a consequence, by limiting the investment choice to fewer
industries, opportunistic investing is replaced through more gradual investment along the industry
cycles, which necessarily deteriorates the average level of returns. In addition, investment criteria
206 However, there are other factors, such as lower deal flow in the large cap segment as well as more
frequent use of auctions that may inhibit buyout return growth in the future. Also compare with results from empirical chapter one.

Summary and Conclusions 342
may be lowered for acquisition targets in a certain industry as buyout firms may become over-
confident with respect to their value creation strategies. Moreover, based on bivariate correlations,
investment in one geographic region was established to be favorable (H47a, H49a). In summary,
these results further contributed to accepting the second general hypothesis (GH2) of this study that
there is a “GP effect” in leveraged buyouts based on an experience effect in executing buyout deals
on a regular basis, which positively influences buyout returns.
7.1.3. Summary Findings on Buyout Strategy Related Value Creation Drivers
Following the spirit of the second research question, the study’s third and final chapter of empirical
results has extended the analysis of indigenous, non-systematic drivers of value creation through
the buyout strategy dimension, which represents the third major pillar of this study’s research
model. This strategic examination in large part builds on findings from both the first and second
empirical chapters, seeking to clarify and shed additional light on them. Hence, “supplementary”
answers to the second research question and towards the third general hypothesis (GH3) could be
presented. Further evidence points to the fact that the leveraged buyout firm through its active
decision-making and pursued strategic implementations is the key determinant of value creation
processes in leveraged buyouts, formulated as the “GP effect”. In the following, the third chapter’s
key findings are summarized (compare tables 66, 67 and 68).
The analysis of target company characteristics has revealed (i) what some of the sought-after (by
buyout firms in their target selection process) characteristics of buyout targets from a strategic
perspective are, and (ii) to what extent these may influence acquisition performance. A range of
findings were surprising, some counter-intuitive, but most confirmatory: it was established that a
national operating focus was more advantageous than internationally/globally operating businesses
(H50), however that a certain degree of industry cyclicality offered higher upside potential than
very stable industries (H52). Niche player targets with small market shares performed at least as
strong as industry leaders following a premium or cost leadership strategy (H53, H54), while a
lower degree of competitive industry concentration proved to be beneficial (H55). Operating with
fewer products through a limited number of distribution channels and potentially a small, selective
customer base tended to lead to higher returns at buyout targets in the sample (H56, H57, H58).
The pre-buyout organizational and corporate structure was found to have a substantial influence on
value creation potential: target companies, which had been part of a larger entity performed
significantly (p<.05) better, as the value creation potential and introduction of an entrepreneurial
spirit outweighed extra organizational improvement efforts required from a standalone company
(H59). Similarly, target companies, which had a lower degree of monitoring and shareholder
activism prior to the buyout, such as state-owned businesses, performed exceptionally well
(p<.001) post-buyout (H60). With respect to ownership concentration, however, no clear statistical
trend could be observed (H61).

Summary and Conclusions 343
Hypo-
thesis #
Tested
Variable
Variable Hypothesis Description Test Result / Key
Findings
Acceptance
or Rejection
Statistical
Validity
H50 Scope of Buyout
Target
Operations
Gross buyout deal performance is higher for target companies, which are operating on a
global basis due to their ability to penetrate
more markets with their products and services,
thus reducing their dependency on a single
domestic market.
National focused players performed
well, while global,
regional and intl.
did not (non-sign.)
Rejection 0.258 (2-tailed)
(global)
H51 General
Target
Industry of
Target
Gross buyout deal performance is higher for
target companies, which are operating in the
service sector than for companies in the
consumer and industrial product sectors.
Service sector
performed best,
industrial and
consumer not
(non-sign.)
Acceptance
(Statistical
Rejection)
0.463
(2-tailed)
(service)
H52 Buyout
Target
Industry
Cyclicality
Gross buyout deal performance is higher for
target companies, whose business environment
is more cyclical, as – according to efficient
market theory – a higher compensation for risk
is required to compensate investors, and
buyout firms may be able to take better
advantage of cyclical upturns.
Stable was
negatively,
cyclical positively
affecting
performance
Acceptance 0.05
(2-tailed)
H53 Market Share
of Buyout
Targets
Gross buyout deal performance is higher for
target companies, which have gained a higher
market share in their respective
industry/markets.
Although non-
sign., smaller
market positions
performed better
Rejection 0.890
(2-tailed)
H54 Generic
Business
Strategy of
Target
Gross buyout deal performance is not
significantly higher for target companies,
independent of their chosen generic business
strategy.
Niche strategy
performed best,
but no clear
dominance
Acceptance 0.166
(2-tailed)
H55 Concen-
tration of
Target’s
Industry
Gross buyout deal performance is higher for
target companies, whose industry structure is
characterized as non-concentrated, i.e. with a
lower number of active industry players.
Monopoly
performed best,
fragmented worst,
but non-sign.
Acceptance
(Statistical
Rejection)
0.334
(2-tailed)
H56 Product
Diversifica-
tion of Target
Gross buyout deal performance is higher for
target companies, whose product and service
portfolio is limited and focused, as the benefits
of product diversification do not outweigh the
associated diversification costs.
Focusing on fewer
products proved
more beneficial,
but non-sign.
Acceptance
(Statistical
Rejection)
0.339
(2-tailed)
H57 Customer
Base of
Buyout
Target
Gross buyout deal performance is higher for
target companies, whose customer base is
broad, as the bargaining power and
dependency on individual customers is
moderate.
Single customer
relationships
performed clearly
better
Rejection 0.001
(2-tailed)
H58 Distribution
Strategy of
Buyout
Target
Gross buyout deal performance is higher for
target companies, who use multiple
distribution channels in order to reach a
maximum amount of customers.
One channel more
effective than
multiple, but non-
sign.
Rejection 0.871
(2-tailed)
(one)
H59 Prior
Organiza-
tional
Structure of
Buyout
Target
Gross buyout deal performance is higher for
target companies, which had been part of a
larger entity, as the value creation potential
and introduction of an entrepreneurial spirit
should outweigh extra organizational
improvement efforts.
Companies that
were part of a
larger entity
showed higher
returns than
standalone
Acceptance 0.05
(2-tailed)
H60 Prior Corp.
Governance
Structure of
Target
Gross buyout deal performance is higher for
target companies, which had a lower degree of
monitoring and shareholder activism prior to
the buyout.
Prior state-owned
businesses offered
highest return
potential
Acceptance 0.001
(2-tailed)
H61 Prior
Ownership
Structure of
Buyout
Target
Gross buyout deal performance is higher for
target companies, which had a more widely
held ownership structure before acquisition, as
the closer supervision of management may
have instilled more effective shareholder
values.
Fragmented
ownership had a
positive impact,
concentration was
adverse, but non-
sign.
Acceptance
(Statistical
Rejection)
0.810
(2-tailed)
Table 66: Summary Findings – Buyout Target Strategic Characteristics
Following the acquisition process approach outlined by Haspeslagh and Jemison (1991), adapted to
leveraged buyouts (figure 6), the second strategic sub-category under scrutiny in the third empirical
chapter of this study had related to the strategic deal decisions involved in leveraged buyouts.

Summary and Conclusions 344
Among the key findings, proactive proprietary deal sourcing from the buyout firm has been
confirmed to lead to strong returns, while any other form, intermediaries (e.g. Investment Banks),
the GP’s (management) network, etc. were less effective (H65). Acquiring businesses from less
sophisticated, non-financial institutions, such as public authorities, was advantageous for the
sponsor, potentially as a result of a (favorable) imbalance in negotiation skills and/or an uneducated
view on disposable asset values on the side of this seller (H66). Both the seller’s and buyer’s
motivation for the transactions were vague, and did not materially influence buyout returns (H69,
H70). Especially, acquiring the buyout target motivated by an “aggressive cost rationalization plan”
by the sponsor was found to be an ill-fated endeavor from a (negative, p<.05) return perspective
and hence cannot be recommended as a value optimizing acquisition strategy (H70).
Hypo-
thesis #
Tested
Variable
Variable Hypothesis Description Test Result / Key
Findings
Acceptance
or Rejection
Statistical
Validity
H62 Degree of
Management
Incentivation
at Buyout
Target
Gross buyout deal performance is higher for
target companies, at which buyout firms have
implemented significant changes in the
ownership and governance structure,
specifically through a substantial usage of
management co-ownership.
Surprisingly no
statistical
confirmation of
the benefits of
equity
participation
Rejection,
also non-sign.
0.983
(2-tailed)
H63 Percentage of
Equity
granted to
Management
Gross buyout deal performance is higher for
target companies, whose management
receives approximately between 10% and 20%
of initial total equity in the transaction.
Positive effect of
equity until 20%,
thereafter adverse
Acceptance
(Statistical
Rejection)
0.250
(2-tailed)
H64 Role of
Management
in Buyout
(asymmetric
information)
Gross buyout deal performance is not
significantly higher for target companies,
independent of whether the transaction
represents a MBI or MBO, with the latter
case accusingly representing an opportunity to
exploit asymmetric information.
MBO positive,
MBI negative
performance
effect, but non-
sign.
Acceptance
(Statistical
Rejection)
0.783
(2-tailed)
(MBO)
H65 Transaction
Source
Gross buyout deal performance is higher for
target companies, which have been acquired as
a result of a negotiated sales process, i.e.
through proactive approaches or by leveraging
existing relationships maintained by the
General Partner or its management team.
Proactive deal
sourcing by the
GP is most
effective, while
other sources are
adverse
Acceptance
(Statistical
Rejection)
0.193
(2-tailed)
H66 Seller Type
(negotiation
power)
Gross buyout deal performance is higher for
target companies, which have been acquired
from less sophisticated, non-financial
institutions, as these may lack a comparable
level of negotiation skills or educated view on
disposable asset values.
The public
authorities/
government
proves to be the
seller leading to
highest returns
Acceptance 0.001
(2-tailed)
H67 Number of
Co-investors
Gross buyout deal performance is higher for
target companies, which benefit from a single
or limited number of co-investors, due to an
amalgamation of expertise and superior
combined financial power.
Co-investors are
found to add to
performance,
especially more
than two
Acceptance 0.05
(2-tailed)
H68 Involvement
of Prior
Owner
Gross buyout deal performance is higher for
target companies, which do not retain a
significant involvement of prior owners as
managers, as the value creation implement-tation process may be inhibited by resistance
for radical corporate change.
Prior owners
adversely affect
returns, more so if
part of management than
as equity owner
Acceptance
(Statistical
Rejection)
0.271
(2-tailed)
H69 Seller
motivation
Gross buyout deal performance is higher for
target companies, which have been acquired by the buyout firm while the seller was under
divestment pressure.
Pressure to divest
not found to lead to higher returns
Rejection 0.05
(2-tailed) (Privatiz.)
H70 Buyer
motivation
Gross buyout deal performance is higher for
target companies, for which buyout firms have
been able to identify management or operatio-
nal inefficiencies, lucid growth strategies or
benefits from favorable external market
conditions at the time of the acquisition.
Inefficient
management has
pos., cost and
growth strategies
neg. impact
Rejection 0.05
(2-tailed)
(Cost
rationali-
zation)
Table 67: Summary Findings – Buyout Strategic Deal Decisions and Characteristics

Summary and Conclusions 345
The involvement of at least one, but better more than two (p<.05) co-investors, in the transaction
for the purpose of added value through broader expertise and/or financial power was found to be
recommendable to buyout firms from a return point of view (H67). The prior owner should not stay
involved in the business (as indicated by an adverse return profile), whereby equity participation
was found to be a less harmful mean of involvement than a continued managerial role.
Nevertheless, there was directional, yet not statistically significant, evidence that management in
MBO situations is exploiting asymmetric information (H64). With respect to management
incentivation (through co-ownership), only support for agency theoretical assumptions could be
given as buyout targets whose management received equity, did not perform significantly better
across the underlying sample (H62). However, prior agency theoretical research in this area was
confirmed (though statistically non-significant) by the fact that acquisition performance improves
up to a level of management ownership of 20% of, declining thereafter (H63).
Hypo-
thesis #
Tested
Variable
Variable Hypothesis Description Test Result / Key
Findings
Acceptance
or Rejection
Statistical
Validity
H71 Key Strategic
Events
Gross buyout deal performance is higher for
target companies, in which senior management
is exchanged and aggressive strategic change
is implemented.
Mgmt changes
directionally
positive, strategic
change no effect
(both non-sign.),
org. restructuring
negative effect
Rejection 0.143
(2-tailed)
(Org.
restruc-
turing)
H72 Key
Operational
Strategic Implementa-
tions
Gross buyout deal performance is relatively
higher for target companies, in which buyout
firms implement an effective incentive plan through equity participation and co-
ownership.
New incentive
plans found to be
highly effective strategic measure
Acceptance 0.01
(2-tailed)
H73 (Dis-)Invest-
ment Strategy
Gross buyout deal performance is not
significantly higher for target companies, independent of whether the buyout firm’s
pursued value creation strategy is based on a
“add-on/expansionary” or “disposal/cut-
back” strategy and its respective
accompanying measures.
Geographic
expansion and add-ons as well as
layoffs positive
effect, asset
consolidation/
disposals negative
Rejection,
also non-sign.
0.322
(2-tailed) (Layoffs)
Table 68: Summary Findings – Buyout Acquisition Process and Strategic Events
Once the acquisition has been negotiated and agreed, the ensuing post-acquisition phase offers
buyout managers the opportunity to exercise and implement strategic action at the target, in order
to actively generate and extract maximum value. The descriptive and statistical results from the
examination of the acquisition process and strategic events exposed that – as a first measure – the
introduction of a new management team at the buyout target is beneficial from a return perspective.
Hence, it can be inferred that on average a new management team appears to bring new valuable
competences to the target business and is more apt to execute change management. The measure
more positively affects returns (H71) than measures seeking to bring about radical strategic change
(through existing management). Also, far-reaching organizational restructuring plans tended to be
less effective from a performance viewpoint (H71). Among strategic implementations, a focus on
growth strategies for the business, e.g. through an expansion of the target’s product lines, alongside
a complete product portfolio review that especially focuses on the target’s pricing strategy, tended
to positively support the sponsor’s value creation goal (H72). In addition, the implementation of a
new incentive (co-ownership) system (p<.01) for management and/or throughout the business can

Summary and Conclusions 346
be seen as absolutely quintessential with a view on aligning managers’ goals with the investor and
stressing the accomplishment of the business plan’s financial targets (H72). Between the alternative
options to either downsize or expand the target’s business, the latter choice is recommendable to
the buyout firm (H73). Although cost cutting measures, such as layoffs designed to increase
efficiency is indisputably adding value (positively, but non-significantly correlated), the buyout
firm should refrain from major “asset stripping” activities, e.g. divesting major parts of the business
(H73). Either geographic expansion or one smart add-on acquisition, which could both be
horizontal or vertical, will contribute far better to reposition the company favorably and to achieve
an improved exit valuation.
In summary, the unprecedented analysis of “buyout strategy variables” in this study has made a
first exploratory attempt to uncover – on the micro-level of buyout transactions – what the strategic
drivers in buyout value creation are. Each sub-category demonstrated affirmative, controversial and
surprising results that may be further explored through future research. Although a range of
variables did not confirm their descriptive trends outlined throughout the third empirical chapter
through sufficient statistical significance levels, several definite conclusions in each strategy
variable category could be established. As a general caveat, the limited sample size compared to
the large number of degrees of freedom necessary in order to execute this type of complex strategy
analysis highlights the limitations of the dataset. Nevertheless, the multiple regression model on
buyout strategy factors overall posted an adjusted R square of 22.8% and therefore not only
contributed very meaningfully to the analysis of sources of value creation, but supports the chosen
research design and the third general research hypothesis (GH3) of this study.
7.1.4. Interpretation of Results with Research Hypotheses
Based on the above outlined summary of this research study’s findings, the general research
hypotheses of this study can be concluded on in the following way:
GH1. The results from the tests of market and financial value drivers in the first
empirical chapter, i.e. with respect to entry and exit years, entry and exit types and
modes, industry, country/origin, amount of invested capital, percentage of
ownership, holding period, acquiring GP firm, industry and equity market
performance, as well as industry financial development, have demonstrated to be
(statistically) significant value and performance drivers in the leveraged buyout
value creation process. The first general hypothesis of this study can therefore be
accepted.
GH2. The results from the test of investment manager and buyout firm value drivers in
the second empirical chapter, i.e. with respect to investment managers’ education,
professional experience as well as the buyout firm’s hierarchical homogeneity/

Summary and Conclusions 347
diversity and organizational deal-making experience profile, have demonstrated to
be (statistically) significant value and performance drivers in the leveraged buyout
value creation process. The second general hypothesis of this study can therefore
be accepted.
GH3. The results from the test of buyout’s strategic value drivers along the leveraged
buyout acquisition process in the third empirical chapter, i.e. with respect to the
focal buyout target’s strategic and business characteristics, strategic deal
decisions and characteristics taken as well as (post-)acquisition process strategic
events, have demonstrated to be (statistically) significant value and performance
drivers in the leveraged buyout value creation process. The third general
hypothesis of this study can therefore also be accepted.
7.2. Contributions to Research and Applications to Practice
The development of variable hypotheses prior to the various tests and the subsequent discussion of
findings in this study has widely been based on a presentational setting of research results targeted
at both an academic and practitioner audience. As a consequence, the following sections are
intended to briefly summarize contributions to research and possible applications to practice.
7.2.1. Contributions to Agency Theoretical and Finance Research
In the event of a leveraged buyout, several of the determinants of agency cost change considerably
(Jensen 1986). A number of governance mechanisms have been identified to limit the agency
conflict in corporations; these mechanisms include improved monitoring and reduction of the
agent’s discretionary decision space (board of directors), the market for corporate control,
managerial equity ownership and other incentive alignment devices (Fama 1980; Demsetz 1983;
Jensen 1988). This study has contributed with the test of several variables related to this discussion
throughout the three empirical chapters.
The first important change in agency cost caused by the buyout stems from the significant use of
debt financing in a typical LBO deal. Agency cost of free cash flow arises when cash flow exists in
excess of what is required to fund all of a firm’s projects that have positive net present values when
discounted at the relevant cost of capital. Such free cash flows must be paid out to shareholders if
the firm is to be efficient and to maximize shareholder value, but managers have few incentives to
do so and prefer to retain control (Jensen 1986; Jensen 1989b). The much higher leverage after a
buyout increases the requirements of debt and interest service payments, thereby significantly
reducing the amount of free cash flow that is at the buyout company managers’ discretion (Kaplan

Summary and Conclusions 348
1989b; Smith 1990b). Thus, high leverage means less managerial discretion and therefore reduces
the “agency cost of free cash flow” (Jensen 1986). Consequently, increased financial leverage in
buyouts is assumed to lead to value creation. The analysis in section 4.5 on value attribution
confirms some of these assumptions. The cash flow generation at buyout targets was found to be
significantly higher than at comparable companies in their respective industries. At the same time,
buyout targets carried substantially higher leverage at point of entry and exit of the investment. In
addition, the amount of equity growth suggested that the buyout target has distributed excess cash
through extraordinary dividends to the General Partner. This is the result of the fact that the
sponsor has an interest in extracting cash as soon as possible from the target, since this positively
affects a cash flow based-IRR calculation. Agency costs of free cash flow are therefore consistently
evaluated and held at a minimum for managerial discretion. However, the potential risk of financial
distress associated with the LBO debt burden, which may even call into question the ability of the
buyout target to survive (Smith 1990b), has also been exhibited among the tested sample – six out
of the 272 buyout targets (2.2%) have gone bankrupt and/or have been fully written off. The
average return of 84.0% of the realized buyout sample – including the write-offs – compared to
16.5% IRR for the publicly traded peer group suggests that the excessive return expectations for
buyout firms following the free cash flow minimization strategy may let them accept infrequent
events of “financial distress”.
The second important determinant of agency cost which is affected by an LBO is the oversight and
control that the owners have over the management of the company. Professionals from the
investing LBO firm are in the position to closely monitor the portfolio company management and
to exert direct control over them (Smith 1990b). As representatives of the majority shareholders,
they have the legal power to influence managerial decisions both directly and through their right to
determine the composition of the top management team. This monitoring and control function of
the LBO firm has been seen as one of the principal capabilities of the LBO organization (Baker and
Montgomery 1994). One aspect of control over the portfolio company which is of particular
interest is the owner’s right to determine the composition of the top management team. The
question of the performance impact of replacements of the top management team has received
much attention both in the theoretical and the empirical literature. One side of this literature
supports the hypothesis of the “market for corporate control” (Manne 1965; Jensen and Ruback
1983), according to which different management teams compete for the control over companies.
The examination of the strategic aspects of buyouts in the third empirical chapter has produced
several findings contributing to this discussion. First, among the post-acquisition strategies, later
replacements in the management (although statistically non-significant) have only led to minor
improvements in buyout performance. However, one potential explanation for the relatively low
significance found may relate to the fact that the impact magnitude by the notion of “market for
corporate control” is less effective in buyouts: since buyout investment managers can exercise large
control over any target management, the potential for shirking post-buyout may already be lower
from the outset than in publicly traded, widely held companies. Another key finding from this
study in this respect is that continued involvement of the prior owner or owner-manager adversely

Summary and Conclusions 349
affects returns, independent of whether in the form of managerial or equity participation. In these
cases, the monitoring and control function of the LBO firm as categorized by Baker and
Montgomery (1994) may be materially inhibited, if not rendered ineffective. This is further
substantiated through the fact that the average IRR in case of managerial (rather than board room)
involvement is most severely affected.
As a third and most important factor to reduce agency costs and to generate value, buyout
transactions are characterized by their considerable use of top management incentives and
management co-ownership in order to align interest between LBO firms (and their investors) and
management. Equity holdings of top managers increase the cost of shirking and consuming
perquisites (Smith 1990a) to them and increase the degree of common interests between owners
and managers. In general, the target company’s top management team had no or only a suboptimal
incentive system prior to the LBO with the incentives either not being very effective (suboptimal
level of co-ownership or stock options etc.), or they were based on performance measures that do
not perfectly reflect the owner’s interest (e.g. rewards based on short-term earnings/stock
performance rather than long-term cash flow or earnings potential and value creation). Leveraged
buyouts specifically, with their limited life and foreseeable liquidation of the investment, create a
situation in which equity holdings of top managers are better suited to aligning interests between
managers and shareholders and thus to enforcing shareholder-wealth-maximizing behavior than
otherwise possible (Baker and Montgomery 1994). This study offers several insights into
ownership dynamics. First, in the first empirical chapter, the percentage of ownership acquired has
been analyzed and a convex relationship between ownership level and returns could be observed,
i.e. control investments perform best as expected; however, minority investments of up to 25% also
perform significantly better than the 2nd and 3rd ownership quartiles. La Porta, Lopez de Silanes et
al. (1999) in their analysis of corporate ownership around the world had previously found that
minority shareholders are systematically expropriated. The dynamics in the private market for
buyouts appear to contradict this overall trend. The positive results for minority investments of
buyout firms are further substantiated in the third empirical chapter, which recommends the
involvement of co-investors in transactions through higher expected returns. The added expertise,
financial power, and layer of “buyout decision control mechanism” instilled through co-investors
(often minority shareholders of up to 25%) demonstrate that ownership dynamics are unique in
buyouts. Moreover, the highly significant (p<.01) results on acquisition performance in the third
empirical chapter regarding implementation of a new incentive system underline the agency
theoretical assumption of reductions in agency cost through co-ownership in the buyout context.
Finally, the highly significant performance results for buyout companies that have been owned and
governed by public sector prior to acquisition could be interpreted in such regard that the use of top
management incentives and management co-ownership in order to align interest between the LBO
firm and previously public authority managers and/or employees is likely to be greatest.
In terms of advancement of theory, the study has further contributed through the development and
application of a value attribution formula (see section 3.5.4.) based on the Dupont equivalence.

Summary and Conclusions 350
Through mathematical deduction, it allows the time-dynamic attribution of acquisition performance
(IRR) generated over the time of the investment into its four main constituents – revenue growth,
margin enhancement, multiple expansion and deleverage/cash flow generation at the target
business. Applied to larger samples of buyouts across time, the formula introduces the opportunity
to assess varying buyout value generation strategies according to industry, time and buyout firm
under examination. It thereby serves as an ex-post benchmark tool, making explicit value creation
drivers that can directly be juxtaposed against comparable companies in the buyout target’s
respective industry, hence highlighting the sponsor’s acquisition-making capabilities.
In summary, the examination of leveraged buyouts in this study revealed arguments in support of
the school of agency theoretical thinking, whether with respect to agency costs of free cash flow,
monitoring and control or use of management incentives. The study has further contributed
meaningfully to other topics in finance, such as acquisition performance and value attribution
research: to the best of the author’s knowledge, no prior study on the performance of buyout
transactions has been published with a comparable sample size or breadth of performance driving
(control) variables.
7.2.2. Contributions to Strategic Management Research
Strategic Management researchers have focused their attention in the acquisition literature on the
way resources and knowledge are transferred between acquirer and target. The resource-based view
of the firm (Penrose 1959; Rumelt 1984; Wernerfelt 1984; Barney 1986; Dierickx and Cool 1989)
sees the ability to share and redeploy resources within and across organizations as the dominant
source of sustainable competitive advantage. The present study has introduced the LBO
organization and its team of investment managers as important resources in the value creation
process. As a result of their unique organizational configuration, LBO firms, when compared to
strategic buyers, are purely financially motivated, non-strategic acquirers, which make no attempt
to foster synergies among their portfolio companies (Baker and Montgomery 1994). The second
empirical chapter has outlined characteristics, skills and capabilities of investment managers, and
related these to performance. Within the team context, the influence of certain attributes and team
configurations was subsequently measured against acquisition performance. One interesting finding
relates to the fact that among prior relevant professional experiences, investment managers with
corporate and/or managerial backgrounds had a highly significant, positive impact on buyout
performance. According to Barney (1986), the expertise and social capital of the members of the
top management team constitute the most valuable resource to the company. The potentially higher
“relatedness” between LBO firm resources with corporate experience/capabilities and target
company management resources may lead to higher “synergistic values” between them and entails
superior performance.
Summary and Conclusions 351
The buyout event gives the LBO firm direct access to the resources of its portfolio company. As
most acquisitions are standalone rather than based on build-up strategies, the LBO firm effectively
chooses not to share any of these resources with other portfolio companies. Consequently, a large
portion of the value creation of the LBO has to come from an increase in the profitability of the
portfolio company’s resource bundle as a standalone business. Therefore, it is crucial to the success
of the LBO to enhance the utilization of these resources. The LBO firm has a range of options for
increasing the resource efficiency of its portfolio company (e.g. cost cutting, capacity optimization,
introduction of new incentive systems, stretched budgets, pressure from financial leverage, etc.).
Motivated by these strategic options, this study, in its third empirical chapter, reviews these options
with a view on buyout performance. Among the strategic events, there is support for the fact that
expansionary activity, either through geographical expansion and/or add-on acquisitions, has a
higher, positive impact on acquisition performance than a reduction in the business’ asset and
resource configuration – radical organizational change, consolidation and relocation of assets did
adversely affect performance. This finding authenticates the potentially detrimental factor to
resource efficiency under the resource-based view of the firm, which is caused by the disruptive
effect of changes in the resource base of the portfolio company. This view had received earlier
support from studies relating, in particular, managerial turnover to performance in a general
acquisition context, which found that managerial turnover reduces acquisition performance
(Cannella and Hambrick 1993; Krishnan, Miller et al. 1997; Zollo and Singh 2000). In conjunction
with the weak findings of the agency theoretical reasoning for a “market for corporate control”
hypothesis in buyouts (Manne 1965; Jensen and Ruback 1983), the resource-based view may
therefore bear higher than anticipated relevance in the leveraged buyout context.
Finally, this study has also endeavored to make a contribution to the literature field of competitive
advantage, business strategy and acquisition performance. The analysis of business strategy
characteristics in the third empirical chapter has sketched a typology of suited target companies.
Among the key findings, no generic business strategy was clearly superior; however, niche
businesses with smaller market shares performed very well from a return perspective. This could be
the result of an often followed (mid-cap market) buyout firm acquisition rationale to acquire and
grow an attractive niche business with the prospect of selling it at a premium to a strategic investor.
The buyout firm thereby almost acts as an “entrepreneurial business broker” by pre-assessing and
matching strategic buyers’ resource portfolio configuration weaknesses. Further findings, for
instance that buyout targets with more simplistic product diversification, distribution channels
and/or customer base outperform, give further evidence that the buyout firm’s strategic pre-
assessment of target businesses may be considerably driven by the notion of an easy integration
capability of the standalone business into a (larger) strategic player’s business model.

Summary and Conclusions 352
7.2.3. Applications of Findings to Private Equity Practitioners
The present study was fundamentally enhanced through the qualitative input from a range of
Private Equity industry practitioners, including General Partners, Limited Partners (especially
Private Equity fund of funds), gatekeepers, industry associations and Private Equity information
providers. The research model of this study had been designed in accordance with the three major
and most frequently quoted areas of due diligence focus when assessing buyout returns: (i) the
equity market and target industry financial environment in order to evaluate the BLO firm’s
acquisition performance track record, (ii) buyout firm investment manager profiles and experience
in order to assess track records of individual managers across time and the buyout firm’s potential
to generate (top quartile) performance in the future, and (iii) buyout strategies in order to establish
the link between observed performance and strategic action for a judgment on the appropriate level
of attention, execution capability and integrity in executing buyout transactions. In all three
dimensions, meaningful contributions were presented for (i) Private Equity fund (of fund) asset
manager and due diligence professionals seeking to improve their evaluation tools/metrics, as well
as (ii) investment managers seeking to improve their investment decisions based on historical
trends and statistical probability.
In the first empirical chapter, the unprecedented sample size that builds the basis of this study
offered insight into the relative attractiveness for buyout investment according to industry sectors.
Through a comparison with public markets, the amount of excess value creation potential in several
industries was exposed. The accompanying analysis of the impact of financial developments in
buyout target industries led to important findings – in specific, it was established that buyout firms
demonstrate a superior investment timing capability: the financial prospects at the time of entry in
an industry on average were very positive regarding top line and profitability growth; when
industry conditions weakened, sponsors exited the business. The value attribution and financial
comparison between target companies and industry peers demonstrated that buyout targets’
financial performance was significantly better in all metrics. Buyout firms were also found to have
benefited from valuation multiple arbitrage. The value attribution according to various industry
sectors demonstrated that the set of value creating strategies across sectors differs. Furthermore,
investment decisions with respect to entry and exit of the focal investments were presented and
differences between U.S. and European buyout activity highlighted.
The second empirical chapter offered insights into the typology of investment managers and buyout
firms. Traditionally an area of severe opaqueness due to lack of public information, this study
collected and examined data on the characteristic profile of buyout investment managers, which
was made explicit with respect to education, professional experience and buyout deal experience
within the team context. Furthermore, buyout firms were assessed with regard to hierarchy and
diversity and subsequently tested for impact on performance. From a Private Equity practitioner
point of view, the results could support the assessment of investment manager teams, which so far
has concentrated almost exclusively on the acquisition track record of individual buyout managers.

Summary and Conclusions 353
Although a viable initial approach, the proposed assessment methodology in this study goes further
by taking into account the organizational configuration of buyout firms, i.e. their knowledge pools
concerning acquisition experience across industries, countries, transaction types, as well as team
diversity and structure/hierarchy and relates these factors to performance. The linkage of observed
buyout performances to a broader picture of the General Partner firm will indubitably lead to an
enhanced understanding of the “GP effect” in the value creation process.
Following the notion of the GP effect further, the last empirical chapter of results provides insights
into the effectiveness of certain strategic decisions taken by buyout firms. The data, which has
mainly been sourced from LBO firm’s self-reported deal strategy information in PPMs, but also
from the Limited Partners’ due diligence, demonstrates that several dynamics differentiate
leveraged buyouts from corporate acquisitions. The lower dependency on, or availability of,
synergistic strategies generally leads either to an expansionary or downsizing strategy. This study’s
first attempt of an evaluation of several integral measures implemented by the LBO firm had
suggested that expansionary activity is more beneficial; in fact, acquiring a target business purely
based on an objective to cut costs has demonstrated to have an adverse effect on performance.
Although still in its infancy, future research in the field of analyzing value drivers in leverage
buyouts is likely to continue concentrating on the links between buyout strategies and performance.
7.3. Limitations of Study and Areas of Future Research
The presented study’s research approach has been of an exploratory nature. In the highly un-
researched field of leveraged buyout performance, it has attempted to offer a broad overview of
potential sources and drivers of value creation. The breadth of the presented results and statistics
leads to the conclusion that similar to the field of M&A research, the research topic in the future
will have to be further sub-divided. Each of the three chapters of empirical results is thereby seen
as one major area to deepen the understanding of academia and practitioners. First of all, the first
empirical chapter offers scope to deepen the analysis of industry trends, especially with a greater
emphasis on the risk-return relationship of investment in different sectors. From a finance research
point of view, this study has neglected the fact that a different level of systematic and non-
systematic risk is involved in various industry sectors and geographic regions. However, on this
point it should be noted that this study has not intended to assess market- and risk-adjusted gross
returns (to investors), but solely focused on the drivers that explain a certain level of buyout
performance. In addition, finance research may refine the application of the herein developed value
attribution formula, e.g. for intermediate cash flow (distribution or injection) events. The
application to a larger set of buyouts will allow drawing more conclusions regarding industry
dynamics.
Secondly, the second empirical chapter offers the opportunity to further deepen the understanding
of the performance of investment manager teams in the buyout context. Reference should be given

Summary and Conclusions 354
to existing research on the performance of corporate management teams and the broad field of
literature on corporate governance, performance of boards of directors and agency theory. The
buyout firm could also be evaluated further trough the field of organizational research, following
the initial classification of Baker and Montgomery (1994), network theory, and learning curve
theory. Finally, the broad scope for future research through the strategic management field has been
touched upon above (see section 7.2.2.): research on the sources of a competitive advantage of
buyout targets and the application of the resource-based view are evident research topics. Buyouts
represent a unique test ground to evaluate how resource efficiency can be increased without the
existence of synergistic factors. In this regard, the analysis of top management teams at buyout
targets, whose expertise and social capital constitutes the most valuable resource to the company
(Barney 1986), may be of particular weight.
With respect to the latter point, this study has also intentionally omitted one area of potential future
research: the acquisition-related dynamics initialized through the buyout firm on the portfolio
company management level. The third empirical chapter focusing on buyout strategies has touched
upon some of these topics, which relate to operational changes, organizational changes, cultural
changes, incentive system changes, etc. From a research perspective, the interaction between
portfolio company managers and GP firm managers should represent an interesting, yet challenging
research topic; especially in light of the fact that a large part of the M&A literature nowadays
emphasizes post-acquisition integration capabilities as prominent acquisition success factor (Zollo
and Singh 2000; Welpe 2004). Likewise, buyout returns may to a greater extent than so far
anticipated be driven by an effective “GP vs. Corporate Management” relationship. The
experiences and perspectives on this relationship gathered from buyout target management teams in
this regard should be of particular interest to future research.
The author would be delighted to be challenged on the results of the study presented above and/or
involved in any new or extended streams of future research based on these findings.
Nicolaus Loos
--- END ---

8. Appendices
List of Appendices
Appendix 1: Combined Entry and Exit Control Variables
Appendix 2: Industry financial and public market variable effect
– Descriptive and Correlation Statistics on Industry Financial Performance Driver (Level
3/4/6)
– Coefficients and Collinearity Statistics on Industry Financial Performance Driver (Level
3/4/6)
Appendix 3: Correlation Matrices
– Correlation Matrix on Deal Entry Condition Variables
– Correlation Matrix on Deal Exit Condition Variables
Appendix 4: Strategy Coding Database
– PC Characteristics and Pre-deal Strategy as well as Financials Input
– Deal Characteristics, Management Team and Exit Input – Strategy and Key Events Input
Appendix 5: GP Investment Manager Coding Database
– Manager’s Education and Private Equity Exposure, Professional Career History and
Titles
Appendix 6: GP Investment Manager and Transaction Matching Tool

Appendices 356
Appendix 1: Combined Entry and Exit Control Variables
Coefficients(a)
Model Unstandardized Coefficients
Standardized Coefficients
t Sig. Collinearity Statistics
B Std. Error Beta Tolerance VIF
1 Entry Type
1980 -2,171 1,104 -,048 -1,967 ,049 ,852 1,174
1981 -1,674 ,666 -,074 -2,514 ,012 ,588 1,700
1982 -,423 ,650 -,019 -,651 ,515 ,618 1,619
1983 -,611 ,575 -,034 -1,062 ,288 ,500 1,999
1984 ,468 ,537 ,031 ,872 ,384 ,405 2,470
1985 -,713 ,518 -,052 -1,377 ,169 ,358 2,792
1986 -,540 ,474 -,054 -1,140 ,255 ,225 4,452
1987 -,984 ,478 -,095 -2,058 ,040 ,243 4,122
1988 -,522 ,455 -,060 -1,145 ,252 ,190 5,274
1989 -,699 ,470 -,068 -1,487 ,137 ,247 4,053
1990 -,600 ,452 -,072 -1,327 ,185 ,175 5,729
1991 -,586 ,448 -,075 -1,307 ,191 ,157 6,382
1992 -,545 ,445 -,069 -1,223 ,221 ,162 6,188
1993 -,516 ,436 -,076 -1,184 ,237 ,123 8,141
1994 -,283 ,432 -,043 -,656 ,512 ,121 8,274
1995 -,047 ,427 -,008 -,110 ,913 ,108 9,275
1996 ,189 ,428 ,029 ,442 ,658 ,117 8,512
1997 ,428 ,430 ,067 ,996 ,319 ,112 8,930
1998 ,814 ,439 ,109 1,856 ,064 ,148 6,757
1999 1,360 ,451 ,161 3,017 ,003 ,181 5,524
2000 1,192 ,492 ,100 2,424 ,015 ,299 3,340
2001 2,253 ,796 ,076 2,831 ,005 ,704 1,421
ACQUISITION ,661 ,150 ,135 4,407 ,000 ,547 1,829
ACQUISITION FINANCING
,748 ,405 ,049 1,844 ,065 ,738 1,355
GROWTH CAPITAL ,278 ,230 ,028 1,205 ,228 ,936 1,068
RECAPITALISATION ,662 ,628 ,025 1,055 ,292 ,880 1,137
AUCTION ,463 ,464 ,024 ,997 ,319 ,911 1,098
BUY-SIDE-INTERMEDIARY
-,606 ,307 -,055 -1,974 ,049 ,654 1,528
NEGOTIATED SALE -,555 ,228 -,074 -2,434 ,015 ,548 1,826
Exit Type
X1985 1,855 ,760 ,063 2,442 ,015 ,773 1,294
X1986 1,542 ,460 ,098 3,354 ,001 ,596 1,677
X1987 2,515 ,469 ,154 5,358 ,000 ,621 1,609
X1988 2,972 ,396 ,230 7,500 ,000 ,546 1,830
X1989 2,861 ,418 ,196 6,840 ,000 ,623 1,605
X1990 1,964 ,442 ,120 4,439 ,000 ,699 1,430
X1991 1,729 ,361 ,144 4,787 ,000 ,568 1,760
X1992 1,528 ,356 ,130 4,289 ,000 ,558 1,791
X1993 1,464 ,299 ,172 4,891 ,000 ,415 2,409
X1994 1,551 ,301 ,177 5,147 ,000 ,433 2,309
X1995 1,355 ,287 ,175 4,714 ,000 ,371 2,693
X1996 1,265 ,277 ,176 4,563 ,000 ,344 2,910
X1997 1,182 ,265 ,182 4,466 ,000 ,307 3,257
X1998 ,950 ,257 ,159 3,694 ,000 ,278 3,601
X1999 ,905 ,261 ,144 3,473 ,001 ,300 3,337
X2000 ,631 ,245 ,131 2,576 ,010 ,198 5,050
X2001 -,001 ,275 ,000 -,005 ,996 ,350 2,857
X2002 ,056 ,332 ,005 ,169 ,866 ,494 2,023
X2003 ,625 ,568 ,028 1,100 ,272 ,808 1,238
BANKRUPTCY (mode) -2,119 ,894 -,072 -2,369 ,018 ,557 1,794
PRIVATE EXIT ,071 ,205 ,012 ,347 ,729 ,455 2,200
PUBLIC EXIT ,571 ,180 ,076 3,173 ,002 ,887 1,128
AUCTION ,201 ,612 ,008 ,328 ,743 ,926 1,079
BANKRUPTCY (type) ,115 1,371 ,003 ,084 ,933 ,552 1,812
SELL-SIDE-INTERMEDIARY
,397 ,917 ,010 ,433 ,665 ,927 1,079
NEGOTIATED SALE -,088 ,187 -,016 -,471 ,637 ,439 2,277
(a) Dependent Variable: Gross IRR Performance
Table 69: Coefficients and Collinearity Statistics on Combined Entry and Exit Dummy Variables

Appendices 357
Appendix 2: Industry financial and public market variable effect
Descriptive StatisticsVariable (Dummy) Tested N(1) Minimum Maximum Mean Std.
Deviation Pearson
Correlation Sig. (2-tailed)
Level 3
Industry Performance 637 -0,565 1,171 0,172 0,165 ,180(**) 0
Excess Return over Index 637 -1,649 10,272 0,560 1,282 ,992(**) 0
Market Performance 1127 -0,490 1,086 0,137 0,117 ,120(**) 0
Excess Return over Market 1127 -1,522 10,142 0,476 1,352 ,996(**) 0
EBITDA Industry Exit 844 80.718 53.658.864 5.780.442 6.771.081 -,070(*) 0,041
EBITDA Margin Entry Date_Ind 807 0,060 0,364 0,158 0,040 ,110(**) 0,002
EV/EBITDA at Entry Date_Ind 846 2,302 67,951 9,228 5,299 ,074(*) 0,031
Multiple Expansion CAGR Industry
827 -0,774 0,926 0,062 0,141 ,073(*) 0,037
Deleverage_Ind 846 -10,423 0,717 -0,220 0,717 ,079(*) 0,022
Sales CAGR x+2 766 -0,627 1,309 0,091 0,129 -,084(*) 0,021
Margin CAGR n-2 798 -0,478 0,808 0,021 0,112 ,099(**) 0,005
Margin CAGR n-1 798 -0,670 1,267 0,024 0,167 ,100(**) 0,005
Margin CAGR n+1 798 -0,670 1,275 0,022 0,175 -,070(*) 0,049
Margin CAGR x-1 757 -0,670 1,267 0,037 0,201 ,072(*) 0,048
Sales CAGR n-2 798 -,269 1,996 ,087 ,233 ,063 ,075
Level 4
Industry performance 572 -,587 1,213 ,153 ,185 ,157(**) 0
Excess Return over Index 572 -1,432 10,312 ,627 1,303 ,990(**) 0
Market Performance 1127 -,490 1,086 ,137 ,117 ,120(**) 0
Excess Return over Market 1127 -1,521 10,141 ,475 1,352 ,996(**) 0
Sales Industry Exit 696 0 155.640.458 15.672.491 17.956.521 -,075(*) 0,049
Sales CAGR Industry 679 -,713 5,118 ,128 ,275 ,091(*) 0,018
EBITDA CAGR Industry 704 -,777 5,091 ,171 ,369 ,127(**) 0,001
EBITDA Margin CAGR Industry 674 -,769 3,142 ,033 ,184 ,090(*) 0,019
Multiple Expansion CAGR Industry
704 -,779 1,556 ,057 ,188 ,095(*) 0,012
EBITDA Margin Entry Date_Ind 694 -,024 697,313 1,984 34,135 ,003 ,944
EV/EBITDA at Entry Date_Ind 725 -7,613 154,970 10,501 10,734 ,055 ,137
EV/EBITDA at Exit Date_Ind 726 ,705 71,296 12,297 10,283 ,055 ,139
Sales CAGR n+1 667 -,588 5,118 ,135 ,396 ,125(**) 0,001
Sales CAGR n+2 667 -,713 3,779 ,124 ,260 ,101(**) 0,009
Sales CAGR x-2 653 -,713 1,994 ,135 ,209 ,114(**) 0,004
Margin CAGR n+2 666 -,534 3,377 ,025 ,204 ,104(**) 0,007
Margin CAGR x-2 629 -,477 ,990 ,041 ,176 ,122(**) 0,002
Margin CAGR x-1 629 -,769 3,142 ,101 ,521 ,116(**) 0,004
Deleverage_Ind 728 -20,874 ,779 -,376 1,804 ,058 ,115
Level 6
Industry Performance 523 -0,661 2,049 0,178 0,251 ,125(**) 0,004
Excess Return over Index 523 -1,564 10,303 0,636 1,349 ,983(**) 0
Market Performance 1127 -0,490 1,086 0,137 0,117 ,120(**) 0
Excess Return over Market 1127 -1,522 10,142 0,476 1,352 ,996(**) 0
Sales CAGR Industry 609 -1,000 12,909 0,191 0,725 0,06 0,141
EBITDA Margin Exit Date_Ind 619 -1,544 3,566 0,163 0,181 0,077 0,057
EBITDA Margin CAGR Industry 598 -25,504 1,076 -0,037 1,055 0,005 0,903
EV/EBITDA at Exit Date_Ind 648 -73,205 1.245,336 16,643 52,273 0,004 0,913
Multiple Expansion CAGR Industry
624 -1,027 13,160 0,107 0,625 ,101(*) 0,011
Deleverage_Ind 659 -189,551 8,764 -0,480 7,456 0,026 0,509
Sales CAGR x-1 580 -0,800 12,909 0,234 0,959 ,085(*) 0,041
(1) Total sample size of tested cases (all realized transactions). (2) Number of cases where dummy variable = 1, i.e. number of transactions per year. ** Correlation is significant at the 0.01 level (2-tailed). * Correlation is significant at the 0.05 level (2-tailed).
Table 70: Descriptive and Correlation Statistics on Industry Financial Performance Driver (Level 3/4/6)

Appendices 358
Appendix 2: Industry financial and public market variable effect (continued)
Coefficients(a)
Model Unstandardized Coefficients
Standardized Coefficients
t Sig. Collinearity Statistics
B Std. Error Beta Tolerance VIF
Level 3 Industry Financials
1 (Constant) ,545 ,075 7,234 ,000
Industry Performance 1,020 ,313 ,137 3,261 ,001 1,000 1,000
2 (Constant) -,048 ,213 -,228 ,820
Industry Performance ,964 ,311 ,129 3,098 ,002 ,996 1,004
EBITDA Margin Entry Date_Ind 3,841 1,289 ,125 2,979 ,003 ,996 1,004
3 (Constant) -,297 ,228 -1,303 ,193
Industry Performance ,746 ,318 ,100 2,344 ,019 ,941 1,063
EBITDA Margin Entry Date_Ind 3,313 1,293 ,107 2,561 ,011 ,977 1,024
EV/EBITDA at Entry Date_Ind ,045 ,015 ,125 2,902 ,004 ,923 1,084
4 (Constant) -,134 ,244 -,549 ,584
Industry Performance ,535 ,355 ,072 1,507 ,133 ,745 1,343
EBITDA Margin Entry Date_Ind 2,436 1,409 ,079 1,729 ,084 ,811 1,233
EV/EBITDA at Entry Date_Ind ,047 ,016 ,132 2,977 ,003 ,859 1,164
Sales CAGR x+2 -,663 ,395 -,071 -1,680 ,094 ,943 1,060
Sales CAGR n-2 ,353 ,208 ,074 1,699 ,090 ,894 1,118
Margin CAGR x-1 ,119 ,266 ,021 ,446 ,656 ,729 1,372
Margin CAGR n-1 ,706 ,299 ,105 2,359 ,019 ,863 1,159
5 (Constant) -,065 ,257 -,253 ,801
Industry Performance ,292 ,380 ,039 ,767 ,443 ,648 1,543
EBITDA Margin Entry Date_Ind 1,833 1,446 ,059 1,268 ,205 ,769 1,301
EV/EBITDA at Entry Date_Ind ,052 ,017 ,146 3,112 ,002 ,767 1,304
Sales CAGR x+2 -,854 ,407 -,092 -2,097 ,036 ,883 1,132
Sales CAGR n-2 ,249 ,215 ,052 1,159 ,247 ,831 1,203
Margin CAGR x-1 ,225 ,273 ,041 ,826 ,409 ,693 1,443
Margin CAGR n-1 ,620 ,302 ,092 2,052 ,041 ,842 1,188
Multiple Expansion CAGR Ind ,850 ,486 ,088 1,750 ,081 ,663 1,508
Deleverage_Ind ,059 ,082 ,031 ,724 ,469 ,901 1,110
(a) Dependent Variable: Gross IRR Performance
Table 71: Coefficients and Collinearity Statistics on Industry Financial Performance Driver (Level 3)

Appendices 359
Appendix 2: Industry financial and public market variable effect (continued)
Coefficients(a)
Model Unstandardized Coefficients
Standardized Coefficients
t Sig. Collinearity Statistics
B Std. Error Beta Tolerance VIF
Level 4 Industry Financials
1 (Constant) ,657 ,074 8,912 ,000
Industry Performance ,746 ,309 ,110 2,415 ,016 1,000 1,000
2 (Constant) ,376 ,137 2,738 ,006
Industry Performance ,615 ,312 ,090 1,970 ,049 ,970 1,031
EBITDA Margin Entry Date_Ind 1,867 ,769 ,111 2,429 ,016 ,970 1,031
3 (Constant) ,228 ,154 1,483 ,139
Industry Performance ,490 ,328 ,072 1,491 ,137 ,872 1,147
EBITDA Margin Entry Date_Ind 1,773 ,784 ,106 2,261 ,024 ,927 1,079
EV/EBITDA at Entry Date_Ind ,009 ,005 ,077 1,665 ,097 ,938 1,066
EV/EBITDA at Exit Date_Ind ,009 ,009 ,049 ,965 ,335 ,800 1,250
4 (Constant) ,220 ,155 1,415 ,158
Industry Performance ,193 ,349 ,028 ,553 ,580 ,764 1,310
EBITDA Margin Entry Date_Ind 1,759 ,801 ,105 2,196 ,029 ,878 1,139
EV/EBITDA at Entry Date_Ind ,000 ,007 ,002 ,035 ,972 ,534 1,871
EV/EBITDA at Exit Date_Ind ,013 ,010 ,071 1,279 ,202 ,648 1,544
EBITDA Margin CAGR Industry -,214 ,537 -,035 -,398 ,691 ,266 3,759
Sales CAGR n+2 ,083 ,270 ,020 ,309 ,757 ,481 2,078
Sales CAGR x-2 ,333 ,355 ,057 ,938 ,349 ,549 1,823
Margin CAGR n+2 ,838 ,545 ,111 1,539 ,125 ,383 2,614
Margin CAGR x-2 ,532 ,407 ,085 1,308 ,192 ,480 2,082
5 (Constant) ,343 ,159 2,157 ,032
Industry Performance ,060 ,350 ,009 ,170 ,865 ,746 1,340
EBITDA Margin Entry Date_Ind 1,588 ,800 ,095 1,985 ,048 ,866 1,154
EV/EBITDA at Entry Date_Ind ,014 ,008 ,120 1,683 ,093 ,388 2,576
EV/EBITDA at Exit Date_Ind -,006 ,012 -,035 -,537 ,592 ,473 2,115
EBITDA Margin CAGR Industry ,103 ,544 ,017 ,190 ,849 ,255 3,923
Sales CAGR n+2 -,192 ,282 -,046 -,679 ,497 ,433 2,312
Sales CAGR x-2 ,460 ,355 ,078 1,295 ,196 ,539 1,857
Margin CAGR n+2 ,747 ,541 ,099 1,382 ,168 ,381 2,623
Margin CAGR x-2 ,478 ,419 ,076 1,143 ,254 ,447 2,237
Deleverage_Ind ,279 ,137 ,100 2,038 ,042 ,825 1,212
Multiple Expansion CAGR Ind 1,121 ,416 ,182 2,697 ,007 ,432 2,317
(a) Dependent Variable: Gross IRR Performance
Table 72: Coefficients and Collinearity Statistics on Industry Financial Performance Driver (Level 4)

Appendices 360
Appendix 2: Industry financial and public market variable effect (continued)
Coefficients(a)
Model Unstandardized Coefficients
Standardized Coefficients
t Sig. Collinearity Statistics
B Std. Error Beta Tolerance VIF
Level 6 Industry Financials
1 (Constant) ,619 ,067 9,271 ,000
Industry Performance ,824 ,221 ,170 3,724 ,000 1,000 1,000
2 (Constant) ,569 ,078 7,333 ,000
Industry Performance ,791 ,223 ,163 3,546 ,000 ,985 1,015
EBITDA Margin Exit Date_Ind ,331 ,265 ,057 1,250 ,212 ,985 1,015
3 (Constant) ,550 ,088 6,248 ,000
Industry Performance ,774 ,226 ,160 3,426 ,001 ,960 1,041
EBITDA Margin Exit Date_Ind ,315 ,267 ,055 1,178 ,239 ,968 1,033
EV/EBITDA at Exit Date_Ind ,002 ,004 ,021 ,455 ,650 ,953 1,050
4 (Constant) ,525 ,090 5,816 ,000
Industry Performance ,788 ,230 ,162 3,428 ,001 ,928 1,077
EBITDA Margin Exit Date_Ind ,277 ,282 ,048 ,985 ,325 ,872 1,147
EV/EBITDA at Exit Date_Ind ,001 ,004 ,014 ,287 ,774 ,935 1,069
EBITDA Margin CAGR Industry -,036 ,047 -,036 -,756 ,450 ,923 1,084
Sales CAGR Industry ,233 ,202 ,056 1,154 ,249 ,900 1,112
5 (Constant) ,554 ,091 6,111 ,000
Industry Performance ,682 ,230 ,141 2,961 ,003 ,906 1,103
EBITDA Margin Exit Date_Ind ,238 ,281 ,041 ,847 ,397 ,858 1,166
EV/EBITDA at Exit Date_Ind -,001 ,004 -,011 -,237 ,813 ,908 1,102
EBITDA Margin CAGR Industry -,031 ,047 -,031 -,661 ,509 ,919 1,088
Sales CAGR Industry ,405 ,211 ,096 1,917 ,056 ,807 1,239
Multiple Expansion CAGR Industry
,200 ,076 ,121 2,617 ,009 ,961 1,041
Deleverage_Ind ,151 ,073 ,099 2,066 ,039 ,886 1,128
(a) Dependent Variable: Gross IRR Performance
Table 73: Coefficients and Collinearity Statistics on Industry Financial Performance Driver (Level 6)

Appen
dic
es
361
Ap
pen
dix
3:
Corr
elati
on
Ma
trix
on
Dea
l E
ntr
y C
on
dit
ion
Va
ria
ble
s
Co
rrel
ati
on
Sta
tist
ics
Gro
ss I
RR
P
erfo
rman
ce
EB
ITD
A
Mrg
. E
ntr
y
Dat
e_In
d
EV
/EB
ITD
A a
t E
ntr
y D
ate_
Ind
Sal
es
CA
GR
n-2
Sal
es
CA
GR
n-1
S
ales
C
AG
R n
+1
Sal
es
CA
GR
n+
2
Mar
gin
C
AG
R n
-2
Mar
gin
C
AG
R
n-1
M
argin
C
AG
R n
+1
Mar
gin
C
AG
R n
+2
Gro
ss I
RR
Per
form
ance
P
ears
on
Corr
elat
ion
1
S
ig.
(2-t
aile
d)
.
N
1685
EB
ITD
A M
argin
Entr
y D
ate_
Indu
stry
P
ears
on C
orr
elat
ion
,003
1
S
ig. (2
-tai
led
) ,9
44
.
N
694
694
EV
/EB
ITD
A a
t E
ntr
y
Dat
e_In
du
stry
P
ears
on C
orr
elat
ion
,055
,0
18
1
S
ig. (2
-tai
led
) ,1
37
,6
29
.
N
725
693
725
Sal
es C
AG
R n
-2
Pea
rson C
orr
elat
ion
,004
,067
,163(*
*)
1
S
ig. (2
-tai
led
) ,9
11
,0
82
,0
00
.
N
666
666
666
666
Sal
es C
AG
R n
-1
Pea
rson C
orr
elat
ion
,015
,055
,004
,497(*
*)
1
S
ig. (2
-tai
led
) ,7
08
,1
57
,9
16
,0
00
.
N
666
666
666
666
666
Sal
es C
AG
R n
+1
P
ears
on
Corr
elat
ion
,1
25(*
*)
,083
(*)
,026
,0
40
-,0
05
1
S
ig. (2
-tai
led
) ,0
01
,0
33
,5
03
,2
99
,907
.
N
667
667
666
666
666
667
Sal
es C
AG
R n
+2
P
ears
on
Corr
elat
ion
,1
01(*
*)
,055
,3
78(*
*)
,05
4
,005
,6
02
(**
) 1
S
ig. (2
-tai
led
) ,0
09
,1
58
,0
00
,1
64
,896
,0
00
.
N
667
667
666
666
666
667
667
Mar
gin
CA
GR
n-2
P
ears
on
Corr
elat
ion
,0
10
,2
45(*
*)
-,0
23
,3
65
(**
) ,2
24(*
*)
,03
4
-,0
28
1
S
ig. (2
-tai
led
) ,7
99
,0
00
,5
53
,0
00
,000
,3
79
,476
.
N
660
660
660
660
660
660
660
660
Mar
gin
CA
GR
n-1
P
ears
on
Corr
elat
ion
,0
41
,2
31(*
*)
-,0
58
,2
10
(**
) ,3
74(*
*)
,02
0
,001
,5
79
(**)
1
S
ig. (2
-tai
led
) ,2
91
,0
00
,1
37
,0
00
,000
,6
01
,980
,0
00
.
N
665
665
665
665
665
665
665
660
665
Mar
gin
CA
GR
n+
1
Pea
rson
Corr
elat
ion
,0
02
-,
041
,2
04(*
*)
,02
8
-,0
37
-,
040
,025
-,
12
8(*
*)
-,0
29
1
S
ig. (2
-tai
led
) ,9
51
,2
85
,0
00
,4
67
,337
,2
98
,522
,0
01
,457
.
N
666
666
666
666
666
666
666
660
665
666
Mar
gin
CA
GR
n+
2
Pea
rson
Corr
elat
ion
,1
04(*
*)
,081
(*)
,30
3(*
*)
,06
7
-,0
16
,0
82(*
) ,1
63(*
*)
-,0
05
,20
6(*
*)
,53
0(*
*)
1
S
ig. (2
-tai
led
) ,0
07
,0
36
,0
00
,0
86
,676
,0
34
,000
,8
96
,000
,0
00
.
N
666
666
666
666
666
666
666
660
665
666
666
**
Corr
elat
ion i
s si
gn
ific
ant
at t
he
0.0
1 l
evel
(2
-tai
led).
*
C
orr
elat
ion
is
sig
nif
ican
t at
th
e 0.0
5 l
evel
(2-t
aile
d).
Ta
ble
74
: C
orr
ela
tio
n S
tati
stic
s o
n D
eal
En
try
Co
nd
itio
n V
ari
ab
les
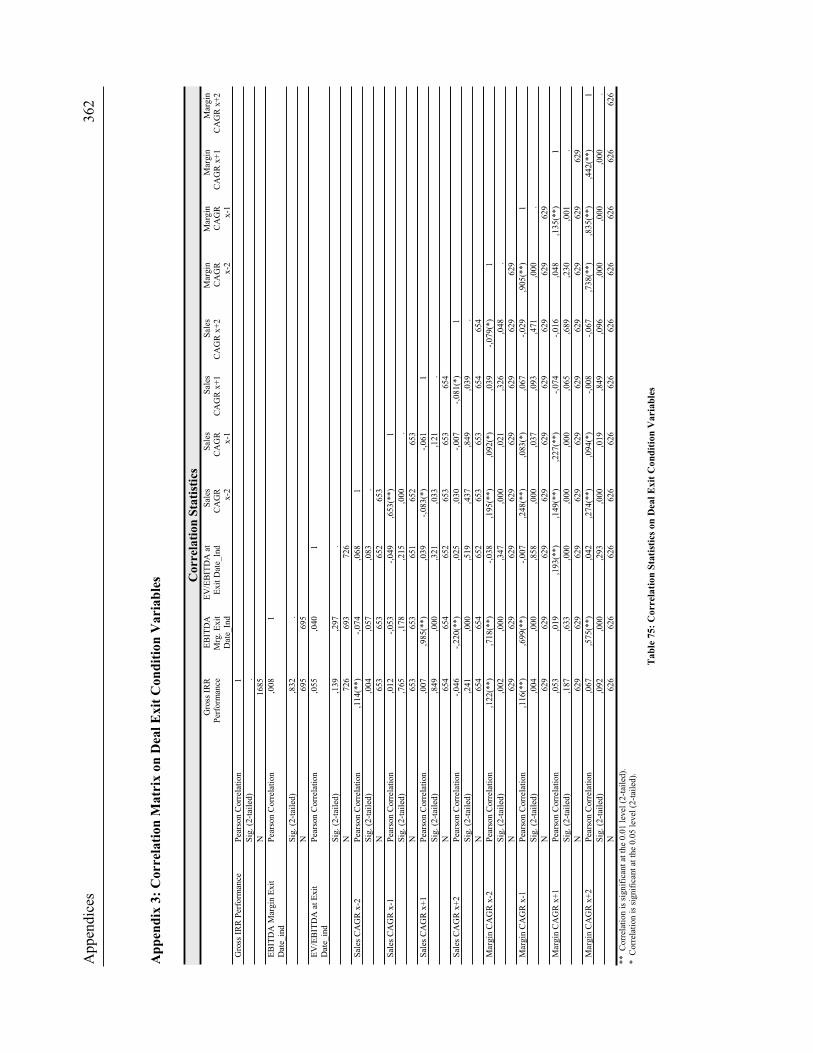
Appen
dic
es
362
Ap
pen
dix
3:
Corr
elati
on
Ma
trix
on
Dea
l E
xit
Con
dit
ion
Va
ria
ble
s Co
rrel
ati
on
Sta
tist
ics
Gro
ss I
RR
P
erfo
rman
ce
EB
ITD
A
Mrg
. E
xit
D
ate_
Ind
EV
/EB
ITD
A a
t E
xit
Dat
e_In
d
Sal
es
CA
GR
x-2
Sal
es
CA
GR
x-1
Sal
es
CA
GR
x+
1
Sal
es
CA
GR
x+
2
Mar
gin
C
AG
R
x-2
Mar
gin
C
AG
R
x-1
Mar
gin
C
AG
R x
+1
Mar
gin
C
AG
R x
+2
Gro
ss I
RR
Per
form
ance
P
ears
on
Corr
elat
ion
1
S
ig.
(2-t
aile
d)
.
N
1685
EB
ITD
A M
argin
Exit
D
ate_
ind
Pea
rson C
orr
elat
ion
,008
1
S
ig. (2
-tai
led
) ,8
32
.
N
695
695
EV
/EB
ITD
A a
t E
xit
D
ate_
ind
Pea
rson C
orr
elat
ion
,055
,040
1
S
ig. (2
-tai
led
) ,1
39
,2
97
.
N
726
693
726
Sal
es C
AG
R x
-2
Pea
rson C
orr
elat
ion
,114(*
*)
-,074
,068
1
S
ig. (2
-tai
led
) ,0
04
,0
57
,0
83
.
N
653
653
652
653
Sal
es C
AG
R x
-1
Pea
rson
Corr
elat
ion
,0
12
-,
053
-,
049
,6
53
(**
) 1
S
ig. (2
-tai
led
) ,7
65
,1
78
,2
15
,0
00
.
N
653
653
651
652
653
Sal
es C
AG
R x
+1
Pea
rson C
orr
elat
ion
,007
,985(*
*)
,039
-,083(*
) -,
061
1
S
ig. (2
-tai
led
) ,8
49
,0
00
,3
21
,0
33
,121
.
N
654
654
652
653
653
654
Sal
es C
AG
R x
+2
P
ears
on
Corr
elat
ion
-,
046
-,
220(*
*)
,025
,0
30
-,0
07
-,
081(*
) 1
S
ig. (2
-tai
led
) ,2
41
,0
00
,5
19
,4
37
,849
,0
39
.
N
654
654
652
653
653
654
654
Mar
gin
CA
GR
x-2
P
ears
on
Corr
elat
ion
,1
22(*
*)
,71
8(*
*)
-,0
38
,1
95
(**
) ,0
92
(*)
,03
9
-,0
79
(*)
1
S
ig. (2
-tai
led
) ,0
02
,0
00
,3
47
,0
00
,021
,3
26
,048
.
N
629
629
629
629
629
629
629
629
Mar
gin
CA
GR
x-1
P
ears
on
Corr
elat
ion
,1
16(*
*)
,69
9(*
*)
-,0
07
,2
48
(**
) ,0
83
(*)
,06
7
-,0
29
,9
05
(**)
1
S
ig. (2
-tai
led
) ,0
04
,0
00
,8
58
,0
00
,037
,0
93
,471
,0
00
.
N
629
629
629
629
629
629
629
629
629
Mar
gin
CA
GR
x+
1
Pea
rson
Corr
elat
ion
,0
53
,0
19
,1
93(*
*)
,149
(**
) ,2
27(*
*)
-,074
-,0
16
,0
48
,13
5(*
*)
1
S
ig. (2
-tai
led
) ,1
87
,6
33
,0
00
,0
00
,000
,0
65
,689
,2
30
,001
.
N
629
629
629
629
629
629
629
629
629
629
Mar
gin
CA
GR
x+
2
Pea
rson
Corr
elat
ion
,0
67
,5
75(*
*)
,042
,2
74
(**
) ,0
94
(*)
-,008
-,0
67
,7
38
(**)
,83
5(*
*)
,44
2(*
*)
1
S
ig. (2
-tai
led
) ,0
92
,0
00
,2
93
,0
00
,019
,8
49
,096
,0
00
,000
,0
00
.
N
626
626
626
626
626
626
626
626
626
626
626
**
Corr
elat
ion i
s si
gn
ific
ant
at t
he
0.0
1 l
evel
(2
-tai
led).
*
C
orr
elat
ion
is
sig
nif
ican
t at
th
e 0.0
5 l
evel
(2-t
aile
d).
Ta
ble
75
: C
orr
ela
tio
n S
tati
stic
s o
n D
eal
Ex
it C
on
dit
ion
Va
ria
ble
s

Ap
pen
dic
es
363
Ap
pen
dix
4:
Str
ate
gy C
od
ing
Da
tab
ase
– P
C C
ha
ract
eris
tics
, P
re-d
eal
Str
ate
gy a
nd
Fin
an
cia
ls I
np
ut

Ap
pen
dic
es
364
Ap
pen
dix
4:
Str
ate
gy C
od
ing
Da
tab
ase
– D
eal
Ch
ara
cter
isti
cs,
Ma
na
gem
ent
Tea
m a
nd
Exit
In
pu
t

Ap
pen
dic
es
365
Ap
pen
dix
4:
Str
ate
gy C
od
ing
Da
tab
ase
– S
tra
teg
y a
nd
Key
Even
ts I
np
ut

Ap
pen
dic
es
366
Ap
pen
dix
4:
Str
ate
gy C
od
ing
Da
tab
ase
– S
tra
teg
y a
nd
Key
Even
ts I
np
ut
(con
t’d
)

Ap
pen
dic
es
367
Ap
pen
dix
5:
GP
In
ves
tmen
t M
an
ag
er C
od
ing D
ata
ba
se –
Ma
na
ger
’s E
du
ca
tio
n a
nd
Pri
va
te E
qu
ity E
xp
osu
re,
Pro
fess
ion
al
Caree
r H
isto
ry &
Tit
les

Appendices
Appendix 6: GP Investment Manager and Transaction Matching Tool
Protected
Data Content

9. Bibliography
Agrawal, A., J. F. Jaffe, et al. (1992). "The Post-Merger Performance of Acquiring Firms: A Re-examination of an Anomaly." Journal of Finance 47(4): 1605-1621.
Agrawal, A. and C. R. Knoeber (1996). "Firm performance and mechanisms to control agency problems between managers and shareholders." Journal of Financial & Quantitative Analysis 31(3): 377.
Allen, J. R. (1996). "LBOs - The evolution of financial structures and strategies." Journal of Applied Corporate Finance 8(4): 18-29.
Altman, E. I. (1983). Corporate Financial Distress: A Complete Guide to Predicting, Avoiding and Dealing with Bankruptcy. New York, John Wiley & Sons.
Altman, E. I. (1987). "The Anatomy of the High-Yield Bond Market." Financial Analysts Journal 43(4): 12.
Altman, E. I. (1992). "Revisiting the high-yield bond market." Financial Management 21(2): 78.
Amabile, T. M. (1988). A model of creativity and innovation in organizations. Research in organizational behaviour. B. M. Straw and L. L. Cummings III. (Eds.), JAI Press. 10: 123-167.
Amabile, T. M., K. G. Hill, et al. (1994). "The work preference inventory: Assessting intrinsic and extrensic motivational orientations." Journal of Personality and Social Psychology 66: 950-967.
Anders, G. (1992). "The `barbarians' in the boardroom." Harvard Business Review 70(4): 79.
Anslinger, P. L. and T. E. Copeland (1996). "Growth through acquisitions: A fresh look." McKinsey Quarterly(2): 96.
Ansoff, I. H. (1965). Corporate Strategy. New York, McGraw-Hill. Asquith, P. (1983). "Merger Bids, Uncertainty, and Stockholder Returns." Journal of
Financial Economics 11(1-4): 51. Asquith, P., D. W. Mullins Jr, et al. (1989). "Original Issue High Yield Bonds: Aging
Analyses of Defaults, Exchanges, and Calls." Journal of Finance 44(4): 923. Asquith, P. and T. A. Wizman (1990). "Event risk, covenants, and bondholder returns in
leveraged buyouts." Journal of Financial Economics 27(1): 195. Athanassiou, N. and D. Nigh (1999). "The impact of U.S. company internationalization on
top management team advice networks: A tacit knowledge perspective." Strategic Management Journal 20: 83-92.
Baker, G. P. (1992). "Beatrice: A Study in the Creation and Destruction of Value." Journal of Finance 47(3, Papers and Proceedings of the Fifty-Second Annual Meeting of the American Finance Association, New Orleans, Louisiana January 3-5, 1992): 1081-1119.
Baker, G. P. and C. A. Montgomery (1994). "Comglomerates and LBO associations: A comparison of organizational forms." Harvard Business School Working Paper(November 4): 1-34.
Baker, G. P. and K. H. Wruck (1989). "Organizational Changes and Value Creation in Leveraged Buyouts." Journal of Financial Economics 25(2): 163.
Baker, G. P. and K. H. Wruck (1989). "Organizational changes and value creation in leveraged buyouts: The Case of The O.M. Scott & Sons Company." Journal of Financial Economics 25(2): 163.

Bibliography 370
Bance, A. (2002). "Why and how to invest in Private Equity." European Venture Capital Association(Special Paper).
Banker, R. D. and R. P. Brief (1999). "Improving Company Productivity: Handbook with Case Studies (Book)." Accounting Review 63(2): 368.
Banker, R. D., C. Hsi-Hui, et al. (1993). "Analyzing the Underlying Dimensions of Firm Profitability." Managerial & Decision Economics 14(1): 25.
Banker, R. D., C. Hsi-Hui, et al. (1996). "A Framework for Analyzing Changes in Strategic Performance." Strategic Management Journal 17(9): 693.
Bantel, K. and S. Jackson (1989). "Top Management and Innovations in Banking: Does the Composition of the Top Team Make a Difference?" Strategic Management Journal 10: 107-124.
Barney, J. B. (1986). "Strategic Factor Markets: Expectations, Luck, and Business Strategy." Management Science 32(10): 1231-1241.
Barney, J. B. (1988). "Returns to Bidding Firms in Mergers and Acquisitions: Reconsidering the Relatedness Hypothesis." Strategic Management Journal9(Special Issue): 71-78.
Beaver, G. (2001). "Management Buy-Outs: Who dares wins?" Strategic Change 10(6, September-October): 307-310.
Berg, A. and O. Gottschalg (2003). "Understanding value generation in buyouts." INSEAD working paper(April 2003).
Berle, A. A. and G. C. Means (1932). The modern corporation and private property. New York, MacMillan.
Black, B. S. and R. J. Gilson (1999). "Does Venture Capital Require an Active Stock Market?" Journal of Applied Corporate Finance 11(4): 36-48.
Black, T. R. (1999). Doing Quantitative Research in the Social Sciences: An integrated Approach to Research Design, Measurement and Statistics. London, Sage.
Boeker, W. (1997). "Executive migration and strategic change: The effect of top manager movement on product-market entry." Administrative Science Quarterly 42: 213-237.
Bortz, J. and N. Döring (1995). Forschungsmethoden und Evaluation für Sozialwissenschaftler. Berlin, Springer.
Boyle, S. (1970). "Pre-merger growth and profit characteristics of large conglomerate mergers in the United States." St. John's Law Review Spring: 152-170.
Bradley, M. and G. Jarrell (1988). Comment. in: Knights, Raiders and Targets. J. Coffee Jr., Louis Lowenstein, and Susan Rose-Ackerman (eds.). Oxford, Oxford University Press: 252-259.
Brealey, R., H. E. Leland, et al. (1977). "Informational Asymmetries, Financial Structure, and Financial Intermediation." Journal of Finance 32(2): 371.
Brinberg, D. and J. E. McGrath (1982). A Network of Validity Concepts within the Research Process". San Francisco, Jossey-Bass.
Bruner, R. F. and K. M. Eades (1992). "The crash of the Revco leveraged buyout: The hypothesis of inadequate capital." Financial Management 21(1): 35.
Bruner, R. F. and L. S. Paine (1988). "Management Buyouts and Managerial Ethics." California Management Review 30(2): 89.
Bull, I. (1989). "Financial Perfomance of Leveraged Buyouts: An Empirical Analysis." Journal of Business Venturing 4(4): 263.
Butler, P. A. (2001). "The alchemy of LBOs." McKinsey Quarterly(2): 140. CalPERS (2002). "Alternative investment program annual review." The California Public
Employees' Retirement System.Cannella, A. A., Jr. and D. C. Hambrick (1993). "Effects of executive departures on the
performance of acquired firms." Strategic Management Journal 14(Special Issue): 137-152.

Bibliography 371
Carpenter, M. A. and J. W. Fredrickson (2001). "Top management teams, global strategic posture, and the moderating role of uncertainty." Academy of Management Journal44(3): 533-546.
Chambers, J. (1998). "“J” Curves and the Outlook for Interim Returns." Institute for Fiduciary Education (IFE) November 1998.
Chandler, A. D. (1962). Strategy and Structure. Cambridge, MA, MIT Press. Chang, S. and D. Mayers (1992). "Managerial vote ownership and shareholder wealth – Evidence from employee stock ownership plans." Journal of Financial Economics
32: 103-131. Chaplinsky, S. and S. E. Perry (2004). "CalPERS vs. Mercury News: Disclosure comes to
Private Equity." Darden Case Study UVA-F-1438-SSRN. Chatterjee, S. (1986). "Types of Synergy and Economic Value: The Impact of Acquisitions
on Merging and Rival Firms." Strategic Management Journal 7(2): 119-139. Chatterjee, S., M. H. Lubatkin, et al. (1992). "Cultural Differences and Shareholder Value
in Related Mergers: Linking Equity and Human Capital." Strategic Management Journal 13(5): 319-334.
Chung, K. and J. F. Weston (1982). Diversification and mergers in a strategic long range planning framework. in: Mergers and Acquisition. M. Keenan and L. White (ed.). Lexington, D.C. Heath.
Conte, M. A. and J. Svejnar (1988). "Productivity Effects of Worker Participation in Management, Profit-Sharing, Worker Ownership Of." International Journal of Industrial Organization 6(1): 139.
Copeland, T. and J. F. Weston (1988). Financial Theory and Corporate Policy. New York, Addison-Wesley.
Cotter, J. F. and S. W. Peck (2001). "The structure of debt and active equity investors: The case of the buyout specialist." Journal of Financial Economics 59(1): 101.
Cyert, R. M. and J. G. March (1963). A Behavioral Theory of the Firm. Englewood Cliffs, NJ, Prentice-Hall.
Dahmen, P. (2001). Corporate Governance and Capital Market Performance. Corporate Governance Standards for Boards of Transnational Corporations, University of St. Gallen Doctoral Seminar Series Working Paper.
Dalton, D. R., C. M. Daily, et al. (1998). "Meta-analytic reviews of board composition, leadership structure, and financial performance." Strategic Management Journal19(3): 269.
Darwin, C. (1859). On the origin of species by means of natural selection, or the preservation of favoured races in the struggle for life. London, John Murray.
Datta, D. K., N. Rajagopalan, et al. (1991). "Diversification and Performance." Journal of Management Studies 28(5): 529.
DeAngelo, H. and L. DeAngelo (1987). "Management Buyouts of Publicly Traded Corporations." Financial Analysts Journal 43(3): 38.
DeAngelo, H. and L. DeAngelo (1998). "Ancient Redwoods and the Politics of Finance: The Hostile Takeover of the Pacific Lumber Company." Journal of Financial Economics January 1998: pp. 3-53.
DeAngelo, H., L. DeAngelo, et al. (1984). "Going Private: Minority Freezeouts and Stockholder Wealth." Journal of Law & Economics 27(2): 367.
DeAngelo, L. E. (1986). "Accounting Numbers as Market Valuation Substitutes: A Study of Management Buyouts of Public Stockholders." Accounting Review 61(3): 400.
Demsetz, H. (1983). "The Structure of Ownership and the Theory of the Firm." Journal of Law & Economics 26(2): 375.
Denis, D. J. and a. D. K. Denis (1994). "Majority Owner-Managers and Organizational Efficiency." Journal of Corporate Finance 1: 91-118.
Denis, D. J. and D. K. Denis (1995). "Causes of financial distress following leveraged recapitalizations." Journal of Financial Economics 37(2): 129.

Bibliography 372
Dierickx, I. and K. Cool (1989). "Asset Stock Accumulation and the Sustainability of Competitive Advantage: Reply." Management Science 35(12): 1514.
Dodd, P. (1980). "Merger proposals, manager discretion and shareholder wealth." Journal of Financial Economics 8(2): 105-138.
Dosoung, C. and G. C. Philippatos (1983). "An Examination of Merger Synergism." Journal of Financial Research 6(3): 239.
Dresdale, R. S. (2002). Private Equity: The Transformation of an Industry, Institute for Fiduciary Education.
Easterwood, J. C., A. Seth, et al. (1989). "The Impact of Leveraged Buyouts on Strategic Direction." California Management Review 32(1): 30.
EU (2002). Europe's Single Capital Market - Conference Report. Bibliothèque Solvay, Brussels, Eurofi 2000.
EVCA (2003). EVCA Guidelines. Zaventern, Belgium, The European Private Equity and Venture Capital Association (EVCA).
Fama, E. F. (1980). "Agency Problems and the Theory of the Firm." Journal of Political Economy 88(2): 288.
Fama, E. F. and M. C. Jensen (1983a). "Separation of Ownership and Control." Journal of Law & Economics 26(2): 301.
Fama, E. F. and M. C. Jensen (1983b). "Agency Problems and Residual Claims." Journal of Law & Economics 26(2): 327.
Fama, E. F. and M. C. Jensen (1985). "Organizational Forms and Investment Decisions." Journal of Financial Economics 14(1): 101.
Fenn, G. W., N. Liang, et al. (1996). "The Economics of the Private Equity Market." Federal Reserve Bulletin Board of Governors of the Federal Reserve.
Finkelstein, S. and D. Hambrick (1990). "Top-Management-Team Tenure and Organizational Outcomes: The Moderating Role of Managerial Discretion." Administrative Science Quarterly 35: 484-503.
Finkelstein, S. and D. Hambrick (1996). Strategic leadership: Top executives and their effects on organizations. St. Paul, West Publishing Company.
Firer, C. (1999). "Driving Financial Performance Through the du Pont Identity: A Strategic Use of Financial Analysis." Financial Practice & Education 9(1): 34.
Flick, U., E. von Kardorff, et al. (2000). Qualitative Forschung - Ein Handbuch. Reinbek bei Hamburg.
Fox, I. and A. Marcus (1992). "The Causes and Consequences of Leveraged Management Buyouts." Academy of Management Review 17(1): 62.
Franks, J., R. Harris, et al. (1991). "The postmerger share-price performance of acquiring firms." Journal of Financial Economics 29(1): 81.
Frisch, R. A. (2002). Esop: The Ultimate Instrument in Succession Planning. New York, NY, John Wiley & Sons.
Gifford, D. (2001). "Why debt can hurt corporate growth - Research substantiates that incurring debt motivates managers to sacrifice long-term investments in favor of short-term cash flow." MIT Sloan Management Review 42(3): 18-18.
Gilbert, X. and P. Strebel (1987). "Strategies to Outpace the Competition." Journal of Business Strategy 8(1): 28.
Gompers, P. and J. Lerner (2002). The opportunity in European Private Equity. Citibank Alternative Investments.
Gottschalg, O. (2002). "Why financial buyers do it better? Agency theory meets the knowledge-based view of the firm." Academy of Management Conference Paper:1-31.
Gottschalg, O., L. Phalippou, et al. (2003). "Performance of Private Equity Funds: Another Puzzle?" INSEAD working paper October 2003.
Grant, R. M. (1996). "Toward a knowledge-based theory of the firm." Strategic Management Journal 17(10): 109.

Bibliography 373
Grossman, S. J. and O. Hart (1982). Corporate financial structure and managerial incentives. in: The economics of information and uncertainty. J. McCall (Ed.). Chicago, University of Chicago Press: 107-140.
Hair, J. H., R. E. Anderson, et al. (1998). Multivariate Data Analysis. Upper Saddle River, New Jersey, Prentice-Hall.
Haiyang, C., J. L. Hexter, et al. (1993). "Management Ownership and Corporate Value." Managerial & Decision Economics 14(4): 335.
Hall, B. H. (1990). "The impact of corporate restructuring on industrial research and development." Brookings Papers on Economic Activity: 85.
Hambrick, D. and P. Mason (1984). "Upper Echelons: The Organization as a Reflection of its Top Managers." Academy of Management Journal 15(3): 514-535.
Haspeslagh, P. and D. E. Jemison (1991). Managing acquisitions: Creating value for corporate renewal. New York, The Free Press.
Healy, P. M., K. G. Palepu, et al. (1992). "Does corporate performance improve after mergers?" Journal of Financial Economics 31(2): 135.
Herman, E. and L. Lowenstein (1988). The efficiency effects of hostile takeovers. in: Knights, Raiders and Targets: The impact of Hostile Takeovers. J. Coffee Jr., Louis Lowenstein, and Susan Rose-Ackerman (eds.). New York, Oxford University Press: 211-40.
Hilb, M. (2002a). "Das Board-Team als Gestaltungsrat." Student Business Review Herbst: 18-21.
Hilb, M. (2002b). Transnationales Management der Human-Ressourcen – Das 4P-Modell des Glocalpreneuring. Neuwied/Kriftel, Luchterhand.
Hite, G. L. and M. R. Vetsuypens (1989). "Management Buyouts of Divisions and Shareholder Wealth." Journal of Finance 44(4): 953.
Hofer, C. W. (1983). ROVA: A New Measure for Assessing Organizational Performance. in: Advances in Strategic Management. R. B. Lamb (Ed.). Greenwich, CT, JAI Press.
Holderness, C. and D. P. Sheehan (1988). "The Role of Majority Shareholders in Publicly Held Corporations: An Exploratory Analysis." Journal of Financial Economics 20: 317-347.
Holderness, C. G., R. S. Kroszner, et al. (1999). "Were the Good Old Days That Good? Changes in Managerial Stock Ownership Since the Great Depression." Journal of Finance 54(2): 435-469.
Holl, P. (1975). "Effect of Control Type on the Performance of the Firm in the U.K." Journal of Industrial Economics 23(4): 257.
Holl, P. (1977). "Control Type and the Market for Corporate Control in Large U.S. Corporations." Journal of Industrial Economics 25(4): 259.
Holthausen, R. W. and D. F. Larcker (1996). "The financial performance of reverse leveraged buyouts." Journal of Financial Economics 42(3): 293.
Hoskisson, R. E., M. A. Hitt, et al. (1993). "Construct Validity of an Objective (Entropy) Categorical Measure of Diversification Strategy." Strategic Management Journal14(3): 215.
Hoskisson, R. E. and T. A. Turk (1990). "Corporate Restructuring: Governance and Control Limits of the Internal Capital Market." Academy of Management Review15(3): 459.
Houlden, B. (1990). "Buy-outs and Beyond--Motivations, Strategies and Ownership Changes." Long Range Planning 23(4): 73.
Ibbotson, R. G., J. L. Sindelar, et al. (1988). "Initial Public Offerings." Journal of Applied Corporate Finance 1: 37-45.
Indahl, R. and E. Zinterhofer (1998). "A note on European Private Equity." Harvard Business School Case(No. 9-299-017): 1-11.

Bibliography 374
Jackson, S. (1992). "Consequences of Group Composition for the Interpersonal Dynamics of Strategic Issue Processing." Advances in Strategic Management 8: 345-382.
Jalilvand, A. and J. A. Switzer (2002). "Operating and Financial Performance of Reverse LBOs: Evcidence from the 1990s." Dalhousie University Working Paper.
Jeng, L. A. and P. C. Wells (2000). "The Determinants of Venture Capital Funding: Evidence Across Countries." Journal of Corporate Finance 6(3): 241-289.
Jensen, M. C. (1986). "Agency Costs of Free Cash Flow, Corporate Finance, and Takeovers." American Economic Review 76(2): 323.
Jensen, M. C. (1988). "Takeovers: Their Causes and Consequences." Journal of Economic Perspectives 2(1): 21.
Jensen, M. C. (1989a). "Active investors, LBOs and the privatization of bankruptcy." Journal of Applied Corporate Finance 2(1): 35-44.
Jensen, M. C. (1989b). "Eclipse of the public corporation." Harvard Business Review67(5): 61.
Jensen, M. C., W. Burkhardt, et al. (1992). "Wisconsin Central Ltd. Railroad and Berkshire Partners (A): Leveraged Buyouts and Financial Distress." Harvard Business School Case(9-190-062).
Jensen, M. C. and W. H. Meckling (1976). "Theory of the Firm: Managerial Behavior, Agency Costs and Ownership Structure." Journal of Financial Economics 3(4): 305.
Jensen, M. C. and R. S. Ruback (1983). "The Market for Corporate Control." Journal of Financial Economics 11(1-4): 5.
Jones, C. M. and M. Rhodes-Kropf (2003). "The Price of Diversifiable Risk in Venture Capital and Private Equity." Working Paper Columbia University.
Jones, D. C. and T. Kato (1995). "The productivity effects of employee stock-ownership plans and bonuses: Evidence from Japanese." American Economic Review 85(3): 391.
Kaldor, N. (1932). "The economic situation of Austria." Harvard Business Review 11. Kaplan, S. (1989a). "Management Buyouts: Evidence on Taxes as a Source of Value."
Journal of Finance 44(3): 611. Kaplan, S. (1989b). "The Effects of Management Buyouts on Operating Performance and
Value." Journal of Financial Economics 24(2): 217. Kaplan, S. and A. Schoar (2003). "Private Equity Performance: Returns Persistence and
Capital." NBER Working Paper 9807: 1-42. Kaplan, S. N., M. L. Mitchell, et al. (1997). "A Clinical Exploration of Value Creation and
Destruction in Acquisitions: Organizational Design, Incentives, and Internal Capital Markets." NBER Working Paper No. W5999.
Kaplan, S. N. and J. C. Stein (1993). "The evolution of pricing and financial structure in the 1980s." Quarterly Journal of Economics 108(2): 313.
Kester, W. C. and T. A. Luehrman (1995). "Rehabilitating the Leveraged Buyout." Harvard Business Review 73(3): 119.
Kitching, J. (1989). "Early returns on LBOs." Harvard Business Review 67(6): 74. KKR (1989). "Leveraged Buy-Outs." Journal of Applied Corporate Finance 2(1): 74-81. Kogut, B. and U. Zander (1992). "Knowledge of the Firm, Combinative Capabilities, and
the Replication of Technology." Organization Science: A Journal of the Institute of Management Sciences 3(3): 383.
Krishnan, H. A., A. Miller, et al. (1997). "Diversification and top management team complementarity: Is performance improved by merging similar or dissimilar teams?" Strategic Management Journal 18(5): 361-374.
La Porta, R., F. Lopez de Silanes, et al. (1999). "Corporate Ownership around the World." Journal of Finance Vol. 54(No. 2): 471-517.
La Porta, R., F. Lopez-de-Silanes, et al. (1998). "Corporate Ownership around the World." NBER working paper 6625.

Bibliography 375
Lang, L. H. P., R. M. Stulz, et al. (1989). "Managerial Performance, Tobin's Q, and the Gains from Successful Tender Offers." Journal of Financial Economics 24(1): 137.
Langetieg, T. C. (1978). "An Application of a Three-Factor Performance Index to Measure Stockholder Gains from Merger." Journal of Financial Economics 6(4): 365.
Lee, D. S. (1992). "Management Buyout Proposals and Inside Information." Journal of Finance 47(3): 1061.
Lehn, K. and A. Poulsen (1989). "Free Cash Flow and Stockholder Grains in Going Private Transactions." Journal of Finance 44(3): 771.
Lehn, K. and A. Poulsen (1990). "The economics of event risk: The case of bondholders in leveraged buyouts." Journal of Corporation Law 15(2): 199.
Lei, D. and M. A. Hitt (1995). "Strategic restructuring and outsourcing: The effect of mergers and acquisitions and LBOs on." Journal of Management 21(5): 835.
Lichtenberg, F. R. and D. Siegel (1990). "The effects of leveraged buyouts on productivity and related aspects of firm behavior." Journal of Financial Economics 27(1): 165.
Liebeskind, J. and M. Wiersema (1992). "LBOs, corporate structuring, and the incentive-intensity hypothesis." Financial Management 21(1): 73.
Liles, P. R. (1977). "Sustaining the Venture Capital Firm." Harvard University Management Analysis Center Mimeo.
Ljungqvist, A. and M. Richardson (2003). "The Cash Flow, Return and Risk Characteristics of Private Equity." NBER Working Paper 9454: 1-41.
Long, W. F. and D. J. Ravenscraft (1993a). "The financial perfromance of whole company LBOs." Economic Studies from US Census(November): 1-36.
Long, W. F. and D. J. Ravenscraft (1993c). Decade of debt: Lessons from the LBOs in the 1980s. The deal decade: What takeovers and leveraged buyouts mean for corporate governance. M. Margaret (Ed.). Washington D.C., Brookings Institution: 205-237.
Loos, N., O. Gottschalg, et al. (2004). "Working out where the value lies." European Venture Capital Journal June 2004.
Lowenstein, L. (1985). "Management buyouts." Columbia Law Review 85(4): 730-784. Lubatkin, M. (1987). "Merger Strategies and Stockholder Value." Strategic Management
Journal 8(1): 39-53. Lubatkin, M. and H. M. O'Neill (1987). "Merger Strategies and Capital Market Risk."
Academy of Management Journal 30(4): 665-684. Lys, T. and L. Vincent (1995). "An Analysis of Value Destruction in AT&T's Acquisition of
NCR." Journal of Financial Economics 39(353). Machlup, F. (1935). "The consumption of capital in Austria." The Review of Economic
Statistics 17(1): 13-19. Macus, M. (2002). Towards a Comprehensive Theory of Boards - Conceptual
Development and Empirical Exploration. IFPM Institute Dissertation Nr. 2677. St. Gallen, Switzerland,
University of St. Gallen. Magenheim, E. B. and D. C. Mueller (1988). Are acquiring firm shareholders better off
after an acquisition? in: Knights, Raiders and Targets. J. Coffee Jr., Louis Lowenstein, and Susan Rose-Ackerman (eds.). Oxford, England, Oxford University Press.
Malatesta, P. H. (1983). "The Wealth Effect of Merger Activity and the Objective Functions of Merging Firms." Journal of Financial Economics 11(1-4): 155.
Malik, F. (1999). Wirksame Unternehmensaufsicht. Frankfurt, Frankfurter Allgemeine Zeitung Verlag.
Malone, S. C. (1989). "Characteristics of Smaller Company Leveraged Buyouts." Journal of Business Venturing 4(5): 349.
Mandelker, G. (1974). "Risk and Return: The Case of Merging Firms." Journal of Financial Economics 1(4): 303.

Bibliography 376
Manne, H. G. (1965). "Mergers and the Market for Corporate Control." Journal of Political Economy 73(2): 110.
Marais, L., K. Schipper, et al. (1989). "Wealth Effects of Going Private for Senior Securities." Journal of Financial Economics 23(1): 155.
March, J. G., L. S. Sproull, et al. (1991). "Learning from Samples of One or Fewer." Organization Science: A Journal of the Institute of Management Sciences 2(1): 58.
Markides, C. (1997). "Strategic Innovation." Sloan Management Review 38(3): 9. Markides, C. (1998). "Strategic innovation in established companies." Sloan Management
Review 39(3): 31. Marti, J. and M. Balboa (2001). "Determinants of Private Equity Fundraising in Western
Europe." Working Paper University Complutense of Madrid. Miles, M. B. and A. M. Huberman (1994). Qualitative Data Analysis: An expanded
Sourcebook. Thousand Oaks, CA, Sage. Morck, R. and A. Shleifer (1988). "Management Ownership and Market Valuation."
Journal of Financial Economics 20(1/2): 293. Morck, R., A. Shleifer, et al. (1988). "Management ownership and market valuation."
Journal of Financial Economics 20: 293-315. Morck, R., A. Shleifer, et al. (1990). "Do Managerial Objectives Drive Bad Acquisitions?"
Journal of Finance 45(1). Mueller, D. C. (1969). "A Theory of Conglomerate Mergers." Quarterly Journal of
Economics 83(4): 643. Mueller, D. C. (1977). "The Effects of Conglomerate Mergers." Journal of Banking &
Finance 1(4): 315. Mueller, D. C. (1985). "Mergers and Market Share." Review of Economics & Statistics
67(2): 259. Mueller, D. C., (ed.) (1980). The determinants and effects of mergers. Cambridge,
Oelgeschlager, Gunn & Hain. Murali, R. and J. B. Welch (1989). "Agents, Owners, Control and Performance." Journal of
Business Finance & Accounting 16(3): 385. Muscarella, C. J. and M. R. Vetsuypens (1990). "Efficiency and Organizational Structure:
A Study of Reverse LBOs." Journal of Finance 45(5): 1389. Myeong-Hyeon Cho, D. (1998). "Ownership structure, investment, and the corporate
value: an empirical analysis." Journal of Financial Economics 47(1): 103. Myers, R. L. (1984). "Lowering Barriers to Innovation." Journal of Business Strategy 5(1):
80.Nathanson, D. and J. Cassano (1982). "Organization, Diversity and Performance."
Wharton Magazine Summer 1982: 19-26. National Academy of Science (1989). On being a Scientist. AIDS Aufklärung,
Sonderdrucke zu HIV und AIDS. Zürich, Schweiz. Heft 13. Nayyar, P. R. (1992). "On the Measurement of Corporate Diversification Strategy:
Evidence from Large U.S. Service Firms." Strategic Management Journal 13(3): 219.
Nelson, R. R. and S. G. Winter (1982). An evolutionary theory of economic change.Cambridge, MA and London, Belknap Press.
Neter, J., W. Wasserman, et al. (1985). Applied Linear Regression Models. Homewood, Illinois, Irwin.
Newbould, G. D. and R. E. Chaffield (1992). "Leveraged buyouts and tax incentives." Financial Management 21(1): 50.
Ofek, E. (1994). "Efficiency gains in unsuccessful management buyouts." Journal of Finance 49(2): 637.
Ohmae, K. (1989). "Managing in a borderless world." Harvard Business Review May-June: 152-161.

Bibliography 377
Opler, T. and S. Titman (1993). "The determinants of leveraged buyout activity : Free cash flow vs. financial distress costs." Journal of Finance 48(5): 1985.
Opler, T. C. (1992). "Operating performance in leveraged buyouts: Evidence from 1985-1989." Financial Management 21(1): 27.
Opler, T. C. (1993). "Controlling financial distress costs in leveraged buyouts with financial innovations." Financial Management 22(3): 79.
O'Reilly, C., R. Snyder, et al. (1993). Effects of executive team demography onorganizational change. New York, Oxford University Press. Palepu, K. G. (1990). "Consequences of leveraged buyouts." Journal of Financial
Economics 27(1): 247. Peck, S. W. (1996b). "The influence of professional investors on the failure of
management buyout attempts." Journal of Financial Economics 40(2): 267. PEIGG (2004a). U.S. Private Equity Valuation Guidelines, Private Equity Industry
Guidelines Group. PEIGG (2004b). Industry group applauds NVCA position on valuation guidelines. Press
Release, Private Equity Industry Guidelines Group: March 2, 2004. Penrose, E. T. (1959). The theory of the growth of firms. Oxford, Oxford University Press. Phan, P. H. and C. W. L. Hill (1995). "Organizational restructuring and economic
performance in leveraged buyouts: An ex post study." Academy of Management Journal 38(3): 704.
Philippatos, G. C. and P. L. Baird Iii (1996). "Postmerger Performance, Managerial Superiority and the Market for Corporate Control." Managerial & Decision Economics 17(1): 45.
Porter, M. E. (1985). Competitive Advantage: Creating and Sustaining Superior Performance. New York, The Free Press.
Porter, M. E. (1996). "What Is Strategy?" Harvard Business Review 74(6): 61. Rappaport, A. (1990). "The staying power of the public corporation." Harvard Business
Review 68(1): 96. Raschle, B. (2001). Diversification, Altassets.com, Internet:
http://www.altassets.com/knowledgebank/learningcurve/2001/nz2619.php. 2004. Ravenscraft, D. J. and F. M. Scherer (1987). Mergers, Sell-offs and Economic Efficiency.
Washington DC, Brookings. Reeb, D. M. and R. C. Anderson (2004). "Founding Family Ownership and Firm
Performance: Evidence from the S&P 500." Journal of Finance Forthcoming. Reilly, F. K. (1997). "The impact of inflation on ROE, growth and stock prices." Financial
Services Review 6(1): 1. Reyes, J. and E. Mendell (2004). "Private Equity Performance Continued Positive Growth
in Q1 2004." Venture Economics and NVCA NEW YORK, NY(July 21, 2004). Rhoades, S. (1986). The operating performance of acquired firms in banking before and
after acquisition. Staff study No. 149. Board of governors of the Federal Reserve System, April.
Roden, D. M. and W. G. Lewellen (1995). "Corporate capital structure decisions: Evidence from leveraged buyouts." Financial Management 24(2): 76.
Rosen, C. and S. Rodrick (2001). Leveraged ESOPs and Employee Buyouts, National Center for Employee Ownership.
Ross, S. A. (1977). "The determination of financial structure: the incentive-signalling approach." Bell Journal of Economics 8(1): 23.
Ruback, R. J. (1988). Comment. in: Corporate takeovers: courses and consequences. A. J. Auerbach (ed.). Chicago, University of Chicago Press.
Rumelt, R. P. (1974). Strategy, Structure and Economic Performance. Department of Research, Graduate School of Business Administration, Harvard University.
Rumelt, R. P. (1977). Diversity and Profitability. Paper MGL-51, Managerial Studies Center, Graduate School of Management, University of California, Los Angeles.

Bibliography 378
Rumelt, R. P. (1984). Towards a strategic theory of the firm. in: Competitive strategy management. R. B. Lamb (Ed.). Englewood Cliffs, NJ, Prentice-Hall: 556-570.
Rust, R. T. and T. Keiningham (1999). "Return on quality at Chase Manhattan Bank." Interfaces 29(2): 62.
Rust, R. T., C. Moorman, et al. (2002). "Getting Return on Quality: Revenue Expansion, Cost Reduction, or Both?" Journal of Marketing 66(4): 7.
Samdani, G. S., P. A. Butler, et al. (2001). The alchemy of leveraged buyouts. in; Value creation: strategies for the chemical industry. F. Budde, Farha, Gary A., Frankemölle, Heiner, Hoffmeister, David F., Krämer, Konstantin (Eds.). Weinheim, Wiley-VCH Verlag: 93-107.
Sanders, W. and M. Carpenter (1998). "Internationalization and firm governance: The roles of CEO compensation, top team composition, and board structure." Academy of Management Journal 41: 158-178.
SBA (1977). Report of the SBA Task Force on Venture and Equity Capital for Small Business. Washington, D.C., U.S. Small Business Administration.
Scherer, F. M. and D. J. Ravenscraft (1989). "The Profitability of Mergers." International Journal of Industrial Organization 7(1): 101.
Schiff, E. (1933). Kapitalbindung und Kapitalverzehr im Konjunkturverlauf. Vienna. Scholes, M. S. and M. A. Wolfson (1989). "Decentralized Investment Banking." Journal of
Financial Economics 24(1): 7. Servaes, H. (1991). "Tobin's Q and Gains from Takeovers." Journal of Finance 46(1): 409. Seth, A. (1990). "Value Creation in Acquisitions: A Re-Examination of Performance
Issues." Strategic Management Journal 11(2): 99-115. Seth, A. and J. Easterwood (1993). "Strategic Redirection in Large Management Buyouts:
The Evidence from Post-Buyout Restructuring." Strategic Management Journal14(4): 251.
Shelton, L. M. (1988). "Strategic Business Fits and Corporate Acquisition: Empirical Evidence." Strategic Management Journal 9(3): 279.
Shleifer, A. and L. Summers (1988). Breach of trust in hostile takeovers: Causes and consequences. in: Corporate takeovers: Causes and consequences. A. Auerbach (Ed.). Chicago, IL, University of Chicago Press.
Singh, H. (1990). "Management Buyouts: Distinguishing Characteristics and Operating Changes Prior to Public Offering." Strategic Management Journal 11(4): 111.
Singh, H. (1993). "Challenges in Researching Corporate Restructuring." Journal of Management Studies 30(1): 147.
Singh, H. and C. A. Montgomery (1987). "Corporate Acquisition Strategies and Economic Performance." Strategic Management Journal 8(4): 377-386.
Smart, S. B. and J. Waldfogel (1994). "Measuring the Effect of Restructuring on Corporate Performance: The Case of Management Buyouts." Review of Economics & Statistics 76(3): 503.
Smith, A. (1990b). "The effects of leveraged buyouts." Business Economics 25(2): 19. Smith, A. J. (1990a). "Corporate ownership structure and performance." Journal of
Financial Economics 27(1): 143. Stulz, R. M. (1990). "Managerial discretion and optimal financing policies." Journal of
Financial Economics 26(1): 3. Taylor, W. (1992). "Crime? Greed? Big Ideas? What were the '80s about?" Harvard
Business Review(January-February): 32-45. Teece, D. J. and G. Pisano (1997). "Dynamic capabilities and strategic management."
Strategic Management Journal 18(7): 509. Thompson, R. S. and M. Wright (1991). "UK Management Buy-outs: Debt, Equity and
Agency Cost Implications." Managerial & Decision Economics 12(1): 15.

Bibliography 379
Venkatraman, N. and V. Ramanujam (1986). "Measurement of Business Performance in Strategy Research: A Comparison of Approaches." Academy of Management Review 11(4): 801.
Venture-Economics (1999). Investment benchmark report: European Private Equity. New York, Thomson Venture Economics.
Venture-Economics (2004). Private Equity Performance Continued Positive Growth in Q1 2004. New York, Thomson Venture Economics.
Villalonga, B. and R. H. Amit (2004). "How Do Family Ownership, Control, and Management Affect Firm Value?" EFA 2004 Maastricht Meetings Paper No. 3620(June 7, 2004).
von Hayek, F. A. (1932). "Kapitalaufzehrung." Weltwirtschaftlies Archiv XXXVI. Wagner, G., J. Pfeffer, et al. (1984). "Organizational demography and turnover in top
management groups." Administrative Science Quarterly 29: 74-92. Waite, S. and M. Fridson (1989). "Do leveraged buyouts pose big risks for the U.S.
financial system?" Mergers and Acquisitions March-April: 43-48. Warga, A., A. Warga, et al. (1993). "Bondholder losses in leveraged buyouts." Review of
Financial Studies 6(4). Waters, D. (1998). Essential Quantitative Methods: A Guide for Business. New York,
Addison Wesley Longman. Weber, R. P. (1994). Basic Content Analysis. International Handbooks of Quantitative
Applications in the Social Sciences: Research Practice. M. S. Lewis-Beck. London, Sage.
Weir, C. (1996). "Management buyouts and entrepreneurial opportunities." Management Decision 34(3): 23.
Weir, C. and D. Laing (1998). "Management buy-outs: The impact of ownership changes on performance." Journal of Small Business and Enterprise Development 5(3): 261-269.
Welpe, R. (2004). Dynamic Organizational Capabilities in Post-Acqusition Management: A Study of the European Banking Industry. Dissertation No. 2967. St. Gallen, Switzerland, University of St. Gallen.
Wernerfelt, B. (1984). "A Resource-Based View of the Firm." Strategic Management Journal 5(2): 171-180.
Wiersema, M. and K. Bantel (1992). "Top Management Team Demography and Corporate Strategic Change." Academy of Management Journal 35: 91-121.
Wiersema, M. F. and J. P. Liebeskind (1995). "The effects of leveraged buyouts on corporate growth and diversification in large firms." Strategic Management Journal16(6): 447.
Wilson (Ed.), N. (1992). ESOPs : Their Role in Corporate Finance and Performance.London, Macmillan.
Wright, M. (2001). "Firm rebirth: Buyouts as facilitators of strategic growth and entrepreneurship." Academy of Management Executive 15(1): 111.
Wright, M. and J. Coyne (1985). Management Buy-outs. Beckenham/London, Croom-Helm.
Wright, M. and K. Robbie (1996). "The investor-led buy-out: A new strategic option." Long Range Planning 29(5): 691.
Wright, M., K. Robbie, et al. (1998). Corporate restructuring, buy-outs, and managerial equity: The European dimension. in: The revolution of corporate finance. J. M. Stern, Chew, Donald H. (Eds.). Malden/MA, Oxford, Blackwell: 399-410.
Wright, M., S. Thompson, et al. (1992a). "Buy-Outs, divestment and leverage: Restructuring transactions and corporate governance." Oxford Review of Economic Policy 8(3): 58-69.
Bibliography 380
Wright, M., S. Thompson, et al. (1992b). "Venture Capital and management-Led, Leveraged Buy-Outs: a European Perspective." Journal of Business Venturing7(1): 47.
Wright, M., N. Wilson, et al. (1996). "The longer-term effects of management-led buy-outs." Journal of Entrepreneurial & Small Business Finance 5(3): 213.
Wruck, K. H. (1989). "Equity ownership concentration and firm value: Evidence from Private Equity Financings." Journal of Financial Economics 23(1): 3.
Wruck, K. H. (1990). "Financial distress, reorganization, and organizational efficiency." Journal of Financial Economics 27(2): 419.
Wruck, K. H. (1994a). "Financial policy, internal control, and performance Sealed Air Corporation's leveraged special dividend." Journal of Financial Economics 36(2): 157.
Wruck, K. H. (1994b). "Revco D.S., Inc. (A)." Harvard Business School Cases: 1. Wruck, K. H. and S.-A. Stephens (1994). "Safeway, Inc.'s Leveraged Buyout (A)." Harvard
Business School Cases: 1. Yelle, L. E. (1979). "The Learning Curve: Historical Review and Comprehensive Survey."
Decision Sciences 10(2): 302. Yin, R. K. (1994). Case Study Research: Design and Methods. Thousand Oaks, CA,
Sage. Zahra, S. A. and M. Fescina (1991). "Will leveraged buyouts kill U.S. corporate research &
development?" Academy of Management Executive 5(4): 7. Zollo, M. and H. Singh (2000). Post-acquisition strategies, integration capability and the
economic performance of corporate acqusitions. Research Paper, Philadelphia, PA, The Wharton School.
(Mueller 1969; DeAngelo and DeAngelo 1987; Conte and Svejnar 1988; Wruck 1990; Jensen,
Burkhardt et al. 1992; Wilson (Ed.) 1992; Wright, Thompson et al. 1992b; Opler 1993; Jones and
Kato 1995; Lei and Hitt 1995; Beaver 2001; Berg and Gottschalg 2003)
(Kaldor 1932; von Hayek 1932; Schiff 1933; Machlup 1935)
(Black and Gilson 1999) (Jeng and Wells 2000) (National Academy of Science 1989)
(Chambers 1998; Chaplinsky and Perry 2004) (Darwin 1859)

C U R R I C U L U M V I T A E
PERSONAL DETAILS
Address: Osterfeldweg 12a D-21077 Hamburg Germany E-mail: [email protected]
Nationality: German
Date/Place of Birth: December 9th, 1975 in Singapore
EDUCATION
Nov. 2000 – Aug. 2004 University of St. Gallen (HSG), Switzerland Doctoral Programme
Jan. 2003 – Dec. 2003 INSEAD, Fontainebleau
Visiting PhD Student & Research Associate INSEAD Buyout Research Center / Strategy Department
Aug. 2000 – Nov. 2000 INSEAD, Singapore
Research Associate
Project/Master Thesis: ‘Technopreneurship in Singapore’
April 1998 – Aug. 2000 Leipzig Graduate School of Management (HHL)
Diplom-Kaufmann / Graduate Degree Studies
Majors: Finance/Accounting, Strategic Management
Oct. 1999 – Jan. 2000 Ecole Supérieure de Commerce de Paris (ESCP-EAP), Paris
Exchange Semester Programme Corporate Finance Major
Jan. 1999 – Sept. 1999 Australian Graduate School of Management (AGSM), Sydney
M.B.A. / Joint Degree Program with HHL Majors: Finance/Accounting, Strategic Management
June 1999 – July 1999 MBA Summer School Program AGSM, Hong Kong
M.B.A. Summer School Corporate Finance Major
Oct. 1996 – Feb. 1998 University of Münster, Germany
Vordiplom / Undergraduate Degree Studies Business/Economics
Aug. 1992 – July 1993 Clinton High School, Clinton, TN, U.S.A.
Highschool Exchange / Graduation
Aug. 1988 – June 1995 Immanuel-Kant-Gymnasium, Hamburg
Abitur (German High School)

TUTORING
Oct – Dec 2003 Paris Graduate School of Management (ESG)
Supervisor for several M.B.A. Master thesis
SCHOLARSHIPS
April 1998 – July 2000 HHL – Scholarship of Henkel KGaA., Germany
Aug. – Nov. 2000 INSEAD – Haniel German National Merit Foundation
PROFESSIONAL EXPERIENCE
March 2001 – current J.P. Morgan, London / New York
Mergers & Acquisitions, Leveraged Finance
Broad transaction experience in Leveraged Buyouts
February – May 2000 Deutsche Bank Investment Banking, Frankfurt
Internship – Mergers & Acquisitions
July – September 1998 PriceWaterhouseCoopers Corporate Finance Consulting, Berlin
Internship – Corporate Finance
April – July 1998 Deutsche Bank & Chamber of Commerce Leipzig, Germany
Consulting Project
Feb. 1998 – April 1998 Arthur Andersen, Hamburg
Internship – Auditing
July 1997 – Sept. 1997 Boltze International, Hamburg
Internship – German Mittelstand, Finance and Marketing
May – July 1996 Hypo-Vereinsbank, Hamburg
Internship – Private Banking and Trading
PROFESSIONAL QUALIFICATIONS
March 2001 Securities and Futures Authority (SFA), United Kingdom
General Securities Representative
ORGANIZATIONS
INSEAD Buyout Research Center, Young Leaders Network, Academy of Management, American
Finance Association, HHL Alumni, AGSM Alumni
MILITARY SERVICE
July 1995 – April 1996 Corps No. 6, Breitenburg, Germany
German Military Service