25. high-resolution sequence stratigraphy, condensed ...€¦ · 25. high-resolution sequence...
TRANSCRIPT

McKenzie, J.A., Davies, P.J., Palmer-Julson, A., et al., 1993Proceedings of the Ocean Drilling Program, Scientific Results, Vol. 133
25. HIGH-RESOLUTION SEQUENCE STRATIGRAPHY, CONDENSED SECTIONS, AND FLOODINGEVENTS OFF THE GREAT BARRIER REEF: 0-1.5 MA1
Craig R. Glenn,2 John D. Kronen, Jr.,2 Phillip A. Symonds,3 Wuchang Wei,4 and Dick Kroon5
ABSTRACT
Examination of seismic reflection and core data between Sites 819 and 821 provides information about patterns ofsedimentation that result from repetitive fluctuations in relative sea level and climatic perturbations. On the basis of sequence-stratigraphic interpretations, we identify nine sequences bounded by sequence boundaries; each sequence contains lithologicallydistinct and relatively thin units that have been interpreted as condensed sections. Because of very high mixed carbonate-silici-clastic sedimentation rates in this region, resolution of third-, fourth-, and fifth-order changes of sea level is recognized. Onepredominant condensed section is identified within each sequence and is associated with the maximum flooding surface of thatsequence. These condensed sections are marked by increases in abundance of quartz, clay, and shallow-water bioclasts; increasesin nonreworked pristine glauconites; decreases in total carbonate abundance; and increases in magnetic susceptibility. Increasesin glauconite have been interpreted to indirectly reflect relative decreases in sedimentation rates, whereby sediment residencetime is prolonged within suboxic bacterial degradation zones. Increases in bioclasts within transgressive systems tracts areattributed to relatively rapid buildups of shallow-water reefal communities that accompanied punctuated flooding events; duringthese times shallow-water carbonate growth accelerated as reefal communities built upward rapidly to keep up with rising sealevel. Increases in quartz and clay contents during maximum flooding are thought to be tied to sediment starvation, wherebybackground clays and quartz contents are concentrated. Decreased accommodation potential during relative highstand phasespromoted progressive highstand systems tract progradation and sedimentation of reworked glauconites and terrigenous sands,silts, and clays. These depositional phases also are marked by increases in bioclastic sands that accompanied the progradational,seaward building events.
INTRODUCTION
The depositional characteristics and lithologies of condensed sec-tions have been variously described in the geologic literature fordecades. They are significant because they represent long periods ofgeologic time within a condensed lithologic unit. Condensed sectionsare thin marine units of pelagic to hemipelagic sediments characterizedby very low sedimentation rates, and are areally most extensive at thetime of maximum marine transgression; they are coincident withmarine flooding surfaces and, in particular, surfaces of maximumflooding. These sections are associated with apparent marine hiatuses,may occur as omission surfaces or marine hardgrounds, and arethought important because they tie the temporal stratigraphic frame-work found in open-ocean microfossil zonations to the physical stra-tigraphy of sequences in shallower/landward sections (Loutit et al.,1988). Condensed sections also are often characterized by authigenicminerals (glauconite, siderite, and phosphorite) and clay minerals andmay contain diverse and abundant planktonic and benthic microfossilassemblages, as well as wind-borne detritus (Loutit et al., 1988; Vailet al., 1991). In carbonate depositional settings, drowning of the shelfthat accompanies marine flooding results in sediment starvation, whichcan concentrate authigenic minerals and form a condensed section thatis often a shaly micritic package (Haq, 1991). In open ocean settingsbelow the calcite compensation depth, maximum flooding surfacescoincide with dissolution surfaces (Haq, 1991).
Here we consider the style and significance of the hallmarks ofcondensed sections that are present in forereef sediments of the upper
McKenzie, J. A., Davies, PJ., Palmer-Julson, A., et al, 1993. Proc. ODP, Sci. Results,133: College Station, TX (Ocean Drilling Program).
2 Department of Geology and Geophysics, School of Ocean and Earth Science andTechnology, University of Hawaii, Honolulu, HI 96822, U.S.A.
3 Division of Marine Sciences, Bureau of Mineral Resources, Geology and Geophys-ics, P.O. Box 378, Canberra City, ACT 2601, Australia.
4 Scripps Institution of Oceanography, La Jolla, CA, 92093, U.S.A.5 Department of Geology and Geophysics, University of Edinburgh, Edinburgh, EH9
3JW, United Kingdom.
slope and outer shelf of the Great Barrier Reef (GBR) transect,Leg 133, Sites 819 through 821. We discuss their relationship totiming and development with respect to sequence-stratigraphic archi-tecture, their lithologic character, and their significance to interpreta-tions of sea-level changes that affected the GBR margin in Pleistocenetime. Sedimentation rates along the margin are high, and the averageduration of many of the sequences appears to be clearly related tocyclicity in the Milankovitch waveband and to third-, fourth-, andfifth-order cycles of sea-level change (see Glenn et al., this volume).They thus serve as an excellent, expanded record (because of highsedimentation rates) within which to investigate sequence stratigra-phy and sequence condensation in a mixed depositional setting. Weprovide an interpretation of the condensed sections present in thesesediments and discuss the synthesis of our interpretations using theconcepts of seismic and sequence-stratigraphic analyses.
METHODS
Sequence-Stratigraphic Methodology
The sequence is the fundamental unit of sequence stratigraphy; itis made up of repetitive, genetically related strata bounded by surfacesof erosion or nondeposition (unconformities) and their correlativeconformities (Mitchum et al., 1977). In general, sequence boundariesare surfaces marked by a basinward shift of facies and onlap ofoverlying strata (Fig. 1) (Van Wagoner et al., 1988). Systems tractsare linkages of contemporaneous depositional systems (Brown andFisher, 1977) that designate up to three subdivisions within a se-quence; they are defined on the basis of types of bounding surfacesand their position within a sequence (Fig. 1; cf. Van Wagoner et al.,1988; Vail et al., 1991). Note that the time of initiation of a systemstract has been interpreted as a function of the interaction betweeneustasy, sediment supply, and tectonic subsidence, and, further, thateach is associated with a specific segment of the eustatic curve,although it has not been defined on the basis of that association(Fig. 1; Van Wagoner et al., 1988; Posamentier et al, 1988). For thisstudy we have assumed that tectonic subsidence for the interval
353

C.R. GLENN ET AL.
SURFACES
(SB) SEQUENCE BOUNDARIES(SB 1) = TYPE-1(SB 2) = TYPE-2
(DLS) DOWNLAP SURFACES(mfs) = maximum flooding surface
(TS) TRANSGRESSIVE SURFACE(First flooding surface above maximumregression)
LEGEND
SYSTEMS TRACTS
HST = HIGHSTAND SYSTEMS TRACTTST - TRANSGRESSIVE SYSTEMS TRACTLST = LOWSTAND SYSTEMS TRACT
LSF = LOWSTAND FANLSW = LOWSTAND WEDGE
SMW = SHELF MARGIN WEDGE SYSTEMS TRACT
LITHOFACIES
g SUPRATIDAL
[ 3 PLATFORM
[1] PLATFORM-MARGIN
GRAINSUPPORTSTONE/REEFS
[&] MEGABRECCIAS/SAND
|E] FORESLOPE
Q TOE-OF-SLOPE/BASIN
Figure 1. Summary schematic diagram showing distribution of the various stratigraphic surfaces, systems tracts, and lithofacies in a carbonate sequence framework,both in depth (A), and in time (B) (from Sarg, 1988). Note the lateral extent of sequence condensation in time and the stratigraphic position of the condensedsection at the maximum flooding surface in depth. Also note the rapid increase in sediment accommodation potential associated with the transgressive systemstract. Lithofacies interpretations are those from Sarg (1988) for an idealized carbonate depositional setting.
studied is thermal and linear (cf. Katz and Miller, this volume). Con-densed sections typically are formed at the maximum flooding surfacebetween formation of transgressive systems tract deposits and over-lying highstand systems tract deposits (Fig. 1). In a typical shelf/slopeprofile, a condensed section can range from a fossil- and glauconite-rich zone on the proximal shelf to a biostratigraphic gap toward thebasin (Haq, 1991). This condition appears to hold true at the GBRmargin, where at Site 819 it is relatively barren of glauconite com-pared with Site 821 (see below).
Before Leg 133, Symonds et al. (1983) originally divided the pack-age of sediments off the central GBR into five major seismic deposi-tional sequences that were separated by unconformities (down to ~l .5s). The upper four sequences were interpreted as major phases of lowsea-level progradation, the oldest one being of Oligocene age. Fearyet al. (1990) interpreted these sediments as latest Miocene to Holoceneprogradational sequences overlain by aggradational sequences.
Following Leg 133, we developed a sequence-stratigraphic analy-sis of the GBR transect based on principles and procedures of se-

HIGH-RESOLUTION SEQUENCE STRATIGRAPHY
quence stratigraphy (cf. Van Wagoner, 1988; Posamentier et al., 1988;Posamentier and Vail, 1988; Sarg, 1988; Vail, 1990; Van Wagoner etal., 1990; Vail et al., 1991; Haq, 1991). This procedure involvesintegration of seismic reflector configurations with downhole wire-line data, downcore sedimentology and geochemistry, biostratigra-phy, and magnetic susceptibility.
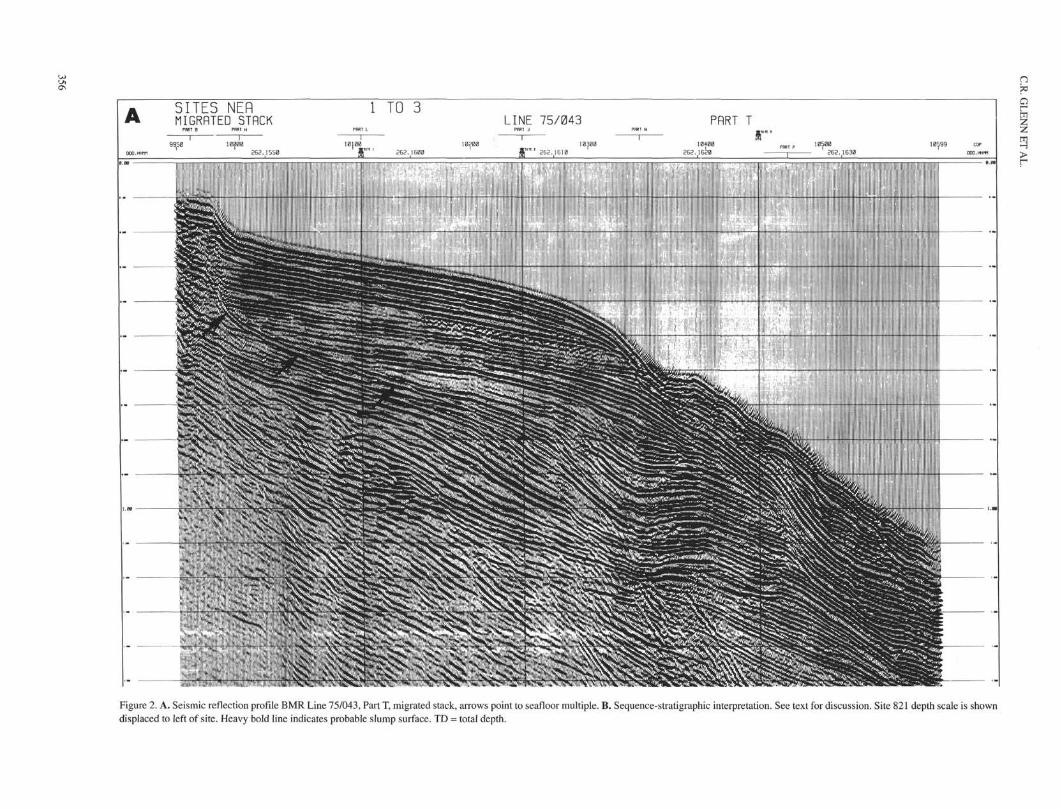
Our seismic/sequence-stratigraphic interpretation of Bureau ofMineral Resources (BMR) seismic Line 75/043 (Part T) facilitatedcorrelation between Sites 821 and 819 and identification of importantstratigraphic surfaces. Parts H, J, L, N, and P of Line 75/043 also wereanalyzed. These lines are part of a data set of about 131 km of24-channel, 80-in.3 water-gun, magnetic, and bathymetric data col-lected by the BMR during its northeastern Australia Rig Seismic sitesurvey in 1987.
Sedimentologic and Geochemical Methodology
Sedimentary variations in cores from Sites 819 and 821 weredefined by the following parameters: percentage total carbonate; per-centage >63-µm fraction of glauconite, siliciclastics (predominantlyof quartz and feldspar), nonforaminifer bioclasts (predominantly ofshell fragments—mostly mollusks, spicules, coralline algae and bryo-zoans, and siliciclastic grains); percentage total foraminifers, nanno-fossils, and tunicates; magnetic susceptibility; and downhole variationsin velocity, resistivity, and gamma-ray emission. A coarse fractionranking also was constructed on the basis of the percentage of grainsvisually estimated to be greater than 125 µm ( fine sand). All smearslides and smear slide analyses for each component were made by oneoperator to ensure the internal consistency of the results. Mineralidentifications were augmented by electron microprobe analysis ofgrain mounts. Total carbonate was determined by acidification-tiedcoulometric titration (cf. Huffman, 1977; Engleman et al., 1985). Totalcarbonate concentrations represent a combined data set of shipboardand shore-based results. Nannofossil abundances were determinedfrom samples spaced approximately every 1.5 m. Magnetic suscepti-bility and wireline data were collected during shipboard operations.Magnetic susceptibility is the ratio of induced magnetization to anapplied weak magnetic field and is proportional to magnetic mineralconcentration, which is usually a trace component of the terrigenousfraction of sediments, but which also may be affected by glauconiteand pyrite (cf. Glenn et al., this volume).
RESULTS
Sequences and Systems Tract Assignments
Sequence boundaries, maximum flooding surfaces, and transgres-sive surfaces are significant stratigraphic surfaces that can be tracedout as time lines on seismic reflection profiles (Vail et al., 1977). Thesesurfaces have been annotated on BMR seismic Line 75/043 (Part T)(Fig. 2) and represent our interpretation of the sequence stratigraphyof the GBR margin cored at Sites 819, 820, and 821. Employing thesequence-stratigraphic interpretation procedures outlined above, weidentified nine sequences within the cored section at these sites.Sequence 6 (Fig. 2) has been further divided into three higher-ordersequences (6A, 6B, and 6C). At Site 821, closest to the GBR platformedge, all nine sequences are each bound at their base and top by asequence boundary, and each contains a transgressive systems tract(TST), capped by a downlapped surface that separates it from anoverlying highstand systems tract (HST); this downlapped surface ischaracterized by thin units having unique sedimentologic properties(see below) and has been interpreted as the maximum flooding surface(MFS). Sequence 8 also contains a relatively thick lowstand systemstract (LST) and transgressive surface (TS) near the base of therecovered section. Site 819, the most basinward and deepest watersite of the transect, is an incomplete section compared with Site 821,because entire and partial sequences are missing. Sequence 6C termi-nates seaward of Site 820, as does the overlying TST section of
Sequence 6B. One cannot resolve from the available seismic datawhether these "missing" sequences are represented in Site 819 cores.Possibly, these sequences have become entirely condensed at Site819, or they may have been eroded and/or slumped out of the section.Further upsection, Sequences 5, 2, and 1 were interpreted as LSTdeposits, and their correlative TST and HST sections can be foundlandward of Site 819. Sequences 3 and 4 are missing in the vicinityof Site 819 because of nondeposition, lateral diversion, or erosion ofprobable LST accumulations.
Sequences 9 through 6 appear to be relatively progradationaldeposits and, as a result, have contributed to a relative outbuilding ofthe margin. Sequence 8 has a thick accumulation of sediments (com-posed of probable prograding wedge deposits) that represents a sig-nificant episode in slope margin outbuilding. We interpret this se-quence to be either a LST or a shelf margin wedge systems tract(SMW). The highstand phase of each of these sequences is also char-acterized by progradation and is marked at its base by downlappingreflectors along the MFS, as well as by a general thickening towardthe basin. Examination of seismic lines perpendicular to seismic LineT shows that the concavity and downwarping of reflectors in Se-quences 9 through 7 between Sites 819 and 820 result from progres-sive infilling of an upper-slope canyon (see Feary et al., this volume).In contrast, Sequences 5 through 1 appear to be aggradationally biasedcontinental shelf and upper-slope deposits, as evidenced at Sites 821and 820. Aggradational deposition is absent at Site 819, but correla-tively equivalent lowstand deposits are represented by Sequences 5,2, and 1.
Combined Sedimentologicand Sequence-Stratigraphic Results
The sediments recovered between Sites 819 and 821 are predomi-nantly unlithified, water-saturated mixed carbonate-siliciclastic sedi-ments composed of calcareous mudstones, wackestones, and pack-stones that grade to carbonate oozes and chalks. Predominant carbon-ate components are calcareous nannofossils, micrite, planktonic andbenthic foraminifers, and shallow-water bioclasts. Mixed with theseare varying percentages of terrigenous clay, quartz, feldspar, and otherdetrital grains. This terrigenous component is dominated by fine clayand some silt, with relatively minor proportions being greater than 63µm; the sand fraction is predominantly 63- to 125-µm, fine-grainedquartz. At Site 821, the most proximal to the reef edge, the sedimentsare rich in glauconite-infilled microfossils (see below).
Carbonate-Magnetic Susceptibility Variations
Figures 3 and 4 show the relationship among calcium carbonate,magnetic susceptibility variations, and other important sedimento-logic and geochemical parameters recorded at Sites 819 and 821. Notethat at Site 821 the character of each of these parameters appears tobe bracketed in a general way by each of the sequences delineated.The total carbonate curve paired with magnetic susceptibility revealsa well-defined pattern of cyclic sedimentation of bundles of relativelylow carbonate (low insoluble residues) and high magnetic suscepti-bility. At Site 821, these bundles tend to form couplets roughly cor-relating with the maximum flooding surfaces and, to a lesser extent,with the highstand systems tracts identified from our sequence strati-graphic analysis (Fig. 4). The rhythmic variations of these bundlesare tracked fairly closely by variation in the percentage >63-µmfraction and gamma-ray intensity at Site 819, and by the variations in>63-µm siliciclastics at both sites. These factors strongly suggest thatthe thickening of carbonate/magnetic susceptibility bundles is a resultof periodic increases of terrigenous materials to the margin. In addi-tion, the relationship of these bundles to the internal architecture ofsequences is especially clear at Site 821 (Fig. 4); the carbonate/mag-netic susceptibility bundles correlate with two discrete phases duringthe development of each TST/HST couplet, one in association withdownlapped maximum flooding surfaces when clays reach a maxima,
355
SITES NEnMIGRRTED STflCK
Figure 2. A. Seismic reflection profile BMR Line 75/043, Part T, migrated stack, arrows point to seafloor multiple. B. Sequence-stratigraphic interpretation. See text for discussion. Site 821 depth scale is showndisplaced to left of site. Heavy bold line indicates probable slump surface. TD = total depth.

SITE821 SITE! 820 SITE1819
HST-5TST-5
HST-6ATST-6A
----- TVTST-βC |HST-7
TST-7
Sequence boundary
HST Highstand systems tract
Maximum flooding surface/Condensed Section
TST Transgressive systems tract
TS Transgressive Surface
LST Lowstand systems tract
SB Sequence boundary
Figure 2 (continued).
ins

C.R. GLENN ET AL.
«e- a Mud CaCO3
(%)
Magneticsusceptibility
(I0"6 CGS Units)
>63µmBioclasts
(non-foraminifer)
>63µmSiliclastics
Shipboardinterpretations:
20 30 40 50 60
i Coarsening upward [ = Fining upward
>63µmGlauconite
Figure 3. Sedimentary, geochemical, gamma-ray, and sequence-stratigraphic data for Hole 819A. Coarsening and fining upward cycles are indicated.Nannofossil datums of Table 1 also are shown.
and the other with late highstand systems tract progradation. At Site821, therefore, these bundles appear to mimic relative changes in sealevel. At Site 819, however, the correspondence of variations to se-quence architecture is very poor because of normal faulting (and/orslumping), and depositional thinning. In addition, the dominance ofLSTs (Fig. 2B) at this more seaward site makes the correlationbetween Sites 819 and 821 difficult.
Glauconite
Maximum flooding surfaces and later highstand progradationalevents also are matched by discrete pulses of glauconite (and minorsiderite and iron oxyhydroxide) sedimentation of two different types.Along downlapped surfaces, which traditionally are interpreted assurfaces of maximum flooding and sequence condensation (cf. Loutitet al., 1988), the proportions of glauconite are abundant and particu-larly "pristine" (Fig. 4). These glauconites typically occur as well-preserved, nonabraded authigenic precipitates that fill in primaryintraparticle porosity, especially within foraminifer tests (Fig. 5). Thetests housing these precipitates are well preserved and show little orno evidence of reworking or abrasion (Fig. 5). In addition to occur-rences along downlapped surfaces, Figure 4 shows that pristine glau-conites also may occur as other, subordinate yet progressively increas-ing, pulses that likewise correlate with increases in the width of thepercentage of carbonate/magnetic susceptibility bundles, and per-centage of siliciclastics and bioclasts. These are found in the trans-
gressive systems tracts of Sequences 8, 6B, and 5, and have beeninterpreted to represent transgressive flooding surfaces (cf. Fig. 1). Incontrast, the glauconites associated with late-stage highstand systemstract progradational events are much less abundant, show substantialevidence for considerable reworking and transport, and are usuallynot contained within foraminifer tests (Fig. 6). The reworked natureof the particles can be attributed to the relatively higher-energydepositional setting associated with highstand progradation that ac-companied decreasing accommodation space. As discussed morefully below, these late-stage reworked glauconites also may reflectanother, perhaps diminished, stage of sequence condensation associ-ated with toplap reflector configurations.
Bioclasts (Nonforaminifer)
Accompanying increases in glauconite and siliciclastics alongflooding surfaces are increases in bioclasts that were derived fromshallow-water environments. At these positions, proportions of shal-low-water bioclasts increase despite decreases in total carbonatecontents (Fig. 4). Such increases within transgressive systems tractsare attributed to relatively rapid buildups of shallow-water reefalcommunities that accompanied punctuated flooding events. We sug-gest that, during these times, shallow-water carbonate growth accel-erated as reefal communities built rapidly upward to keep up withaccelerated rising sea level. These are akin to the keep-up carbonatecomplexes of Kendall and Schlager (1981) and Sarg (1988). Upon or
358

HIGH-RESOLUTION SEQUENCE STRATIGRAPHY
Seismicsequencestratigraphy
>63µmSiliclastics
>63µmBioclasts
(non-foraminifer)
Coarsefractionranking
Totalforaminifers
Totalnannofossils
Totaltunicates
Noü
FLβθD— — — fcfc•-
25 45 65 85 10 20
CaCOo Magneticsusceptibility
*Not seismicallyresolvable
ta\ suscepuoπuyK ' (I0"6 CGS units)
60 40 20 0>63µm
Glauconite
Figure 4. Sedimentary, geochemical, gamma-ray, and sequence-stratigraphic data for Hole 821 A. The sequence boundary at about 170 mbsf (ca. 0.92 Ma) separatesa largely progradational seismic package below from a largely aggradational seismic package above (cf. Fig. 1). Two kinds of glauconite are observed based ondegree of preservation: pristine and reworked. Pristine glauconite is associated with marine flooding surfaces and along condensed sections. Reworked glauconiteis associated with toplapped and highstand systems tract progradation. See text for discussion. Nannofossil datums of Table 1 also are shown.
shortly following attainment of maximum flooding, percentages ofshallow-water bioclast components diminished markedly. We attrib-ute this to either subsequent drowning or landward-backstepping ofthese communities as sea level reached a maximum.
During highstand deposition, decreased accommodation potentialpromoted progressive progradation and sedimentation of reworkedglauconites and terrigenous sands, silts, and clays. These depositionalphases also were marked by progressive upsection increases in bio-clastic components. We attribute these increases to highstand systemstract progradation and outbuilding of reef-derived material (Fig. 4).
Microfossils
Variations in total foraminifers, nannofossils, and tunicates alsoare shown in Figure 4. The variations in these components show aspiky character that in a general way appears to be grouped byabundance minima along sequence boundaries. The premise thatmicrofossil abundances tend to show dramatic increases in associa-tion with maximum flooding and sequence condensation (Loutit etal., 1988; Vail et al., 1991) is not borne out, however, for the mixedsediments of the GBR transect. We postulate that this is because ofthe increase in importance of carbonate sedimentation at this settingrelative to the dominance of siliciclastic detritus at sites where manyprevious sequence stratigraphic interpretations have been made (e.g.,Loutit et al, 1988; Posamentier et al., 1988; Posamentier and Vail,1988). In siliciclastic settings, sequence condensation is the naturalresult of the nearshore trapping of siliciclastic sands during maximumflooding. When this occurs, only fine-grained clays, minor silts, and
open-marine pelagic sedimentation occur. Microfossils become rela-tively more abundant during these times, because they are less dilutedby other sedimentary components; actual microfossil productivitymay, however, remain relatively unchanged. Within the low-latitude,carbonate-dominated setting of the GBR, however, lower rates of ter-rigenous supply, combined with increased rain rates of pelagic micro-fossils, may be so pronounced that it becomes increasingly difficultto detect such an effect. Indeed, at these relatively remote sites, onecan actually observe an increase in clay and silt in association withthe downlapped surface (Fig. 4).
Durations of Sea-level Cycles as Deduced from Sequence
Stratigraphy
Based on interpolated nannofossil age data (Table 1; also seeGlenn et al., this volume), the duration of these sequences ranges fromnearly third order (Sequence 5, 443 ka) through fourth order (Se-quence 1, 133 ka; Sequence 2,146 ka; Sequence 3, 102 ka; Sequence6, 173 ka; Sequence 7, 128 ka; Sequence 8, 249 ka; cycle ordernomenclature after Wornardt and Vail, 1991). Of these, high sedimen-tation rates associated with Sequence 6 allow for its combined seismicand sedimentologic sequence-stratigraphic subdivision into threefifth-order parasequences (Sequences 6A, 6B, 6C) with durations of88, 51, and 34 ka, respectively. The maximum flooding surface offifth-order Sequence 6B is coincident with the maximum floodingsurface of fourth-order Sequence 6. Relatively low sedimentationrates associated with Sequence 5 do not permit subdivision of thisunit on the basis of seismic data, nor on the basis of the bundling of
359

C.R. GLENN ET AL.
B
Figure 5. Smear slide photomicrographs of pristine glauconites from condensed sections in Hole 82 IB. A. Arrow points to planktonic foraminifer with glauconiteinfill; note delicate and undamaged architecture of test (Sample 133-821B-2H-1, 54-56 cm; horizontal dimension (HD) of photo = 1.25 mm). B. Bioclast withglauconite replacing internal sediment; note foraminiferal tests (arrow) within the glauconite (Sample 133-821B-2H-1, 54-56 cm; HD = 2.50 mm). C. Benthicforaminifer displaying early-stage glauconitization (Sample 133-821B-4H-6, 70-72 cm; HD = 1.25 mm). D. Glauconitized gastropod (Sample 133-821B-4H-6,70-72 cm; HD = 1.25 mm).
magnetic susceptibility-carbonate data. However, variations in glau-conite, siliciclastics, and bioclasts suggest that this near third-orderunit is composed of three or more higher-order sequences (Fig. 4).
DISCUSSION
Significance of Condensed Sections
Condensed sections, also known in the literature as condensedsequences and as beds that display stratigraphic condensation or se-quence condensation, have been identified and have been the subjectof investigation in numerous marine stratigraphic units found world-wide and of all ages postdating the Jurassic. These sections are ofsignificance and interest, because they represent a process of extremelyslow net sedimentation that continued over long periods of time. Sincethe 1930s and 1940s, such intervals have been recognized as charac-terized by the following features: (1) enrichment of well-preservedfossils and fossil fragments, (2) faunal mixing: fossils from differentpaleontological zones that were mixed up together within a bed, and(3) widespread distribution of sediments having negligible thicknesses(Heim, 1934; Rod, 1946). Since then, researchers have increasinglyrecognized that intervals of sequence condensation also frequentlywere marked by the occurrence and, in some instances, a high (evenminable) abundance of authigenic minerals (e.g., Glenn and Arthur,1988; Glenn, 1990). Of continuing debate, however, is how much
sediment reworking and winnowing contributes to the condensationprocess (e.g., Rod, 1946; Jenkyns, 1971; Kennedy and Garrison, 1975;Krajewski, 1984; Kidwell, 1991; Glenn and Arthur, 1988; Glenn et al.,1988; Burnett et al., 1988; Glenn and Arthur, 1990; Föllmi, 1990;Snyder et al., 1990).
With the advent of sequence stratigraphy in the last two decades,condensed sections have taken on new meaning and significance asan integral component in the stratigraphic architecture of sequencescontrolled by fluctuations in relative sea level (Jervey, 1988; Posa-mentier et al., 1988; Posamentier and Vail, 1988). Loutit et al. (1988)and their colleagues defined condensed sections (in light of sequencestratigraphy) as thin marine units of pelagic to hemipelagic sedimentsthat: (1) are characterized by very low sedimentation rates that areareally most extensive at the time of maximum transgression andcoincident with the surface of maximum flooding, (2) are associatedwith apparent marine hiatuses, and (3) occur as omission surfaces ormarine hardgrounds. Loutit et al. (1988) further stressed that con-densed sections are important, because they tie the temporal strati-graphic framework found in open-ocean microfossil zonations to thephysical stratigraphy of sequences in shallower continental marginsections. Today, condensed sections have become an integral part ofa sequence, no matter how those sequences are defined. For example,Galloway (1989) (see also Schlager, 1991) provided an alternativeapproach to defining sequences as depositional systems containing
360

HIGH-RESOLUTION SEQUENCE STRATIGRAPHY
Figure 6. Smear slide photomicrographs of reworked glauconites from highstand systems tract in Hole 82IB. A. Arrow points to reworked glauconite fragment(Sample 133-821B-10H-4, 70-72 cm; horizontal dimension (HD) of photo = 1.25 mm). B. Reworked and fragmented glauconitized foraminifer (Sample133-821B-10H-4, 70-72 cm; HD = 1.25 mm). C. Arrows point to reworked and abraded glauconitized foraminifer (Sample 133-821B-10H-4, 70-72 cm; HD =1.25 mm). D. Reworked and abraded fragments of foraminifers, bioclasts, and micrite with some scattered reworked glauconite grains (arrows) (Sample133-821B-13H-5, 70-72 cm; HD = 2.80 mm).
bypass and erosional surfaces (sequence boundaries of Mitchum et al.,1977, and Van Wagoner et al., 1988) bounded by hiatal surfaces(preserved as submarine unconformities or condensed sections) thatrecord maximum marine flooding. This "genetic sequence" providesan alternative sequence-stratigraphic unit that does not rely on thepresence or recognition of widespread subaerial unconformities causedby eustatic and relative falls of sea level.
Seismic-based models recognize condensed sections that resultfrom sediment starvation during times of maximum flooding. Theseoccur along the break that separates the transgressive and highstandsystems tracts. Assuming that seismic reflectors do indeed reflect timelines, sequence condensation may, hypothetically, also occur any-where that reflectors converge, such as along surfaces of onlapping,back-stepping, downlapping, and toplapping (Fig. 7). For example,this may be reflected in outcrop studies that link condensed sectionsto a variety of shallow- and deep-water settings, to starvations thatcoincide with regressions characterized by sediment bypassing, andto transgression (e.g., Rod, 1946; Jenkyns, 1971; Einsele andSeilacher, 1982; Bayer and Seilacher, 1985; Kidwell, 1991). On thesingular basis of temporal variations in glauconite abundance, ourdata suggest that sequence condensation is predominantly limited tomarine flooding and maximum flooding surfaces in this mixed depo-sitional setting. However, the systematic occurrence of reworked
Table 1. Summary of mean depths of biostratigraphic horizonsfrom Sites 819,820, and 821.
Datum
LO Emiliania Huxleyi acmeLO Emiliania huxleyiHO Psuedoemiliania lacunosaHO Gephyrocapsa spp. C-DHO Gephyrocapsa spp. A-BHO Helicosphaera selliiHO Calcidiscus macintyrei
Age (Ma)
0.080.2750.4650.921.101.271.48
Site 819
8.429.432.456.0
116.87189.2
>400
Site 820
12.135.8
107.1163.6260.3271.7
>400
Site 821
39.3123.1176.8270.1279.2
>400
Notes: Biostratigraphic age assignments updated from Berggren et al., 1985. Theage scales calculated for these cores assume a constant sedimentation ratebetween each age datum. LO = lowest occurrence, HO = highest occurrence.
glauconites within the upper portions of highstand systems tracts alsomay reflect relatively minor episodes of starvation and bypassing thatoccur in association with toplapping deposits (Fig. 7). In this portionof the highstand systems tract, sequence condensation may be com-mon because here toplapping reflectors (time lines) converge. In sum,the actual distribution of condensed deposits within siliciclastic andmixed carbonate/siliciclastic sequences is probably more complexthan has been depicted by recent models.
361

C.R. GLENN ET AL.
Prograding sliciclastics, bioclasts, andreworked authigenic minerals
POTENTIAL
CONDENSED DEPOSITS^
Intrasequence architectureSite 821
Retrograde and downlappedin-situ authigenic minerals,"flood bioclasts", and siliclastics
SEQUENCEBQW>PARY DOWNLAP L J
B
DOWNLAP SURFACE / T S U N C A T X N = B A C K L A P
Tranβgr tβlvβ Systems Tract
Reworked glauconites
Pristine glauconites
Figure 7. Intrasequence architecture at Site 821. A. Possible positions of sequence condensation within an idealized depositional sequence (stipples) (after Kidwell,
1991). B. Schematic illustration of the placement of nonreworked pristine and reworked glauconites recovered at Site 821. Pristine glauconites form within
transgressive systems tracts and at the maximum flooding surface, whereas reworked glauconites are found within highstand systems tracts. C. The timing of
systems tracts development with respect to one cycle of sea-level change. LST = lowstand systems tract, TST = transgressive systems tract, HST = highstand
systems tract, TS = transgressive surface, MFS = maximum flooding surface, SB = sequence boundary. Dots on the sea-level curve represent locations of glauconite.
HST
MFS —
TST
• * «
a à.
Significance of Glauconite in Condensed Sections
Glauconites occur mainly in water depths of 100 to 500 m onmodern seafloors and can make up 10% to 90% of the sediments ofthe outer shelf and upper slope between water depths of 200 and 300 m(Odin and Matter, 1981), although some of these may be relict.Glauconites are mineralogically diverse because of highly variablephysical and chemical properties; their formation appears to be con-trolled by a delicate balance between degree of physical confinementand the amount of ionic exchange between the microenvironment, suchas within foraminiferal shells, and ambient open seawater (Odin andMatter, 1981). In addition, they may form directly from pore waterswithin suboxic bacterial zones in association with iron reduction(Glenn and Arthur, 1988; 1990). Glauconites are unique, because theycontain iron in both its reduced and oxidized states, and are thuscharacteristic of weakly oxidizing to mildly reducing marine environ-ments (cf. Glenn and Arthur, 1988; 1990). This prerequisite appears todictate where and when glauconite may form. During early diagenesisof marine sediments, iron may be reduced and solubilized by iron-reducing bacteria within the zone of suboxic diagenesis (cf. Froelichet al., 1979; Berner, 1980) or within the microreducing environmentsprovided by foraminifer tests. We think the reason glauconites are sotypically encountered within condensed intervals is because slow ratesof sedimentation effectively increase the residence time for particlesbefore they encounter the more fully reducing conditions associatedwith bacterial sulfate reduction; when this takes place, sulfate isreduced to produce sulfide, which rapidly sequesters available reducediron to form pyrite, not glauconite. Slow rates of sedimentation (and
organic carbon accumulation) effectively expand the zone of suboxicdiagenesis and increase the length of time a given parcel of sedimentwill have before encountering dissolved sulfide at depth.
Climatic Overprints
In this compilation, we have assumed that sequence-stratigraphicarchitectures observed along the GBR transect are a result of vari-ations in accommodation potential that result from the interplaybetween subsidence, sediment supply, and changes in eustatic sealevel. We have, however, largely ignored another major variable thatmay have greatly impacted sedimentation in this area during the past1.5 Ma: climate. Collectively, the data presented here indicate thatcondensed sections within the GBR transect are thin units that occuralong downlapped surfaces and that are characterized by increases inclays and quartz, pristine glauconite, and shallow-water bioclasts. Weinterpret the abundance of glauconite to reflect overall diminishedsedimentation rates and attribute the abundance of bioclasts to theestablishment and initial flourishing of shallow-water reefal commu-nities along the outer margin during marine flooding. In light of thegeneral interpretation procedures of sequence stratigraphy, increasesin clays and quartz during these times seem somewhat puzzling; thesemodels generally depict a minimum in the influence of terrigenoussedimentation during these times. We suggest, therefore, that thereason for this apparent dichotomy is related to sedimentary over-printing caused by climate change.
We envision two possible scenarios that may explain the increasesin clays and quartz in association with maximum flooding at these
362

HIGH-RESOLUTION SEQUENCE STRATIGRAPHY
sites. It remains possible that, accompanying maximum flooding,hinterlands were exposed to increases in rainfall and weathering, andthat terrigenous components thus were increasingly flushed toward thebasin during these times. Our preferred interpretation, however, is thatclays represent sediment starvation, and that the quartz we are observ-ing in these sections may represent a background eolian componentthat becomes relatively concentrated during times of sequence conden-sation. Clays are typical of most condensed sections because duringtimes of maximum flooding most siliciclastic detritus is trapped innearshore depositional settings. Today, dust storms in Australia are avast source for eolian sediments and also are capable of transportinglarge particles. For example, a large storm in 1928 carried an averagedistribution of up to 30 g/m2 over New Zealand, about 2000 km away(Glasby, 1971). A significant thrust of our ongoing study of thesesediments is aimed at trying to differentiate these possible mechanisms(cf. Glenn et al., this volume).
Temporal Validity
Our evidence for sequence condensation within these sedimentshas been somewhat artificial, because we have, in fact, no actualtemporal data to indicate that the sediments along downlapped sur-faces represent hiatuses or abnormally long periods of geologic time.This is because our biostratigraphic zonations are much wider thanthe spacings of the stratigraphic sequences they contain. The infer-ence that the thin units associated with the downlapped surfacesreflect episodes of sequence condensation is based on recent se-quence-stratigraphic models and the common association betweensignificant accumulations of glauconites and other authigenic mineralphases and markedly reduced sedimentation rates in the geologicrecord. Further testing of the true temporal significance of thesehorizons awaits refined age dating.
SUMMARY AND CONCLUSIONS
1. Great Barrier Reef forereef sediments contain a high-resolutionPleistocene record of mixed siliciclastic-carbonate sedimentation.
2. Nine sequences are recognizable from available seismic dataand have been penetrated by drilling. Based on interpolated nanno-fossil age data, the duration of these sequences ranges from nearlythird order (Sequence 5, 443 ka) through fourth order (Sequence 1,133 ka; Sequence 2,146 ka; Sequence 3,102 ka; Sequence 6,173 ka;Sequence 7, 128 ka; Sequence 8, 249 ka). Of these, high sedimenta-tion rates associated with Sequence 6 allow for its combined seismicand sedimentologic sequence stratigraphic subdivision into threefifth-order parasequences (Sequences 6A, 6B, 6C) with durations of88, 51, and 34 ka, respectively. The maximum flooding surface offifth-order Sequence 6B is coincident with the maximum floodingsurface of fourth-order Sequence 6. Relatively low sedimentationrates associated with Sequence 5 do not permit subdivision of thisunit on the basis of seismic data, nor on the basis of the bundling ofcarbonate-magnetic susceptibility data. However, variations in glau-conite, siliciclastics, and bioclasts suggest that this near third-orderunit is composed of three or more higher-order sequences.
3. Terrigenous influx to the GBR forereef setting, as indicated bysimultaneous increases in magnetic susceptibility, insoluble residues,gamma-ray activity, and siliciclastic sands, dramatically increasedduring discreet flooding events and reached a maxima in associationwith maximum flooding along downlapped surfaces resolvable inseismic data. In traditional sequence stratigraphic interpretations,these downlapped surfaces mark maximum episodes of sequencecondensation and terrigenous starvation within each systems tract.The data presented here, however, suggest that, within this mixedterrigenous-carbonate depositional setting, rates of terrigenous inputreached a maxima during these times. We suggest that this input isclimate modulated.
4. Increases in terrigenous influx during flooding events also arecharacterized by increases in authigenic glauconite mineralizationand increases in shallow-water bioclast influx. At these positions,proportions of shallow-water bioclasts increase despite decreases intotal carbonate contents.
5. Increases in bioclasts within transgressive systems tracts areattributed to relatively rapid buildups of shallow-water reefal com-munities that accompanied punctuated flooding events. Although thepercentage of total carbonate decreased during these episodes, wesuggest that during these times shallow-water carbonate growth ac-celerated as reefal communities built upward rapidly to keep up withrising sea level. These rapid buildups are akin to the keep-up carbon-ate complexes of Kendall and Schlager (1981) and Sarg (1988).
6. Upon, or shortly following, attainment of maximum flooding,percentages of shallow-water bioclast components diminished mark-edly. These decreases in bioclasts have been interpreted as the resultof either the progressive or incipient drowning of shallow-water reefs(cf. Kendall and Schlager, 1981) or their landward back-steppingaway from the forereef depositional sites.
7. Decreased accommodation potential during relative highstandphases promoted progressive highstand systems tract progradationand sedimentation of reworked glauconites and terrigenous sands,silts, and clays. These depositional phases also were marked byincreases in bioclastic sands that accompanied progradational, sea-ward building events.
8. Increases in microfossil abundances do not appear to relate toformation of condensed sections in this mixed carbonate-terrigenousdepositional setting.
9. However, whereas the relative rising and falling of sea levelpredicted from our data are internally consistent, the relative coarse-ness of biostratigraphic datums, the general paucity of lowstandsystems tracts at Site 821, and our assumptions of constant thermalsubsidence make references to the absolute timings of floodingevents tenuous. Thus, correspondence of these awaits refined agecontrol and testing relative to other, similarly resolvable, continentalmargin records.
ACKNOWLEDGMENTS
Financial support for this project was provided by grants from theU.S. Scientific Advisory Committee (USSAC). We thank GregoryMoore and Michael Arthur for helpful discussions and Karl Föllmiand Isabel Montanez for thorough reviews of the manuscript. To ourco-chiefs, colleagues, and the ship and drilling crews of JOIDESResolution, we express our gratitude for their helpfulness and coop-eration. This is a contribution to IGCP Project 325 Paleoceanographyand Authigenic Minerals and is UH SOEST Contribution No. 3172.
REFERENCES*
Bayer, U., and Seilacher, A. (Eds.), 1985. Sedimentary and EvolutionaryCycles: Berlin (Springer-Verlag), Lecture Notes and Earth Sci., 1.
Berggren, W.A., Kent, D.V., and Van Couvering, J.A., 1985. The Neogene:Part 2. Neogene geochronology and chronostratigraphy. In Snelling, NJ.(Ed.), The Chronology of the Geological Record. Geol. Soc. LondonMem., 10:211-260.
Berner, R.A., 1980. Early Diagenesis: A Theoretical Approach: Princeton, NJ(Princeton Univ. Press).
Brown, L.F., and Fisher, W.L., 1977. Seismic stratigraphic interpretation ofdepositional systems. In Payton, C.E. (Ed.), Seismic Stratigraphy: Appli-cations to Hydrocarbon Exploration. AAPG Mem., 26:213-248.
Burnett, W.C., Baker, K.B., Chin, P.A., McCabe, W., and Ditchburn, R., 1988.Uranium-series and AMS 14C studies of modern phosphatic pellets fromPeru shelf muds. Mar. Geol, 80-3/4:215-230.
Abbreviations for names of organizations and publications in ODP reference lists followthe style given in Chemical Abstracts Service Source Index (published by AmericanChemical Society).

C.R. GLENN ET AL.
Einsele, G., and Seilacher, A. (Eds.), 1982. Cycle and Event Stratification:Berlin (Springer-Verlag).
Engleman, E.E., Jackson, L.L., and Norton, D.R., 1985. Determination ofcarbonate carbon in geological materials by coulometric titration. Chem.Geol, 53:125-128.
Feary, D.A., Pigram, C.J., Davies, P.J., Symonds, P.A., Droxler, A.W., andPeerdeman, F, 1990. Ocean Drilling Program—Leg 133 safety package.Bur. Miner. Res. Aust. Rec, 1990/6.
Föllmi, K.B., 1990. Condensation and phosphogenesis; example of the Helveticmid-Cretaceous (northern Tethyan margin). In Notholt, A.J.G., and Jarvis,I. (Eds.), Phosphorite Research and Development. Geol. Soc. Spec. Publ.London, 52:237-252.
Froelich, P.N., Klinkhammer, G.P., Bender, M.L., Luedtke, N.A., Heath, G.R.,Cullen, D., Dauphin, P., Hartman, B., Hammond, D., and Maynard, V., 1979.Early oxidation of organic matter in pelagic sediments of the easternEquatorial Atlantic: suboxic diagenesis. Geochim. Cosmochim. Acta,43:1075-1090.
Galloway, W.E., 1989. Genetic stratigraphic sequences in basin analysis I:architecture and genesis of flooding-surface bounded depositional units.AAPG Bull., 13:125-142.
Glasby, G.P., 1971. The influence of aeolian transport of dust particles onmarine sedimentation in the Southwest Pacific. J. R. Soc. N.Z., 1:285-300.
Glenn, C.R., 1990. Depositional sequences of the Duwi, Sibaiya and Phos-phate formations, Egypt: phosphogenesis and glauconitization in a LateCretaceous epeiric sea. In Notholt, A.J.G., and Jarvis, I. (Eds.), Phos-phorite Research and Development. Geol. Soc. Spec. Publ. London,52:205-222.
Glenn, C.R., and Arthur, M.A., 1988. Petrology and major element geochemis-try of Peru margin phosphorites and associated diagenetic minerals: authi-genesis in modern organic-rich sediments. Mar. Geol., 80-3/4:231-267.
, 1990. Anatomy and origin of a Cretaceous phosphorite-greensandgiant, Egypt. Sedimentology, 37:123-154.
Glenn, C.R., Arthur, M.A., Yeh, H.W., and Burnett, W C , 1988. Carbonisotopic composition and lattice-bound carbonate of Peru-Chile marginphosphorites. Mar. Geol., 80-3/4:287-307.
Haq, B.U., 1991. Sequence stratigraphy, sea-level change, and significance forthe deep sea. Spec. Publs. Int. Assoc. Sedimentol., 12:1-36.
Heim, A.A., 1934. Stratigraphische ^Condensation. Eclogae Geol. Helv.,27:372-383.
Huffman, E.W.D., 1977. Performance of a new automatic carbon dioxidecoulometer. Microchem. J., 22:567-573.
Jenkyns, H.C., 1971. The genesis of condensed sequences in the TethyanJurassic. Lethaia, 4:327-352.
Jervey, M.T., 1988. Quantitative geological modeling of siliciclastic rocksequences and their seismic expression. In Wilgus, C.K., Hastings, B.S.,et al. (Eds.), Sea-Level Changes: An Integrated Approach. Spec. Publ.—Soc. Econ. Paleontol. Mineral., 42:47-69.
Kendall, C.G.St.C, and Schlager, W., 1981. Carbonates and relative changesin sea level. Mar. Geol, 44:181-212.
Kennedy, W.J., and Garrison, R.E., 1975. Morphology and genesis of nodularphosphates in the Cenomanian glauconite marl of South East England.Lethaia, 8:339-360.
Kidwell, S.M., 1991. Condensed deposits in siliciclastic sequences: expectedand observed features. In Einsele, G., Ricken, W., and Seilacher, A. (Eds.),Cycles and Events in Stratigraphy: Berlin (Springer-Verlag), 682-695.
Krajewski, K.P., 1984. Early diagenetic phosphate cements in the Albiancondensed glauconitic limestone of the Tatra Mountains, Western Carpa-thians. Sedimentology, 31:443-470.
Loutit, T.S., Hardenbol, J., Vail, PR. and Baum, G.R., 1988. Condensedsections: the key to age determination and correlation of continental marginsequences. In Wilgus, C.K., Hastings, B.S., et al. (Eds.), Sea-LevelChanges: An Integrated Approach. Spec. Publ.—Soc. Econ. Paleontol.Mineral., 42:183-213.
Mitchum, R.M., Jr., Vail, PR., and Thompson, S., Ill, 1977. Seismic stratigra-phy and global changes of sea level, Part 2: the depositional sequence asa basic unit for stratigraphic analysis. In Payton, C.E. (Ed.), SeismicStratigraphy—Applications to Hydrocarbon Exploration. AAPG Mem.,26:53-62.
Odin, G.S., and Matter, A., 1981. Die glauconarium origine. Sedimentology,28:611-643.
Posamentier, H.W, Jervey, M.T., and Vail, PR., 1988. Eustatic control onclastic deposition. I: conceptual framework. In Wilgus, C , Hastings, B.S.,Kendall, C.G.S.C, Posamentier, H.W., Ross, CA., and Van Wagoner, J.C.(Eds.), Sea-level Changes: An Integrated Approach: Spec. Publ.—Soc.Econ. Paleontol. Mineral., 42:109-124.
Posamentier, H.W, and Vail, PR., 1988. Eustatic controls on clastic deposition.II—sequence and systems tract models. In Wilgus, C.K., Hastings, B.S.,et al. (Eds.), Sea-Level Changes: An Integrated Approach. Spec. Publ.—Soc. Econ. Paleontol. Mineral., 42:124-154.
Rod, E., 1946. Uber ien fossillager in oberen Malm der Melchtaleralpen.Eclogae Geol. Helv., 39:177-198.
Sarg, J.F., 1988. Carbonate sequence stratigraphy. In Wilgus, C.K., Hastings,B.S., Kendall, C.G.St.C, Posamentier, H.W., Ross, CA., and VanWagoner, J.C. (Eds.), Sea-Level Changes: An Integrated Approach. Spec.Publ.—Soc. Econ. Paleontol. Mineral., 42:155-181.
Schlager, W., 1991. Depositional bias and environmental change—importantfactors in sequence stratigraphy. Sediment. Geol, 70:109-130.
Snyder, S.W., Hine, A.C., and Riggs, S.R., 1990. Carolina continental margin:Part 2. The seismic stratigraphic record of shifting Gulf Stream flow pathsin response to Miocene glacio-eustasy: implications for phosphogenesisalong the North Carolina continental margin. In Burnett, W.C., and Riggs,S.R. (Eds.), Phosphate Deposits of the World (Vol. 3): Cambridge (Cam-bridge Univ. Press), 396-423.
Symonds, RA., Davies, PJ., and Parisi, A., 1983. Structure and stratigraphyofthe central Great Barrier Reef. BMR J. Aust. Geol. Geophys., 8:277-291.
Vail, P.R., 1990. Sequence stratigraphic interpretation of seismic, well andoutcrop data. AAPG Short Course.
Vail, PR., Audemard, F., Bowman, S.A., Eisner, P.N., and Perez-Cruz, G.,1991. The stratigraphic signatures of tectonics, eustasy, and sedimentation.In Einsele, G., Ricken, W., and Seilacher, A. (Eds.), Cycles and Events inStratigraphy: Amsterdam (Elsevier), 617-681.
Vail, P.R., Todd, R.G., and Sangree, J.B., 1977. Seismic stratigraphy and globalchanges of sea level, Part 5: chronostratigraphic significance of seismicreflections. In Payton, C.E. (Ed.), Seismic Stratigraphy—Applications toHydrocarbon Exploration. AAPG Mem., 26:99-116.
Van Wagoner, J.C, Mitchum, R.M., Campion, K.M., and Rahmanian, V.D.,1990. Siliciclastic Sequence Stratigraphy in Well Logs, Cores, and Out-crops: Concepts for High-Resolution Correlation of Time and Fades.AAPG, Methods Explor. Ser., 7.
Van Wagoner, J.C, Posamentier, H.W, Mitchum, R.M., Vail, PR., Sarg, J.F.,Loutit, T.S., Hardenbol, J., 1988. An overview ofthe fundamentals ofthesequence stratigraphy and key definitions. In Wilgus, C.K., Hastings, B.S.,Kendall, C.G.St.C, Posamentier, H.W., Ross, CA., and Van Wagoner, J.C.(Eds.), Sea-Level Changes: An Integrated Approach. Spec. Publ.—Soc.Econ. Paleontol. Mineral., 42:39-45.
Wornardt, W.W., and Vail, PR., 1991. Tentative revision of the global Plio-cene-Pleistocene Sequences based on sequence stratigraphy in the Gulf ofMexico. AAPG Bull, 75:1425.
Date of initial receipt: 28 April 1992Date of acceptance: 10 December 1992Ms 133SR-241
364