2.4 cautions about correlation and regression. residuals (again!) recall our discussion about...
Post on 19-Dec-2015
221 views
TRANSCRIPT
2.4 Cautions about Correlation and
Regression

Residuals (again!)
Recall our discussion about residuals- what is a residual?
The idea for line of best fit was to “minimize” the residuals.
While this can always be done, when is the line of best fit a good fit (as opposed to some curve)?
Residual Plots
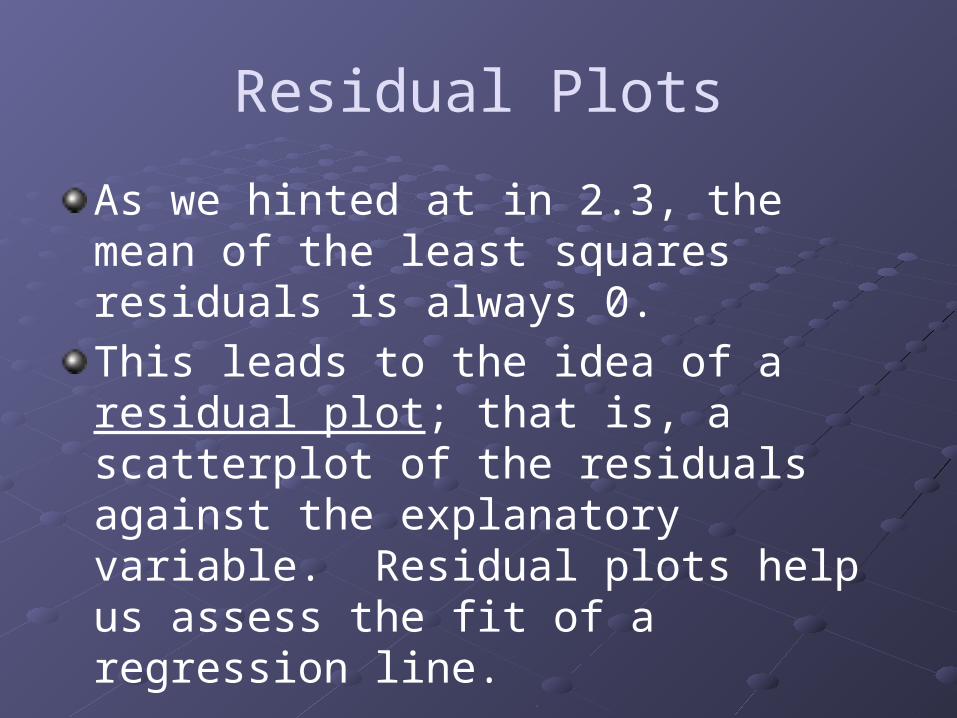
As we hinted at in 2.3, the mean of the least squares residuals is always 0.
This leads to the idea of a residual plot; that is, a scatterplot of the residuals against the explanatory variable. Residual plots help us assess the fit of a regression line.
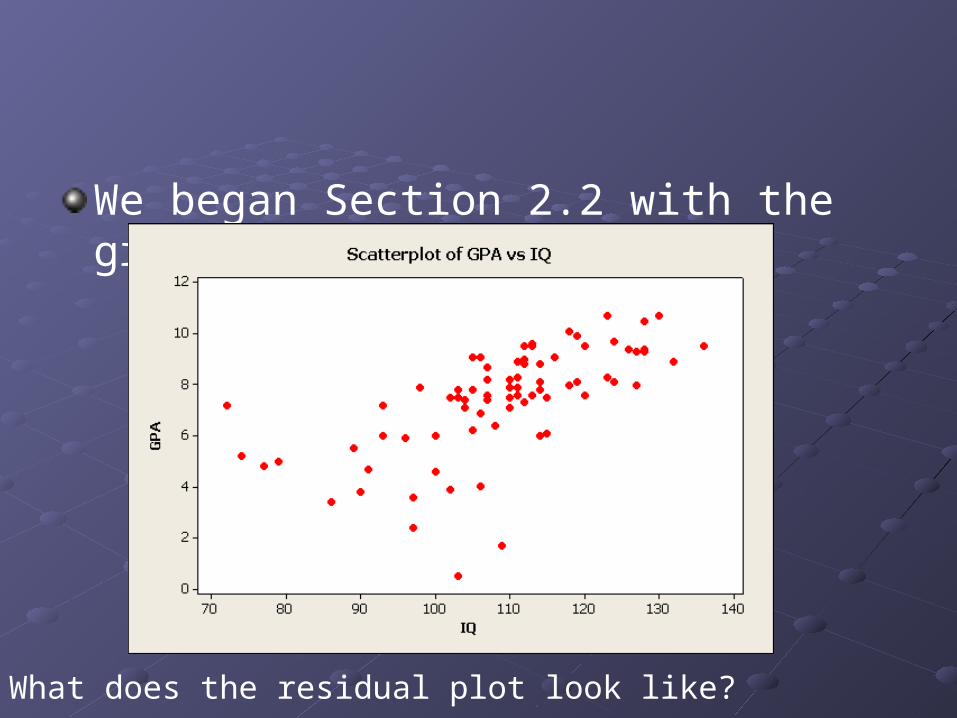
We began Section 2.2 with the graph
What does the residual plot look like?
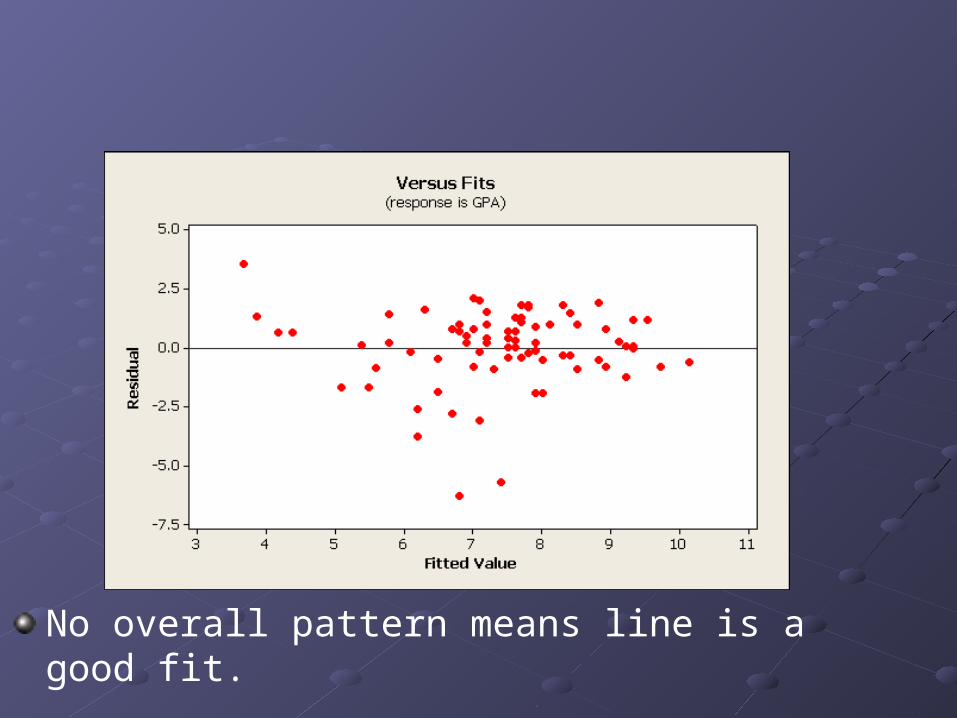
No overall pattern means line is a good fit.

We also looked at this graph in section 2.3
Looks great!
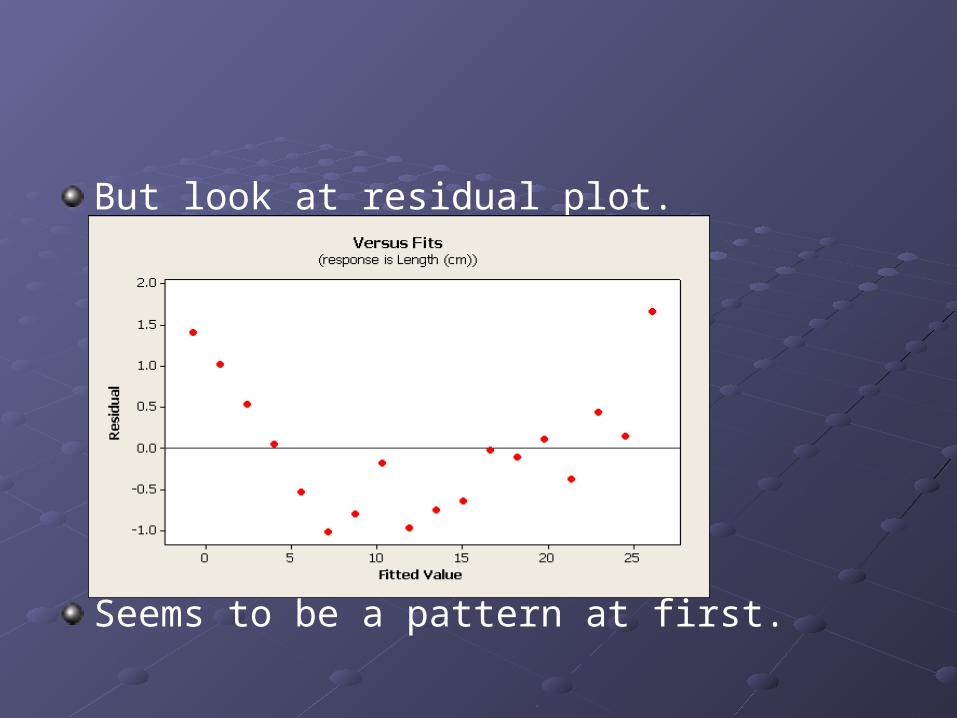
But look at residual plot.
Seems to be a pattern at first.

Consider the following data:
X Y1 42 203 63 55 66 58 19 220 2
Line of best fit is y = 8.71 - 0.499 x.
(2, 20) and (20,2) seem problematic.

X Y1 4
3 63 55 66 58 19 220 2
Line of best fit is y = 5.51 - 0.256x

X Y1 42 203 63 55 66 58 19 2
Line of best fit is y = 11.2 - 1.10 x
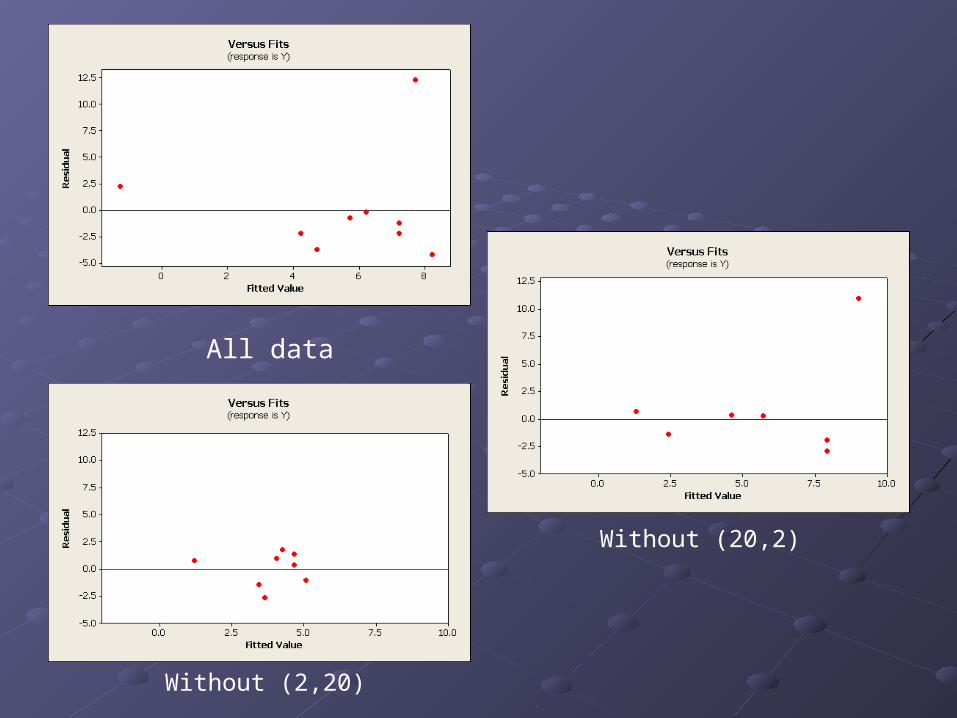
All data
Without (2,20)
Without (20,2)

What was the point of all that?
Eliminating a value which has a large deviation in y made for the best residual plot, and it didn’t change the least squares regression much.
Eliminating a value which has a large deviation in x considerably changed the least squares regression line.
An observation is influential for a calculation if removing it would drastically change the result of the calculation.
Usually an extreme outlier in the x direction is considered influential but not an extreme outlier in the y direction.
This leads to the truth that while correlation can imply causation, it does not necessarily.

Lurking Variable
When we consider ice cream sales and drowning deaths these variables, they will show a positive and potentially statistically significant correlation.
Certainly there is no causal relationship here, despite what the data implies.
There is a third variable that is “lurking” behind all of this; namely summertime.
A lurking variable is a variable that is not among the explanatory or response variables in a study and still may yet influence the interpretation of relationships among those variables.

2.5 Data Analysis for Two-Way Tables
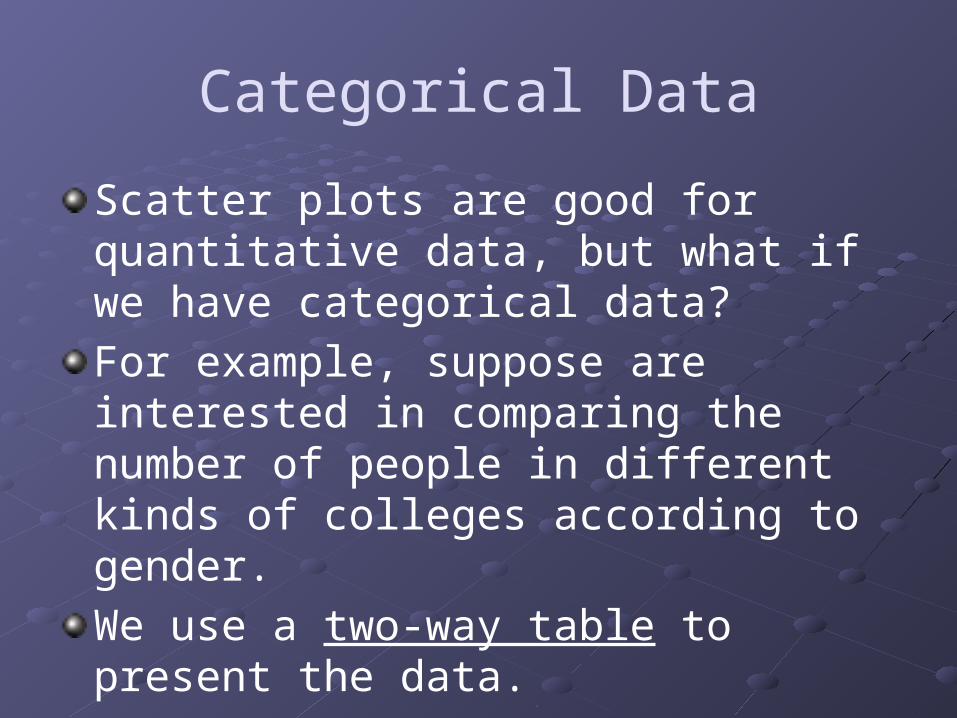
Categorical Data
Scatter plots are good for quantitative data, but what if we have categorical data?
For example, suppose are interested in comparing the number of people in different kinds of colleges according to gender.
We use a two-way table to present the data.

Status Men (in thousands) Women (in thousands)
Two-year college, full-time 890 969
Two-year college, part-time 340 403
Four-year college, full-time 2897 3321
Four-year college, part-time 249 383
Graduate school 306 366
Vocation school 160 137
Easy to read off data. Could have included a “total” row.
This two-way table gives the actual numbers. Perhaps percentages would be more helpful. The following is a joint distribution.

Status Men Women
Two-year college, full-time .085 .093
Two-year college, part-time .033 .039
Four-year college, full-time .278 .319
Four-year college, part-time .024 .037
Graduate school .029 .035
Vocation school .015 .013
This is a joint distribution. It is obtained by dividing the cell entry by the total sample size. Notice that the sum of all the values should be 1 (sometimes there is slight round-off error).
If we are interested in the percentage of each variable, we use a marginal distribution.
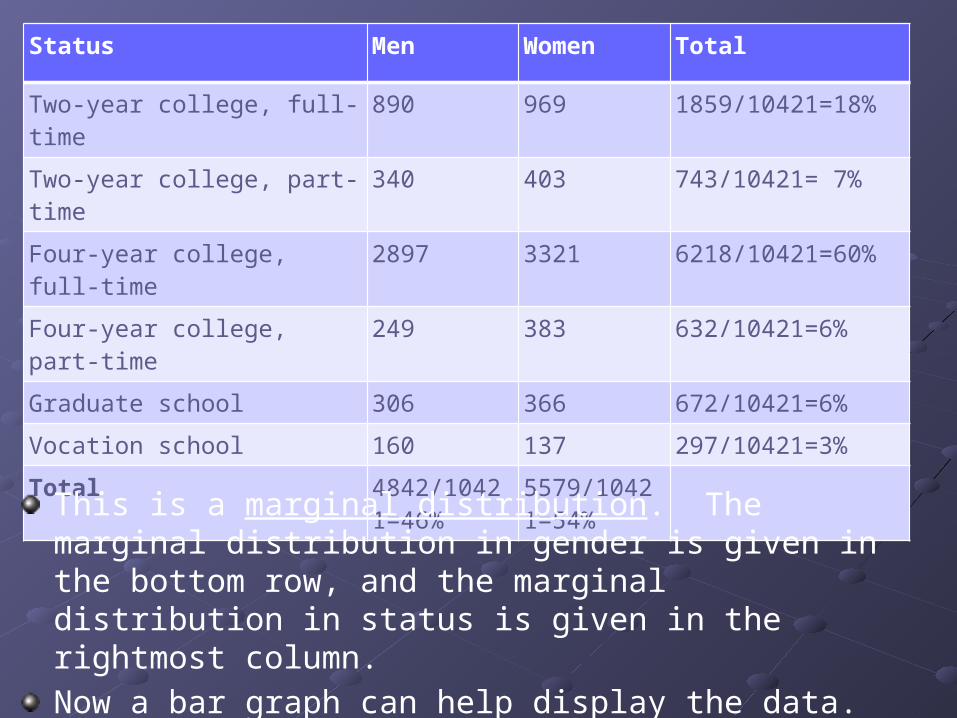
Status Men Women Total
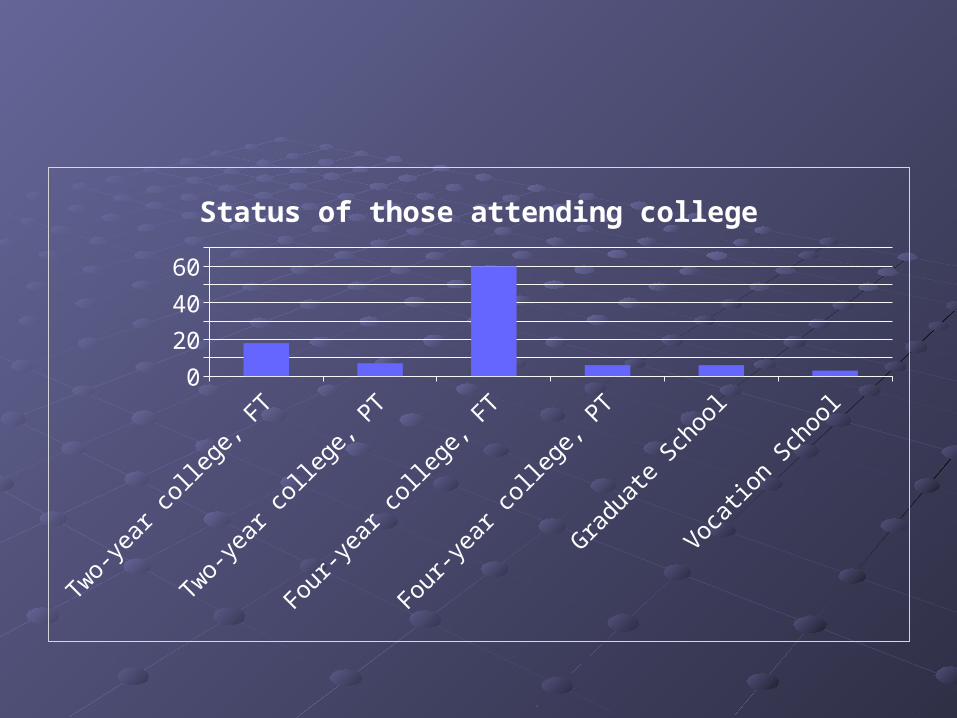
Two-year college, full-time 890 969 1859/10421=18%
Two-year college, part-time 340 403 743/10421= 7%
Four-year college, full-time 2897 3321 6218/10421=60%
Four-year college, part-time 249 383 632/10421=6%
Graduate school 306 366 672/10421=6%
Vocation school 160 137 297/10421=3%
Total 4842/10421=46%
5579/10421=54%
This is a marginal distribution. The marginal distribution in gender is given in the bottom row, and the marginal distribution in status is given in the rightmost column.
Now a bar graph can help display the data. We’ll graph status of those in college.
Two-year college, FT
Two-year college, PT
Four-year college, FT
Four-year college, PT
Graduate School
Vocation School
0
10
20
30
40
50
60
70
Status of those attending college

Status Men Women
Two-year college, full-time 48% 52%
Two-year college, part-time 46% 54%
Four-year college, full-time 47% 53%
Four-year college, part-time 39% 61%
Graduate school 46% 54%
Vocation school 54% 46%
This is a conditional distribution in status since we are fixing a status. We could have also looked at a conditional distribution in gender.

Simpson’s Paradox
Simpson’s paradox occurs when the success of a group seems reversed when the groups are combined.
Let’s look at an example.
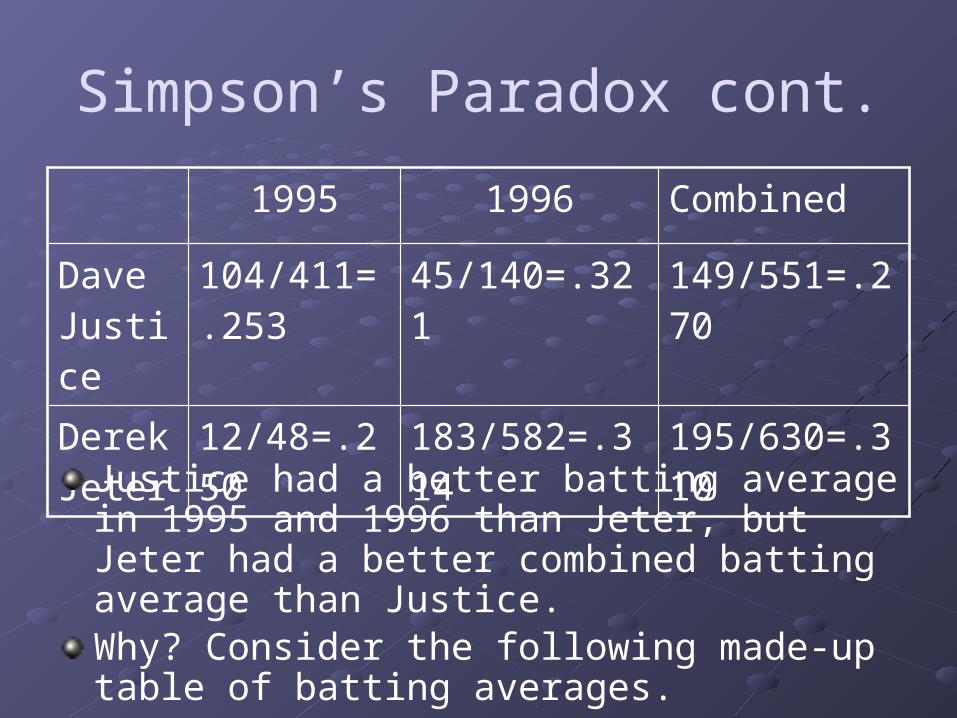
Simpson’s Paradox cont.
1995 1996 Combined
Dave Justice
104/411= .253
45/140=.321 149/551=.270
Derek Jeter
12/48=.250 183/582=.314 195/630=.310
Justice had a better batting average in 1995 and 1996 than Jeter, but Jeter had a better combined batting average than Justice.Why? Consider the following made-up table of batting averages.
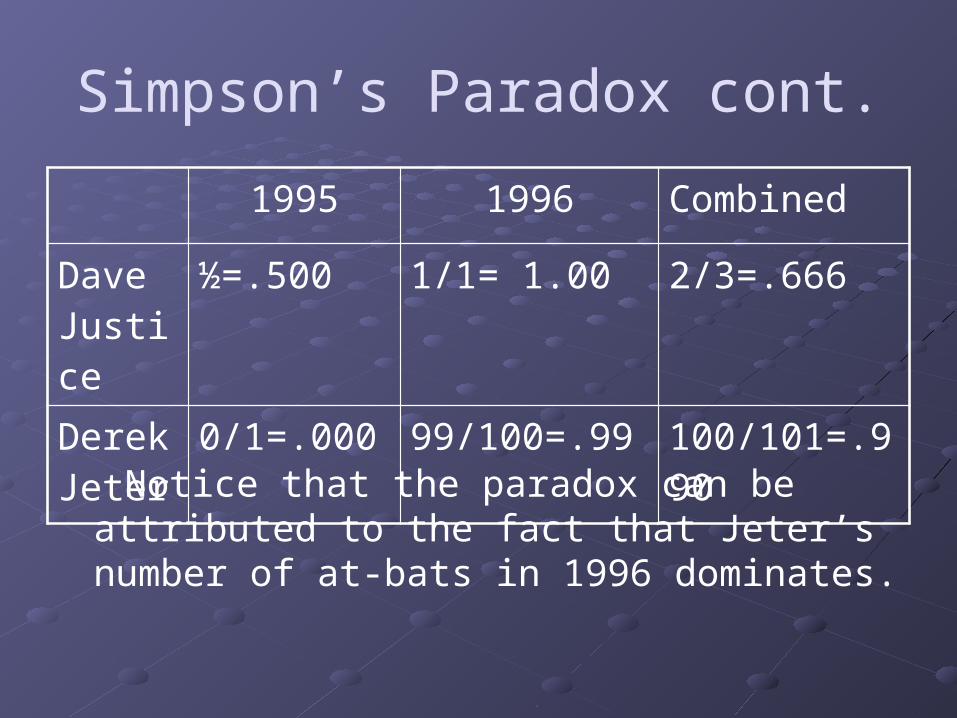
Simpson’s Paradox cont.
1995 1996 Combined
Dave Justice
½=.500 1/1= 1.00 2/3=.666
Derek Jeter
0/1=.000 99/100=.99 100/101=.990
Notice that the paradox can be attributed to the fact that Jeter’s number of at-bats in 1996 dominates.