2.3 macroeconomic objectives - ib revision · pdf file02-10-2014 · 2.3...
TRANSCRIPT

2.3 Macroeconomic Objectives Ruru Hoong Oct’ 2014
2.3 Macroeconomic Objectives Low Unemployment Unemployment: people of working age who are actively looking for a job and able to work, but who are not employed. Unemployment rate: number of people unemployed expressed as a percentage of the total labour force.
*labour force: economically active population – people who are employed and those of working age
Unemployment rate: number of unemployed/labour force x 100
Difficulties in measuring unemployment
1. Hidden unemployment • Discouraged workers that are no longer working for work are no longer
considered part of “unemployed” • Do not include people on retraining programs who have previously lost
their jobs/ retire early • Do not include people working in underground economy
2. Underemployment • People of working age with part-time jobs when they would rather work
full time; jobs that do not make use of their skills or education § Still wasting resources § Part of hidden unemployment
3. Distribution of unemployment – it is an average measure of unemployment • Regional: geographical disparities in regions with declining industries,
some regions tend to be more prosperous than others • Ethnic: discrimination; differences in education • Age: youth unemployment tends to be higher than older population due to
lower skill levels; also very elderly less likely to be unemployed or find new job
• Gender: tends to be higher for women than for men (diff. in education, employer discrimination, other social factors)
Consequences of unemployment Economic Consequences
1. Loss of real GDP • Fewer people work than are available to work; amount of output produced
is less than what the economy is capable of producing • Under-utilization of a country’s resources • Below the level that which is beneficial to an economy trying to raise
standards of living for its people 2. Loss of income for individuals
• Financially worse off and less disposable incomes • Less AD, more unemployment, and pulls economy into recession
3. Loss of government tax revenue • Less tax revenue to do less work income
4. Increase in cost of unemployment benefits

2.3 Macroeconomic Objectives Ruru Hoong Oct’ 2014
• Governments have to pay monthly benefits to the unemployed; fiscal resources could have been used in the provision of public goods or merit goods (opportunity cost)
• Puts pressure on government’s fiscal conditions (increased budget deficits)
5. Greater disparities in distribution of income • More income inequality (between people who work/ don’t work), wealth
gap may increase over time as unemployed find it harder to work in the future and children from these families may not have access to education
6. Turn towards protectionist policies • Unemployment usually blamed on competition from cheap foreign
producers, more quotas ant tariffs – eventually make nation less competitive
Personal and Social Consequences
1. Increased crime rates 2. Increased indebtedness and homelessness 3. Increased stress and family breakdowns
Types of Unemployment Disequilibrium unemployment: occurs when there are any conditions preventing the market from “clearing” or reaching market equilibrium
1. Real-wage/ classical unemployment: wages are higher than equilibrium and employers will not pay the wage (due to trade unions and government imposing minimum wage). • Aggregate demand for labour curve dependent on AD in economy (If AD
increases, more output and labour needed) • Aggregate supply for labor is the number of an
economy’s workers that are willing and able to work at the average given wage rate
• Solutions: abolish minimum wage o Higher employment & more production o But… Lower employment if people
demand higher wages (eg. industrial North England strikes)
o Lower wage for workers o Income disparity and inequity o Workers may leave country
2. Demand-deficient (cyclical unemployment): when there is insufficient AD for goods and services in the economy, so that the equilibrium level of real output is below the economy’s potential real output level (NRU). • Usually associated with the cyclical downturns in the economy (periods of
slow growth/ negative real GDP growth in recession) and there is a fall in demand for labour
• Initially high level of economic activity (demand at AD1, output Y1)
• Economy slows down, AD falls from AD1 to AD2 • Decrease in output to Y2, lower production, firms
lay off workers and fall in demand for workers • Solutions: Increase AD (monetary and fiscal
policy… see 2.4-2.6)

2.3 Macroeconomic Objectives Ruru Hoong Oct’ 2014
Equilibrium unemployment: occurs when labour market is in equilibrium – other types of unemployment Full employment/ natural rate of unemployment: unemployment that still prevails when the economy is producing potential output, due to people that are unwilling/unable to take up available jobs (frictional + seasonal + structural).
1. Frictional unemployment: short-term unemployment that occurs when people are in-between jobs, or they have left education and waiting to take up first job (not typically negative in a dynamic economy – more productive) • Solutions:
o Improve flow of information from potential employers to people looking for jobs (eg. internet job sites)
o Lower unemployment benefits so less incentive to spend time looking for jobs
§ More willing to work, shift AS right § Less spending on government’s part § May not go for optimal jobs § Discontent with the government
2. Seasonal unemployment: occurs when people work for part of the year but are unemployed for other parts (eg. farmers, tourist industry) • Solutions:
o Encourage workers to take up different jobs in “off-season” o Improve flow of information o Lower unemployment benefits
3. Structural unemployment: occurs when there is a permanent fall in demand for particular types of labour skills, change in geographical location of industries, and labour market rigidities.
a) Changes in demand for particular labour skills • Technological change: automation reduces need for labour –
machines and computers take over jobs once held by people

2.3 Macroeconomic Objectives Ruru Hoong Oct’ 2014
• Low cost labour in foreign countries (eg. Chinese labour lower costs of production than Italian)
• Changes in consumer taste – eg. non-renewable resources, fall in demand for coal; coal miners structurally unemployed and lack skills and occupational mobility to find new jobs
• *not demand-deficient unemployment, as it is only a fall in demand in one type of labour
b) Change in geographical location of industries • Relocation/ closing down of large firm/ industry • Relocation to foreign country • Occupational immobility results in mismatch in labour demanded
and supplied within geographical region c) Labout market rigidities: factors preventing the forces of demand
and supply from operating in the labour market – institutional framework of economy • Minimum wage legislation • Employment protection laws – firms cautious about hiring workers
due to lengthy documentation/ cost to fire workers (see 2.4-2.6 for government policies to deal with the different types of unemployment)

2.3 Macroeconomic Objectives Ruru Hoong Oct’ 2014
Low and Stable Rate of Inflation Inflation: sustained increase in average price levels in the economy (usually measured by calculation of CPI) Disinflation: the fall in the rate of inflation (although inflation is still positive – there is still an increase in average price levels Deflation: a persistent fall in the average price levels in the economy Inflation/ deflation are typically measured by calculating a consumer price index (CPI), which measures the change in prices of a basket of goods and services consumed by the average household in an economy, relative to a base year. (measure of the price of living) Problems with CPI
1. CPI is an average: different rates of inflation for different income earners • CPI reflects “typical” household; not applicable to all people as there are
different patterns of consumption 2. Changes in product quality
• Quality changes over time • Introduction of new products (fixed basket of goods cannot account for
new products, so hard to compare) 3. Comparability over time
• Part (2) • Periodical revisions in CPI baskets and changes in base year makes it less
comparable, and limits analysts because of cumulative changes in basket of goods and services
4. International Comparisons • Different countries have different components and different ways of
measuring inflation which makes it hard to compare • EU devised Harmonized Index of Consumer Prices
5. Error/ inaccuracies in data collection • Impossible to collect all prices, so samples have to be taken (large
samples are time consuming and costly) Core Index: a rate of inflation based on a CPI that excludes goods with highly volatile prices, notably food and oil. Producer Price Index (PPI): measures changes in the price level of factors of production (from the point of view of producers rather than the consumers)
• Raw materials/ commodities • Better predictor of future inflation/ change in CPI in the future (as costs of
production affect the price of the good produced) • Upward movements indicates cost-push pressure
How to calculate CPI & inflation rate
1. Choose a base year 2. Choose a “basket” of goods and services which the “typical” household buys 3. Give each good a weight according to its importance to the household
expenditure 4. Find the price of each good in the base year. Give each price the index 100 5. Calculate weighted price index for each good 6. Find the total weighted price index divided by the total weight (100 in base)
2.3 Macroeconomic Objectives Ruru Hoong Oct’ 2014
7. Repeat for other years
price index for a specific year = value of basket in specific year /value of index in base year
% change in A (inflation rate) = final value of A – initial A/initial A x 100%
Calculating real income from nominal income using CPI
real income = nominal income /CPI x 100 *since CPI compares price levels based on G&S in a specific basket, it only makes sense to calculate real income from it using the same basket and base year … vs. GDP deflator
real income = nominal income /GDP Deflator x 100 • GDP deflator: actual output vs. basket of goods • Includes goods irrelevant to consumers; capital, current expenditure by
government; also excludes imports • GDP deflator does not weigh goods with relative importance
Consequences of inflation
1. Redistributive effects L People holding cash as value of cash falls L People with fixed incomes/ incomes that rise less rapidly (eg. pensioners, individuals with fixed welfare payments, workers with wage contracts) L Lendors/ creditors if rate of inflation rises more than rate of interest (fall in the real value of the loan) J Payers of fixed incomes/ wages that rise less rapidly as the real value of payments fall due to inflation J Borrowers as they are better off at the end of the loan period
2. Loss of purchasing power • Quantity of goods and services that can be bought with the money • % change in purchasing power = % change in nominal income - %
change in APL (rate of inflation) 3. Less saving
• Savings/ real value will fall unless the rate of interest increases • Real rate of interest = interest rate adjusted for inflation • Have to raise nominal interest rates to keep up with inflation
4. Greater uncertainty • Inability to predict what inflation will be like in the future • More cautious about future plans, lower investment • Inaccurate forecasts of costs and revenues, so there is uncertainty
amongst economic decision makers 5. Less competitive exports
• Export competitiveness falls as APL increases more than other countries • Foreigners buy less • X-M decreases, and possibly could result in current account deficit
(depends on elasticities) Consequences of deflation
1. Redistributive effects J People holding cash as value of cash increases J People with fixed incomes/ incomes that fall less rapidly (eg. pensioners, individuals with fixed welfare payments, workers with wage contracts)
2.3 Macroeconomic Objectives Ruru Hoong Oct’ 2014
J Lendors/ creditors (increase in the real value of the loan) L Payers of fixed incomes/ wages as real value increases due to deflation L Borrowers as they are worse off at the end of the loan period
2. High levels of cyclical unemployment • Fall in AD as people postpone purchases and less borrowing • More unemployment, less spending • Deflationary spiral of increasing cyclical unemployment
3. Greater uncertainty • Inability to predict what deflation will be like in the future • More cautious about future plans, lower investment • Inaccurate forecasts of costs and revenues, so there is uncertainty
amongst economic decision makers 4. Risk of bankruptcies as borrowers cannot pay debt, financial institutions
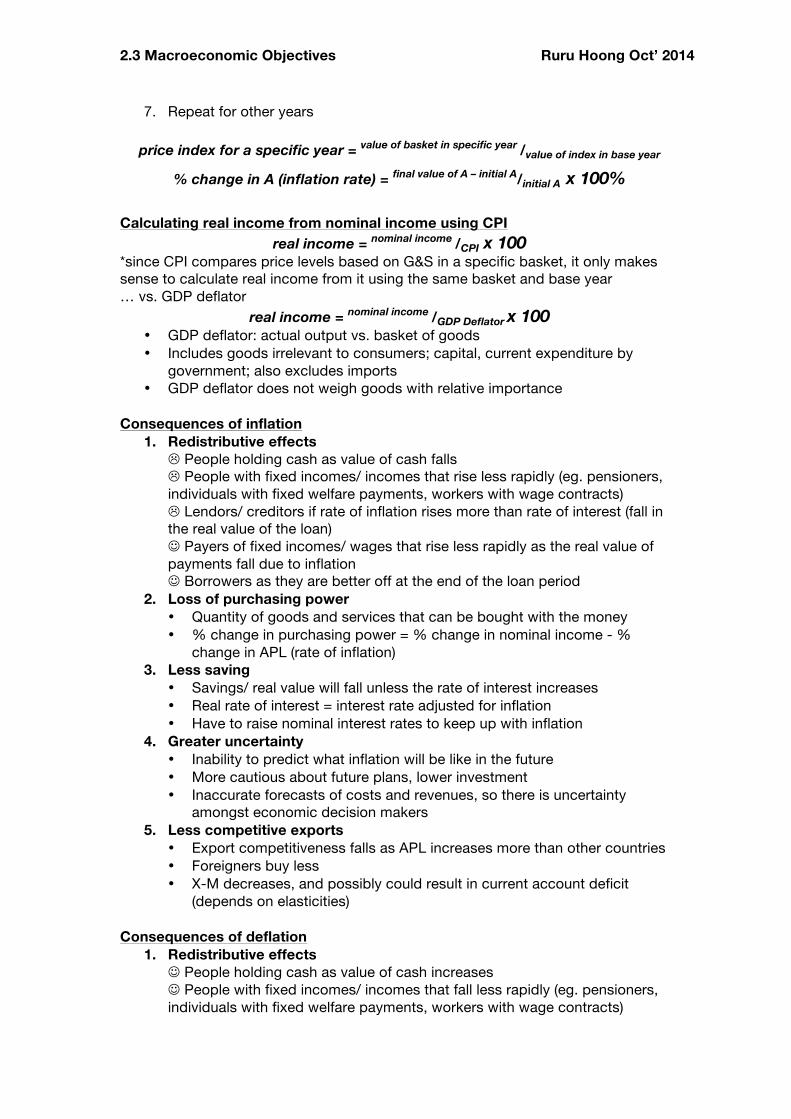
suffer, major crisis Causes of inflation
1. Demand-Pull • Increases in AD
o Increased government spending o Increased consumer expenditure/ business investment due to
confidence o Decrease in interest rates, income tax, business tax o Increased X-M (due to fall in exchange rate)
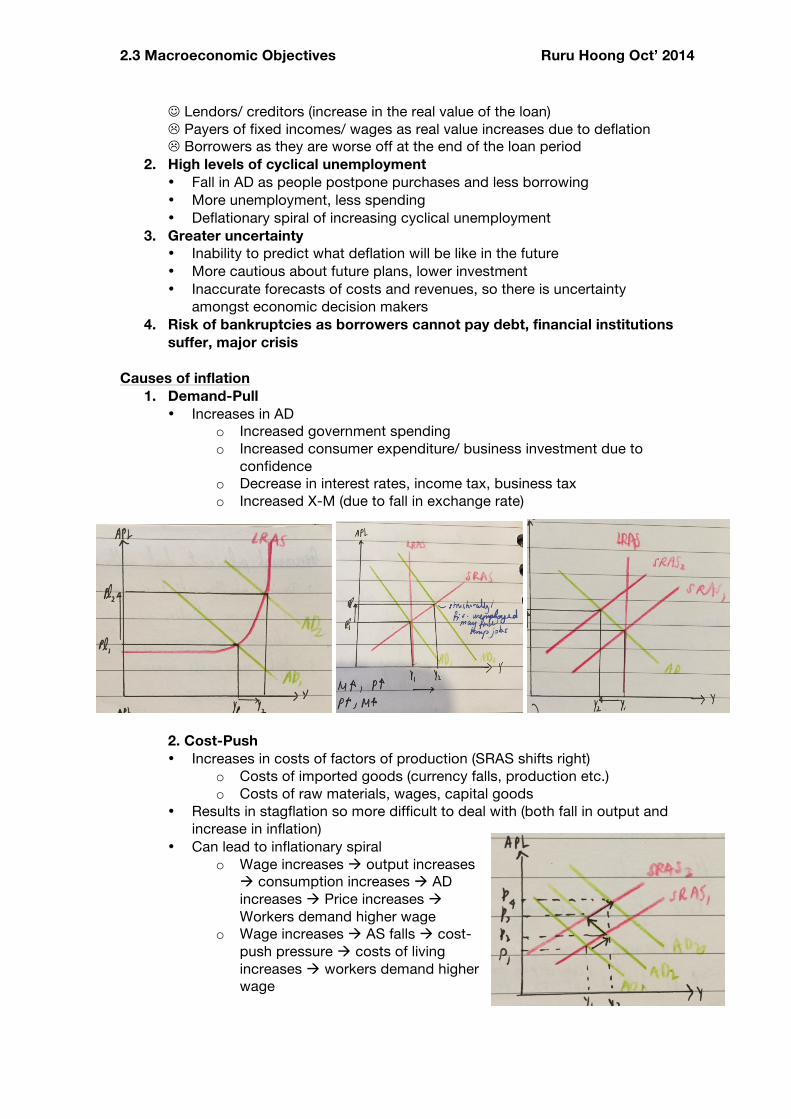
2. Cost-Push • Increases in costs of factors of production (SRAS shifts right)
o Costs of imported goods (currency falls, production etc.) o Costs of raw materials, wages, capital goods
• Results in stagflation so more difficult to deal with (both fall in output and increase in inflation)
• Can lead to inflationary spiral o Wage increases à output increases
à consumption increases à AD increases à Price increases à Workers demand higher wage
o Wage increases à AS falls à cost-push pressure à costs of living increases à workers demand higher wage

2.3 Macroeconomic Objectives Ruru Hoong Oct’ 2014
Policies to deal with inflation 1. Decide whether inflation is a problem for the government
• Creeping inflation generally good for the economy 2. Identify source of inflation 3. Apply appropriate measures
• Demand side: Reduce AD (contractionary fiscal and monetary policies) • Supply side: Increase AS
o Control power of trade unions, reduce unemployment benefits, abolish minimum wage, cut public sector wages
o Productivity deals, encourage investment into import alternatives, protective measures/ subsidise domestic production
Possible relationships between unemployment & inflation

2.3 Macroeconomic Objectives Ruru Hoong Oct’ 2014

2.3 Macroeconomic Objectives Ruru Hoong Oct’ 2014
Economic Growth Economic Growth: an increase in real GDP over time
• Can help achieve low inflation and unemployment
ü Non inflationary growth (usually “normal” increases in demand with increases in population and income; LRAS shifts as well due to more workers, better technology)
ü Increase in national income and output – if per capita, higher material living standards
ü Can result in great leaps in technology ü Increased incomes, increased tax revenues, can subsidize merit and public
goods, increasing living standards and fighting inequality ü International context: increased competitiveness of exports, increased
demand for imports
û Increased income inequality if only in one sector (ef. Primary à tertiary; unemployment due to structural change)
û Negative impacts on the environment/ sustainable growth û Higher GDP does not necessarily equal better standard of living
Calculating rate of economic growth
Growth rate = real GDP Y2 – real GDP Y1 /real GDP Y1 x 100%

2.3 Macroeconomic Objectives Ruru Hoong Oct’ 2014
Equity in the Distribution of Income Equity: the condition of being fair and just Equality: each member receives exactly the same income. Income inequality inevitably exists (well, unless you’re in a totally communist regime! Even so… Ain’t possible.) Equity does not equal equality – although the pursuit of equity generally leads to greater equality.
• More equitable income distribution • In general, agreed that market economies do inevitably result in income
inequality Problem of income distribution arises as ownership of the four factors of production (land, labour, capital, entrepreneurship) are highly unequal, and the prices of factors of production determined in a market economy vary enormously.
• Differences in skill/ education due to poor background • Poor healthcare/malnutrition • Unequal distribution of land, capital, and entrepreneurial abilities
As a result, these inherent differences will get worse (cyclical – poor remain poor due to disadvantages) and the market system cannot result in income equity and ensure that everyone has enough income to satisfy their basic needs.
• Therefore government attempts to redistribute income and make it more equitable
Indicators of income equality/ inequality
• Quintile: 20% of country’s population o If income more equally distributed, every quintile receives 20% of
income o Deciles (10%) and quartiles (25%) used too
• Lorenz Curve & Gini coefficient

2.3 Macroeconomic Objectives Ruru Hoong Oct’ 2014
Poverty: Inability to satisfy basic consumption needs Relative Poverty: living standards or incomes well below ‘average’ or median in society
• If equal distribution, no relative poverty • Typical based on standard determined by median income level • Specifies a specific percentage of median income below which there is
poverty Absolute Poverty: the percentage of the population whose income falls below the poverty line
• Income level considered minimally sufficient to sustain a family in terms of food, housing, clothing and so on
• World Bank: <US$1.25/ day: extreme poverty; <US$2/ day: moderate poverty Possible causes of poverty
1. Low incomes and unemployment 2. Low human, physical, natural capital (land ownership) 3. Geography (remote, isolated areas) 4. Discrimination/ Age/ Gender 5. Poverty (poverty leads to more poverty… wait a second… I think the textbook
authors are getting a LITTLE bit bored…) Possible consequences of poverty
1. Low standards of living 2. Lack of access to healthcare and education 3. Social problems … and more poverty.
The role of taxation in promoting equity Direct taxes: taxes paid directly to the government authorities/ taxes imposed on people’s wealth and income

2.3 Macroeconomic Objectives Ruru Hoong Oct’ 2014
• Personal income taxes (eg. wages, rental income, interest income, dividends) • Wealth taxes (property and inheritance tax) • Corporate income taxes (taxes on the profits of firms)
Indirect taxes: taxes levied on expenditure on goods and services
• General expenditure taxes (GST, VAT) • Excise taxes (cigarette tax, petrol tax) • Custom duties/ tariffs (applied to foreign imports)
Types of taxes Progressive taxes: as income increases, the percentage of income paid as taxes increases; there is an increasing tax rate
• Used as a way to redistribute income • Makes business cycle milder
Proportional taxes: as income increases, the percentage of income paid stays the same; there is an constant tax rate
• Still satisfies the principle of vertical equity • Less complex system • Can be viewed as supply-side policy – greater incentive to work and raise
labour supply Regressive taxes: as income increases, the percentage of income paid as taxes falls; there is a decreasing tax rate
• Makes income distribution less equal (usually indirect taxes) • Although may be a good source of government revenue

2.3 Macroeconomic Objectives Ruru Hoong Oct’ 2014
Other measures to promote equity 1. Government expenditure
• Subsidies or government provision of public goods or merit goods • Healthcare education infrastructure • Makes sure poorer members of economy have access to these
necessities 2. Transfer payments: payments made by government to individuals
specifically for the purposes of redistributing income • Old age pensions • Unemployment benefits • Child support assistance/ allowance
Calculating marginal rate of tax and average rate of tax
Relationship between equity and efficiency …possible trade-offs between equity and efficiency; how to go about redistribution Taxes
ü Can be used to correct market failure, increased efficiency û Discourage entrepreneurial activity and disincentive to work û Allocative inefficiency to neo-classical economists
Government expenditure ü Can be used to correct market failure, increased efficiency û Firms have to pay for more social insurance, social security, fewer workers
employed û Bureaucracy
Transfer payments ü Automatic stabilizer to reduce severity of recessions û Discourage/ disincentive to work û People take social benefits that they don’t need (social expense)