21 february 2017 for personal use only - asx · acquisitions of m4 and mva interim dividend of...
TRANSCRIPT

FY17 Half Year Results21 February 2017
Matt MuscioChief Executive Officer
Dean TaylorChief Financial Officer
Kristine JamesGeneral Manager Corporate Development
For
per
sona
l use
onl
y

Agenda
1
1. Highlights
2. Financial Performance
3. New Product Launches
4. MVA Integration and Momentum
5. Progress on Innovation
6. Strategy
7. Outlook
8. Appendix
For
per
sona
l use
onl
y

2
Key Metrics
A solid underlying performance for H1 FY17 with 13.4% revenue growth on prior comparable period
8 500 bps
767 bps
7.3%
500 bps70% of
NPATA(4)
131Active Surgeons(1)
51.1%Gross Margin
$9.1EBITDA(2)
80.2%Cash Conversion(pcp 3.5%)
30.8%Net Working Capital(pcp 35.8%)
% to LTM sales
6.25cInterim Dividend (3)
(pcp 5.0c)
Notes:
1. Active surgeons are surgeons who generate $50,000 or more of revenue in the LTM
(including biologics) for LifeHealthcare
2. Underlying EBITDA excludes transaction costs of $0.5m (pcp $0.3m)
3. Subject to Dividend Reinvestment Plan
4. Underlying Net Profit after Tax and before Acquisition Amortisation
7% growth from
30 June 2016
13.4%
$61.7mRevenue
252 bps
1.69xLeverage(pcp 2.16x)
Net Debt to
Underlying EBITDA
FX impact of 450 bps
Mix impact of 50 bps
92% conversion on
LTM basis
89% of Statutory
NPAT
For
per
sona
l use
onl
y

FY11 FY12 FY13 FY14 FY15 FY16 H1FY17
3
Consistent Track Record of Growth
Delivering consistent growth in the number of active surgeons, revenue and earnings
$31 $34 $37 $41$48
$54$62
FY11 FY12 FY13 FY14 FY15 FY16 H1FY17
($m)
$69 $70$77
$87
$99
$115
$4.5$5.6 $6.2
$7.1$8.5 $8.5 $9.1
FY11 FY12 FY13 FY14 FY15 FY16 H1 FY17
($m)
$12.2 $12.4
$14.1
$15.3
$17.3
$19.3
Active Surgeons(1) Revenue EBITDA(2)
Notes:
1. Active surgeons are surgeons who generate $50,000 or
more of revenue in the LTM (including biologics) for
LifeHealthcare
2. Underlying EBITDA excludes acquisition transaction costs
(#)
75
87
98 99105
123
131
Revenue per active surgeon ($’000)
258 371 428 471 447 438350
For
per
sona
l use
onl
y

Highlights
Significant progress through continued surgeon engagement and leveraging recent product launches
Continued
New Surgeon
Growth
Leverage of
MIS in Spine
Further
Robotics
Penetration
Strong
Growth in
Orthopaedics
Increased
Imaging Offering
& Penetration
Momentum in
Interventional
Cardiology
12.8% growth in
implants through
penetration in
complex
orthopaedic,
minimally invasive
spine and spinal
robotics
Additional eight
active surgeons in
H1 FY17 bringing
total to 131 active
surgeons
195 cases performed
across 26 surgeons
since launch
Everest XT minimally
invasive spine
platform from K2M
continues to perform
well following the
December 2015
launch, providing
access to high growth
$25m market
segment
Two robotics units
installed in H1 FY17
at strategically
valuable sites of
Wollongong Private
(Ramsay Health
Care) and Epworth
Richmond bringing
total Australian
install base to six
84 robotic enabled
spine surgeries
conducted in H1
FY17, up 140% on
prior comparable
period
Strong penetration
with existing
biologics portfolio in
orthopaedic
applications with
benefits of lower
working capital
requirements
realised
High growth in
complex lower limb
reconstruction market,
with market leading
position in internal
limb lengthening sub
segment
BodyTom portable
full body CT
scanner to be
installed at Epworth
Richmond in Q3
FY17 providing only
the second ‘scan
and plan’ BodyTom
/ Mazor site globally
CereTom CT
scanner installation
underway for launch
of Australia’s 1st
mobile stroke
ambulance unit in
Victoria
Expansion of
interventional
cardiology portfolio
with new agency
agreement
completed with
Concept Medical
Strong growth in
the interventional
cardiology and
respiratory division
on the back of the
Medical Vision
Australia
acquisition in
October 2015
4
For
per
sona
l use
onl
y

5
Summary Income Statement
Solid earnings growth through expense management to offset deterioration in AUD
H1 FY17 H1 FY16Change on
pcp
Revenue 61.7 54.4 13.4%
Gross Margin 31.5 30.5 3.3%
Gross Margin % 51.1% 56.1% (5.0%)
Underlying EBITDA(1) 9.1 8.5 7.3%
EBITDA % 14.8% 15.6% (0.8%)
Transaction Costs (0.5) (0.3) 53.6%
EBITDA 8.7 8.2 5.8%
Depreciation 2.2 1.8 25.0%
Amortisation 0.8 0.8 -
EBIT 5.7 5.6 0.6%
Interest Expense 1.3 1.1 9.1%
Income Tax Expense 1.4 1.4 (0.1%)
NPAT 3.0 3.1 (2.7%)
Underlying NPATA(2) 3.8 3.8 0.4%
Underlying NPATA EPS (c) 9.0 8.9
Payout % of Statutory NPAT 89% 69%
Payout % of Underlying NPATA 70% 56%
13.4% revenue growth on pcp with organic growth of
9.6%
Gross margin affected by strong capital sales at lower
margin and deterioration of AUD being partially offset by
improved supplier trading terms
Strong operating expense management resulting in
improved operating expense to sales ratio by 420 bps
Depreciation increased due to investment in warehouse
automation to improve operational efficiency and
instrument kits to support revenue growth
Interest expense increased from additional bank debt for
acquisitions of M4 and MVA
Interim dividend of 6.25c subject to Dividend
Reinvestment Plan with 2.5% discount
Notes:
1. Underlying results excludes acquisition transaction costs of $0.5m in
H1 FY17 and $0.3m in H1 FY16
2. Underlying NPATA adds back to NPAT amortisation of acquisition
identifiable intangibles
($m)
For
per
sona
l use
onl
y

6
Balance Sheet and Cashflow Extract
Prudent balance sheet management continues with improvement in underlying quality of inventory as
well as improvement in net debt and cash conversion
FY14 H1FY15 FY15 H1FY16 FY16 H1FY17
(%)
31.8 31.5
29.2
31.4
FY14 H1FY15 FY15 H1FY16 FY16 H1FY17
(x)
1.32
0.96
1.37
1.69
Net Debt to EBITDANet Working Capital to LTM Sales
H1 FY17 H1 FY16
Inventory 37.4 35.7
Trade & Other Receivables 25.0 18.6
Trade & Other Payables (24.8) (16.7)
Net Working Capital 37.6 37.6
Net Debt(1) 33.7 39.5
Operating Cash Flow 7.3 0.3
Operating Cash Flow Conversion (on EBITDA) 80.2% 3.5%
Capital Expenditure 3.3 2.4
Notes:
1. Borrowings are inclusive of utilised overdraft facility in H1
FY16
Increase in inventory to meet growth compounded by
increased cost to land from weaker AUD
Net working capital ratio of 30.8% improvement in line
with management’s expectations with further
improvement expected in H2 FY17
Receivables and payables increased as a result of a
delayed receipt due from new Royal Adelaide Hospital
Strong cash conversion of 80.2% of EBITDA to
operating cash flows with $1.5m cash at bank at
December
Capital expenditure higher from increased investment in
instrument kits to support revenue growth along with
further investment in automation of warehouse
management
Significant improvement of net debt leverage to pcp
closing at 1.69x underlying EBITDA
($m) (extract)
35.8 2.16
30.81.69F
or p
erso
nal u
se o
nly

New Product Launches
New product launches in H1 FY17 continuing the momentum in channel optimisation
7
Barricaid Lumbar
Disc Repair
Technology
CereTom Mobile
Stroke Units in
Ambulances
Visionsense 3D
Endoscopy
Mindray M9
Dipromed Transparent
Laparoscopic Hernia
Mesh
Telexy Qpath
POC Ultrasound
Workflow Solution
Lateral and Posterior
Lumbar 3D Printed
Implants
For
per
sona
l use
onl
y

MVA Integration and Momentum
Strong momentum in interventional cardiology and respiratory division with new supply partnerships
extending into peripheral vascular applications
8
Medical Vision Australia business acquired in October
2015 proving a strong strategic fit and achieving positive
sales momentum in interventional cardiology
Capital sales growth in H1 FY17 across IVUS
(intravascular ultrasound) and Bronchus (respiratory
imaging) with a solid sales pipeline into H2 FY17
Partnership established with Concept Medical to market
Magic Touch, the world first Sirolimus coated drug eluting
balloon on the market, TGA expected to take ~12 months
In late stage negotiations with prospective partners to
build out coronary intervention portfolio and extend
further into peripheral vascular applications
MVA earn out payable in Q3 FY17
Volcano iFR
Concept Medical
Magictouch Drug Eluting
Balloon
For
per
sona
l use
onl
y

Progress on Innovation
Focus on enablers in high growth therapeutic channels with compelling efficacy and health economics
9
Improving patient outcomes through less invasive surgery,
lower revision rates, faster recovery times, reduced post
operative pain and lower infection rates
Mazor Renaissance Spinal Robot
Value proposition of reduction in revision surgery, screw
explant costs and patient length of stay in hospital
CereTom Mobile Stroke Unit in Ambulances
Stroke is a leading cause of death and disability with
significant patient care and rehabilitation costs
Mobile CT used to rapidly diagnose Ischemic
stroke patients and initiate time critical medical
treatment with significantly superior outcomes
Strategic installations at Wollongong Private and Epworth
Richmond in H1 FY17 has expanded the robotics footprint
to six sites
LifeHealthcare partnership with Royal Melbourne Hospital
and Ambulance Victoria to launch Australia’s first mobile
stoke ambulanceFor
per
sona
l use
onl
y

Update on Strategic Priorities
Progress on strategic priorities ensuring sustained future growth, benefits of scale and adaptation to evolving
healthcare trends
10
Organisational
Efficiency &
Effectiveness
Biologics
Growth
Develop Solutions to
Address Changing Needs
of Healthcare
Channel
Optimisation
Long term supplier agreements in
place with RTI Surgical and
MiMedx
Continued progress on TGA
submissions with approval
obtained for RTI Surgical’s
nanOss bone graft substitute and
human tissue portfolio approvals
anticipated in FY18
Dedicated sales resource in place
for New Zealand and
engagement of Australian Key
Opinion Leaders initiated
Enhanced sales and operations
planning processes embedded to
strengthen supplier demand
planning and optimise inventory
North Ryde warehouse
reconfiguration and automation
delivering improved workflow,
inventory visibility and increased
scalability
Investment in IT platform
enabling improved data analysis
and intelligence across
operations
Further inroads made into
providing efficacious,
innovative technology that
addresses health economics
such as the Mazor
Renaissance spinal robotics
system and the CereTom
mobile CT scanner
Launch of seven new products in
established therapeutic channels
during H1 FY17 driving future
organic growth and enabling
leverage of existing sales
infrastructure
New supply partnerships
established in interventional
cardiology, orthopaedics,
neurosurgery and ultrasound
Dividend Reinvestment Plan
initiated to provide flexibility in
addressing growth opportunities
For
per
sona
l use
onl
y
11
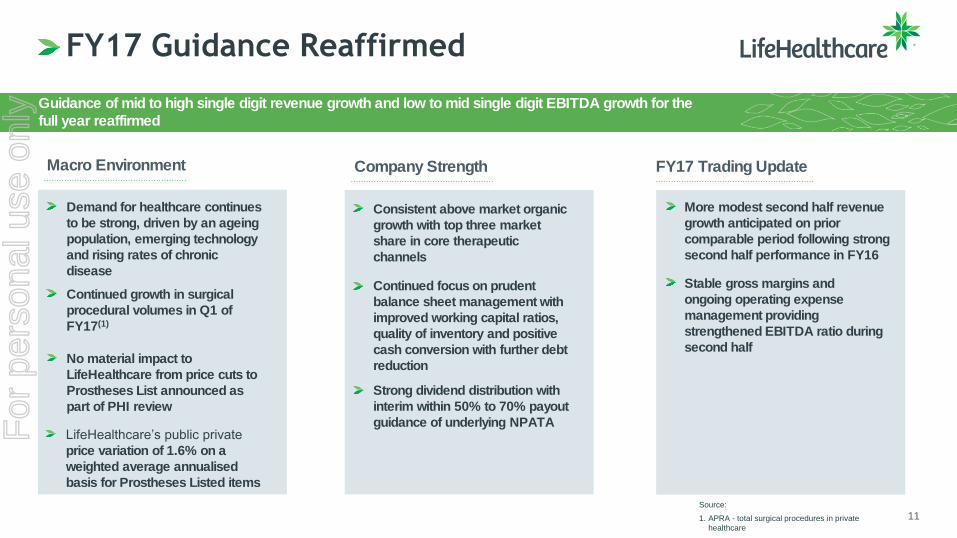
FY17 Guidance Reaffirmed
Guidance of mid to high single digit revenue growth and low to mid single digit EBITDA growth for the
full year reaffirmed
Demand for healthcare continues
to be strong, driven by an ageing
population, emerging technology
and rising rates of chronic
disease
Macro Environment
More modest second half revenue
growth anticipated on prior
comparable period following strong
second half performance in FY16
Company Strength
Stable gross margins and
ongoing operating expense
management providing
strengthened EBITDA ratio during
second half
Consistent above market organic
growth with top three market
share in core therapeutic
channels
Continued focus on prudent
balance sheet management with
improved working capital ratios,
quality of inventory and positive
cash conversion with further debt
reduction
Continued growth in surgical
procedural volumes in Q1 of
FY17(1)
No material impact to
LifeHealthcare from price cuts to
Prostheses List announced as
part of PHI review
FY17 Trading Update
Strong dividend distribution with
interim within 50% to 70% payout
guidance of underlying NPATA
Source:
1. APRA - total surgical procedures in private
healthcare
LifeHealthcare’s public private
price variation of 1.6% on a
weighted average annualised
basis for Prostheses Listed items
For
per
sona
l use
onl
y

Appendix
For
per
sona
l use
onl
y

13
Summary Balance Sheet
H1 FY17 H1 FY16
Cash 1.5 0.5
Trade & Other Receivables 25.0 18.6
Inventory 37.4 35.7
PP&E 11.2 10.5
Deferred Tax Asset 4.9 7.0
Intangible Assets 27.7 29.1
Other 1.8 1.1
Total Assets 108.6 102.5
Trade & Other Payables 24.8 16.7
Borrowings 35.2 39.5
Provisions 2.2 2.2
Other 1.8 1.8
Total Liabilities 64.1 60.2
Net Assets 44.5 42.3
($m)
For
per
sona
l use
onl
y

Disclaimer
The material in this presentation has been prepared by LifeHealthcare Group Limited ABN 72 166 525 186 (“LifeHealthcare”) to provide shareholders with information on the business. This document is part of, and should be read in conjunction with a briefing to be given by LifeHealthcare. A copy of the briefing is available at http://www.lifehealthcare.com.au/investors/.
Information in this presentation, including forecast financial information should not be considered as advice or a recommendation to investors or potential investors and does not take into account investment objectives, financial situation or needs of any particular investor. These should be considered, with or without professional advice when deciding if an investment is appropriate. Persons needing advice should consult their stockbroker, solicitor, accountant or other independent financial advisor.
The release, publication or distribution of this presentation in certain jurisdictions may be restricted by law and therefore persons in such jurisdictions into which this presentation is released, published or distributed should inform themselves about and observe such restrictions.
This presentation does not constitute, or form part of, an offer to sell or the solicitation of an offer to subscribe for or buy any securities, nor the solicitation of any vote or approval in any jurisdiction, nor shall there be any sale, issue or transfer of the securities referred to in this presentation in any jurisdiction in contravention of applicable law.
Certain statements made in this presentation are forward-looking statements. These forward-looking statements are not historical facts but rather are based on LifeHealthcare’s current expectations, estimates and projections about the industry in which LifeHealthcare operates, and beliefs and assumptions. These statements are not guarantees of future performance and are subject to known and unknown risks, uncertainties and other factors, some of which are beyond the control of LifeHealthcare, are difficult to predict and could cause actual results to differ materially from those expressed or forecasted in the forward looking statements.
LifeHealthcare cautions investors and potential investors not to place undue reliance on these forward-looking statements, which reflect the view of LifeHealthcare only as of the date of this presentation. The forward-looking statements made in this presentation relate only to events as of the date on which the statements are made. LifeHealthcare will not undertake any obligation to release publicly any revisions or updates to these forward-looking statements to reflect events, circumstances or unanticipated events occurring after the date of this presentation except as required by law or by any appropriate regulatory authority.
For
per
sona
l use
onl
y

Thank you
Subscribe to company news at www.lifehealthcare.com.au/investors/
For
per
sona
l use
onl
y