21' community health assessment
TRANSCRIPT

Worcester County, Maryland
Community Health Assessment
2021

WORCESTER COUNTY COMMUNITY HEALTH ASSESSMENT
2021
1
Dear Community Partners,
The Health Department is pleased to present the 2021 Community Health Assessment of Worcester County. In this publication, with input from community advisory committees, community surveys, focus groups, and quantitative data sources, the most important health status indicators affecting our community have been selected and compared to the state of Maryland. Everyone is encouraged to use the data in this report to identify community needs, to design health activities and programs, and/or to join community networking activities. Please reference the document as the Worcester County Health Department: Community Health Assessment, 2021.
The Worcester County Health Department values providing our community with public health leadership and quality services. The health department is accredited by the Public Health Accreditation Board. This is a significant achievement and recognition of the high standards and quality of our core public health services. In addition, our behavioral health care programs are fully accredited by the Joint Commission, an independent nonprofit organization that accredits and certifies more than 17,000 health organizations and programs in the United States.
In fiscal year 2020 and 2021, we continued to advance public health by implementing continuous quality improvement projects in every program and engaging the community in the Community Health Assessment (CHA) using the Mobilizing for Action through Planning and Partnerships (MAPP) framework. All of this work was accomplished while addressing the COVID- 19 pandemic and ramping up services, such as community testing, and vaccine clinics. This data does not reflect the effects and impact of the global pandemic; however, the Worcester County Health Department will add supplemental information and qualitative data in the future.
It is my hope that the Community Health Assessment will provide important information about the health of our community, which will promote community engagement in activities that will improve health status in Worcester County.
Sincerely,
Rebecca Jones RN, BSN, MSN Health Officer Worcester County Health Department

WORCESTER COUNTY COMMUNITY HEALTH ASSESSMENT
2021
2
Table of Contents Introduction ........................................................................................ 13 Select Health Indicators ...................................................................... 14 Worcester County Population Profile ................................................... 17
Demographics ................................................................................. 17
Age........................................................................................................ 17 Sex, Race, & Ethnicity .......................................................................... 18
Social Determinants of Health ............................................................. 19
Income ............................................................................................ 19
Poverty ............................................................................................ 20
Educational Attainment .................................................................. 22
Employment .................................................................................... 23
Housing .......................................................................................... 24
Homelessness ................................................................................. 25
ALICE ............................................................................................. 26
Food Insecurity ............................................................................... 28
Access to Health Care .......................................................................... 29
Health Insurance Coverage .............................................................. 29
Health Care Providers ...................................................................... 32
Health Care Service Utilization ........................................................ 32
Life Expectancy and Leading Causes of Death ..................................... 36
Life Expectancy ............................................................................... 36
Mortality ......................................................................................... 38
Leading Causes of Death ..................................................................... 38 Premature Deaths ................................................................................. 41
Years of Potential Life Lost to 75 (YPLL-75) ...................................... 41
Chronic Diseases and Conditions ......................................................... 43
Cardiovascular Disease ................................................................... 43
High Blood Pressure ........................................................................ 45
Cancer ............................................................................................ 48
Chronic Lower Respiratory Disease .................................................. 50

WORCESTER COUNTY COMMUNITY HEALTH ASSESSMENT
2021
3
Appendix A: Community Themes and Strengths Assessment................87Data Sources .......................................................................................85References...........................................................................................83County Health Rankings......................................................................81Influenza (Flu) and Pneumonia Immunizations ....................................79
Gonorrhea....................................................................................... 79
Chlamydia ...................................................................................... 78
Communicable Diseases ......................................................................78
Infant Mortality ............................................................................... 77
Low Birthweight .............................................................................. 76
Prenatal Care .................................................................................. 75
Teen Birth ....................................................................................... 75
Maternal and Child Health ...................................................................74
Suicide............................................................................................ 73
Adverse Childhood Experiences ....................................................... 72
Suicidal Behavior ............................................................................ 70
Health Status .................................................................................. 68
Quality of Life and Mental Health ........................................................68
Physical Activity .............................................................................. 65
Drug and Alcohol Intoxication Deaths.............................................. 64
Excessive Alcohol and Drug Use ...................................................... 60
Smoking.......................................................................................... 58
Health Related Risk Behaviors.............................................................58
Obesity ........................................................................................... 55
Diabetes.......................................................................................... 53
.............................................................................................................. 52Asthma ................................................................................................. 51COPD ................................................................................................... 51
WORCESTER COUNTY COMMUNITY HEALTH ASSESSMENT
2021
4
List of Figures
Figure 1. Worcester Population ............................................................................................ 17
Figure 2. Worcester Population by Age Group, 2019 ............................................................ 17
Figure 3. Worcester Population by Age Group, 2010-2019 ................................................... 18
Figure 4. Projected Worcester Population by Age Group ....................................................... 18
Figure 5. Worcester Population by Race, 2019 ..................................................................... 18
Figure 6. Household Income, Worcester and MD, 2015-2019 ............................................... 19
Figure 7. Sources of Household Incomes, Worcester and MD, 2015-2019 ............................ 20
Figure 8. Poverty Rate, 2019 ................................................................................................ 20
Figure 9. Poverty by Race/ Ethnicity & Sex, Worcester, 2015-2019 ...................................... 20
Figure 10. All ages in poverty, Worcester and MD, 2011-2019 ............................................. 21
Figure 11. Top-Ten Counties with High Poverty Rate, 2019 .................................................. 21
Figure 12. Proportion of Households participating in SNAP program by race/ethnicity, Worcester, 2015-2019 .......................................................................................................... 21
Figure 13. Educational Attainment of People 25 and Older in Worcester and MD, 2015-2019 ............................................................................................................................................ 22
Figure 14. Percent Racial/Ethnic groups with a Bachelor Degree or Higher, 2015-2019 ....... 22
Figure 15. Poverty Rate by Educational Attainment, 2015-2019 .......................................... 22
Figure 16. Occupations for the civilian employed population ............................................... 23
Figure 17. Worcester Civilian Workers by Industry Group .................................................... 23
Figure 18. Annual Unemployment Rate, Worcester and MD, 2011-2019 .............................. 23
Figure 19. Change in Median house value, median gross rent, and homeownership rate in Worcester and MD, 2015-2019 ............................................................................................. 24
Figure 20. Percent of households whose housing costs are 30 percent or more of their income, Worcester and MD, 2105-2019 ............................................................................................. 24
Figure 21. Annual homeless point in time count by Jurisdiction, 2019 ................................ 25
Figure 22. Annual homeless point in time count, Lower Shore, MD, 2016-2019 ................... 25
Figure 23. Total homeless clients served, Lower Shore, MD ................................................. 25

WORCESTER COUNTY COMMUNITY HEALTH ASSESSMENT
2021
5
Figure 24. Household Income, Worcester, 2018 ................................................................... 26
Figure 25. Food Insecurity Rate, Worcester and MD, 2016-2018. ........................................ 28
Figure 26. No health insurance coverage among persons under age 65, Worcester and MD, 2010-2018 ........................................................................................................................... 29
Figure 27. Uninsured Population by Age Group, Worcester, 2015-2019 ............................... 30
Figure 28. Uninsured Rate by Race/Ethnicity, Worcester, MD, 2015-2019 .......................... 30
Figure 29. Health Insurance Coverage, Worcester, 2015-2019 ............................................. 30
Figure 30. Number of Medicare Beneficiaries, Worcester, 2010-2018 ................................... 31
Figure 31. Average Monthly Enrollee in Medicaid, Worcester................................................ 31
Figure 32. Medicaid Enrollee by Age .................................................................................... 31
Figure 33. Medicare Enrollee by Age Group, Worcester, 2015-2019 ..................................... 31
Figure 34. Utilization of Primary Care Services, Worcester and MD, 2019 ............................ 32
Figure 35. Utilization of selective preventive services, Worcester and MD, 2018/2019 .......... 33
Figure 36. Adolescents enrolled in Medicaid receiving a wellness checkup, Worcester and MD, 2010-2017 ........................................................................................................................... 33
Figure 37. Adolescents enrolled in Medicaid receiving a wellness checkup by race/ethnicity, Worcester, 2017 ................................................................................................................... 33
Figure 38. Children enrolled in Medicaid receiving dental care, Worcester and MD, 2011-2017 ............................................................................................................................................ 34
Figure 39. Children enrolled in Medicaid Receiving Dental Care by Race/Ethnicity, Worcester, 2011-2017 ........................................................................................................................... 34
Figure 40. Emergency Department visits by source of payment, Worcester, 2018 and 2019 . 35
Figure 41. Uninsured Emergency Department Visit, Worcester ............................................ 35
Figure 42. Emergency Department visit rate, Worcester and MD 2016-2019 ........................ 35
Figure 43. Emergency Department visit rate by counties, 2018 and 2019, MD ..................... 36
Figure 44. Life Expectancy at Birth, Worcester and MD, 2011-2019 .................................... 36
Figure 45. Life Expectancy at Birth by Race, Worcester, 2017-2019 ..................................... 37
Figure 46. Life Expectancy at Birth by Sex, Worcester, 2017-2019....................................... 37
Figure 47. Life Expectancy at Birth Maryland Counties, 2017-2019 ..................................... 37
Figure 48. Top-Ten Leading Causes of Death, Worcester, 2017-2019 ................................... 38

WORCESTER COUNTY COMMUNITY HEALTH ASSESSMENT
2021
6
Figure 49. Age-Adjusted Mortality Rates for All Causes of Death .......................................... 40
Figure 50. Age-Adjusted Mortality Rate for the Top Two-Leading ......................................... 40
Figure 51. Age-Adjusted Mortality Rate for the Top Third and Fourth Leading Causes of Death, Worcester, 2011-2019 ............................................................................................... 41
Figure 52. Leading Causes of Premature Death (YPLL-75), Worcester, 2016-2018 ................ 42
Figure 53. Age-Adjusted Premature Mortality Rate, Worcester and MD, 2017-2019 ............. 42
Figure 54. Prevalence of Cardiovascular Disease (CVD) among Adults, Worcester and MD 2013-2019 (Three-Year Moving Average) ............................................................................... 43
Figure 55. Prevalence of Cardiovascular Disease by Race, Worcester, 2012-2019 (Five-Year Moving Average) ................................................................................................................... 43
Figure 56. Percent Distribution of all deaths due to Cardiovascular Disease by Age Group, Worcester, 2017-2019 .......................................................................................................... 44
Figure 57. Age-Adjusted Mortality Rate due to Heart Disease Worcester and MD, 2011-2019 (Three-Year Moving Average) ................................................................................................. 44
Figure 58. Age-Adjusted Heart Disease Mortality Rate by Race, Worcester, 2011-2019 (Three-Year Moving Average) ........................................................................................................... 44
Figure 59. Age-Adjusted Mortality Rate Due to Stroke, Worcester and MD, 2011-2019 (Three-Year Moving Average) ........................................................................................................... 45
Figure 60. Age-Adjusted Mortality Rate Due to Stroke by Race, Worcester, 2011-2018 (Three-Year Moving Average) ........................................................................................................... 45
Figure 61. Prevalence of Hypertension among Adults, Worcester and MD, 2011-2018 (Two-Year Average) ....................................................................................................................... 46
Figure 62. Prevalence of Hypertension by Age Group and Sex, Worcester, 2016-2019 (Three Year Average) ....................................................................................................................... 46
Figure 63. Prevalence of Hypertension by Race, Worcester, 2011-2019 (Three-Year Average) 46
Figure 64. Age-Adjusted Emergency Department (ED) Visit Rates Due to Hypertension by Race, Worcester, 2011-2017 ................................................................................................. 47
Figure 65. All Cancer Sites Age-Adjusted Cancer Incidence Rate,Worcester and MD, 2012-2017 .................................................................................................................................... 48
Figure 66. All Cancer Sites Age-Adjusted Cancer Incidence Rate by Sex and Race, Worcester, 2013-2017 ........................................................................................................................... 48
Figure 67. All Cancer Sites Age-Adjusted Cancer Mortality Rate, Worcester and MD, 2012-2018 .................................................................................................................................... 49
Figure 68. All Cancer Sites Age-Adjusted Cancer Mortality Rate by Sex and Race, Worcester, 2014-2018 ........................................................................................................................... 49

WORCESTER COUNTY COMMUNITY HEALTH ASSESSMENT
2021
7
Figure 69. Percent Distribution of All Deaths due to Chronic Lower Respiratory Disease by Age Group and Race, Worcester, 2017-2019 ......................................................................... 50
Figure 70. Age Adjusted Chronic Lower Respiratory Disease Mortality Rate, Worcester and MD, 2011-2019 (Three-Year Moving Average)........................................................................ 50
Figure 71. Prevalence of COPD among Adults, Worcester and MD, 2013-2019 (Three-Year Moving Average) ................................................................................................................... 51
Figure 72. Current Asthma Prevalence among Adults, Worcester and MD, 2012-2019 (Three-Year Moving Average) ........................................................................................................... 51
Figure 73. Adult Current Asthma Prevalence by Race, Worcester and MD, 2011-2019 (Five-Year Moving Average) ........................................................................................................... 51
Figure 74. Lifetime Asthma Prevalence among High School Students, Worcester and MD, 2013-2018 ........................................................................................................................... 52
Figure 75. Emergency Department Visit Rate due to Asthma by Race, Worcester, 2011-2017 ............................................................................................................................................ 52
Figure 76. Top Ten Counties with High Emergency Department Visit Rates Due to Asthma, 2017 .................................................................................................................................... 53
Figure 77. Prevalence of Diabetes among Adults, Worcester and MD, 2012-2019 (Three-Year Moving Average) ................................................................................................................... 53
Figure 78. Prevalence of Diabetes by Race, Worcester and MD 2012-2019 (Five-Year Moving Average) ............................................................................................................................... 54
Figure 79. Emergency Department Visit Rate due to Diabetes, Worcester and MD, 2011-2017 ............................................................................................................................................ 54
Figure 80. Emergency Department Visit Rate Due to Diabetes by Race, Worcester, 2011-2017 ............................................................................................................................................ 54
Figure 81. Top Ten Counties with High Emergency Department Visit Rate Due to Diabetes, 2017 .................................................................................................................................... 55
Figure 82. Prevalence of Self-Reported Obesity among Adults, Worcester and MD, 2012-2019 (Three-Year Moving Average) ................................................................................................. 56
Figure 83. Percent of Self-Reported Obesity among adults by age-Group and Sex, Worcester, 2017-2019 ........................................................................................................................... 56
Figure 84. Percent of Self-Reported Obesity among Adults by Race, Worcester, 2011-2019 (Five-Year Moving Average) ................................................................................................... 56
Figure 85. Obesity and Overweight Rates among High School Students, Worcester, 2018 .... 57
Figure 86. Percentage of High School Students Who Had Obesity, Worcester and MD, 2013-2018 .................................................................................................................................... 57
Figure 87. Prevalence of Current Cigarette Smoking Among Adults, Worcester and MD, 2013-2019 (Three-Year Moving Average) ........................................................................................ 58
WORCESTER COUNTY COMMUNITY HEALTH ASSESSMENT
2021
8
Figure 88. Prevalence of Current Cigarette Smoking among Adults by Age-Group and Sex, Worcester, 2017-2019 .......................................................................................................... 58
Figure 89. Prevalence of Current Cigarette Smoking among Adults by Race, Worcester, 2012-2019 (Five-Year Moving Average) .......................................................................................... 59
Figure 90. High School Students Who Currently Smoked Cigarettes, Worcester and MD, 2013-2018 ........................................................................................................................... 59
Figure 91. High School Students Who Currently Smoked Cigarettes by Sex and Race, Worcester, 2018 ................................................................................................................... 59
Figure 92. Tobacco Use among High School Students, Worcester and MD 2018 ................... 60
Figure 93. Adult Binge Drinking, Worcester and MD, 2011-2019 ......................................... 61
Figure 94. Adult Binge Drinking by Gender and Age-Group, Worcester, 2017-2019 ............. 61
Figure 95. Current Smokers by Binge Drinking Status, Worcester, 2017-2019 .................... 61
Figure 96. Binge Drinking among High School Students, Worcester and MD, 2016 and 2018 ............................................................................................................................................ 62
Figure 97. Binge Drinking among High School Students by Race and Gender, Worcester, 2018 .................................................................................................................................... 62
Figure 98. Emergency Department Visit Rates for Addiction-Related Conditions, Worcester and MD, 2010-2017 ............................................................................................................. 64
Figure 99. Emergency Department Visit Rates for Addiction-Related Conditions by Race, Worcester, 2010-2017 .......................................................................................................... 64
Figure 100. Number of Drug and Alcohol Intoxication Deaths Occurring in Worcester, 2010-2019 (Three-Year Moving Average) ........................................................................................ 64
Figure 101. Number of Drug and Alcohol Intoxication Deaths .............................................. 65
Figure 102. Age-Adjusted Mortality Rate due to Drug and Alcohol Intoxication by Place of Residence, Worcester, 2016-2018 ......................................................................................... 65
Figure 103. Adults Who Reported Leisure Time Inactivity, Worcester and MD 2011-2019 (Three-Year Average) ............................................................................................................. 66
Figure 104. Adults Who Reported Leisure Time Inactivity by Age-Group, Gender, and Race, Worcester, 2017-2019 .......................................................................................................... 66
Figure 105. Adults Who Reported Leisure Time Inactivity by Weight Category, Worcester, 2017-2019 ........................................................................................................................... 66
Figure 106. Percentage of High School Students Participating in Physical Activity, Worcester and MD, 2018 ...................................................................................................................... 67
Figure 107. Adults with Self-Perceived Fair/Poor Health, Worcester and MD, 2012-2019 (Three-Year Moving Average) ................................................................................................. 68

WORCESTER COUNTY COMMUNITY HEALTH ASSESSMENT
2021
9
Figure 108. Adults with Self-Perceived Fair/Poor Health by Age Group, Sex, and Race, Worcester, MD, 2017-2019 ................................................................................................... 69
Figure 109. Adults Reporting 8+ Days Poor Health, Worcester and MD, 2017-2019 ............. 69
Figure 110. Adults with Lifetime Diagnosis of Depression, Worcester and MD, 2017-2019 (Three-Year Moving Average) ................................................................................................. 70
Figure 111. Adults with Lifetime Diagnosis of Depression by Age Group, Sex, and Race, Worcester, 2017-2019 .......................................................................................................... 70
Figure 112. Age-Adjusted Emergency Department Visit Rates Related to Mental Health Conditions, Worcester and MD, 2010-2017 .......................................................................... 72
Figure 113. Age-Adjusted Emergency Department Visit Rates Related to Mental Health Conditions by Race, Worcester, 2010-2017 ........................................................................... 72
Figure 114. Suicide by Method, Worcester, 2008-2019 ........................................................ 73
Figure 115. Crude Suicide Rates, Worcester and MD, 2008-2019 ........................................ 74
Figure 116. Birth Rate, Worcester and MD, 2012-2019 ....................................................... 74
Figure 117. Birth Rate by Race, Worcester, 2019 ................................................................. 74
Figure 118. Teen Birth Rate, Worcester and MD, 2011-2019 (Three-Year Moving Average) ... 75
Figure 119. Teen Birth Rate by Race, Worcester, 2011-2019 (Three-Year Moving Average) ... 75
Figure 120. Pregnant Women with Late/No Prenatal Care, Worcester and MD, 2011-2019 (Three-Year Moving Average) ................................................................................................. 75
Figure 121. Pregnant Women with Late/No Prenatal Care by Race, Worcester, 2017-2019 .. 76
Figure 122. Low Birthweight, Worcester and MD, 2011-2019 (Three-Year Moving Average) .. 76
Figure 123. Low Birthweight by Race, Worcester, 2017-2019 ............................................... 76
Figure 124. Infant Mortality Rate, Worcester and MD, 2009-2019 (Five-Year Moving Average) ............................................................................................................................................ 77
Figure 125. Infant Mortality by Infant Age at Death, Worcester, 2009-2019 (Five Year Moving Average) ............................................................................................................................... 77
Figure 126. Infant Deaths by Race, Worcester, 2009-2019 .................................................. 77
Figure 127. Births by Race, Worcester, 2009-2019 .............................................................. 77
Figure 128. Chlamydia Rate, Worcester and MD, 2010-2019 (Three-Year Moving Average)... 78
Figure 129. Gonorrhea Rate, Worcester and MD, 2010-2019 (Three-Year Moving Average) ... 79
Figure 130. Flu Vaccination Coverage among Adults 18 Years and Older, Worcester and MD 2011-2019 ........................................................................................................................... 79

WORCESTER COUNTY COMMUNITY HEALTH ASSESSMENT
2021
10
Figure 131. Pneumococcal Vaccination Coverage among Adults Aged 65 and Over, Worcester and MD, 2018-2019 ............................................................................................................. 80
Figure 132. Flu Vaccination Coverage by Race, and Sex Adults 65 Years and Older, Worcester, 2017-2019 (Three-Year Average) .......................................................................... 80
Figure 133. Flu Vaccination Coverage by County, Adults 65 Years and Older, MD, 2017-2019 (Three-Year Average) ............................................................................................................. 80
Figure 134. 2021 County Health Rankings for Worcester ..................................................... 81
Figure 135. County Health Rankings Model ......................................................................... 81
List of Tables
Table 1. Health Indicators, Worcester and MD ..................................................................... 14
Table 2. Percent of Households below the ALICE Threshold, Worcester, 2014-2018 ............. 26
Table 3. Percent of Households below the ALICE Threshold by Race, Worcester, 2018.......... 27
Table 4. Worcester Rankings by Household Income, 2015-2019 ........................................... 27
Table 5. Means of transportation to work, Worcester and MD, 2015-2019 ............................ 28
Table 6. Ratio of Population to Medical Providers, 2020 ....................................................... 32
Table 7. Emergency Department Visits in Worcester and MD by Demographic Characteristics, 2018 and 2019 ..................................................................................................................... 34
Table 8. Top Leading Cause of Death by Age Group, Worcester, ........................................... 38
Table 9. The Six Leading Causes of Death by Race, Worcester, 2017-2019 ........................... 39
Table 10. Ten Leading Causes of Death by Sex, Worcester, 2017-2019 ................................ 39
Table 11. Years of Potential Life Lost Before the Age of 75 (YPLL-75) Crude Rate, Worcester, 2013-2019 ........................................................................................................................... 41
Table 12. Top Ten Counties with High Emergency Department Visit Rate Due to Hypertension, 2017 .............................................................................................................. 47
Table 13. Age-Adjusted Cancer Incidence Rate, Worcester and MD, 2013-2017 ................... 49
Table 14. Lifetime Asthma Prevalence among High School Students, Worcester and MD, 2018 ............................................................................................................................................ 52
Table 15. Prevalence of Chronic Conditions by BMI Categories, Worcester, 2015-2019 ......... 57
Table 16. Top-Five Counties in MD with High Binge Drinking Rate, 2018 ............................ 62

WORCESTER COUNTY COMMUNITY HEALTH ASSESSMENT
2021
11
Table 17. Current and Lifetime Substance Use among High School Students, Worcester and MD, 2016 and 2018 ............................................................................................................. 63
Table 18. Current and Lifetime Substance Use among High School Students by Gender and Race, Worcester, 2018 .......................................................................................................... 63
Table 19. Percentage of High School Students Participating in Physical Activity by Sex, Grade, and Race, Worcester, MD, 2018 ............................................................................................ 67
Table 21. Adult Self-Perception of Health, Worcester and MD, 2017-2019 ............................ 68
Table 22. Adults Reporting 8+ Poor Health by Gender, Age Group, and Race, Worcester, 2015-2019 .................................................................................................................................... 69
Table 23. Adults Reporting 8+ Poor Health by Gender, Age Group and Race, Worcester, 2015-2019 .................................................................................................................................... 69
Table 24. Mental Health and Suicidal Behavior among High School and Middle School Students, Worcester and MD, 2018 ...................................................................................... 70
Table 25. Mental Health and Suicidal Behavior among High School and Middle School Students, Worcester and MD, 2018 ...................................................................................... 70
Table 26. Mental Health and Suicide Related Behavior among High School Students by Sex and Race, Worcester, 2016 and 2018 ................................................................................... 71
Table 27. Mental Health and Suicide Related Behavior among High School Students by Sex and Race, Worcester, 2016 & 2018 ....................................................................................... 71
Table 28. School Bullying among High School and Middle School Students, Worcester and MD, 2018 ............................................................................................................................. 71
Table 29. School Bullying among High School and Middle School Students, Worcester and MD, 2018 ............................................................................................................................. 71
Table 30. Prevalence of Adverse Childhood Experiences (ACEs) among Worcester and MD Adults, 2018 ........................................................................................................................ 72
Table 31. Characteristics of Suicide Deaths, Worcester, 2008-2019 (N=81) .......................... 73
Table 32. Infant Mortality Rate by Race, Worcester, 2009-2019 (Five-Year Moving Average) . 78
Table 33. Changes in County Health Rankings, 2016 to 2021 .............................................. 82
Table 34. Tri-County (Worcester, Wicomico, and Somerset) Health Outcome and Health Factor Rankings, 2021 .................................................................................................................... 82

WORCESTER COUNTY COMMUNITY HEALTH ASSESSMENT
2021
13
Introduction
This Worcester County Community Health Assessment (CHA) is part of an on-going community health improvement process and the third completed using the MAPP (Mobilizing for Action through Planning and Partnerships) model. The MAPP tool was developed by the National Association of County and City Health Officials (NACCHO) in collaboration with the Centers for Disease Control and Prevention (CDC).
The first CHA using the MAPP model was conducted in 2011 as part of the health department’s Public Health Accreditation Board (PHAB) process. Worcester is one of the first two health departments in the state to become accredited.
The ultimate goal of a community health assessment is to develop strategies to address the community’s health needs and identified issues. Over the past four years we have made considerable effort to meet the goals of the four priority areas that members of our community identified in the 2017 community health needs assessment.
The assessment describes the health status of Worcester County residents and examines health trends over time. The report includes a range of indicators relevant to the county. Data used in this report came from different sources:
Maryland Behavioral Risk Factor Surveillance System (MD BRFSS) Maryland Vital Statistics Data US Census Bureau MD Health Services Cost Review Commission (HSCRC) Maryland Youth Risk Behavior Survey (YRBS) Infectious Disease and Environmental Health Administration (IDEHA) State Health Improvement Process (MD-SHIP) MD Primary Care Office CDC, National Center for Health Statistics
Worcester County has a relatively small year round population. This often causes a large fluctuation in estimates from year to year. To increase stability, many of the estimates in this report are presented based on data combined from multiple years.
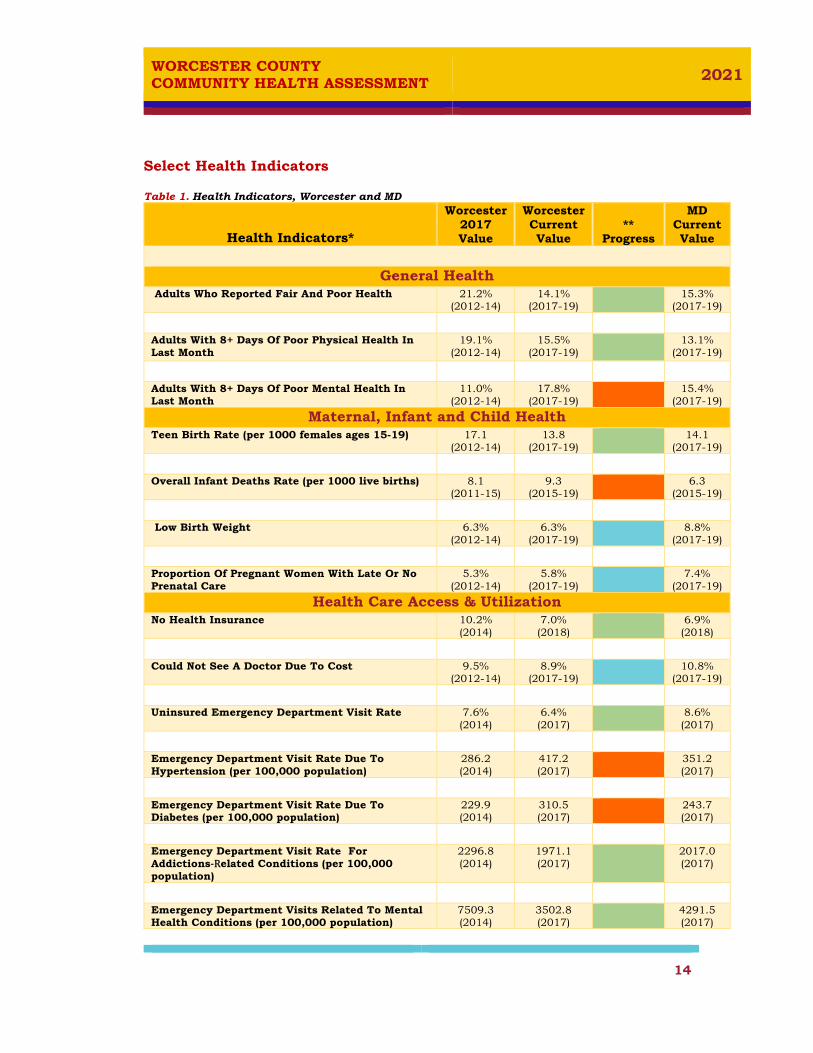
Table 1 shows some health indicators relevant to Worcester County and the State Health Improvement Process (SHIP) six vision areas.
WORCESTER COUNTY COMMUNITY HEALTH ASSESSMENT
2021
14
Select Health Indicators
Table 1. Health Indicators, Worcester and MD
Health Indicators*
Worcester 2017 Value
Worcester Current Value
** Progress
MD Current Value
General Health
Adults Who Reported Fair And Poor Health
21.2% (2012-14)
14.1% (2017-19)
15.3%
(2017-19)
Adults With 8+ Days Of Poor Physical Health In Last Month
19.1% (2012-14)
15.5% (2017-19)
13.1%
(2017-19)
Adults With 8+ Days Of Poor Mental Health In Last Month
11.0% (2012-14)
17.8% (2017-19)
15.4%
(2017-19)
Maternal, Infant and Child Health Teen Birth Rate (per 1000 females ages 15-19) 17.1
(2012-14) 13.8
(2017-19) 14.1
(2017-19)
Overall Infant Deaths Rate (per 1000 live births) 8.1 (2011-15)
9.3 (2015-19)
6.3 (2015-19)
Low Birth Weight 6.3% (2012-14)
6.3% (2017-19)
8.8% (2017-19)
Proportion Of Pregnant Women With Late Or No Prenatal Care
5.3% (2012-14)
5.8% (2017-19)
7.4%
(2017-19)
Health Care Access & Utilization No Health Insurance 10.2%
(2014) 7.0% (2018)
6.9% (2018)
Could Not See A Doctor Due To Cost 9.5% (2012-14)
8.9% (2017-19)
10.8% (2017-19)
Uninsured Emergency Department Visit Rate 7.6% (2014)
6.4% (2017)
8.6% (2017)
Emergency Department Visit Rate Due To Hypertension (per 100,000 population)
286.2 (2014)
417.2 (2017)
351.2 (2017)
Emergency Department Visit Rate Due To Diabetes (per 100,000 population)
229.9 (2014)
310.5 (2017)
243.7 (2017)
Emergency Department Visit Rate For Addictions-Related Conditions (per 100,000 population)
2296.8 (2014)
1971.1 (2017)
2017.0 (2017)
Emergency Department Visits Related To Mental Health Conditions (per 100,000 population)
7509.3 (2014)
3502.8 (2017)
4291.5 (2017)

WORCESTER COUNTY COMMUNITY HEALTH ASSESSMENT
2021
15
Health Indicators*
Worcester 2017 Value
Worcester Current Value
** Progress
MD Current Value
Preventive Services Adults 65+ Who Have Had A Flu Shot (in the past 12 months)
64.2% (2014)
67.3% (2019)
68.4% (2019)
Adults 65+ Who Have Ever Had Pneumonia Shot 72.2% (2014)
70.4% (2019)
76.9% (2019)
Age 50+ Who Ever Had A Sigmoidoscopy/Colonoscopy
73.2% (2012-14)
80.2% (2018)
75.3% (2018)
Women Age 50+ Who Had Last Mammogram More Than 2yrs/Ever
19.5% (2012-14)
23.5% (2018)
18.8% (2018)
Adults Who Visited The Dentist Or Dental Clinic Within the Past Year
68.0% (2012-14)
69.8% (2018)
66.8% (2018)
Health Behaviors Current Smokers -18 And Older 15.2%
(2012-14) 15.5%
(2017-19) 13.0%
(2017-19)
Current Smokers -High School Students 14.7% (2014)
7.7% (2018)
5.0% (2018)
High School Students Who Ever Used Electronic Vapor Products (e-cigarettes, e-pipes, vape pipes, vaping pens, e-hookahs, and hookah pens)
43.1% (2014)
41.4% (2018)
27.4% (2018)
Binge Drinking Among Adults 15.1% (2012-14)
13.1% (2017-19)
14.2% (2017-19)
Binge Drinking Among High School Students 20.0% (2014)
19.2% (2018)
12.0% (2018)
No Leisure Time Physical Activities/Exercise in the Last 30 Days
27.4% (2012-14)
28.6% (2017-19)
23.9% (2017-19)
High School Students Who were Physically Active at Least 60 Minutes Per Day on five or More Days Per Week
42.5% (2014)
43.0% (2018)
36.5% (2018)
Chronic Disease and Conditions Obese -18 And Older (BMI ≥30) 31.7%
(2012-14) 34.3%
(2017-19) 31.5%
(2017-19)
Obese –High School Students 13.5% (2014)
13.4% (2018)
12.6% (2018)
High Blood Pressure Among Adults 36.7% 2011/2013
39.5% 2017/2019
34.0%
2017/19
Diabetes Among Adults 16.7% (2012-14)
13.3% (2017-19)
11.1% (2017-19)

WORCESTER COUNTY COMMUNITY HEALTH ASSESSMENT
2021
16
Health Indicators*
Worcester 2017 Value
Worcester Current Value
** Progress
MD Current Value
Adults With Cardiovascular Disease (angina, heart attack or a stroke)
16.7% (2012-14)
10.3% (2017-19)
7.7%
(2017-19)
Adults With Current Asthma 6.8% (2012-14)
9.4% (2017-19)
9.3%
(2017-19)
Adults With COPD 5.7% (2012-14)
4.7% (2017-19)
5.6%
(2017-19)
Chlamydia Incidence (per 100,000 population) 361.0 (2013-15)
408.9 (2017-19)
569.2
(2017-19)
Gonorrhea Incidence (per 100,000 population) 119.7 (2013-15)
102.7 (2017-19)
175.5
(2017-19)
Age-Adjusted All Cancer Sites Incidence (per 100,000 population)
507.6 (2008-12)
482.0 (2012-16)
443.9
(2012-16)
Mortality Life Expectancy 80
(2012-2014) 79.6
(2017-19) 79.2
(2017-19)
Age-Adjusted Death Rate For All Causes (per 100,000 population )
691.4 (2012-14)
692.7 (2017-19)
713.0
(2017-19)
Age-Adjusted Heart Disease Death Rate (per 100,000 population )
183.1 (2012-14)
187.7 (2017-19)
161.9
(2017-19)
Age-Adjusted Cancer Death Rate For All Cancer Sites (per 100,000 population)
175.7 (2012-14)
154.6 (2017-19)
148.6 (2017-19)
Age-Adjusted Death Rate due to Drug and Alcohol Intoxication (per 100,000 population)
18.3 (2011-15)
40.6 (2016-18)
32.0 (2016-18)
Crude Suicide Death Rate (per 100,000 population)
12.8 (2010-14)
12.8 (2015-19)
10.2 (2015-19)
**Indicator progress is based on a simple comparison between the 2017 and current value. Statistical significance test not conducted
Improved Worsened No Change

WORCESTER COUNTY COMMUNITY HEALTH ASSESSMENT
2021
17
Worcester County Population Profile
Worcester County accounts for about 0.9% of the MD’s population. The county ranked 17th in the state for total population. In 2019, the total population of Worcester County was estimated to be 52,276, an increase of 0.9% from 2018.
In 2019, the population of Worcester increased by 1.5% from 2011 total population, while the overall state increased by 3.5%.
Source: US Census Bureau
Demographics
Age Worcester Median age: 50.4 Maryland Median age: 38.7 US Median Age: 38.1
Worcester is the second oldest county in MD with 28.2% of the total population aged 65 and older.
Source: US Census Bureau
Figure 1. Worcester Population
2011
2012
2013
2014
2015
2016
2017
2018
2019
51,501
51,580
51,550
51,572
51,425
51,424
51,577
51,823
52,276
Figure 2. Worcester Population by Age Group, 2019
UNDER 20 20-44 45-64 65+
18.8%24.8%
28.1% 28.2%

WORCESTER COUNTY COMMUNITY HEALTH ASSESSMENT
2021
18
Between 2011-2019, the 65 and older population grew by 21% while the other age groups declined.
Source: US Census Bureau
By 2030, 3 in 10 Worcester residents (31% of the projected 57,949 population) will be ages 65 and older.
Source: Maryland Department of Planning
Sex, Race, & Ethnicity
Source: US Census Bureau
Figure 3. Worcester Population by Age Group, 2010-2019
18.8
24.8
28.1
28.2
10
15
20
25
30
35
2011 2012 2013 2014 2015 2016 2017 2018 2019
Per
cen
t
Under 20 20-44 45-64 65+
Figure 4. Projected Worcester Population by Age Group
Under 20 20-44 45-64 65+
18.8
24.8
28.1 28.2
18.7
24.225.8
31.4
Per
cen
t
2019 Projected 2030
Figure 5. Worcester Population by Race, 2019
NonHispanic
White
NonHispanic
Black
Hispanic Asian Others
80.0%
12.7%3.7% 1.5% 2.0%
48%52%Male
Female

WORCESTER COUNTY COMMUNITY HEALTH ASSESSMENT
2021
19
Social Determinants of Health
Social determinants of health (SDOH) are the environmental conditions where people are born, live, learn, work, play, worship, and age that affect a wide range of health, functioning and quality-of-life outcomes and risks. They include factors like socioeconomic status, education, neighborhood, and physical environment, employment, and social support networks, as well as access to health care. One of Heathy People 2030’s goals is specifically related to SDOH (Healthy People 2030, U.S. Dept. of Health and Human Service).
Source: Healthy People 2030, U.S. Department of Health and Human Services, Office of Disease Prevention and Health Promotion
Income 17.9% Worcester households earn less than $24K, compared to 13.1% of MD households. Worcester median household income for 2015-2019 was $63,499. It was the 10th lowest in the state, and $21,000 less than the overall MD median ($84,805).
Source: 2019 American Community Survey (ACS) 5- Year Estimate
Figure 6. Household Income, Worcester and MD, 2015-2019
Under $24K
$25K-$49K
$50K-$99K
$100K-199K
Over $200K
13.1%
16.0%
28.5%
29.5%
12.7%
17.9%
22.7%
31.0%
21.8%
6.5%
Worcester
MD

WORCESTER COUNTY COMMUNITY HEALTH ASSESSMENT
2021
20
67% of Worcester County households income comes from wages and salaries, about 12 percentage points less than the state. Social Security benefit accounts for a large share of income (46%) in Worcester. Some households received income from more than one source.
Source: 2019 ACS 5-Year Estimate
Poverty In 2019, 9.9% of the total Worcester population were living in poverty, slightly higher than the state average. 14% of school age children (Ages 5-17) lived in poor families, compared to 11.9% overall in MD. Source: Small Area Income & Poverty Estimates
About 1 in 5 (21.1%) blacks were below poverty level, compared with 7.2% of whites. In 2015-2019, 8.6% of men, and 9.5% of women were below poverty level.
Source: 2019 ACS 5-Year Estimate
Figure 8. Poverty Rate, 2019
ALL AGE IN POVERTY AGES 5-17 IN FAMILIES IN POVERTY
9.9%
14.0%
9.1%
11.9%
Worcester MD
Figure 9. Poverty by Race/ Ethnicity & Sex, Worcester, 2015-2019
NonHispanic
White
NonHispanic
Black
Hispanic Asian Male Female
7.2%
21.1%
8.6% 9.2% 8.6% 9.5%
Figure 7. Sources of Household Incomes, Worcester and MD, 2015-2019
2.2%
4.5%
10.8%
10.9%
22.6%
28.3%
79.1%
2.0%
4.0%
10.1%
12.9%
31.6%
46.0%
67.1%
Cash public assistance
Supplemental Security
Food stamps/SNAP
Self-Employment
Retirement
Social Security
Wages/Salary
MDWorcester

WORCESTER COUNTY COMMUNITY HEALTH ASSESSMENT
2021
21
The poverty rate in Worcester has decreased by 4.8% from 2018 to 2019.
Source: Small Area Income & Poverty Estimates
In 2019, Worcester ranked 11th with high poverty rate out of 24 Maryland counties, moving down one spot from 2018.
Source: Small Area Income & Poverty Estimates
During 2015-2019, 9.7% of households in Worcester participated in Supplemental Nutrition Assistance Program (SNAP). Whites make 58.5% of SNAP recipients, followed by 39.5% black, 1.3% Hispanic, and 0.8% Asian.
Source: 2019 ACS 5- Year Estimate
Figure 11. Top-Ten Counties with High Poverty Rate, 2019
Somerset
Baltimore City
Dorchester
Wicomico
Allegany
Garrett
Kent
Washington
Caroline
Cecil
Worcester
23.6
20.4
16.4
16.0
16.0
12.8
12.4
12.3
12.1
10.3
9.9
Figure 10. All ages in poverty, Worcester and MD, 2011-2019
13.0 13.1
11.3
9.910.4
9.9
10.2 10.2 9.99.4 9.1 9.1
2011 2012 2013 2014 2015 2016 2017 2018 2019
Per
cent
Worcester County Maryland
Figure 12. Proportion of Households participating in SNAP program by race/ethnicity, Worcester, 2015-2019
58.5%
1.3%
39.5%
0.8%
WhiteHispanic BlackAsian

WORCESTER COUNTY COMMUNITY HEALTH ASSESSMENT
2021
22
Educational Attainment
Approximately 75% of Worcester County’s total population were 25 years of age or older. Of those: 91% had at least graduated from high school. 29.1% had a bachelor’s degree or higher, compared to 40.1% overall in MD. Source: 2019 ACS 5-Year Estimate
Compared with 53.7% of Asian and 31.3% of non-Hispanic whites only 13.8% of blacks had attained a bachelor’s degree or more.
Source: 2019 ACS 5-Year Estimate
The poverty rate declined as educational attainment increased. For residents 25 and older, the poverty rate for individuals with less than high school education was 16.9%, while the rate for people with bachelor’s degree or higher was 4 times lower (4.8%). Source: 2019 ACS 5-Year Estimate
Figure 13. Educational Attainment of People 25 and Older in Worcester and MD, 2015-2019
8.7%
31.8%
30.5%
18.6%
10.5%
9.8%
24.6%
25.4%
21.5%
18.6%
Less than high school
High school graduate (includesequivalency)
Some college or associate'sdegree
Bachelor's degree
Graduate or professional degree
Worcester MD
Figure 14. Percent Racial/Ethnic groups with a Bachelor Degree or Higher, 2015-2019
Asian
Non- HispanicWhite
Hispanic
Non-HispanicBlack
53.7%
31.3%
20.4%
13.8%
Figure 15. Poverty Rate by Educational Attainment, 2015-2019
Less than highschool
High schoolgraduate(includes
equivalency)
Some collegeor associate's
degree
Bachelor'sdegree or
higher
16.9%
9.3%6.0% 4.8%

WORCESTER COUNTY COMMUNITY HEALTH ASSESSMENT
2021
23
Employment During 2015-2019, 55% of Worcester’s 16 and over population worked in civilian labor, 9 percentage points lower than the rate in MD:63.7%. The largest percentage (35%) of population were in management, business science and arts occupations, followed by sales and office occupations.
Source: 2019 ACS 5-Year Estimate
The education and health service industry employed the largest number of people in Worcester and overall in state, with 19.7% and 23.7%, respectively. The entertainment, recreation, and food services industry was the next largest with 19% of total employment.
Source: 2019 ACS 5-Year Estimate
The unemployment rate in Worcester and overall in MD has been steadily declining since 2011. The unemployment rate in Worcester has remained higher than the state in the last decade, however, the gap has been narrowing from 6.5 percentage point in 2011 to 3.7 percentage point in 2019.
Figure 16. Occupations for the civilian employed population 16 years and over, Worcester, 2015-2019
35%
24%
23%
10%8%
Management, business,sciences, and arts
Sales and office
Service occupations
Natural resources,construction, andmaintenanceProduction,transportation, andmaterial moving
Figure 17. Worcester Civilian Workers by Industry Group, 2015-2019
19.7
19.0
12.3
10.2
9.4
6.6
6.2
4.3
4.2
3.4
2.0
1.4
1.2
Educational services and health care
Arts, entertainment, recreation, and food services
Retail trade
Professional, scientific,and management
Construction
Finance and insurance, and real estate
Public administration
Manufacturing
Other Services, except public administration
Transportation and warehousing, and utilities
Wholesale trade
Agriculture, forestry, fishing and hunting
Information
Figure 18. Annual Unemployment Rate, Worcester and MD, 2011-2019
Source: U.S. Department of Labor (Data retrieved from MD Manual on-line website)
13.7%12.6%
10.6%
8.7%7.2%
7.2% 6.6%5.1%
4.2% 3.5%
2011 2012 2013 2014 2015 2016 2017 2018 2019
WorcesterMD

WORCESTER COUNTY COMMUNITY HEALTH ASSESSMENT
2021
24
Housing In 2015-2019, the median property value for owner-occupied houses in Worcester was $262,200. Worcester had a homeownership rate of 75.1%, compared with 66.9% for statewide. The median monthly housing costs for owners with a mortgage was $1,622 and for owners without a mortgage it was $589. For renter-occupied houses, the median gross rent for Worcester County, Maryland was $1,035.
Between 2010-2014 and 2015-2019, homeownership in Worcester increased by 21%, while statewide rate declined by 0.3%. During the same period, median house value and median gross rent in Worcester increased by 8.3% and 9.5%, respectively, compared to 9.5% and 14.3% increase statewide.
Source: 2019 ACS 5-Year Estimate
Households that pay thirty percent or more of their income on housing costs are considered cost-burdened. In 2015-2019, 39.2% Worcester homeowners with a mortgage, paid more than thirty percent of their income on housing costs compared to 27.5% MD households. Source: 2019 ACS 5-Year Estimate
Figure 19. Change in Median house value, median gross rent, and homeownership rate in Worcester and MD, 2015-2019
Median housevalue
Median gross rent Homeownershiprate
8.3%9.5%
21.2%
9.5%
14.3%
-0.3%
Worcester MD
Figure 20. Percent of households whose housing costs are 30 percent or more of their income, Worcester and MD, 2105-2019
OWNERS WITH MORTGAGE
OWNERS WITHOUT MORTGAGE
RENTERS
39.2%
17.2%
50.1%
27.5%
13.3%
49.7%
Worcester MD

WORCESTER COUNTY COMMUNITY HEALTH ASSESSMENT
2021
25
Homelessness In 2019, Maryland had an estimated 6,561 people experiencing homelessness on any given day. Of that total 275 (4.2%) were on the Lower Shore of MD (Dorchester, Wicomico, Worcester, and Somerset). (Source: The Maryland Interagency Council of Homelessness)
The number of individuals experiencing homelessness in 2019 declined by 6% (17 fewer individuals) from 2018.
(Source: The Maryland Interagency Council of Homelessness)
The total number of homeless individuals counted in 2019 was one fifth of the total number of homeless clients served during FY19.
In FY19 the annual total number of clients served was 8% lower than the total in FY18. Source: The Maryland Interagency Council of Homelessness
Figure 23. Total homeless clients served, Lower Shore, MD
FY15 FY16 FY17 FY18 FY19
9101184
1416 1509 1384
Figure 22. Annual homeless point in time count, Lower Shore, MD, 2016-2019
2016 2017 2018 2019
262 260292 275
Figure 21. Annual homeless point in time count by Jurisdiction, 2019
GarrettCecil County
CarrollAllegany
Mid-ShoreHowardHarford
WashingtonLower Shore
FrederickAnne Arundel
Southern MarylandPrince George’s
MontgomeryBaltimore
Baltimore City
12126144145164201228249275286302306
447647735
2294

WORCESTER COUNTY COMMUNITY HEALTH ASSESSMENT
2021
26
Overall, Worcester County has an older population, a higher poverty rate and a higher unemployment rate than the state average. According to the 2020 ALICE (Asset Limited, Income Constrained, Employed) report released by United Way of Maryland, more than one-third of households in Worcester County either live in poverty or qualify as ALICE (Figure 24).
ALICE comprises households that earn more than the Federal Poverty Level but less than the basic cost of living for the state.
In 2018, 10% of Worcester’s 22,162 households earned below the Federal Poverty Level, and another 30% were ALICE. The percentage of households living below the ALICE Threshold (ALICE and poverty-level households combined) increased from 33% in 2010 to 40% in 2018.
Source: 2018 United Way ALICE Report for Maryland
In all places with the exception of Berlin, the number of ALICE households are increasing in 2018. Pocomoke City and Snow Hill, the two towns with the highest percentage of households below the ALICE Threshold, also have the higher proportion of black population. The two towns combined represent 38% of the total non-Hispanic black population in the county.
Figure 24. Household Income, Worcester, 2010-2018
2010 2012 2014 2016 2018
11% 9% 10% 10% 10%
22% 29% 28% 28% 30%
67% 62% 62% 62% 61%
Above ALICE HouseholdALICE HouseholdPoverty Household
Table 2. Percent of Households below the ALICE Threshold, Worcester, 2014-2018
Place % ALICE & poverty 2014 2016 2018
Pocomoke City 56% 66% 67% Snow Hill 47% 59% 61% Berlin 35% 47% 43% West Ocean City 32% 37% 40% Ocean City 27% 37% 42% Ocean Pines 19% 27% 31%
Source: United Way ALICE Report for Maryland
WORCESTER COUNTY COMMUNITY HEALTH ASSESSMENT
2021
27
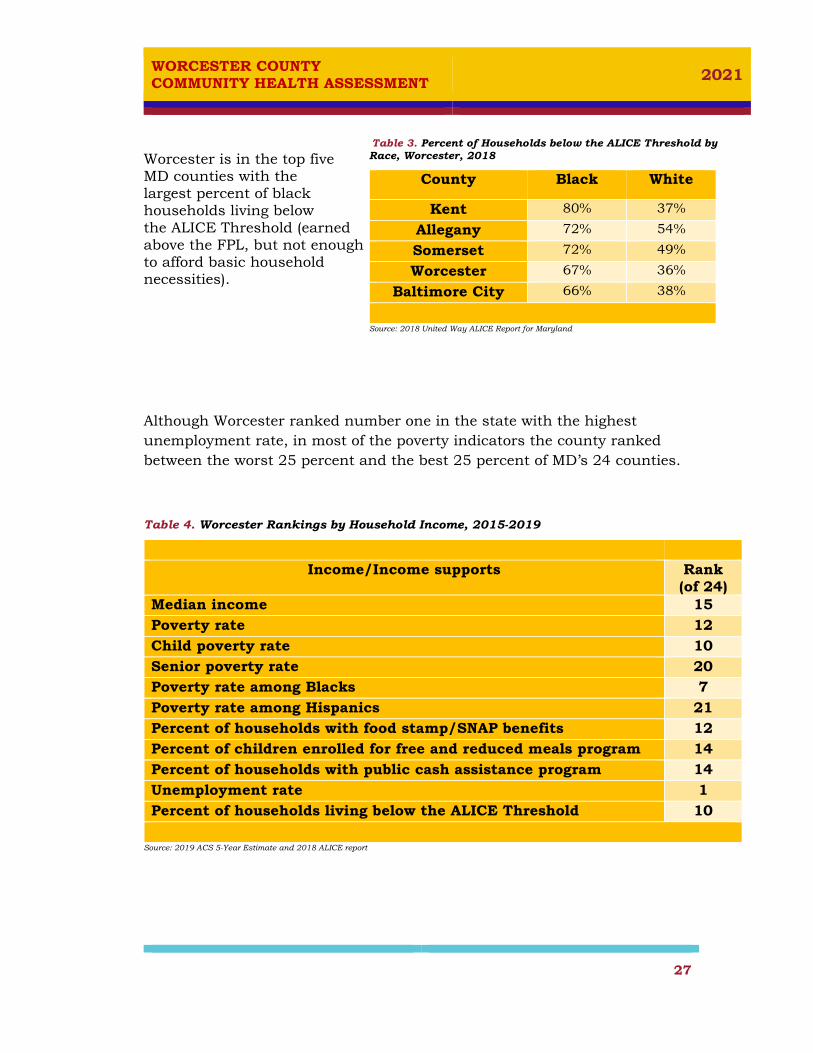
Worcester is in the top five MD counties with the largest percent of black households living below the ALICE Threshold (earned above the FPL, but not enough to afford basic household necessities).
Although Worcester ranked number one in the state with the highest unemployment rate, in most of the poverty indicators the county ranked between the worst 25 percent and the best 25 percent of MD’s 24 counties.
Table 4. Worcester Rankings by Household Income, 2015-2019
Income/Income supports Rank
(of 24) Median income 15 Poverty rate 12 Child poverty rate 10 Senior poverty rate 20 Poverty rate among Blacks 7 Poverty rate among Hispanics 21 Percent of households with food stamp/SNAP benefits 12 Percent of children enrolled for free and reduced meals program 14 Percent of households with public cash assistance program 14 Unemployment rate 1 Percent of households living below the ALICE Threshold 10
Source: 2019 ACS 5-Year Estimate and 2018 ALICE report
Table 3. Percent of Households below the ALICE Threshold by Race, Worcester, 2018
County Black White
Kent 80% 37%
Allegany 72% 54%
Somerset 72% 49%
Worcester 67% 36%
Baltimore City 66% 38%
Source: 2018 United Way ALICE Report for Maryland

WORCESTER COUNTY COMMUNITY HEALTH ASSESSMENT
2021
28
Transportation
According to the 2015-2019 ACS, an estimated 80.8% of Worcester County workers, and 73.9% of workers in MD, travel to work alone. 2.5% of workers in Worcester use public transportation to get to work, compared with 8.4% of workers overall in MD.
Food Insecurity
Food insecurity, defined by United States Department of Agriculture (USDA), is “[a] limited or uncertain availability of nutritionally adequate and safe foods or limited or uncertain ability to acquire acceptable foods in socially acceptable ways”.
In 2018, 1 in 8 (13.3%) Worcester residents were estimated to be food insecure, 20% higher than the state average. Compared to 2017, the number of individual who were food insecure in 2018 increased by 14%.
In Worcester, 34% of food insecure individuals earn too much money to qualify for most federal nutrition assistance programs in 2018. Source: Feeding America Map the Meal Gap
Table 5. Means of transportation to work, Worcester and MD, 2015-2019
Worcester MD
% %
Car, truck, van -- drove alone 80.8 73.9
Car, truck, van -- carpooled 7.4 8.9
Public transportation (excluding taxicab)
2.5 8.4
Walked 2.2 2.3
Other means 1.7 1.5
Worked at home 5.5 5.0
Source: 2019 ACS 5-Year Estimate
Figure 25. Food Insecurity Rate, Worcester and MD, 2016-2018
2016 2017 2018
11.6% 11.7%
13.3%
11.1% 10.7% 11.0%
Worcester MD

WORCESTER COUNTY COMMUNITY HEALTH ASSESSMENT
2021
29
Access to Health Care
Access to health care is one of the five domains of SDOH. Access to health care means having "the timely use of personal health services to achieve the best health outcomes" (IOM, 1993).
Access to health care consists of four components (Healthy People 2020)
Coverage: gaining entry into the health care system Services: accessing a health care location where needed services are provided Timeline: ability to provide health care when the need is recognized Workforce: finding a health care provider with whom the patient can communicate and trust
Health insurance coverage status affects access to health care. Studies show that uninsured adults in the United States have less access to recommended care, receive poorer quality of care, and experience worse health outcomes than insured adults (IOM, 2002).
Health Insurance Coverage
The number of people in Worcester without health insurance significantly declined during last decade. The uninsured rate among persons under 65 declined by 50%, from 14% in 2013 to 7% in 2018.
Source: Small Area Health Insurance Estimates
Figure 26. No health insurance coverage among persons under age 65, Worcester and MD, 2010-2018
14.6% 14.0%
7.7% 7.8%7.0%
12.7%11.7%
7.4% 7.0% 6.9%
2010 2011 2012 2013 2014 2015 2016 2017 2018
Worcester MD
WORCESTER COUNTY COMMUNITY HEALTH ASSESSMENT
2021
30
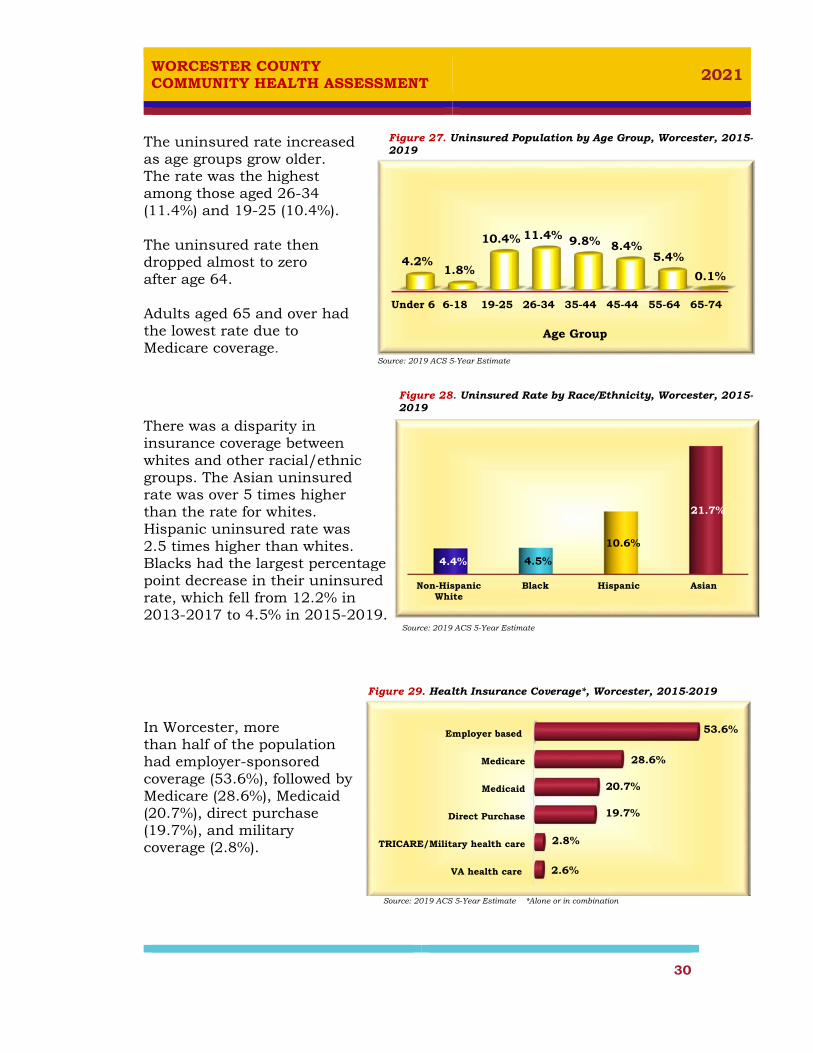
The uninsured rate increased as age groups grow older. The rate was the highest among those aged 26-34 (11.4%) and 19-25 (10.4%). The uninsured rate then dropped almost to zero after age 64. Adults aged 65 and over had the lowest rate due to Medicare coverage. Source: 2019 ACS 5-Year Estimate
There was a disparity in insurance coverage between whites and other racial/ethnic groups. The Asian uninsured rate was over 5 times higher than the rate for whites. Hispanic uninsured rate was 2.5 times higher than whites. Blacks had the largest percentage point decrease in their uninsured rate, which fell from 12.2% in 2013-2017 to 4.5% in 2015-2019. Source: 2019 ACS 5-Year Estimate In Worcester, more than half of the population had employer-sponsored coverage (53.6%), followed by Medicare (28.6%), Medicaid (20.7%), direct purchase (19.7%), and military coverage (2.8%).
Source: 2019 ACS 5-Year Estimate *Alone or in combination
Figure 27. Uninsured Population by Age Group, Worcester, 2015-2019
Under 6 6-18 19-25 26-34 35-44 45-44 55-64 65-74
4.2%1.8%
10.4% 11.4% 9.8% 8.4%5.4%
0.1%
Age Group
Figure 28. Uninsured Rate by Race/Ethnicity, Worcester, 2015-2019
Non-HispanicWhite
Black Hispanic Asian
4.4% 4.5%
10.6%
21.7%
Figure 29. Health Insurance Coverage*, Worcester, 2015-2019
Employer based
Medicare
Medicaid
Direct Purchase
TRICARE/Military health care
VA health care
53.6%
28.6%
20.7%
19.7%
2.8%
2.6%

WORCESTER COUNTY COMMUNITY HEALTH ASSESSMENT
2021
31
In 2018, an estimated 14,381 (28% of Worcester population) were enrolled in Medicare. That is a 17% increase from 2010. Of this total, 13.4% of enrollees were dually eligible and enrolled in both Medicaid and Medicare. The percent of Medicare-Medicaid enrollees also increased by 22%, from 10.9% in 2010 to 13.4% in 2018. Source: CMS.Gov
In 2019, on average 13,378 individuals (25% of Worcester population) enrolled in Medicaid. for each month. That was more than a 50% increase from 2010 (8,807). Source: Maryland Medicaid eHealth Statistics
Source: 2019 ACS 5-Year Estimate
Figure 30. Number of Medicare Beneficiaries, Worcester, 2010-2018
10.9% 11.2% 11.4% 11.5% 12.5% 12.5% 13.0% 13.4% 13.4%
12,3
00
12,5
02
12,8
65
13,1
47
13,3
73
13,7
19
13,9
48
14,2
41
14,3
81
2010 2011 2012 2013 2014 2015 2016 2017 2018
Medicare beneficiaries with part A and part B
Percent eligible for medicaid
Figure 31. Average Monthly Enrollee in Medicaid, Worcester, 2010-2019
8,8
07
9,3
74
9,9
76
10,3
38
12,2
54
12,4
82
12,9
93
13,5
87
13,4
85
13,3
78
2010 2011 2012 2013 2014 2015 2016 2017 2018 2019
Aver
age
num
ber
per
mon
th
Figure 32. Medicaid Enrollee by Age Group, Worcester, 2015-2019
41.6%
47.3%
11.1%Under 19
19 to 64years
65 yearsand over
Figure 33. Medicare Enrollee by Age Group, Worcester, 2015-2019
0.2%
7.2%
92.6%

WORCESTER COUNTY COMMUNITY HEALTH ASSESSMENT
2021
32
Health Care Providers The U.S. Department of Health and Human Services (DHHS) Health Resources and Services Administration (HRSA) designates a geographic area, population group or a facility as a Health Professional Shortage Area (HPSA) or a Medically Underserved Area/Population (MUA/P) using several criteria.
The entire County of Worcester is both HPSA and MUA designated. This shortage designation could mean limited access to health care, longer wait time for patients, or overuse of emergency system of care.
The ratio of the Worcester County population to primary care physicians is higher than the state, but lower than the neighboring counties. The county’s population to mental health provider ratio is higher than the neighboring counties and the state ratio.
Health Care Service Utilization
Approximately 77% of Worcester adults had a routine checkup in the past year, compared to 80% statewide and more than 8 out of 10 adults in the county had a personal doctor or health care provider. Nearly 9 out of 10 Worcester residents reported that their ability to see a doctor is not impacted by cost, similar to the state rate. Source: MD BRFSS
Table 6. Ratio of Population to Medical Providers, 2020
County Ratio of population to medical providers
Primary Care
Physician
Mental Health
Providers
Dentists
Worcester 1,180:1 400:1 1,740:1 Wicomico 1,610:1 290:1 1,200:1 Somerset 2,850:1 340:1 470:1 Maryland 1,130:1 360:1 1,260:1
Source: 2021 County Health Rankings
Figure 34. Utilization of Primary Care Services, Worcester and MD, 2019
Routine checkup pastyear
Has one or morepersonal doctor
Ability to see doctornot impacted by cost
76.9%
85.9%
89.2%
80.1%
84.8%
89.1%
Worcester MD

WORCESTER COUNTY COMMUNITY HEALTH ASSESSMENT
2021
33
In 2019, less Worcester adults aged 65 and over reported having pneumonia and flu vaccine in the past 12 months than the state average. In 2018, 69.8% of Worcester residents visited a dentist last year, higher than the state rate of 66.8%. Almost 2 in 5 women in Worcester didn’t have a pap smear over the past three years and more than 2 out of 10 women over 50 didn’t have a mammogram over the past two years.
Source: MD BRFSS
The percentage of adolescents (ages 13-20) in Medicaid who received a wellness checkup decreased from 57% in 2014 to 53% in 2017. The rate was lower than the state average.
Source: Maryland’s State Health Improvement Process'(SHIP) website
Of the four race and ethnicity groups, Hispanic adolescents (70%) were more likely than black (59.5%), Asian (59.4%) and white (48.3%) adolescents in Medicaid to receive a well-child checkup during the past year.
Source: Maryland’s State Health Improvement Process (SHIP) website
Figure 35. Utilization of selective preventive services, Worcester and MD, 2018/2019
Women age 50+ who hadmammogram in last 2 years
Women who had pap test in past 3years
Age 50+ who ever hadsigmoidoscopy or colonoscopy
Adults who visited dentist in pastyear
Adults age 65+ who hadpneumonia shot
Adults 65+ who have had a fluvaccine during past 12 months
76.5%
61.4%
80.2%
69.8%
70.4%
67.0%
81.2%
69.4%
75.3%
66.8%
76.9%
68.7%
MD Worceter
Figure 36. Adolescents enrolled in Medicaid receiving a wellness checkup, Worcester and MD, 2010-2017
55.6%
57.0%
55.2%
52.1%53.0%
53.6%
58.0%
55.3%54.6%
2012 2013 2014 2015 2016 2017
Worcester MD
Figure 37. Adolescents enrolled in Medicaid receiving a wellness checkup by race/ethnicity, Worcester, 2017
54.3
48.6
52.859.5
52.4
70.2
45.0
59.4
2013 2014 2015 2016 2017
Per
ccen
t
White Black Hispanic Asian
WORCESTER COUNTY COMMUNITY HEALTH ASSESSMENT
2021
34
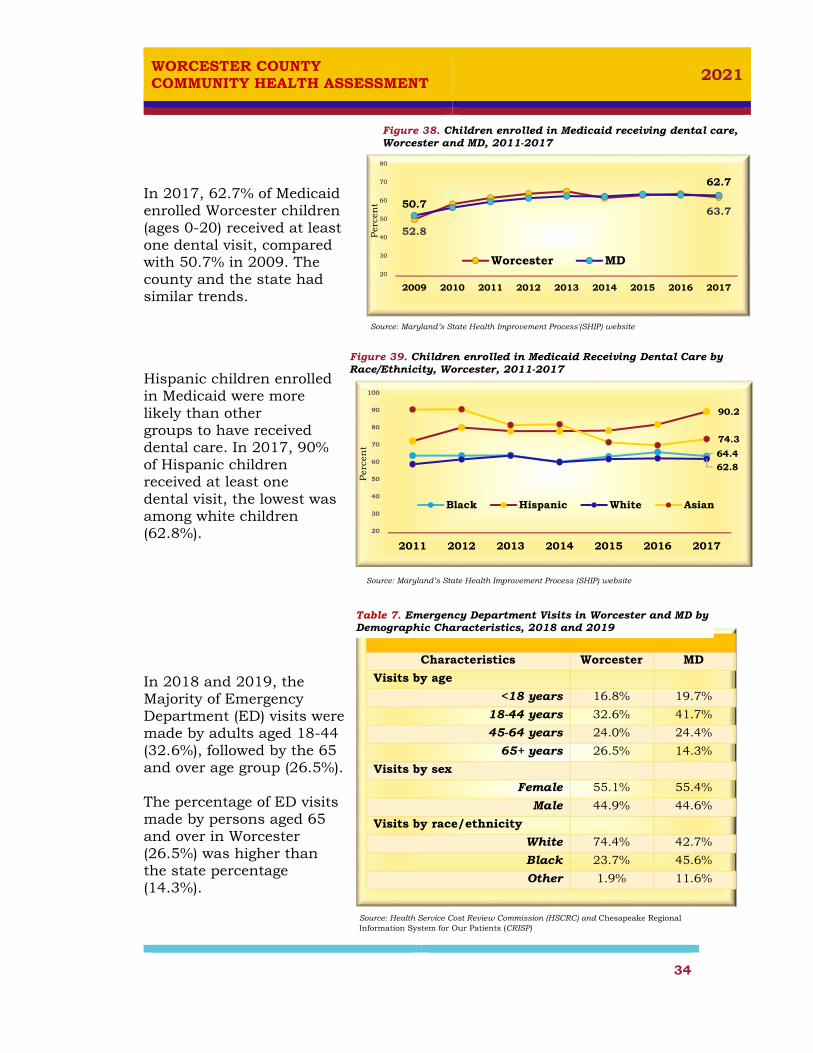
In 2017, 62.7% of Medicaid enrolled Worcester children (ages 0-20) received at least one dental visit, compared with 50.7% in 2009. The county and the state had similar trends.
Source: Maryland’s State Health Improvement Process'(SHIP) website
Hispanic children enrolled in Medicaid were more likely than other groups to have received dental care. In 2017, 90% of Hispanic children received at least one dental visit, the lowest was among white children (62.8%).
Source: Maryland’s State Health Improvement Process (SHIP) website
In 2018 and 2019, the Majority of Emergency Department (ED) visits were made by adults aged 18-44 (32.6%), followed by the 65 and over age group (26.5%). The percentage of ED visits made by persons aged 65 and over in Worcester (26.5%) was higher than the state percentage (14.3%).
Source: Health Service Cost Review Commission (HSCRC) and Chesapeake Regional Information System for Our Patients (CRISP)
Figure 39. Children enrolled in Medicaid Receiving Dental Care by Race/Ethnicity, Worcester, 2011-2017
64.4
90.2
62.8
74.3
20
30
40
50
60
70
80
90
100
2011 2012 2013 2014 2015 2016 2017
Per
cen
t
Black Hispanic White Asian
Figure 38. Children enrolled in Medicaid receiving dental care, Worcester and MD, 2011-2017
50.7
62.7
52.8
63.7
20
30
40
50
60
70
80
2009 2010 2011 2012 2013 2014 2015 2016 2017
Per
cen
t
Worcester MD
Characteristics Worcester MD
Visits by age
<18 years 16.8% 19.7%
18-44 years 32.6% 41.7%
45-64 years 24.0% 24.4%
65+ years 26.5% 14.3%
Visits by sex
Female 55.1% 55.4%
Male 44.9% 44.6%
Visits by race/ethnicity
White 74.4% 42.7%
Black 23.7% 45.6%
Other 1.9% 11.6%
Table 7. Emergency Department Visits in Worcester and MD by Demographic Characteristics, 2018 and 2019

WORCESTER COUNTY COMMUNITY HEALTH ASSESSMENT
2021
35
In 2018 and 2019, Medicaid was the expected payment source for 35% of ED visits. The percentage of ED visits covered by Medicare and commercial insurance was similar (29%).
Source: Health Service Cost Review Commission (HSCRC) and CRISP
The proportion of uninsured emergency visits in Worcester were consistently below the state. The proportion of ED visits by uninsured patients dropped from 18.8% in 2009 to 6.4% in 2017.
Source: Maryland’s State Health Improvement Process (SHIP) website
Between 2016-2019, Worcester’s ED visit rates (per 1,000 population) were consistently higher than the state rate but the rate has shown improvement from 2016, decreasing by 10%.
Source: Health Service Cost Review Commission (HSCRC) and CRISP
Figure 41. Uninsured Emergency Department Visit, Worcester and MD, 2009-2017
18.8
14.112.6
7.36.4
19.6
15.8 15.2
10.78.6
2009 2010 2011 2012 2013 2014 2015 2016 2017
Per
cen
t
Worcester MD
Figure 40. Emergency Department visits by source of payment, Worcester, 2018 and 2019
Medicare 29.4%
Medicaid 34.8%
Self-Pay and
Charity6.3%
Commerical and Other
29.5%
Figure 42. Emergency Department visit rate, Worcester and MD, 2016-2019
493.8 486.0459.9 445.1
309.9 300.1265.8 280.0
2016 2017 2018 2019
Rat
e per
1,0
00 p
opula
tion
Worcester MD

WORCESTER COUNTY COMMUNITY HEALTH ASSESSMENT
2021
36
In 2018 and 2019, Worcester ranked fifth out of 24 Maryland counties with high emergency department visit rates.
Source: Health Service Cost Review Commission (HSCRC) and CRISP
Life Expectancy and Leading Causes of Death
Life Expectancy is a summary mortality measure used to describe the overall health status of population. Between 2017-2019, average life expectancy at birth for Worcester’s population increased by 1.1 years, while overall in MD it remained the same. The life expectancy of an infant born in Worcester in 2019 was 79.6 years, 0.4 years above the MD average. Source: MD Vital Statistics Administration
Figure 43. Emergency Department visit rate by counties, 2018 and 2019, MD
Garrett
TalbotCaroline
St. Mary's
Somerset
Worcester
Kent
Wicomico
Baltimore
Dorchester
704.6
712.1
721.9
800.4
858.1
915.4
1031.0
1067.3
1110.6
1201.4
Rat
e per
1,0
00 p
opu
lati
on
Figure 44. Life Expectancy at Birth, Worcester and MD, 2011-2019
79.6 79.4
77.9
78.5
79.679.6 79.779.2 79.2
79.2
2011-13 2013-15 2015-17 2017-19
Age
in
Yea
rs
Worcester MD

WORCESTER COUNTY COMMUNITY HEALTH ASSESSMENT
2021
37
Between 2017-2019, life expectancy at birth for Worcester’s black population was about 4.3 years lower than for whites. Source: MD Vital Statistics Administration
In Worcester, between 2017-2019, life expectancy for females was 82.5 years and 76.7 years for males, a difference of 5.8 years.
Source: MD Vital Statistics Administration Worcester’s life expectancy rank improved from 14th in 2016-2018 to 6th highest in 2017-2019 out of 24 Maryland counties. In 2019, life expectancy for the U.S. population was 78.8 years.
Figure 45. Life Expectancy at Birth by Race, Worcester, 2017-2019
All Races White Black
79.6 80.2
75.9
Age
in
Yea
rs
Figure 46. Life Expectancy at Birth by Sex, Worcester, 2017-2019
Both Sexes Female Male
79.6
82.5
76.7
Age
in
Yea
rs
Figure 47. Life Expectancy at Birth Maryland Counties, 2017-2019
MONTGOMERY HOWARD
FREDERICK TALBOT
QUEEN ANNE’S WORCESTER
CALVERT ANNE ARUNDEL
PRINCE GEORGE’S HARFORD
KENT CARROLL
CHARLESST. MARY’S
GARRETT BALTIMORE COUNTY
WASHINGTON CAROLINE
ALLEGANY WICOMICO
CECIL DORCHESTER
SOMERSET BALTIMORE CITY
85.183.2
80.580.4
79.879.679.479.379.179.079.0
78.678.678.578.378.1
76.876.876.776.6
75.775.675.5
72.8
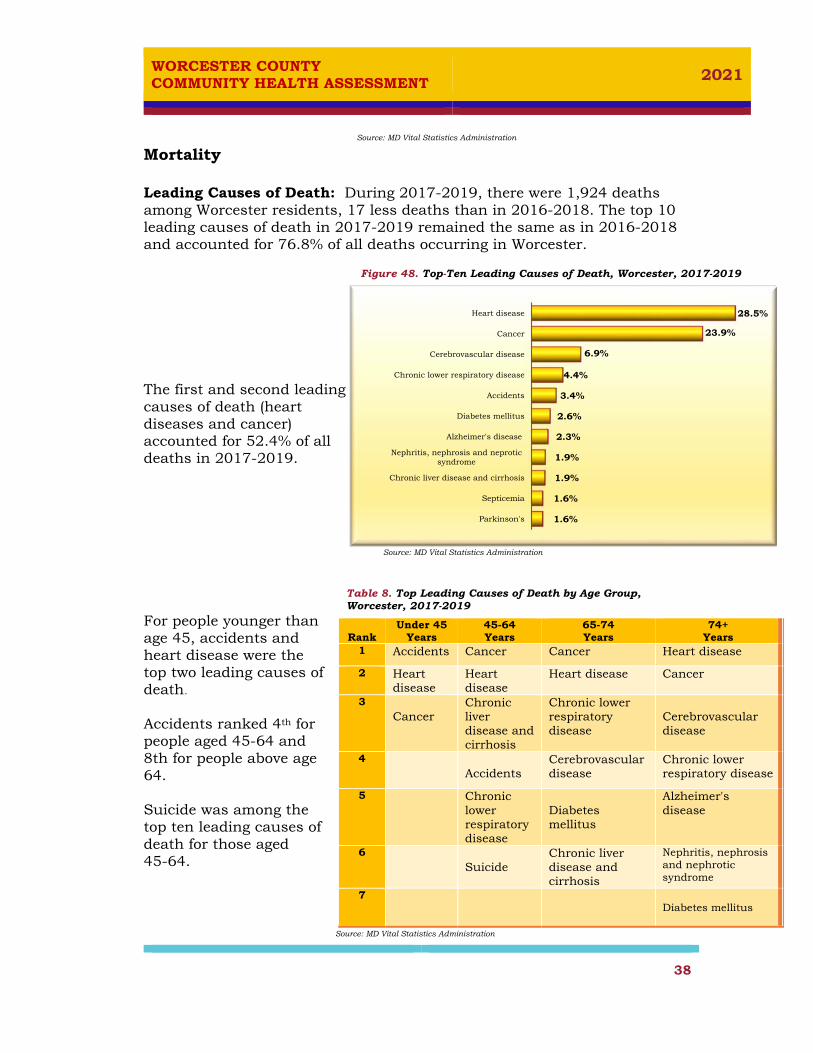
WORCESTER COUNTY COMMUNITY HEALTH ASSESSMENT
2021
38
Source: MD Vital Statistics Administration
Mortality Leading Causes of Death: During 2017-2019, there were 1,924 deaths among Worcester residents, 17 less deaths than in 2016-2018. The top 10 leading causes of death in 2017-2019 remained the same as in 2016-2018 and accounted for 76.8% of all deaths occurring in Worcester.
The first and second leading causes of death (heart diseases and cancer) accounted for 52.4% of all deaths in 2017-2019.
Source: MD Vital Statistics Administration
Table 8. Top Leading Causes of Death by Age Group, Worcester, 2017-2019
For people younger than age 45, accidents and heart disease were the top two leading causes of death. Accidents ranked 4th for people aged 45-64 and 8th for people above age 64. Suicide was among the top ten leading causes of death for those aged 45-64.
Source: MD Vital Statistics Administration
Rank
Under 45 Years
45-64 Years
65-74 Years
74+ Years
1 Accidents Cancer Cancer Heart disease
2 Heart disease
Heart disease
Heart disease Cancer
3 Cancer
Chronic liver disease and cirrhosis
Chronic lower respiratory disease
Cerebrovascular disease
4 Accidents
Cerebrovascular disease
Chronic lower respiratory disease
5
Chronic lower respiratory disease
Diabetes mellitus
Alzheimer's disease
6
Suicide
Chronic liver disease and cirrhosis
Nephritis, nephrosis and nephrotic syndrome
7 Diabetes mellitus
Figure 48. Top-Ten Leading Causes of Death, Worcester, 2017-2019
Heart disease
Cancer
Cerebrovascular disease
Chronic lower respiratory disease
Accidents
Diabetes mellitus
Alzheimer's disease
Nephritis, nephrosis and neproticsyndrome
Chronic liver disease and cirrhosis
Septicemia
Parkinson's
28.5%
23.9%
6.9%
4.4%
3.4%
2.6%
2.3%
1.9%
1.9%
1.6%
1.6%

WORCESTER COUNTY COMMUNITY HEALTH ASSESSMENT
2021
39
Table 9. The Six Leading Causes of Death by Race, Worcester, 2017-2019
Heart disease, cancer and stroke were the top three leading causes of death for both blacks and whites. Alzheimer’s was 6th in the top ten leading causes of death among whites only. Septicemia was among the top 10 causes of death among blacks, but not among whites. Source: MD Vital Statistics Administration Table 10. Ten Leading Causes of Death by Sex, Worcester, 2017-2019
Alzheimer’s was the 5th leading cause of death among females, but ranked 10th among males. Parkinson’s and suicide were in the top ten leading causes of death among males only.
Source: MD Vital Statistics Administration
Rank
Black, all ages
Percent
White, all ages
Percent
1 Heart disease 31.6 Heart disease 28.1
2 Cancer 18.2 Cancer 24.8
3
6.3 Cerebrovascular disease
7.0
4 Diabetes
4.4 Chronic lower respiratory disease
4.7
5 Nephritis and nephrotic syndrome
4.0 Accidents
3.2
6
Accidents
4.0
Alzheimer’s
2.6
7 Septicemia 3.6 Diabetes 2.3
Rank Male, all ages Percent Female, all ages Percent
1 Heart disease 28.8 Heart disease 28.2
2 Cancer 24.3 Cancer 23.4
3 Cerebrovascular disease
4.6 Cerebrovascular disease
9.3
4 Chronic lower respiratory disease
4.3 Chronic lower respiratory disease
4.4
5 Accidents 4.3 Alzheimer’s disease 2.9
6 Diabetes mellitus 3.2 Accidents 2.5
7 Nephritis, and nephrotic syndrome
2.3
Diabetes mellitus 1.9
8 Chronic liver disease
2.2
Septicemia 1.8
9
Parkinson’s disease
1.9
Nephritis, and nephrotic syndrome
1.7
10
Alzheimer's disease
Suicide
1.7
1.7
Chronic liver disease
1.5
disease (Stroke)Cerebrovascular

WORCESTER COUNTY COMMUNITY HEALTH ASSESSMENT
2021
40
The age-adjusted death rate for three year combined period 2017- 2019, was 692.7 deaths per 100,000 population, a decrease of 4.8% from the 2016-2018 rate and lower than the state rate of 713.0 deaths per 100,000 population.
Overall, the three-year average age-adjusted mortality rate for Worcester increased by 8.3% from 2012-2014 to 2015-2017. From 2015-2017 to 2017- 2019 the rate declined by 7.5%, compared to a 0.3% decrease for MD.
Source: MD Vital Statistics Administration
Heart disease is the number one cause of death in Worcester, killing nearly 548 people between 2017-2019. The age-adjusted rate decreased 8% from 202 per 100,000 population in 2016-2018 to 185.9 in 2017-2019. The age-adjusted death rate for cancer, the second leading cause of death has shown a downward trend. The rate Source: MD Vital Statistics Administration declined by 14% from180.4 per 100,000 population in 2013-15 to 154.6 in 2017-2019.
Figure 49. Age-Adjusted Mortality Rates for All Causes of Death, Worcester and MD, 2011-2019
705.8 707.1
748.5727.6
692.7708.3 703.1 715.3 717.5
713.0
2011-13 2013-15 2015-17 2017-19
Rat
e per
100,0
00 p
opu
lati
on
Worcester MD
Figure 50. Age-Adjusted Mortality Rate for the Top Two-Leading Causes of Death, Worcester, 2011-2019
183.4 180.9
198.6 202.0
185.9
180.7 180.4171.7
158.8154.6
2011-13 2013-15 2015-17 2017-19
Rat
e per
100,0
00 p
opu
lati
on
Heart disease Cancer

WORCESTER COUNTY COMMUNITY HEALTH ASSESSMENT
2021
41
The age-adjusted mortality rate for cerebrovascular disease, the 3rd leading cause of death, has been steadily increasing. The rate increased 14% in 2017-2019 from 38.7 in 2016-2018 to 44.3 per 100,000 population. The age-adjusted rate for chronic lower respiratory disease, the 4th leading cause of death, declined by 33% between 2011-2019. Source: MD Vital Statistics Administration
Premature Deaths Years of Potential Life Lost to 75 (YPLL-75) measures the relative impact of premature deaths on the community by counting the number of years that a person’s life was cut short by a premature death (for persons under 75 years of age).
Table 11. Years of Potential Life Lost Before the Age of 75 (YPLL-75) Crude Rate, Worcester, 2013-2019
Between 2017-2019 39.5% total deaths in Worcester were under 75 years of age. In 2017-2019, Worcester’s YPLL-75 crude rate was 8348.8 years of life lost per 100,000 population, 11.4% lower than the 2016-2018 rate.
Source: MD Vital Statistics Administration
YPLL rate per 100,000<75
2013-2015 8089.1 2014-2016 9187.5 2015-2017 9922.0 2016-2018 9422.9 2017-2019 8348.8
Figure 51. Age-Adjusted Mortality Rate for the Top Third and Fourth Leading Causes of Death, Worcester, 2011-2019
27.1 33.3
37.238.7
44.3
37.9 38.2
28.9 28.426.6
2011-13 2013-15 2015-17 2017-19R
ate
per
100,0
00 p
opu
lati
on
Cerebrovascular diseaseChronic lower respiratory disease
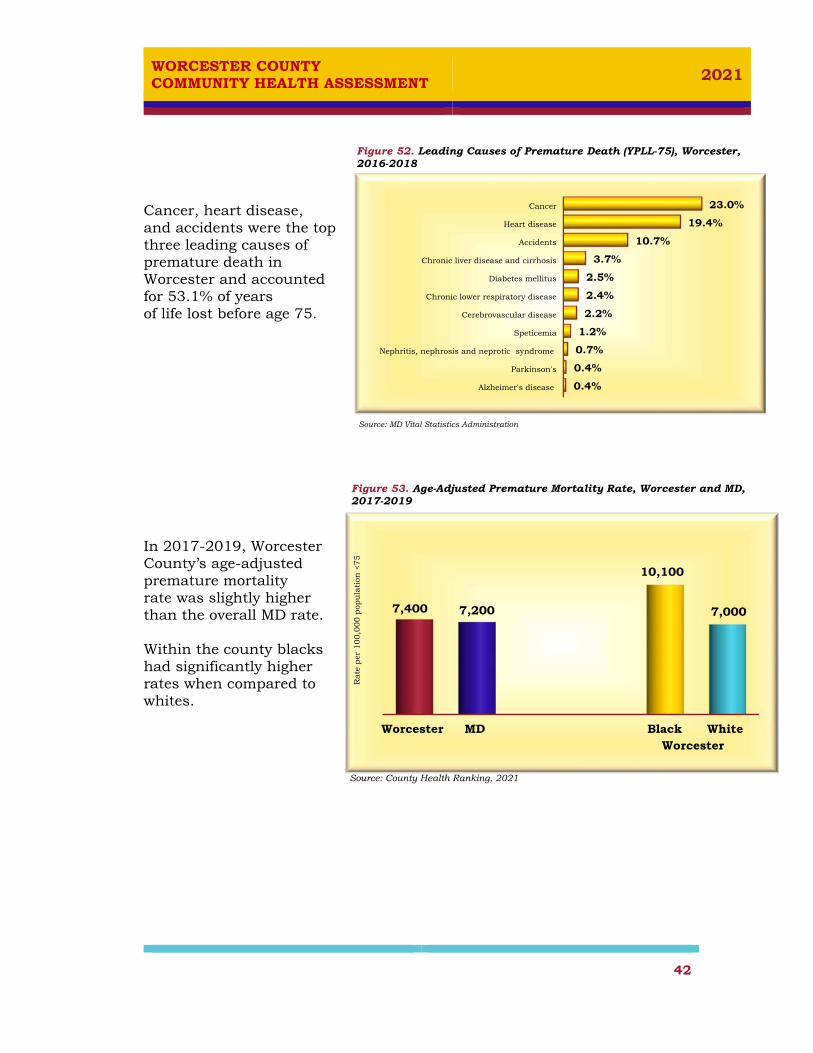
WORCESTER COUNTY COMMUNITY HEALTH ASSESSMENT
2021
42
Cancer, heart disease, and accidents were the top three leading causes of premature death in Worcester and accounted for 53.1% of years of life lost before age 75.
Source: MD Vital Statistics Administration
In 2017-2019, Worcester County’s age-adjusted premature mortality rate was slightly higher than the overall MD rate. Within the county blacks had significantly higher rates when compared to whites.
Source: County Health Ranking, 2021
Figure 52. Leading Causes of Premature Death (YPLL-75), Worcester, 2016-2018
Alzheimer's disease
Parkinson's
Nephritis, nephrosis and neprotic syndrome
Speticemia
Cerebrovascular disease
Chronic lower respiratory disease
Diabetes mellitus
Chronic liver disease and cirrhosis
Accidents
Heart disease
Cancer
0.4%
0.4%
0.7%
1.2%
2.2%
2.4%
2.5%
3.7%
10.7%
19.4%
23.0%
Figure 53. Age-Adjusted Premature Mortality Rate, Worcester and MD, 2017-2019
Worcester MD Black White
7,400 7,200
10,100
7,000
Rat
e per
100,0
00 p
opu
lati
on <
75
Worcester
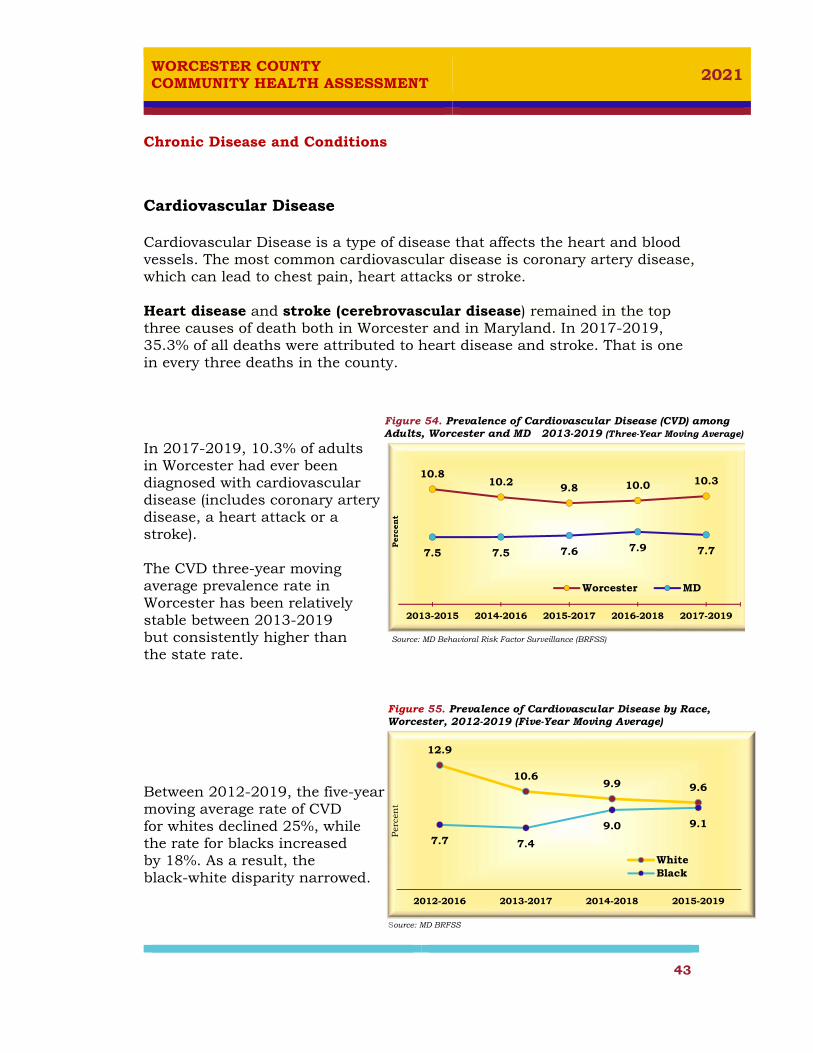
WORCESTER COUNTY COMMUNITY HEALTH ASSESSMENT
2021
43
Chronic Disease and Conditions
Cardiovascular Disease Cardiovascular Disease is a type of disease that affects the heart and blood vessels. The most common cardiovascular disease is coronary artery disease, which can lead to chest pain, heart attacks or stroke. Heart disease and stroke (cerebrovascular disease) remained in the top three causes of death both in Worcester and in Maryland. In 2017-2019, 35.3% of all deaths were attributed to heart disease and stroke. That is one in every three deaths in the county.
In 2017-2019, 10.3% of adults in Worcester had ever been diagnosed with cardiovascular disease (includes coronary artery disease, a heart attack or a stroke). The CVD three-year moving average prevalence rate in Worcester has been relatively stable between 2013-2019 but consistently higher than Source: MD Behavioral Risk Factor Surveillance (BRFSS) the state rate. Between 2012-2019, the five-year moving average rate of CVD for whites declined 25%, while the rate for blacks increased by 18%. As a result, the black-white disparity narrowed.
Source: MD BRFSS
Figure 54. Prevalence of Cardiovascular Disease (CVD) among Adults, Worcester and MD 2013-2019 (Three-Year Moving Average)
10.810.2 9.8 10.0 10.3
7.5 7.5 7.6 7.9 7.7
2013-2015 2014-2016 2015-2017 2016-2018 2017-2019
Per
cent
Worcester MD
Figure 55. Prevalence of Cardiovascular Disease by Race, Worcester, 2012-2019 (Five-Year Moving Average)
12.9
10.69.9 9.6
7.7 7.4
9.0 9.1
2012-2016 2013-2017 2014-2018 2015-2019
Per
cen
t
WhiteBlack
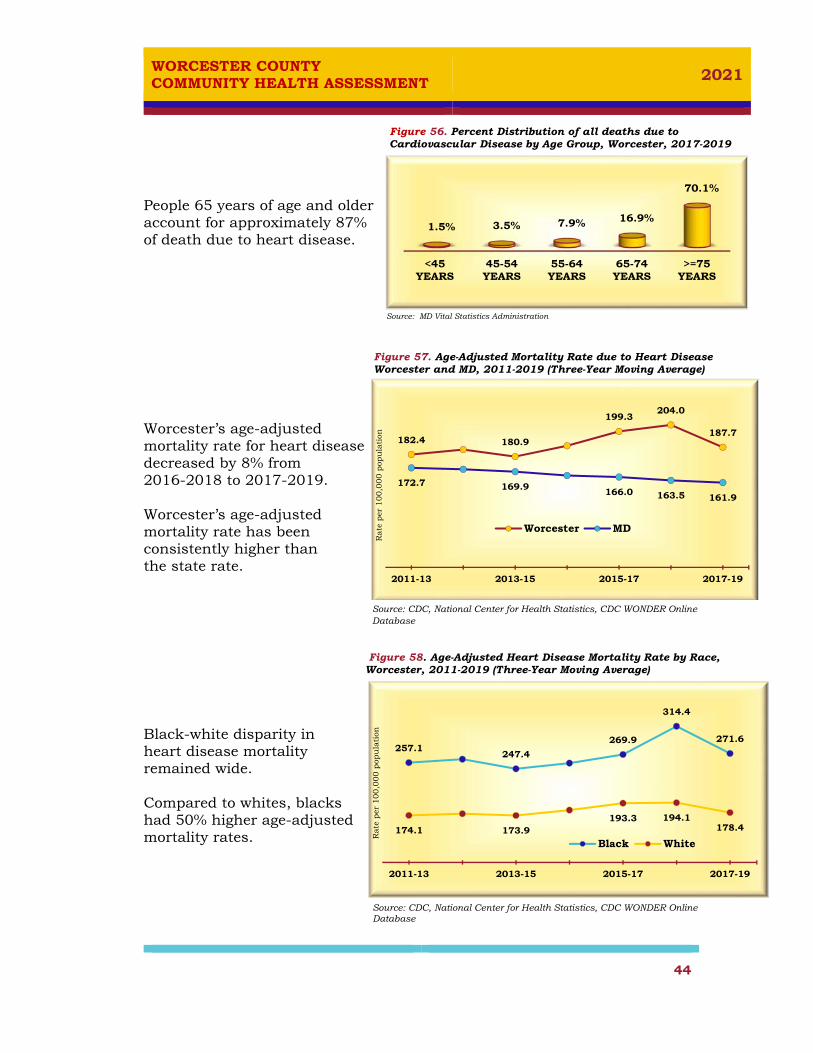
WORCESTER COUNTY COMMUNITY HEALTH ASSESSMENT
2021
44
People 65 years of age and older account for approximately 87% of death due to heart disease.
Source: MD Vital Statistics Administration
Worcester’s age-adjusted mortality rate for heart disease decreased by 8% from 2016-2018 to 2017-2019. Worcester’s age-adjusted mortality rate has been consistently higher than the state rate.
Source: CDC, National Center for Health Statistics, CDC WONDER Online Database
Black-white disparity in heart disease mortality remained wide. Compared to whites, blacks had 50% higher age-adjusted mortality rates.
Source: CDC, National Center for Health Statistics, CDC WONDER Online Database
Figure 57. Age-Adjusted Mortality Rate due to Heart Disease Worcester and MD, 2011-2019 (Three-Year Moving Average)
182.4 180.9
199.3204.0
187.7
172.7 169.9 166.0 163.5 161.9
2011-13 2013-15 2015-17 2017-19
Rat
e per
100,0
00 p
opu
lati
on
Worcester MD
Figure 58. Age-Adjusted Heart Disease Mortality Rate by Race, Worcester, 2011-2019 (Three-Year Moving Average)
257.1247.4
269.9
314.4
271.6
174.1 173.9193.3 194.1
178.4
2011-13 2013-15 2015-17 2017-19
Rat
e per
100,0
00 p
opu
lati
on
Black White
Figure 56. Percent Distribution of all deaths due to Cardiovascular Disease by Age Group, Worcester, 2017-2019
<45YEARS
45-54YEARS
55-64YEARS
65-74YEARS
>=75YEARS
1.5% 3.5% 7.9% 16.9%
70.1%

WORCESTER COUNTY COMMUNITY HEALTH ASSESSMENT
2021
45
Between 2011-2019, mortality rate due to stroke increased both in Worcester and MD, but Worcester experienced the largest increase (63%).
Source: MD Vital Statistics Administration
Blacks died of stroke at higher rates than whites. In 2016-2018, the disparity between black and white mortality was wider than it was in 2011-2013.
Source: CDC, National Center for Health Statistics, CDC WONDER Online Database
High Blood Pressure
High blood pressure is a major risk factor for heart disease, heart attack, and stroke. The risk increases as the level of blood pressure increases. The Healthy People 2030 target is to reduce the proportion of adults with hypertension to 27.7 percent.
Figure 59. Age-Adjusted Mortality Rate Due to Stroke, Worcester and MD, 2011-2019 (Three-Year Moving Average)
27.1
33.337.2 38.7
44.336.5 37.1
39.3 40.140.7
2011-13 2012-14 2013-15 2014-16 2015-17 2016-18 2017-19
Worcester MD
Figure 60. Age-Adjusted Mortality Rate Due to Stroke by Race, Worcester, 2011-2018 (Three-Year Moving Average)
40.843.4
59.8 60.7 62.0
28.931.1
37.640.6
2011-13 2012-14 2013-15 2014-16 2015-17 2016-18
Rat
e per
100,0
00 p
opu
lati
on
Black White
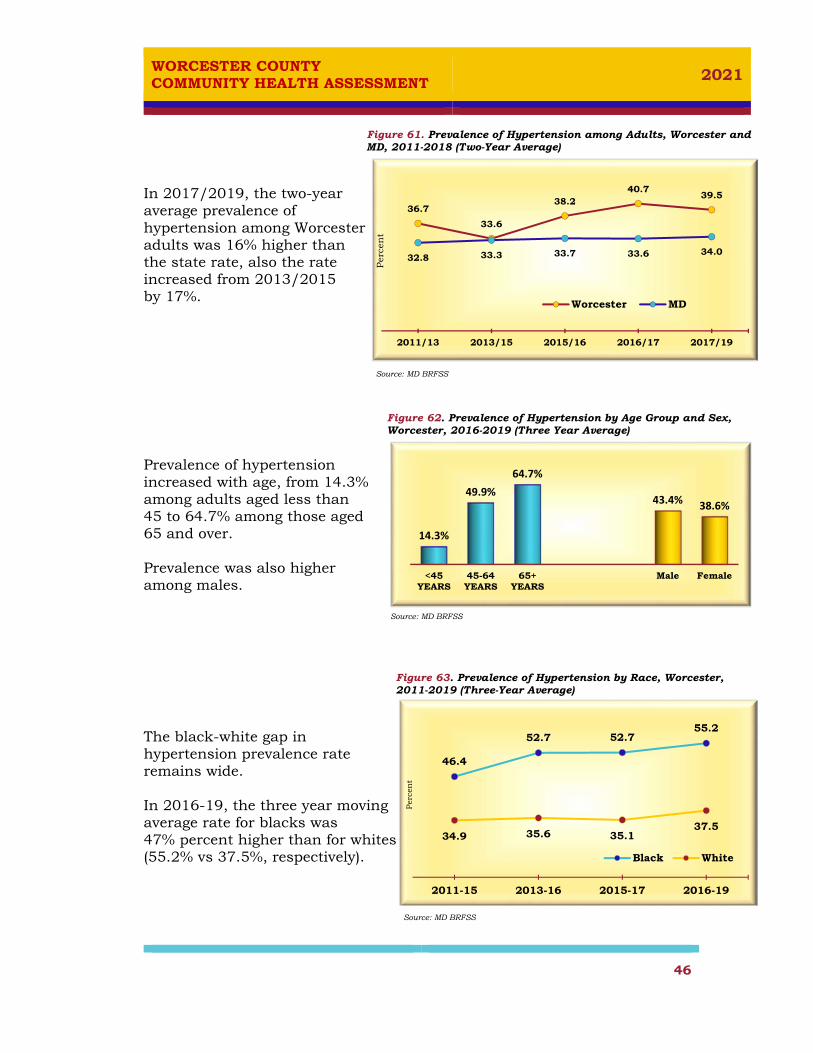
WORCESTER COUNTY COMMUNITY HEALTH ASSESSMENT
2021
46
In 2017/2019, the two-year average prevalence of hypertension among Worcester adults was 16% higher than the state rate, also the rate increased from 2013/2015 by 17%.
Source: MD BRFSS
Prevalence of hypertension increased with age, from 14.3% among adults aged less than 45 to 64.7% among those aged 65 and over. Prevalence was also higher among males.
Source: MD BRFSS
The black-white gap in hypertension prevalence rate remains wide. In 2016-19, the three year moving average rate for blacks was 47% percent higher than for whites (55.2% vs 37.5%, respectively).
Source: MD BRFSS
Figure 61. Prevalence of Hypertension among Adults, Worcester and MD, 2011-2018 (Two-Year Average)
36.7
33.6
38.240.7
39.5
32.8 33.3 33.7 33.6 34.0
2011/13 2013/15 2015/16 2016/17 2017/19
Per
cen
t
Worcester MD
Figure 62. Prevalence of Hypertension by Age Group and Sex, Worcester, 2016-2019 (Three Year Average)
<45YEARS
45-64YEARS
65+YEARS
Male Female
14.3%
49.9%
64.7%
43.4% 38.6%
Figure 63. Prevalence of Hypertension by Race, Worcester, 2011-2019 (Three-Year Average)
46.4
52.7 52.755.2
34.9 35.6 35.137.5
2011-15 2013-16 2015-17 2016-19
Per
cen
t
Black White
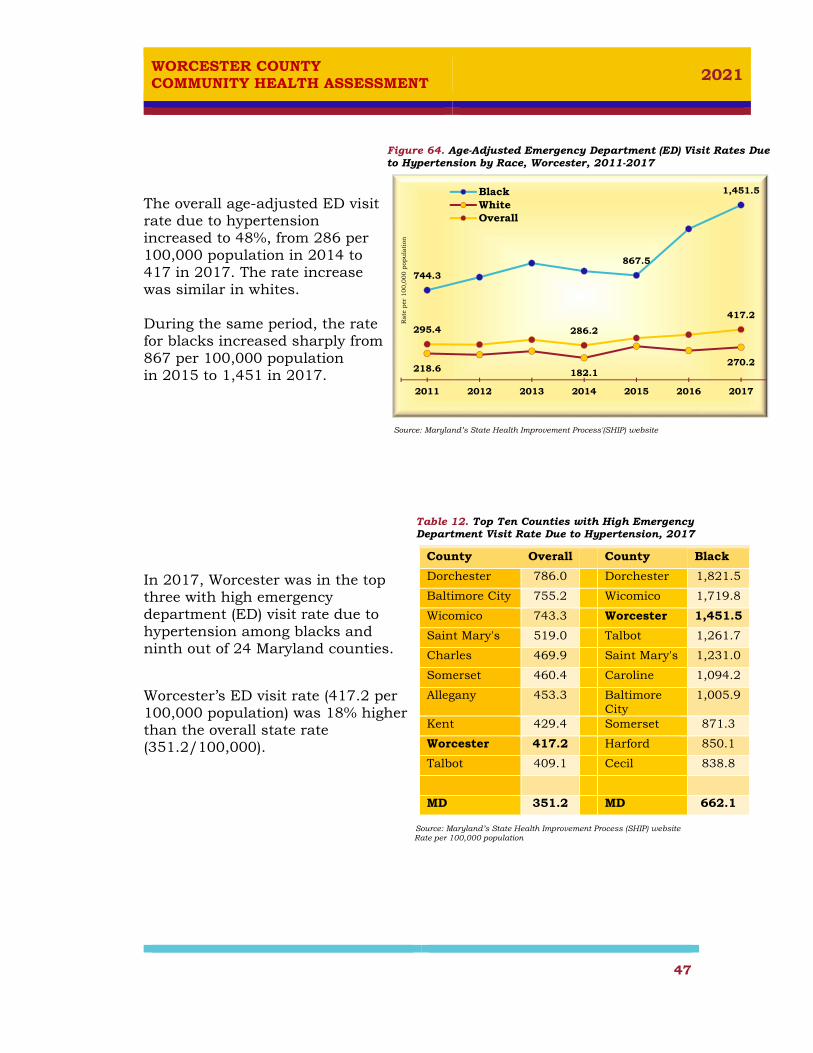
WORCESTER COUNTY COMMUNITY HEALTH ASSESSMENT
2021
47
The overall age-adjusted ED visit rate due to hypertension increased to 48%, from 286 per 100,000 population in 2014 to 417 in 2017. The rate increase was similar in whites. During the same period, the rate for blacks increased sharply from 867 per 100,000 population in 2015 to 1,451 in 2017.
Source: Maryland’s State Health Improvement Process'(SHIP) website
Table 12. Top Ten Counties with High Emergency Department Visit Rate Due to Hypertension, 2017
In 2017, Worcester was in the top three with high emergency department (ED) visit rate due to hypertension among blacks and ninth out of 24 Maryland counties.
Worcester’s ED visit rate (417.2 per 100,000 population) was 18% higher than the overall state rate (351.2/100,000).
Source: Maryland’s State Health Improvement Process (SHIP) website Rate per 100,000 population
County Overall
County Black
Dorchester 786.0
Dorchester 1,821.5
Baltimore City 755.2
Wicomico 1,719.8
Wicomico 743.3
Worcester 1,451.5
Saint Mary's 519.0
Talbot 1,261.7
Charles 469.9
Saint Mary's 1,231.0
Somerset 460.4
Caroline 1,094.2
Allegany 453.3
Baltimore City
1,005.9
Kent 429.4
Somerset 871.3
Worcester 417.2
Harford 850.1
Talbot 409.1
Cecil 838.8
MD 351.2
MD 662.1
Figure 64. Age-Adjusted Emergency Department (ED) Visit Rates Due to Hypertension by Race, Worcester, 2011-2017
1,451.5
867.5
744.3
270.2182.1218.6
417.2
286.2295.4
2017201620152014201320122011R
ate
per
100,0
00 p
opu
lati
on
BlackWhiteOverall

WORCESTER COUNTY COMMUNITY HEALTH ASSESSMENT
2021
48
Cancer
Cancer continues to be the second leading cause of death in Worcester and Maryland. From 2013-2017, on average about 428 new cases of cancer were diagnosed among Worcester County residents.
During 2013-2017,Worcester all cancer sites incidence rate was higher than the MD rate (494.9 vs 453.8 per 100,000 population). All cancer sites incidence rates increased in both Worcester and Maryland. The 2013-2017 incidence rates for all cancer sites increased by 2.7% in Worcester and by 2.2% in Maryland. Source: MD DHMH- 2019 Cancer Report and NIH-National Cancer Institute
Overall cancer incidence rates were 18% and 10% higher in males and blacks than in females and whites, respectively.
Source: NIH-National Cancer Institute
Figure 65. All Cancer Sites Age-Adjusted Cancer Incidence Rate, Worcester and MD, 2012-2017
2012-2016 2013-2017
482.0
494.9
443.9
453.8
Rat
e per
100,0
00 p
opu
lati
on
WorcesterMD
Figure 66. All Cancer Sites Age-Adjusted Cancer Incidence Rate by Sex and Race, Worcester, 2013-2017
White Black Male Female
499.4
550.9542.0
460.8
Rat
e per
100,0
00 p
opula
tion

WORCESTER COUNTY COMMUNITY HEALTH ASSESSMENT
2021
49
During 2014-2018 Worcester
all sites cancer mortality rate was higher than the MD rate (164.5 vs 155.1 per 100,000 population). All cancer sites mortality rates declined in both Worcester and Maryland. The 2014-2018 mortality rates for all cancer sites decreased by 8% in Worcester and by 3.2% in MD from 2012-2016. Source: MD DHMH- 2019 Cancer Report and NIH-National Cancer Institute
Overall cancer mortality rates were 41% and 24% higher in males and blacks than in females and whites, respectively.
Source: NIH-National Cancer Institute
Table 13. Age-Adjusted Cancer Incidence Rate, Worcester and MD, 2013-2017
The cancer incidence rates for lung and bronchus, female breast, colon and melanoma of the skin were higher than the state. During 2013-2017, the melanoma incidence rate for Worcester was second highest in the state and twice the state average. Source: NIH-National Cancer Institute
Incidence Rate (per 100,000 population) Worcester MD
Prostate 121.3 124.7
Female Breast 135.8 132.9
Lung and Bronchus 62.0 56.4
Melanoma of the Skin 48.4 24.0
Colon and Rectum 37.5 36.4
Figure 67. All Cancer Sites Age-Adjusted Cancer Mortality Rate, Worcester and MD, 2012-2018
2012-2016 2014-2018
178.6
164.5
160.3
155.1
Rat
e per
100,0
00 p
opula
tion
Worcester
MD
Figure 68. All Cancer Sites Age-Adjusted Cancer Mortality Rate by Sex and Race, Worcester, 2014-2018
Male Female White Black
196.7
139.6162.7
202.0
Rat
e per
100,0
00 p
opula
tion

WORCESTER COUNTY COMMUNITY HEALTH ASSESSMENT
2021
50
Chronic Lower Respiratory Disease
Chronic lower respiratory disease (CLRD) is the fourth leading cause of death in Worcester and the fifth in Maryland. In 2017-2019, 4.4% of all deaths were attributed to CLRD. CLRD includes chronic obstructive pulmonary disease (COPD) and asthma.
During 2017-2019, people 65 years of age and older accounted for approximately 87% of deaths due to CLRD. CLRD was the 4th leading cause of death in whites and the 8th in blacks.
Source: MD Vital Statistics Administration
In Worcester the age-adjusted CLRD mortality rate decreased 33% since 2012-2014, while the overall rate in MD has remained relatively stable.
Source: MD Vital Statistics Administration
Figure 69. Percent Distribution of All Deaths due to Chronic Lower Respiratory Disease by Age Group and Race, Worcester, 2017-2019
<65years
65-74Years
>=75Years
White Black
13.1%21.4%
65.5%
91.7%
8.3%
Figure 70. Age Adjusted Chronic Lower Respiratory Disease Mortality Rate, Worcester and MD, 2011-2019 (Three-Year Moving Average)
37.9 38.2
28.9 28.426.6
32.930.8
30.4 30.5 30.0
2011-13 2013-15 2015-17 2017-19
Rat
e per
100,0
00 p
opu
lati
on
Worcester MD
WORCESTER COUNTY COMMUNITY HEALTH ASSESSMENT
2021
51
COPD During the 2017-2019 period, 4.7% of adults in Worcester reported that they had been diagnosed with COPD. That is 17% lower than the state average (5.6%). The rate also declined 35% from 2014-2016.
Source: MD BRFSS
Asthma
Between 2017 and 2019, 9.4% of Worcester adults reported currently having asthma, almost the same as the state prevalence rate (9.3%). Overall in Worcester, the three- year moving average rate has been on an upward trend, while the state rate remained stable.
Source: MD BRFSS
The prevalence of asthma had been trending upward for both black and white adults. During 2015-2019, 13% of blacks reported currently having asthma, 1.5 times the rate of whites.
Source: MD BRFSS
Figure 71. Prevalence of COPD among Adults, Worcester and MD, 2013-2019 (Three-Year Moving Average)
7.2 7.2 7.0
5.6
4.75.8 5.8 5.8 5.7
5.6
2013-2015 2014-2016 2015-2017 2016-2018 2017-2019
Per
cen
t
Worcester MD
Figure 72. Current Asthma Prevalence among Adults, Worcester and MD, 2012-2019 (Three-Year Moving Average)
6.86.3
7.8 7.5
10.49.49.0 8.9 8.9 9.2
9.4 9.3
2012-14 2013-15 2014-16 2015-17 2016-18 2017-19
Per
cen
t
WorcesterMD
Figure 73. Adult Current Asthma Prevalence by Race, Worcester and MD, 2011-2019 (Five-Year Moving Average)
5.57.0 6.7 7.0
8.410.2
12.6 12.6
15.1
13.0
2011-15 2012-16 2013-17 2014-18 2015-19
Per
cent
White Black
WORCESTER COUNTY COMMUNITY HEALTH ASSESSMENT
2021
52
24.4% of high school students in Worcester had been told by a doctor or nurse that they had asthma (lifetime asthma). More blacks (36%) than whites (20.8%) and more males than females reported lifetime asthma. Overall the prevalence rates were lower than the state average.
Between 2014-2018, the lifetime asthma prevalence rate in Worcester did not change significantly.
Source: 2018 MD YRBS
There was a wide disparity in asthma related ED visit rates between blacks and whites. Over a seven year period from 2011-2017, ED visits rates, due to asthma were 3-5 times higher for blacks than those for whites.
Source: MD State Health Improvement Process (SHIP) website
Table 14. Lifetime Asthma Prevalence among High School Students, Worcester and MD, 2018
Worcester MD
Total 24.4 25.9
Female 22.2 24.7
Male 26.2 26.8
White 20.8 21.4
Black 36.1 31.3
Hispanic 29.0 26.7 Source: 2018 MD YRBS
Figure 74. Lifetime Asthma Prevalence among High School Students, Worcester and MD, 2013-2018
27.2
24.5
25.5
24.4
26.3
26.3 26.425.9
2013 2014 2016 2018
Per
cen
t
Worcester MD
Figure 75. Emergency Department Visit Rate due to Asthma by Race, Worcester, 2011-2017
176.8158.8
59.749.2
79.170.1
2017201620152014201320122011
Rat
e per
10,0
00 p
opu
lati
on BlackWhiteOverall

WORCESTER COUNTY COMMUNITY HEALTH ASSESSMENT
2021
53
In 2017, out of 24 Maryland counties Worcester County ranked seventh with high emergency department (ED) visit rates due to asthma.
Worcester’s ED visit rate (79.1 per 10,000 population) was 15% higher than overall state rate (68.4/10,000).
Source: MD State Health Improvement Process (SHIP) website
Source: MD State Health Improvement Process (SHIP) website
Diabetes
Diabetes is the leading cause of kidney failure, non-traumatic lower limb amputation, and new cases of blindness among adults. It is also a major cause of heart disease and stroke and the 6th leading cause of death in Maryland and the 7th in the US.
In Worcester, diabetes has risen from the 8th leading cause in 2012-2014 to the 6th leading cause of death overall, and the 4th among blacks in 2016-2018.
The diabetes prevalence rate among adults declined from 16.3% in 2012-2014 to the lowest rate in 2015-2017 (11.7%). In 2016-2018, the rate had begun to rise. In 2017-2019 the rate showed moderate decline(13.3%). Source: MD BRFSS
Source: MD BRFSS
Figure 76. Top Ten Counties with High Emergency Department Visit Rates Due to Asthma, 2017
Baltimore City
Dorchester
Somerset
Kent
Wicomico
Allegany
Worcester
Cecil
Charles
Talbot
State
222.0
136.9
122.9
119.8
102.9
79.8
79.1
73.8
72.8
72.1
68.4
Rat
e per
10,0
00 p
opula
tion
Figure 77. Prevalence of Diabetes among Adults, Worcester and MD, 2012-2019 (Three-Year Moving Average)
16.3
12.6
14.0
11.7
14.013.3
10.0 10.1 10.4 10.511.0 11.1
2012-14 2013-15 2014-16 2015-17 2016-18 2017-19
Per
cen
t
Worcester MD
WORCESTER COUNTY COMMUNITY HEALTH ASSESSMENT
2021
54
Prevalence of diabetes was higher among black adults. The 2015-2019 five-year moving average rate for blacks was (20.3%), about two times higher than whites (11.3%).
Source: MD BRFSS
Worcester’s ED visit rates per 100,000 population were consistently higher than the state rates.
Source: Maryland’s State Health Improvement Process (SHIP) website
In 2017, blacks had a diabetes ED visit rate of 767 per 100,000 population, over three times higher than whites at 245.9 per 100,000 population. But, the gap in ED rate between black and white slightly narrowed after 2011.
Source: Source: Maryland’s State Health Improvement Process (SHIP) website
Figure 78. Prevalence of Diabetes by Race, Worcester and MD, 2012-2019 (Five-Year Moving Average)
11.9 12.4 12.0 12.611.3
27.3 28.0
20.2 20.3 20.3
2011-15 2012-16 2013-17 2014-18 2015-19
Per
cen
t
White Black
Figure 79. Emergency Department Visit Rate due to Diabetes, Worcester and MD, 2011-2017
180.9 192.1 207.4243.7
241.8 240.3 229.9
345.8310.5
2011 2012 2013 2014 2015 2016 2017
Rat
e per
100,0
00 p
opu
lati
on
MD Worcester
Figure 80. Emergency Department Visit Rate Due to Diabetes by Race, Worcester, 2011-2017
921.8
688.5
865.8767.0
142.3 167.4258.7 245.9
2011 2012 2013 2014 2016 2017
Rat
e per
100,0
00 p
opu
lati
on
Black White

WORCESTER COUNTY COMMUNITY HEALTH ASSESSMENT
2021
55
In 2017, Worcester was in the top 10 of 24 Maryland counties with high emergency department (ED) visit rates due to diabetes.
Source: Source: Maryland’s State Health Improvement Process (SHIP) website
Obesity
People who are obese have higher rates of illness and death than people of healthy weight. These illnesses include high blood pressure, diabetes, and cardiovascular disease mainly heart disease and stroke which are the leading causes of death in the United States. The Body Mass Index (BMI) is an internationally recognized standard for classifying overweight and obesity in adults. For adults 20 years old and older, a BMI of 25-29.9 is considered overweight, and 30 or more is obese. For children and teens, Body Mass Index (BMI) is age and sex-specific. Obesity in children is defined as a BMI at or above the 95th percentile for age and sex and overweight is defined as a BMI between the 85th and 95th percentile.
Figure 81. Top Ten Counties with High Emergency Department Visit Rate Due to Diabetes, 2017
Baltimor…
Wicomico
Dorchester
Garrett
Somerset
Talbot
Worcester
Caroline
Kent
Saint…
MD
584.6
530.9
525.2
381.2
381.0
314.5
310.5
304.5
304.1
299.5
243.7

WORCESTER COUNTY COMMUNITY HEALTH ASSESSMENT
2021
56
Based on 2017-2019 self-reported BRFSS data, one out of every three Worcester adults has obesity (34.3%). The rate was 8% higher than the rate for 2012-2014 (31.7%).
Source: BRFSS
The prevalence of obesity is highest (45%) among adults aged 45-64 years. Worcester adult men had higher percent of obesity than women.
Source: MD BRFSS
There is significant disparity in the prevalence and trend of obesity between blacks and whites. Prevalence of self–reported obesity was highest among black adults (54.7%) compared to whites (32.7%). Between 2011-2019, the rate increased 20% for blacks compared to 6% for whites.
Source: BRFSS
Figure 82. Prevalence of Self-Reported Obesity among Adults, Worcester and MD, 2012-2019 (Three-Year Moving Average)
31.732.9
36.1 36.337.5
34.3
28.5 28.9 29.5 30.0 30.8 31.5
2012-14 2013-15 2014-16 2015-17 2016-18 2017-19Per
cen
t
Worcester MD
Figure 84. Percent of Self-Reported Obesity among Adults by Race, Worcester, 2011-2019 (Five-Year Moving Average)
45.549.9 49.8
57.454.7
30.6 32.5 31.8 32.0 32.7
2011-15 2012-16 2013-17 2014-18 2015-19
Per
cen
t
Black White
Figure 83. Percent of Self-Reported Obesity among adults by age-Group and Sex, Worcester, 2017-2019
<45YEARS
45-64YEARS
65+YEARS
Male Female
26.0%
45.0%
32.6%
37.7%
31.0%

WORCESTER COUNTY COMMUNITY HEALTH ASSESSMENT
2021
57
The prevalence of chronic diseases increases with increasing BMI. The most prevalent chronic conditions were diabetes hypertension, and high cholesterol.
Source: MD BRFSS
According to the 2018 YRBS, 13.4% of high school students had obesity and an additional 15.5% were overweight. There were differences in rates among black and white students. More than one out of three black students were overweight or obese.
Source: MD Youth Risk Behavior Surveillance (YRBS)
The prevalence of obesity among high school students was similar to MD high school students overall, but both Worcester and MD rates in 2018 were higher than the rates in 2013.
Source: MD YRBS
Table 15. Prevalence of Chronic Conditions by BMI Categories, Worcester, 2015-2019
Healthy Weight
Overweight
Obese
Health Condition (BMI 18.5 - 24.9)
(BMI 25.0-29.9)
(BMI 30.0 and above)
Heart Attack 3.4 6.8 7.1
Angina or Coronary artery disease
1.7
5.3
5.9
Stroke 1.4 4.6 4.0
Diabetes 3.5 11.2 23.4
Hypertension 18.6 45.8 52.2
High cholesterol 18.7 46.9 51.4
Figure 86. Percentage of High School Students Who Had Obesity, Worcester and MD, 2013-2018
10.9
13.5 13.6 13.4
11.0 11.5
13.1 12.6
2013 2014 2016 2018
Per
cen
t
Worcester MD
Figure 85. Obesity and Overweight Rates among High School Students, Worcester, 2018
All Races White Black
13.4%
10.9%
19.5%
15.5% 14.8%
17.9%
Obese
Overweight

WORCESTER COUNTY COMMUNITY HEALTH ASSESSMENT
2021
58
Health Related Risk Behaviors
Smoking Cigarette smoking harms nearly every organ of the body, causes many diseases, and reduces the health of smokers in general. Cigarette smoking remains the leading cause of preventable disease, disability, and death in the United States. In the United States, smoking causes 90% of lung cancer deaths, and 80% of all cases of chronic obstructive pulmonary disease (Source: CDC). In Maryland, lung cancer is the leading cause of cancer death in both men and women, accounting for 24.2% of all cancer deaths in 2016.
In 2017-2019, the percentage of adults 18 and over who were current cigarette smokers was 15.5%, which was higher than the state rate (13%),but 30% lower than the 2014-2016 rate of 22.4%.
Source: MD BRFSS
The prevalence of cigarette smoking was highest among adults aged 44 years and younger (22.7%). Men are more likely to be current cigarette smokers than women. About one in every five men smoked cigarettes (20.4%).
Source: MD BRFSS
Figure 87. Prevalence of Current Cigarette Smoking Among Adults, Worcester and MD, 2013-2019 (Three-Year Moving Average)
21.8 22.4 21.7
17.9
15.5
15.414.5 14.2
13.4 13.0
2013-15 2014-16 2015-17 2016-18 2017-19
Per
cen
t
WorcesterMD
Figure 88. Prevalence of Current Cigarette Smoking among Adults by Age-Group and Sex, Worcester, 2017-2019
<45 Years 45.64Years
65+Years Male Female
22.7%
12.4%
9.4%
20.4%
11.0%

WORCESTER COUNTY COMMUNITY HEALTH ASSESSMENT
2021
59
There was no large disparity in black and white smoking prevalence. The black and white five - year moving average rates declined from 22.8% and 20.4% in 2013-2017 to 19% and 18.4% in 2015-2019, respectively. Overall, there was a decline in cigarette smoking during 2015-2019 period.
Source: MD BRFSS
In 2018, the percentage of high school students who currently smoked cigarettes declined significantly from 21.3% in 2013 to 7.7%.
Source: MD YRBS
In 2018, there was significant racial differences in the prevalence of current cigarette use with Hispanic and white students having significantly higher prevalence (10.2% and 9.2%, respectively) than blacks (2.4%).
Source: MD YRBS
Figure 89. Prevalence of Current Cigarette Smoking among Adults by Race, Worcester, 2012-2019 (Five-Year Moving Average)
19.120.4
19.118.4
20.0
22.8
20.5
19.0
2012-16 2013-17 2014-18 2015-19
Per
cen
t
White Black
Figure 90. High School Students Who Currently Smoked Cigarettes, Worcester and MD, 2013-2018
21.3
14.713.3
7.711.9
8.7 8.2
5.0
2013 2014 2016 2018
Per
cent
WorcesterMD
Figure 91. High School Students Who Currently Smoked Cigarettes by Sex and Race, Worcester, 2018
Male Female Hispanic White Black
8.2%6.8%
10.2%9.2%
2.4%

WORCESTER COUNTY COMMUNITY HEALTH ASSESSMENT
2021
60
In 2018, the percentage of Worcester high school students who used any type of tobacco or electronic vapor products was significantly higher than the state rate, and about 6% of students smoked a whole cigarette before age 13 years. Also, one out of three high school students lived with someone who smokes cigarettes.
Source: MD YRBS
Excessive Alcohol and Drug Use
According to the Maryland Department of Health (MDH), the number of drug and alcohol-related intoxication deaths occurring in Maryland decreased slightly in 2019, the first decline in intoxication deaths in 10 years. The total number of deaths in 2019 was 2,379, which represented a 1% decrease from the number of deaths (2,406) in 2018.
In Worcester, a total of 98 drug and alcohol-related intoxication deaths occurred during the last five-year period (2015-2019), which was more than twice the number of deaths occurred during the 2010-2014 five year period.
Figure 92. Tobacco Use among High School Students, Worcester and MD, 2018
Currently Smoked Cigarettes orCigars or Used Smokeless
Tobacco or Electronic VaporProduct
Live with Someone Who NowSmokes Cigarettes or Cigars
Smoked a Whole Cigarette BeforeAge 13 Years
41.4%
33.1%
5.6%
27.4%
27.5%
4.1%
Worcetser
MD

WORCESTER COUNTY COMMUNITY HEALTH ASSESSMENT
2021
61
The trend in binge drinking among Worcester adults has declined from 20.3% in 2014-2016 to 13.1% in 2017-2019, which is slightly lower than the state rate (14.2%).
Source: MD BRFSS
Men are almost two times more likely to binge drink than women. The binge drinking rate was also higher among younger age groups. Source: MD BRFSS
Compared to non-binge drinkers, binge drinkers are three times more likely to smoke cigarettes. About 36% of adult binge drinkers also reported being current smokers compared to 12.7% of non-binge drinkers.
Source: MD BRFSS
Figure 93. Adult Binge Drinking, Worcester and MD, 2011-2019 (Three-Year Moving Average)
16.217.1
20.3
16.8
16.214.6 14.9 14.9
14.2
2011-13 2012-14 2013-15 2014-16 2015-17 2016-18 2017-19
Per
cent
WorcetserMD
Figure 94. Adult Binge Drinking by Gender and Age-Group, Worcester, 2017-2019
Female Male < 45YEARS
45-64YEARS
65+YEARS
9.5%
17.1%
21.2%
11.9%
4.1%
Figure 95. Current Smokers by Binge Drinking Status, Worcester, 2017-2019
Binge drinker Non-Binge drinker
63.9%
87.3%
36.1%
12.7%
Non-Smokers
Smokers

WORCESTER COUNTY COMMUNITY HEALTH ASSESSMENT
2021
62
In Worcester, rates of binge drinking among high school students (19.2%) were higher than the overall state rate (12%).
Source: MD YRBS
In 2018, Worcester was number three out of 24 MD counties with high binge drinking rates among high school students.
Source: MD YRBS
Binge drinking was more common among female (21.8%) than male (16.3%) high school students. Black high school students had the lowest rate of binge drinking.
Source: MD YRBS
Figure 96. Binge Drinking among High School Students, Worcester and MD, 2016 and 2018
2016 2018
19.5% 19.2%
13.0%12.0%
WorcesterMD
Figure 97. Binge Drinking among High School Students by Race and Gender, Worcester, 2018
Male Female White Hispanic Black
16.3%
21.8% 22.8%
14.8%
10.3%
Table 16. Top-Five Counties in MD with High Binge Drinking Rate, 2018
County Rate
Queen Anne's 27.8%
Garrett 20.2%
Worcester 19.2%
Cecil 19.1%
Kent 18.7%

WORCESTER COUNTY COMMUNITY HEALTH ASSESSMENT
2021
63
Current marijuana use among high school students increased from 21.2% in 2016 to 26.4% in 2018. Among lifetime use, the 2018 rates of substance use among Worcester high school students were higher across the board (except injecting drug use) compared to the overall state rates. There has been an increase in the lifetime use of marijuana, heroin and prescription medicine misuse from 2016.
Source: MD YRBS
White, more than black and Hispanic high school students and female, more than male high students used alcohol and marijuana. Rates of substance use among black students were lower across the board (except injecting drug use) compared to white high school students. Hispanic students had slightly higher rates of illicit drug use when compared to white and black students. Source: MD YRBS
Table 17. Current and Lifetime Substance Use among High School Students, Worcester and MD, 2016 and 2018
Worcester MD
2016 2018
2018 Current Use % %
%
Marijuana 21.2 26.4
17.6 Alcohol 33.1 32.0
24.1
Binge Drinking 19.5 19.2
12.1 Lifetime Use
Marijuana 35.5 39.4
31.0 Cocaine 6.9 6.1
4.8
Methamphetamine 4.3 3.9
3.7 Heroin 3.0 3.7
3.7
Injecting drug use 3.6 3.6
4.1 Synthetic marijuana 9.0 8.0
6.3
Ecstasy 6.6 5.5 4.9 Prescription pain medicine misuse
14.0 14.8 14.6
Table 18. Current and Lifetime Substance Use among High School Students by Gender and Race, Worcester, 2018
Male Female
Black White Hispanic
Current Use % % % % %
Marijuana 25.3 27.3 24.8 27.9 21.6
Alcohol 27.3 36.7 19.6 37.0 27.3
Binge Drinking 16.3 21.8 10.3 22.8 14.8
Lifetime Use
Marijuana 38.1 40.9 39.8 40.9 36.0
Cocaine 13.2 15.8 12.4 14.5 16.6
Methamphetamine 6.1 1.1 2.2 3.9 6.1
Heroin 5.8 1.2 2.3 3.4 5.2
Injecting drug use 4.4 2.2 3.8 3.3 4.3
Synthetic marijuana
10.2
5.2
4.5
8.9
7.8
Ecstasy 7.8 2.6 3.9 5.1 9.3
Prescription pain medicine misuse
13.2
15.8
12.4
14.5
16.6
WORCESTER COUNTY COMMUNITY HEALTH ASSESSMENT
2021
64
Between 2010 and 2017, the ED visit rate for addiction-related conditions increased overtime and reached 4,371 per 100,000 population, an increase of 200% from 2010. In 2017, it dropped down 54% to 1,977 per 100,000 population. Source: Maryland’s State Health Improvement Process (SHIP) website
There was no substantial differences in ED visit rate for addiction-related conditions between black and white except the sharp rise and fall of the black ED rate in 2015.
Source: Maryland’s State Health Improvement Process (SHIP) website
Drug and Alcohol Intoxication Deaths
The three-year moving average drug and alcohol intoxication deaths decreased by 14% from 2016-2018 to 2017-2019 (63 to 54 deaths).
72% of all intoxication deaths that occurred in Worcester in 2017-2019 were opioid-related. (heroin, prescription opioids, and fentanyl).
Source: MD Vital Statistics Administration
Figure 100. Number of Drug and Alcohol Intoxication Deaths Occurring in Worcester, 2010-2019 (Three-Year Moving Average)
2319
26
35
5763 63
54
39
15
2010-12 2011-13 2012-14 2013-15 2014-16 2015-17 2016-18 2017-19
Nu
mber
of D
eath
s
TotalOpioid RelatedNot Opioid Related
Figure 98. Emergency Department Visit Rates for Addiction-Related Conditions, Worcester and MD, 2010-2017
1,442.41,904.8
2,305.6
4,371.2
1,977.1
1,122.41,398.2 1,607.5
3,191.1
2,017.0
2010 2011 2012 2013 2014 2015 2016 2017
Rat
e per
100,0
00 p
opu
lati
on
WorcesterMD
Figure 99. Emergency Department Visit Rates for Addiction-Related Conditions by Race, Worcester, 2010-2017
1,596.9
7,957.0
2,340.1
1,580.3
1,323.32,066.63,852.1
2,279.2
2,036.9
1,093.6
20172016201520142013201220112010
Rat
e per
100,0
00
BlackWhite

WORCESTER COUNTY COMMUNITY HEALTH ASSESSMENT
2021
65
In 2017-2019, fentanyl involved deaths declined 10%, heroin- related deaths declined 19%, cocaine related deaths declined 42%, and alcohol-related deaths declined 31%. Prescription opioid related deaths held steady from 2015-2017 to 2017-2019.
Source: MD Vital Statistics Administration
In 2016-2018, Worcester was one of the top 10 out of 24 MD counties with high age-adjusted mortality rates due to drug and alcohol intoxication. Source: MD Vital Statistics Administration
Physical Activity
Regular physical activity can improve the health and quality of life at all ages. Research has shown that regular activity reduces the risk of cardiovascular disease, type 2 diabetes, some forms of cancer, strengthens bones and muscles, and increases the chance of living longer.
Figure 101. Number of Drug and Alcohol Intoxication Deaths by Selected Substances, Worcester, 2011-2019 (Three-Year Moving Average)
2011-13 2012-14 2013-15 2014-16 2015-17 2016-18 2017-19
Nu
mber
of D
eath
s
HeroinFentanylAlcoholCocaineRx opioid
Figure 102. Age-Adjusted Mortality Rate due to Drug and Alcohol Intoxication by Place of Residence, Worcester, 2016-2018
Baltimore CityCecil
AlleganyBaltimore
WashingtonCaroline
WorcesterCarrollCalvertHarford
Maryland
84.856.055.9
46.444.2
41.440.640.339.039.0
32.0
Rat
eper
100,0
00 p
opu
lati
on

WORCESTER COUNTY COMMUNITY HEALTH ASSESSMENT
2021
66
In 2017-2019, nearly 29% of adults in Worcester were not physically active, compared to 24% the overall state rate. The prevalence rate in 2017-2019 increased by 12% from 2011-2013.
Source: MD BRFSS
Leisure time inactivity increases with age from 23%, among those younger than 45, to 33% among adults 65 years and above. Black (44%) and male (31%) adults reported higher proportions of leisure time inactivity than whites and females, respectively.
Source: MD BRFSS
Prevalence of leisure time inactivity increased from 20.4% to 40.3% with increasing BMI category.
Source: MD BRFSS
Figure 103. Adults Who Reported Leisure Time Inactivity, Worcester and MD 2011-2019 (Three-Year Average)
25.5 26.0 24.228.6 28.6
23.2 23.5 24.2 23.8 23.9
2011-13 2013-15 2015-17 2017-19
Per
cen
t
Worcester MD
Figure 104. Adults Who Reported Leisure Time Inactivity by Age-Group, Gender, and Race, Worcester, 2017-2019
<45YEARS
45-64YEARS
65+YEARS
Male Female Black White
23%
32% 33% 31%26%
44%
24%
Figure 105. Adults Who Reported Leisure Time Inactivity by Weight Category, Worcester, 2017-2019
Healthy Weight Overweight Obese
20.4% 21.3%
40.3%
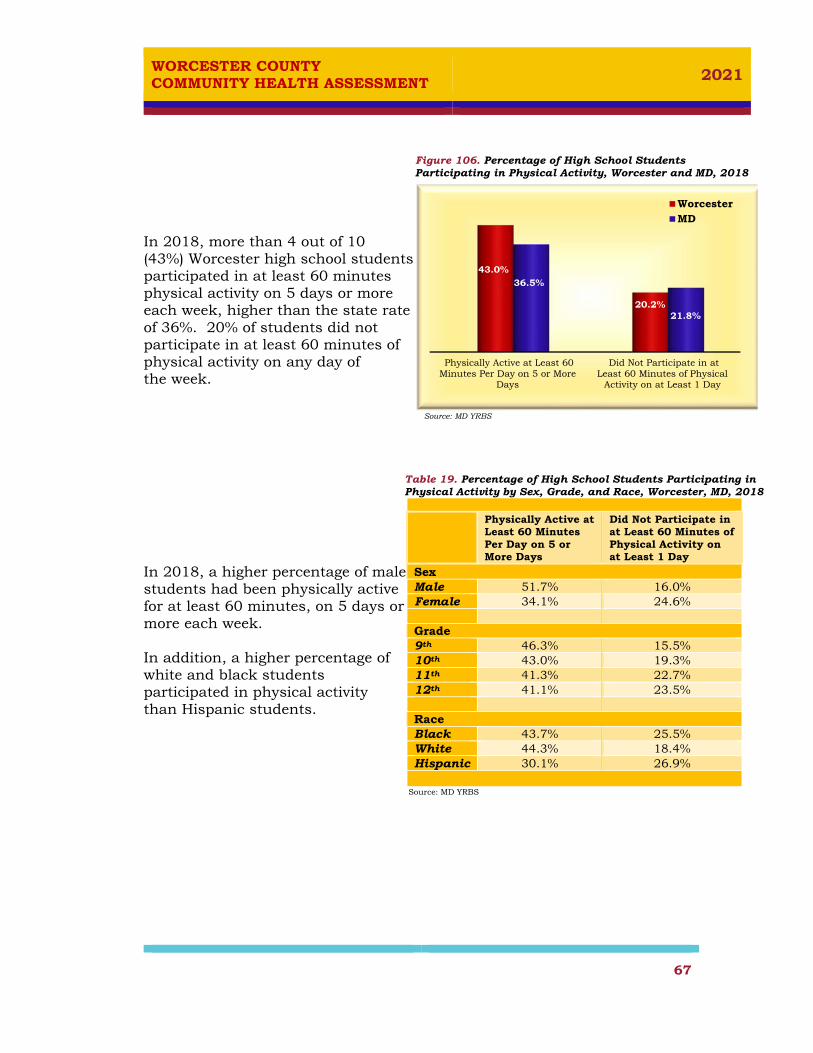
WORCESTER COUNTY COMMUNITY HEALTH ASSESSMENT
2021
67
In 2018, more than 4 out of 10 (43%) Worcester high school students participated in at least 60 minutes physical activity on 5 days or more each week, higher than the state rate of 36%. 20% of students did not participate in at least 60 minutes of physical activity on any day of the week.
Source: MD YRBS
In 2018, a higher percentage of male students had been physically active for at least 60 minutes, on 5 days or more each week. In addition, a higher percentage of white and black students participated in physical activity than Hispanic students.
Figure 106. Percentage of High School Students Participating in Physical Activity, Worcester and MD, 2018
Physically Active at Least 60Minutes Per Day on 5 or More
Days
Did Not Participate in atLeast 60 Minutes of Physical
Activity on at Least 1 Day
43.0%
20.2%
36.5%
21.8%
WorcesterMD
Table 19. Percentage of High School Students Participating in Physical Activity by Sex, Grade, and Race, Worcester, MD, 2018
Physically Active at Least 60 Minutes Per Day on 5 or More Days
Did Not Participate in at Least 60 Minutes of Physical Activity on at Least 1 Day
Sex Male 51.7% 16.0% Female 34.1% 24.6% Grade 9th 46.3% 15.5% 10th 43.0% 19.3% 11th 41.3% 22.7% 12th 41.1% 23.5% Race Black 43.7% 25.5% White 44.3% 18.4% Hispanic 30.1% 26.9%
Source: MD YRBS
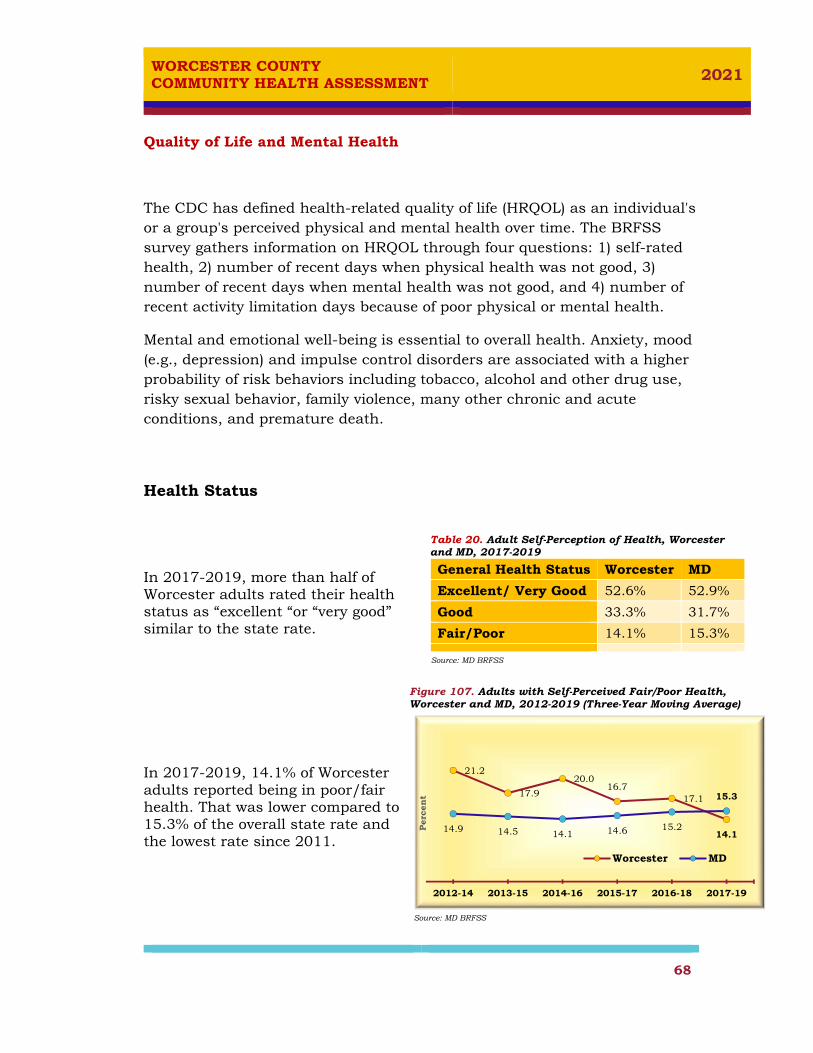
WORCESTER COUNTY COMMUNITY HEALTH ASSESSMENT
2021
68
Quality of Life and Mental Health
The CDC has defined health-related quality of life (HRQOL) as an individual's or a group's perceived physical and mental health over time. The BRFSS survey gathers information on HRQOL through four questions: 1) self-rated health, 2) number of recent days when physical health was not good, 3) number of recent days when mental health was not good, and 4) number of recent activity limitation days because of poor physical or mental health.
Mental and emotional well-being is essential to overall health. Anxiety, mood (e.g., depression) and impulse control disorders are associated with a higher probability of risk behaviors including tobacco, alcohol and other drug use, risky sexual behavior, family violence, many other chronic and acute conditions, and premature death.
Health Status
In 2017-2019, more than half of Worcester adults rated their health status as “excellent “or “very good” similar to the state rate.
Source: MD BRFSS
In 2017-2019, 14.1% of Worcester adults reported being in poor/fair health. That was lower compared to 15.3% of the overall state rate and the lowest rate since 2011.
Source: MD BRFSS
Table 20. Adult Self-Perception of Health, Worcester and MD, 2017-2019
General Health Status Worcester MD
Excellent/ Very Good 52.6% 52.9%
Good 33.3% 31.7%
Fair/Poor 14.1% 15.3%
Figure 107. Adults with Self-Perceived Fair/Poor Health, Worcester and MD, 2012-2019 (Three-Year Moving Average)
21.2
17.9
20.016.7
17.1
14.114.9 14.5 14.1 14.6 15.2
15.3
2012-14 2013-15 2014-16 2015-17 2016-18 2017-19
Per
cent
Worcester MD

WORCESTER COUNTY COMMUNITY HEALTH ASSESSMENT
2021
69
Rates of self-reported fair/poor health were similar among men and women and among blacks and whites. Adults 45 and older were more likely to report fair or poor health than those under 45.
Source: MD BRFSS
Worcester adults who reported their physical and mental health was not good on eight or more days in the past 30 days were slightly higher than state average.
Source: MD BRFSS
Male, blacks and those under 45 were more likely to report that their mental health was not good 8+ days in the past 30 days.
The proportion of adults who experienced 8+ days of poor physical health were higher among adults 45 and older and males.
Source: MD BRFSS
Figure 108. Adults with Self-Perceived Fair/Poor Health by Age Group, Sex, and Race, Worcester, MD, 2017-2019
<45YEARS
45-64YEARS
65+YEARS
Male Female Black White
1.7%
21.3% 22.0%
13.1%15.2% 15.6%
13.7%
Figure 109. Adults Reporting 8+ Days Poor Health, Worcester and MD, 2017-2019
8+ Days Poor MentalHelath
8+ Days Poor PhysicalHealth
17.8%15.5%
15.4% 13.1%
WorcesterMD
8+ Days Poor Mental Health
8+ Days Poor Physical Health
Gender
Male 17.4% 18.4%
Female 15.6% 14.4%
Age Group
<45 Years 21.9% 10.7%
45-64 Years 18.0% 20.0%
65+ Years 8.6% 20.5%
Race
Black 19.9% 16.3%
White 16.9% 16.9%
Table 21. Adults Reporting 8+ Poor Health by Gender, Age Group, and Race, Worcester, 2015-2019
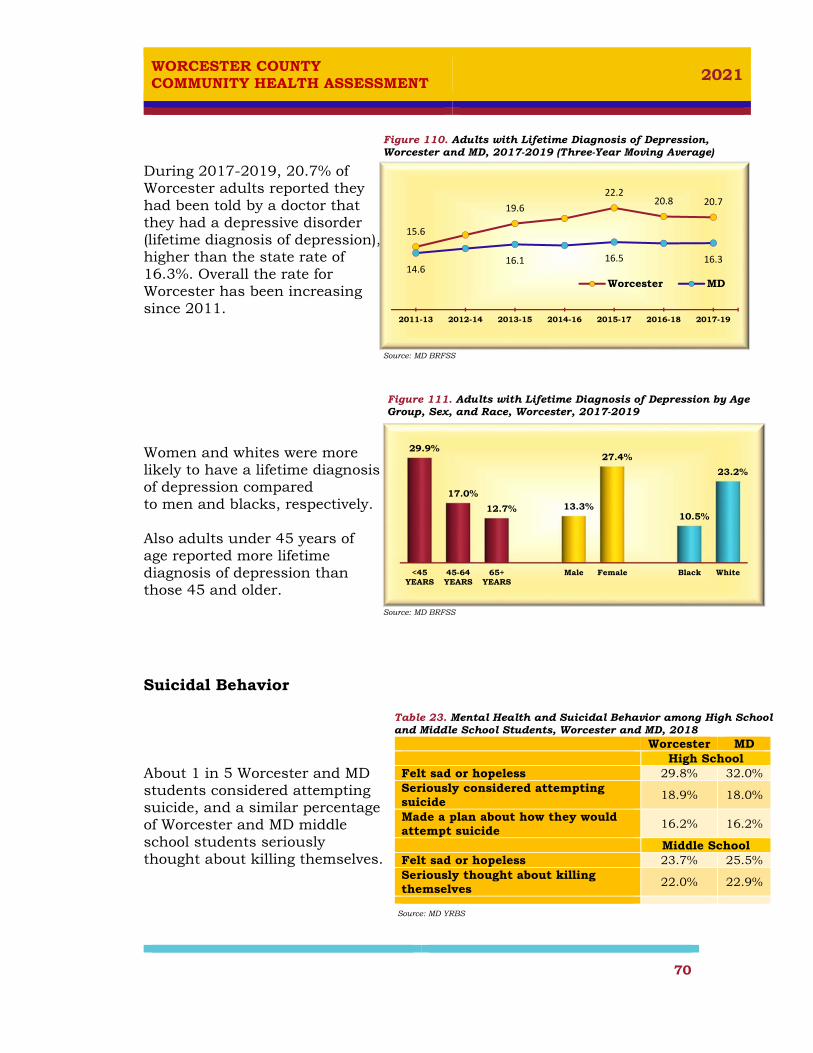
WORCESTER COUNTY COMMUNITY HEALTH ASSESSMENT
2021
70
During 2017-2019, 20.7% of Worcester adults reported they had been told by a doctor that they had a depressive disorder (lifetime diagnosis of depression), higher than the state rate of 16.3%. Overall the rate for Worcester has been increasing since 2011.
Source: MD BRFSS
Women and whites were more likely to have a lifetime diagnosis of depression compared to men and blacks, respectively. Also adults under 45 years of age reported more lifetime diagnosis of depression than those 45 and older.
Source: MD BRFSS
Suicidal Behavior About 1 in 5 Worcester and MD students considered attempting suicide, and a similar percentage of Worcester and MD middle school students seriously thought about killing themselves.
Source: MD YRBS
Figure 111. Adults with Lifetime Diagnosis of Depression by Age Group, Sex, and Race, Worcester, 2017-2019
<45YEARS
45-64YEARS
65+YEARS
Male Female Black White
29.9%
17.0%
12.7% 13.3%
27.4%
10.5%
23.2%
Figure 110. Adults with Lifetime Diagnosis of Depression, Worcester and MD, 2017-2019 (Three-Year Moving Average)
15.6
19.6
22.220.8 20.7
14.616.1 16.5 16.3
2011-13 2012-14 2013-15 2014-16 2015-17 2016-18 2017-19
Worcester MD
Table 23. Mental Health and Suicidal Behavior among High School and Middle School Students, Worcester and MD, 2018
Worcester MD High School Felt sad or hopeless 29.8% 32.0% Seriously considered attempting suicide
18.9% 18.0%
Made a plan about how they would attempt suicide
16.2% 16.2%
Middle School Felt sad or hopeless 23.7% 25.5% Seriously thought about killing themselves
22.0% 22.9%

WORCESTER COUNTY COMMUNITY HEALTH ASSESSMENT
2021
71
2018 suicide related behavior rates were similar to the 2016 rates. More female and Hispanic students reported experiencing feeling sadness and considered suicide attempt than male and other racial group students. More than 1 in 3 female and Hispanic students reported feeling sadness or hopelessness in 2018. The prevalence for females was 72% higher than for male students (37.9% vs 22%, respectively), and 74% higher for Hispanic students than for black students (37.5% vs 21.5%, respectively). Overall, black students reported a lower rate of suicidal behaviors than white and Hispanic students.
Source: MD BRFSS
Youth who report frequently bullying others and youth who report being frequently bullied are at increased risk for suicide-related behavior (CDC).
Middle school students were more likely to report being bullied in school, or electronically than high school students. In Worcester, bullying on school property and electronic bullying among middle school students increased from 2016 to 2018.
Table 25. Mental Health and Suicide Related Behavior among High School Students by Sex and Race, Worcester, 2016 and 2018
2016 2018 Felt sad or hopeless
Total 30.1% 29.8% Male 23.7% 22.0%
Female 36.4% 37.9%
Black 21.7% 21.5% White 30.8% 31.3%
Hispanic - 37.5% Seriously considered attempting suicide
Total 19.0% 18.9% Male 16.0% 14.0%
Female 21.7% 23.6%
Black 17.6% 14.6% White 17.8& 19.1%
Hispanic - 28.8% Made a plan about how they would attempt suicide
Total 15.6% 16.2% Male 15.0% 12.8%
Female 15.9% 19.8%
Black 13.6% 13.1% White 14.5% 16.3%
Hispanic - 25.5%
Table 27. School Bullying among High School and Middle School Students, Worcester and MD, 2018
Worcester MD High School 2016 2018 2018 Bullied on school property 22.5% 20.9% 16.7% Electronically bullied 19.1% 16.8% 13.5% Middle School Bullied on school property 30.5% 44.1% 38.8% Electronically bullied 15.2% 22.5% 18.3%
Source: MD YRBS

WORCESTER COUNTY COMMUNITY HEALTH ASSESSMENT
2021
72
Adverse Childhood Experiences (ACEs) are potentially traumatic events that occur in childhood. ACEs includes violence, abuse, and growing up in a family with mental health or substance use problems. ACEs are linked to chronic health problems, mental illness, and substance misuse in adulthood. (Source: CDC)
In Worcester, 52% of adults had at least one ACE and about 16% Source: Maryland BRFSS had 3 or more types of ACEs.
The age-adjusted emergency department visits related to mental health conditions reached a 10-year high in 2014, and in 2017, the rate dropped by 53%, from 7,509.3 per 100,000 population in 2014 to the 3,502.8 per 100,000 in 2017.
Source: MD State Health Improvement Process (SHIP) website
There was an increase in mental health related visits to emergency departments between 2011-2014, then the rates declined for both blacks and whites. Overall, whites had higher visit rates than blacks.
Source: MD State Health Improvement Process (SHIP) website
Figure 112. Age-Adjusted Emergency Department Visit Rates Related to Mental Health Conditions, Worcester and MD, 2010-2017
2780.83500.6 3442.6 3796.7
4291.5
3149.1
6446.1
7509.3
3657.0
3502.8
2010 2011 2012 2013 2014 2015 2016 2017
Rat
e per
100,0
00 p
opu
lati
on
MDWorcester
Figure 113. Age-Adjusted Emergency Department Visit Rates Related to Mental Health Conditions by Race, Worcester, 2010-2017
2617.7
5552.2 5646.4
3116.1
2347.7
6449.77165.9
7857.8
5732.7
3575.2
2010 2011 2012 2013 2014 2015 2016 2017
Rat
e per
100,0
00
Black White
Table 29. Prevalence of Adverse Childhood Experiences (ACEs) among Worcester and MD Adults, 2018
Worcester MD
% %
Number of ACEs
0 ACE 32.5 38.2
1 to 2 ACEs 51.7 38.8
3 to 8 ACEs 15.8 23.0
Household substance abuse 27.1 24.8
Parental separation or divorce 30.4 29.1
Intimate partner violence 11.1 15.3
Emotional abuse 35.3 34.0 Source: MD BRFSS. Data retrieved from MD Department of Health website

WORCESTER COUNTY COMMUNITY HEALTH ASSESSMENT
2021
73
Suicide In 2017-2019 suicide was the 13th and 11th leading cause of death in Worcester and MD, and the 6th leading cause of death for Worcester adults aged 45-64. During 2008-2019, a total of 81 Worcester residents died of suicide, and firearms were the common method used (60.5%).
Source: MD Vital Statistics Administration
The majority of persons who died by suicide were whites (96%) and males (80%). The age group with the most deaths from suicide was 45-64 years old, accounting for 49.4% of suicides in Worcester from 2008-2019. From 2008-2019, 59.3% of the suicides recorded in Worcester were among people who had a high school education or less.
Source: MD Vital Statistics Administration
Table 30. Characteristics of Suicide Deaths, Worcester, 2008-2019 (N=81)
Sex Male 80.3% Female 19.8%
Age Group <25 Years 8.6% 25-44 Years 12.4% 45-64 Years 49.4% 65+ Years 29.6%
Race Black 3.7% White 96.3%
Marital status Single 23.5% Married 33.3% Widowed 22.2% Divorced 30.0%
Education Level < High school 13.6% High school graduate 45.7% 1-3 years college 21.0% 4+ Years college 18.5%
Figure 114. Suicide by Method, Worcester, 2008-2019
Exposure
Firearms
Hanging
Others
Poisoning

WORCESTER COUNTY COMMUNITY HEALTH ASSESSMENT
2021
74
Worcester’s suicide rate, five- year moving average fluctuated and overall remained at similar level after 2010-2014. In 2015- 2019, the crude rate among Worcester residents was 12.8 per 100,000 population, 9.7% higher than the 2014-2018, but the same as 2010-2014 rate. Worcester suicide rate has been consistently higher rate than the state rate. Source: MD Vital Statistics Administration
Maternal and Child Health
In 2019, there were 393 live births to Worcester residents, with a birth rate of 7.5 per 1,000 population, a 5.1% decline from 2018. The rate was 34.7% lower than the overall state rate (11.6 per 1,000 population).
Source: MD Vital Statistics Administration
In 2019, the highest birth rate was among the Hispanic population at 11.8 per 1,000 population, followed by blacks (10.3 per 1,000).
Source: MD Vital Statistics Administration
Figure 115. Crude Suicide Rates, Worcester and MD, 2008-2019
14.4
13.2 12.8
11.6 12.0 11.6 11.612.8
9.2 9.3 9.4 9.5 9.5 9.7 10.0 10.2
2008-12 2010-14 2012-16 2014-18 2015-19
Rat
e per
100,0
00 p
opu
lati
on
WorcesterMD
Figure 116. Birth Rate, Worcester and MD, 2012-2019
8.8 9.08.2 7.9 7.5
12.4 12.3 12.1 11.8 11.6
2012 2013 2014 2015 2016 2017 2018 2019
Rat
e per
1,0
00 p
opula
tion
Worcester MD
Figure 117. Birth Rate by Race, Worcester, 2019
White Black Hispanic Asian/PacificIslander
6.8
10.311.8
7.9
Rat
e per
1,0
00 p
opula
tion

WORCESTER COUNTY COMMUNITY HEALTH ASSESSMENT
2021
75
Teen birth (females aged 15-19) rates have declined steadily over the past ten years both in Worcester and MD. In 2017-2019, births to Worcester teenagers aged15-19 accounted for 4.3% of all births, with the rate of 13.8 per 1,000 population, slightly lower than the overall MD rate (14.1 per 1,000). Source: MD Vital Statistics Administration
Teen birth rates have fallen for blacks and whites more than 40% in the last decade but the rates for blacks remained 3.6 times higher than the rates for whites.
Source: MD Vital Statistics Administration
Prenatal Care
During 2017-2019, about 1 in 17 infants (5.8% of live births) was born to a woman receiving late (third trimester) or no prenatal care in Worcester. That was 5.8% lower than the 2016-2018 rate and 21% below the state average (7.4%).
Source: MD Vital Statistics Administration
Figure 118. Teen Birth Rate, Worcester and MD, 2011-2019 (Three-Year Moving Average)
24.2
17.616.2
13.8
22.018.0
15.714.1
2011-13 2013-15 2015-17 2017-19
Rat
e per
1,0
00
Worcester MD
Figure 119. Teen Birth Rate by Race, Worcester, 2011-2019 (Three-Year Moving Average)
17.112.8 10.7 8.7
50.8
33.8 36.331.3
2011-13 2013-15 2015-17 2017-19
Ret
e per
1,0
00 p
opu
lati
on
White Black
Figure 120. Pregnant Women with Late/No Prenatal Care, Worcester and MD, 2011-2019 (Three-Year Moving Average)
5.55.0
6.0 5.8
8.8 9.18.3
7.4
2011-13 2013-15 2015-17 2017-19
Per
cen
t
WorcesterMD

WORCESTER COUNTY COMMUNITY HEALTH ASSESSMENT
2021
76
In 2017-2019, Hispanic women were most likely to report late or no prenatal care (10.7%), followed by blacks (7.1%).
Source: MD Vital Statistics Administration
Low Birthweight In Worcester, between the 2017 and 2019 time period, on average 6.3% of all infants delivered were low birthweight (less than 2,500 grams or 5.5 pounds). The rate was 11% higher than the 2016-2018 rate and 29% lower than the state rate of 8.8%. Source: MD Vital Statistics Administration
In 2017-2019, the rate of low birthweight in Worcester was 27% higher for black infants than white infants.
Source: MD Vital Statistics Administration
Figure 121. Pregnant Women with Late/No Prenatal Care by Race, Worcester, 2017-2019
All Races White Black Hispanic
5.8% 5.0%7.1%
10.7%
Figure 122. Low Birthweight, Worcester and MD, 2011-2019 (Three-Year Moving Average)
6.67.6 7.8
6.8
5.66.3
8.7 8.6 8.7 8.8
2011-13 2013-15 2015-17 2017-19
Per
cen
t
Worcester MD
Figure 123. Low Birthweight by Race, Worcester, 2017-2019
All Races White Black
6.3% 6.0%7.6%
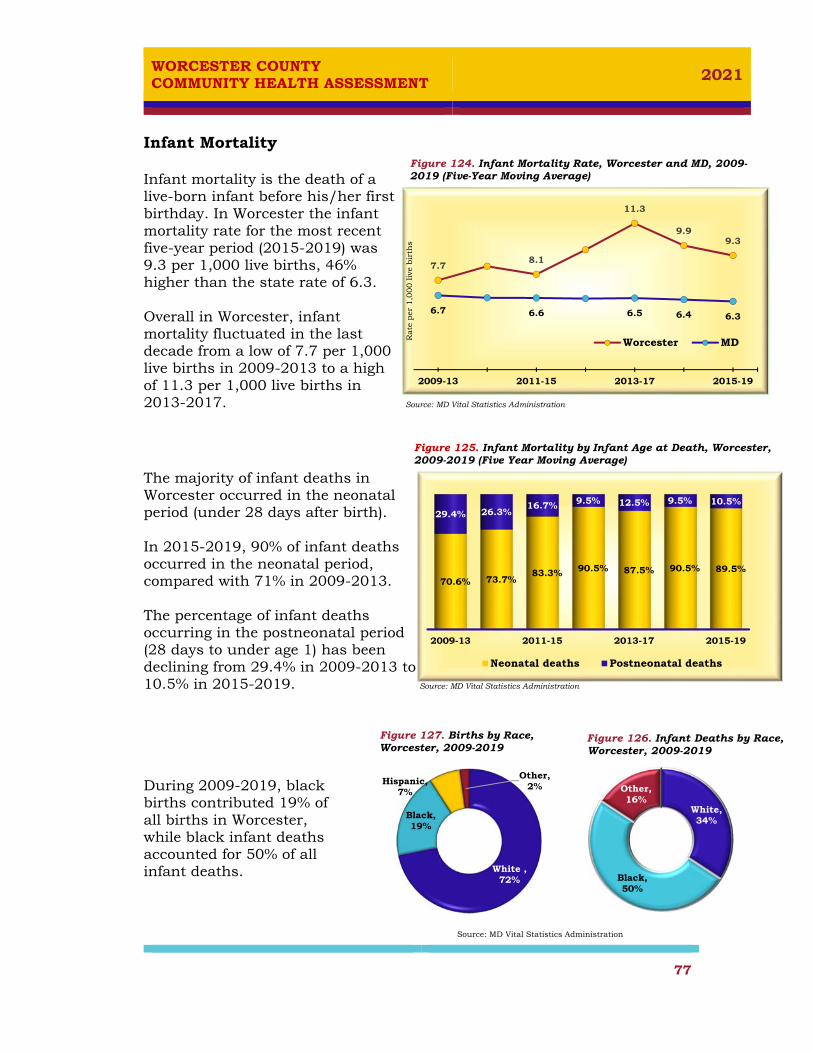
WORCESTER COUNTY COMMUNITY HEALTH ASSESSMENT
2021
77
Infant Mortality Infant mortality is the death of a live-born infant before his/her first birthday. In Worcester the infant mortality rate for the most recent five-year period (2015-2019) was 9.3 per 1,000 live births, 46% higher than the state rate of 6.3. Overall in Worcester, infant mortality fluctuated in the last decade from a low of 7.7 per 1,000 live births in 2009-2013 to a high of 11.3 per 1,000 live births in 2013-2017. Source: MD Vital Statistics Administration
The majority of infant deaths in Worcester occurred in the neonatal period (under 28 days after birth). In 2015-2019, 90% of infant deaths occurred in the neonatal period, compared with 71% in 2009-2013. The percentage of infant deaths occurring in the postneonatal period (28 days to under age 1) has been declining from 29.4% in 2009-2013 to 10.5% in 2015-2019. Source: MD Vital Statistics Administration
During 2009-2019, black births contributed 19% of all births in Worcester, while black infant deaths accounted for 50% of all infant deaths.
Source: MD Vital Statistics Administration
Figure 124. Infant Mortality Rate, Worcester and MD, 2009-2019 (Five-Year Moving Average)
7.78.1
11.3
9.99.3
6.7 6.6 6.5 6.4 6.3
2009-13 2011-15 2013-17 2015-19
Rat
e per
1,0
00 liv
e bir
ths
Worcester MD
Figure 125. Infant Mortality by Infant Age at Death, Worcester, 2009-2019 (Five Year Moving Average)
2009-13 2011-15 2013-17 2015-19
70.6% 73.7%83.3% 90.5% 87.5% 90.5% 89.5%
29.4% 26.3%16.7% 9.5% 12.5% 9.5% 10.5%
Neonatal deaths Postneonatal deaths
Figure 126. Infant Deaths by Race, Worcester, 2009-2019
White, 34%
Black, 50%
Other, 16%
Figure 127. Births by Race, Worcester, 2009-2019
White , 72%
Black, 19%
Hispanic, 7%
Other, 2%
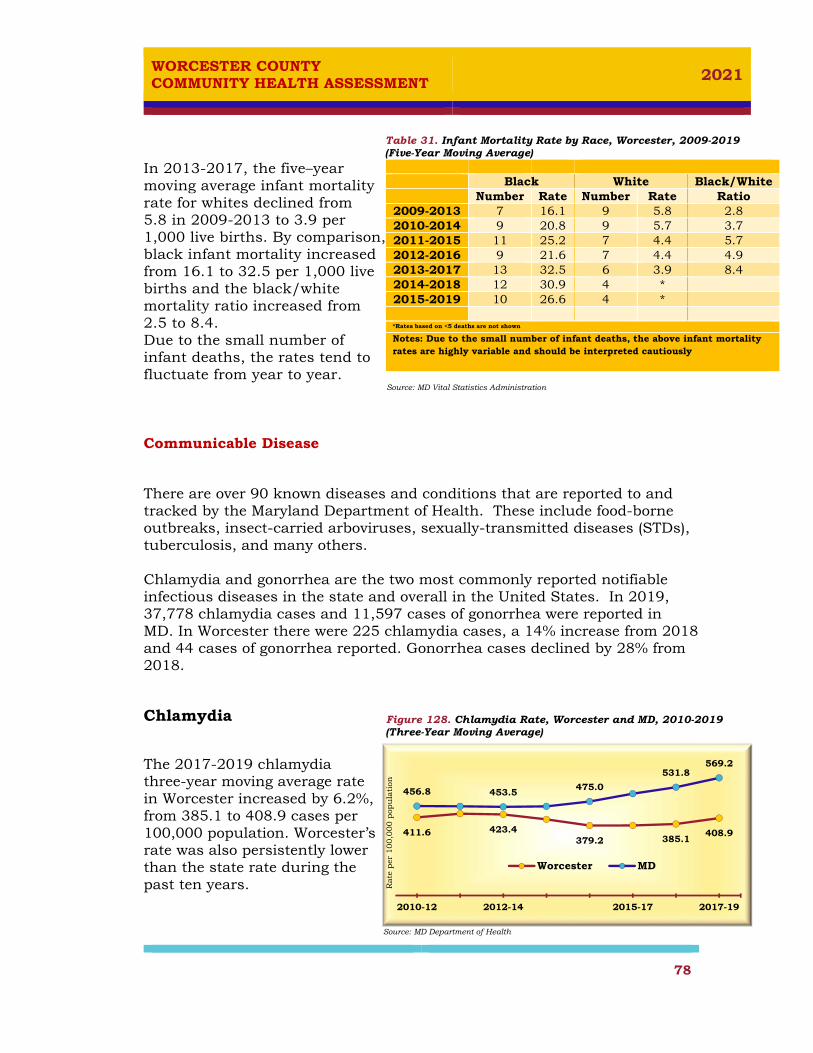
WORCESTER COUNTY COMMUNITY HEALTH ASSESSMENT
2021
78
In 2013-2017, the five–year moving average infant mortality rate for whites declined from 5.8 in 2009-2013 to 3.9 per 1,000 live births. By comparison, black infant mortality increased from 16.1 to 32.5 per 1,000 live births and the black/white mortality ratio increased from 2.5 to 8.4. Due to the small number of infant deaths, the rates tend to fluctuate from year to year. Source: MD Vital Statistics Administration
Communicable Disease
There are over 90 known diseases and conditions that are reported to and tracked by the Maryland Department of Health. These include food-borne outbreaks, insect-carried arboviruses, sexually-transmitted diseases (STDs), tuberculosis, and many others. Chlamydia and gonorrhea are the two most commonly reported notifiable infectious diseases in the state and overall in the United States. In 2019, 37,778 chlamydia cases and 11,597 cases of gonorrhea were reported in MD. In Worcester there were 225 chlamydia cases, a 14% increase from 2018 and 44 cases of gonorrhea reported. Gonorrhea cases declined by 28% from 2018.
Chlamydia
The 2017-2019 chlamydia three-year moving average rate in Worcester increased by 6.2%, from 385.1 to 408.9 cases per 100,000 population. Worcester’s rate was also persistently lower than the state rate during the past ten years.
Source: MD Department of Health
Table 31. Infant Mortality Rate by Race, Worcester, 2009-2019 (Five-Year Moving Average)
Black White Black/White Number Rate Number Rate Ratio
2009-2013 7 16.1 9 5.8 2.8 2010-2014 9 20.8 9 5.7 3.7 2011-2015 11 25.2 7 4.4 5.7 2012-2016 9 21.6 7 4.4 4.9 2013-2017 13 32.5 6 3.9 8.4 2014-2018 12 30.9 4 * 2015-2019 10 26.6 4 *
*Rates based on <5 deaths are not shown
Notes: Due to the small number of infant deaths, the above infant mortality rates are highly variable and should be interpreted cautiously
Figure 128. Chlamydia Rate, Worcester and MD, 2010-2019 (Three-Year Moving Average)
411.6 423.4379.2 385.1
408.9
456.8 453.5 475.0
531.8569.2
2010-12 2012-14 2015-17 2017-19
Rat
e per
100,0
00 p
opu
lati
on
Worcester MD

WORCESTER COUNTY COMMUNITY HEALTH ASSESSMENT
2021
79
Gonorrhea
During 2017-2019, a total of 160 gonorrhea cases were reported in Worcester. This case count corresponds to a rate of 102.7 cases per 100,000 population, a decline of 11.5% compared with the rate in 2016-2018, and 40% lower than the state rate.
Source: MD Department of Health
Influenza (Flu) and Pneumonia Immunizations
Influenza (flu) is a serious contagious disease which can lead to hospitalization and sometimes death. The best way to prevent seasonal flu is by getting a seasonal flu vaccination each year. During 2016-2018, influenza and pneumonia were the tenth leading cause of death overall in Worcester, and the sixth leading cause of death for the 65-74 year old age group. There was a variation in flu vaccination coverage among adults age 18+ years and 65+ years, ranging from 25% and 52.1% in 2015 to 54.6% in 2019 and 70.7% in 2017, respectively. In 2019, 54.6% adults 18 years and above reported receiving influenza vaccination, the highest coverage rate in over a decade. Among adults age 65 and older, the coverage rate in 2019 increased by 12% (from 59.5% in 2018 to 67% in 2019) and about 2 percentage points lower than the state rate. Source: MD BRFSS
Figure 129. Gonorrhea Rate, Worcester and MD, 2010-2019 (Three-Year Moving Average)
94.5 89.8
109.3 116.1102.7
111.8100.0
124.9
164.6175.5
2010-12 2012-14 2015-17 2017-19
Rat
e per
100,0
00 p
opu
lati
on
Worcester MD
Figure 130. Flu Vaccination Coverage among Adults 18 Years and Older, Worcester and MD, 2011-2019
38.544.9 45.4
42.6
25.6
39.9
49.0
36.8
54.6
68.9 67.8
52.1
70.767.0
2011 2012 2013 2014 2015 2016 2017 2018 2019
Per
cen
t
Overall Worcester Overall MD
65+ Worcetser 65+ MD

WORCESTER COUNTY COMMUNITY HEALTH ASSESSMENT
2021
80
In 2019, 72% of adults ages 65 and older reported receiving pneumococcal vaccinations, an increase of 21% from 2018, and 6% lower than the overall state rate.
Source: MD BRFSS
Among adults 65 years and older, blacks and males had lower vaccination coverage than whites and females.
Source: MD BRFSS
During 2017-2019, Worcester ranked in the top five of 24 MD counties with the highest 3-year average flu vaccination rate among adults 65 years and older.
Source: MD BRFSS
Figure 131. Pneumococcal Vaccination Coverage among Adults Aged 65 and Over, Worcester and MD, 2018-2019
2018 2019
59.5% 72.0%
56.5%
76.6%
Worcester MD
Figure 132. Flu Vaccination Coverage by Race, and Sex Adults 65 Years and Older, Worcester, 2017-2019 (Three-Year Average)
Total White Black Male Female
65.7%68.7%
54.8%64.7% 66.7%
Figure 133. Flu Vaccination Coverage by County, Adults 65 Years and Older, MD, 2017-2019 (Three-Year Average)
MontgomeryAnne Arundel
TalbotQueen Anne's
WorcesterHoward
KentCarroll
BaltimoreCharles
70.0%
67.5%
66.4%
65.9%
65.7%
65.4%
64.8%
64.8%
64.0%
63.7%
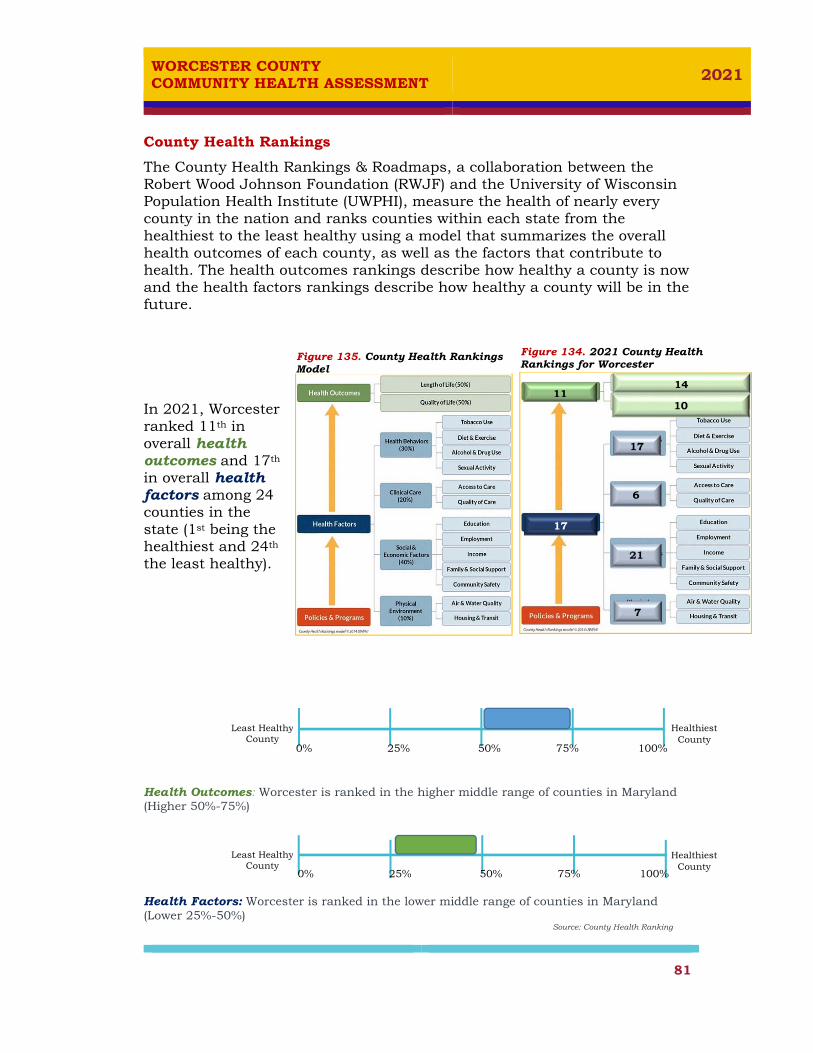
WORCESTER COUNTY COMMUNITY HEALTH ASSESSMENT
2021
81
County Health Rankings
The County Health Rankings & Roadmaps, a collaboration between the Robert Wood Johnson Foundation (RWJF) and the University of Wisconsin Population Health Institute (UWPHI), measure the health of nearly every county in the nation and ranks counties within each state from the healthiest to the least healthy using a model that summarizes the overall health outcomes of each county, as well as the factors that contribute to health. The health outcomes rankings describe how healthy a county is now and the health factors rankings describe how healthy a county will be in the future.
In 2021, Worcester ranked 11th in overall health outcomes and 17th in overall health factors among 24 counties in the state (1st being the healthiest and 24th the least healthy).
Health Outcomes: Worcester is ranked in the higher middle range of counties in Maryland (Higher 50%-75%) Health Factors: Worcester is ranked in the lower middle range of counties in Maryland (Lower 25%-50%) Source: County Health Ranking
11
17
14
17
6
7
10
0% 25% 50% 75% 100%
0% 25% 50% 75% 100%
Least Healthy County
Healthiest County
Least Healthy County
Healthiest County
Figure 135. County Health Rankings Model
Figure 134. 2021 County Health Rankings for Worcester

WORCESTER COUNTY COMMUNITY HEALTH ASSESSMENT
2021
82
Overall in the past five years Worcester’s rank has shown little or no improvement. Even though measures related to physical environment (air pollution, water quality, housing, and transit) remained the same or in some cases improving, Worcester’s ranking changed from 2nd in 2016 to 7th in 2021.
All three counties (Worcester, Wicomico and Somerset) ranked in the bottom five of Maryland 24 counties in social and economic factors.
Next step: This report provides information on a wide range of health indicators that helps us understand the community health status in relation to the state and national objectives. The assessment report findings will now be used to identify community heath priorities and develop strategies to address the identified issues. The public and private health system partners are encouraged to use this report. Please cite original source of the data “as reported in the Worcester Community Health Assessment, 2021.” Lastly, please let us know about your experiences with this CHA.
Table 32. Changes in County Health Rankings, 2016 to 2021 2016
Ranking 2021
Ranking Change
Overall Health Outcome
12 11 1
Length of Life 14 14 0 Quality of Life 11 10 1
Overall Health Factors
15
17
-2
Health Behaviors 16 17 -1 Clinical Care 7 6 1
Socio & Economic Factors
21
21
0
Physical Environment
2
7
-5
Source: County Health Ranking
Table 33. Tri-County (Worcester, Wicomico, and Somerset) Health Outcome and Health Factor Rankings, 2021 Worcester
Ranking Wicomico Ranking
Somerset Ranking
Length of Life 14 19 21 Quality of Life 10 20 23 Health Behaviors 17 18 24 Clinical Care 6 17 18 Socio & Economic Factors
21
20
23
Physical Environment
7
23
17
Source: County Health Ranking

WORCESTER COUNTY COMMUNITY HEALTH ASSESSMENT
2021
83
References
1. Worcester County Health Department web site : http://worcesterhealth.org/
2. Maryland Behavioral Risk Factor Surveillance System web site: https://ibis.health.maryland.gov/
3. Maryland Youth Risk Behavior Survey: https://phpa.health.maryland.gov/ccdpc/Reports/Pages/YRBS2018.asp
4. Maryland Vital Statistics Administration web site : http://dhmh.maryland.gov/vsa
5. Maryland State Health Improvement Process web site : https://pophealth.health.maryland.gov/pages/ship-lite-home.aspx
6. U.S. Census: www.census.gov
7. Small Area Income and Poverty Estimates: http://www.census.gov/did/www/saipe
8. U.S Census :http://www.census.gov/quickfacts/dashboard/
9. Maryland at Glance: http://msa.maryland.gov/msa/mdmanual/01glance/economy/html/unemployrates.html
10. CDC -Chronic Disease Prevention and Health Promotion web site : http://www.cdc.gov/chronicdisease/index.htm
11. CDC- Nutrition, Physical Activity and Obesity web site : http://www.cdc.gov/nccdphp/dnpao/index.html
12. Healthy People 2030 web site : https://health.gov/healthypeople
13. ALICE — Asset Limited, Income Constrained, Employed https://www.unitedforalice.org/maryland
14. Worcester County Network of Care web site: http://worcester.md.networkofcare.org/ph/
15. County Health Rankings: https://www.countyhealthrankings.org/

WORCESTER COUNTY COMMUNITY HEALTH ASSESSMENT
2021
84
16. Maryland Medicaid: https://md-medicaid.org/
17. Mobilizing for Action through Planning and Partnerships (MAPP) https://www.naccho.org/programs/public-health-infrastructure/performance-improvement/community-health-assessment/mapp
18. HRSA- Health Professional Shortage Areas web site: http://hpsafind.hrsa.gov/
19. Institute of Medicine, Committee on Monitoring Access to Personal Health Care Services. Access to health care in America. Washington, DC: National Academy Press; 1993.
20. CDC- Seasonal Influenza(Flu) : www.cdc.gov/flu/
21. CDC. Alcohol-attributable deaths and years of potential life lost, United
States, 2001. MMWR 2004;5
22. CDC. Alcohol and Public Health: Alcohol-Related Disease Impact (ARDI) [database].
23. Freedman DS, Khan LK, Serdula MK, Dietz WH, Srinivasan SR, Berenson GS. The relation of childhood BMI to adult adiposity: the Bogalusa Heart Study. Pediatrics. 2005;115:22–27.
24. Centers for Disease Control and Prevention. Annual smoking-attributable mortality, years of potential life lost, and productivity losses—United States, 1997–2001. MMWR. 2005;54(250):625-628
25. National Association of County and City Health Officials http://naccho.org/
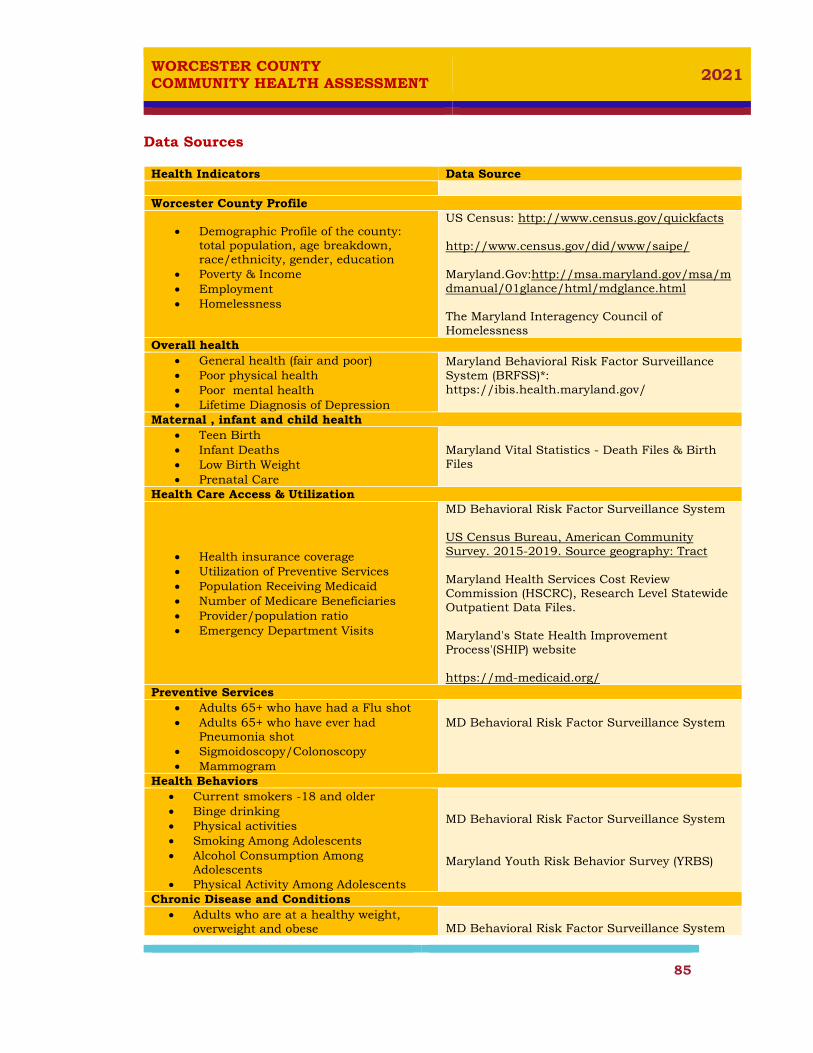
WORCESTER COUNTY COMMUNITY HEALTH ASSESSMENT
2021
85
Data Sources
Health Indicators Data Source Worcester County Profile
Demographic Profile of the county: total population, age breakdown, race/ethnicity, gender, education
Poverty & Income Employment Homelessness
US Census: http://www.census.gov/quickfacts http://www.census.gov/did/www/saipe/ Maryland.Gov:http://msa.maryland.gov/msa/mdmanual/01glance/html/mdglance.html The Maryland Interagency Council of Homelessness
Overall health General health (fair and poor) Poor physical health Poor mental health Lifetime Diagnosis of Depression
Maryland Behavioral Risk Factor Surveillance System (BRFSS)*: https://ibis.health.maryland.gov/
Maternal , infant and child health Teen Birth Infant Deaths Low Birth Weight Prenatal Care
Maryland Vital Statistics - Death Files & Birth Files
Health Care Access & Utilization
Health insurance coverage Utilization of Preventive Services Population Receiving Medicaid Number of Medicare Beneficiaries Provider/population ratio Emergency Department Visits
MD Behavioral Risk Factor Surveillance System US Census Bureau, American Community Survey. 2015-2019. Source geography: Tract Maryland Health Services Cost Review Commission (HSCRC), Research Level Statewide Outpatient Data Files. Maryland's State Health Improvement Process'(SHIP) website https://md-medicaid.org/
Preventive Services Adults 65+ who have had a Flu shot Adults 65+ who have ever had
Pneumonia shot Sigmoidoscopy/Colonoscopy Mammogram
MD Behavioral Risk Factor Surveillance System
Health Behaviors Current smokers -18 and older Binge drinking Physical activities Smoking Among Adolescents Alcohol Consumption Among
Adolescents Physical Activity Among Adolescents
MD Behavioral Risk Factor Surveillance System Maryland Youth Risk Behavior Survey (YRBS)
Chronic Disease and Conditions Adults who are at a healthy weight,
overweight and obese MD Behavioral Risk Factor Surveillance System

WORCESTER COUNTY COMMUNITY HEALTH ASSESSMENT
2021
86
High blood pressure among adults Diabetes among adults Adults With Asthma Adults With COPD Adults With Cardiovascular Disease Weight Status Among Adolescents Asthma among Adolescents Chlamydia Incidence Gonorrhea Incidence
Maryland Youth Risk Behavior Survey Maryland Department of Health and Mental Hygiene
Mortality Life Expectancy Mortality rate for Top Ten Leading
Causes of Death Years of Potential Life Lost to 75 (YPLL-
75) Drug- and Alcohol-Related Intoxication
Deaths Cancer Death
Maryland Vital Statistics Administration Maryland Department of Health and Mental Hygiene- Cancer report

2021
Worcester County, Maryland
Assessment
Community Themes and Strengths
2021-WORCESTER COUNTY COMMUNITY THEMES AND STRENGTHS ASSESSMENT
1
Table of Contents Introduction ............................................................................................................. 3
Findings ................................................................................................................... 3
Survey Participants Demographic .......................................................................... 3
1. Quality of Life ................................................................................................. 5
I. Personal health and the health of the community ......................................................... 5
II. Satisfaction with the community ........................................................................................ 8
2. Community Health Issues ............................................................................ 14
a) Top-three factors that most improve the quality of life in a community ........ 14
b) Top-three health issues ..................................................................................... 16
c) Top-three strength ............................................................................................... 17
d) Top-three risk behavior ..................................................................................... 18
e) Top-three challenges to getting medical care ............................................. 19
f) Top-three topics people in your community need more information …………………………………………………………………………………………………………………………….20
3. Additional Comments or Feedback ............................................................... 21

2021-WORCESTER COUNTY COMMUNITY THEMES AND STRENGTHS ASSESSMENT
2
List of Figures
Figure 1. Employment Status ................................................................................... 5 Figure 2. Personal Perception of Health by Race ....................................................... 6 Figure 3. Community Perception of Health by Race ................................................... 6 Figure 4. Community Perception of Heath by Household Income Level ...................... 7 Figure 5. Respondents who Reported Fair/Poor Personal and Community Health by Age Group ................................................................................................................ 7 Figure 6. Satisfaction with Quality of Life ................................................................. 8 Figure 7. Satisfaction with Quality of Life by Race .................................................... 8 Figure 8. Satisfaction with Quality of Life by Age Group ............................................ 8 Figure 9. Satisfaction with the Health Care Services ................................................. 9 Figure 10. Satisfaction with Health Care Services By Race ........................................ 9 Figure 11. Satisfaction with Health Care Services By Age Group ............................... 9 Figure 12. Level of Agreement with Community Safety ............................................ 10 Figure 13.Level of Agreement with Employment/Economic Opportunity in the Community ............................................................................................................ 11 Figure 14. Level of Agreement on Community Connectedness and Diversity ........... 12 Figure 15. Level of Agreement on Environmental Health ......................................... 13 Figure 16. Respondents who Strongly Agreed or Agreed to Being Satisfied with Their Living Conditions .................................................................................................... 14
List of Tables
Table 1. Race and Gender ......................................................................................... 4 Table 2. Marital Status ............................................................................................. 4 Table 3. Education Attainment ................................................................................. 4 Table 4. Age Group ................................................................................................... 4 Table 5. Household Income ....................................................................................... 4 Table 6. Personal Perception of Health ...................................................................... 5 Table 7. Community Perception of Health ................................................................. 6 Table 8. Top-Three Factors for Heathy Community-All Respondents ....................... 14 Table 9. Top-Three Health Issues - All Respondents ................................................ 16 Table 10. Top-Three Strengths of the Community-All Respondents ......................... 17 Table 11. Top-Three Risk Behaviors in the Community - All Respondents ............... 18 Table 12. Top-Three Challenges to Getting Medical Care - All Respondents ............. 19 Table 13. Top-Three Topics Community Need for More Information - All Respondents ............................................................................................................................... 20
2021-WORCESTER COUNTY COMMUNITY THEMES AND STRENGTHS ASSESSMENT
3
Introduction Community Themes and Strengths Assessment (CTSA) is one of four assessments within the Mobilizing for Action through Planning and Partnerships (MAPP) framework. The CTSA provides a deep understanding of the issues that residents feel are important by answering the questions: “What is important to our community?” “How is quality of life perceived in our community?” and “What assets do we have that can be used to improve community health?” The Worcester County CTSA is one of the two assessments completed as part of the 2021 Community Health Need Assessment.
During the winter of 2020, the Worcester County Health Department gathered community input on perception of health and needs through a community survey (distributed both online and in paper format). The survey instrument was created by Worcester County Health Department. The survey consisted of 38 questions related to personal and community health, and the community’s strengths and weaknesses. The survey was a convenience sample and open to “anyone who lived, worked, or played in Worcester County.” The survey was conducted before the COVID-19 state-wide shutdown.
A total of 569 community members participated in the survey. Nearly 66% of the respondents lived in Worcester County. The second largest respondents were from neighboring Wicomico County (15%).
Findings
Survey Participants Demographic Respondents key characteristics:
81% were white 73% were women 55% were married 54% were 55 years of age and above 60% earned a college degree or higher 58% had a yearly household income more than $49,000 66% were full-time or part-time employed, 18% were retired 68% owned a house

2021-WORCESTER COUNTY COMMUNITY THEMES AND STRENGTHS ASSESSMENT
4
Compared to the general population, the survey sample had more female respondents (52% vs 73%, respectively) and held higher levels of educational attainment (60%) than the general population (29%).
The table and graph below shows the detailed demographic characteristics of survey participants.
Table 1. Race and Gender
Race/ Ethnicity
White 80.8%
Black 13.7%
Hispanic 2.4%
Other 3.0%
Gender
Female 73.1%
Male 26.9%
Table 4. Age Group
18-25 years 3.8%
26-39 years 15.4%
40-54 years 27.1%
55-64 years 24.4%
65-80 years 24.6%
Over 80 years 4.6%
Table 5. Household Income
Less than $20,000 16.2%
$20,000 to $29,000 9.6%
$30,000 to $49,000 18.4%
Over $50,000 55.7%
Table 3. Education Attainment
Less than High School 3.5%
High School Diploma or GED 17.1%
Some College 19.7%
College Degree or Higher 59.6%
Table 2. Marital Status
Married 54.6%
Single 25.2%
Divorced 10.5%
Widowed 9.5%

2021-WORCESTER COUNTY COMMUNITY THEMES AND STRENGTHS ASSESSMENT
5
1. Quality of Life
I. Survey participants were asked to rate their personal health and the health of their community as excellent, very good, good, fair or poor.
Almost half of survey respondents rated their overall personal health as excellent or very good another 40% rated as good.
Figure 1. Employment Status
Unemployed, 30.1%
Full-time employed, 54.2%
Part-time employed,
11.4%
Self-employed,
4.2%Reason for unemployment
Retired 62.2%
Disabled (receiving disability benefits)
13.5%
Cannot find work 7.7%
Laid off 6.4%
Unable to work for health reasons
4.5%
Table 6. Personal Perception of Health
Excellent 10.5%
Very Good 36.4%
Good 40.3%
Fair 10.5%
Poor 2.3%

2021-WORCESTER COUNTY COMMUNITY THEMES AND STRENGTHS ASSESSMENT
6
50% of white respondents rated their personal health excellent/ very good compared to 39% of black respondents.
Black respondents reported fair or poor health at a rate of 18.8% compared to 12% for whites.
67% of respondents rated their community health either good, very good, or excellent. More respondents rated their community health as fair/poor (33%) compared to personal health (13%). Nearly 7 out of 10 black and white respondents rated their community either good, very good, or excellent.
35.7% black and 32% white respondents rated their community health as fair/poor.
Figure 2. Personal Perception of Health by Race
Excellent/VeryGood
Good Fair/Poor
50.0%
38.0%
12.0%
39.1%42.0%
18.8%
WhiteBlack
Table 7. Community Perception of Health
Excellent 2.7% Very Good 17.6% Good 46.8% Fair 29.5% Poor 3.4%
Figure 3. Community Perception of Health by Race
Excellent/VeryGood
Good Fair/Poor
19.8%
48.2%
32.0%22.9%
41.4%35.7%
WhiteBlack

2021-WORCESTER COUNTY COMMUNITY THEMES AND STRENGTHS ASSESSMENT
7
16% of survey respondents reported a household income under $20,000. Of those, 2 in 5 (42%) rated their community health as fair or poor compared to 30% of respondents with household income above $30,000.
More respondents rated their community health as fair/poor comparing to personal health, across all age group. Younger adults (18-39 years) were more likely than middle age or older adults (≥65 years) to rate their community health as fair or poor.
Figure 4. Community Perception of Heath by Household Income Level
Less than$20,000
$20,000 to$29,000
$30,000 to$49,000 Over $50,000
18.2% 19.1% 16.9% 22.7%
40.3% 42.6% 52.8% 46.8%
41.6% 38.3% 30.3% 30.5%
Excellent/Very Good Good Fair/Poor
Figure 5. Respondents who reported Fair/Poor personal and Community Health by Age Group
18-39 Years 40-64 Years 65+ Years
6.1%
14.5% 13.3%
41.4%
34.7%
25.0%
Personal Health Community Health
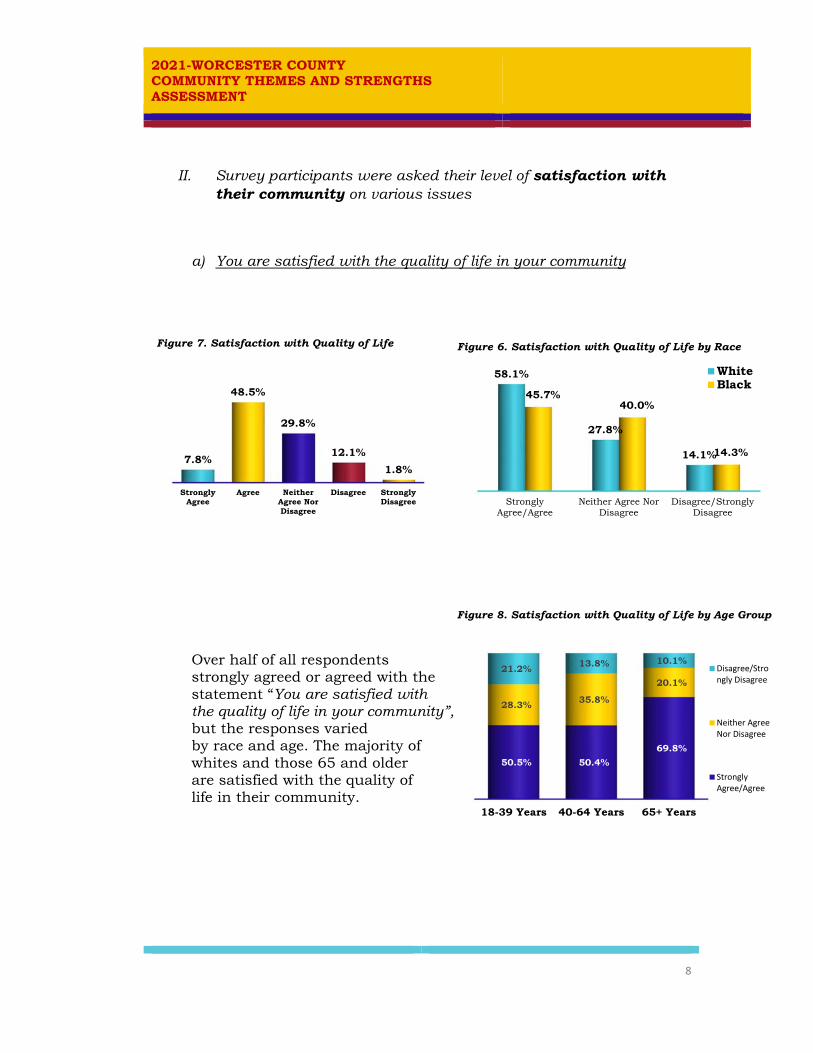
2021-WORCESTER COUNTY COMMUNITY THEMES AND STRENGTHS ASSESSMENT
8
II. Survey participants were asked their level of satisfaction with
their community on various issues
a) You are satisfied with the quality of life in your community
Over half of all respondents strongly agreed or agreed with the statement “You are satisfied with the quality of life in your community”, but the responses varied by race and age. The majority of whites and those 65 and older are satisfied with the quality of life in their community.
Figure 7. Satisfaction with Quality of Life
StronglyAgree
Agree NeitherAgree NorDisagree
Disagree StronglyDisagree
7.8%
48.5%
29.8%
12.1%
1.8%
Figure 6. Satisfaction with Quality of Life by Race
StronglyAgree/Agree
Neither Agree NorDisagree
Disagree/StronglyDisagree
58.1%
27.8%
14.1%
45.7%40.0%
14.3%
WhiteBlack
Figure 8. Satisfaction with Quality of Life by Age Group
18-39 Years 40-64 Years 65+ Years
50.5% 50.4%
69.8%
28.3% 35.8%
20.1%
21.2% 13.8% 10.1%Disagree/Strongly Disagree
Neither AgreeNor Disagree
StronglyAgree/Agree

2021-WORCESTER COUNTY COMMUNITY THEMES AND STRENGTHS ASSESSMENT
9
b) You are satisfied with the health care services in your community.
Overall, 58% of respondents are satisfied with the health care services in their community. Whites and those in the 18-39 years age group were more likely to disagree with being satisfied with health care services.
Figure 9. Satisfaction with the Health Care Services
StronglyAgree
Agree NeitherAgree NorDisagree
Disagree StronglyDisagree
8.1%
49.6%
17.0%21.6%
3.8%
Figure 10. Satisfaction with Health Care Services by Race
StronglyAgree/Agree
Neither Agree NorDisagree
Disagree/StronglyDisagree
57.6%
15.2%
27.3%
58.6%
21.4% 20.0%
White
Black
Figure 11. Satisfaction with Health Care Services by Age Group
18-39 Years 40-64 Years 65+ Years
48.5% 55.2%63.9%
18.6%17.6%
17.7%
33.0% 27.2%18.4%
Disagree/Strongly Disagree
Neither AgreeNor Disagree
StronglyAgree/Agree
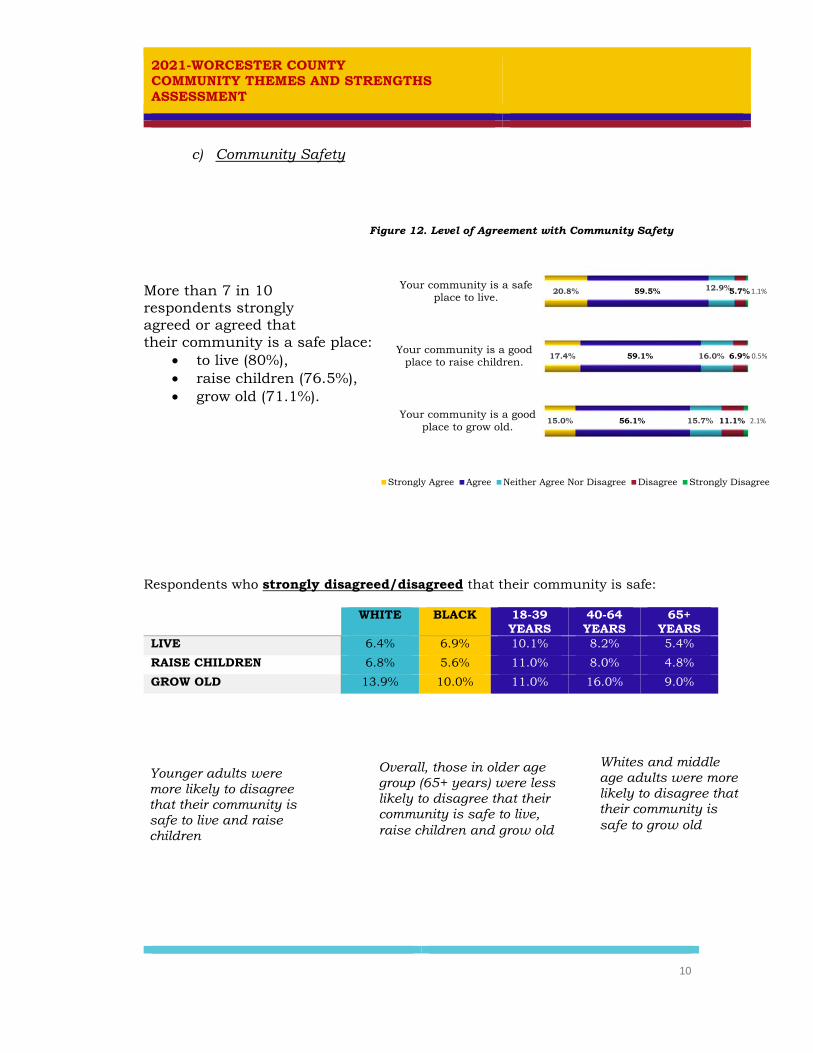
2021-WORCESTER COUNTY COMMUNITY THEMES AND STRENGTHS ASSESSMENT
10
c) Community Safety
More than 7 in 10 respondents strongly agreed or agreed that their community is a safe place:
to live (80%), raise children (76.5%), grow old (71.1%).
Respondents who strongly disagreed/disagreed that their community is safe: WHITE BLACK 18-39
YEARS 40-64 YEARS
65+ YEARS
LIVE 6.4% 6.9% 10.1% 8.2% 5.4%
RAISE CHILDREN 6.8% 5.6% 11.0% 8.0% 4.8%
GROW OLD 13.9% 10.0% 11.0% 16.0% 9.0%
Figure 12. Level of Agreement with Community Safety
Your community is a safeplace to live.
Your community is a goodplace to raise children.
Your community is a goodplace to grow old.
20.8%
17.4%
15.0%
59.5%
59.1%
56.1%
12.9%
16.0%
15.7%
5.7%
6.9%
11.1%
1.1%
0.5%
2.1%
Strongly Agree Agree Neither Agree Nor Disagree Disagree Strongly Disagree
Younger adults were more likely to disagree that their community is safe to live and raise children
Whites and middle age adults were more likely to disagree that their community is safe to grow old
Overall, those in older age group (65+ years) were less likely to disagree that their community is safe to live, raise children and grow old

2021-WORCESTER COUNTY COMMUNITY THEMES AND STRENGTHS ASSESSMENT
11
d) Employment/economic opportunity
One in three respondents disagreed that there are job opportunities in their community.
Nearly, 1 in 4 respondents are dissatisfied with youth activities in their community. The same number of respondents disagreed that there are options for youth to move from school to job or college.
Respondents who strongly disagreed/disagreed that:
WHITE
BLACK 18-39 YEARS
40-64 YEARS
65+ YEARS
THERE ARE JOB OPPORTUNITIES IN YOUR COMMUNITY.
31.5%
45.1%
30.3%
36.6%
27.6%
YOU ARE SATISFIED WITH THE ACTIVITIES IN THE COMMUNITY FOR THE YOUTH.
21.1%
35.7%
25.0%
26.3%
12.9% THERE ARE OPTIONS FOR YOUTH TO MOVE FROM HIGH SCHOOL TO JOBS, TRADE SCHOOLS OR COLLEGES IN YOUR COMMUNITY.
19.3%
32.9%
29.4%
19.4%
21.2%
Figure 13. Level of Agreement with Employment/Economic Opportunity in the Community
There are job opportunities in yourcommunity.
You are satisfied with the activities in thecommunity for the youth.
There are options for youth to move fromhigh school to jobs, trade schools or
colleges in your community.
5.4%
8.5%
7.5%
35.4%
41.4%
44.1%
26.7%
27.5%
27.4%
26.5%
17.9%
18.0%
6.1%
4.6%
3.0%
Strongly Agree Agree Neither Agree Nor Disagree Disagree Strongly Disagree
Black respondents are more likely to disagree/strongly disagree:
that there are job opportunities (45%) that they are satisfied with youth
activities (36%) that there are options for youth to
move from school to jobs/colleges (33%)
More than 1 in 3 (37%) middle age adults disagree that there are job opportunities. Those under age 40, are more likely (29%) to disagree that there are options for youth to move from high school to job or college.

2021-WORCESTER COUNTY COMMUNITY THEMES AND STRENGTHS ASSESSMENT
12
e) Community connectedness/engagement and disparity
In their community: 83% respondents strongly
agreed or agreed that they can work with others to make the community a better place to live
61% are satisfied with the work done by business and organization
57% are satisfied with level of trust and respect between residents
65% strongly agreed or agreed that disparity exists among groups
Respondents who strongly disagreed/disagreed that:
WHITE
BLACK 18-39 YEARS
40-64 YEARS
65+ YEARS
IN YOUR COMMUNITY, YOU CAN WORK BY YOURSELF OR WITH OTHERS TO MAKE THE COMMUNITY A BETTER PLACE TO LIVE.
4.7%
12.69%
3.0%
8.0%
4.1%
YOU ARE SATISFIED WITH THE WORK DONE BY BUSINESSES, AGENCIES, AND ORGANIZATIONS TO STRENGTHEN YOUR COMMUNITY.
11.3%
28.2%
13.0%
14.1%
12.9%
YOU ARE SATISFIED WITH LEVELS OF TRUST AND RESPECT BETWEEN RESIDENTS IN YOUR COMMUNITY.
15.3%
21.1%
18.0%
19.5%
10.9%
DISPARITY EXISTS AMONG GROUPS IN YOUR COMMUNITY. RACES OR ETHNIC GROUPS, GENDERS, AGES, SEXUAL ORIENTATIONS AND GEOGRAPHICAL LOCATIONS.
10.6%
5.7%
6.0%
11.0%
10.2%
Figure 14. Level of Agreement on Community Connectedness and Diversity
In your community, you can work byyourself or with others to make thecommunity a better place to live.
You are satisfied with the work done bybusinesses, agencies, and organizations to
strengthen your community.
You are satisfied with levels of trust andrespect between residents in your
community.
Disparity exists among groups in yourcommunity. races or ethnic groups, genders,ages, sexual orientations and geographical
locations.
15.3%
7.8%
7.1%
15.3%
67.4%
52.9%
50.2%
49.8%
12.7%
28.0%
27.4%
24.4%
4.2%
8.9%
11.8%
9.2%
0.5%
2.4%
3.5%
1.4%
Strongly Agree Agree Neither Agree Nor Disagree Disagree Strongly Disagree
Blacks and middle aged respondents (40-64 years) were more likely to disagree that they can work by themselves or with others in their community than whites and other age groups.
Blacks and middle aged respondents were more likely to disagree that they are satisfied with work done by business and level of trust and respect between residents in the community than whites and other age groups.
Respondents above the age of 40 years and white respondents were more likely to disagree that disparity exists among groups in their community than blacks and younger adults (<40 years).

2021-WORCESTER COUNTY COMMUNITY THEMES AND STRENGTHS ASSESSMENT
13
f) Environment
71% respondents strongly agreed or agreed that their community has good environmental health 75% respondents strongly agreed or agreed that extreme weather does/will impact their health and community
Respondents who strongly disagreed/disagreed that:
WHITE
BLACK 18-39 YEARS
40-64 YEARS
65+ YEARS
YOUR COMMUNITY HAS GOOD ENVIRONMENTAL HEALTH.
11.2%
17.4%
19.2%
13.4%
8.2%
EXTREME WEATHER DOES OR WILL IMPACT YOUR HEALTH AND COMMUNITY.
7.5%
14.1%
6.0%
9.5%
8.8%
Figure 15. Level of Agreement on Environmental Health
Your community has goodenvironmental health.
Extreme weather does or will impactyour health and community.
13.7%
19.6%
56.9%
55.0%
17.1%
16.6%
10.7%
7.6%
Strongly Agree Agree Neither Agree Nor Disagree Disagree Strongly Disagree
Blacks and younger (18-39 years) respondents were more likely to disagree that their community has good environmental health than whites and other age groups.
Whites and younger (18-39 years) respondents were less likely to disagree that extreme weather will impact their health and community.

2021-WORCESTER COUNTY COMMUNITY THEMES AND STRENGTHS ASSESSMENT
14
2. Community Health Issues
Survey participants were asked to identify top-three factors for healthy community, health issues in the community, community strengths and risk behaviors from lists provided
a) Top-three factors that most improve the quality of life in a community-“Healthy Community”
Survey respondents identified access to health care and other services, good jobs and healthy economy, and low crime/safe neighborhoods as three of the most important factors that improve a ‘healthy community’.
Figure 16. Respondents who strongly agreed or agreed to being satisfied with their living conditions
Overall White Black 18-39Years
40-64Years
65+Years
85.3% 87.1%73.6%
58.8%70.6%
90.5%
Overall, 85% of those surveyed strongly agreed or agreed to being satisfied with their living conditions. White respondents were more likely to agree with the statement than blacks. Satisfaction with living conditions increase with age.
Table 8. Top- Three Factors for Heathy Community-All Respondents
1 Access to health care and other services
47%
2 Good jobs and healthy economy 40%
3 Low crime or safe neighborhoods 33%
4 Good schools 30%
5 Affordable housing 23%
6 Strong family life or good family support
21%

2021-WORCESTER COUNTY COMMUNITY THEMES AND STRENGTHS ASSESSMENT
15
Affordable housing was selected as one of the top-three factors for healthy community only by black respondents. The common factors selected in the top-three by both blacks and white were good jobs and access to health care. Access to health care was selected by all age groups as the top factor for healthy community. Jobs was selected as a top three by respondents below the age of 64 and low crime was selected by middle age and older groups.
Top-three Factors for Healthy Community by Race
White Black
1 Access to health care and other services
54% Good jobs and healthy economy
37%
2 Good jobs and healthy economy
44% Affordable housing
32%
3 Low crime or safe neighborhoods
37% Access to health care and other services
30%
Top-three Factors for Heathy Community by Age Group
18-39 Years
40-64 Years
65+ Years
1 Access to health care and other services
57%
Access to health care and other services
50%
Access to health care and other services
45%
2 Good jobs and healthy economy
47% Good jobs and healthy economy
48% Low crime/safe neighborhoods
39%
3 Good schools
38% Low crime/safe neighborhoods
32% Good schools 34%
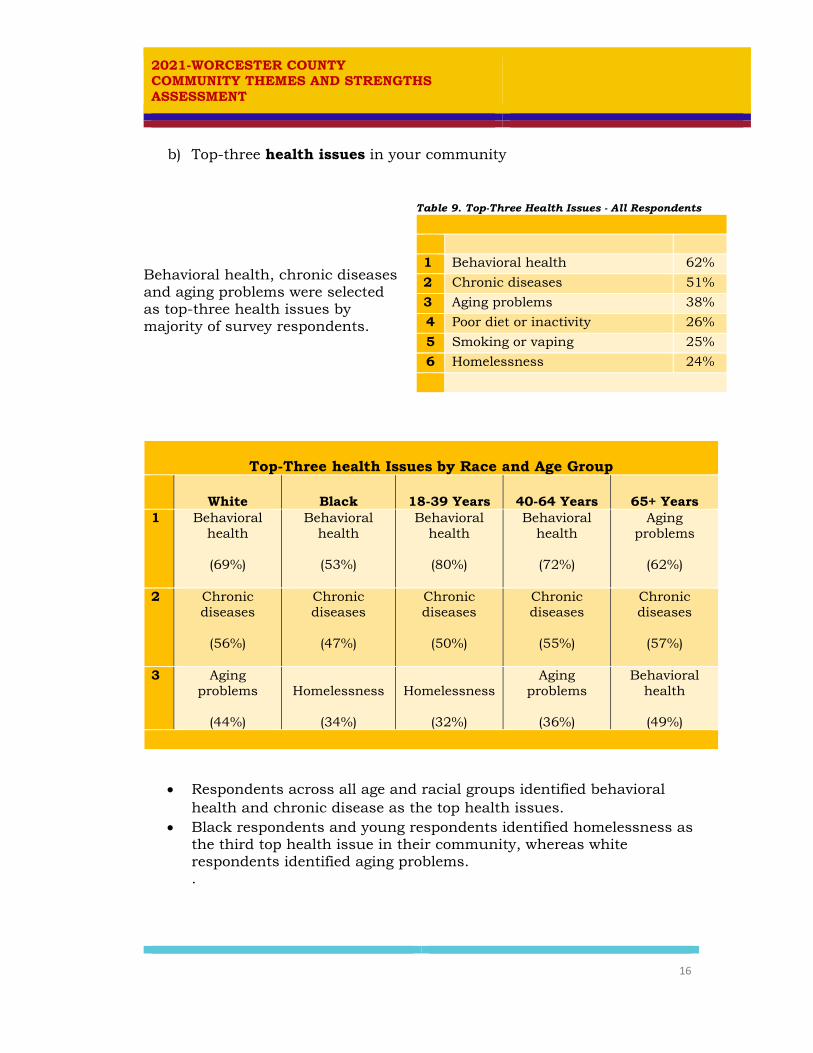
2021-WORCESTER COUNTY COMMUNITY THEMES AND STRENGTHS ASSESSMENT
16
b) Top-three health issues in your community
Behavioral health, chronic diseases and aging problems were selected as top-three health issues by majority of survey respondents.
Respondents across all age and racial groups identified behavioral health and chronic disease as the top health issues.
Black respondents and young respondents identified homelessness as the third top health issue in their community, whereas white respondents identified aging problems. .
Top-Three health Issues by Race and Age Group
White Black 18-39 Years 40-64 Years 65+ Years 1 Behavioral
health
(69%)
Behavioral health
(53%)
Behavioral health
(80%)
Behavioral health
(72%)
Aging problems
(62%)
2 Chronic diseases
(56%)
Chronic diseases
(47%)
Chronic diseases
(50%)
Chronic diseases
(55%)
Chronic diseases
(57%)
3 Aging problems
(44%)
Homelessness
(34%)
Homelessness
(32%)
Aging problems
(36%)
Behavioral health
(49%)
Table 9. Top-Three Health Issues - All Respondents
1 Behavioral health 62%
2 Chronic diseases 51%
3 Aging problems 38%
4 Poor diet or inactivity 26%
5 Smoking or vaping 25%
6 Homelessness 24%

2021-WORCESTER COUNTY COMMUNITY THEMES AND STRENGTHS ASSESSMENT
17
c) Top-three strengths of your community
Survey respondents identified good schools, low crime and safe neighborhoods, and community involvement as top-three strengths of their community.
Good schools was the most common community strength selected by all age and racial groups.
Low crime and safety was not in the top three community strengths for younger respondents.
Black respondents identified religious and spiritual values as the third top strength of their community.
Top-Three Strengths of the Community by Race and Age Group
White Black 18-39 Years 40-64 Years 65+ Years 1 Good schools
(54%)
Good schools
(45%)
Good schools
(51%)
Good schools
(52%)
Good schools
(51%) 2 Low crime or
safe neighbor-hoods
(39%)
Low crime or safe neighbor-
hoods
(33%)
Parks and recreation
(40%)
Low crime or safe neighbor-
hoods
(38%)
Low crime or safe neighbor-
hoods
(42%) 3 Community
involvement
(38%)
Religious and spiritual values (32%)
Community involvement
(35%)
Community involvement
(34%)
Community involvement
(39%)
Table 10. Top-Three Strength of the Community-All Respondents
1 Good schools 48%
2 Low crime or safe neighborhoods 36%
3 Community involvement 33%
4 Parks and recreation 27%
5 Access to health care and other services
25%
6 Clean environment 20%
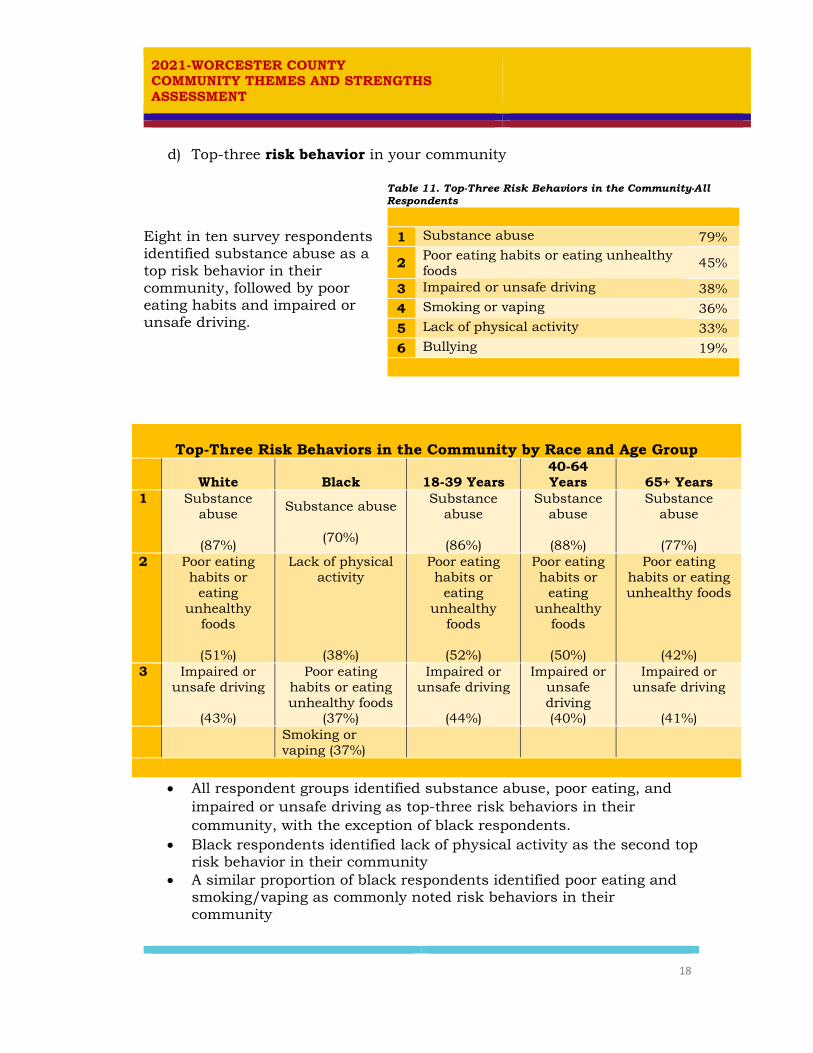
2021-WORCESTER COUNTY COMMUNITY THEMES AND STRENGTHS ASSESSMENT
18
d) Top-three risk behavior in your community
Eight in ten survey respondents identified substance abuse as a top risk behavior in their community, followed by poor eating habits and impaired or unsafe driving.
All respondent groups identified substance abuse, poor eating, and impaired or unsafe driving as top-three risk behaviors in their community, with the exception of black respondents.
Black respondents identified lack of physical activity as the second top risk behavior in their community
A similar proportion of black respondents identified poor eating and smoking/vaping as commonly noted risk behaviors in their community
Top-Three Risk Behaviors in the Community by Race and Age Group
White Black 18-39 Years 40-64 Years 65+ Years
1 Substance abuse
(87%)
Substance abuse
(70%)
Substance abuse
(86%)
Substance abuse
(88%)
Substance abuse
(77%)
2 Poor eating habits or
eating unhealthy
foods
(51%)
Lack of physical activity
(38%)
Poor eating habits or
eating unhealthy
foods
(52%)
Poor eating habits or
eating unhealthy
foods
(50%)
Poor eating habits or eating unhealthy foods
(42%) 3 Impaired or
unsafe driving
(43%)
Poor eating habits or eating unhealthy foods
(37%)
Impaired or unsafe driving
(44%)
Impaired or unsafe driving (40%)
Impaired or unsafe driving
(41%)
Smoking or vaping (37%)
Table 11. Top-Three Risk Behaviors in the Community-All Respondents
1 Substance abuse 79%
2 Poor eating habits or eating unhealthy foods
45%
3 Impaired or unsafe driving 38%
4 Smoking or vaping 36%
5 Lack of physical activity 33%
6 Bullying 19%
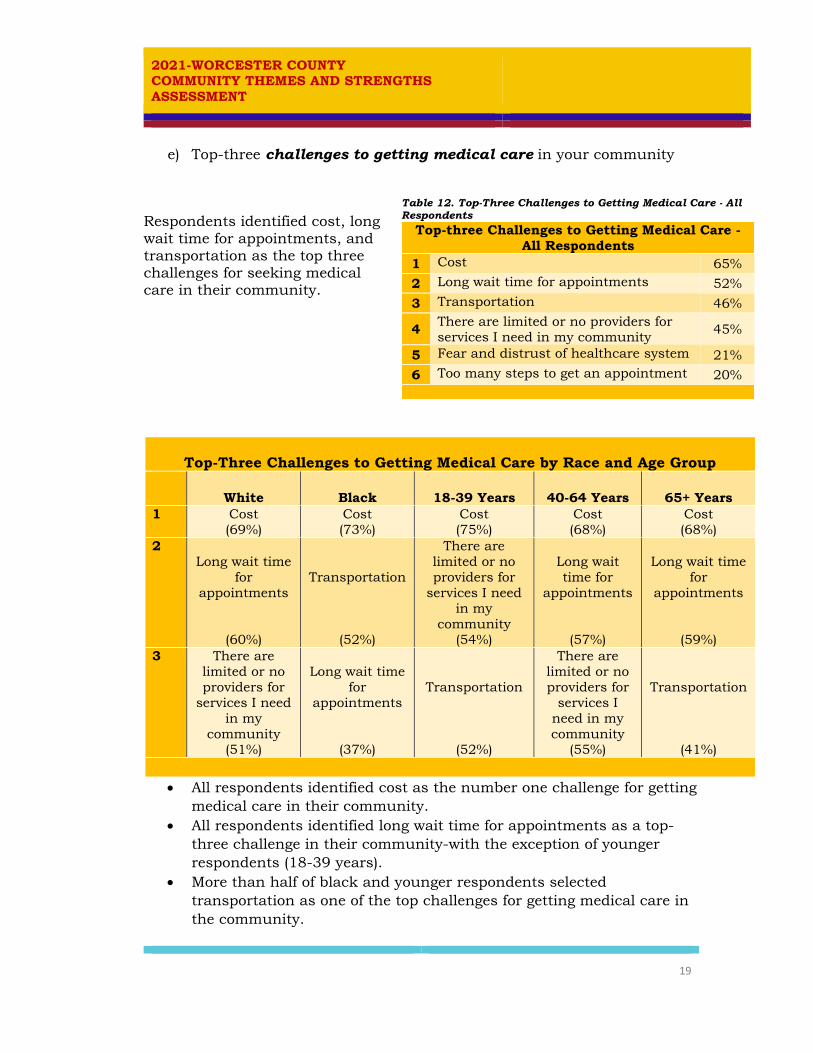
2021-WORCESTER COUNTY COMMUNITY THEMES AND STRENGTHS ASSESSMENT
19
e) Top-three challenges to getting medical care in your community
Respondents identified cost, long wait time for appointments, and transportation as the top three challenges for seeking medical care in their community.
All respondents identified cost as the number one challenge for getting medical care in their community.
All respondents identified long wait time for appointments as a top-three challenge in their community-with the exception of younger respondents (18-39 years).
More than half of black and younger respondents selected transportation as one of the top challenges for getting medical care in the community.
Top-Three Challenges to Getting Medical Care by Race and Age Group
White Black 18-39 Years 40-64 Years 65+ Years 1 Cost
(69%) Cost (73%)
Cost (75%)
Cost (68%)
Cost (68%)
2 Long wait time
for appointments
(60%)
Transportation
(52%)
There are limited or no providers for
services I need in my
community (54%)
Long wait time for
appointments
(57%)
Long wait time
for appointments
(59%) 3 There are
limited or no providers for
services I need in my
community (51%)
Long wait time
for appointments
(37%)
Transportation
(52%)
There are limited or no providers for
services I need in my community
(55%)
Transportation
(41%)
Table 12. Top-Three Challenges to Getting Medical Care - All Respondents
Top-three Challenges to Getting Medical Care - All Respondents
1 Cost 65%
2 Long wait time for appointments 52%
3 Transportation 46%
4 There are limited or no providers for services I need in my community 45%
5 Fear and distrust of healthcare system 21%
6 Too many steps to get an appointment 20%

2021-WORCESTER COUNTY COMMUNITY THEMES AND STRENGTHS ASSESSMENT
20
f) Top-three topics people in your community need more information
Respondents identified substance use disorders, mental health disorders, and chronic disease management as top three topics that their community need for more information,
Respondents of all race and age groups identified mental health and substance use disorders as the top two topics that the community needs more information about, with exception of older respondents (64+ years).
The need for information about healthy living was cited in the top three only by black respondents, while the need for information about aging in place was cited only by older respondents.
Top-Three Topics Community Need for More Information by Race and Age Group
White Black 18-39 Years 40-64 Years 65+ Years 1 Substance use
disorders
(47%)
Mental health disorders
(34%)
Mental health disorders
(60%)
Mental health disorders
(45%)
Chronic disease
management (45%)
2 Mental health disorders
(44%)
Substance use disorders
(33%)
Substance use disorders
(51%)
Substance use disorders
(45%)
Substance use disorders
(43% 3 Chronic
disease management
(38%)
Healthy living
(33%)
Chronic disease
management (33%)
Chronic disease
management (30%)
Chronic disease
management (33%)
Aging in place
(36%)
Table 13. Top-Three Topics Community Need for More Information - All Respondents
1 Substance use disorders 43%
2 Mental health disorders 40%
3 Chronic disease management 33%
4 Healthy living 27%
5 Aging in place 25%
6 Tobacco or vaping dangers 20%

2021-WORCESTER COUNTY COMMUNITY THEMES AND STRENGTHS ASSESSMENT
21
3. Additional comments or feedback The last section of the survey asked respondents to provide any additional comments or feedback. Below are selected comments grouped according to contents:
Health Care Services
“Accessing mental health care in this county is very difficult”
“Healthy living and nutrition is a major issue. Cost of healthcare and lack of appointments available; and the cost is even worse. Things need to change.”
“More mental health services. I have a child with depression and we STRUGGLED with trying to find a therapist for her. She now uses an online service.”
“More PCPs who take new patients”
“I hope the heroin problem ceases and the upcoming meth problems too!”
“This was an interesting survey. I was happy to see mental health as a choice in some of the questions.”
“We lack enough mental health providers and inpatient care in our area”
“more dental clinics”
“need Rx assistance”
Local government’s role
“City administration’s focus is on vacation revenues only”
“A very good quality of life but there is too much emphasis on tourism.”
“Community center, walking distance not crossing a highway. If kids have something to do, then they might vape or smoke less out of boredom”
“Need a recreation center (like YMCA) in Berlin area (not Ocean Pines)”
“My town is in desperate need for affordable activities for its youth thru seniors. Our water quality is an on going process to improve”
“More info needed on toxins in our environment”

2021-WORCESTER COUNTY COMMUNITY THEMES AND STRENGTHS ASSESSMENT
22
“Need affordable housing for single income families in good neighborhoods”
“Need more housing affordable to seniors and young people”
“Need year round housing for local, blue collar workers”
“We need a county rec facility in the north end of the county. Not everyone lives in Ocean Pines where there are rec activities.”
“We need reliable, flexible and low cost public transportation, We need more mental health and substance use help for youth”
“We need sustainable employment”
“Sleeps at a church shed with permission”
“Need better jobs”
“Need more help and compassion for social workers”
“Need more help for the homeless”
“Need more help with people being released from jail back into community. To prevent recidivism”
“Need more low cost housing”
“Need senior and affordable housing (BAD)”
“Provide more activities for children after school that don’t cost too much”
“Schools need better protection for kids getting bullied”
“I just feel like when we all work together we can achieve so much and make a difference in the lives of the people we see”
Quality of life in the community
“Excellent community atmosphere,”
“GOOD NEIGHBORS, LOCATED CLOSE TO SHOPS AND MEDICAL SERVICES.”
“I appreciate the resources available within the Worcester County Community”
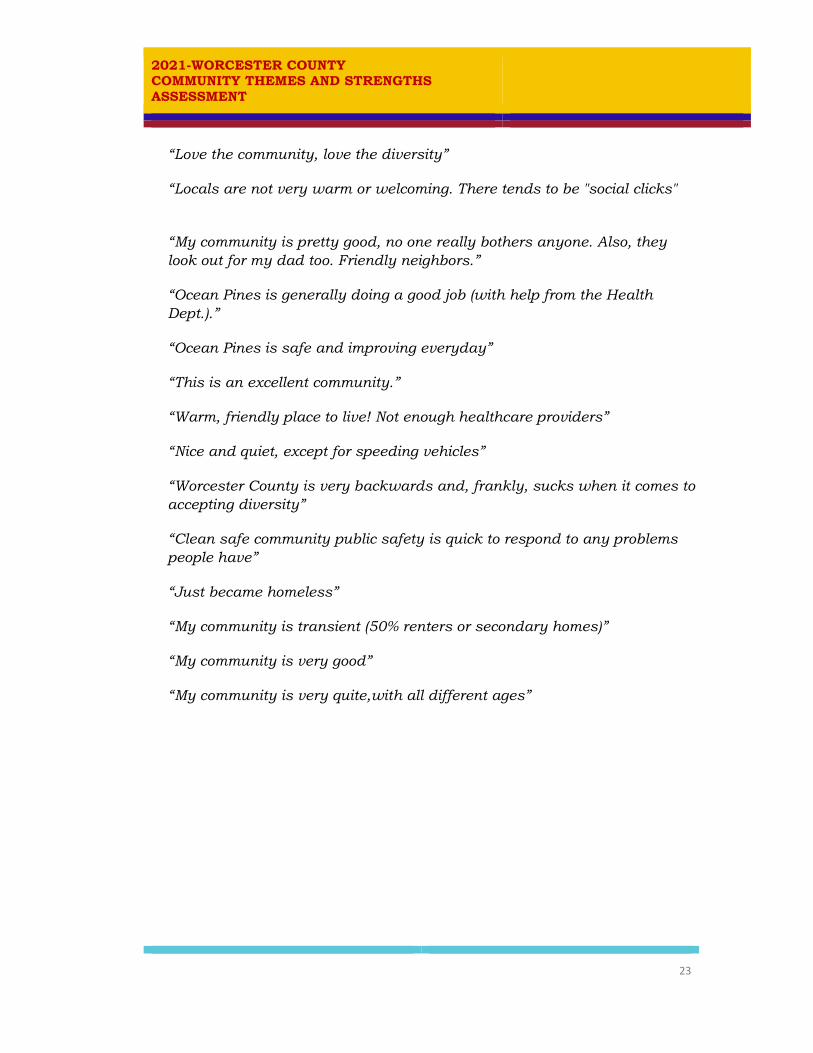
2021-WORCESTER COUNTY COMMUNITY THEMES AND STRENGTHS ASSESSMENT
23
“Love the community, love the diversity”
“Locals are not very warm or welcoming. There tends to be "social clicks"
“My community is pretty good, no one really bothers anyone. Also, they look out for my dad too. Friendly neighbors.”
“Ocean Pines is generally doing a good job (with help from the Health Dept.).”
“Ocean Pines is safe and improving everyday”
“This is an excellent community.”
“Warm, friendly place to live! Not enough healthcare providers”
“Nice and quiet, except for speeding vehicles”
“Worcester County is very backwards and, frankly, sucks when it comes to accepting diversity”
“Clean safe community public safety is quick to respond to any problems people have”
“Just became homeless”
“My community is transient (50% renters or secondary homes)”
“My community is very good”
“My community is very quite,with all different ages”

WORCESTER COUNTY COMMUNITY HEALTH ASSESSMENT
2021
Acknowledgements:
The Worcester County Health Department would like to thank all the members of the “Mobilizing for Action through Planning and Partnerships” core group and steering committee for the commitment of their time and for their valuable contribution throughout the planning process. In addition, we would also like to thank the many residents of Worcester County who volunteered their time to complete the community survey and/or to participate in focus groups and share with us their perspective of living in our community.
The report is prepared by: Worcester County Health Department Quality, Planning and Core Services Contact Person: [email protected]

WORCESTER COUNTY HEALTH DEPARTMENT 6040 PUBLIC LANDING ROAD
SNOW HILL, MD 21863 w o r c e s t e r h e a l t h . o r g