205 final report - arvin
TRANSCRIPT
Arvin Wastewater Treatment Plant Master Plan – Final Report
August 29, 2019
Prepared for: Veolia North America Prepared by: Connie Adera Pooja Sinha Sean Larson Zakir Hirani Stantec Consulting Ltd.

ARVIN WASTEWATER TREATMENT PLANT MASTER PLAN – FINAL REPORT
Table of Contents
ABBREVIATIONS ........................................................................................................................ V
1.0 EXECUTIVE SUMMARY .................................................................................................1.1 1.1 BACKGROUND AND OBJECTIVES ................................................................................ 1.1 1.2 METHODOLOGY ............................................................................................................. 1.2 1.3 PROJECT FINDINGS AND RECOMMENDATIONS......................................................... 1.3
1.3.1 Projected Flows and Loadings for a 20-year Design Period .................. 1.3 1.3.2 Recommended Ultimate Effluent Destination and Liquids
Treatment Upgrades ................................................................................... 1.3 1.3.3 Recommended Solids Handling Alternative and Odor Control
Measures ....................................................................................................... 1.5 1.3.4 Additional Capital Spending ..................................................................... 1.5 1.3.5 Projected Capital Spending ...................................................................... 1.5
2.0 BACKGROUND AND OBJECTIVES ..............................................................................2.1 2.1 PROJECT BACKGROUND .............................................................................................. 2.1 2.2 OBJECTIVES ..................................................................................................................... 2.2
3.0 EXISTING INFRASTRUCTURE .........................................................................................3.1
4.0 INFLUENT WASTEWATER CHARACTERISTICS AND EFFLUENT WATER QUALITY GOALS .........................................................................................................................4.1
4.1 INFLUENT WASTEWATER CHARACTERISTICS ................................................................. 4.1 4.2 CURRENT EFFLUENT WATER QUALITY GOALS .............................................................. 4.1 4.3 CENTRAL VALLEY SALINITY ALTERNATIVES FOR LONG-TERM SUSTAINABILITY
(CV SALTS) INITIATIVE ..................................................................................................... 4.2 4.4 TITLE 22 REGULATORY REQUIREMENTS ......................................................................... 4.3
5.0 METHODOLOGY ..........................................................................................................5.1
6.0 FUTURE HYDRAULIC AND ORGANIC PLANT LOADING ..............................................6.1 6.1 FLOW PROJECTIONS FOR HYDRAULIC LOADING ...................................................... 6.1 6.2 ORGANIC LOADING ...................................................................................................... 6.2
7.0 ALTERNATIVES ANALYSIS FOR EFFLUENT DESTINATION ..............................................7.1 7.1 ALTERNATIVE 1 - LAND APPLICATION FOR CROP PRODUCTION ............................. 7.2
7.1.1 Alternative 1A – Land Application for Crop Production with Disinfected Tertiary Effluent ........................................................................ 7.4
7.1.2 Alternative 1B – Land Application for Crop Production with Disinfected Tertiary Effluent with Salinity Management ......................... 7.5
7.2 ALTERNATIVE 2 - GROUNDWATER RECHARGE VIA SURFACE SPREADING .............. 7.6 7.2.1 Alternative 2A – Surface Spreading with 100% RWC .............................. 7.6 7.2.2 Alternative 2B - Subsurface Piping (Leach Fields) ................................... 7.8
ARVIN WASTEWATER TREATMENT PLANT MASTER PLAN – FINAL REPORT
7.3 ALTERNATIVE 3 – GROUNDWATER RECHARGE VIA SURFACE SPREADING BY ARVIN EDISON WATER STORAGE DISTRICT .................................................................. 7.9
7.4 ALTERNATIVE 4 – GROUNDWATER RECHARGE VIA DIRECT INJECTION ................... 7.9 7.5 COST ESTIMATES FOR LIQUIDS TREATMENT FOR VARIOUS EFFLUENT
DESTINATION ................................................................................................................. 7.10 7.6 RECOMMENDATION FOR EFFLUENT DESTINATION AND PROPOSED
TREATMENT TRAIN ........................................................................................................... 7.1
8.0 ODOR CONTROL .........................................................................................................8.5 8.1 REGULATORY REQUIREMENTS ....................................................................................... 8.5 8.2 ODOR CONTROL PROCESSES ....................................................................................... 8.6 8.3 BASIS OF DESIGN AND COST ESTIMATES FOR ODOR CONTROL AT
HEADWORKS AND DEWATERING BUILDING ................................................................ 8.8
9.0 ALTERNATIVES ANALYSIS FOR SOLIDS HANDLING .....................................................9.1 9.1 CURRENT SOLIDS HANDLING PRACTICE ...................................................................... 9.1 9.2 POTENTIAL ALTERNATIVES FOR SOLIDS HANDLING .................................................... 9.2
9.2.1 Alternative 1 – Dewater solids with belt filter press to produce 15% solids for hauling (current practice) .................................................. 9.2
9.2.2 Alternative 2 – Dewater solids with belt filter press and solar dryer to produce 75% solids for hauling ............................................................. 9.3
9.2.3 Alternative 3 – Dewater solids with belt filter press and thermal dryer to produce 90% solids for hauling ................................................... 9.5
9.3 BASIS OF DESIGN FOR SOLIDS MANAGEMENT ALTERNATIVES .................................. 9.7 9.4 COST ESTIMATES FOR SOLIDS HANDLING ALTERNATIVES ........................................... 9.8 9.5 RECOMMENDATION FOR SOLIDS MANAGEMENT ................................................... 9.10
10.0 ADDITIONAL UPGRADES ...........................................................................................10.1 10.1 ADMINISTRATION BUILDING ........................................................................................ 10.1 10.2 ROAD AND PARKING AREA REPAIRS ........................................................................ 10.3 10.3 MISCELLANEOUS PLANT REPAIRS................................................................................ 10.4
11.0 SUMMARY AND RECOMMENDATIONS .....................................................................11.1 11.1.1 Projected Flows and Loadings for a 20-year Design Period ................ 11.1 11.1.2 Recommended Ultimate Effluent Destination and Liquids
Treatment Upgrades ................................................................................. 11.1 11.1.3 Recommended Solids Handling Alternative and Odor Control
Measures ..................................................................................................... 11.2 11.1.4 Additional Capital Spending ................................................................... 11.3 11.1.5 Projected Capital Spending .................................................................... 11.3
11.2 PROPOSED NEXT STEPS ................................................................................................ 11.4
12.0 APPENDICES ............................................................................................................... A.1
ARVIN WASTEWATER TREATMENT PLANT MASTER PLAN – FINAL REPORT
LIST OF TABLES Table 1-1: Comparison of Cost Estimates for Two Different Treatment Options to
Produce Disinfected Tertiary Effluent ....................................................................... 1.4 Table 1-2: Net Present Values for Solids Management Alternatives................................... 1.5 Table 1-3: Cost Estimate for WWTP Upgrades - Total Cost ................................................... 1.6 Table 4-1: Arvin WWTP 2018 Annual Average Influent Concentrations ............................. 4.1 Table 4-2: Arvin WWTP 2018 Annual Average Effluent Concentrations and Goals ......... 4.1 Table 4-3: Groundwater Quality Goals ................................................................................... 4.2 Table 4-4: Title 22 Recycled Water Requirements. ................................................................ 4.4 Table 5-1: Capital Cost Markups Applied to Total Construction Cost ............................... 5.4 Table 6-1: Design Basis for Alternatives Analysis (20-year Design Period) .......................... 6.3 Table 7-1: Title 22 Treatment requirements for varying agricultural uses ........................... 7.3 Table 7-2: Design Basis for Sidestream RO System for Salinity Management .................... 7.6 Table 7-3: Design Basis for Surface Spreading with 100% RWC ........................................... 7.8 Table 7-4: Design Basis for Groundwater Recharge via Direct Injection ......................... 7.10 Table 7-5: Capital Costs for Effluent Destination Alternatives ........................................... 7.11 Table 7-6: O&M Costs for Effluent Destination Alternatives ............................................... 7.12 Table 7-7: Net Present Values for Treated Water for Effluent Destination
Alternatives ................................................................................................................ 7.12 Table 7-8: Comparison of Capital Cost Estimates for Two Different Treatment
Options to Produce Tertiary Effluent ........................................................................ 7.3 Table 7-9: Comparison of O&M Cost Estimates for Two Different Treatment
Options to Produce Tertiary Effluent ........................................................................ 7.4 Table 7-10: Comparison of Net Present Values for Two Different Treatment
Options to Produce Tertiary Effluent ........................................................................ 7.4 Table 8-1: Advantages and Disadvantages of a Biofilter .................................................... 8.7 Table 8-2: Advantages and Disadvantages of a Carbon Filter .......................................... 8.7 Table 8-3: Basis of Design and Cost Estimate for the Odor Control System ...................... 8.8 Table 9-1: Summary of Solids Production and Disposal with Current Practice ................. 9.1 Table 9-2: Basis of Design and Cost Estimate for the Odor Control System for Solar
Dryer ............................................................................................................................. 9.5 Table 9-3: Basis of Design for the Odor Control System for Thermal Dryer ......................... 9.6 Table 9-4: Summary of Solids Management Alternatives – Future ..................................... 9.7 Table 9-5: Capital Costs for Solids Management Alternatives ............................................ 9.9 Table 9-6: O&M Costs for Solids Management Alternatives .............................................. 9.10 Table 9-7: Net Present Values for Solids Management Alternatives................................. 9.10 Table 11-1: Comparison of Net Present Values for Two Different Treatment
Options to Produce Tertiary Effluent ...................................................................... 11.2 Table 11-2: Net Present Values for Solids Management Alternatives .............................. 11.3 Table 11-3: Cost Estimate for WWTP Upgrades - Total Cost ............................................... 11.3
LIST OF FIGURES Figure 1-1: Methodology to develop alternative process trains for the Arvin WWTP. ...... 1.2 Figure 3-1: Arvin WWTP Location and Service Area ............................................................. 3.1
ARVIN WASTEWATER TREATMENT PLANT MASTER PLAN – FINAL REPORT
Figure 3-2: Site Layout of the Arvin WWTP .............................................................................. 3.3 Figure 3-3: Archimedes screws at the Headworks (left); Orbal® (right)............................. 3.3 Figure 5-1: Methodology to develop alternative process trains for the Arvin WWTP. ...... 5.1 Figure 6-1: Historical Per Capita Water Use at the City of Arvin. ......................................... 6.1 Figure 6-2: Historical Per Capita Organic Loading ............................................................... 6.2 Figure 6-3: Historical and Projected Influent BOD Loading for the Arvin WWTP ............... 6.4 Figure 7-1: Process Schematic to Produce Disinfected Tertiary Effluent for Land
Application for Crop production.............................................................................. 7.5 Figure 7-2: Process Schematic to Produce Disinfected Tertiary Effluent for Land
Application for Crop production plus Salinity Management ............................... 7.5 Figure 7-3: Process Schematic to Produce Recycled Water for Groundwater
Recharge via Surface Spreading with 100% RWC ................................................. 7.7 Figure 7-4: Process Schematic to Produce Recycled Water for Groundwater
Recharge via Surface Spreading with 100% RWC by AEWSD .............................. 7.9 Figure 7-5: Process Schematic to Produce Recycled Water for Groundwater
Recharge via Direct Injection ................................................................................. 7.10 Figure 7-6: Process Schematic to Produce Disinfected Tertiary Effluent for Effluent
Disposal Pond with MBR Process ............................................................................... 7.2 Figure 9-1 Process Schematic of Current Solids Handling Practice .................................... 9.1 Figure 9-2: Process Schematic of Alternative 1 ..................................................................... 9.2 Figure 9-3: Belt Filter Press.......................................................................................................... 9.3 Figure 9-4: Solar Dryer ................................................................................................................ 9.4 Figure 9-5: Process Schematic of Alternative 2 ..................................................................... 9.4 Figure 9-6: Thermal Dryer .......................................................................................................... 9.6 Figure 9-7 Process Schematic of Alternative 3 ...................................................................... 9.6 Figure 10-1: Proposed Location of a New Administration Building ................................... 10.2 Figure 10-2: Proposed Layout for a New Administration Building. .................................... 10.2 Figure 10-3: Proposed Repairs for the Arvin WWTP Road and Parking Surface .............. 10.3 Figure 10-4: Connection and Piping from Sludge Holding Tank Requiring
Replacement ............................................................................................................ 10.4 Figure 11-1: Proposed Project Implementation Schedule ................................................. 11.4
LIST OF APPENDICES
APPENDIX A ........................................................................................................................... A.1
v
Abbreviations
AEWSD Arvin-Edison Water Storage District AF Acre-Foot BFP Belt Filter Press BOD Biological Oxygen Demand CCD Closed Circuit Desalination CEQA California Environmental Quality Act City City of Arvin CRRR Community Recycling and Recovery, Inc. DWR Department of Water Resources EC Electrical Conductivity EPA U.S. Environmental Protection Agency FEMA Federal Emergency Management Agency GHG Greenhouse Gas GWR Groundwater Recharge LID Local Improvement District MBR Membrane Biological Reactor MCL Maximum Contaminant Level MF Microfiltration MGD Million Gallons per Day mg/l milligrams per liter MSR 2016 Municipal Service Review, City of Arvin OPCC Opinion of Probable Construction Cost POC Point of Compliance PVC Polyvinyl Chloride RAS Return Activated Sludge RO Reverse Osmosis RWC Recycled Municipal Wastewater Contribution RWQCB Central Valley Regional Water Quality Control Board SAT Soil Aquifer Treatment SGMA Sustainable Groundwater Management Act SOI Sphere of Influence SWRCB State Water Resources Control Board TCO Total Coliform Organism TDS Total Dissolved Solids TKN Total Kjeldahl Nitrogen TM Technical Memorandum TN Total Nitrogen TOC Total Organic Carbon TSS Total Suspended Solids USCB U.S. Census Bureau USDA U.S. Department of Agriculture VFD Variable Frequency Drives VOC Volatile Organic Compounds VWOS Veolia West Operating Services

vi
WAS Waste Activated Sludge WWTP Wastewater Treatment Plant °F degrees Fahrenheit μmhos/cm micromhos per centimeter
ARVIN WASTEWATER TREATMENT PLANT MASTER PLAN – FINAL REPORT
1.1
1.0 EXECUTIVE SUMMARY 1.1 BACKGROUND AND OBJECTIVES
The City of Arvin (City), located southeast of Bakersfield in Kern County, has a population of approximately 21,000 people within a service area of approximately 4.82 square miles. The City has a mixture of residential, industrial, commercial and institutional land use, with residential making up the majority of the land use. Located in the southwest portion of the City, the Arvin wastewater treatment plant (WWTP) is a 2-MGD rated facility that currently treats approximately 1.1 MGD of wastewater. The water conservation efforts across the City has reduced per capita wastewater flow by about 47% resulting in increased organics loading to the WWTP. The Arvin WWTP provides secondary treatment using oxidation ditches with the treated water being used for irrigating farmland. The solids generated from the WWTP are thickened and hauled away to a compost facility that is approximately 29 miles away. The WWTP is contract-operated by the Veolia West Operating Services (VWOS).
Although most of the treated wastewater is currently used for irrigating farmland, the City is exploring alternatives for reuse of treated wastewater due to potential regulatory requirements for the total dissolved solids (TDS) and total nitrogen (TN) that may be more stringent than what the WWTP can currently achieve. The City is also planning to reduce the volume of solids hauled by exploring on-site dewatering/drying alternatives.
Stantec was retained by the City via VWOS to further explore effluent destinations and solids disposal options. The primary drivers for the City were to diversify the effluent destination and lower greenhouse gas emissions (through reduced trucking of solids) while maximizing the use of existing infrastructure for planned growth. With TDS and TN as key constituents, Stantec was tasked to conduct a planning study with the following objectives:
• Determine future plant capacity (hydraulic and organic) based on 20-year design period.
• Evaluate and recommend ultimate effluent destination
• Develop a process train to meet the effluent water quality goals for selected effluent destination
• Evaluate two solids handling alternatives with odor control and provide recommendation, and
• Evaluate office upgrades and/or expansions to accommodate the facility upgrades
• Develop Class 5 opinion of probable construction cost (OPCC) for the recommended upgrades
ARVIN WASTEWATER TREATMENT PLANT MASTER PLAN – FINAL REPORT
1.2
1.2 METHODOLOGY
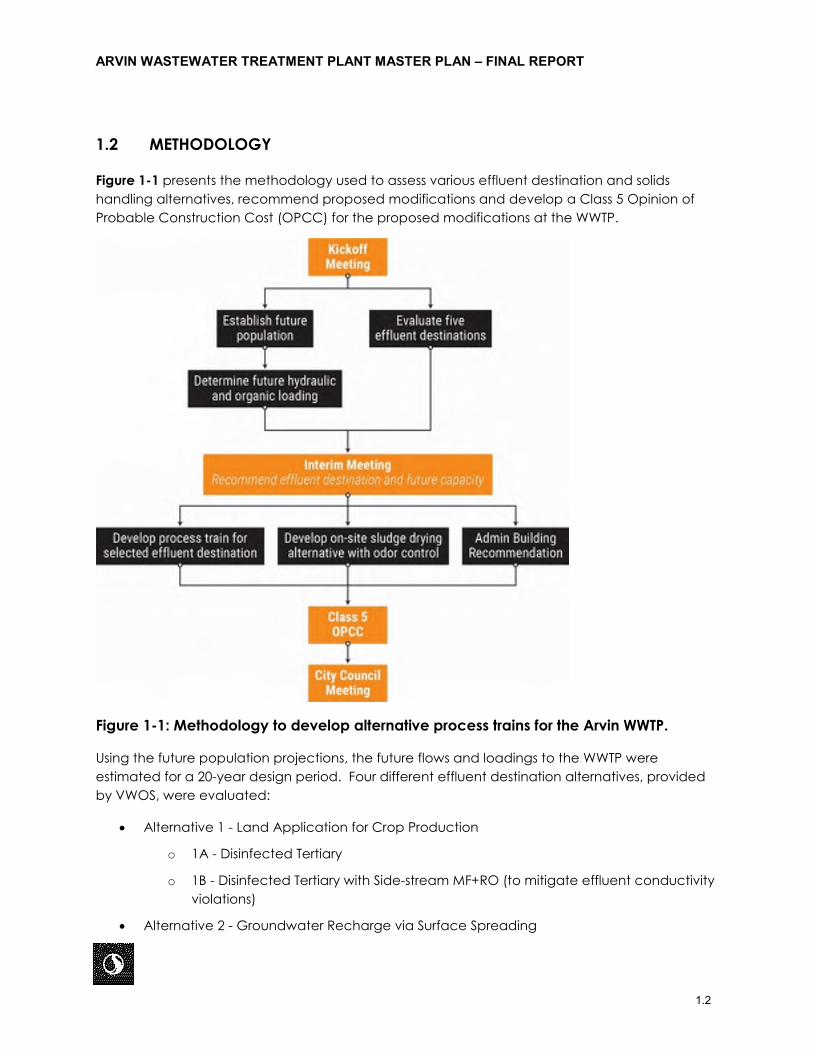
Figure 1-1 presents the methodology used to assess various effluent destination and solids handling alternatives, recommend proposed modifications and develop a Class 5 Opinion of Probable Construction Cost (OPCC) for the proposed modifications at the WWTP.
Figure 1-1: Methodology to develop alternative process trains for the Arvin WWTP.
Using the future population projections, the future flows and loadings to the WWTP were estimated for a 20-year design period. Four different effluent destination alternatives, provided by VWOS, were evaluated:
• Alternative 1 - Land Application for Crop Production
o 1A - Disinfected Tertiary
o 1B - Disinfected Tertiary with Side-stream MF+RO (to mitigate effluent conductivity violations)
• Alternative 2 - Groundwater Recharge via Surface Spreading
ARVIN WASTEWATER TREATMENT PLANT MASTER PLAN – FINAL REPORT
1.3
o 2A - 100% Recycled Municipal Wastewater Contribution (RWC)
o 2B - 100% RWC with Subsurface Piping (Leach Fields)
• Alternative 3 - Groundwater Recharge via Surface Spreading by Arvin Edison Water Storage District (AEWSD) using 100% Recycled Water
• Alternative 4 - Groundwater Recharge via Direct Injection
Effluent water quality goals were determined for each of these effluent destinations. Treatment upgrades were then identified, and unit processes sized accordingly to achieve effluent water quality goals. Finally, high-level cost estimates were developed for each alternative to determine the most suitable effluent destination. Solids production was also quantified for the process train required to achieve the effluent water quality goals for the recommended effluent destination alternative.
Upon quantification of solids production, two different on-site sludge drying alternatives with odor control were evaluated – solar dryer and thermal dryer. These alternatives were compared to the current practice of simply hauling the dewatered sludge to a composting facility. Using the cost estimates, a sludge handling alternative was recommended.
Cost estimates were also developed for a new administration building, repairing the plant access road and parking lot and, miscellaneous repairs. A Class 5 OPCC summarizing the recommended upgrades was developed.
1.3 PROJECT FINDINGS AND RECOMMENDATIONS
1.3.1 Projected Flows and Loadings for a 20-year Design Period
Based on projected population growth rate of 2% and per capita water consumption rate of 51 gal/person/day, the wastewater flow to the Arvin WWTP is expected to reach 1.7 MGD in next 20 years. Using a per capita BOD loading of 0.185 lb/person/day and projected population of 32,883 in 2039, the annual average BOD loading to the Arvin WWTP is projected to be 6,073 lb/d.
1.3.2 Recommended Ultimate Effluent Destination and Liquids Treatment Upgrades
Among the four effluent destination alternatives evaluated, Alternative 1A (disinfected tertiary effluent for continued use of effluent for irrigation) was found to be most economical since it does not require desalination. Other alternatives require varying degrees of desalination for either salinity management and/or to achieve total organic carbon (TOC) removal for groundwater recharge. The net present value (NPV) per acre-foot (ac-ft) of treated water to produce disinfected tertiary effluent was estimated at $1,040/ac-ft whereas that for the other alternatives ranged from $1,420-$2,380/ac-ft. The secondary effluent currently produced by the Arvin WWTP cannot be used for certain irrigation applications such as food crop irrigation. Producing disinfected tertiary effluent would allow the City to use treated water for unrestricted
ARVIN WASTEWATER TREATMENT PLANT MASTER PLAN – FINAL REPORT
1.4
irrigation; the water can also be disposed via effluent disposal ponds. It should be noted that disposing the effluent via disposal ponds would require higher degree of nitrogen removal than the Arvin WWTP is currently achieving. Such treatment would necessitate addition of an anoxic tank. A redundant secondary clarifier is also deemed necessary by the plant operations staff. And finally, a filtration and disinfection system would be required to produce disinfected tertiary effluent.
Disinfected tertiary effluent can also be produced by using a Membrane Bioreactor (MBR) process. MBR uses membranes instead of secondary clarifiers for solids separation; high level of solids removal by membranes also eliminates the need for a downstream filtration system. Since membranes can filter mixed liquor concentration of up to 12,000 mg/L, the MBR process can increase the plant capacity substantially (2-3 times) within the same footprint. If City chooses to upgrade the liquids treatment at the Arvin WWTP to produce disinfected tertiary effluent then Stantec recommends upgrading the existing Orbal® process to an MBR, while taking the other oxidation ditch train out of service. Such upgrade would require addition of fine screens at the headworks, upgrade of aeration system for the Orbal® to get higher oxygen transfer and addition of membrane filtration systems downstream of the Orbal®.
Converting the Orbal® to an MBR would provide following advantages:
• Increases the capacity of the Orbal® train to meet the future flows and loadings thereby eliminating the need to operate the second oxidation ditch train
• Eliminates the need to add an anoxic tank, redundant secondary clarifier and a cloth filter; fewer processes to operate and maintain
• Prepares the WWTP to produce disinfected tertiary effluent by simply adding a UV disinfection system in future
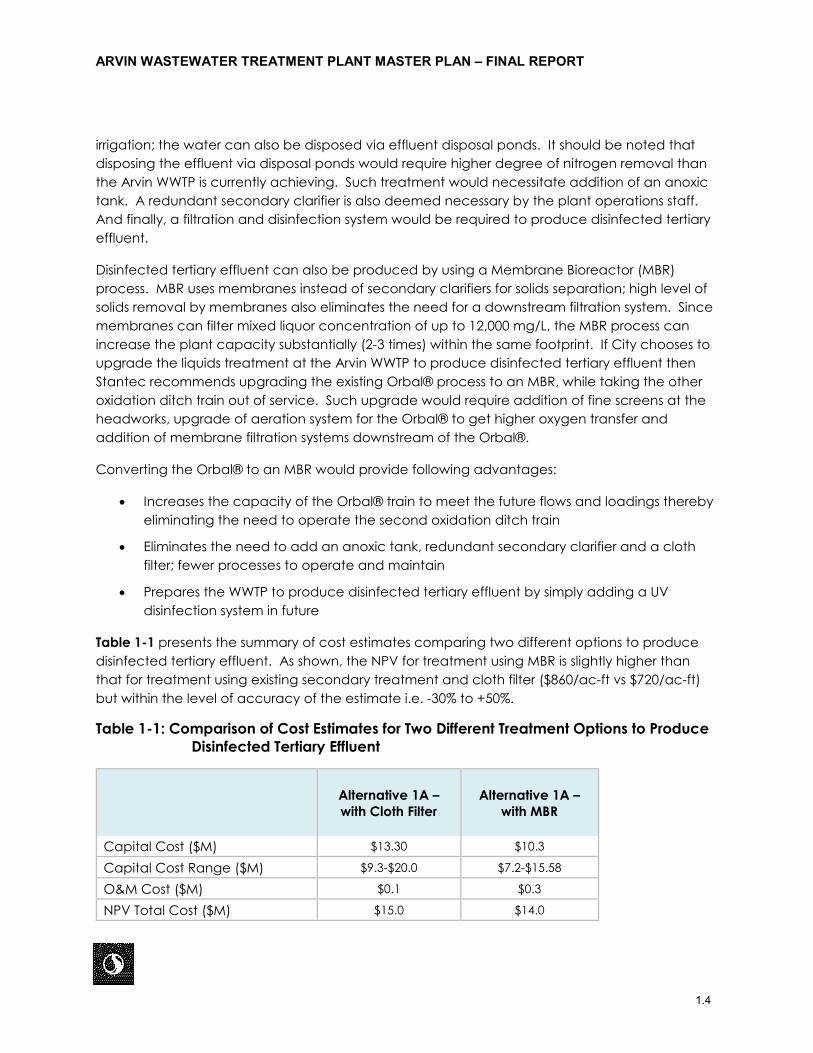
Table 1-1 presents the summary of cost estimates comparing two different options to produce disinfected tertiary effluent. As shown, the NPV for treatment using MBR is slightly higher than that for treatment using existing secondary treatment and cloth filter ($860/ac-ft vs $720/ac-ft) but within the level of accuracy of the estimate i.e. -30% to +50%.
Table 1-1: Comparison of Cost Estimates for Two Different Treatment Options to Produce Disinfected Tertiary Effluent
Alternative 1A – with Cloth Filter
Alternative 1A – with MBR
Capital Cost ($M) $13.30 $10.3
Capital Cost Range ($M) $9.3-$20.0 $7.2-$15.58
O&M Cost ($M) $0.1 $0.3
NPV Total Cost ($M) $15.0 $14.0
ARVIN WASTEWATER TREATMENT PLANT MASTER PLAN – FINAL REPORT
1.5
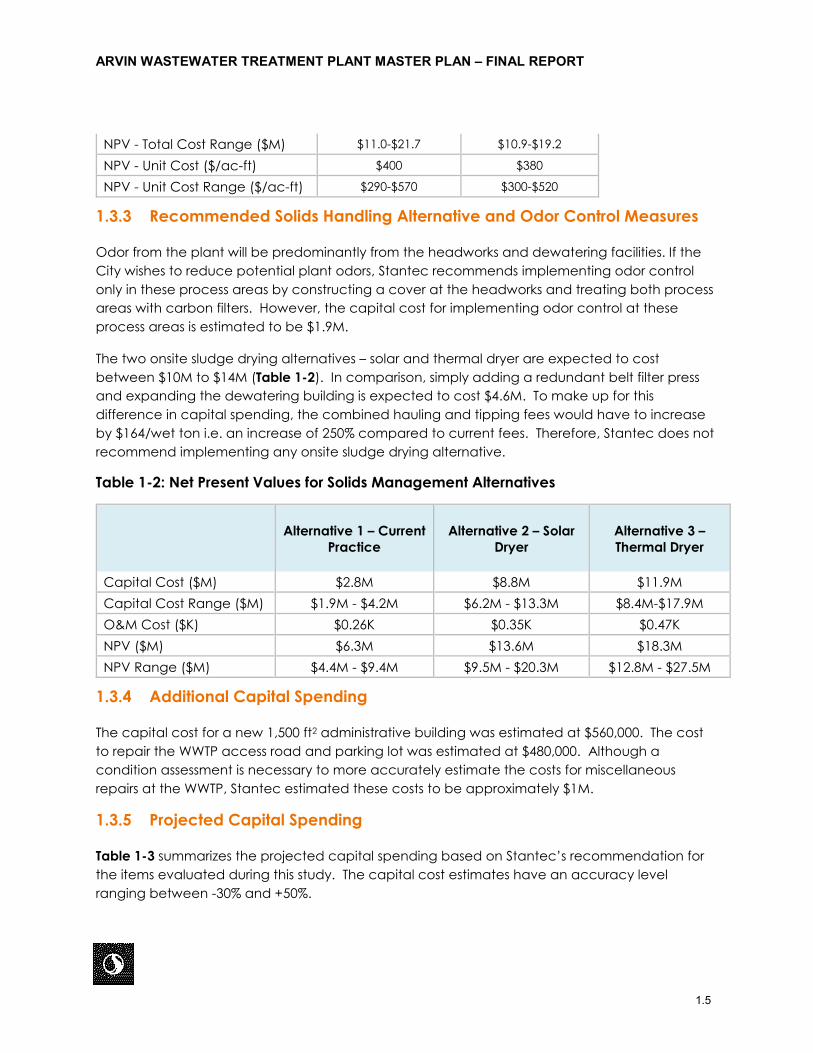
NPV - Total Cost Range ($M) $11.0-$21.7 $10.9-$19.2
NPV - Unit Cost ($/ac-ft) $400 $380
NPV - Unit Cost Range ($/ac-ft) $290-$570 $300-$520
1.3.3 Recommended Solids Handling Alternative and Odor Control Measures
Odor from the plant will be predominantly from the headworks and dewatering facilities. If the City wishes to reduce potential plant odors, Stantec recommends implementing odor control only in these process areas by constructing a cover at the headworks and treating both process areas with carbon filters. However, the capital cost for implementing odor control at these process areas is estimated to be $1.9M.
The two onsite sludge drying alternatives – solar and thermal dryer are expected to cost between $10M to $14M (Table 1-2). In comparison, simply adding a redundant belt filter press and expanding the dewatering building is expected to cost $4.6M. To make up for this difference in capital spending, the combined hauling and tipping fees would have to increase by $164/wet ton i.e. an increase of 250% compared to current fees. Therefore, Stantec does not recommend implementing any onsite sludge drying alternative.
Table 1-2: Net Present Values for Solids Management Alternatives
Alternative 1 – Current Practice
Alternative 2 – Solar Dryer
Alternative 3 – Thermal Dryer
Capital Cost ($M) $2.8M $8.8M $11.9M Capital Cost Range ($M) $1.9M - $4.2M $6.2M - $13.3M $8.4M-$17.9M O&M Cost ($K) $0.26K $0.35K $0.47K NPV ($M) $6.3M $13.6M $18.3M NPV Range ($M) $4.4M - $9.4M $9.5M - $20.3M $12.8M - $27.5M
1.3.4 Additional Capital Spending
The capital cost for a new 1,500 ft2 administrative building was estimated at $560,000. The cost to repair the WWTP access road and parking lot was estimated at $480,000. Although a condition assessment is necessary to more accurately estimate the costs for miscellaneous repairs at the WWTP, Stantec estimated these costs to be approximately $1M.
1.3.5 Projected Capital Spending
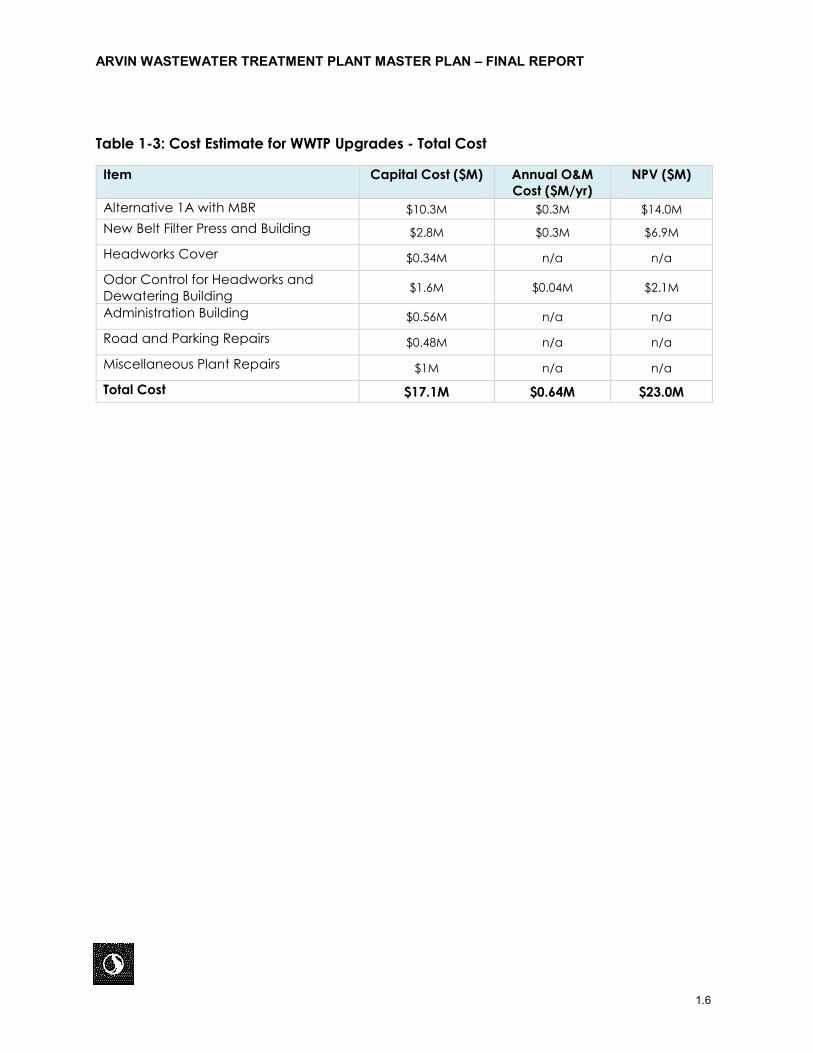
Table 1-3 summarizes the projected capital spending based on Stantec’s recommendation for the items evaluated during this study. The capital cost estimates have an accuracy level ranging between -30% and +50%.
ARVIN WASTEWATER TREATMENT PLANT MASTER PLAN – FINAL REPORT
1.6
Table 1-3: Cost Estimate for WWTP Upgrades - Total Cost
Item Capital Cost ($M) Annual O&M Cost ($M/yr)
NPV ($M)
Alternative 1A with MBR $10.3M $0.3M $14.0M New Belt Filter Press and Building $2.8M $0.3M $6.9M
Headworks Cover $0.34M n/a n/a
Odor Control for Headworks and Dewatering Building $1.6M $0.04M $2.1M
Administration Building $0.56M n/a n/a
Road and Parking Repairs $0.48M n/a n/a
Miscellaneous Plant Repairs $1M n/a n/a
Total Cost $17.1M $0.64M $23.0M
ARVIN WASTEWATER TREATMENT PLANT MASTER PLAN – FINAL REPORT
2.1
2.0 BACKGROUND AND OBJECTIVES 2.1 PROJECT BACKGROUND
The City of Arvin (City), located southeast of Bakersfield in Kern County, has a population of approximately 21,000 people within a service area of approximately 4.82 square miles. The City has a mixture of residential, industrial, commercial and institutional land use, with residential making up the majority of the land use. Although the City is planning to extend its sphere of influence in the future by up to 60%, no formal plans for rezoning have been generated.
Located in the southwest portion of the City, the wastewater treatment plant (WWTP), Arvin WWTP, is a 2-MGD rated facility that currently treats approximately 1.1 MGD of wastewater. The water conservation efforts across the City has reduced per capita wastewater flow by about 47%, while Biological Oxygen Demand (BOD) has increased by nearly 130%. The Arvin WWTP provides secondary treatment using oxidation ditches with the treated water being used for irrigating farmland. The solids generated from the WWTP are thickened and hauled away to a compost facility that is approximately 29 miles away. The WWTP is contract-operated by the Veolia West Operating Services (VWOS).
Although most of the treated wastewater is currently used for irrigating farmland, the City is exploring alternatives for reuse of treated wastewater due to potential regulatory requirements for the total dissolved solids (TDS) and total nitrogen (TN) that may be more stringent than what the WWTP can currently achieve. The City is also planning to reduce the volume of solids hauled by exploring on-site dewatering/drying alternatives.
In 2008, AECOM prepared a preliminary design report for the expansion of the Arvin WWTP with a goal to increase the plant capacity from 2 to 2.5 MGD and reduce the effluent TN to less than 10 mg/L. The main components of the design included an anoxic tank for denitrification, additional aeration in the oxidation ditch and Orbal®, a third secondary clarifier for added redundancy, additional splitter box and pump stations to combine the ditch and Orbal® systems, pond lining, addition of new electrical components to the existing administration building, and the construction of a new pre-engineered administration building. Disinfection and removal of TDS were not included in the proposed treatment expansion.
Another study, conducted by Quad-Knopf in 2017, identified potential modifications to the treatment process to increase plant capacity, reduce energy consumption, increase sludge handling efficiency and, explore alternatives for effluent discharge, specifically to the local water storage district. The study concurred with the biological treatment recommendations from the AECOM report as well as recommending an added treatment train consisting of an MBR and disinfection system to produce disinfected tertiary effluent that meets Title 22 requirements. Such approach will increase the potential alternative destination options for the final effluent. The recommended effluent destination alternatives included the City purchasing farmland to irrigate or supplementing the Arvin Edison Water Storage District (AEWSD) water supply.
ARVIN WASTEWATER TREATMENT PLANT MASTER PLAN – FINAL REPORT
2.2
2.2 OBJECTIVES
In 2019, Stantec was retained by the City via VWOS to further explore effluent destinations and solids disposal options. The primary drivers for the City were to diversify the effluent destination and lower greenhouse gas emissions (through reduced trucking of solids) while maximizing the use of existing infrastructure for planned growth. With TDS and TN as key constituents, Stantec was tasked to conduct a planning study with the following objectives:
• Review previous studies including but not limited to:
o City of Arvin WWTP Expansion Final Preliminary Engineering Report (AECOM, 2008)
o City of Arvin WWTP Feasibility Study (Quad-Knopf, 2017)
• Determine future plant capacity (hydraulic and organic) based on 20-year design period.
• Evaluate and recommend ultimate effluent destination based on following options:
o Land Application (for Crop Production/Irrigation)
o Percolation Basins (Groundwater Recharge via Surface Spreading)
o Leach Fields (Groundwater Recharge via Subsurface Spreading)
o Discharge to Arvin Edison Water Storage District (Groundwater Recharge via Surface Spreading)
o Direct Injection (Groundwater Recharge via Subsurface Injection)
• Develop a process train to meet the effluent water quality goals for selected effluent destination
• Evaluate two solids handling and odor control alternatives and provide recommendation
• Evaluate office upgrades and/or expansions to accommodate the facility upgrades, and
• Prepare Proposition 218-compliant capital and operation and maintenance (O&M) costs for selected alternatives
• Summarize the project findings in a report that complies with the SRF loan application guidelines
• Present project findings to the City Council, if requested by the City.
ARVIN WASTEWATER TREATMENT PLANT MASTER PLAN – FINAL REPORT
3.1
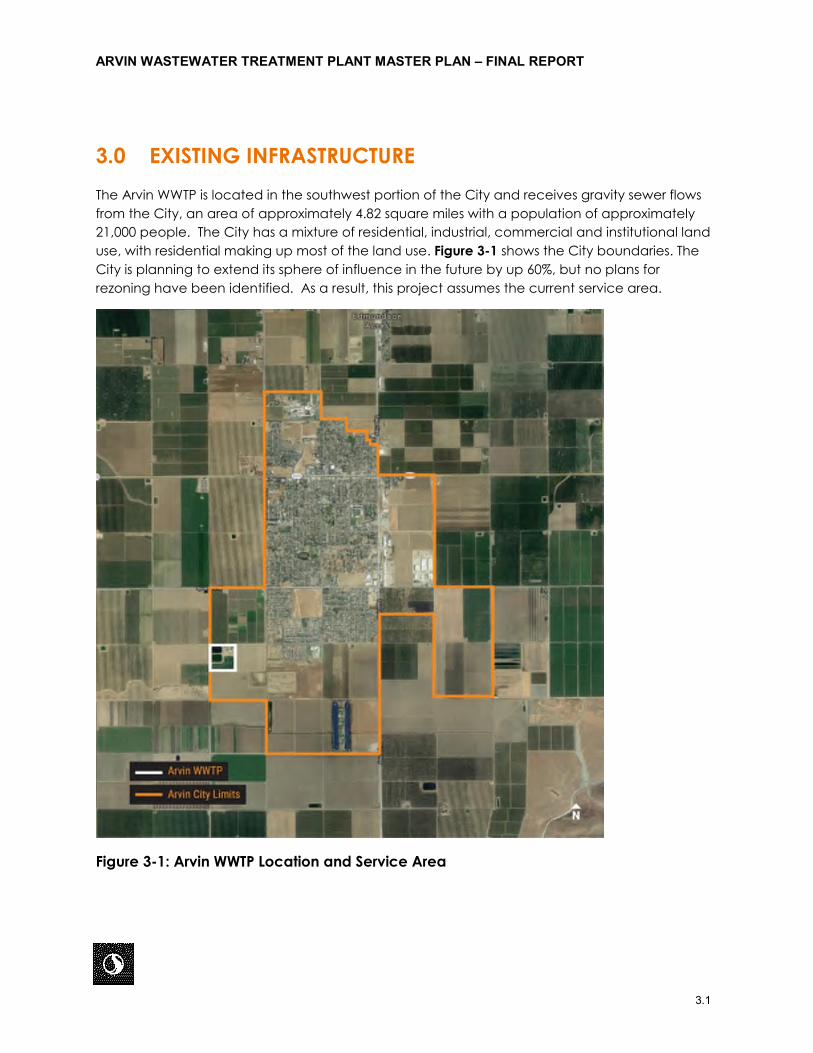
3.0 EXISTING INFRASTRUCTURE The Arvin WWTP is located in the southwest portion of the City and receives gravity sewer flows from the City, an area of approximately 4.82 square miles with a population of approximately 21,000 people. The City has a mixture of residential, industrial, commercial and institutional land use, with residential making up most of the land use. Figure 3-1 shows the City boundaries. The City is planning to extend its sphere of influence in the future by up 60%, but no plans for rezoning have been identified. As a result, this project assumes the current service area.
Figure 3-1: Arvin WWTP Location and Service Area
ARVIN WASTEWATER TREATMENT PLANT MASTER PLAN – FINAL REPORT
3.2
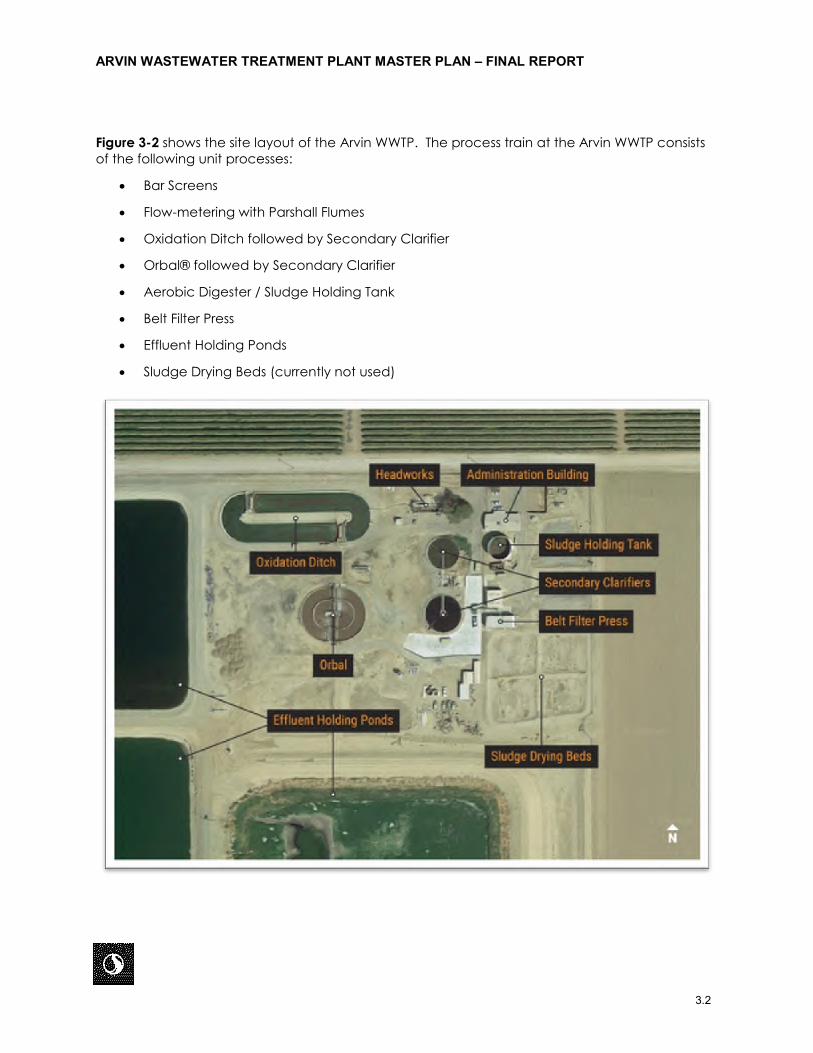
Figure 3-2 shows the site layout of the Arvin WWTP. The process train at the Arvin WWTP consists of the following unit processes:
• Bar Screens
• Flow-metering with Parshall Flumes
• Oxidation Ditch followed by Secondary Clarifier
• Orbal® followed by Secondary Clarifier
• Aerobic Digester / Sludge Holding Tank
• Belt Filter Press
• Effluent Holding Ponds
• Sludge Drying Beds (currently not used)
ARVIN WASTEWATER TREATMENT PLANT MASTER PLAN – FINAL REPORT
3.3
Figure 3-2: Site Layout of the Arvin WWTP
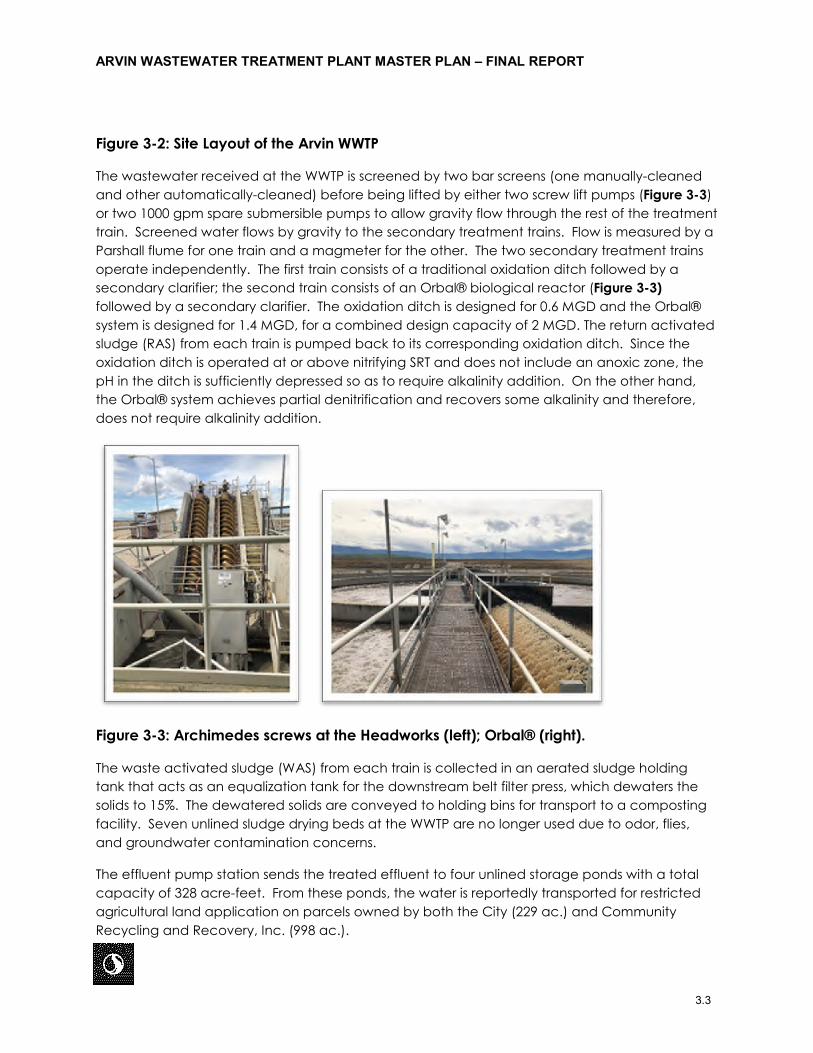
The wastewater received at the WWTP is screened by two bar screens (one manually-cleaned and other automatically-cleaned) before being lifted by either two screw lift pumps (Figure 3-3) or two 1000 gpm spare submersible pumps to allow gravity flow through the rest of the treatment train. Screened water flows by gravity to the secondary treatment trains. Flow is measured by a Parshall flume for one train and a magmeter for the other. The two secondary treatment trains operate independently. The first train consists of a traditional oxidation ditch followed by a secondary clarifier; the second train consists of an Orbal® biological reactor (Figure 3-3) followed by a secondary clarifier. The oxidation ditch is designed for 0.6 MGD and the Orbal® system is designed for 1.4 MGD, for a combined design capacity of 2 MGD. The return activated sludge (RAS) from each train is pumped back to its corresponding oxidation ditch. Since the oxidation ditch is operated at or above nitrifying SRT and does not include an anoxic zone, the pH in the ditch is sufficiently depressed so as to require alkalinity addition. On the other hand, the Orbal® system achieves partial denitrification and recovers some alkalinity and therefore, does not require alkalinity addition.
Figure 3-3: Archimedes screws at the Headworks (left); Orbal® (right).
The waste activated sludge (WAS) from each train is collected in an aerated sludge holding tank that acts as an equalization tank for the downstream belt filter press, which dewaters the solids to 15%. The dewatered solids are conveyed to holding bins for transport to a composting facility. Seven unlined sludge drying beds at the WWTP are no longer used due to odor, flies, and groundwater contamination concerns.
The effluent pump station sends the treated effluent to four unlined storage ponds with a total capacity of 328 acre-feet. From these ponds, the water is reportedly transported for restricted agricultural land application on parcels owned by both the City (229 ac.) and Community Recycling and Recovery, Inc. (998 ac.).
ARVIN WASTEWATER TREATMENT PLANT MASTER PLAN – FINAL REPORT
4.1
4.0 INFLUENT WASTEWATER CHARACTERISTICS AND EFFLUENT WATER QUALITY GOALS
4.1 INFLUENT WASTEWATER CHARACTERISTICS
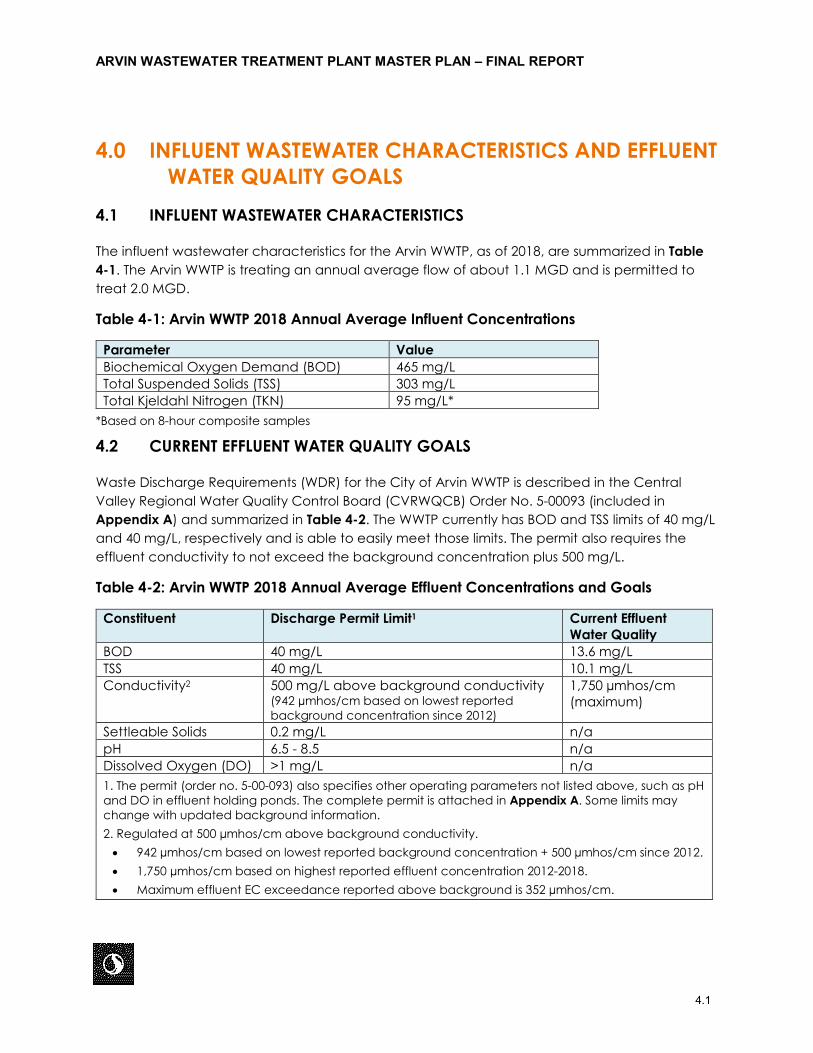
The influent wastewater characteristics for the Arvin WWTP, as of 2018, are summarized in Table 4-1. The Arvin WWTP is treating an annual average flow of about 1.1 MGD and is permitted to treat 2.0 MGD.
Table 4-1: Arvin WWTP 2018 Annual Average Influent Concentrations
Parameter Value Biochemical Oxygen Demand (BOD) 465 mg/L Total Suspended Solids (TSS) 303 mg/L Total Kjeldahl Nitrogen (TKN) 95 mg/L*
*Based on 8-hour composite samples
4.2 CURRENT EFFLUENT WATER QUALITY GOALS
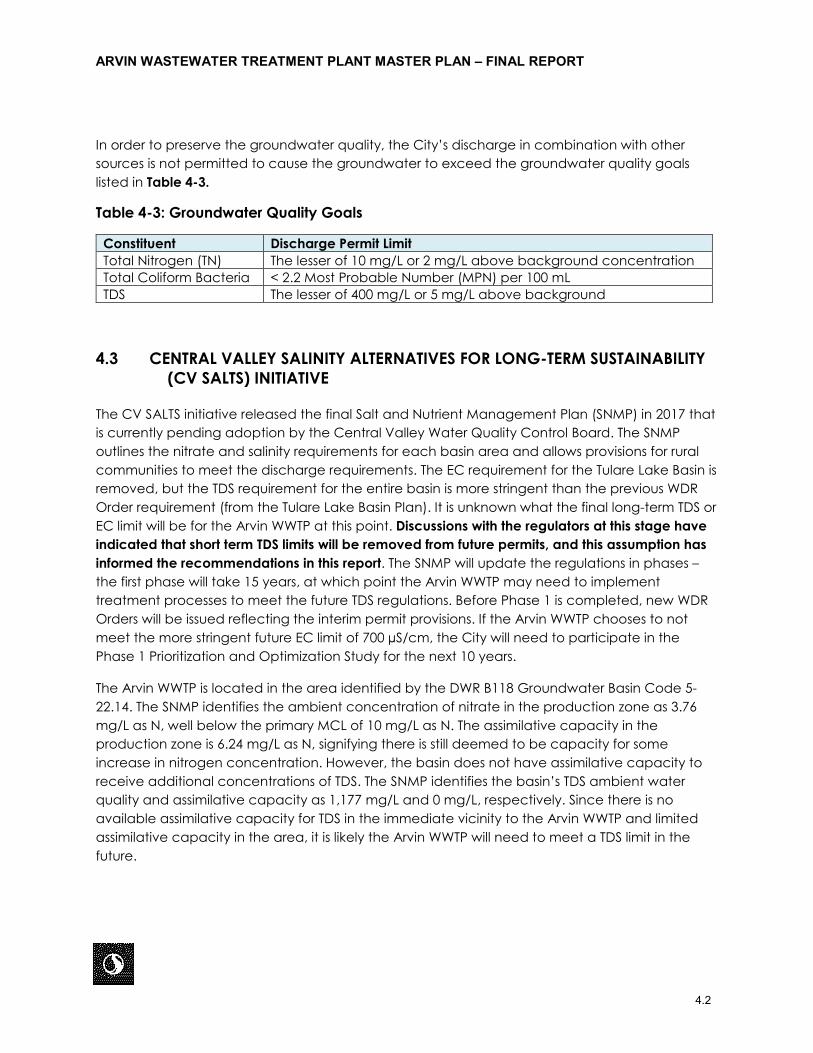
Waste Discharge Requirements (WDR) for the City of Arvin WWTP is described in the Central Valley Regional Water Quality Control Board (CVRWQCB) Order No. 5-00093 (included in Appendix A) and summarized in Table 4-2. The WWTP currently has BOD and TSS limits of 40 mg/L and 40 mg/L, respectively and is able to easily meet those limits. The permit also requires the effluent conductivity to not exceed the background concentration plus 500 mg/L.
Table 4-2: Arvin WWTP 2018 Annual Average Effluent Concentrations and Goals
Constituent Discharge Permit Limit1 Current Effluent Water Quality
BOD 40 mg/L 13.6 mg/L TSS 40 mg/L 10.1 mg/L Conductivity2 500 mg/L above background conductivity
(942 µmhos/cm based on lowest reported background concentration since 2012)
1,750 µmhos/cm (maximum)
Settleable Solids 0.2 mg/L n/a pH 6.5 - 8.5 n/a Dissolved Oxygen (DO) >1 mg/L n/a 1. The permit (order no. 5-00-093) also specifies other operating parameters not listed above, such as pH and DO in effluent holding ponds. The complete permit is attached in Appendix A. Some limits may change with updated background information. 2. Regulated at 500 µmhos/cm above background conductivity. • 942 µmhos/cm based on lowest reported background concentration + 500 µmhos/cm since 2012. • 1,750 µmhos/cm based on highest reported effluent concentration 2012-2018. • Maximum effluent EC exceedance reported above background is 352 µmhos/cm.
ARVIN WASTEWATER TREATMENT PLANT MASTER PLAN – FINAL REPORT
4.2
In order to preserve the groundwater quality, the City’s discharge in combination with other sources is not permitted to cause the groundwater to exceed the groundwater quality goals listed in Table 4-3.
Table 4-3: Groundwater Quality Goals
Constituent Discharge Permit Limit Total Nitrogen (TN) The lesser of 10 mg/L or 2 mg/L above background concentration Total Coliform Bacteria < 2.2 Most Probable Number (MPN) per 100 mL TDS The lesser of 400 mg/L or 5 mg/L above background
4.3 CENTRAL VALLEY SALINITY ALTERNATIVES FOR LONG-TERM SUSTAINABILITY (CV SALTS) INITIATIVE
The CV SALTS initiative released the final Salt and Nutrient Management Plan (SNMP) in 2017 that is currently pending adoption by the Central Valley Water Quality Control Board. The SNMP outlines the nitrate and salinity requirements for each basin area and allows provisions for rural communities to meet the discharge requirements. The EC requirement for the Tulare Lake Basin is removed, but the TDS requirement for the entire basin is more stringent than the previous WDR Order requirement (from the Tulare Lake Basin Plan). It is unknown what the final long-term TDS or EC limit will be for the Arvin WWTP at this point. Discussions with the regulators at this stage have indicated that short term TDS limits will be removed from future permits, and this assumption has informed the recommendations in this report. The SNMP will update the regulations in phases – the first phase will take 15 years, at which point the Arvin WWTP may need to implement treatment processes to meet the future TDS regulations. Before Phase 1 is completed, new WDR Orders will be issued reflecting the interim permit provisions. If the Arvin WWTP chooses to not meet the more stringent future EC limit of 700 µS/cm, the City will need to participate in the Phase 1 Prioritization and Optimization Study for the next 10 years.
The Arvin WWTP is located in the area identified by the DWR B118 Groundwater Basin Code 5-22.14. The SNMP identifies the ambient concentration of nitrate in the production zone as 3.76 mg/L as N, well below the primary MCL of 10 mg/L as N. The assimilative capacity in the production zone is 6.24 mg/L as N, signifying there is still deemed to be capacity for some increase in nitrogen concentration. However, the basin does not have assimilative capacity to receive additional concentrations of TDS. The SNMP identifies the basin’s TDS ambient water quality and assimilative capacity as 1,177 mg/L and 0 mg/L, respectively. Since there is no available assimilative capacity for TDS in the immediate vicinity to the Arvin WWTP and limited assimilative capacity in the area, it is likely the Arvin WWTP will need to meet a TDS limit in the future.
ARVIN WASTEWATER TREATMENT PLANT MASTER PLAN – FINAL REPORT
4.3
4.4 TITLE 22 REGULATORY REQUIREMENTS
Recycled water from the City of Arvin WWTP must meet the requirements established by the Regional Water Quality Control Board (RWQCB) and the Division of Drinking Water (DDW). The RWQCB permits the capacity of the WWTP, while the DDW permits the WWTP to implement reuse via surface irrigation, surface application, or subsurface application. If any changes are made to the process at the WWTP, an amendment to the Waste Discharge Requirement (WDR) from the RWQCB is needed. The WDR includes the groundwater requirements specified in the Water Quality Control Plan for the Tulare Lake Basin, 2nd Edition.
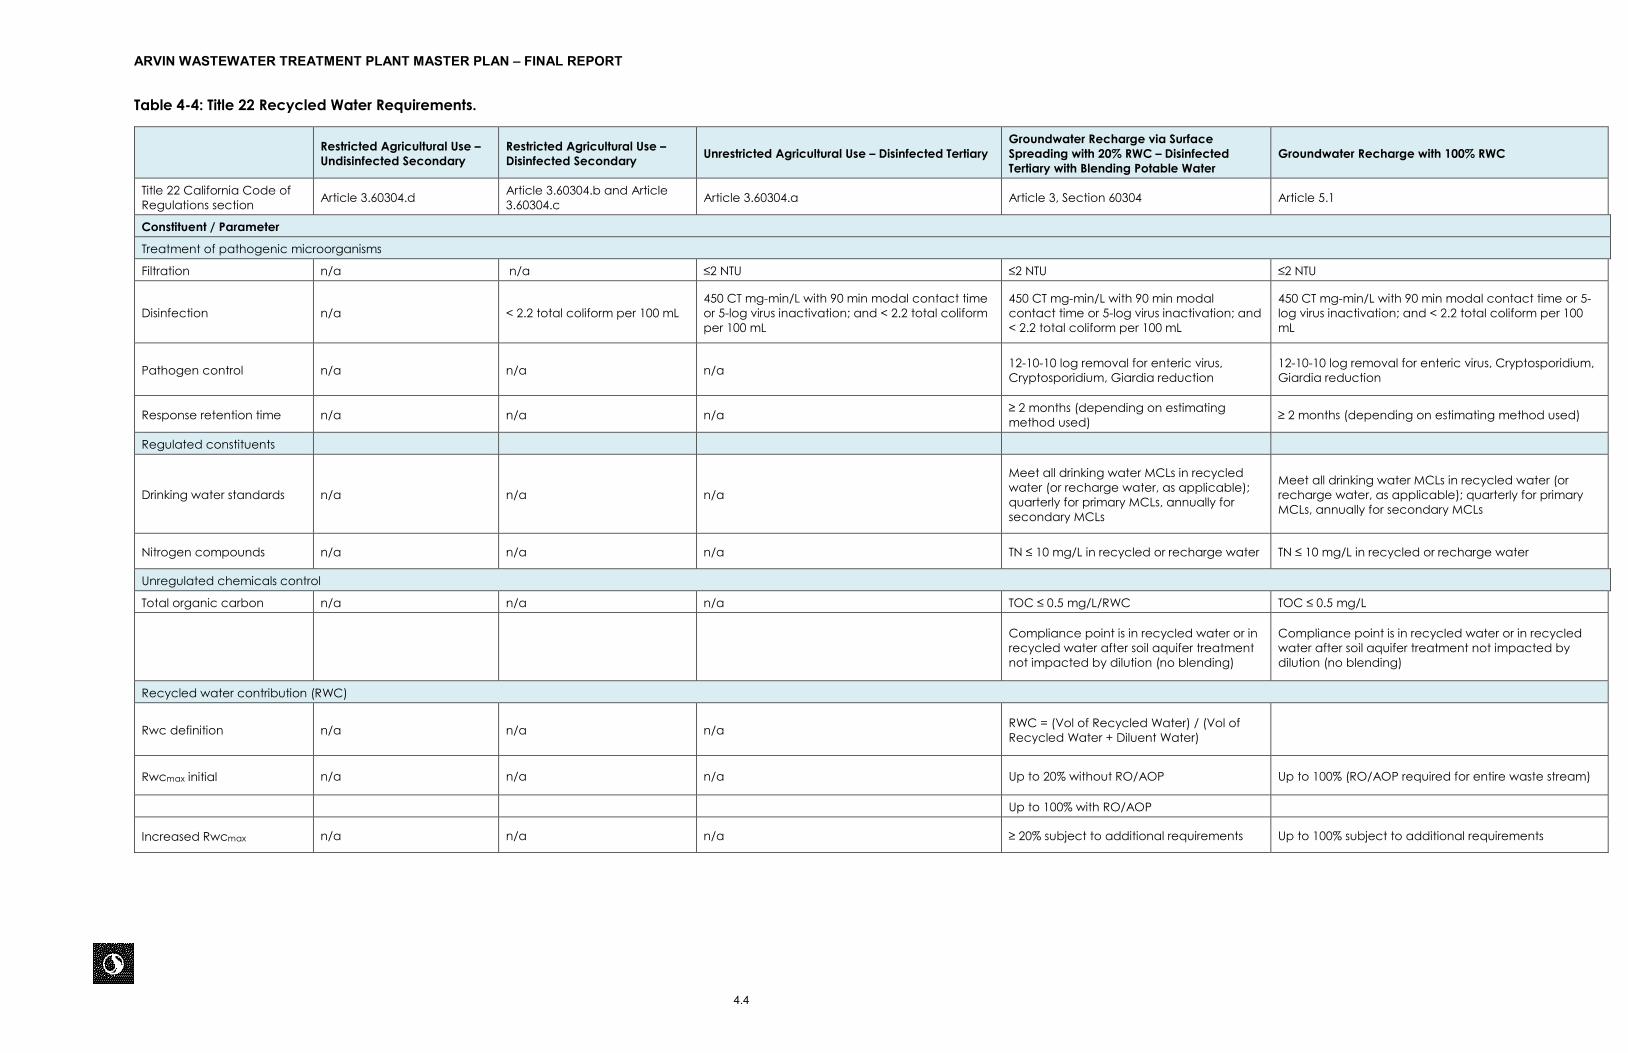
Wastewater must be treated in accordance with the Division of Drinking Water (DDW) Title 22 regulations (Title 22) and should meet the standards provided for the local groundwater basin if it were to be recycled. The City aims to use the effluent from the Arvin WWTP for either unrestricted agricultural use, surface application, or subsurface application. Unrestricted agricultural use is categorized as “use of recycled water for irrigation”. In order to be “unrestricted”, the most stringent irrigation water quality requirements must be met (found in Section 60304), which are summarized in Table 4-4. Surface application and subsurface application require the water to meet all drinking water MCLs.
The City had requested Stantec to analyze various alternatives for effluent disposal/reuse. Such analysis requires summarizing the water quality requirements for each alternative and then developing treatment train and associated high-level cost estimates.
The WWTP effluent is currently utilized for restricted agriculture, for which undisinfected secondary effluent is sufficient. If the City were to use the effluent for additional irrigation purposes, then disinfected secondary effluent is required. For irrigating food crops including edible root crops, disinfected tertiary effluent is required. If the City were to use the effluent for groundwater recharge (GWR) via either surface spreading or direct injection, some level of advanced treatment (using either reverse osmosis and/or advanced oxidation process) will be required unless sufficient blending water (potable water) is available.
ARVIN WASTEWATER TREATMENT PLANT MASTER PLAN – FINAL REPORT
4.4
Table 4-4: Title 22 Recycled Water Requirements.
Restricted Agricultural Use – Undisinfected Secondary
Restricted Agricultural Use – Disinfected Secondary Unrestricted Agricultural Use – Disinfected Tertiary
Groundwater Recharge via Surface Spreading with 20% RWC – Disinfected Tertiary with Blending Potable Water
Groundwater Recharge with 100% RWC
Title 22 California Code of Regulations section Article 3.60304.d Article 3.60304.b and Article
3.60304.c Article 3.60304.a Article 3, Section 60304 Article 5.1
Constituent / Parameter
Treatment of pathogenic microorganisms
Filtration n/a n/a ≤2 NTU ≤2 NTU ≤2 NTU
Disinfection n/a < 2.2 total coliform per 100 mL 450 CT mg-min/L with 90 min modal contact time or 5-log virus inactivation; and < 2.2 total coliform per 100 mL
450 CT mg-min/L with 90 min modal contact time or 5-log virus inactivation; and < 2.2 total coliform per 100 mL
450 CT mg-min/L with 90 min modal contact time or 5-log virus inactivation; and < 2.2 total coliform per 100 mL
Pathogen control n/a n/a n/a 12-10-10 log removal for enteric virus, Cryptosporidium, Giardia reduction
12-10-10 log removal for enteric virus, Cryptosporidium, Giardia reduction
Response retention time n/a n/a n/a ≥ 2 months (depending on estimating method used) ≥ 2 months (depending on estimating method used)
Regulated constituents
Drinking water standards n/a n/a n/a
Meet all drinking water MCLs in recycled water (or recharge water, as applicable); quarterly for primary MCLs, annually for secondary MCLs
Meet all drinking water MCLs in recycled water (or recharge water, as applicable); quarterly for primary MCLs, annually for secondary MCLs
Nitrogen compounds n/a n/a n/a TN ≤ 10 mg/L in recycled or recharge water TN ≤ 10 mg/L in recycled or recharge water
Unregulated chemicals control
Total organic carbon n/a n/a n/a TOC ≤ 0.5 mg/L/RWC TOC ≤ 0.5 mg/L
Compliance point is in recycled water or in recycled water after soil aquifer treatment not impacted by dilution (no blending)
Compliance point is in recycled water or in recycled water after soil aquifer treatment not impacted by dilution (no blending)
Recycled water contribution (RWC)
Rwc definition n/a n/a n/a RWC = (Vol of Recycled Water) / (Vol of Recycled Water + Diluent Water)
Rwcmax initial n/a n/a n/a Up to 20% without RO/AOP Up to 100% (RO/AOP required for entire waste stream)
Up to 100% with RO/AOP
Increased Rwcmax n/a n/a n/a ≥ 20% subject to additional requirements Up to 100% subject to additional requirements
ARVIN WASTEWATER TREATMENT PLANT MASTER PLAN – FINAL REPORT
5.1
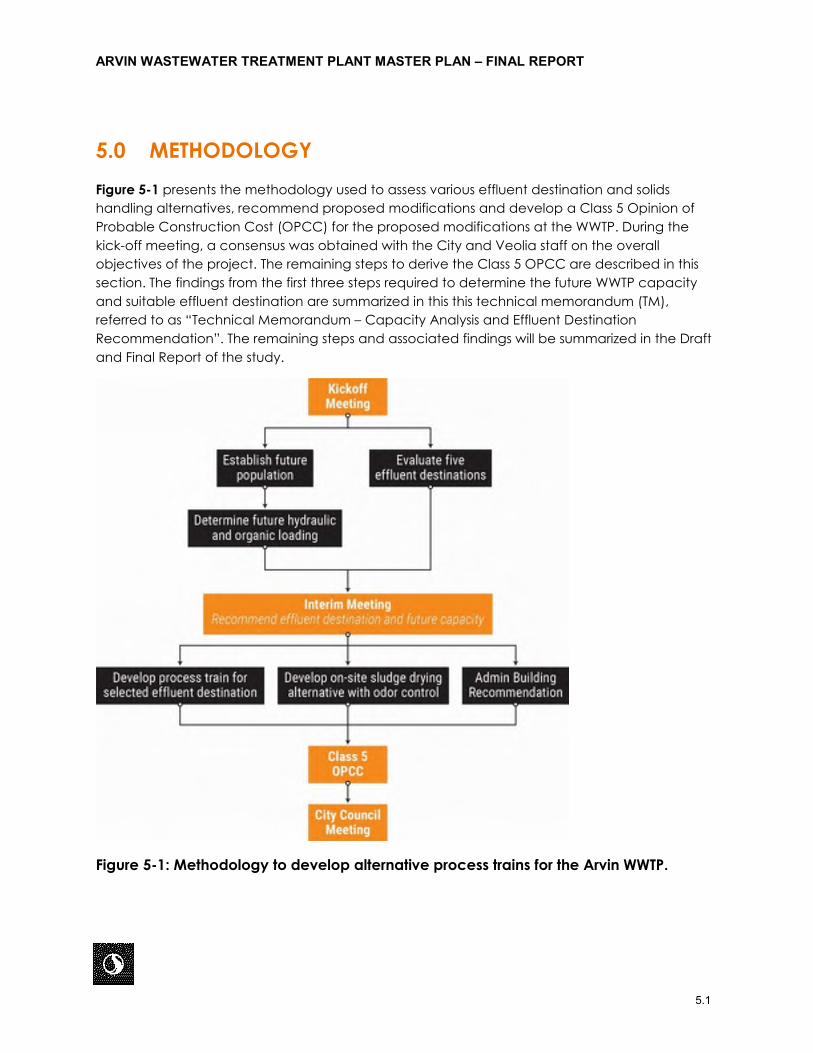
5.0 METHODOLOGY Figure 5-1 presents the methodology used to assess various effluent destination and solids handling alternatives, recommend proposed modifications and develop a Class 5 Opinion of Probable Construction Cost (OPCC) for the proposed modifications at the WWTP. During the kick-off meeting, a consensus was obtained with the City and Veolia staff on the overall objectives of the project. The remaining steps to derive the Class 5 OPCC are described in this section. The findings from the first three steps required to determine the future WWTP capacity and suitable effluent destination are summarized in this this technical memorandum (TM), referred to as “Technical Memorandum – Capacity Analysis and Effluent Destination Recommendation”. The remaining steps and associated findings will be summarized in the Draft and Final Report of the study.
Figure 5-1: Methodology to develop alternative process trains for the Arvin WWTP.
ARVIN WASTEWATER TREATMENT PLANT MASTER PLAN – FINAL REPORT
5.2
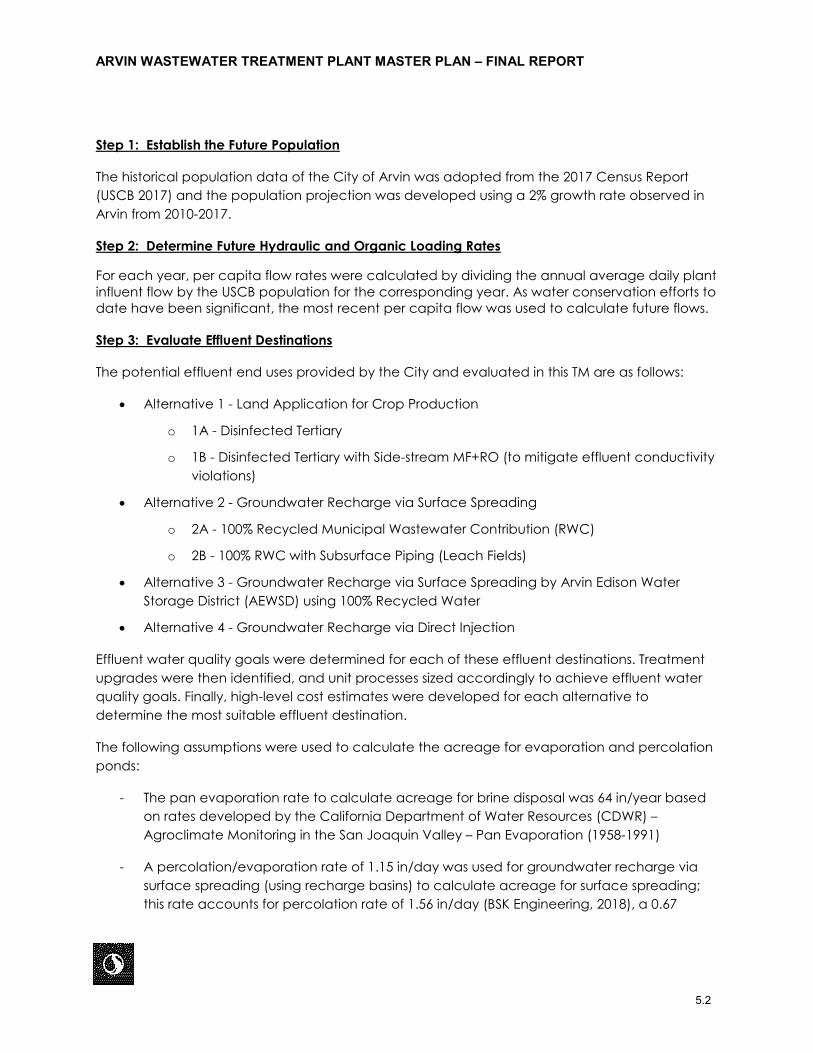
Step 1: Establish the Future Population
The historical population data of the City of Arvin was adopted from the 2017 Census Report (USCB 2017) and the population projection was developed using a 2% growth rate observed in Arvin from 2010-2017.
Step 2: Determine Future Hydraulic and Organic Loading Rates
For each year, per capita flow rates were calculated by dividing the annual average daily plant influent flow by the USCB population for the corresponding year. As water conservation efforts to date have been significant, the most recent per capita flow was used to calculate future flows.
Step 3: Evaluate Effluent Destinations
The potential effluent end uses provided by the City and evaluated in this TM are as follows:
• Alternative 1 - Land Application for Crop Production
o 1A - Disinfected Tertiary
o 1B - Disinfected Tertiary with Side-stream MF+RO (to mitigate effluent conductivity violations)
• Alternative 2 - Groundwater Recharge via Surface Spreading
o 2A - 100% Recycled Municipal Wastewater Contribution (RWC)
o 2B - 100% RWC with Subsurface Piping (Leach Fields)
• Alternative 3 - Groundwater Recharge via Surface Spreading by Arvin Edison Water Storage District (AEWSD) using 100% Recycled Water
• Alternative 4 - Groundwater Recharge via Direct Injection
Effluent water quality goals were determined for each of these effluent destinations. Treatment upgrades were then identified, and unit processes sized accordingly to achieve effluent water quality goals. Finally, high-level cost estimates were developed for each alternative to determine the most suitable effluent destination.
The following assumptions were used to calculate the acreage for evaporation and percolation ponds:
- The pan evaporation rate to calculate acreage for brine disposal was 64 in/year based on rates developed by the California Department of Water Resources (CDWR) – Agroclimate Monitoring in the San Joaquin Valley – Pan Evaporation (1958-1991)
- A percolation/evaporation rate of 1.15 in/day was used for groundwater recharge via surface spreading (using recharge basins) to calculate acreage for surface spreading; this rate accounts for percolation rate of 1.56 in/day (BSK Engineering, 2018), a 0.67
ARVIN WASTEWATER TREATMENT PLANT MASTER PLAN – FINAL REPORT
5.3
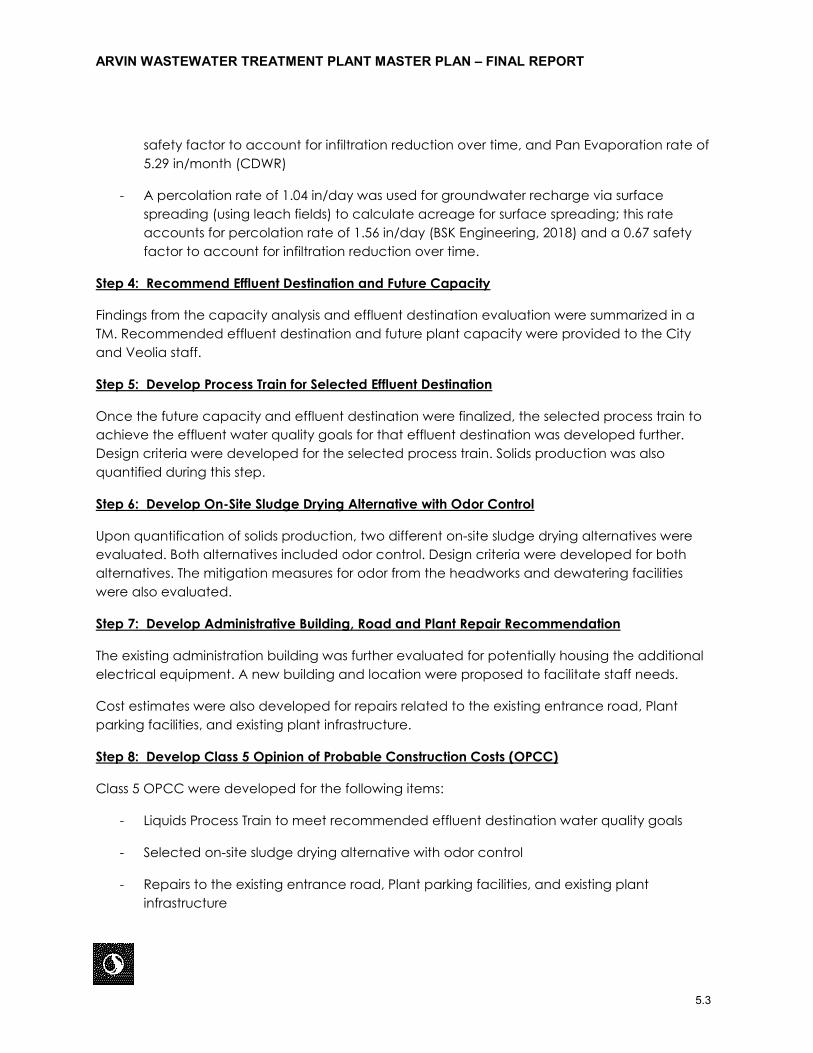
safety factor to account for infiltration reduction over time, and Pan Evaporation rate of 5.29 in/month (CDWR)
- A percolation rate of 1.04 in/day was used for groundwater recharge via surface spreading (using leach fields) to calculate acreage for surface spreading; this rate accounts for percolation rate of 1.56 in/day (BSK Engineering, 2018) and a 0.67 safety factor to account for infiltration reduction over time.
Step 4: Recommend Effluent Destination and Future Capacity
Findings from the capacity analysis and effluent destination evaluation were summarized in a TM. Recommended effluent destination and future plant capacity were provided to the City and Veolia staff.
Step 5: Develop Process Train for Selected Effluent Destination
Once the future capacity and effluent destination were finalized, the selected process train to achieve the effluent water quality goals for that effluent destination was developed further. Design criteria were developed for the selected process train. Solids production was also quantified during this step.
Step 6: Develop On-Site Sludge Drying Alternative with Odor Control
Upon quantification of solids production, two different on-site sludge drying alternatives were evaluated. Both alternatives included odor control. Design criteria were developed for both alternatives. The mitigation measures for odor from the headworks and dewatering facilities were also evaluated.
Step 7: Develop Administrative Building, Road and Plant Repair Recommendation
The existing administration building was further evaluated for potentially housing the additional electrical equipment. A new building and location were proposed to facilitate staff needs.
Cost estimates were also developed for repairs related to the existing entrance road, Plant parking facilities, and existing plant infrastructure.
Step 8: Develop Class 5 Opinion of Probable Construction Costs (OPCC)
Class 5 OPCC were developed for the following items:
- Liquids Process Train to meet recommended effluent destination water quality goals
- Selected on-site sludge drying alternative with odor control
- Repairs to the existing entrance road, Plant parking facilities, and existing plant infrastructure
ARVIN WASTEWATER TREATMENT PLANT MASTER PLAN – FINAL REPORT
5.4
- Modification to existing administration building and construction of a new administration building
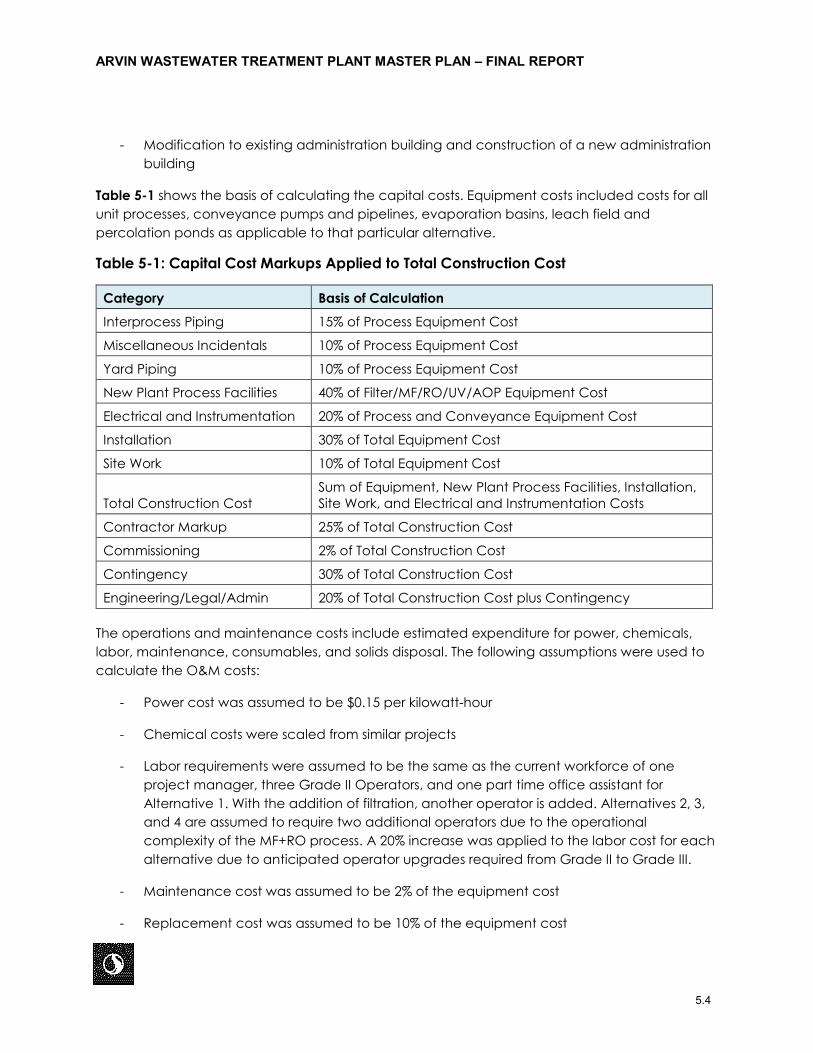
Table 5-1 shows the basis of calculating the capital costs. Equipment costs included costs for all unit processes, conveyance pumps and pipelines, evaporation basins, leach field and percolation ponds as applicable to that particular alternative.
Table 5-1: Capital Cost Markups Applied to Total Construction Cost
Category Basis of Calculation Interprocess Piping 15% of Process Equipment Cost
Miscellaneous Incidentals 10% of Process Equipment Cost
Yard Piping 10% of Process Equipment Cost
New Plant Process Facilities 40% of Filter/MF/RO/UV/AOP Equipment Cost
Electrical and Instrumentation 20% of Process and Conveyance Equipment Cost
Installation 30% of Total Equipment Cost
Site Work 10% of Total Equipment Cost
Total Construction Cost Sum of Equipment, New Plant Process Facilities, Installation, Site Work, and Electrical and Instrumentation Costs
Contractor Markup 25% of Total Construction Cost
Commissioning 2% of Total Construction Cost
Contingency 30% of Total Construction Cost
Engineering/Legal/Admin 20% of Total Construction Cost plus Contingency
The operations and maintenance costs include estimated expenditure for power, chemicals, labor, maintenance, consumables, and solids disposal. The following assumptions were used to calculate the O&M costs:
- Power cost was assumed to be $0.15 per kilowatt-hour
- Chemical costs were scaled from similar projects
- Labor requirements were assumed to be the same as the current workforce of one project manager, three Grade II Operators, and one part time office assistant for Alternative 1. With the addition of filtration, another operator is added. Alternatives 2, 3, and 4 are assumed to require two additional operators due to the operational complexity of the MF+RO process. A 20% increase was applied to the labor cost for each alternative due to anticipated operator upgrades required from Grade II to Grade III.
- Maintenance cost was assumed to be 2% of the equipment cost
- Replacement cost was assumed to be 10% of the equipment cost
ARVIN WASTEWATER TREATMENT PLANT MASTER PLAN – FINAL REPORT
5.5
- Diluent water cost was assumed to be $1,078/ac-ft
- A contingency of 10% was applied to the total of all the above costs
- The Net Present Value was calculated using a discount rate of 4% and time period of 20 years
Additional assumptions for cost development include:
- Land required to construct percolation ponds, leach fields, and evaporation ponds is assumed to already be owned by the City. Loss of agricultural lease revenue is not included in the cost.
- Land owned by the city (229 acres) not required for Plant expansion has been applied as a credit of $25,000/acre to the total cost. Land purchased by the City to accommodate the developed land spreading option (guaranteed effluent destination) has been applied as a cost of $35,000/acre. Land sale prices are estimates and are subject to market fluctuations.
- Existing conveyance pipelines will be used to transport treated effluent for irrigation alternatives (Alternatives 1A and 1B); no additional pipeline and pumping costs have been added for those alternatives.
The cost estimates presented in this TM were prepared in accordance with the criteria established by the Association for the Advancement of Cost Engineering (AACE) for a Class 5 cost estimate. The estimate has an accuracy level ranging between -30% and +50%. The estimate is based on capacity factored parametric models, judgment, and analogy with similar engineered systems.
ARVIN WASTEWATER TREATMENT PLANT MASTER PLAN – FINAL REPORT
6.1
6.0 FUTURE HYDRAULIC AND ORGANIC PLANT LOADING 6.1 FLOW PROJECTIONS FOR HYDRAULIC LOADING
Influent flowrates for the Arvin WWTP were obtained from the City/Veolia staff. Using the flowrates from 2000-2017, per capita flowrates were calculated by dividing the annual average daily plant influent flow by the City’s population as reported for that year by the United States Census Bureau (USCB).
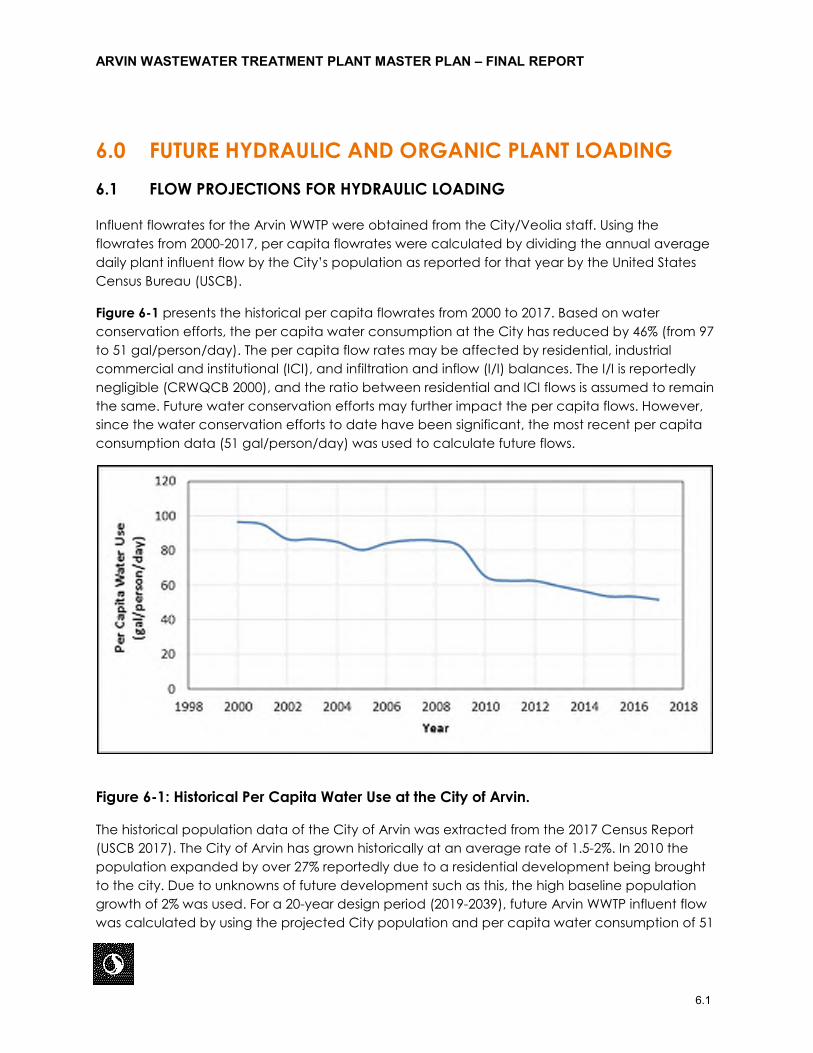
Figure 6-1 presents the historical per capita flowrates from 2000 to 2017. Based on water conservation efforts, the per capita water consumption at the City has reduced by 46% (from 97 to 51 gal/person/day). The per capita flow rates may be affected by residential, industrial commercial and institutional (ICI), and infiltration and inflow (I/I) balances. The I/I is reportedly negligible (CRWQCB 2000), and the ratio between residential and ICI flows is assumed to remain the same. Future water conservation efforts may further impact the per capita flows. However, since the water conservation efforts to date have been significant, the most recent per capita consumption data (51 gal/person/day) was used to calculate future flows.
Figure 6-1: Historical Per Capita Water Use at the City of Arvin.
The historical population data of the City of Arvin was extracted from the 2017 Census Report (USCB 2017). The City of Arvin has grown historically at an average rate of 1.5-2%. In 2010 the population expanded by over 27% reportedly due to a residential development being brought to the city. Due to unknowns of future development such as this, the high baseline population growth of 2% was used. For a 20-year design period (2019-2039), future Arvin WWTP influent flow was calculated by using the projected City population and per capita water consumption of 51
ARVIN WASTEWATER TREATMENT PLANT MASTER PLAN – FINAL REPORT
6.2
gal/person/day. The future population projected for the City of Arvin in 2039 is anticipated to be 32,880 people and corresponding Arvin WWTP influent flow to be 1.7 MGD. Reportedly, the future planned full build-out population at maximum density will be approximately 50,000 people. At the assumed growth rate of 2%, this population may be reached by 2060.
6.2 ORGANIC LOADING
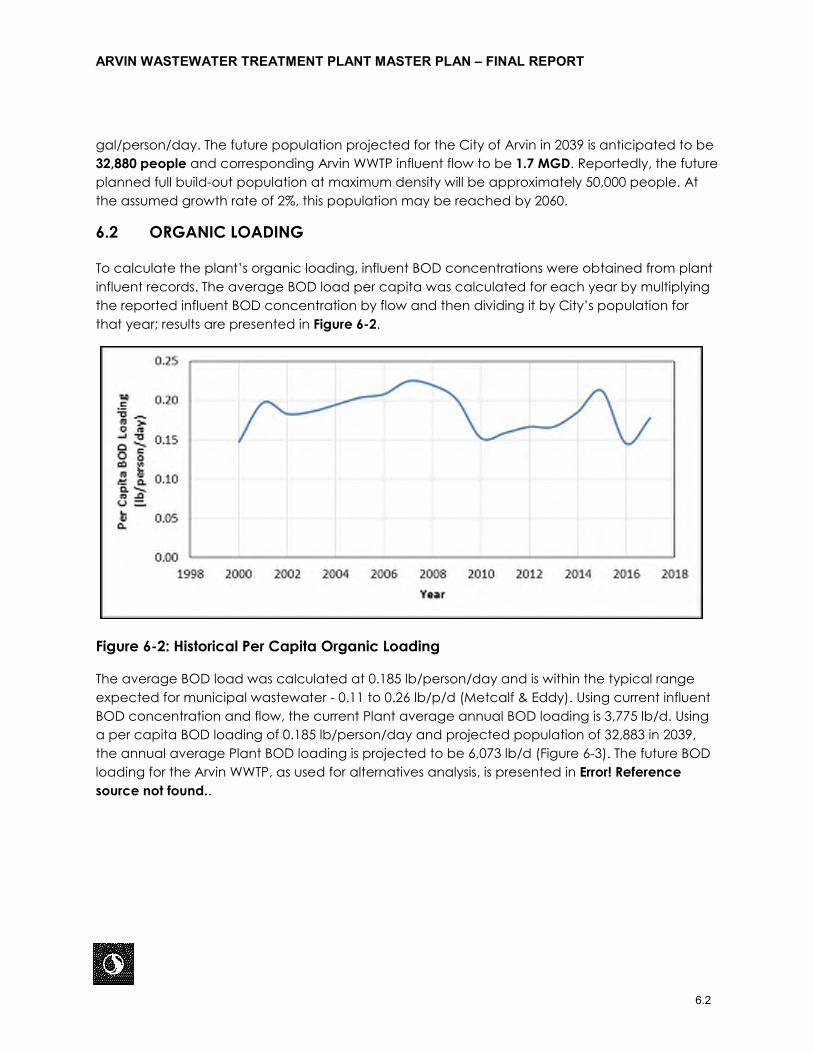
To calculate the plant’s organic loading, influent BOD concentrations were obtained from plant influent records. The average BOD load per capita was calculated for each year by multiplying the reported influent BOD concentration by flow and then dividing it by City’s population for that year; results are presented in Figure 6-2.
Figure 6-2: Historical Per Capita Organic Loading
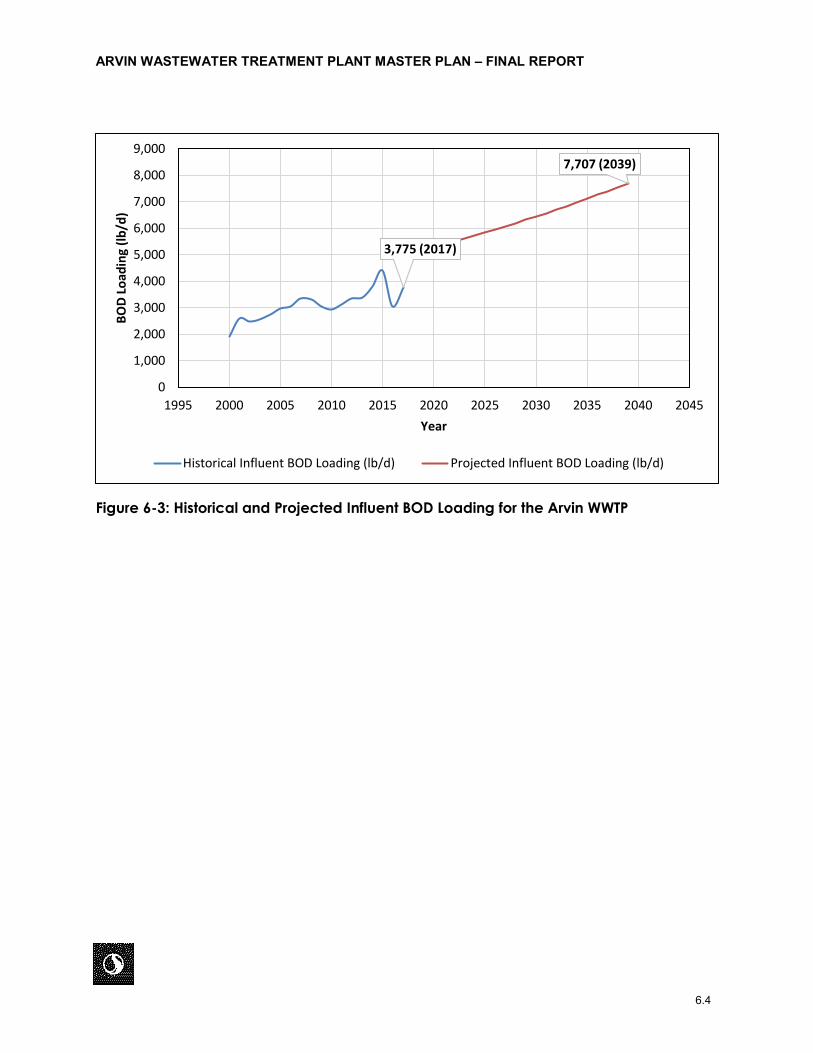
The average BOD load was calculated at 0.185 lb/person/day and is within the typical range expected for municipal wastewater - 0.11 to 0.26 lb/p/d (Metcalf & Eddy). Using current influent BOD concentration and flow, the current Plant average annual BOD loading is 3,775 lb/d. Using a per capita BOD loading of 0.185 lb/person/day and projected population of 32,883 in 2039, the annual average Plant BOD loading is projected to be 6,073 lb/d (Figure 6-3). The future BOD loading for the Arvin WWTP, as used for alternatives analysis, is presented in Error! Reference source not found..
ARVIN WASTEWATER TREATMENT PLANT MASTER PLAN – FINAL REPORT
6.3
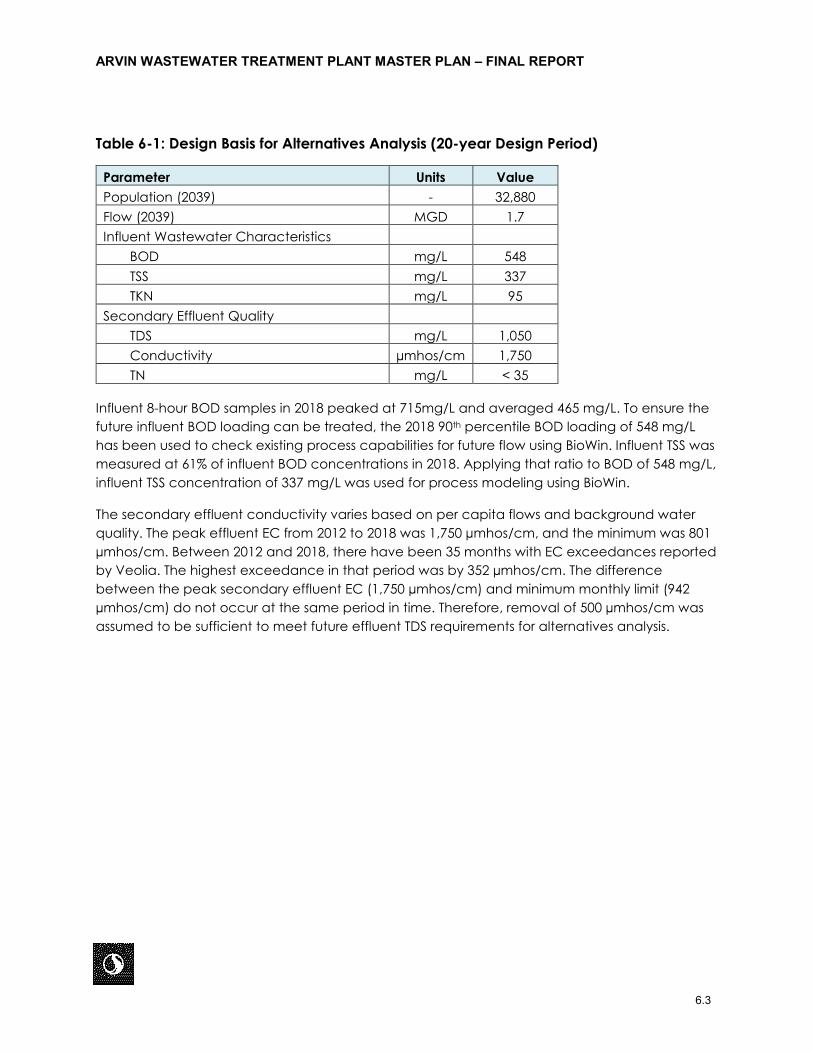
Table 6-1: Design Basis for Alternatives Analysis (20-year Design Period)
Parameter Units Value Population (2039) - 32,880 Flow (2039) MGD 1.7 Influent Wastewater Characteristics
BOD mg/L 548 TSS mg/L 337 TKN mg/L 95
Secondary Effluent Quality TDS mg/L 1,050 Conductivity µmhos/cm 1,750 TN mg/L < 35
Influent 8-hour BOD samples in 2018 peaked at 715mg/L and averaged 465 mg/L. To ensure the future influent BOD loading can be treated, the 2018 90th percentile BOD loading of 548 mg/L has been used to check existing process capabilities for future flow using BioWin. Influent TSS was measured at 61% of influent BOD concentrations in 2018. Applying that ratio to BOD of 548 mg/L, influent TSS concentration of 337 mg/L was used for process modeling using BioWin.
The secondary effluent conductivity varies based on per capita flows and background water quality. The peak effluent EC from 2012 to 2018 was 1,750 µmhos/cm, and the minimum was 801 µmhos/cm. Between 2012 and 2018, there have been 35 months with EC exceedances reported by Veolia. The highest exceedance in that period was by 352 µmhos/cm. The difference between the peak secondary effluent EC (1,750 µmhos/cm) and minimum monthly limit (942 µmhos/cm) do not occur at the same period in time. Therefore, removal of 500 µmhos/cm was assumed to be sufficient to meet future effluent TDS requirements for alternatives analysis.
ARVIN WASTEWATER TREATMENT PLANT MASTER PLAN – FINAL REPORT
6.4
Figure 6-3: Historical and Projected Influent BOD Loading for the Arvin WWTP
3,775 (2017)
7,707 (2039)
0
1,000
2,000
3,000
4,000
5,000
6,000
7,000
8,000
9,000
1995 2000 2005 2010 2015 2020 2025 2030 2035 2040 2045
BOD
Load
ing
(lb/d
)
Year
Historical Influent BOD Loading (lb/d) Projected Influent BOD Loading (lb/d)
ARVIN WASTEWATER TREATMENT PLANT MASTER PLAN – FINAL REPORT
7.1
7.0 ALTERNATIVES ANALYSIS FOR EFFLUENT DESTINATION The City currently utilizes the entire plant effluent for a single end use – land application for crop production. However, crops grown around the City of Arvin have been changing over time from row crops to permanent crops, as reported by Quad-Knopf. This evolution reduces the potential land application area that the current effluent can be used for since the undisinfected secondary effluent cannot be used on crops for human consumption. Therefore, the City is anticipating that the effluent water quality requirements for land application for crop production will change from the current undisinfected secondary effluent to a disinfected tertiary effluent. Due to the uncertainty of the continuation of land application for fodder crops, as well as the need to meet total nitrogen and TDS limits, the City is evaluating option to determine the most cost-effective, long-term solution for recycled water end use.
Stantec was asked by the City to evaluate four potential effluent destinations with a total of six treatment alternatives as follows:
• Alternative 1 - Land Application for Crop Production
o 1A - Disinfected Tertiary
o 1B - Disinfected Tertiary with Side-stream MF+RO with Salinity Management
• Alternative 2 - Groundwater Recharge via Surface Spreading
o 2A - 100% RWC
o 2B – 100% RWC with Subsurface Piping (Leach Fields)
• Alternative 3 - Groundwater Recharge via Surface Spreading by Arvin Edison Water Storage District (AEWSD) using 100% Recycled Water
• Alternative 4 - Groundwater Recharge via Direct Injection
Depending on the end use, varying level of treatment may be required:
- An anoxic tank will be required to achieve additional biological denitrification to lower the effluent TN concentration.
- Filtration followed by disinfection will be required to produced disinfected tertiary effluent for certain end uses.
- Treatment by RO may become necessary for groundwater recharge applications either via surface spreading or direct injection and/or TDS reduction.
- Ultraviolet/Advanced Oxidation Process (UV/AOP) for disinfection and removal of other constituents will be required downstream of the RO for groundwater recharge via direct injection.
ARVIN WASTEWATER TREATMENT PLANT MASTER PLAN – FINAL REPORT
7.2
The lined evaporation basins used for RO Brine disposal are a significant cost for each alternative analyzed that uses RO. To reduce the brine disposal volume, advanced technologies such as Closed-Circuit Desalination (CCD) can be used that can increase the overall recovery from 85% to 95%. Although this adds to the equipment cost, it may substantially reduce the costs for evaporation ponds. Use of RO with CCD is assumed for alternatives in this analysis that require RO.
The following sections explain the treatment needs for each end use of the effluent and the associated treatment costs.
7.1 ALTERNATIVE 1 - LAND APPLICATION FOR CROP PRODUCTION
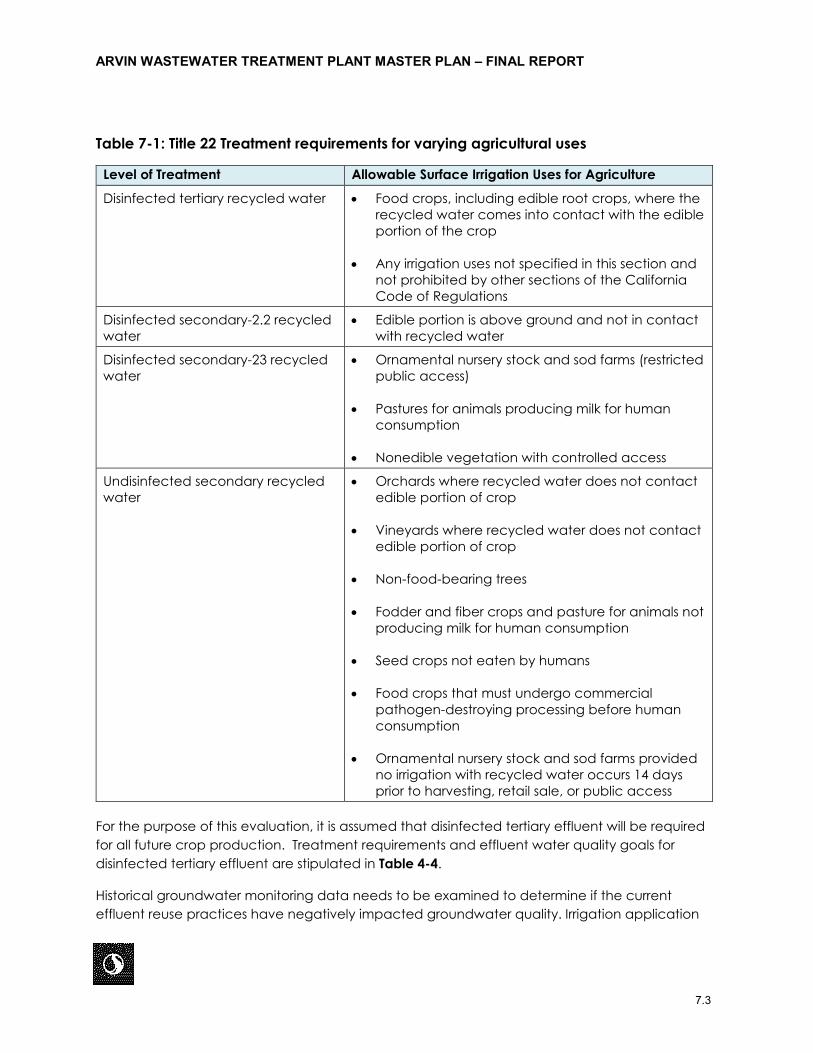
The Arvin WWTP is currently producing undisinfected secondary effluent suitable for restricted agricultural use for fodder and fiber crops and pasture for animals not producing milk for human consumption. Title 22 requirements stipulate four levels of treatment requirements for various agricultural uses, as described in Table 7-1.
Depending on the agricultural application, the effluent has to achieve one of the following levels of treatment:
- Undisinfected secondary effluent,
- Disinfected secondary effluent meeting 23 total coliforms per 100 mL,
- Disinfected secondary effluent meeting 2.2 total coliforms per 100 mL, or
- Disinfected tertiary recycled water.
ARVIN WASTEWATER TREATMENT PLANT MASTER PLAN – FINAL REPORT
7.3
Table 7-1: Title 22 Treatment requirements for varying agricultural uses
Level of Treatment Allowable Surface Irrigation Uses for Agriculture
Disinfected tertiary recycled water • Food crops, including edible root crops, where the recycled water comes into contact with the edible portion of the crop
• Any irrigation uses not specified in this section and not prohibited by other sections of the California Code of Regulations
Disinfected secondary-2.2 recycled water
• Edible portion is above ground and not in contact with recycled water
Disinfected secondary-23 recycled water
• Ornamental nursery stock and sod farms (restricted public access)
• Pastures for animals producing milk for human consumption
• Nonedible vegetation with controlled access
Undisinfected secondary recycled water
• Orchards where recycled water does not contact edible portion of crop
• Vineyards where recycled water does not contact edible portion of crop
• Non-food-bearing trees
• Fodder and fiber crops and pasture for animals not producing milk for human consumption
• Seed crops not eaten by humans
• Food crops that must undergo commercial pathogen-destroying processing before human consumption
• Ornamental nursery stock and sod farms provided no irrigation with recycled water occurs 14 days prior to harvesting, retail sale, or public access
For the purpose of this evaluation, it is assumed that disinfected tertiary effluent will be required for all future crop production. Treatment requirements and effluent water quality goals for disinfected tertiary effluent are stipulated in Table 4-4.
Historical groundwater monitoring data needs to be examined to determine if the current effluent reuse practices have negatively impacted groundwater quality. Irrigation application
ARVIN WASTEWATER TREATMENT PLANT MASTER PLAN – FINAL REPORT
7.4
rates, crop uptake of nitrogen, and soil aquifer treatment (SAT) may result in current compliance. If the current practices have not impacted groundwater in excess of the permitted levels, the City may choose to continue producing undisinfected secondary effluent and acquire more land for land application as the effluent flow increases in future. Such action would eliminate the need for tertiary treatment and disinfection as well as have a guaranteed location for effluent use in the future.
In order to diversify the use of effluent for land application, production of disinfected tertiary effluent may be necessary. The Arvin WWTP will need to add filtration and disinfection facilities to produce a disinfected tertiary effluent.
In addition to meeting the turbidity and total coliform requirements for disinfected tertiary effluent, some additional treatment may be necessary for total nitrogen and conductivity removal. These treatment requirements need to be confirmed after examining the historical groundwater monitoring data. For the purpose of this analysis, two alternatives were evaluated for this effluent destination:
• Alternative 1A – Land Application for Crop Production with Disinfected Tertiary Effluent
• Alternative 1B – Land Application for Crop Production with Disinfected Tertiary Effluent plus Salinity Management
Both alternatives assume the addition of an anoxic tank for denitrification whereas Alternative 1B also include the addition of a sidestream MF+RO system for salinity management/TDS reduction.
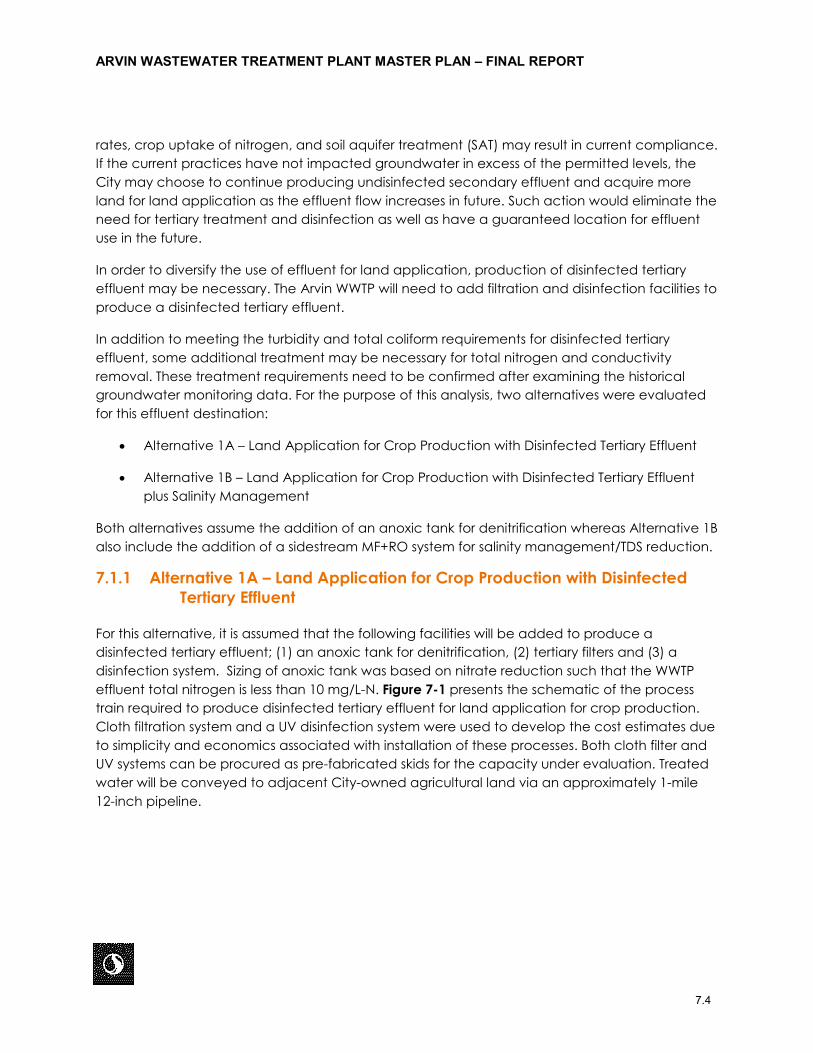
7.1.1 Alternative 1A – Land Application for Crop Production with Disinfected Tertiary Effluent
For this alternative, it is assumed that the following facilities will be added to produce a disinfected tertiary effluent; (1) an anoxic tank for denitrification, (2) tertiary filters and (3) a disinfection system. Sizing of anoxic tank was based on nitrate reduction such that the WWTP effluent total nitrogen is less than 10 mg/L-N. Figure 7-1 presents the schematic of the process train required to produce disinfected tertiary effluent for land application for crop production. Cloth filtration system and a UV disinfection system were used to develop the cost estimates due to simplicity and economics associated with installation of these processes. Both cloth filter and UV systems can be procured as pre-fabricated skids for the capacity under evaluation. Treated water will be conveyed to adjacent City-owned agricultural land via an approximately 1-mile 12-inch pipeline.
ARVIN WASTEWATER TREATMENT PLANT MASTER PLAN – FINAL REPORT
7.5
Figure 7-1: Process Schematic to Produce Disinfected Tertiary Effluent for Land Application for Crop production
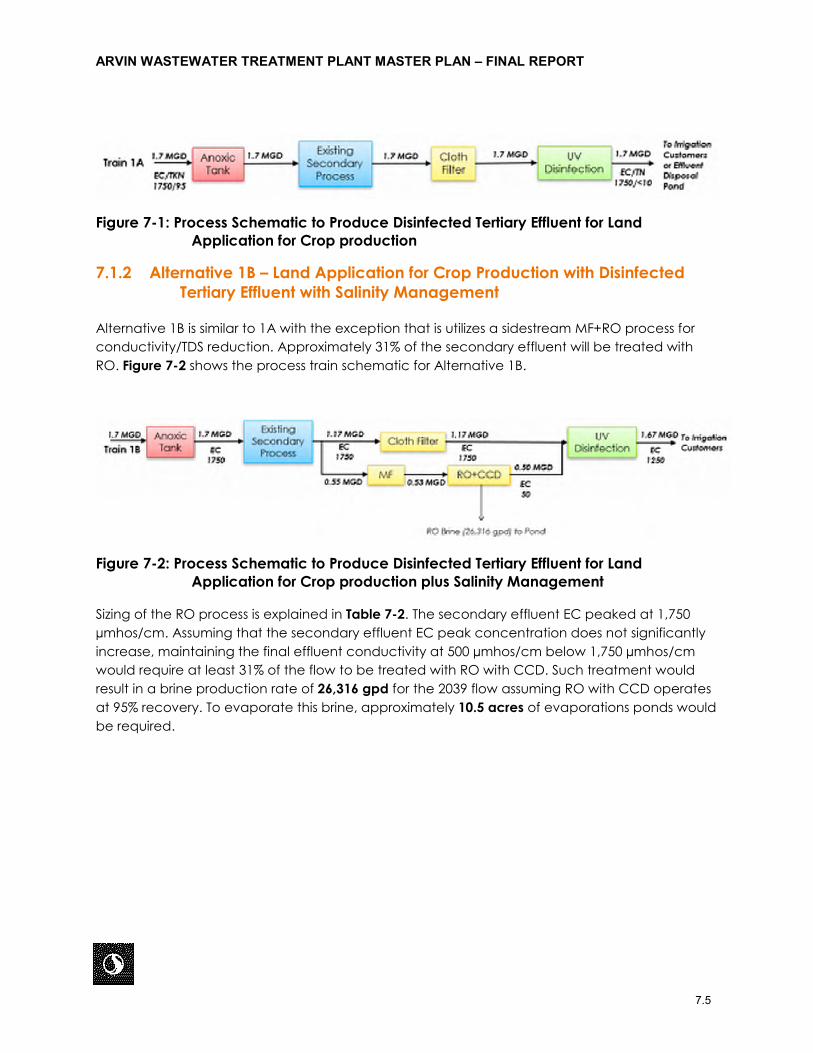
7.1.2 Alternative 1B – Land Application for Crop Production with Disinfected Tertiary Effluent with Salinity Management
Alternative 1B is similar to 1A with the exception that is utilizes a sidestream MF+RO process for conductivity/TDS reduction. Approximately 31% of the secondary effluent will be treated with RO. Figure 7-2 shows the process train schematic for Alternative 1B.
Figure 7-2: Process Schematic to Produce Disinfected Tertiary Effluent for Land Application for Crop production plus Salinity Management
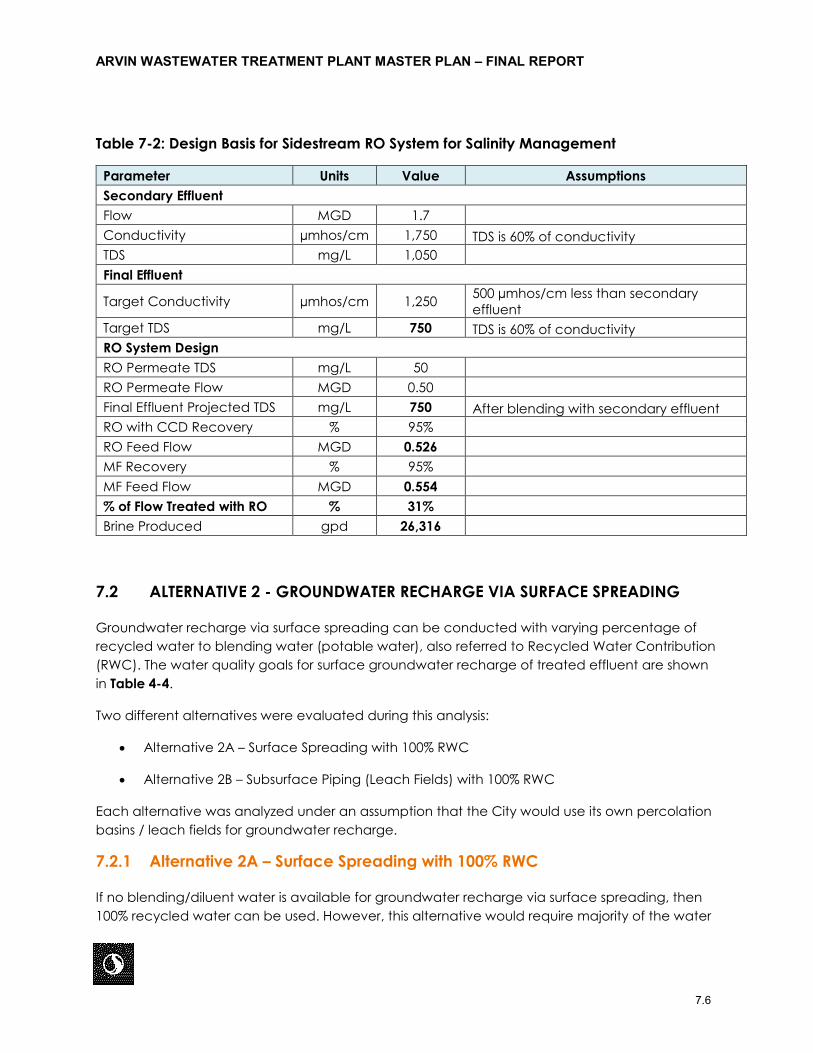
Sizing of the RO process is explained in Table 7-2. The secondary effluent EC peaked at 1,750 µmhos/cm. Assuming that the secondary effluent EC peak concentration does not significantly increase, maintaining the final effluent conductivity at 500 µmhos/cm below 1,750 µmhos/cm would require at least 31% of the flow to be treated with RO with CCD. Such treatment would result in a brine production rate of 26,316 gpd for the 2039 flow assuming RO with CCD operates at 95% recovery. To evaporate this brine, approximately 10.5 acres of evaporations ponds would be required.
ARVIN WASTEWATER TREATMENT PLANT MASTER PLAN – FINAL REPORT
7.6
Table 7-2: Design Basis for Sidestream RO System for Salinity Management
Parameter Units Value Assumptions Secondary Effluent Flow MGD 1.7 Conductivity µmhos/cm 1,750 TDS is 60% of conductivity TDS mg/L 1,050 Final Effluent
Target Conductivity µmhos/cm 1,250 500 µmhos/cm less than secondary effluent
Target TDS mg/L 750 TDS is 60% of conductivity RO System Design RO Permeate TDS mg/L 50 RO Permeate Flow MGD 0.50 Final Effluent Projected TDS mg/L 750 After blending with secondary effluent RO with CCD Recovery % 95% RO Feed Flow MGD 0.526 MF Recovery % 95% MF Feed Flow MGD 0.554 % of Flow Treated with RO % 31% Brine Produced gpd 26,316
7.2 ALTERNATIVE 2 - GROUNDWATER RECHARGE VIA SURFACE SPREADING
Groundwater recharge via surface spreading can be conducted with varying percentage of recycled water to blending water (potable water), also referred to Recycled Water Contribution (RWC). The water quality goals for surface groundwater recharge of treated effluent are shown in Table 4-4.
Two different alternatives were evaluated during this analysis:
• Alternative 2A – Surface Spreading with 100% RWC
• Alternative 2B – Subsurface Piping (Leach Fields) with 100% RWC
Each alternative was analyzed under an assumption that the City would use its own percolation basins / leach fields for groundwater recharge.
7.2.1 Alternative 2A – Surface Spreading with 100% RWC
If no blending/diluent water is available for groundwater recharge via surface spreading, then 100% recycled water can be used. However, this alternative would require majority of the water
ARVIN WASTEWATER TREATMENT PLANT MASTER PLAN – FINAL REPORT
7.7
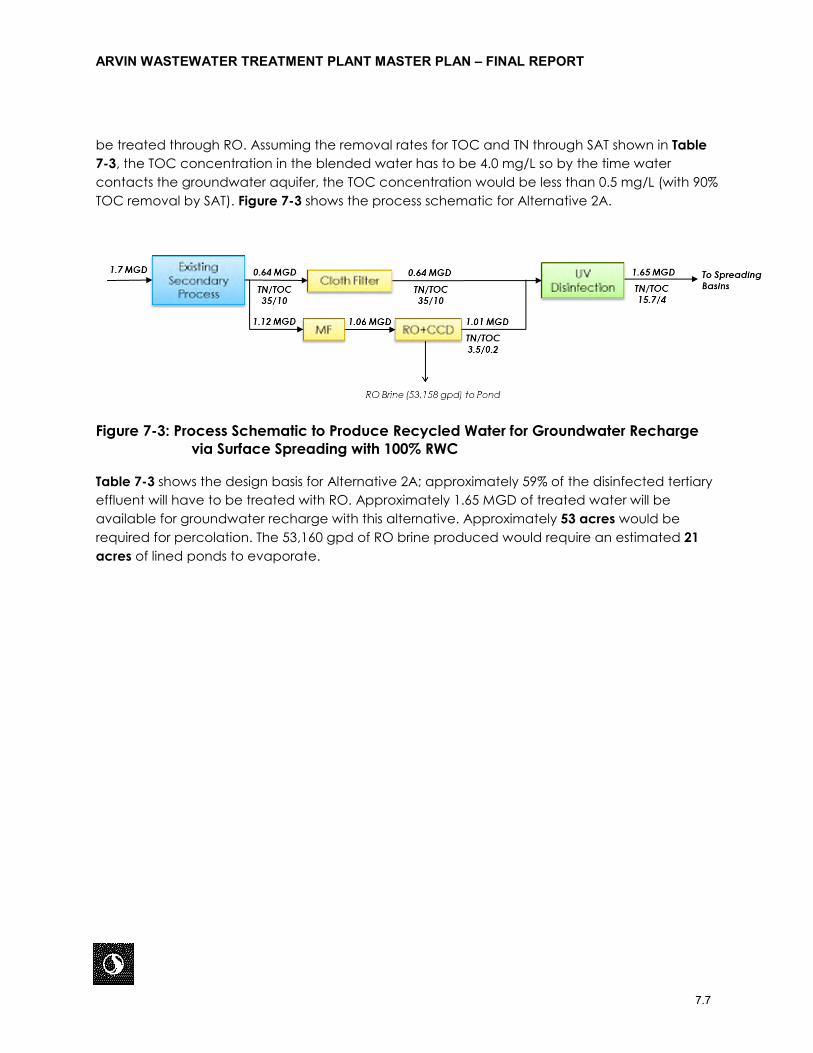
be treated through RO. Assuming the removal rates for TOC and TN through SAT shown in Table 7-3, the TOC concentration in the blended water has to be 4.0 mg/L so by the time water contacts the groundwater aquifer, the TOC concentration would be less than 0.5 mg/L (with 90% TOC removal by SAT). Figure 7-3 shows the process schematic for Alternative 2A.
Figure 7-3: Process Schematic to Produce Recycled Water for Groundwater Recharge via Surface Spreading with 100% RWC
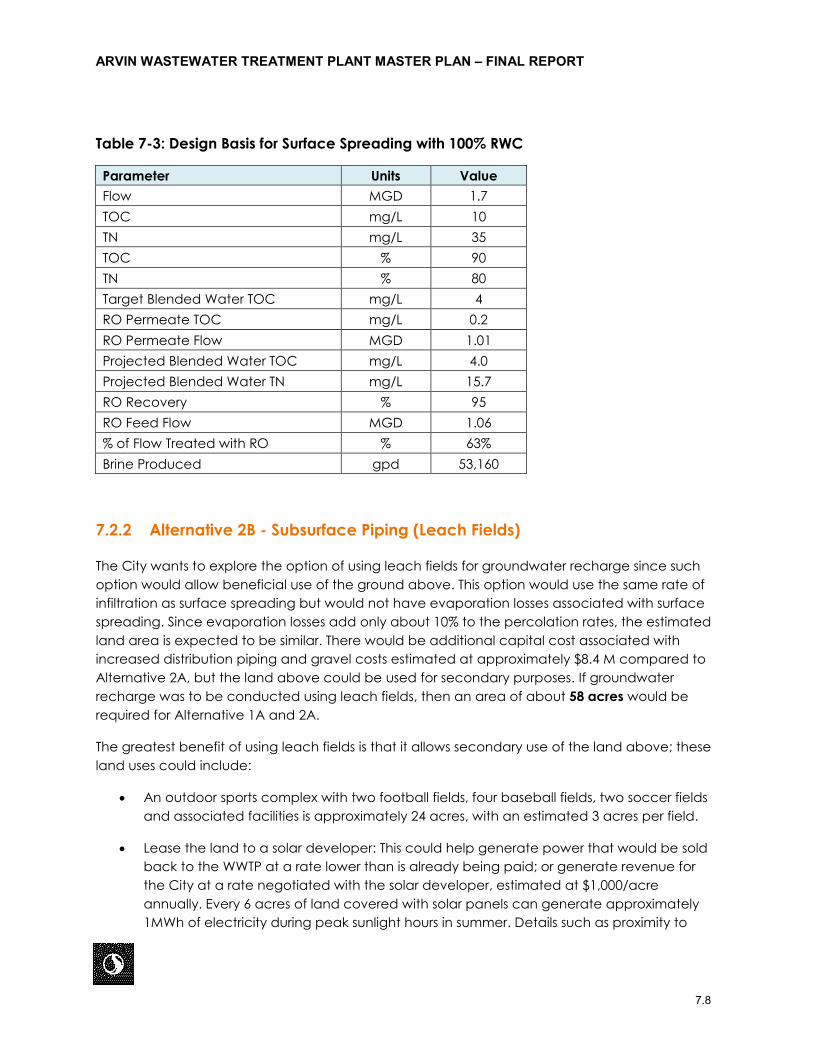
Table 7-3 shows the design basis for Alternative 2A; approximately 59% of the disinfected tertiary effluent will have to be treated with RO. Approximately 1.65 MGD of treated water will be available for groundwater recharge with this alternative. Approximately 53 acres would be required for percolation. The 53,160 gpd of RO brine produced would require an estimated 21 acres of lined ponds to evaporate.
ARVIN WASTEWATER TREATMENT PLANT MASTER PLAN – FINAL REPORT
7.8
Table 7-3: Design Basis for Surface Spreading with 100% RWC
Parameter Units Value Flow MGD 1.7 TOC mg/L 10 TN mg/L 35 TOC % 90 TN % 80 Target Blended Water TOC mg/L 4 RO Permeate TOC mg/L 0.2 RO Permeate Flow MGD 1.01 Projected Blended Water TOC mg/L 4.0 Projected Blended Water TN mg/L 15.7 RO Recovery % 95 RO Feed Flow MGD 1.06 % of Flow Treated with RO % 63% Brine Produced gpd 53,160
7.2.2 Alternative 2B - Subsurface Piping (Leach Fields)
The City wants to explore the option of using leach fields for groundwater recharge since such option would allow beneficial use of the ground above. This option would use the same rate of infiltration as surface spreading but would not have evaporation losses associated with surface spreading. Since evaporation losses add only about 10% to the percolation rates, the estimated land area is expected to be similar. There would be additional capital cost associated with increased distribution piping and gravel costs estimated at approximately $8.4 M compared to Alternative 2A, but the land above could be used for secondary purposes. If groundwater recharge was to be conducted using leach fields, then an area of about 58 acres would be required for Alternative 1A and 2A.
The greatest benefit of using leach fields is that it allows secondary use of the land above; these land uses could include:
• An outdoor sports complex with two football fields, four baseball fields, two soccer fields and associated facilities is approximately 24 acres, with an estimated 3 acres per field.
• Lease the land to a solar developer: This could help generate power that would be sold back to the WWTP at a rate lower than is already being paid; or generate revenue for the City at a rate negotiated with the solar developer, estimated at $1,000/acre annually. Every 6 acres of land covered with solar panels can generate approximately 1MWh of electricity during peak sunlight hours in summer. Details such as proximity to
ARVIN WASTEWATER TREATMENT PLANT MASTER PLAN – FINAL REPORT
7.9
existing transmission lines and a market for the power generated, such as to a Community Choice Aggregation, would need to be further discussed with the solar generator. It may be possible that the developer may not want to use all available land, depending on power demand in the area. Typical lease lengths are a minimum of 20 years.
7.3 ALTERNATIVE 3 – GROUNDWATER RECHARGE VIA SURFACE SPREADING BY ARVIN EDISON WATER STORAGE DISTRICT
The AEWSD is interested in utilizing the treated effluent from the Arvin WWTP provided the effluent meets the requirements for groundwater recharge via surface spreading with 100% RWC. AEWSD has three potential locations for surface spreading. The farthest spreading basin is 5.5 miles from the Arvin WWTP and would require a new conveyance system. For the purpose of this analysis, the conveyance and spreading basins preparation costs have been included in this alternative. The finished water will need to be pumped up to 5.5 miles to the AEWSD for use.
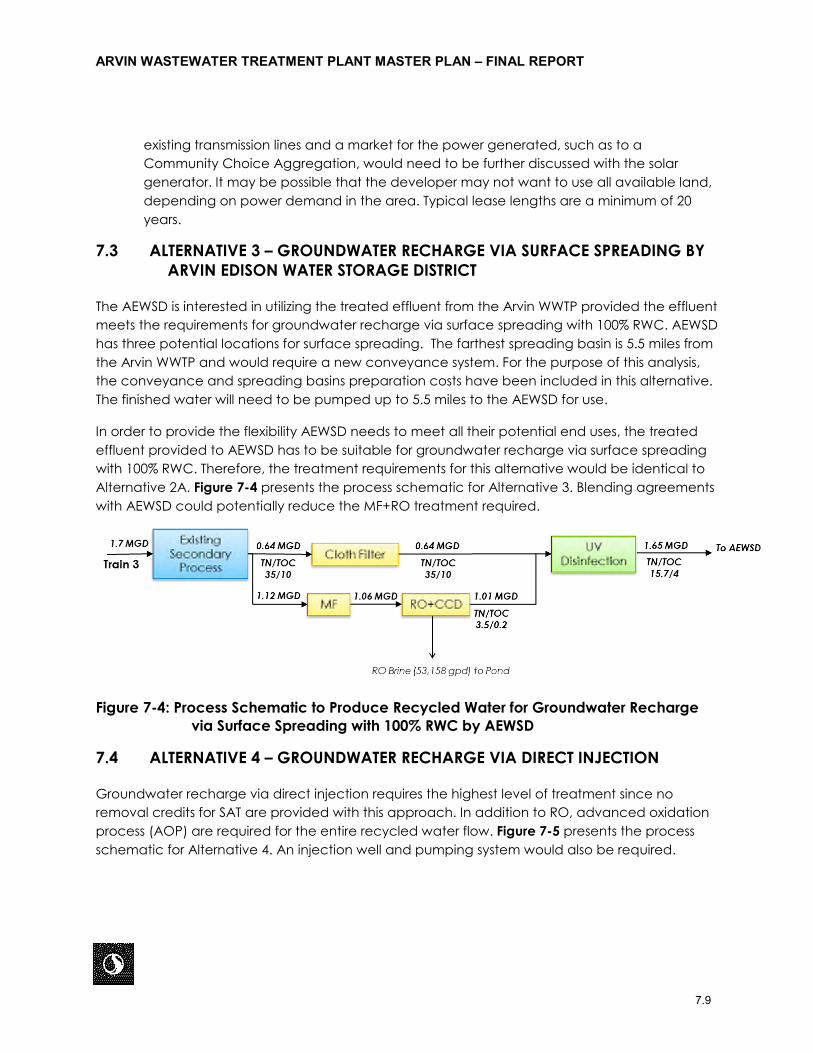
In order to provide the flexibility AEWSD needs to meet all their potential end uses, the treated effluent provided to AEWSD has to be suitable for groundwater recharge via surface spreading with 100% RWC. Therefore, the treatment requirements for this alternative would be identical to Alternative 2A. Figure 7-4 presents the process schematic for Alternative 3. Blending agreements with AEWSD could potentially reduce the MF+RO treatment required.
Figure 7-4: Process Schematic to Produce Recycled Water for Groundwater Recharge via Surface Spreading with 100% RWC by AEWSD
7.4 ALTERNATIVE 4 – GROUNDWATER RECHARGE VIA DIRECT INJECTION
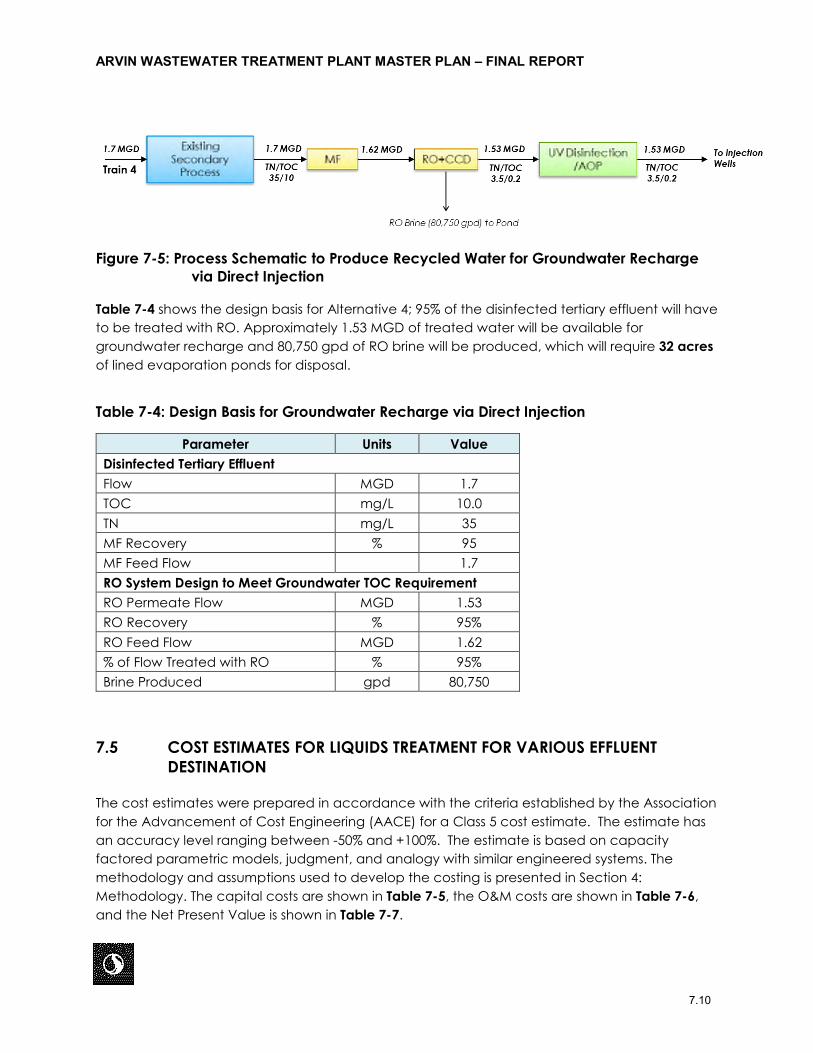
Groundwater recharge via direct injection requires the highest level of treatment since no removal credits for SAT are provided with this approach. In addition to RO, advanced oxidation process (AOP) are required for the entire recycled water flow. Figure 7-5 presents the process schematic for Alternative 4. An injection well and pumping system would also be required.
ARVIN WASTEWATER TREATMENT PLANT MASTER PLAN – FINAL REPORT
7.10
Figure 7-5: Process Schematic to Produce Recycled Water for Groundwater Recharge via Direct Injection
Table 7-4 shows the design basis for Alternative 4; 95% of the disinfected tertiary effluent will have to be treated with RO. Approximately 1.53 MGD of treated water will be available for groundwater recharge and 80,750 gpd of RO brine will be produced, which will require 32 acres of lined evaporation ponds for disposal.
Table 7-4: Design Basis for Groundwater Recharge via Direct Injection
Parameter Units Value Disinfected Tertiary Effluent Flow MGD 1.7 TOC mg/L 10.0 TN mg/L 35 MF Recovery % 95 MF Feed Flow 1.7 RO System Design to Meet Groundwater TOC Requirement RO Permeate Flow MGD 1.53
RO Recovery % 95%
RO Feed Flow MGD 1.62
% of Flow Treated with RO % 95%
Brine Produced gpd 80,750
7.5 COST ESTIMATES FOR LIQUIDS TREATMENT FOR VARIOUS EFFLUENT DESTINATION
The cost estimates were prepared in accordance with the criteria established by the Association for the Advancement of Cost Engineering (AACE) for a Class 5 cost estimate. The estimate has an accuracy level ranging between -50% and +100%. The estimate is based on capacity factored parametric models, judgment, and analogy with similar engineered systems. The methodology and assumptions used to develop the costing is presented in Section 4: Methodology. The capital costs are shown in Table 7-5, the O&M costs are shown in Table 7-6, and the Net Present Value is shown in Table 7-7.
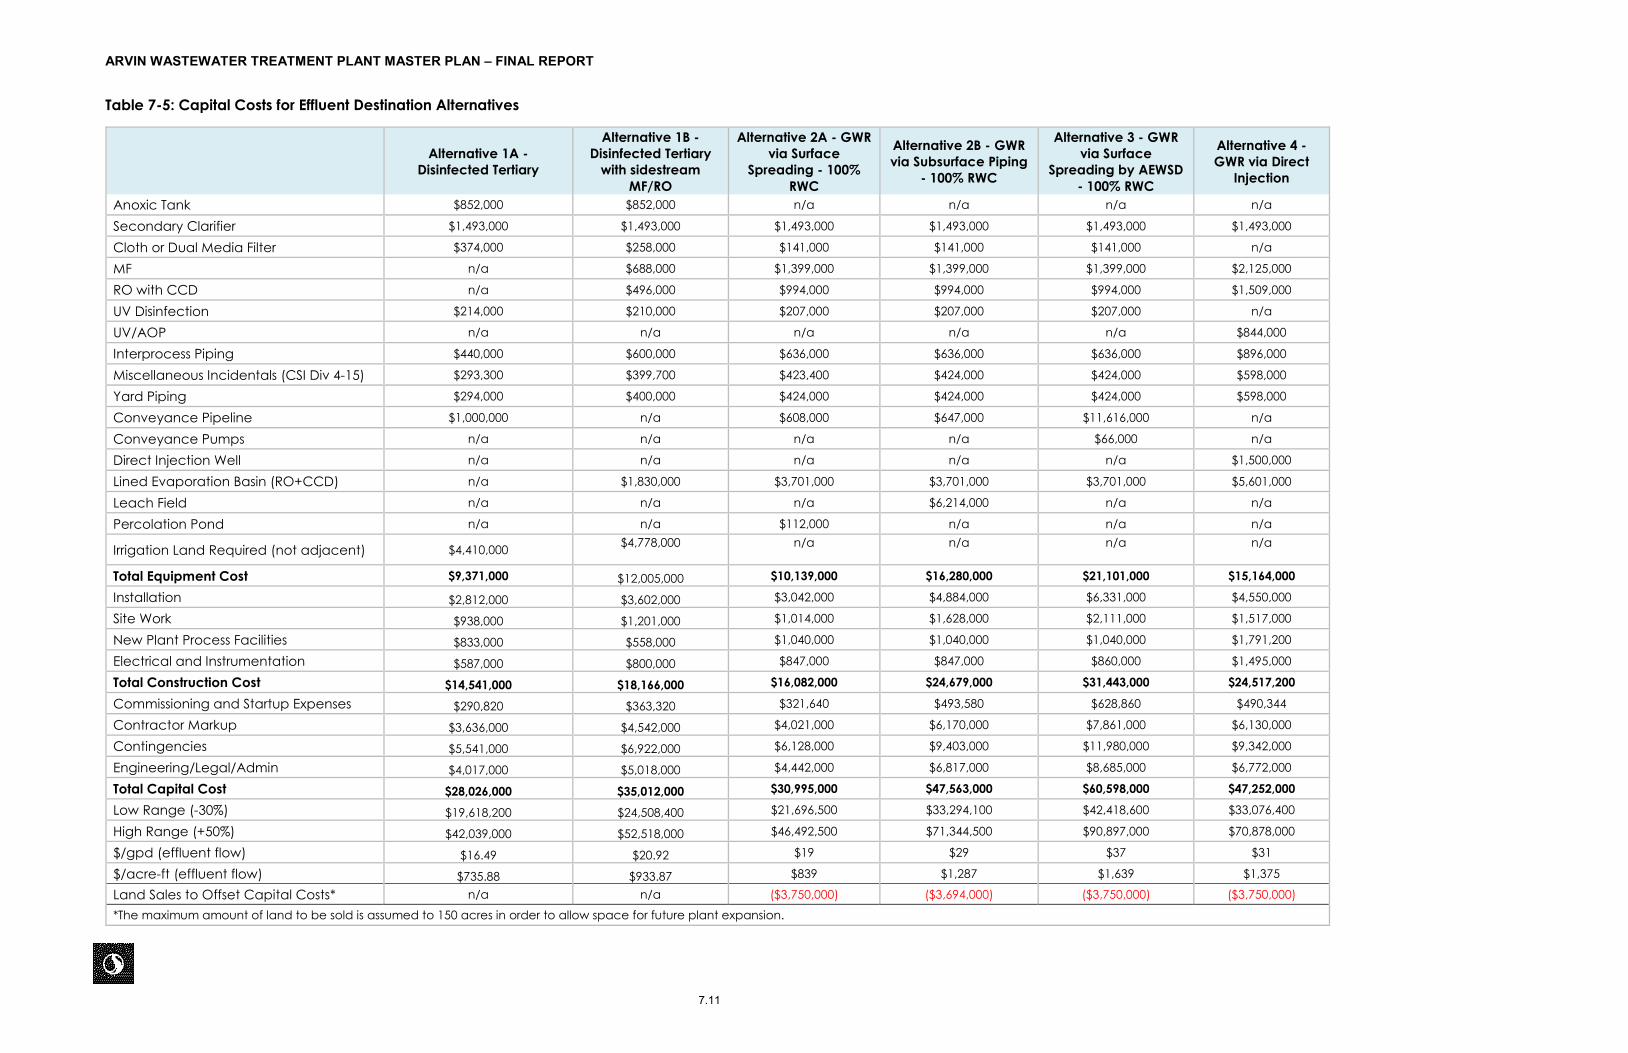
ARVIN WASTEWATER TREATMENT PLANT MASTER PLAN – FINAL REPORT
7.11
Table 7-5: Capital Costs for Effluent Destination Alternatives
Alternative 1A - Disinfected Tertiary
Alternative 1B - Disinfected Tertiary
with sidestream MF/RO
Alternative 2A - GWR via Surface
Spreading - 100% RWC
Alternative 2B - GWR via Subsurface Piping
- 100% RWC
Alternative 3 - GWR via Surface
Spreading by AEWSD - 100% RWC
Alternative 4 - GWR via Direct
Injection
Anoxic Tank $852,000 $852,000 n/a n/a n/a n/a
Secondary Clarifier $1,493,000 $1,493,000 $1,493,000 $1,493,000 $1,493,000 $1,493,000
Cloth or Dual Media Filter $374,000 $258,000 $141,000 $141,000 $141,000 n/a
MF n/a $688,000 $1,399,000 $1,399,000 $1,399,000 $2,125,000
RO with CCD n/a $496,000 $994,000 $994,000 $994,000 $1,509,000
UV Disinfection $214,000 $210,000 $207,000 $207,000 $207,000 n/a
UV/AOP n/a n/a n/a n/a n/a $844,000
Interprocess Piping $440,000 $600,000 $636,000 $636,000 $636,000 $896,000
Miscellaneous Incidentals (CSI Div 4-15) $293,300 $399,700 $423,400 $424,000 $424,000 $598,000
Yard Piping $294,000 $400,000 $424,000 $424,000 $424,000 $598,000
Conveyance Pipeline $1,000,000 n/a $608,000 $647,000 $11,616,000 n/a
Conveyance Pumps n/a n/a n/a n/a $66,000 n/a
Direct Injection Well n/a n/a n/a n/a n/a $1,500,000
Lined Evaporation Basin (RO+CCD) n/a $1,830,000 $3,701,000 $3,701,000 $3,701,000 $5,601,000
Leach Field n/a n/a n/a $6,214,000 n/a n/a
Percolation Pond n/a n/a $112,000 n/a n/a n/a
Irrigation Land Required (not adjacent) $4,410,000 $4,778,000
n/a n/a n/a n/a
Total Equipment Cost $9,371,000 $12,005,000 $10,139,000 $16,280,000 $21,101,000 $15,164,000
Installation $2,812,000 $3,602,000 $3,042,000 $4,884,000 $6,331,000 $4,550,000
Site Work $938,000 $1,201,000 $1,014,000 $1,628,000 $2,111,000 $1,517,000
New Plant Process Facilities $833,000 $558,000 $1,040,000 $1,040,000 $1,040,000 $1,791,200
Electrical and Instrumentation $587,000 $800,000 $847,000 $847,000 $860,000 $1,495,000
Total Construction Cost $14,541,000 $18,166,000 $16,082,000 $24,679,000 $31,443,000 $24,517,200
Commissioning and Startup Expenses $290,820 $363,320 $321,640 $493,580 $628,860 $490,344
Contractor Markup $3,636,000 $4,542,000 $4,021,000 $6,170,000 $7,861,000 $6,130,000
Contingencies $5,541,000 $6,922,000 $6,128,000 $9,403,000 $11,980,000 $9,342,000
Engineering/Legal/Admin $4,017,000 $5,018,000 $4,442,000 $6,817,000 $8,685,000 $6,772,000
Total Capital Cost $28,026,000 $35,012,000 $30,995,000 $47,563,000 $60,598,000 $47,252,000
Low Range (-30%) $19,618,200 $24,508,400 $21,696,500 $33,294,100 $42,418,600 $33,076,400
High Range (+50%) $42,039,000 $52,518,000 $46,492,500 $71,344,500 $90,897,000 $70,878,000
$/gpd (effluent flow) $16.49 $20.92 $19 $29 $37 $31
$/acre-ft (effluent flow) $735.88 $933.87 $839 $1,287 $1,639 $1,375
Land Sales to Offset Capital Costs* n/a n/a ($3,750,000) ($3,694,000) ($3,750,000) ($3,750,000)
*The maximum amount of land to be sold is assumed to 150 acres in order to allow space for future plant expansion.
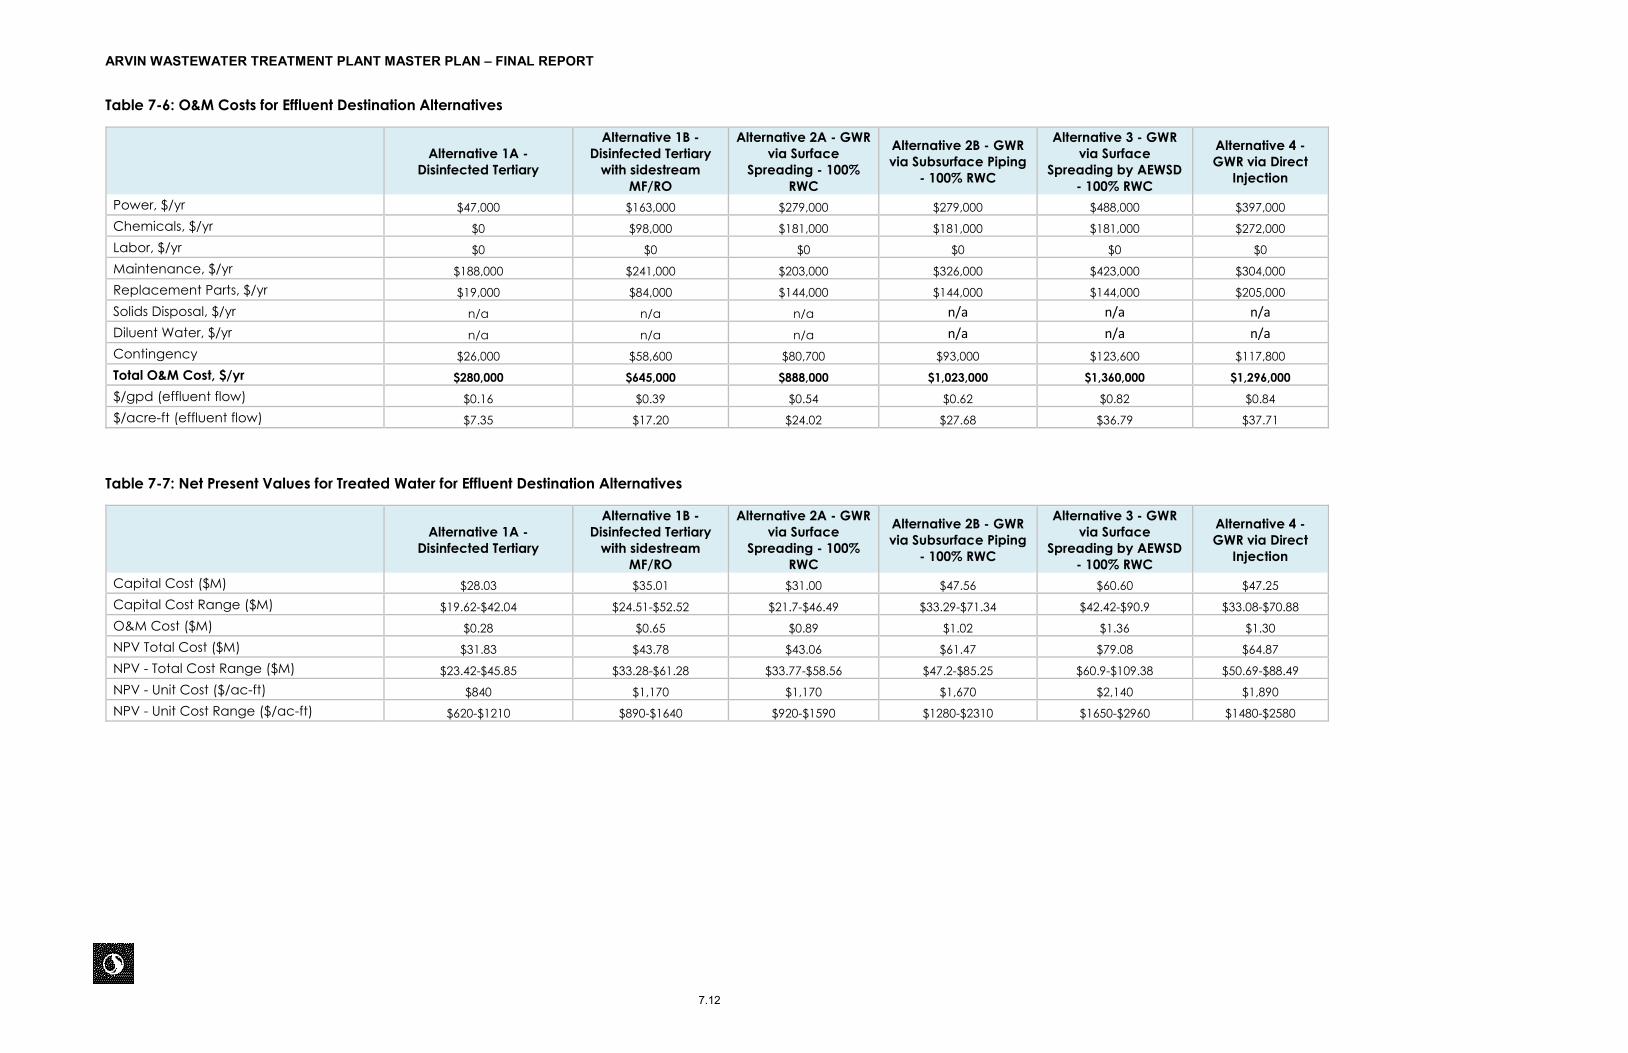
ARVIN WASTEWATER TREATMENT PLANT MASTER PLAN – FINAL REPORT
7.12
Table 7-6: O&M Costs for Effluent Destination Alternatives
Alternative 1A - Disinfected Tertiary
Alternative 1B - Disinfected Tertiary
with sidestream MF/RO
Alternative 2A - GWR via Surface
Spreading - 100% RWC
Alternative 2B - GWR via Subsurface Piping
- 100% RWC
Alternative 3 - GWR via Surface
Spreading by AEWSD - 100% RWC
Alternative 4 - GWR via Direct
Injection
Power, $/yr $47,000 $163,000 $279,000 $279,000 $488,000 $397,000 Chemicals, $/yr $0 $98,000 $181,000 $181,000 $181,000 $272,000 Labor, $/yr $0 $0 $0 $0 $0 $0 Maintenance, $/yr $188,000 $241,000 $203,000 $326,000 $423,000 $304,000 Replacement Parts, $/yr $19,000 $84,000 $144,000 $144,000 $144,000 $205,000 Solids Disposal, $/yr n/a n/a n/a n/a n/a n/a
Diluent Water, $/yr n/a n/a n/a n/a n/a n/a Contingency $26,000 $58,600 $80,700 $93,000 $123,600 $117,800 Total O&M Cost, $/yr $280,000 $645,000 $888,000 $1,023,000 $1,360,000 $1,296,000 $/gpd (effluent flow) $0.16 $0.39 $0.54 $0.62 $0.82 $0.84 $/acre-ft (effluent flow) $7.35 $17.20 $24.02 $27.68 $36.79 $37.71
Table 7-7: Net Present Values for Treated Water for Effluent Destination Alternatives
Alternative 1A - Disinfected Tertiary
Alternative 1B - Disinfected Tertiary
with sidestream MF/RO
Alternative 2A - GWR via Surface
Spreading - 100% RWC
Alternative 2B - GWR via Subsurface Piping
- 100% RWC
Alternative 3 - GWR via Surface
Spreading by AEWSD - 100% RWC
Alternative 4 - GWR via Direct
Injection
Capital Cost ($M) $28.03 $35.01 $31.00 $47.56 $60.60 $47.25 Capital Cost Range ($M) $19.62-$42.04 $24.51-$52.52 $21.7-$46.49 $33.29-$71.34 $42.42-$90.9 $33.08-$70.88 O&M Cost ($M) $0.28 $0.65 $0.89 $1.02 $1.36 $1.30 NPV Total Cost ($M) $31.83 $43.78 $43.06 $61.47 $79.08 $64.87 NPV - Total Cost Range ($M) $23.42-$45.85 $33.28-$61.28 $33.77-$58.56 $47.2-$85.25 $60.9-$109.38 $50.69-$88.49 NPV - Unit Cost ($/ac-ft) $840 $1,170 $1,170 $1,670 $2,140 $1,890 NPV - Unit Cost Range ($/ac-ft) $620-$1210 $890-$1640 $920-$1590 $1280-$2310 $1650-$2960 $1480-$2580
ARVIN WASTEWATER TREATMENT PLANT MASTER PLAN – FINAL REPORT
7.1
7.6 RECOMMENDATION FOR EFFLUENT DESTINATION AND PROPOSED TREATMENT TRAIN
Among the four effluent destination alternatives evaluated, Alternative 1A (disinfected tertiary effluent for continued use of effluent for irrigation) was found to be most economical since it does not require desalination. Other alternatives require varying degrees of desalination for either salinity management and/or to achieve total organic carbon (TOC) removal for groundwater recharge. The net present value (NPV) per acre-foot (ac-ft) of treated water to produce disinfected tertiary effluent was estimated at $840/ac-ft whereas that for the other alternatives ranged from $1,170-$2,140/ac-ft. The secondary effluent currently produced by the Arvin WWTP cannot be used for certain irrigation applications such as food crop irritation. Producing disinfected tertiary effluent would allow the City to use treated water for unrestricted irrigation; the water can also be disposed via effluent disposal ponds. It should be noted that disposing the effluent via disposal ponds would require higher degree of nitrogen removal than the Arvin WWTP is currently achieving. Such treatment would necessitate addition of an anoxic tank. A redundant secondary clarifier is also deemed necessary by the plant operations staff. And finally, a filtration and disinfection system would be required to produce disinfected tertiary effluent.
Disinfected tertiary effluent can also be produced by using a Membrane Bioreactor (MBR) process. MBR uses membranes instead of secondary clarifiers for solids separation; high level of solids removal by membranes also eliminates the need for a downstream filtration system. Since membranes can filter mixed liquor concentration of up to 12,000 mg/L, the MBR process can increase the plant capacity substantially (2-3 times) within the same footprint. If City chooses to upgrade the liquids treatment at the Arvin WWTP to produce disinfected tertiary effluent then Stantec recommends upgrading the existing Orbal® process to an MBR, while taking the other oxidation ditch train out of service. Such upgrade would require addition of fine screens at the headworks, upgrade of aeration system for the Orbal® to get higher oxygen transfer and addition of membrane filtration systems downstream of the Orbal®.
Converting the Orbal® to an MBR would provide following advantages:
• Increases the capacity of the Orbal® train to meet the future flows and loadings thereby eliminating the need to operate the second oxidation ditch train
• Eliminates the need to add an anoxic tank, redundant secondary clarifier and a cloth filter; fewer processes to operate and maintain
• Prepares the WWTP to produce disinfected tertiary effluent by simply adding a UV disinfection system in future
If both oxidation ditch and Orbal trains were to be kept in service, then a redundant secondary clarifier may be required. The NPV for adding an anoxic tank, redundant secondary clarifier and a cloth filter is comparable to installing a membrane filtration system downstream of the Orbal ($720/ac-ft vs $860/ac-ft. Figure 7-6 presents the schematic of the process train required to produce tertiary effluent with MBR. The MBR can be procured as pre-fabricated skids for the
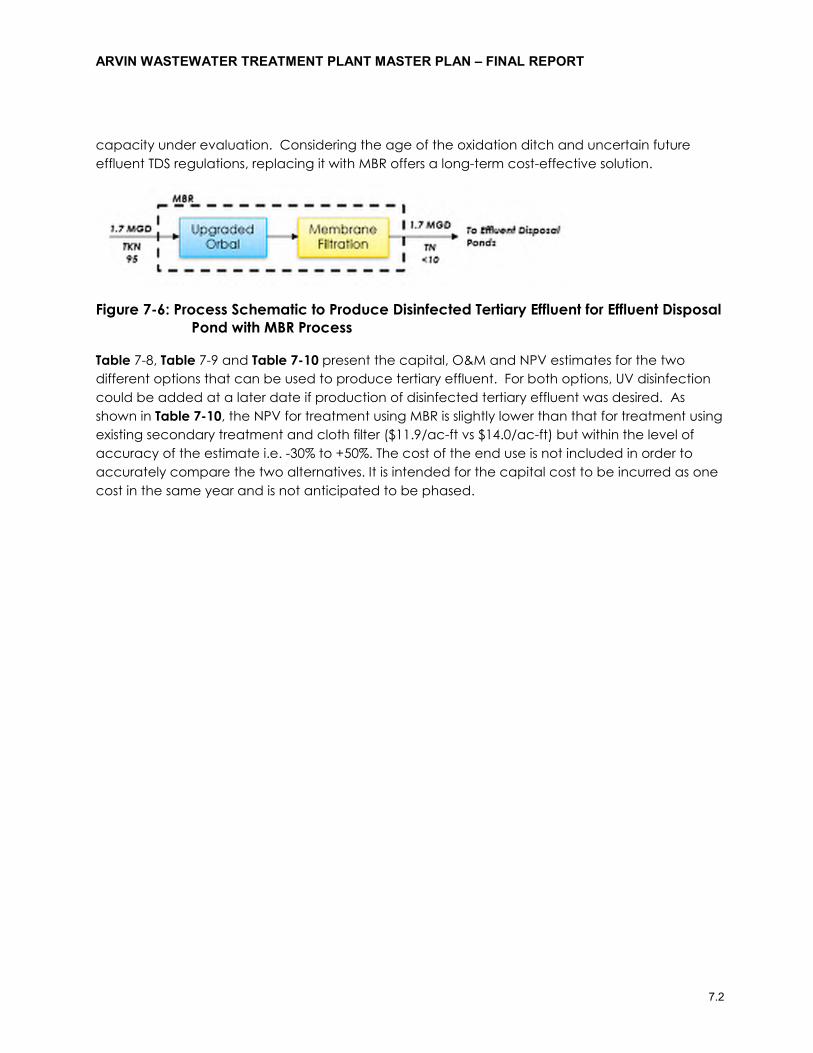
ARVIN WASTEWATER TREATMENT PLANT MASTER PLAN – FINAL REPORT
7.2
capacity under evaluation. Considering the age of the oxidation ditch and uncertain future effluent TDS regulations, replacing it with MBR offers a long-term cost-effective solution.
Figure 7-6: Process Schematic to Produce Disinfected Tertiary Effluent for Effluent Disposal Pond with MBR Process
Table 7-8, Table 7-9 and Table 7-10 present the capital, O&M and NPV estimates for the two different options that can be used to produce tertiary effluent. For both options, UV disinfection could be added at a later date if production of disinfected tertiary effluent was desired. As shown in Table 7-10, the NPV for treatment using MBR is slightly lower than that for treatment using existing secondary treatment and cloth filter ($11.9/ac-ft vs $14.0/ac-ft) but within the level of accuracy of the estimate i.e. -30% to +50%. The cost of the end use is not included in order to accurately compare the two alternatives. It is intended for the capital cost to be incurred as one cost in the same year and is not anticipated to be phased.
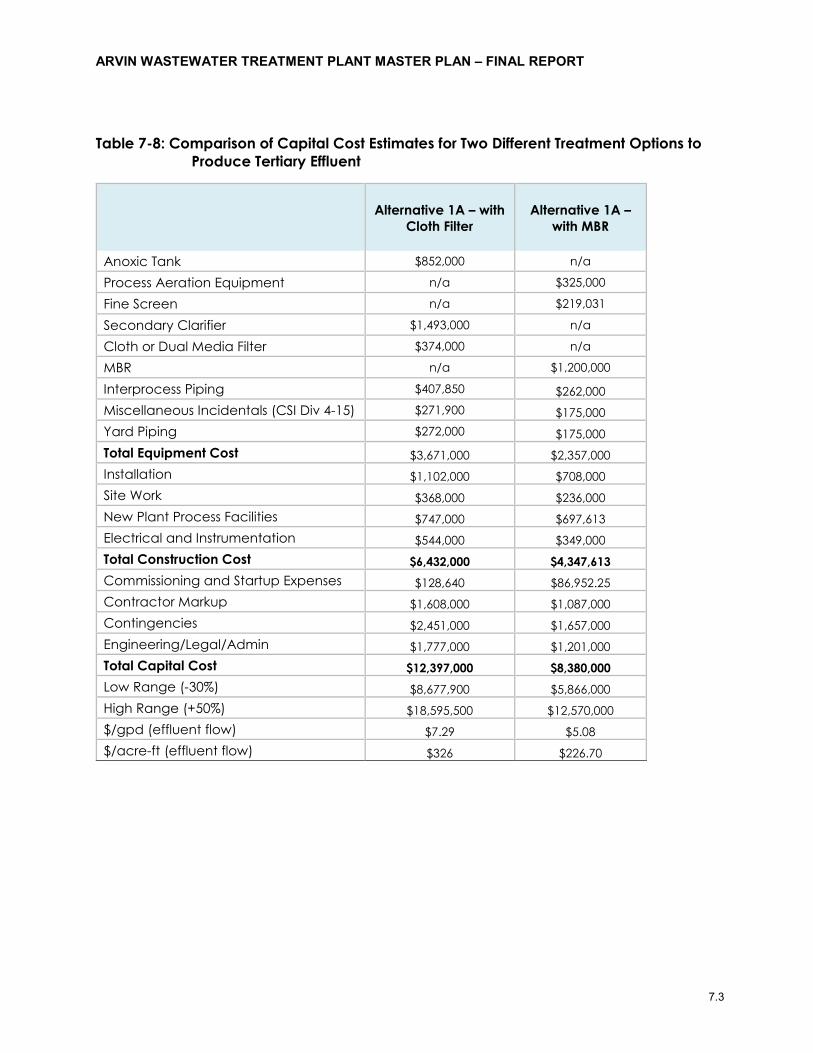
ARVIN WASTEWATER TREATMENT PLANT MASTER PLAN – FINAL REPORT
7.3
Table 7-8: Comparison of Capital Cost Estimates for Two Different Treatment Options to Produce Tertiary Effluent
Alternative 1A – with Cloth Filter
Alternative 1A – with MBR
Anoxic Tank $852,000 n/a
Process Aeration Equipment n/a $325,000
Fine Screen n/a $219,031
Secondary Clarifier $1,493,000 n/a
Cloth or Dual Media Filter $374,000 n/a
MBR n/a $1,200,000
Interprocess Piping $407,850 $262,000 Miscellaneous Incidentals (CSI Div 4-15) $271,900 $175,000 Yard Piping $272,000 $175,000 Total Equipment Cost $3,671,000 $2,357,000 Installation $1,102,000 $708,000 Site Work $368,000 $236,000 New Plant Process Facilities $747,000 $697,613 Electrical and Instrumentation $544,000 $349,000 Total Construction Cost $6,432,000 $4,347,613 Commissioning and Startup Expenses $128,640 $86,952.25 Contractor Markup $1,608,000 $1,087,000 Contingencies $2,451,000 $1,657,000 Engineering/Legal/Admin $1,777,000 $1,201,000 Total Capital Cost $12,397,000 $8,380,000 Low Range (-30%) $8,677,900 $5,866,000 High Range (+50%) $18,595,500 $12,570,000 $/gpd (effluent flow) $7.29 $5.08 $/acre-ft (effluent flow) $326 $226.70
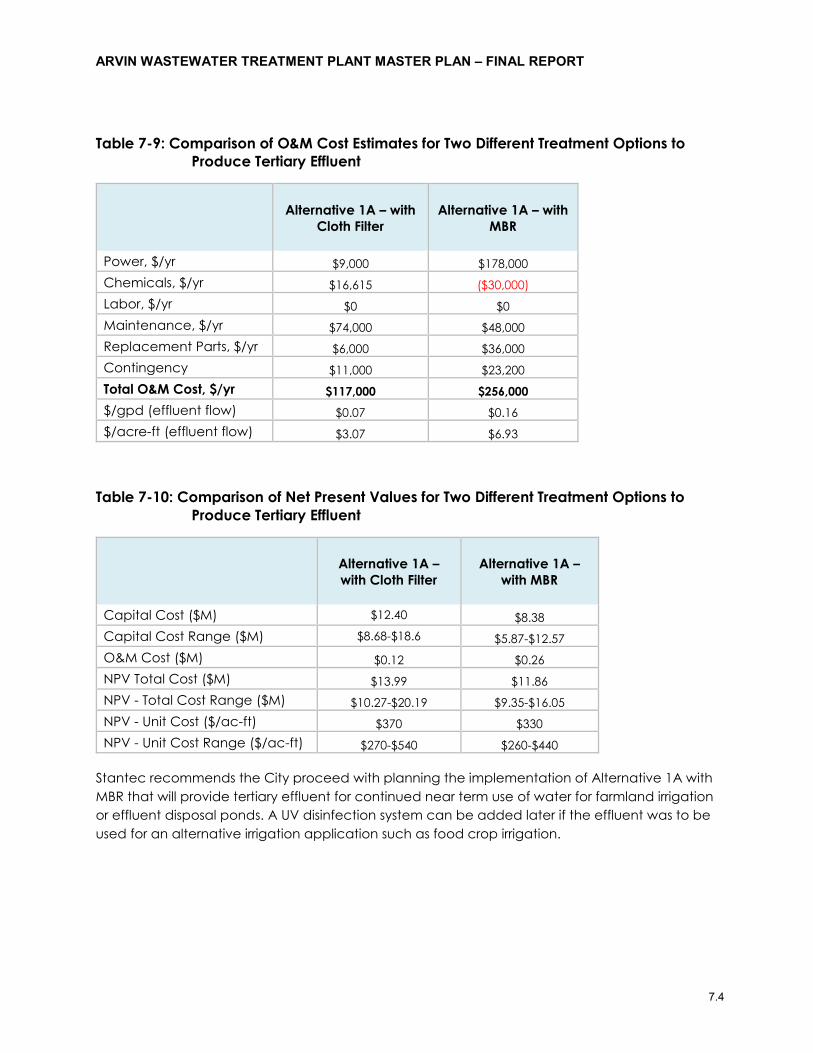
ARVIN WASTEWATER TREATMENT PLANT MASTER PLAN – FINAL REPORT
7.4
Table 7-9: Comparison of O&M Cost Estimates for Two Different Treatment Options to Produce Tertiary Effluent
Alternative 1A – with Cloth Filter
Alternative 1A – with MBR
Power, $/yr $9,000 $178,000 Chemicals, $/yr $16,615 ($30,000) Labor, $/yr $0 $0 Maintenance, $/yr $74,000 $48,000 Replacement Parts, $/yr $6,000 $36,000 Contingency $11,000 $23,200 Total O&M Cost, $/yr $117,000 $256,000 $/gpd (effluent flow) $0.07 $0.16 $/acre-ft (effluent flow) $3.07 $6.93
Table 7-10: Comparison of Net Present Values for Two Different Treatment Options to Produce Tertiary Effluent
Alternative 1A – with Cloth Filter
Alternative 1A – with MBR
Capital Cost ($M) $12.40 $8.38 Capital Cost Range ($M) $8.68-$18.6 $5.87-$12.57 O&M Cost ($M) $0.12 $0.26 NPV Total Cost ($M) $13.99 $11.86 NPV - Total Cost Range ($M) $10.27-$20.19 $9.35-$16.05 NPV - Unit Cost ($/ac-ft) $370 $330 NPV - Unit Cost Range ($/ac-ft) $270-$540 $260-$440
Stantec recommends the City proceed with planning the implementation of Alternative 1A with MBR that will provide tertiary effluent for continued near term use of water for farmland irrigation or effluent disposal ponds. A UV disinfection system can be added later if the effluent was to be used for an alternative irrigation application such as food crop irrigation.
ARVIN WASTEWATER TREATMENT PLANT MASTER PLAN – FINAL REPORT
8.5
8.0 ODOR CONTROL
The Arvin WWTP has received odor complaints in the past from nearby residents. The City has expanded partially in the direction of the Plant, with the closest residences approximately 1,400 feet away. It is unclear if these odors were generated from the Plant or agricultural spreading practices in the area, but based on City’s request, Stantec has prepared a preliminary estimate of odor control for the Plant headworks, dewatering facilities, and solids drying facilities.
All odor control systems contain the following elements:
• Ventilation of working areas: • Capture and collection of foul air; • Treatment of the air to remove odorous compounds; and • Exhaust of the treated air.
8.1 REGULATORY REQUIREMENTS
The National Fire Protection Agency (NFPA) Standard 820 provides standards of ventilation established to prevent fire and explosion within wastewater treatment facilities. The ventilation rates for various areas of WWTPs depend on the type of electrical equipment used in those areas. The Arvin WWTP process areas being treated will be completely enclosed. The NFPA ventilation standard for enclosed aeration zones is 12 air changes per hour if the electrical equipment has a National Electrical Code (NEC) rating of Division 2 Class I Group D. If the equipment is rated Division 1 there are no ventilation requirement. It is unknown if the equipment in the headworks and dewatering building is Division 1. Therefore, a minimum ventilation rate of 12 air changes per hour will be required. NFPA also has standards for the odor control areas. With Division 2 electrical equipment a minimum of six air changes per hour in the areas out to three feet surrounding any potential leak.
Occupational Health and Safety Administration (OSHA) does not provide specific ventilation standards but rather sets limits for worker exposure to specific compounds. In wastewater treatment applications, hydrogen sulfide is the most common among these compounds. Worker exposure to hydrogen sulfide is limited to 20 ppm. If greater than 20 ppm, these areas must be governed by the rules of confined space entry. Confined space entry requires workers to have respirators and thus the OASHA limits for concentration of hydrogen sulfide do not apply in these areas. As confined spaces, these areas will have to be equipped with the following gas detectors and associated alarms located at the entrances:
• Hydrogen sulfide;
• Oxygen; and
• Methane.
ARVIN WASTEWATER TREATMENT PLANT MASTER PLAN – FINAL REPORT
8.6
Ventilation and Emission Capture/Collection – In addition to the regulatory requirements discussed above, there are other considerations in the sizing and arrangement of the ventilation and air collection systems. The foremost concern at the WWTP is to prevent odors from escaping the facility and impacting the public in the surrounding areas.
8.2 ODOR CONTROL PROCESSES
There are a wide variety of odor control technologies available, but these can be grouped into the following general types:
• Absorption filters – carbon and iron sponge filters;
• Biofilters – organic and inorganic media filters;
• Biotrickling filters and bioscrubbers;
• Wet chemical scrubbers;
• Chemical dosing of the wastewater; and
• Regenerative thermal oxidation.
Among these technologies, biological systems, carbon filters, and wet chemical scrubbers are best suited to remove hydrogen sulfide, organics, and ammonia, respectively. Several different chemicals can be dosed into the wastewater flow to reduce the formation and release of odorous compounds. These chemicals generally target hydrogen sulfide generation but will reduce other sulfide compounds depending on the chemical used. However, as with wet chemical scrubbers, many of these compounds are corrosive or otherwise harmful and require care in handling and storage.
Both biofilters and carbon filters are very effective at removing odors, but they function very differently. In a biofilter, odorous compounds are adsorbed into a thin moisture layer on the surface of the media. The compounds are then oxidized by microorganisms in the moisture layer. The byproducts are mineral salts, carbon dioxide and water. Depending on the material used for the media, there can be a residual odor from the media itself. This is true of organic media biofilters that are composed mostly of wood or bark nuggets. Biofilters require a relatively large footprint compared to other control technologies. In addition, the media must be replaced every three years, and this generally requires the use of earth moving equipment.
In an activated carbon filter, odorous compounds are adsorbed onto surface of the carbon media. The media has high porosity which provides an enormous amount of available adsorption surface area. There are three generic types of carbon media - plain carbon also known as virgin carbon, caustic impregnated carbon and catalytic carbon. Both catalytic and impregnated carbon are treated to improve their ability to remove hydrogen sulfide and thus extend the life of the carbon in airstreams with high concentrations of hydrogen sulfide. Plain or virgin carbon is better suited for light hydrogen sulfide loading and higher VOC removal.
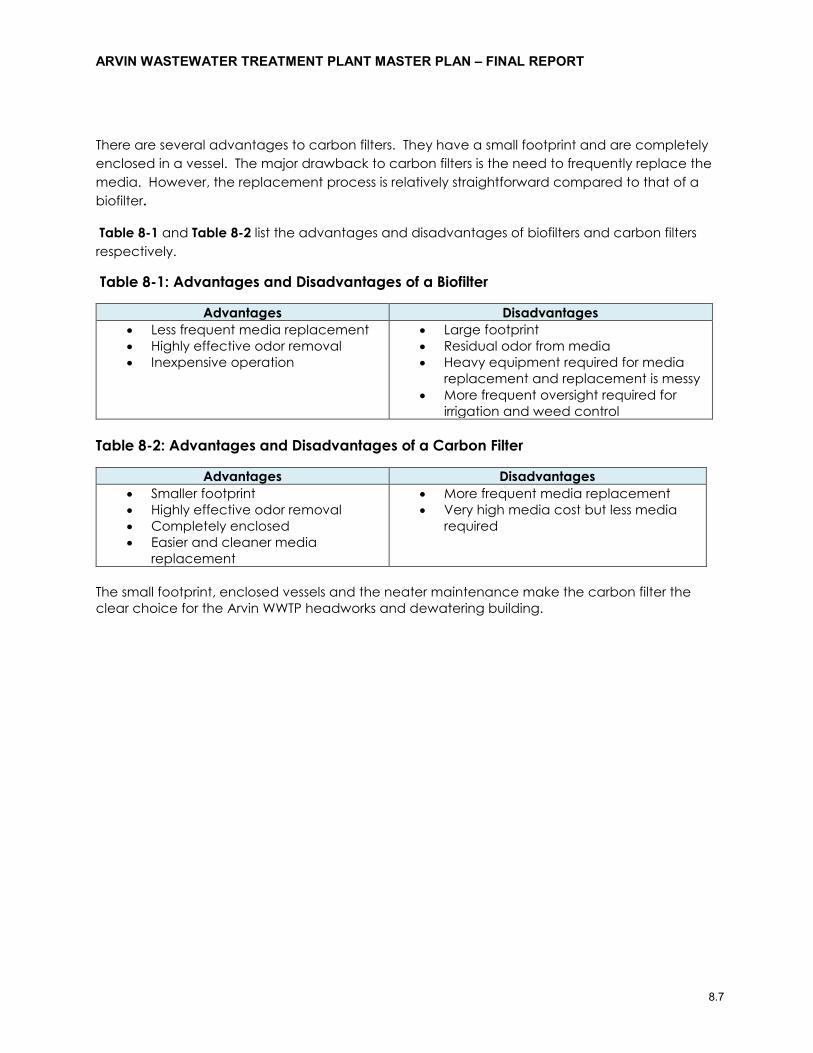
ARVIN WASTEWATER TREATMENT PLANT MASTER PLAN – FINAL REPORT
8.7
There are several advantages to carbon filters. They have a small footprint and are completely enclosed in a vessel. The major drawback to carbon filters is the need to frequently replace the media. However, the replacement process is relatively straightforward compared to that of a biofilter.
Table 8-1 and Table 8-2 list the advantages and disadvantages of biofilters and carbon filters respectively.
Table 8-1: Advantages and Disadvantages of a Biofilter
Advantages Disadvantages • Less frequent media replacement • Highly effective odor removal • Inexpensive operation
• Large footprint • Residual odor from media • Heavy equipment required for media
replacement and replacement is messy • More frequent oversight required for
irrigation and weed control Table 8-2: Advantages and Disadvantages of a Carbon Filter
Advantages Disadvantages • Smaller footprint • Highly effective odor removal • Completely enclosed • Easier and cleaner media
replacement
• More frequent media replacement • Very high media cost but less media
required
The small footprint, enclosed vessels and the neater maintenance make the carbon filter the clear choice for the Arvin WWTP headworks and dewatering building.
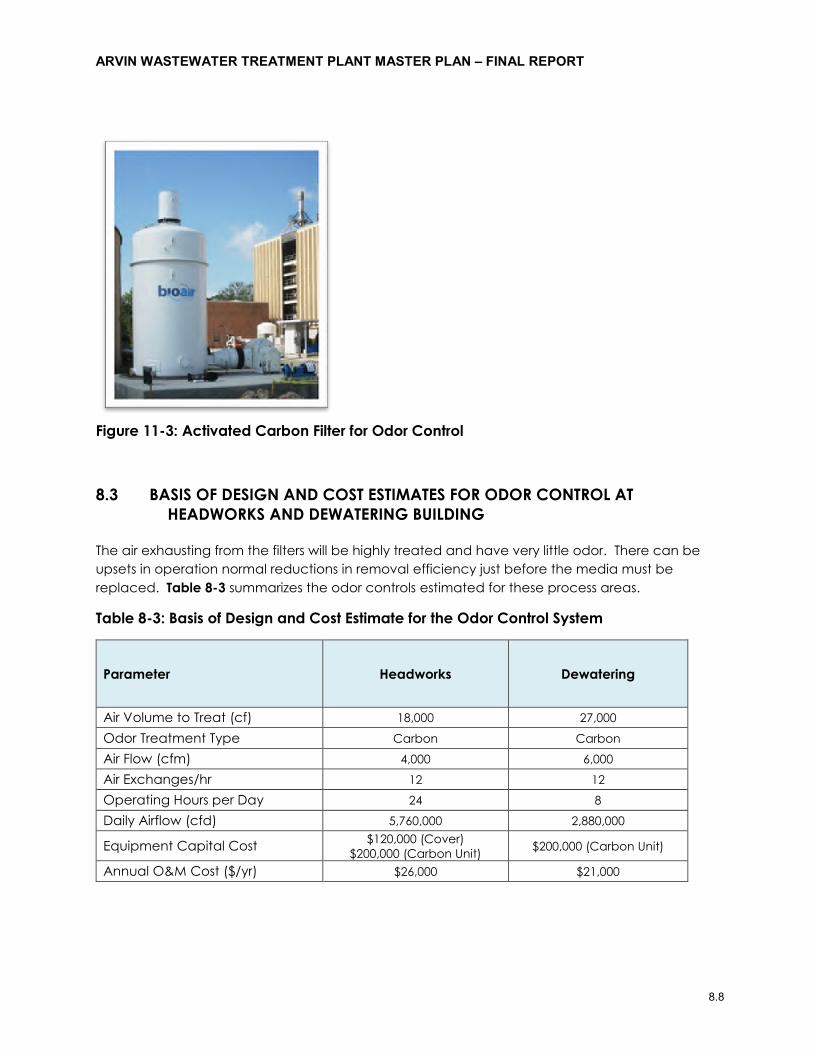
ARVIN WASTEWATER TREATMENT PLANT MASTER PLAN – FINAL REPORT
8.8
Figure 11-3: Activated Carbon Filter for Odor Control
8.3 BASIS OF DESIGN AND COST ESTIMATES FOR ODOR CONTROL AT HEADWORKS AND DEWATERING BUILDING
The air exhausting from the filters will be highly treated and have very little odor. There can be upsets in operation normal reductions in removal efficiency just before the media must be replaced. Table 8-3 summarizes the odor controls estimated for these process areas.
Table 8-3: Basis of Design and Cost Estimate for the Odor Control System
Parameter Headworks Dewatering
Air Volume to Treat (cf) 18,000 27,000
Odor Treatment Type Carbon Carbon
Air Flow (cfm) 4,000 6,000
Air Exchanges/hr 12 12
Operating Hours per Day 24 8
Daily Airflow (cfd) 5,760,000 2,880,000
Equipment Capital Cost $120,000 (Cover) $200,000 (Carbon Unit) $200,000 (Carbon Unit)
Annual O&M Cost ($/yr) $26,000 $21,000
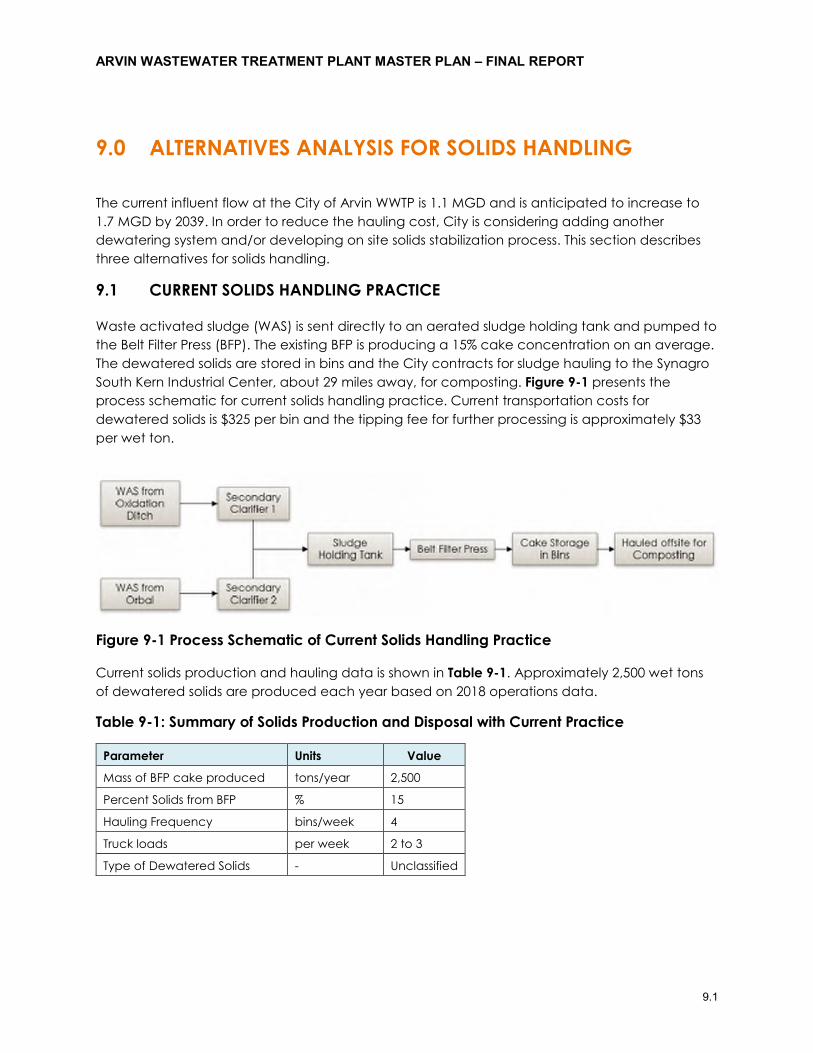
ARVIN WASTEWATER TREATMENT PLANT MASTER PLAN – FINAL REPORT
9.1
9.0 ALTERNATIVES ANALYSIS FOR SOLIDS HANDLING
The current influent flow at the City of Arvin WWTP is 1.1 MGD and is anticipated to increase to 1.7 MGD by 2039. In order to reduce the hauling cost, City is considering adding another dewatering system and/or developing on site solids stabilization process. This section describes three alternatives for solids handling.
9.1 CURRENT SOLIDS HANDLING PRACTICE
Waste activated sludge (WAS) is sent directly to an aerated sludge holding tank and pumped to the Belt Filter Press (BFP). The existing BFP is producing a 15% cake concentration on an average. The dewatered solids are stored in bins and the City contracts for sludge hauling to the Synagro South Kern Industrial Center, about 29 miles away, for composting. Figure 9-1 presents the process schematic for current solids handling practice. Current transportation costs for dewatered solids is $325 per bin and the tipping fee for further processing is approximately $33 per wet ton.
Figure 9-1 Process Schematic of Current Solids Handling Practice
Current solids production and hauling data is shown in Table 9-1. Approximately 2,500 wet tons of dewatered solids are produced each year based on 2018 operations data.
Table 9-1: Summary of Solids Production and Disposal with Current Practice
Parameter Units Value
Mass of BFP cake produced tons/year 2,500
Percent Solids from BFP % 15
Hauling Frequency bins/week 4
Truck loads per week 2 to 3
Type of Dewatered Solids - Unclassified
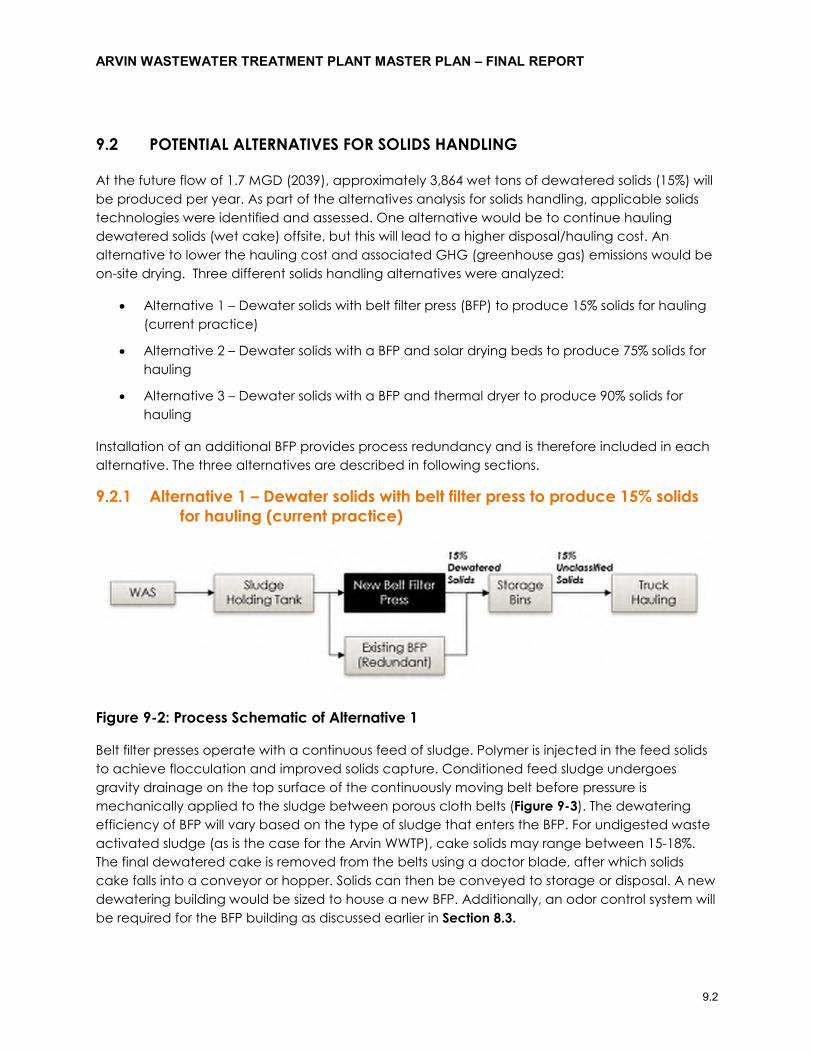
ARVIN WASTEWATER TREATMENT PLANT MASTER PLAN – FINAL REPORT
9.2
9.2 POTENTIAL ALTERNATIVES FOR SOLIDS HANDLING
At the future flow of 1.7 MGD (2039), approximately 3,864 wet tons of dewatered solids (15%) will be produced per year. As part of the alternatives analysis for solids handling, applicable solids technologies were identified and assessed. One alternative would be to continue hauling dewatered solids (wet cake) offsite, but this will lead to a higher disposal/hauling cost. An alternative to lower the hauling cost and associated GHG (greenhouse gas) emissions would be on-site drying. Three different solids handling alternatives were analyzed:
• Alternative 1 – Dewater solids with belt filter press (BFP) to produce 15% solids for hauling (current practice)
• Alternative 2 – Dewater solids with a BFP and solar drying beds to produce 75% solids for hauling
• Alternative 3 – Dewater solids with a BFP and thermal dryer to produce 90% solids for hauling
Installation of an additional BFP provides process redundancy and is therefore included in each alternative. The three alternatives are described in following sections.
9.2.1 Alternative 1 – Dewater solids with belt filter press to produce 15% solids for hauling (current practice)
Figure 9-2: Process Schematic of Alternative 1
Belt filter presses operate with a continuous feed of sludge. Polymer is injected in the feed solids to achieve flocculation and improved solids capture. Conditioned feed sludge undergoes gravity drainage on the top surface of the continuously moving belt before pressure is mechanically applied to the sludge between porous cloth belts (Figure 9-3). The dewatering efficiency of BFP will vary based on the type of sludge that enters the BFP. For undigested waste activated sludge (as is the case for the Arvin WWTP), cake solids may range between 15-18%. The final dewatered cake is removed from the belts using a doctor blade, after which solids cake falls into a conveyor or hopper. Solids can then be conveyed to storage or disposal. A new dewatering building would be sized to house a new BFP. Additionally, an odor control system will be required for the BFP building as discussed earlier in Section 8.3.
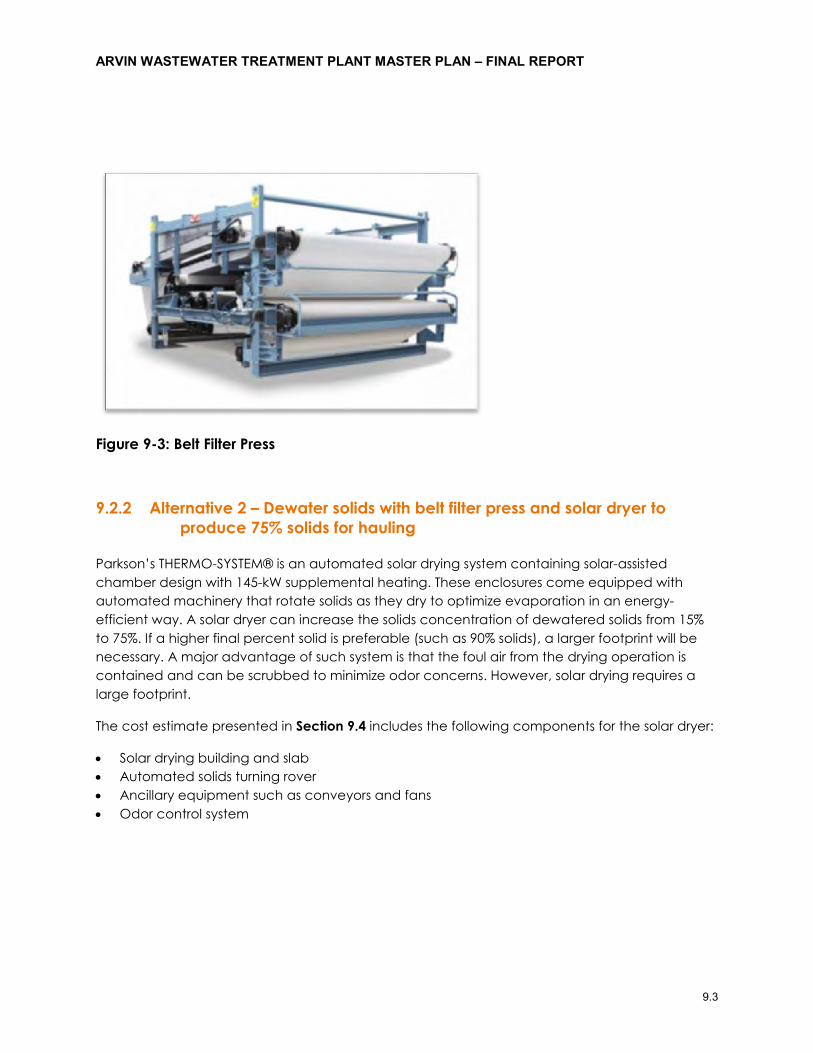
ARVIN WASTEWATER TREATMENT PLANT MASTER PLAN – FINAL REPORT
9.3
Figure 9-3: Belt Filter Press
9.2.2 Alternative 2 – Dewater solids with belt filter press and solar dryer to produce 75% solids for hauling
Parkson’s THERMO-SYSTEM® is an automated solar drying system containing solar-assisted chamber design with 145-kW supplemental heating. These enclosures come equipped with automated machinery that rotate solids as they dry to optimize evaporation in an energy-efficient way. A solar dryer can increase the solids concentration of dewatered solids from 15% to 75%. If a higher final percent solid is preferable (such as 90% solids), a larger footprint will be necessary. A major advantage of such system is that the foul air from the drying operation is contained and can be scrubbed to minimize odor concerns. However, solar drying requires a large footprint.
The cost estimate presented in Section 9.4 includes the following components for the solar dryer:
• Solar drying building and slab • Automated solids turning rover • Ancillary equipment such as conveyors and fans • Odor control system
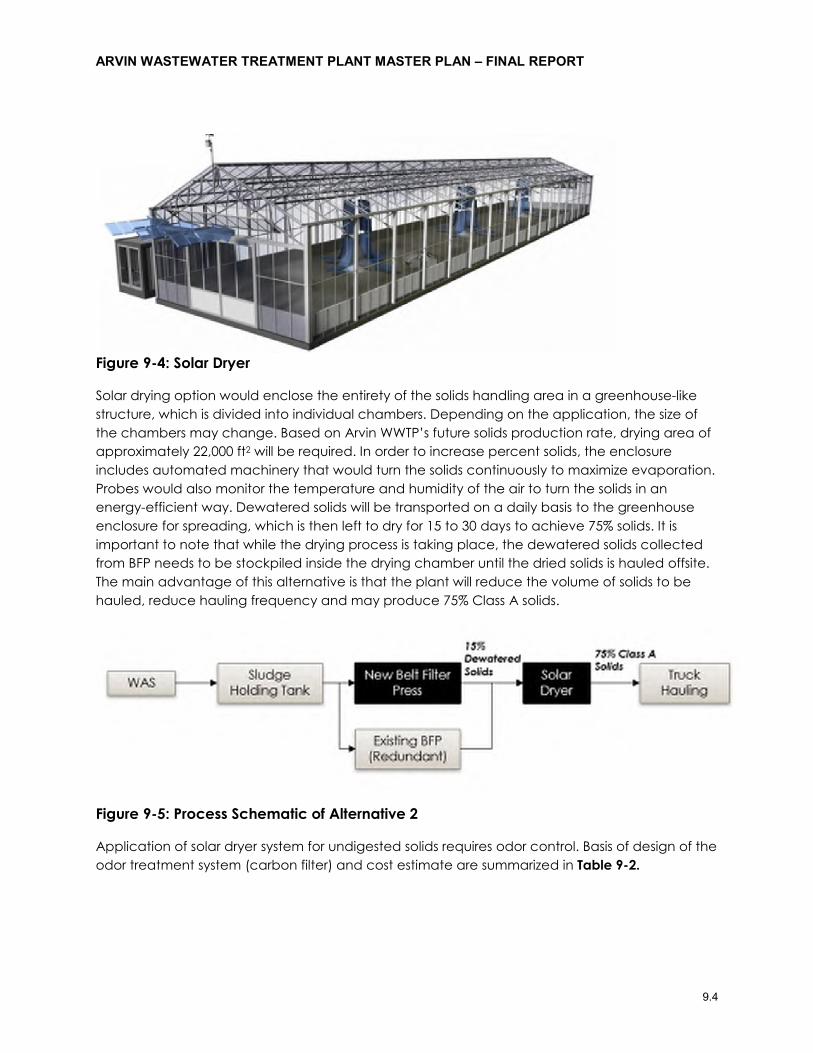
ARVIN WASTEWATER TREATMENT PLANT MASTER PLAN – FINAL REPORT
9.4
Figure 9-4: Solar Dryer
Solar drying option would enclose the entirety of the solids handling area in a greenhouse-like structure, which is divided into individual chambers. Depending on the application, the size of the chambers may change. Based on Arvin WWTP’s future solids production rate, drying area of approximately 22,000 ft2 will be required. In order to increase percent solids, the enclosure includes automated machinery that would turn the solids continuously to maximize evaporation. Probes would also monitor the temperature and humidity of the air to turn the solids in an energy-efficient way. Dewatered solids will be transported on a daily basis to the greenhouse enclosure for spreading, which is then left to dry for 15 to 30 days to achieve 75% solids. It is important to note that while the drying process is taking place, the dewatered solids collected from BFP needs to be stockpiled inside the drying chamber until the dried solids is hauled offsite. The main advantage of this alternative is that the plant will reduce the volume of solids to be hauled, reduce hauling frequency and may produce 75% Class A solids.
Figure 9-5: Process Schematic of Alternative 2
Application of solar dryer system for undigested solids requires odor control. Basis of design of the odor treatment system (carbon filter) and cost estimate are summarized in Table 9-2.
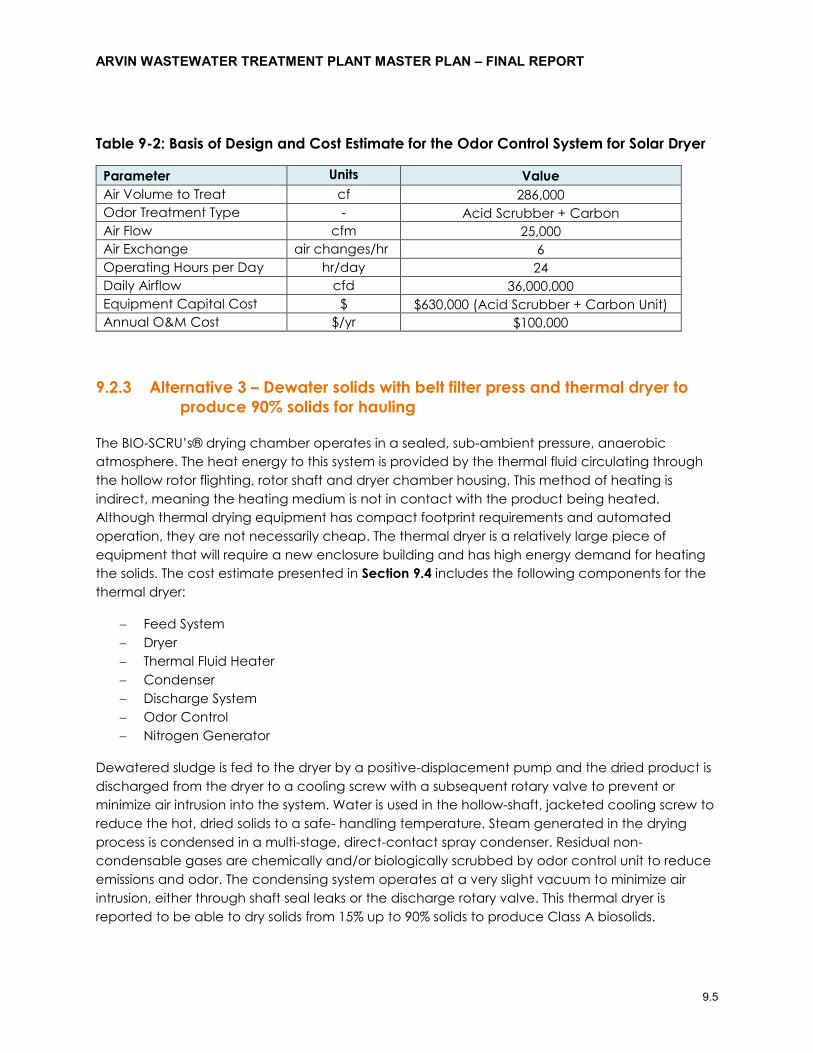
ARVIN WASTEWATER TREATMENT PLANT MASTER PLAN – FINAL REPORT
9.5
Table 9-2: Basis of Design and Cost Estimate for the Odor Control System for Solar Dryer
Parameter Units Value Air Volume to Treat cf 286,000 Odor Treatment Type - Acid Scrubber + Carbon Air Flow cfm 25,000 Air Exchange air changes/hr 6 Operating Hours per Day hr/day 24 Daily Airflow cfd 36,000,000 Equipment Capital Cost $ $630,000 (Acid Scrubber + Carbon Unit) Annual O&M Cost $/yr $100,000
9.2.3 Alternative 3 – Dewater solids with belt filter press and thermal dryer to produce 90% solids for hauling
The BIO-SCRU’s® drying chamber operates in a sealed, sub-ambient pressure, anaerobic atmosphere. The heat energy to this system is provided by the thermal fluid circulating through the hollow rotor flighting, rotor shaft and dryer chamber housing. This method of heating is indirect, meaning the heating medium is not in contact with the product being heated. Although thermal drying equipment has compact footprint requirements and automated operation, they are not necessarily cheap. The thermal dryer is a relatively large piece of equipment that will require a new enclosure building and has high energy demand for heating the solids. The cost estimate presented in Section 9.4 includes the following components for the thermal dryer:
− Feed System − Dryer − Thermal Fluid Heater − Condenser − Discharge System − Odor Control − Nitrogen Generator
Dewatered sludge is fed to the dryer by a positive-displacement pump and the dried product is discharged from the dryer to a cooling screw with a subsequent rotary valve to prevent or minimize air intrusion into the system. Water is used in the hollow-shaft, jacketed cooling screw to reduce the hot, dried solids to a safe- handling temperature. Steam generated in the drying process is condensed in a multi-stage, direct-contact spray condenser. Residual non-condensable gases are chemically and/or biologically scrubbed by odor control unit to reduce emissions and odor. The condensing system operates at a very slight vacuum to minimize air intrusion, either through shaft seal leaks or the discharge rotary valve. This thermal dryer is reported to be able to dry solids from 15% up to 90% solids to produce Class A biosolids.
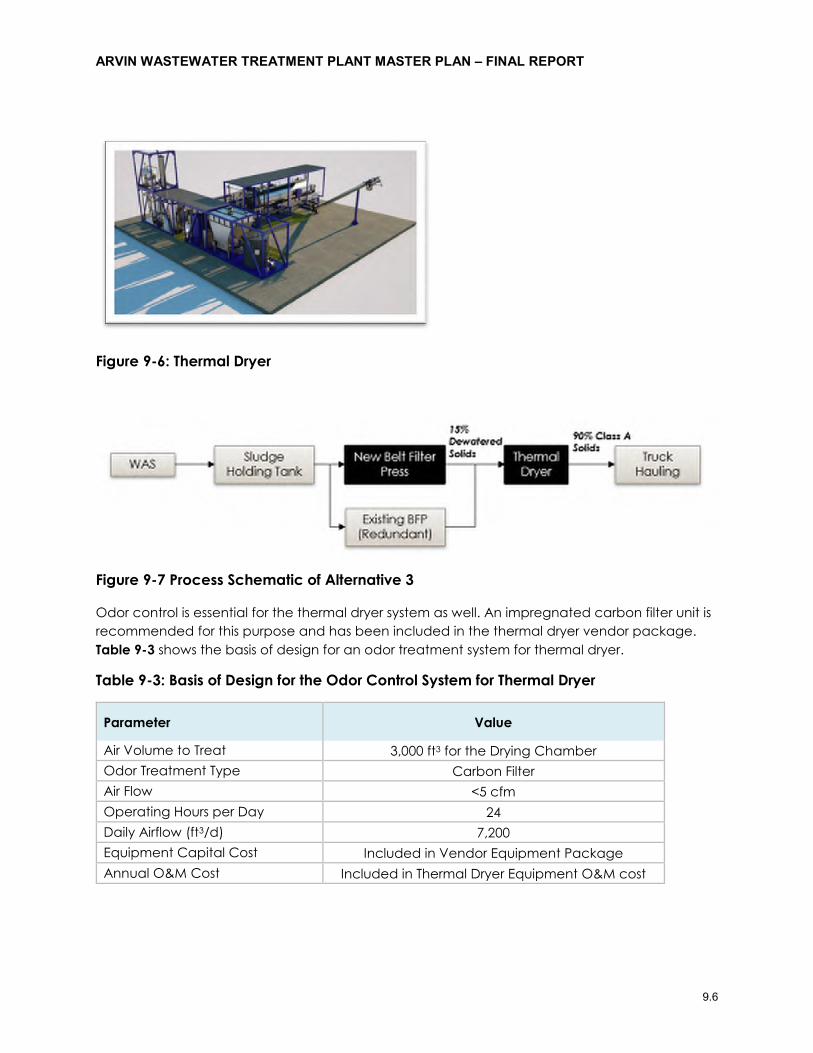
ARVIN WASTEWATER TREATMENT PLANT MASTER PLAN – FINAL REPORT
9.6
Figure 9-6: Thermal Dryer
Figure 9-7 Process Schematic of Alternative 3
Odor control is essential for the thermal dryer system as well. An impregnated carbon filter unit is recommended for this purpose and has been included in the thermal dryer vendor package. Table 9-3 shows the basis of design for an odor treatment system for thermal dryer.
Table 9-3: Basis of Design for the Odor Control System for Thermal Dryer
Parameter Value
Air Volume to Treat 3,000 ft3 for the Drying Chamber Odor Treatment Type Carbon Filter Air Flow <5 cfm Operating Hours per Day 24 Daily Airflow (ft3/d) 7,200 Equipment Capital Cost Included in Vendor Equipment Package Annual O&M Cost Included in Thermal Dryer Equipment O&M cost
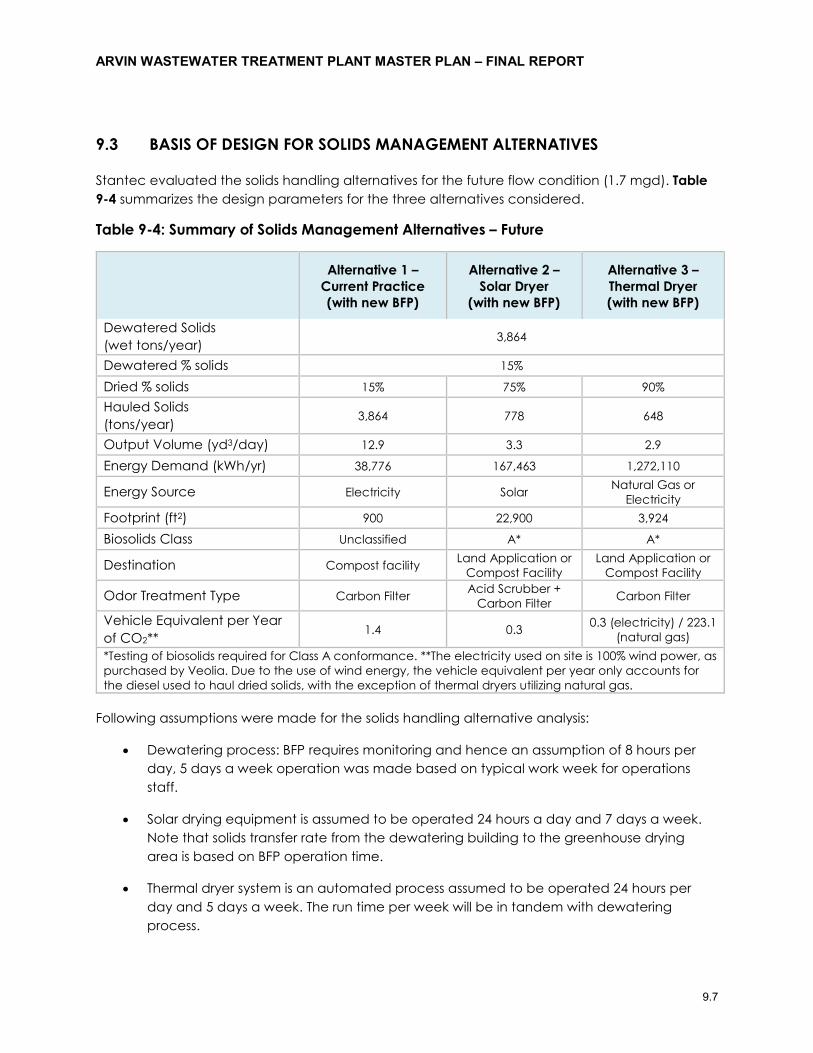
ARVIN WASTEWATER TREATMENT PLANT MASTER PLAN – FINAL REPORT
9.7
9.3 BASIS OF DESIGN FOR SOLIDS MANAGEMENT ALTERNATIVES
Stantec evaluated the solids handling alternatives for the future flow condition (1.7 mgd). Table 9-4 summarizes the design parameters for the three alternatives considered.
Table 9-4: Summary of Solids Management Alternatives – Future
Alternative 1 –
Current Practice (with new BFP)
Alternative 2 – Solar Dryer
(with new BFP)
Alternative 3 – Thermal Dryer (with new BFP)
Dewatered Solids (wet tons/year) 3,864
Dewatered % solids 15%
Dried % solids 15% 75% 90% Hauled Solids (tons/year) 3,864 778 648
Output Volume (yd3/day) 12.9 3.3 2.9
Energy Demand (kWh/yr) 38,776 167,463 1,272,110
Energy Source Electricity Solar Natural Gas or Electricity
Footprint (ft2) 900 22,900 3,924
Biosolids Class Unclassified A* A*
Destination Compost facility Land Application or Compost Facility
Land Application or Compost Facility
Odor Treatment Type Carbon Filter Acid Scrubber + Carbon Filter Carbon Filter
Vehicle Equivalent per Year of CO2** 1.4 0.3 0.3 (electricity) / 223.1
(natural gas) *Testing of biosolids required for Class A conformance. **The electricity used on site is 100% wind power, as purchased by Veolia. Due to the use of wind energy, the vehicle equivalent per year only accounts for the diesel used to haul dried solids, with the exception of thermal dryers utilizing natural gas.
Following assumptions were made for the solids handling alternative analysis:
• Dewatering process: BFP requires monitoring and hence an assumption of 8 hours per day, 5 days a week operation was made based on typical work week for operations staff.
• Solar drying equipment is assumed to be operated 24 hours a day and 7 days a week. Note that solids transfer rate from the dewatering building to the greenhouse drying area is based on BFP operation time.
• Thermal dryer system is an automated process assumed to be operated 24 hours per day and 5 days a week. The run time per week will be in tandem with dewatering process.
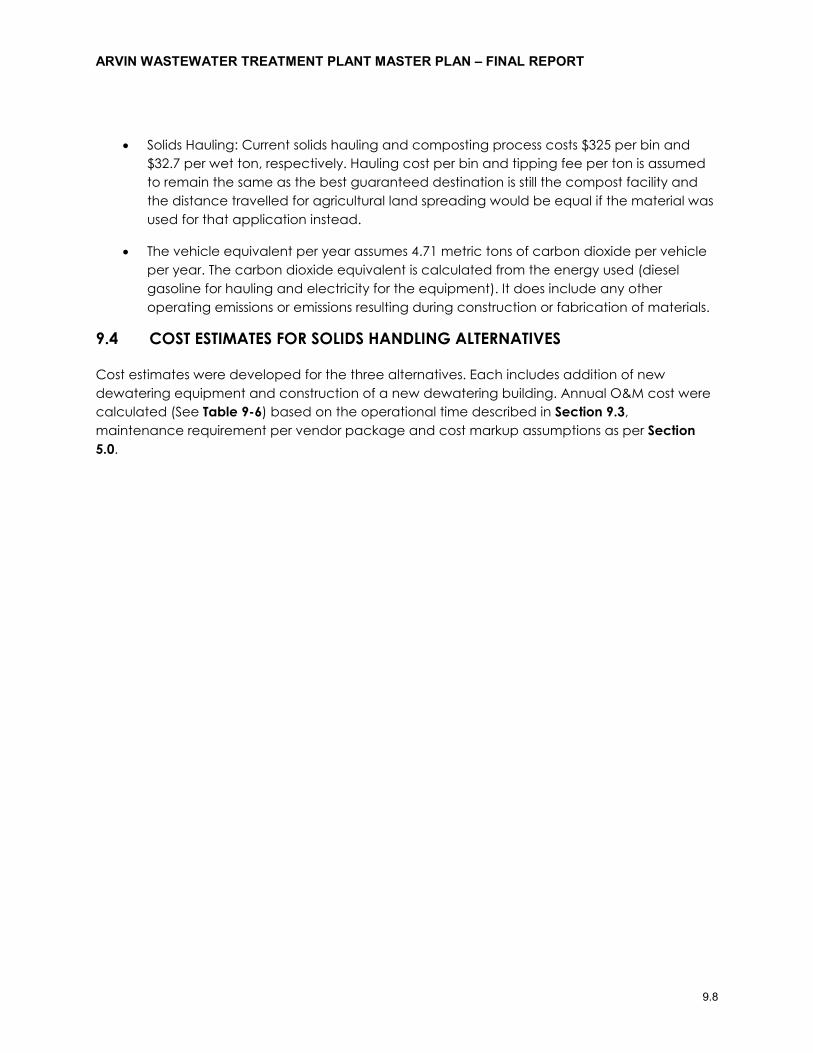
ARVIN WASTEWATER TREATMENT PLANT MASTER PLAN – FINAL REPORT
9.8
• Solids Hauling: Current solids hauling and composting process costs $325 per bin and $32.7 per wet ton, respectively. Hauling cost per bin and tipping fee per ton is assumed to remain the same as the best guaranteed destination is still the compost facility and the distance travelled for agricultural land spreading would be equal if the material was used for that application instead.
• The vehicle equivalent per year assumes 4.71 metric tons of carbon dioxide per vehicle per year. The carbon dioxide equivalent is calculated from the energy used (diesel gasoline for hauling and electricity for the equipment). It does include any other operating emissions or emissions resulting during construction or fabrication of materials.
9.4 COST ESTIMATES FOR SOLIDS HANDLING ALTERNATIVES
Cost estimates were developed for the three alternatives. Each includes addition of new dewatering equipment and construction of a new dewatering building. Annual O&M cost were calculated (See Table 9-6) based on the operational time described in Section 9.3, maintenance requirement per vendor package and cost markup assumptions as per Section 5.0.
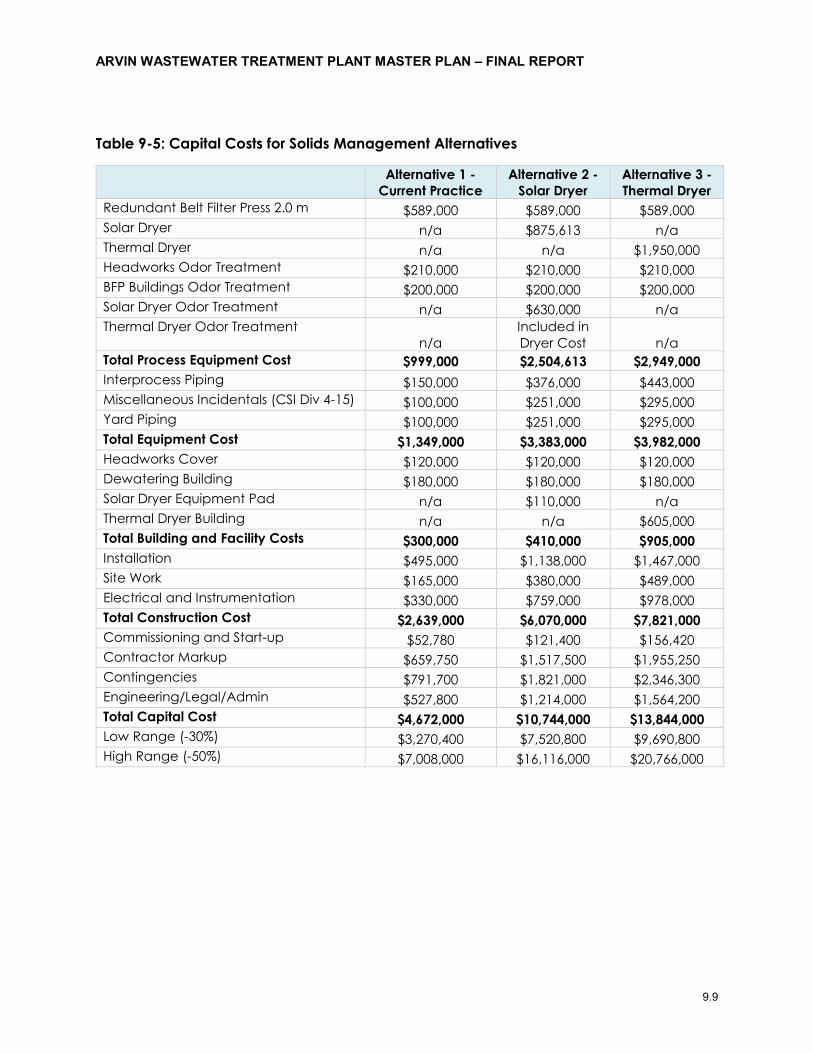
ARVIN WASTEWATER TREATMENT PLANT MASTER PLAN – FINAL REPORT
9.9
Table 9-5: Capital Costs for Solids Management Alternatives
Alternative 1 - Current Practice
Alternative 2 - Solar Dryer
Alternative 3 - Thermal Dryer
Redundant Belt Filter Press 2.0 m $589,000 $589,000 $589,000 Solar Dryer n/a $875,613 n/a Thermal Dryer n/a n/a $1,950,000 Headworks Odor Treatment $210,000 $210,000 $210,000 BFP Buildings Odor Treatment $200,000 $200,000 $200,000 Solar Dryer Odor Treatment n/a $630,000 n/a Thermal Dryer Odor Treatment
n/a Included in Dryer Cost n/a
Total Process Equipment Cost $999,000 $2,504,613 $2,949,000 Interprocess Piping $150,000 $376,000 $443,000 Miscellaneous Incidentals (CSI Div 4-15) $100,000 $251,000 $295,000 Yard Piping $100,000 $251,000 $295,000 Total Equipment Cost $1,349,000 $3,383,000 $3,982,000 Headworks Cover $120,000 $120,000 $120,000 Dewatering Building $180,000 $180,000 $180,000 Solar Dryer Equipment Pad n/a $110,000 n/a Thermal Dryer Building n/a n/a $605,000 Total Building and Facility Costs $300,000 $410,000 $905,000 Installation $495,000 $1,138,000 $1,467,000 Site Work $165,000 $380,000 $489,000 Electrical and Instrumentation $330,000 $759,000 $978,000 Total Construction Cost $2,639,000 $6,070,000 $7,821,000 Commissioning and Start-up $52,780 $121,400 $156,420 Contractor Markup $659,750 $1,517,500 $1,955,250 Contingencies $791,700 $1,821,000 $2,346,300 Engineering/Legal/Admin $527,800 $1,214,000 $1,564,200 Total Capital Cost $4,672,000 $10,744,000 $13,844,000 Low Range (-30%) $3,270,400 $7,520,800 $9,690,800 High Range (-50%) $7,008,000 $16,116,000 $20,766,000
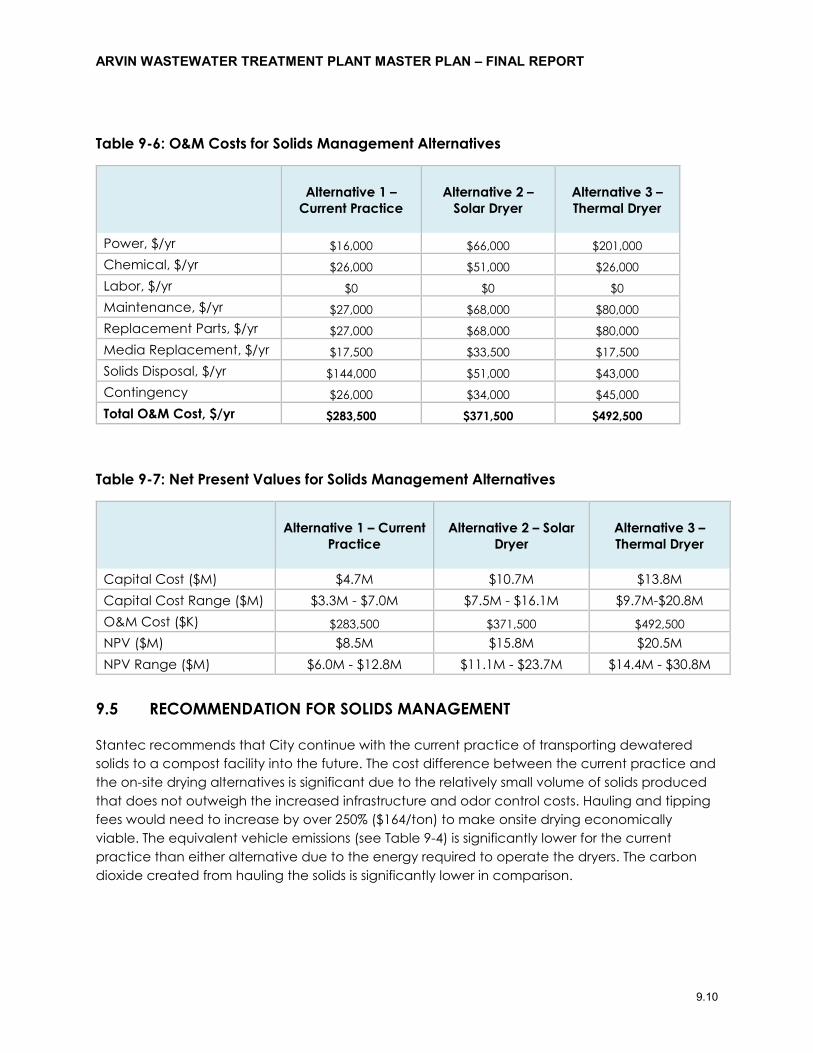
ARVIN WASTEWATER TREATMENT PLANT MASTER PLAN – FINAL REPORT
9.10
Table 9-6: O&M Costs for Solids Management Alternatives
Alternative 1 – Current Practice
Alternative 2 – Solar Dryer
Alternative 3 – Thermal Dryer
Power, $/yr $16,000 $66,000 $201,000 Chemical, $/yr $26,000 $51,000 $26,000 Labor, $/yr $0 $0 $0 Maintenance, $/yr $27,000 $68,000 $80,000 Replacement Parts, $/yr $27,000 $68,000 $80,000 Media Replacement, $/yr $17,500 $33,500 $17,500 Solids Disposal, $/yr $144,000 $51,000 $43,000 Contingency $26,000 $34,000 $45,000 Total O&M Cost, $/yr $283,500 $371,500 $492,500
Table 9-7: Net Present Values for Solids Management Alternatives
Alternative 1 – Current Practice
Alternative 2 – Solar Dryer
Alternative 3 – Thermal Dryer
Capital Cost ($M) $4.7M $10.7M $13.8M Capital Cost Range ($M) $3.3M - $7.0M $7.5M - $16.1M $9.7M-$20.8M O&M Cost ($K) $283,500 $371,500 $492,500 NPV ($M) $8.5M $15.8M $20.5M NPV Range ($M) $6.0M - $12.8M $11.1M - $23.7M $14.4M - $30.8M
9.5 RECOMMENDATION FOR SOLIDS MANAGEMENT
Stantec recommends that City continue with the current practice of transporting dewatered solids to a compost facility into the future. The cost difference between the current practice and the on-site drying alternatives is significant due to the relatively small volume of solids produced that does not outweigh the increased infrastructure and odor control costs. Hauling and tipping fees would need to increase by over 250% ($164/ton) to make onsite drying economically viable. The equivalent vehicle emissions (see Table 9-4) is significantly lower for the current practice than either alternative due to the energy required to operate the dryers. The carbon dioxide created from hauling the solids is significantly lower in comparison.
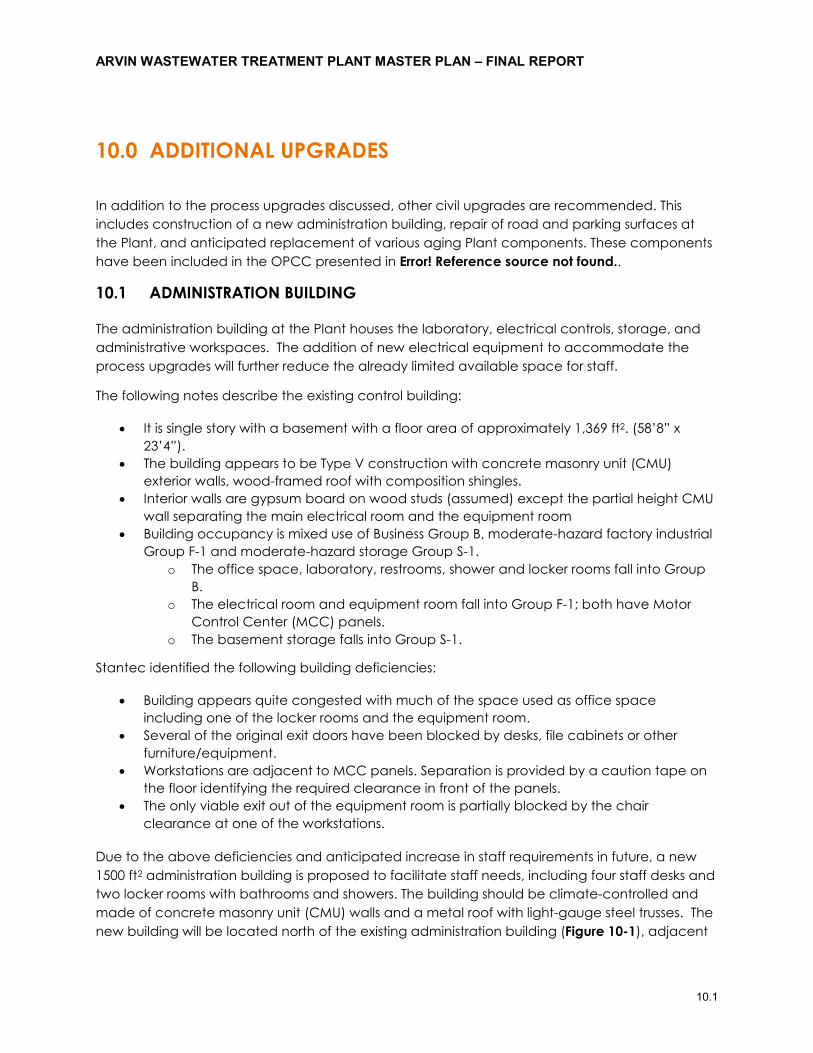
ARVIN WASTEWATER TREATMENT PLANT MASTER PLAN – FINAL REPORT
10.1
10.0 ADDITIONAL UPGRADES
In addition to the process upgrades discussed, other civil upgrades are recommended. This includes construction of a new administration building, repair of road and parking surfaces at the Plant, and anticipated replacement of various aging Plant components. These components have been included in the OPCC presented in Error! Reference source not found..
10.1 ADMINISTRATION BUILDING
The administration building at the Plant houses the laboratory, electrical controls, storage, and administrative workspaces. The addition of new electrical equipment to accommodate the process upgrades will further reduce the already limited available space for staff.
The following notes describe the existing control building:
• It is single story with a basement with a floor area of approximately 1,369 ft2. (58’8” x 23’4”).
• The building appears to be Type V construction with concrete masonry unit (CMU) exterior walls, wood-framed roof with composition shingles.
• Interior walls are gypsum board on wood studs (assumed) except the partial height CMU wall separating the main electrical room and the equipment room
• Building occupancy is mixed use of Business Group B, moderate-hazard factory industrial Group F-1 and moderate-hazard storage Group S-1.
o The office space, laboratory, restrooms, shower and locker rooms fall into Group B.
o The electrical room and equipment room fall into Group F-1; both have Motor Control Center (MCC) panels.
o The basement storage falls into Group S-1.
Stantec identified the following building deficiencies:
• Building appears quite congested with much of the space used as office space including one of the locker rooms and the equipment room.
• Several of the original exit doors have been blocked by desks, file cabinets or other furniture/equipment.
• Workstations are adjacent to MCC panels. Separation is provided by a caution tape on the floor identifying the required clearance in front of the panels.
• The only viable exit out of the equipment room is partially blocked by the chair clearance at one of the workstations.
Due to the above deficiencies and anticipated increase in staff requirements in future, a new 1500 ft2 administration building is proposed to facilitate staff needs, including four staff desks and two locker rooms with bathrooms and showers. The building should be climate-controlled and made of concrete masonry unit (CMU) walls and a metal roof with light-gauge steel trusses. The new building will be located north of the existing administration building (Figure 10-1), adjacent
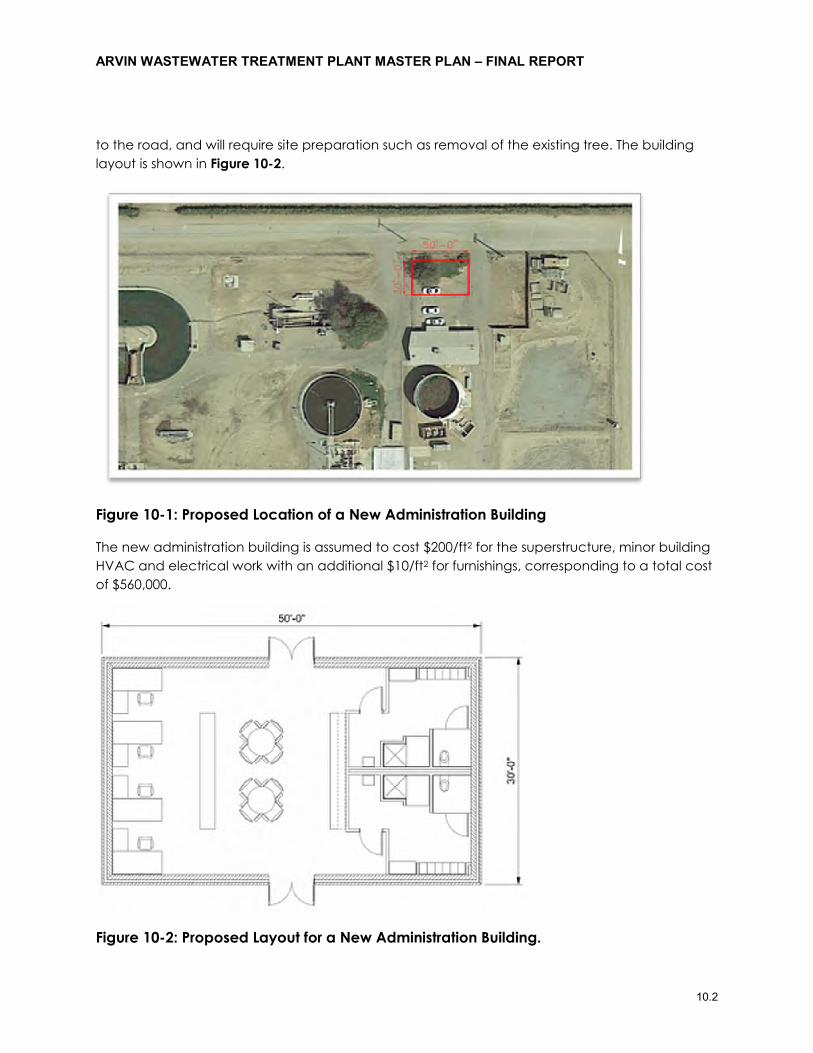
ARVIN WASTEWATER TREATMENT PLANT MASTER PLAN – FINAL REPORT
10.2
to the road, and will require site preparation such as removal of the existing tree. The building layout is shown in Figure 10-2.
Figure 10-1: Proposed Location of a New Administration Building
The new administration building is assumed to cost $200/ft2 for the superstructure, minor building HVAC and electrical work with an additional $10/ft2 for furnishings, corresponding to a total cost of $560,000.
Figure 10-2: Proposed Layout for a New Administration Building.
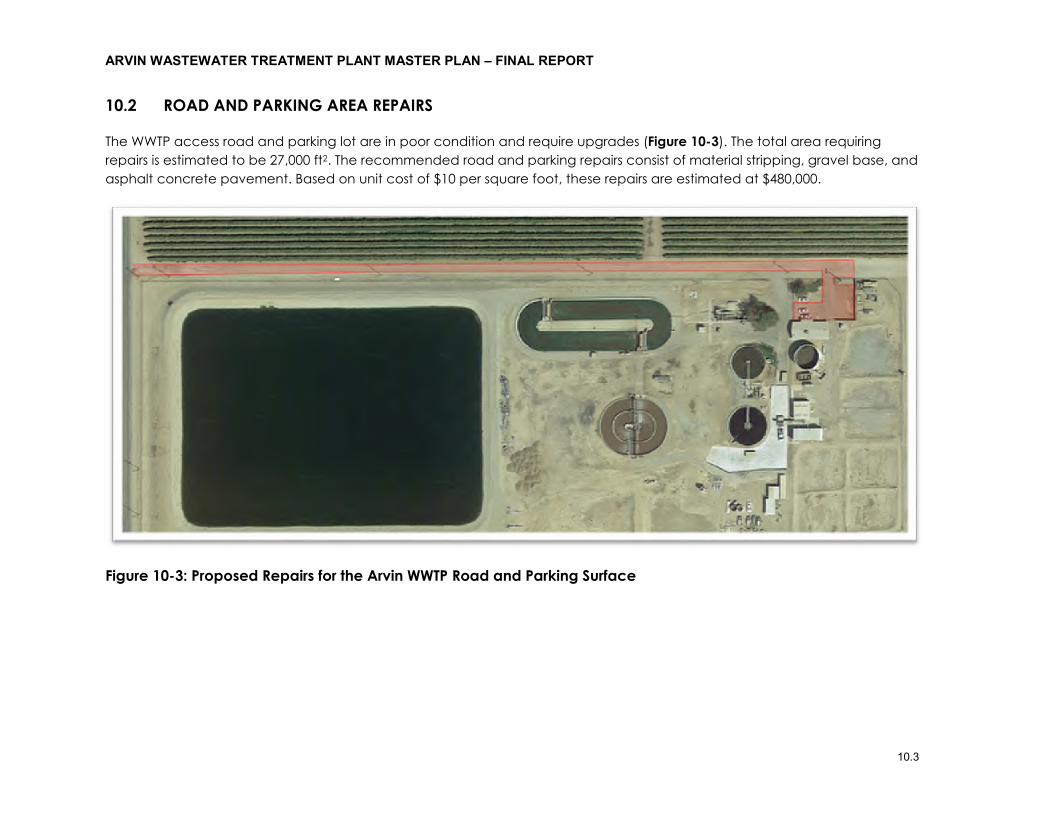
ARVIN WASTEWATER TREATMENT PLANT MASTER PLAN – FINAL REPORT
10.3
10.2 ROAD AND PARKING AREA REPAIRS
The WWTP access road and parking lot are in poor condition and require upgrades (Figure 10-3). The total area requiring repairs is estimated to be 27,000 ft2. The recommended road and parking repairs consist of material stripping, gravel base, and asphalt concrete pavement. Based on unit cost of $10 per square foot, these repairs are estimated at $480,000.
Figure 10-3: Proposed Repairs for the Arvin WWTP Road and Parking Surface
N
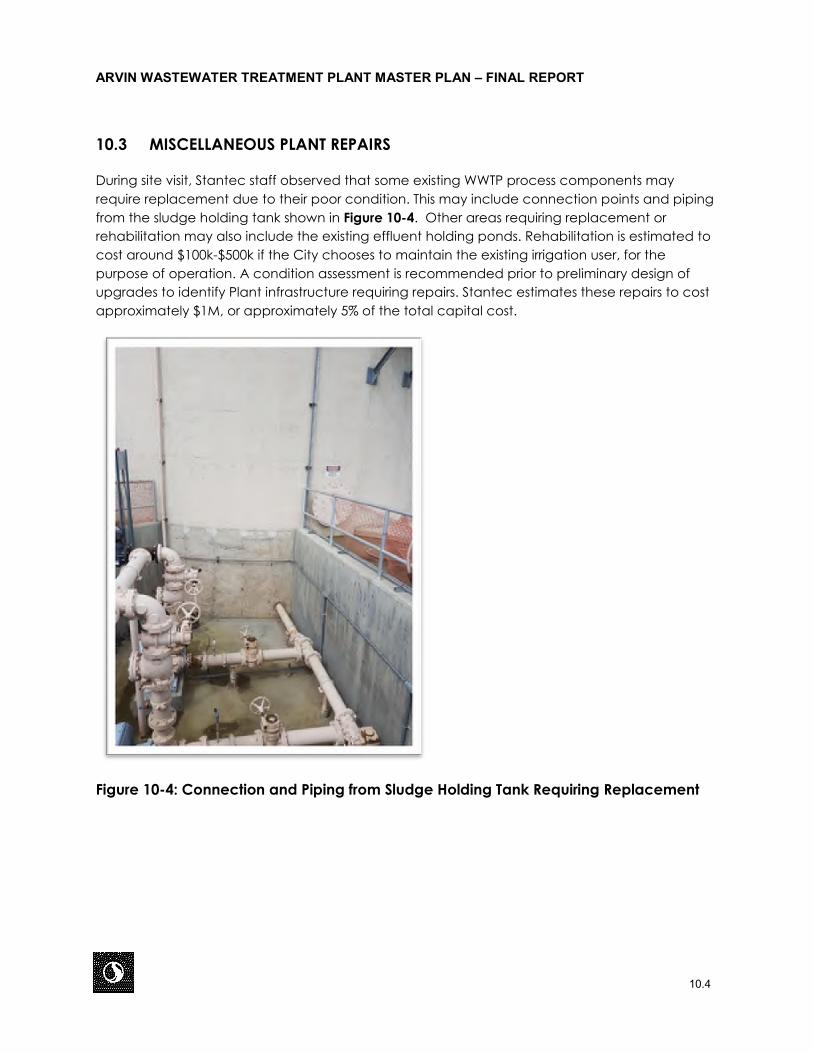
ARVIN WASTEWATER TREATMENT PLANT MASTER PLAN – FINAL REPORT
10.4
10.3 MISCELLANEOUS PLANT REPAIRS
During site visit, Stantec staff observed that some existing WWTP process components may require replacement due to their poor condition. This may include connection points and piping from the sludge holding tank shown in Figure 10-4. Other areas requiring replacement or rehabilitation may also include the existing effluent holding ponds. Rehabilitation is estimated to cost around $100k-$500k if the City chooses to maintain the existing irrigation user, for the purpose of operation. A condition assessment is recommended prior to preliminary design of upgrades to identify Plant infrastructure requiring repairs. Stantec estimates these repairs to cost approximately $1M, or approximately 5% of the total capital cost.
Figure 10-4: Connection and Piping from Sludge Holding Tank Requiring Replacement
ARVIN WASTEWATER TREATMENT PLANT MASTER PLAN – FINAL REPORT
11.1
11.0 SUMMARY AND RECOMMENDATIONS
11.1.1 Projected Flows and Loadings for a 20-year Design Period
Based on projected population growth rate of 2% and per capita water consumption rate of 51 gal/person/day, the wastewater flow to the Arvin WWTP is expected to reach 1.7 MGD in next 20 years. Using a per capita BOD loading of 0.185 lb/person/day and projected population of 32,883 in 2039, the annual average BOD loading to the Arvin WWTP is projected to be 6,073 lb/d.
11.1.2 Recommended Ultimate Effluent Destination and Liquids Treatment Upgrades
Among the four effluent destination alternatives evaluated, Alternative 1A (disinfected tertiary effluent for continued use of effluent for irrigation) was found to be most economical since it does not require desalination. Other alternatives require varying degrees of desalination for either salinity management and/or to achieve total organic carbon (TOC) removal for groundwater recharge. The net present value (NPV) per acre-foot (ac-ft) of treated water to produce disinfected tertiary effluent was estimated at $840/ac-ft whereas that for the other alternatives ranged from $1,170-$2.140/ac-ft. The secondary effluent currently produced by the Arvin WWTP cannot be used for certain irrigation applications such as food crop irritation. Producing disinfected tertiary effluent would allow the City to use treated water for unrestricted irrigation; the water can also be disposed via effluent disposal ponds. It should be noted that disposing the effluent via disposal ponds would require a higher degree of nitrogen removal than the Arvin WWTP is currently achieving. Such treatment would necessitate the addition of an anoxic tank. A redundant secondary clarifier is also deemed necessary by the plant operations staff. And finally, a filtration and disinfection system would be required to produce disinfected tertiary effluent.
Disinfected tertiary effluent can also be produced by using a Membrane Bioreactor (MBR) process. MBR uses membranes instead of secondary clarifiers for solids separation; high level of solids removal by membranes also eliminates the need for a downstream filtration system. Since membranes can filter mixed liquor concentration of up to 12,000 mg/L, the MBR process can increase the plant capacity substantially (2-3 times) within the same footprint. If City chooses to upgrade the liquids treatment at the Arvin WWTP to produce disinfected tertiary effluent then Stantec recommends upgrading the existing Orbal® process to an MBR, while taking the other oxidation ditch train out of service. Such upgrade would require addition of fine screens at the headworks, upgrade of aeration system for the Orbal® to get higher oxygen transfer and addition of membrane filtration systems downstream of the Orbal®.
Converting the Orbal® to an MBR would provide following advantages:
• Increases the capacity of the Orbal® train to meet the future flows and loadings thereby eliminating the need to operate the second oxidation ditch train
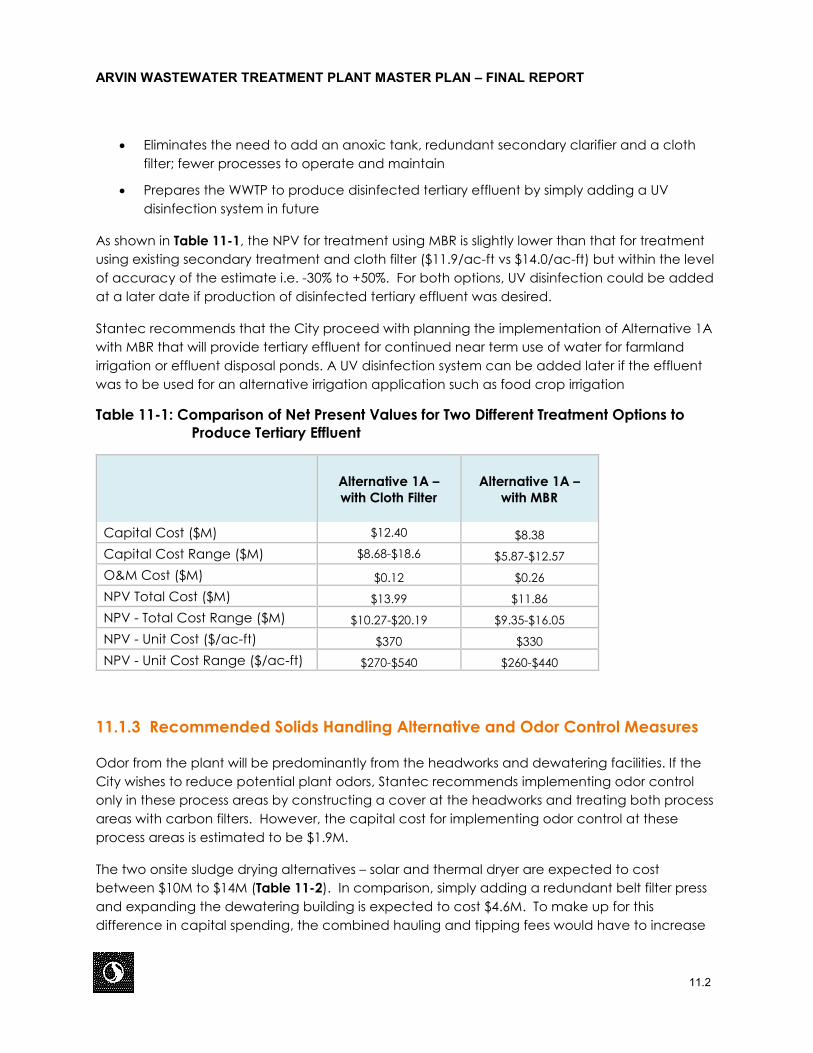
ARVIN WASTEWATER TREATMENT PLANT MASTER PLAN – FINAL REPORT
11.2
• Eliminates the need to add an anoxic tank, redundant secondary clarifier and a cloth filter; fewer processes to operate and maintain
• Prepares the WWTP to produce disinfected tertiary effluent by simply adding a UV disinfection system in future
As shown in Table 11-1, the NPV for treatment using MBR is slightly lower than that for treatment using existing secondary treatment and cloth filter ($11.9/ac-ft vs $14.0/ac-ft) but within the level of accuracy of the estimate i.e. -30% to +50%. For both options, UV disinfection could be added at a later date if production of disinfected tertiary effluent was desired.
Stantec recommends that the City proceed with planning the implementation of Alternative 1A with MBR that will provide tertiary effluent for continued near term use of water for farmland irrigation or effluent disposal ponds. A UV disinfection system can be added later if the effluent was to be used for an alternative irrigation application such as food crop irrigation
Table 11-1: Comparison of Net Present Values for Two Different Treatment Options to Produce Tertiary Effluent
Alternative 1A – with Cloth Filter
Alternative 1A – with MBR
Capital Cost ($M) $12.40 $8.38 Capital Cost Range ($M) $8.68-$18.6 $5.87-$12.57 O&M Cost ($M) $0.12 $0.26 NPV Total Cost ($M) $13.99 $11.86 NPV - Total Cost Range ($M) $10.27-$20.19 $9.35-$16.05 NPV - Unit Cost ($/ac-ft) $370 $330 NPV - Unit Cost Range ($/ac-ft) $270-$540 $260-$440
11.1.3 Recommended Solids Handling Alternative and Odor Control Measures
Odor from the plant will be predominantly from the headworks and dewatering facilities. If the City wishes to reduce potential plant odors, Stantec recommends implementing odor control only in these process areas by constructing a cover at the headworks and treating both process areas with carbon filters. However, the capital cost for implementing odor control at these process areas is estimated to be $1.9M.
The two onsite sludge drying alternatives – solar and thermal dryer are expected to cost between $10M to $14M (Table 11-2). In comparison, simply adding a redundant belt filter press and expanding the dewatering building is expected to cost $4.6M. To make up for this difference in capital spending, the combined hauling and tipping fees would have to increase
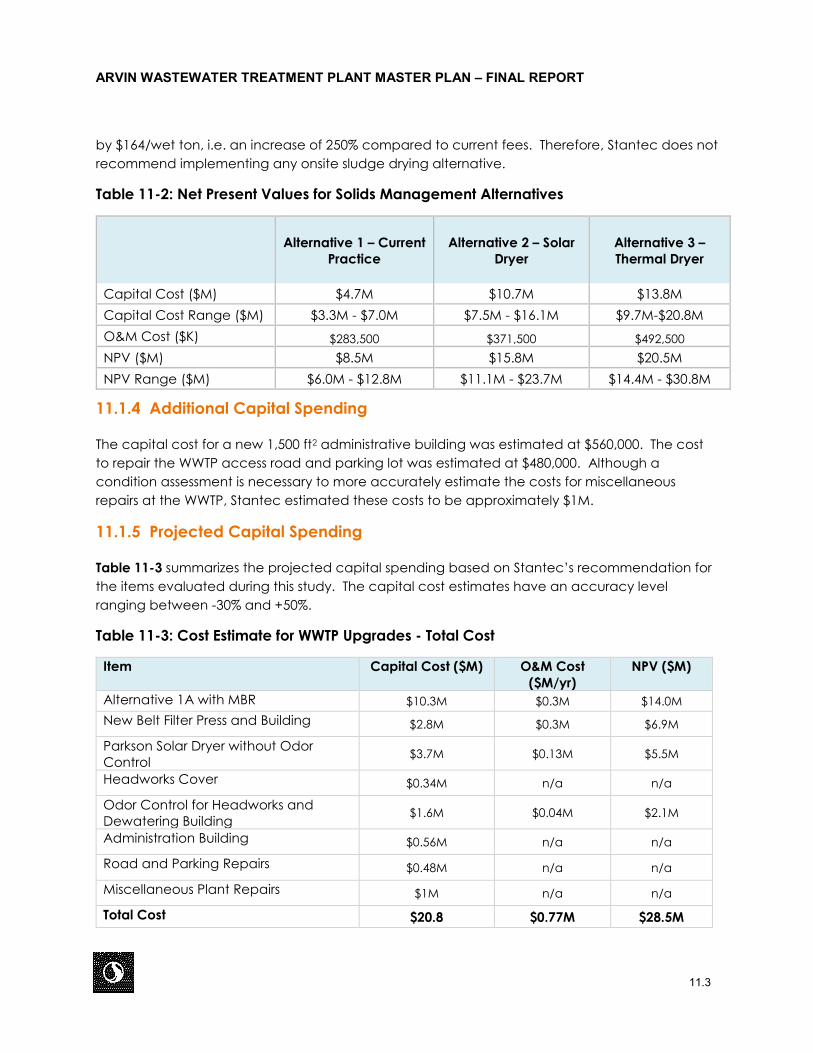
ARVIN WASTEWATER TREATMENT PLANT MASTER PLAN – FINAL REPORT
11.3
by $164/wet ton, i.e. an increase of 250% compared to current fees. Therefore, Stantec does not recommend implementing any onsite sludge drying alternative.
Table 11-2: Net Present Values for Solids Management Alternatives
Alternative 1 – Current Practice
Alternative 2 – Solar Dryer
Alternative 3 – Thermal Dryer
Capital Cost ($M) $4.7M $10.7M $13.8M Capital Cost Range ($M) $3.3M - $7.0M $7.5M - $16.1M $9.7M-$20.8M O&M Cost ($K) $283,500 $371,500 $492,500 NPV ($M) $8.5M $15.8M $20.5M NPV Range ($M) $6.0M - $12.8M $11.1M - $23.7M $14.4M - $30.8M
11.1.4 Additional Capital Spending
The capital cost for a new 1,500 ft2 administrative building was estimated at $560,000. The cost to repair the WWTP access road and parking lot was estimated at $480,000. Although a condition assessment is necessary to more accurately estimate the costs for miscellaneous repairs at the WWTP, Stantec estimated these costs to be approximately $1M.
11.1.5 Projected Capital Spending
Table 11-3 summarizes the projected capital spending based on Stantec’s recommendation for the items evaluated during this study. The capital cost estimates have an accuracy level ranging between -30% and +50%.
Table 11-3: Cost Estimate for WWTP Upgrades - Total Cost
Item Capital Cost ($M) O&M Cost ($M/yr)
NPV ($M)
Alternative 1A with MBR $10.3M $0.3M $14.0M New Belt Filter Press and Building $2.8M $0.3M $6.9M
Parkson Solar Dryer without Odor Control $3.7M $0.13M $5.5M
Headworks Cover $0.34M n/a n/a
Odor Control for Headworks and Dewatering Building $1.6M $0.04M $2.1M
Administration Building $0.56M n/a n/a
Road and Parking Repairs $0.48M n/a n/a
Miscellaneous Plant Repairs $1M n/a n/a
Total Cost $20.8 $0.77M $28.5M
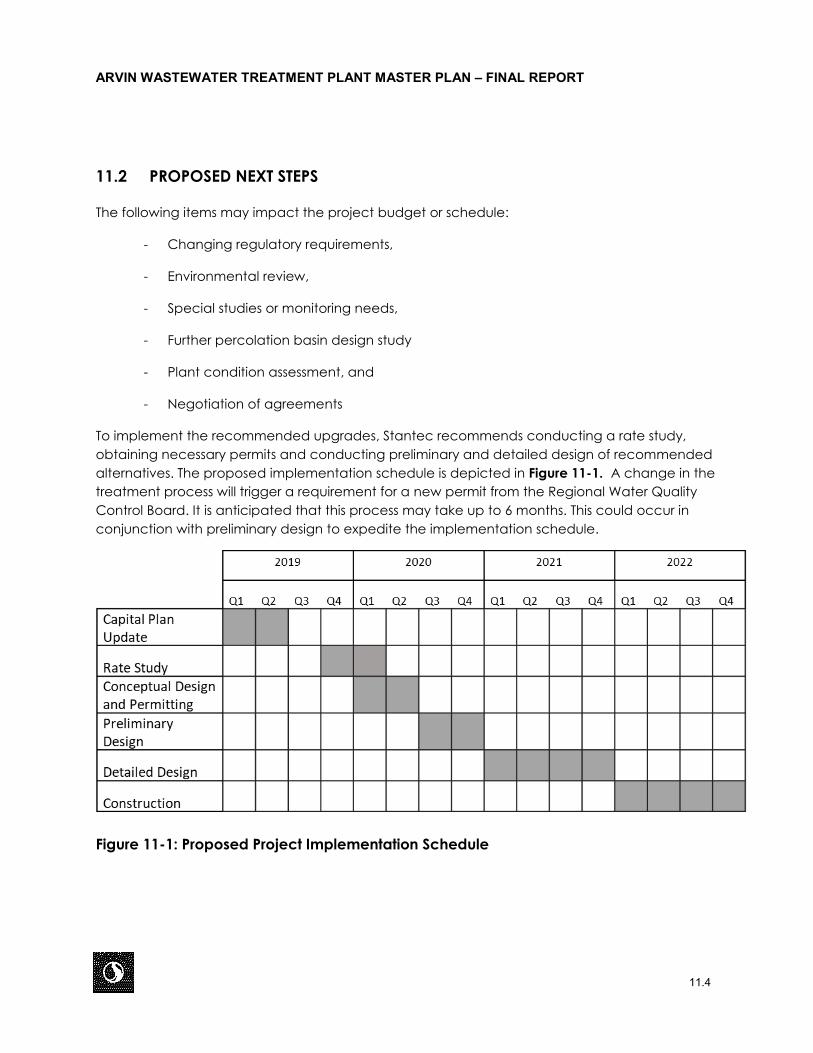
ARVIN WASTEWATER TREATMENT PLANT MASTER PLAN – FINAL REPORT
11.4
11.2 PROPOSED NEXT STEPS
The following items may impact the project budget or schedule:
- Changing regulatory requirements,
- Environmental review,
- Special studies or monitoring needs,
- Further percolation basin design study
- Plant condition assessment, and
- Negotiation of agreements
To implement the recommended upgrades, Stantec recommends conducting a rate study, obtaining necessary permits and conducting preliminary and detailed design of recommended alternatives. The proposed implementation schedule is depicted in Figure 11-1. A change in the treatment process will trigger a requirement for a new permit from the Regional Water Quality Control Board. It is anticipated that this process may take up to 6 months. This could occur in conjunction with preliminary design to expedite the implementation schedule.
Figure 11-1: Proposed Project Implementation Schedule
ARVIN WASTEWATER TREATMENT PLANT MASTER PLAN – FINAL REPORT
A.1
12.0 APPENDICES
Appendix A WASTE DISCHARGE PERMIT
California Regional Water Quality Control Board Central Valley Region
Steven T. Butler, Chair Winsto.1 H. Hiekov Gray D m ~ s
Secretary for E.rvironmenmI
Prof ecrion
19 May 2000
Fresno Branch Office Internet Address: hrrp://\cww.swcb.ca.go~I-wqcb5
3614 East Ashlan Avenue, Fresno, California 93726-3595 Phone (559) 445-5 1 16 FAX (559) 445-59 10
CERTIFIED MAIL Z 186 965 320
Governor
Mr. Thomas A. Payne, City Manager City of Arvin 200 Campus Drive k i n , CA 93203
TRANSMITTAL OF ADOPTED WASTE DISCHARGE REQUIREMENTS FOR CITY OF ARVIN AND UNITED STATES FILTER CORPORATION, ARVIN WASTEWATER TREATMENT FACILITY, KERN COUNTY
Enclosed is an official copy of Order No. 5-00-093 as adopted by the California Regional Water Quality
Senior Engineer RCE No. 55985
Enclosure Adopted Order Standard Provisions
cc: Mr. John Youngeman, Division of Water Quality, State Water Resources Control Board, Sacramento
Department of Environmental Health Services, Office of Drinking Water, Fresno Department of Fish and Game, Region IV, Fresno Department of Water Resources, San Joaquin District, Fresno Kern co&ty Environmental Health Department, Bakersfield Kern ~ o u n t y Planning Department, Bakersfield Kern County Water Agency, Bakersfield Mr. Jack Martin, US Filter, Pleasa Hill "I? Mr. Mike Popichak, US Filter, Arvin 4
Mr. Kim Domingo, Boyle Engineering, Bakersfield Mr. Scott Gurnett, Gurnett's Ski Park, ANin
California Envirorzmental Protectiorz Agency
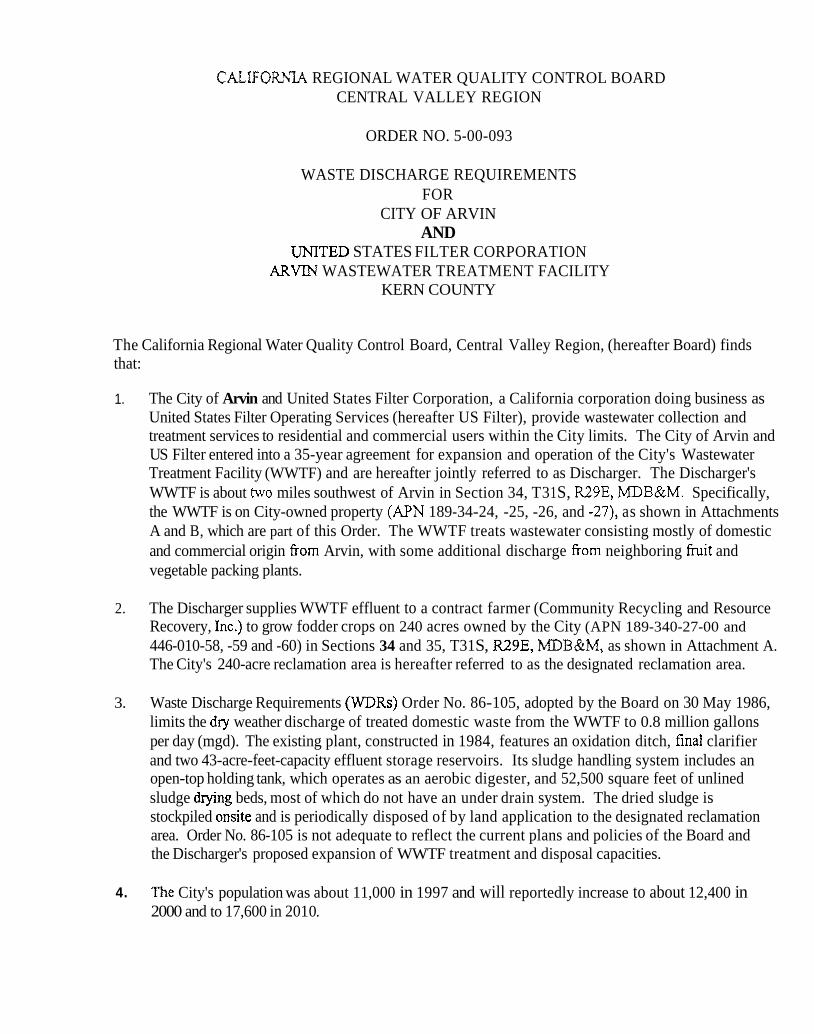
CALIFOR\?A REGIONAL WATER QUALITY CONTROL BOARD CENTRAL VALLEY REGION
ORDER NO. 5-00-093
WASTE DISCHARGE REQUIREMENTS FOR
CITY OF ARVIN AND
UNITED STATES FILTER CORPORATION ARWN WASTEWATER TREATMENT FACILITY
KERN COUNTY
The California Regional Water Quality Control Board, Central Valley Region, (hereafter Board) finds that:
1. The City of Arvin and United States Filter Corporation, a California corporation doing business as United States Filter Operating Services (hereafter US Filter), provide wastewater collection and treatment services to residential and commercial users within the City limits. The City of Arvin and US Filter entered into a 35-year agreement for expansion and operation of the City's Wastewater Treatment Facility (WWTF) and are hereafter jointly referred to as Discharger. The Discharger's WWTF is about ~o miles southwest of Arvin in Section 34, T3 1 S, R29E, MDB&M. Specifically, the WWTF is on City-owned property (APN 189-34-24, -25, -26, and -27), as shown in Attachments A and B, which are part of this Order. The WWTF treats wastewater consisting mostly of domestic and commercial origin £rom Arvin, with some additional discharge from neighboring fruit and vegetable packing plants.
2. The Discharger supplies WWTF effluent to a contract farmer (Community Recycling and Resource Recovery, Inc.) to grow fodder crops on 240 acres owned by the City (APN 189-340-27-00 and 446-010-58, -59 and -60) in Sections 34 and 35, T31 S, R29E, MDB&M, as shown in Attachment A. The City's 240-acre reclamation area is hereafter referred to as the designated reclamation area.
3. Waste Discharge Requirements (WDRs) Order No. 86-105, adopted by the Board on 30 May 1986, limits the dry weather discharge of treated domestic waste from the WWTF to 0.8 million gallons per day (mgd). The existing plant, constructed in 1984, features an oxidation ditch, final clarifier and two 43-acre-feet-capacity effluent storage reservoirs. Its sludge handling system includes an open-top holding tank, which operates as an aerobic digester, and 52,500 square feet of unlined sludge drylng beds, most of which do not have an under drain system. The dried sludge is stockpiled onsite and is periodically disposed of by land application to the designated reclamation area. Order No. 86-105 is not adequate to reflect the current plans and policies of the Board and the Discharger's proposed expansion of WWTF treatment and disposal capacities.
4. The City's population was about 11,000 in 1997 and will reportedly increase to about 12,400 in 2000 and to 17,600 in 201 0.
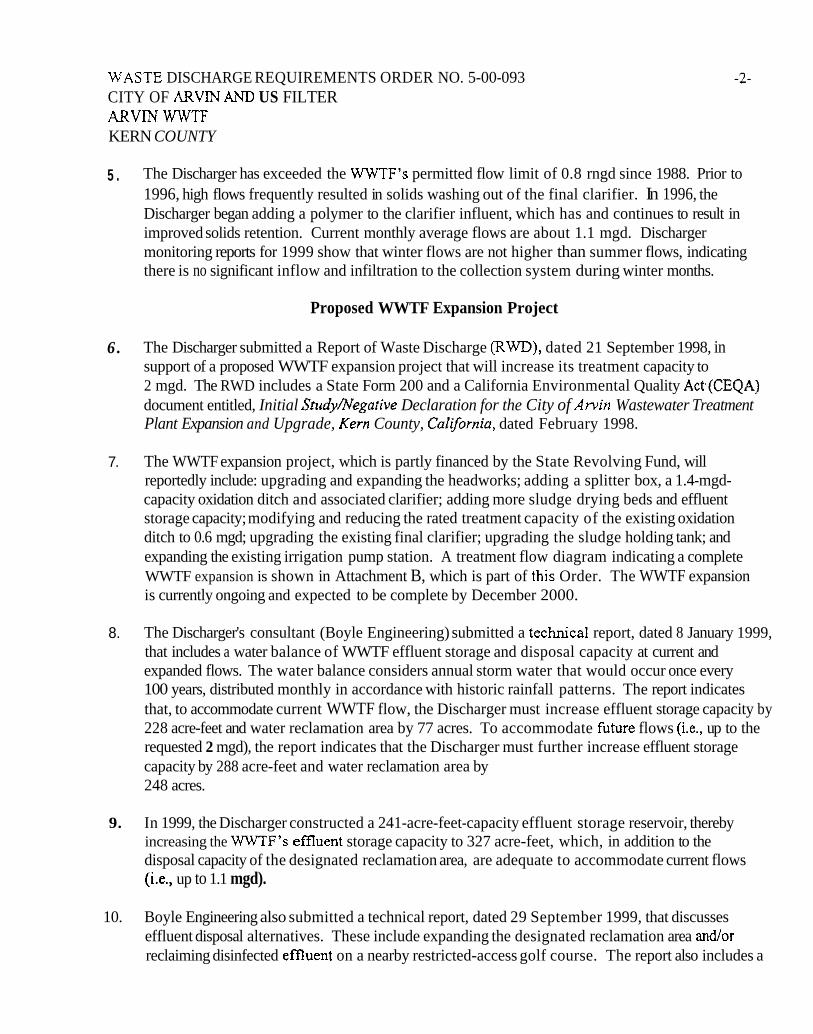
LVASTE DISCHARGE REQUIREMENTS ORDER NO. 5-00-093 CITY OF ARVIN AND US FILTER ARVIN WTF KERN COUNTY
5 . The Discharger has exceeded the WWTF's permitted flow limit of 0.8 rngd since 1988. Prior to 1996, high flows frequently resulted in solids washing out of the final clarifier. In 1996, the Discharger began adding a polymer to the clarifier influent, which has and continues to result in improved solids retention. Current monthly average flows are about 1.1 mgd. Discharger monitoring reports for 1999 show that winter flows are not higher than summer flows, indicating there is no significant inflow and infiltration to the collection system during winter months.
Proposed WWTF Expansion Project
6 . The Discharger submitted a Report of Waste Discharge (RWD), dated 21 September 1998, in support of a proposed WWTF expansion project that will increase its treatment capacity to 2 mgd. The RWD includes a State Form 200 and a California Environmental Quality Act.(CEQA) document entitled, Initial Study/Ngative Declaration for the City of Awin Wastewater Treatment Plant Expansion and Upgrade, Kern County, Calqornia, dated February 1998.
7. The WWTF expansion project, which is partly financed by the State Revolving Fund, will reportedly include: upgrading and expanding the headworks; adding a splitter box, a 1.4-mgd- capacity oxidation ditch and associated clarifier; adding more sludge drying beds and effluent storage capacity; modifying and reducing the rated treatment capacity of the existing oxidation ditch to 0.6 mgd; upgrading the existing final clarifier; upgrading the sludge holding tank; and expanding the existing irrigation pump station. A treatment flow diagram indicating a complete WWTF expansion is shown in Attachment B, which is part of t h s Order. The WWTF expansion is currently ongoing and expected to be complete by December 2000.
8. The Discharger's consultant (Boyle Engineering) submitted a technical report, dated 8 January 1999, that includes a water balance of WWTF effluent storage and disposal capacity at current and expanded flows. The water balance considers annual storm water that would occur once every 100 years, distributed monthly in accordance with historic rainfall patterns. The report indicates that, to accommodate current WWTF flow, the Discharger must increase effluent storage capacity by 228 acre-feet and water reclamation area by 77 acres. To accommodate hture flows (i.e., up to the requested 2 mgd), the report indicates that the Discharger must further increase effluent storage capacity by 288 acre-feet and water reclamation area by 248 acres.
9. In 1999, the Discharger constructed a 241-acre-feet-capacity effluent storage reservoir, thereby increasing the WWTF's emuent storage capacity to 327 acre-feet, which, in addition to the disposal capacity of the designated reclamation area, are adequate to accommodate current flows (i.e., up to 1.1 mgd).
10. Boyle Engineering also submitted a technical report, dated 29 September 1999, that discusses effluent disposal alternatives. These include expanding the designated reclamation area andlor reclaiming disinfected emuent on a nearby restricted-access golf course. The report also includes a
WASTE DISCHARGE REQUIREMENTS ORDER NO. 5-00-093 CITY OF ARVTN AND US FILTER ARVN WWTF KERN COUNTY
nitrogen balance for the Discharger's water reclamation operation that indicates the annual croppins pattern in the designated reclamation area is adequate to uptake all nitrogen applied in the WWTF effluent at current flows.
1 1. In the past, the Discharger had reclaimed WWTF effluent on 154-acres leased property (APN .
446-010-04 and-05) owned by Mr. Bruno Cauzza. The lease agreement with Mr. Cauzza expired in 1999, and presently no lease agreement exists with Mr. Cauzza for WWTF effluent disposal.
12. The Discharger indicates that the WWTF expansion project is complete with the exception of the expanded sludge handling facility, which the Discharger expects to complete by December 2000. The Discharger is currently operating the new 1.4-mgd-capacity oxidation ditch (and associated final clarifier) to process all WWTF influent (i.e., the old 0.6-mgd-capacity oxidation ditch is in standby mode and will not become operational until WWTF influent flows exceed 1.4 rngd).
Boyle Engineering submitted a revised water balance and nitrogen balance report dated 17 February 2000, for the current WWTF monthly average flow of 1.0 rngd and projected monthly average flows of: 1.26 mgd, 1.37 mgd, 1.62 mgd, 1.65 mgd, and 2 rngd ultimate design flow. The ,
water balance considers the aforementioned flows with some seasonal variations specifically increased flows during summer time (May through October), and annual storm water that would occur once every 100 years, distributed monthly in accordance with historic rainfall patterns. Based on the water balance report, Board staff concludes that the Discharger has adequate storage and disposal capacity for the current 1.1 rngd flow including summer time increase up to 1.26 mgd. Staff also concludes that the Discharger can accommodate monthly average flow of 1.26 mgd, with seasonal variation allowance of 1.45 mgd for the summer months only after complete construction of a proposed 20-acre emergency WWTF effluent storage area.
Hydrology, Soils and Beneficial Uses
14. The WWTF and designated reclamation area are within the South Valley Floor Hydrologic Unit and Kern Delta Hydrologic k e a (No. 557.10), as depicted on interagency hydrologic maps prepared by the California Department of Water Resources @WR) in August 1986. Surface water drainage is to the southwest, towards Kern Island Canal (Central Branch Levee).
15. Soils in the WWTF vicinity and designated reclamation area generally consist of alluvial material (Hesperida sandy loam at the surface) estimated to have a thickness of 200 to 300 feet. The soils in the WWTF vicinity exhibit a percolation rate of 0.026 ftlday, according to a technical report submitted by Boyle Engineering dated 29 September 1999.
'NASTE DISCHARGE RIQUIREMENTS ORDER NO. 5-00-093 CITY OF ARVM AND US FILTER ARVIN WWTF KERN COUNTY
16. Area groundwater flows northwest and is about 100 feet below surface grade, according to information in Lines of Equal Elevation of Water in Wells in Unconfined Aquifer, published by DWR in Spring 1998. Inigation water within the City limits and surrounding area is supplied by the Arvin-Edison Water Storage District. This water originates from mountain streams and surface canals and is recharged or stored in underground aquifers prior to delivery to agricultural users.
17. Source water for the City of Arvin is provided by four groundwater wells owned and operated by the Arvin Community Water District (hereafter District). The quality of Awin's source water is characterized below:
Constituent Units City Municipal Supply1
Conductivity at 25 T (EC) prnhos/cm Chloride mgll Nitrate-Nitrogen mg/l
I From Arvin Community Water District 'annual water supply report dated 24 March 1999.
18. Average annual rainfall and pan evaporation rates in the area are about 6 inches and 52 inches, respectively.
19. According to the Federal Emergency Management Agency (FEMA), the WWTF vicinity is within Zone A, an area of flooding of indeterminate depth from potential 100-year storm event flood flows from Caliente Creek, which is northeast of Arvin. To provide flood protection, F E W requires that all new construction be at least 24 inches above the highest adjacent grade.
20. The Water Quality Control Plan for the Tulare Lake Basin, Second Edition. (hereafter Basin Plan), designates beneficial uses, establishes water quality objectives, and contains implementation plans and policies, for Basin waters. These requirements implement the Basin Plan.
2 1. The City of Arvin is on the valley floor, with surface water drainage to the west through unnamed channels towards Kern Lake. The beneficial uses of Valley Floor Waters, as identified in the Basin Plan, include industrial and agricultural supply, industrial process supply, water contact and noncontact water recreation, warm fi-esh water habitat, wildlife habitat, preservation of rare and endangered species, and groundwater recharge.
22. The beneficial uses of the groundwater are municipal, industrial, and agricultural supply.
General Findings
23. Domestic wastewater contains pathogens harmful to humans that are typically measured by means of total or fecal colifom, as indicator organisms. The California Department of Health Services
WASTE DISCHARGE REQUIREMENTS ORDER NO. 5-00-093 CITY OF ARVM AND US FILTER XRVIN WWTF KERV COUNTY
(DHS), which has primary state-wide responsibility for protecting public health, has established statewide criteria in Title 22, California Code of Regulations (CCR), Section 60301, et seq., (hereafter Title 22) for the use of reclaimed (or recycled) water and has developed guidelines for specific uses. The 1988 Memorandum of Agreement (MOA) between DHS and the State Water Resources Control Board on the use of reclaimed water establishes basic principles relative to the agencies and the Regional Boards. In addition, the MOA allocates primary areas of responsibility and authority between these agencies, and provides for methods and mechanisms necessary to assure ongoing, continuous future coordination of activities relative to the use of reclaimed water in California.
The DHS has developed proposed revisions to the existing 1977 reclamation regulations. These revisions are intended to expand the range of allowable uses of reclaimed water, establish criteria for these uses, and clarify some of the ambiguity contained in the existing regulations. Under terms of the MOA, the Board implements the recommendations of DHS for the protection of public health. The DHS has recommended that the'Board implement the regulations as proposed for revision. The proposed revisions are currently in circulation for public comment.
24. The California Department of Water Resources has established standards for the construction and destruction of groundwater wells (hereafter DWR Well Standards). These standards are described in two DWR publications: California Well Standards Bulletin 74-90 (June 199 1) and Water Well Standards: State of California Bulletin 94-81 (December 198 1).
5 . State regulations pertaining to water quality monitoring for waste management units are found in Title 27, California Code of Regulations (CCR), Section 20380 et seq., (hereafter Title 27). These regulations prescribe procedures for detecting and characterizing the impact of waste constituents on groundwater. While the facility has been found exempt from Title 27, the data analysis methods of Title 27 are appropriate for determining whether the discharge complies with the terms for protection of groundwater specified in this Order. As long as the discharge complies the exemption remains warranted.
26. Federal Regulations for storm water discharges were promulgated by the United States Environmental Protection Agency (USEPA) on 16 November 1990 (Title 40 CFR Parts 122, 123, and 124). The regulations require specific categories of facilities, which discharge storm water associated with industrial activity (storm water), to obtain NPDES permits and to implement Best Available Technology Economically Achievable (BAT) and Best Conventional Pollutant Control Technology (BCT)'to reduce or eliminate industrial storm water pollution. The State Water Resources Control Board adopted Order No. 91-1 3-DQ (General Pennit No. CAS000001), amended 17 September 1992, specifying waste discharge requirements for discharges of storm water associated industrial activities, excluding construction activities, and ;equiring submittal of a Notice of Intent by industries to be covered under the permit.
WASTE DISCHARGE REQUIREMENTS ORDER NO. 5-00-093 CITY OF ARVM AND US FILTER ARVMWWTF .
KERN COUNTY
27. Federal sludge management and disposal regulations are prescribed by Title 40 Code of Federal Regulations (CFR), Part 503 (hereafter 40 CFR Part 503). Federal regulations require that the sludge be adequately sampled and analyzed prior to disposal, sludge disposal meet certain pollutant loading limits, and sludge disposal comply with certain operational standards to reduce pathogens and vectors.
28. On 17 February 1998, the City of Arvin certified a Negative Declaration in accordance with the California Environmental Quality Act (CEQA) (Public Resources Code Section 21000 et seq.) and the State CEQA Guidelines for the expanded WWTF. The document addressed only the increase in WWTF treatment capacity and not the need for expanding the designated reclamation area to accommodate additional flow. Board staff reviewed the document and concurs that the WWTF expansion project will not have a significant effect on water quality, provided the Discharger increases its effluent disposal capacity.
29. The conditionaI discharge as permitted herein is consistent with the antidegradation provisions of State Water Resources Control Board Resolution Xo. 68-1 6. Some degradation of groundwater immediately beneath the WWTF is appropriate provided no degradation of groundwater occurs beyond a specific area defined herein by predetermined points of compliance. Degradation of groundwater underlying the WWTF within these points of compliance is consistent with maximum benefit to the people of the State, as the land use at thls location is not expected to ever change and best practical treatment or control can be achieved through a combination of the described treatment processes at the WWTF and water quality monitoring. Assimilative capacity is available in the underlying groundwater to allow for some dcgadation and will not unreasonably affect present and anticipated beneficial use of such water or result in water quality less than that described in the Water Quality Control Plan for the Tulare Lake Basin. Such degradation will be limited to only the groundwater underlying the WWTF within a predetermined area, and monitoring is required to assure protection of the groundwater inside and outside of this area.
30. The Board has notified the Discharger, interested azencies, and persons of its intent to prescribe waste discharge requirements of this discharge and has provided them with an opportunity for a public hearing and an opportunity to submit their witten views and recommendations.
IT IS HEREBY ORDERED that Waste Discharge Requirements Order No. 86-105 is rescinded and that the City of Arvin and United States Filter Corporation, their agents, successors, and assigns, in order to meet the provisions contained in Division 7 of the California Water Code and regulations adopted thereunder, shall comply with the following at the Anin Wastewater Treatment Facility:
WASTE DISCHARGE REQI.TTREMFNTS (:)RL)ER NO. 5-00-093 CITY OF ARVIN AND US FILTER N i V I N W WTF KERN COUNTY
rage I I
A. Dischsrge. Prohibitions
1 . Discharge of waste to surfacc waters or surface water drainage courses is prohibited. Bypass or overflow of untre~ted or partially ireated waste is prohibited, cxcept as allowed in Provision E.2 of Standard Piovisiotls and Reporting Requirements.
2. Dikhargc of waste classified as llazardous' as defined in Seciio~~ 2521(a) of Title 223, CCR; S&tion 2510 et seq., or 'designated,' 2,s dcfintd in Section 13 173 of the Califomiu Waler Codc, is prohibited.
B. Discharge Spciflcrtions
1. Until Provision F.6 is satisfied, the monthly average discharge to efflucnc storage reservoirs shall rrut cxcccd 1.10 mgd fiom 1 Novembcr to 30 Apnl, md 1.28 mgd fro% I May to 3 1 October.
2. Afler Provision F.6 is satisfied, the monthly average discharge to cfflue~~l st~ragc reservoirs shdl not exceed 1.26 mgd from 1 November to 30 April, and 1.45 ingd fiom 1 May 110 31 October.
3. After Provision F.7 is satisfled, the nionthly average discharge lo effluent slwagc reservoirs shall not exceed 2.0 mgd from 1 November to 30 April, and 2.30 mgd f h m I May to 3 1 October.
4. The rnaximun~ EC of discharge from the IwTF shall not excced the average EC of the source water plus 500 pmhus/cm.
5. Discharge to the effluent storage rcservo1r-s shall not exceed the following limits:
Constituent .-- Units -. - M z t h l y Average -. Daily Maxim=
BODI' mg/I 40 l'otal Suspetlded Solids m€fl 40 Settleable Solids rn 111 0.2 .-..-. - . .- ' Fi.ve-day, 20°C biochemical oxygen demand
6 . Discharge to the designtlted reclamation area and storage reservoirs contaiding iiutti~''&n.d/or cu~~Unel-cial fertilizers shall be consistent withal>~Iicabre a g o n ~ r i t i c ~ l o a d l r ~ s iccipta$lg, . . ,;. . , ,
to the Board.
WASTE DISCHARGE REQUIREMENTS ORDER NO. 5-00-093 CITY OF ARVIN AND US FILTER ARVIN WWTF KERN COUNTY
7. Effluent in storage reservoirs should not have a pH less than 6.5 or greater than 8.5.
8. Effluent storage reservoirs shall be managed to prevent breeding of mosquitoes.
9. Objectionable odors originating at this facility shall not be perceivable beyond the limits of the wastewater treatment and disposal area.
10. As a means of discerning compliance with Discharge Specification B.9, the dissolved oxygen content in the upper zone (i.e., 1-foot) of effluent storage reservoirs shall not be less than 1.0 mg/l.
1 1. Freeboard in all effluent storage reservoirs shall never be less than two feet (measured vertically to the lowest point of potential overflow).
12. The WWTF, in conjunction with the designated reclamation area, shall have sufficient capacity to accommodate allowable wastewater flow and design seasonal precipitation and ancillary inflow and infiltration. Design seasonal precipitation shall be used on total annual precipitation using a return period of 100 years, distributed monthly in accordance with historical rainfall patterns.
13. The WVTF shall be designed, constructed, operated, and maintained to prevent inundation or washout due to floods with a 100-year return frequency.
14. Public contact with wastewater shall be precluded through such means as fences and signs, or acceptable alternatives.
C. Designated Reclamation Area Specifications
1. Water reclamation shall be limited to furrow or flood inigation of fodder, fiber, and seed crops for nonhuman consumption.
2. Reclaimed water used for inigation shall be managed to minimize erosion.
3. The perimeter of the application area shall be graded to prevent ponding along public roads or other public areas.
4. Application of reclaimed water to the application area shall be at reasonable rates considering the crops, soil, climate, and irrigation management system.
5. The Discharger shall maintain the following setback distances fiom areas imgated with reclaimed water:
WASTE DISCHARGE REQUIRElMENTS ORDER NO. 5-00-093 CITY OF ARVM AND US FILTER ARVIN WWTF KERN COUNTY
Setback Distance (feet)
Property line Public roads Irrigation wellsldrainage courses Domestic wells
6. Areas irrigated with reclaimed water should be managed to prevent breeding of mosquitoes. More specifically:
a. All applied reclaimed water must infiltrate completely within a 48-hour period.
b. Ditches must be maintained free of emergent, marginal, and floating vegetation.
c. Low-pressure and unpressurized pipel.ines and ditches accessible to mosquitoes shall not be used to store wastewater.
7. All areas where reclaimed water is to be used shall be posted with conspicuous signs displaying the following wording or its equivalent in a size that can be clearly read at a distance by the public:
'WO TRESPASSING SEWER WATER DANGER - PELIGRO DO NOT DRMK NO SE BEBEN LA AGUA"
The signs will have the universal "Do not drink" cross-out underneath the wording (see Attachment C).
8. No physical connection shall exist between reclaimed water piping and any domestic water supply well, or between reclaimed water piping and any irrigation well that does not have an air gap or reduced pressure principle device.
D. Solids Disposal Specifications
1. Collected screenings, sludges, and other solids removed fiom liquid wastes shall be disposed of in a manner that is consistent with Title 27, CCR, Division 2, Subdivision 1, Section 20005 et seq., and approved by the Executive Officer.
2. Any proposed change in sludge use or disposal practice shall be reported to the Executive Officer and USEPA Regional Administrator a t least 90 days in advance of the change.
3. Use and disposal of sewage sludge shall comply with state laws and regulations. If the State Water Resources Control Board and the regional water quality control boards assume primacy to
WASTE DISCHARGE REQUIREMENTS ORDER NO. 5-00-093 CITY OF ARVIN AND US FILTER ARVN UWTF KERN COUNTY
implement regulations contained in 40 CFR 503, this Order may be reopened to incorporate appropriate time schedules and technical standards. In the interim, the Discharger should comply with the standards and time schedules contained in 40 CFR 503, which shall be enforced by the United States Environmental Protection Agency (USEPA).
E. Groundwater Limitations
A point of compliance (POC) as referenced herein means a vertical line that extends through the uppermost aquifer underlying the unit. Every POC must be hydraulically downgradient fiom the point of discharge. A POC may define either a point on a vertical surface representing the maximum horizontal extent of allowable degradation ('boundary, POC') or a point within this area ('internal POC'). Properly constructed groundwater monitoring wells capable of yielding representative samples from the uppermost layer of water shall be used to monitor water quality at POCs and to determine upgradient water quality according to a plan approved by the Executive Officer.
1. The discharge in combination with other sources, shall not cause groundwater underlying the WWTF inside the boundary POCs, to contain the following indicator parameters in concentrations that:
a. Are statistically greater than 2 mgll nitrogen (as N) above background water quality, or a total of 10 mg/l, whichever is less.
b. Are equal to or greater than 2.21100 ml total coliforrn orsanisms over any seven day period.
c. Are statistically greater than 5 mg/l total dissolved solids above background water quality, or a total of 400 mg/l, whichever is less
d. Impart tastes or odor that cause nuisance or adversely affect beneficial uses.
2. The discharge shall not cause groundwater passing or that are the boundary POCs and beyond to contain waste constituents in concentrations statistically greater than background water quality except for conductivity, which shall not exceed 25 pmhoslcm over any five year period.
F. . Provisions
1. The Discharger shall comply with Monitoring and Reporting Program No. 5-00-093, which is part of this Order, and any revisions thereto as ordered by the Executive Officer.
WASTE DISCHARGE REQUIREMENTS ORDER NO. 5-00-093 CITY OF ARVIN AND US FILTER ARVIN WWTF KERN COUNTY
2 . The Discharger shall comply with the Standard Provisions and Reporting Requiremenrsfor Waste Discharge Requirements, dated 1 March 199 1, which are attached hereto and by reference a part of this Order. This attachment and its individual paragraphs are commonly referenced as Standard Provision(s).
3. By September 2000, the Discharger shall submit the following technical reports:
a. A technical report describing the Discharger's water reclamation operation and a contingency plan that will assure that untreated or inadequately treated wastewater will not be discharged to the designated reclamation area. The report shall clearly indicate the means for compliance with Designated Reclamation Area Specifications C. 1 through C.8, and shall be prepared by a civil engineer registered in California and experienced in the design of wastewater treatment and disposal facilities.
b. A technical report describing a work plan for the installation of a groundwater-monitoring network. The network shall consist of one or more background mbnitoring wells and two or more downgradient wells capable of yielding representative samples from the uppermost layer of water representative of the uppermost aquifer located at the hydraulically downgradient limit(s) of the WWTF andlor designated reclamation area. All monitoring wells shall meet DWR Well Standards in addition to performance standards prescribed by Title 27, Section 20415(b)(4) et seq. All well locations and construction features are subject to the prior approval of the Executive Officer and must be sufficient to monitor potential impacts of wastewater discharge discharge to storage reservoirs and the designated reclamation area on the uppermost groundwater aquifer. Within 60 days following workplan approval, the Discharger shall implement the program. Within 30 days following the construction of the approved network, the Discharger shall submit copies of drillers' logs and "as built" construction drawings of each groundwater monitoring well, as well as properly surveyed reference point elevations for each well.
4. The Discharger shall commence monitoring of the background monitoring wells within 30 days of completion of the approved groundwater monitoring network and shall monitor for all specified constituents of concern. The groundwater monitoring program shall include consistent sampling and analytical procedures that are designed to ensure that monitoring results provide a reliable indication of water quality at all monitoring points.
5. After one full year of monitoring of at least the frequency specified in the Monitoring and Reporting Program, the Discharger shall characterize background groundwater quality using data from approved background well(s) using methods as described by Title 27, Section 20415(e)(10). The Discharger shall use these background values and quarterly POC well
WASTE DISCHARGE REQUIREMENTS ORDER NO. 5-00-093 CITY OF ARVIN AND US FILTER A R V N WWTF KEFW COUNTY
monitoring data and an appropriate data analysis method, as described by Title 27, Section 20415(e)(7-9), to determine whether there is statistically significant evidence of an increase in the concentrations of constituents of concern in groundwater passing the POCs.
6. To increase the WWTF's monthly average wet weather discharge to 1.26 mgd, and summertime discharge to 1.45 mgd for water reclamation, the Discharger shall submit a technical report indicating the storage capacity and construction details of the proposed 20-acre emergency eMuent storage/reclarnation area (as described by Boyle Engineering in its water balance report dated 17 February 2000). Upon written acceptance of the technical report by the Executive Officer, this Provision will be satisfied.
7. To increase the WWTF's disposal capacity to 2 mgd by water reclamation, the Discharger shall submit a technical report containing a complete description of additional property purchased or leased on which Discharger proposes to reclaim WWTF effluent. This report shall include, at a minimum, a description of the proposed reclamation property, its location and Assessor Parcel Number(s), crop types and growing seasons, groundwater well locations and construction details, and other information as necessary to demonstrate that the Discharger's use of the property for reclamation will comply with the terms and conditions of this Order.
All technical reports shall be prepared by a California registered civil engineer experienced in the design of wastewater treatment and disposal facilities. Upon DHS approval and written acceptance of the technical report by the Executive Officer, this Provision will be satisfied and the designated reclamation area (as defined in FindingNo. 3) will be revised to include additional reclamation area(s) as approved by the Executive Officer.
8. The use of reclaimed water shall comply with provisions contained in Title 22.
9. The Discharger shall notify the Board, in writing, at least 120 days prior to (a) any introduction of pollutants into the WWTF by an industrial user, and (b) any substantial change in the volume or character of wastewater being introduced into the WWTF.
10. The Discharger shall enforce the Pretreatment Standards promulgated under Sections 307(b), 307(c) and 307(d) of the Clean Water Act. The Discharger shall perform the pretreatment functions required by 40 CFR Part 403 including but not .limited to:
a. Adopting the legal authority required by 40 CFR 403.8(f)(l);
b. Enforcing the Pretreatment Standards of 40 CFR 403.5 and 403.6;
?.VASTE DISCHARGE REQUIREMENTS ORDER NO. 5-00-093 CITY OF ARVTN AND US FILTER ARVM WWTF KERN COUNTY
c. Implementing procedures to ensure compliance as required by 40 CFR 403.8(f)(2); and
d. Providing funding and personnel for implementation and enforcement of the pretreatment program as required by 40 CFR 403.8(f)(3).
1 1. The Discharger shall implement its approved pretreatment program and the program shall be an enforceable condition of this pennit. If the Discharger fails to perform the pretreatment functions, the Regional Water Quality Control Board (RWQCB), the State Water Resources Control Board (SWRCB) or the U.S. Environmental Protection Agency (U.S. EPA) may take enforcement actions against the Discharger as authorized by the Clean Water Act.
12. The Discharger shall implement, as more completely set forth in 40 CFR 403.5, the necessary legal authorities, programs, and controls to ensure that the following incompatible wastes are not introduced to the treatment system, where incompatible wastes are:
a. - Wastes that create a fire or explosion hazard in the treatment works;
b. Wastes that will cause corrosive structural damage to treatment works, but in no case wastes with a pH lower than 5.0, unless the works is specially designed to accommodate such wastes;
c. Solid or viscous wastes in amounts that cause obstruction to flow in sewers, or which cause other interference with proper operation or treatment works;
d. Any waste, including oxygen demanding pollutants (BOD, etc.), released in such volume or strength as to cause inhibition or disruption in the treatment works, and subsequent treatment process upset and loss of treatment efficiency;
e. Heat in amounts that inhibit or disrupt biological activity in the treatment works, or that raise influent temperatures above 40°C (104"F), unless the Regional Board approves alternate temperature limits;
f. Petroleum oil, nonbiodegradable cutting oil, or products of mineral oil origin in amounts that will cause interference or pass through;
g. Pollutants that result in the presence of toxic gases, vapors, or fumes within the treatment works in a quantity that may cause acute worker health and safety problems; and
h. Any trucked or hauled pollutants, except at points predesignated by the Discharger.
M:.4STE DISCHARGE REQUIREMENTS ORDER NO. 5-00-093 CITI' OF ARVM AND US FILTER AR\'IN WWTF Ern1 COUNTY
I
1;. In the event of any change in control or ownership of land or waste discharge facilities described herein, the Discharger shall notify the succeeding owner or v e n t o r of the existence of this Order by letter, a copy of which shall be immediately forwarded to this office.
To assume operation under this Order, the succeeding owner or operator must apply in writing to the Executive OEcer requesting transfer of the Order. The request must contain the requesting entity's full legal name, the state of incorporation if a corporation, the name and address and telephone number of the persons responsible for contact with the Board, and a statement. The statement shall comply with the sigatory para_mph of Standard Provision B.3
. and state that the new owner or operator assumes full responsibility for compliance with this Order. Failure to submit the request shall be considered a diszharge without requirements, a ~~iolation of the California Water Code. Transfer shall be appro\red or disapproved by the Executive Ofncer.
14. The Discharzer must comply with all conditions of this Order, including timely submittal of technical and monitoring reports as directed by the Executive Officer. iriolations may result in enforcement action, including the Board or court orders requiing corrective action or imposing civil monetary liability, or in revision or rescission of this Ordor.
15. A copy of this Order shall be kept at the discharge facility for reference by WWTF operating personnel. Key operating personnel shall be familiar with its contents.
16. The Board will review this Order periodicilly and will revise rquirements when necessary.
I, G.4RY M. CARLTON, Executive Officer, do h&y certify the foresoin: is a full, me , and correct copy of an Order adopted by the California Regional Water Quality Control Board, Central Valley Region, on 38 April 2000.
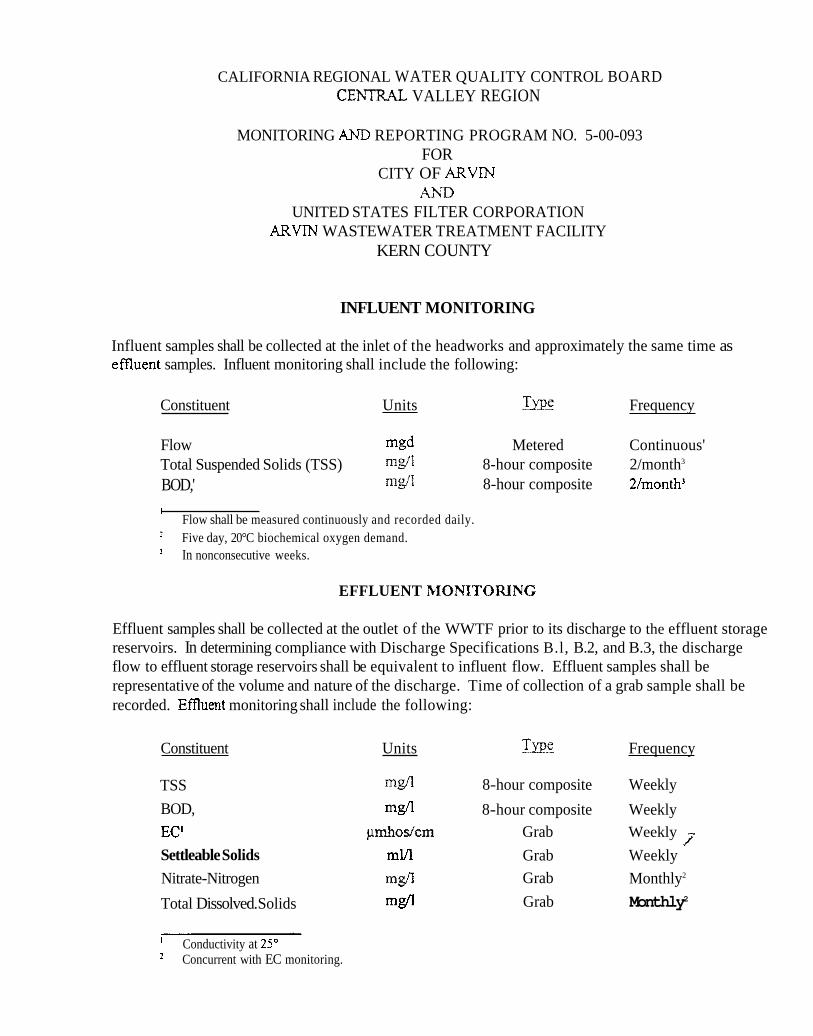
CALIFORNIA REGIONAL WATER QUALITY CONTROL BOARD CEhTR.4.L VALLEY REGION
MONITORING AND REPORTING PROGRAM NO. 5-00-093 FOR
CITY OF ARVM AND
UNITED STATES FILTER CORPORATION ARVIN WASTEWATER TREATMENT FACILITY
KERN COUNTY
INFLUENT MONITORING
Influent samples shall be collected at the inlet of the headworks and approximately the same time as effluent samples. Influent monitoring shall include the following:
Constituent Units EIE Frequency
Flow mgd Metered Continuous' Total Suspended Solids (TSS) mg/l 8-hour composite 2/month3
BOD,' mg/l 8-hour composite 2/month3
' Flow shall be measured continuously and recorded daily. Five day, 20°C biochemical oxygen demand.
' In nonconsecutive weeks.
EFFLUENT ~IONITOFUNG
Effluent samples shall be collected at the outlet of the WWTF prior to its discharge to the effluent storage reservoirs. In determining compliance with Discharge Specifications B.l, B.2, and B.3, the discharge flow to effluent storage reservoirs shall be equivalent to influent flow. Effluent samples shall be representative of the volume and nature of the discharge. Time of collection of a grab sample shall be recorded. Effluent monitoring shall include the following:
Constituent Units Type Frequency
TSS mgll 8-hour composite Weekly
BOD, mg/l 8-hour composite Weekly
EC' pmhos/cm Grab Weekly
Settleable Solids ml/l Grab Weekly
Nitrate-Nitrogen mgfl Grab Monthly2
Total Dissolved. Solids mg/l Grab Monthly2
' Conductivity at 25" Concurrent with EC monitoring.
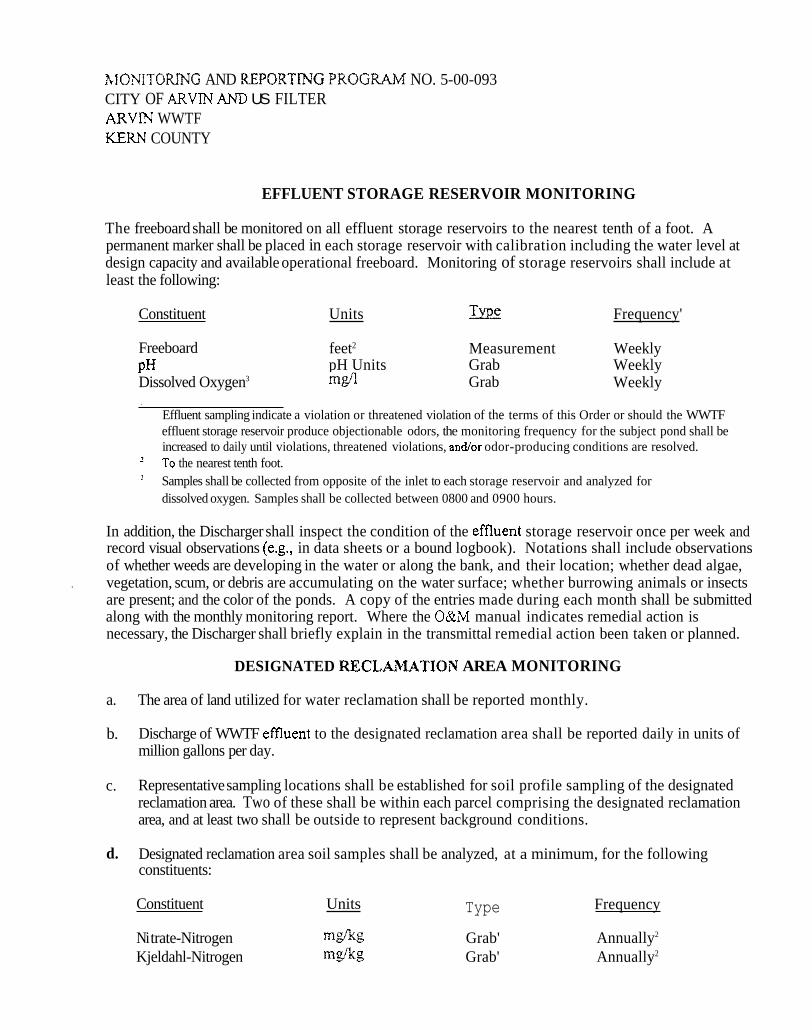
h1ONITORMG AND REPORTDIG PROGRPLM NO. 5-00-093 CITY OF ARVTN AND US FILTER ARVM WWTF KERN COUNTY
EFFLUENT STORAGE RESERVOIR MONITORING
The freeboard shall be monitored on all effluent storage reservoirs to the nearest tenth of a foot. A permanent marker shall be placed in each storage reservoir with calibration including the water level at design capacity and available operational freeboard. Monitoring of storage reservoirs shall include at least the following:
Constituent Units & Frequency'
Freeboard feet2 Measurement Weekly PH pH Units Grab Weekly Dissolved Oxygen3 m&'l Grab Weekly
' Effluent sampling indicate a violation or threatened violation of the terms of this Order or should the WWTF effluent storage reservoir produce objectionable odors, the monitoring frequency for the subject pond shall be increased to daily until violations, threatened violations, andfor odor-producing conditions are resolved.
"0 the nearest tenth foot. Samples shall be collected from opposite of the inlet to each storage reservoir and analyzed for dissolved oxygen. Samples shall be collected between 0800 and 0900 hours.
In addition, the Discharger shall inspect the condition of the effluent storage reservoir once per week and record visual observations (e.g., in data sheets or a bound logbook). Notations shall include observations of whether weeds are developing in the water or along the bank, and their location; whether dead algae,
. vegetation, scum, or debris are accumulating on the water surface; whether burrowing animals or insects are present; and the color of the ponds. A copy of the entries made during each month shall be submitted along with the monthly monitoring report. Where the O&M manual indicates remedial action is necessary, the Discharger shall briefly explain in the transmittal remedial action been taken or planned.
DESIGNATED RECLAMATION AREA MONITORING
a. The area of land utilized for water reclamation shall be reported monthly.
b. Discharge of WWTF effluent to the designated reclamation area shall be reported daily in units of million gallons per day.
c. Representative sampling locations shall be established for soil profile sampling of the designated reclamation area. Two of these shall be within each parcel comprising the designated reclamation area, and at least two shall be outside to represent background conditions.
d. Designated reclamation area soil samples shall be analyzed, at a minimum, for the following constituents:
Constituent Units Type Frequency
Ni trate-Nitrogen mgfl<g Grab' Annually2
Kjeldahl-Nitrogen mg1-b Grab' Annually2
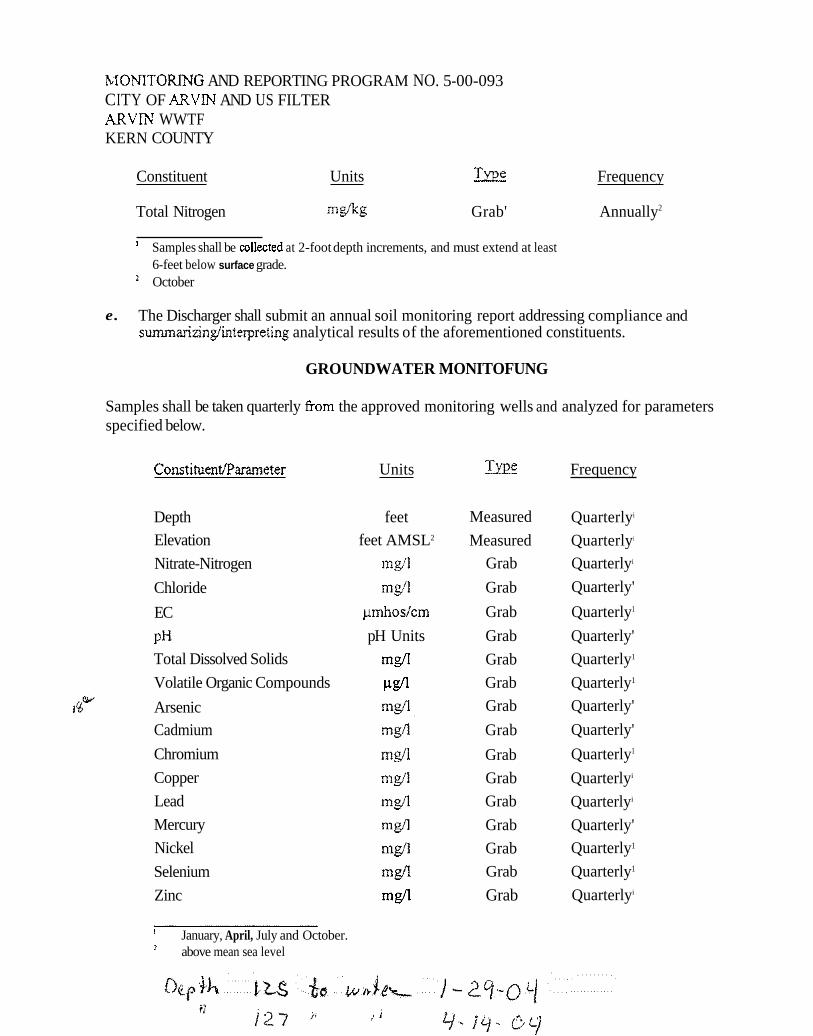
bIONITOlUNG AND REPORTING PROGRAM NO. 5-00-093 CITY OF ARVIN AND US FILTER ARVm WWTF KERN COUNTY
Constituent Units DIE Frequency
Total Nitrogen m&g Grab' Annually2
Samples shall be collected at 2-foot depth increments, and must extend at least 6-feet below surface grade. October
e. The Discharger shall submit an annual soil monitoring report addressing compliance and summarizing/interpreting analytical results of the aforementioned constituents.
GROUNDWATER MONITOFUNG
Samples shall be taken quarterly from the approved monitoring wells and analyzed for parameters specified below.
ConstituentParameter Units IYIE Frequency
Depth
Elevation
Nitrate-Nitrogen
Chloride
EC
pH Total Dissolved Solids
Volatile Organic Compounds
I%* Arsenic Cadmium
Chromium
Copper
Lead
Mercury
Nickel
Selenium
Zinc
feet
feet AMSL2
mg/l
mg/l pmhoslcm
pH Units
mg/l
clgn mgA. mg/l
mg/l mg/l
mg/l
mg/l
mg/l
m f l
mg/l
Measured
Measured Grab
Grab
Grab
Grab
Grab
Grab
Grab
Grab
Grab
Grab
Grab
Grab
Grab
Grab
Grab
Quarterlyi
Quarterlyi
Quarterlyi
Quarterly'
Quarterly1
Quarterly'
Quarterly1
Quarterly1
Quarterly'
Quarterly'
Quarterly1
Quarterlyi
Quarterlyi
Quarterly'
Quarterly1
Quarterly1
Quarterlyi
I January, April, July and October. above mean sea level
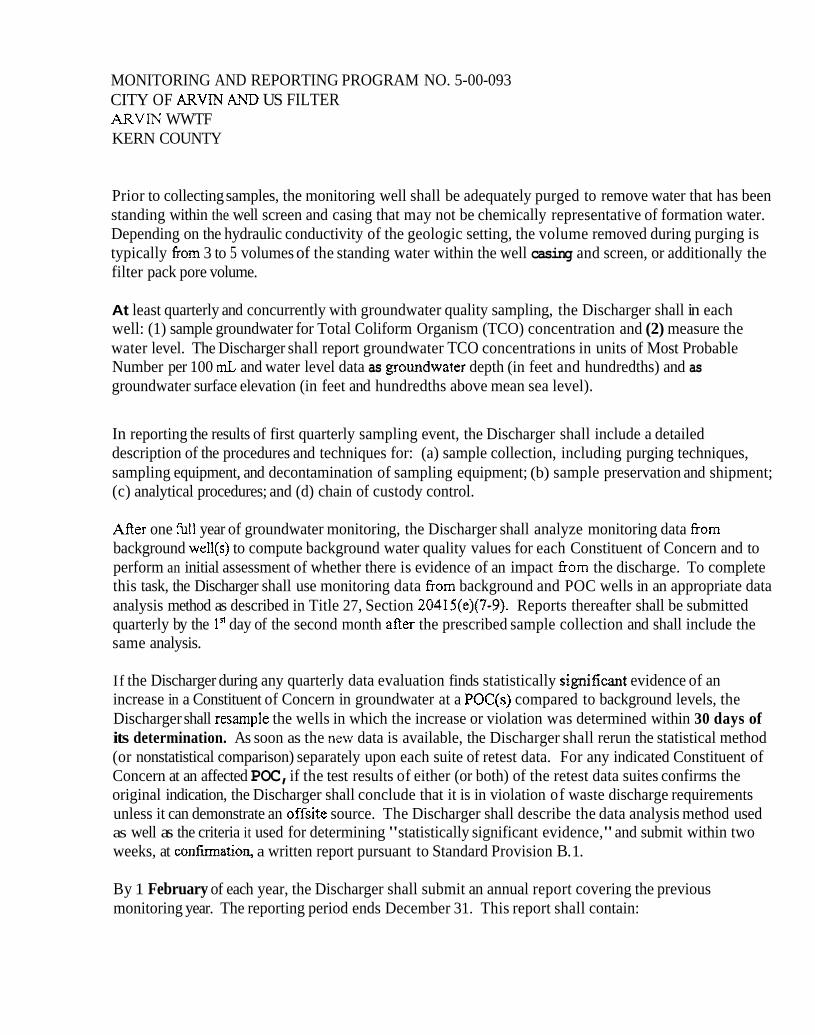
MONITORING AND REPORTING PROGRAM NO. 5-00-093 CITY OF ARVJN AND US FILTER m V I N WWTF KERN COUNTY
Prior to collecting samples, the monitoring well shall be adequately purged to remove water that has been standing within the well screen and casing that may not be chemically representative of formation water. Depending on the hydraulic conductivity of the geologic setting, the volume removed during purging is typically from 3 to 5 volumes of the standing water within the well casing and screen, or additionally the filter pack pore volume.
At least quarterly and concurrently with groundwater quality sampling, the Discharger shall in each well: (1) sample groundwater for Total Coliform Organism (TCO) concentration and (2) measure the water level. The Discharger shall report groundwater TCO concentrations in units of Most Probable Number per 100 rnL and water level data as groundwater depth (in feet and hundredths) and as groundwater surface elevation (in feet and hundredths above mean sea level).
In reporting the results of first quarterly sampling event, the Discharger shall include a detailed description of the procedures and techniques for: (a) sample collection, including purging techniques, sampling equipment, and decontamination of sampling equipment; (b) sample preservation and shipment; (c) analytical procedures; and (d) chain of custody control.
After one full year of groundwater monitoring, the Discharger shall analyze monitoring data from background well(s) to compute background water quality values for each Constituent of Concern and to perform an initial assessment of whether there is evidence of an impact from the discharge. To complete this task, the Discharger shall use monitoring data from background and POC wells in an appropriate data analysis method as described in Title 27, Section 20415(e)(7-9). Reports thereafter shall be submitted quarterly by the In day of the second month after the prescribed sample collection and shall include the same analysis.
If the Discharger during any quarterly data evaluation finds statistically significant evidence of an increase in a Constituent of Concern in groundwater at a POC(s) compared to background levels, the Discharger shall resarnple the wells in which the increase or violation was determined within 30 days of its determination. As soon as the new data is available, the Discharger shall rerun the statistical method (or nonstatistical comparison) separately upon each suite of retest data. For any indicated Constituent of Concern at an affected POC, if the test results of either (or both) of the retest data suites confirms the original indication, the Discharger shall conclude that it is in violation of waste discharge requirements unless it can demonstrate an offsite source. The Discharger shall describe the data analysis method used as well as the criteria it used for determining "statistically significant evidence," and submit within two weeks, at confiation, a written report pursuant to Standard Provision B. 1.
By 1 February of each year, the Discharger shall submit an annual report covering the previous monitoring year. The reporting period ends December 3 1. This report shall contain:
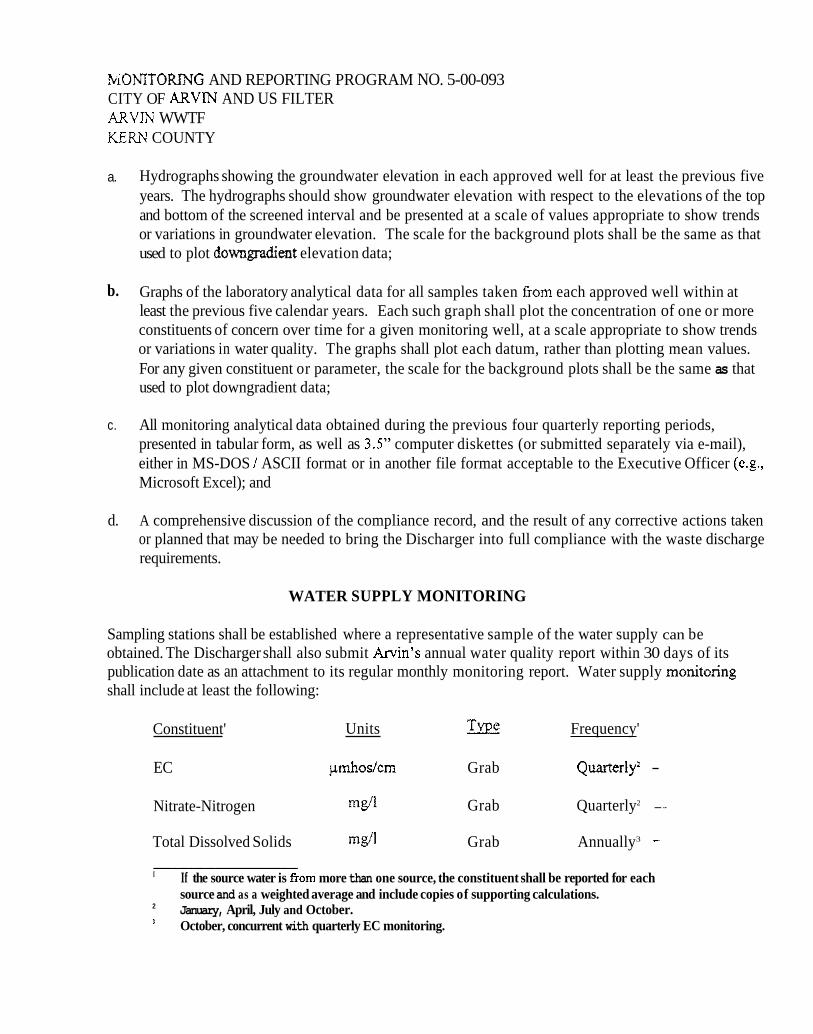
kiONITORMG AND REPORTING PROGRAM NO. 5-00-093 CITY OF ARVIN AND US FILTER ARVK WWTF KEm' COUNTY
a. Hydrographs showing the groundwater elevation in each approved well for at least the previous five years. The hydrographs should show groundwater elevation with respect to the elevations of the top and bottom of the screened interval and be presented at a scale of values appropriate to show trends or variations in groundwater elevation. The scale for the background plots shall be the same as that used to plot downgradient elevation data;
b. Graphs of the laboratory analytical data for all samples taken from each approved well within at least the previous five calendar years. Each such graph shall plot the concentration of one or more constituents of concern over time for a given monitoring well, at a scale appropriate to show trends or variations in water quality. The graphs shall plot each datum, rather than plotting mean values. For any given constituent or parameter, the scale for the background plots shall be the same as that used to plot downgradient data;
c. All monitoring analytical data obtained during the previous four quarterly reporting periods, presented in tabular form, as well as 3.5" computer diskettes (or submitted separately via e-mail), either in MS-DOS / ASCII format or in another file format acceptable to the Executive Officer (e.g., Microsoft Excel); and
d. A comprehensive discussion of the compliance record, and the result of any corrective actions taken or planned that may be needed to bring the Discharger into full compliance with the waste discharge requirements.
WATER SUPPLY MONITORING
Sampling stations shall be established where a representative sample of the water supply can be obtained. The Discharger shall also submit Arvin's annual water quality report within 30 days of its publication date as an attachment to its regular monthly monitoring report. Water supply monitoring shall include at least the following:
Constituent' Units In?? Frequency'
EC pmhos/cm Grab Quarterly -
Nitrate-Nitrogen m f l Grab Quarterly2 ---
Total Dissolved Solids mg/l Grab Annually3 .-
I If the source water is from more than one source, the constituent shall be reported for each source and as a weighted average and include copies of supporting calculations.
2 January, April, July and October. October, concurrent with quarterly EC monitoring.
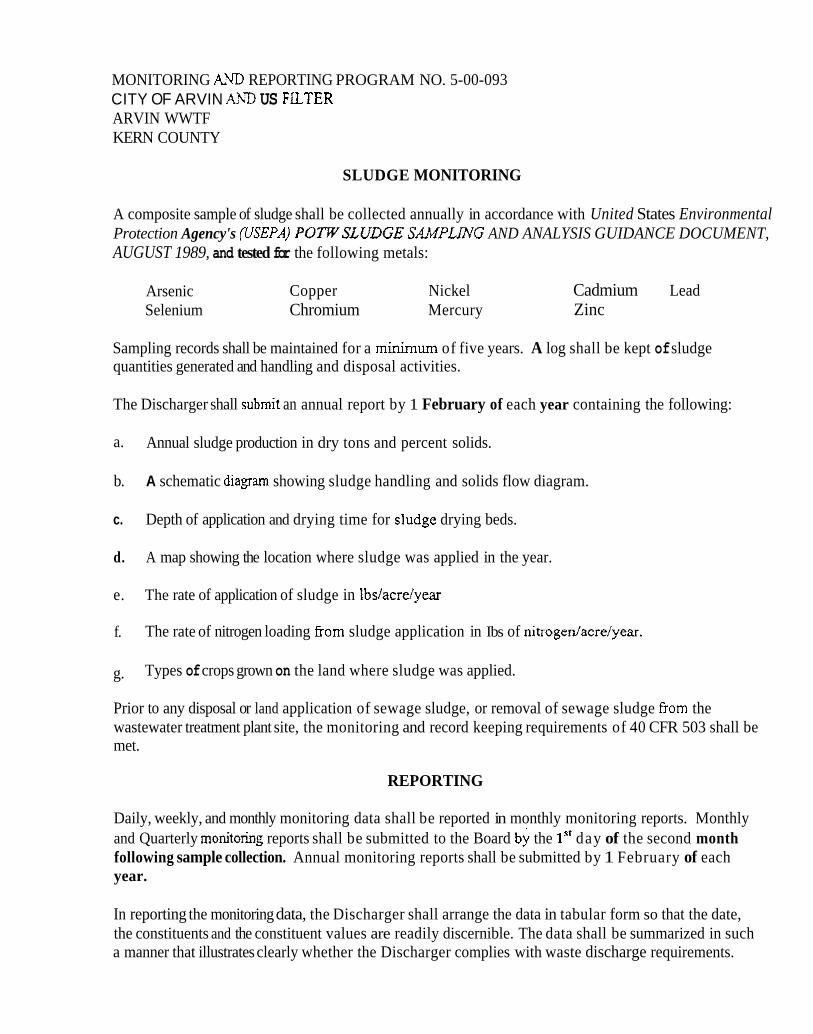
MONITORING AND REPORTING PROGRAM NO. 5-00-093 CITY OF ARVIN A-hD US FILTER ARVIN WWTF KERN COUNTY
SLUDGE MONITORING
A composite sample of sludge shall be collected annually in accordance with United States Environmental Protection Agency's (VSEPA) P O W S L U D G E SAMPLlNG AND ANALYSIS GUIDANCE DOCUMENT, AUGUST 1989, and tested for the following metals:
Arsenic Copper Nickel Cadmium Lead Selenium Chromium Mercury Zinc
Sampling records shall be maintained for a minimum of five years. A log shall be kept of sludge quantities generated and handling and disposal activities.
The Discharger shall subrnit an annual report by 1 February of each year containing the following:
a. Annual sludge production in dry tons and percent solids.
b. A schematic diagram showing sludge handling and solids flow diagram.
c. Depth of application and drying time for sludge drying beds.
d. A map showing the location where sludge was applied in the year.
e. The rate of application of sludge in lbs/acre/year
f. The rate of nitrogen loading fiom sludge application in Ibs of nitrogenlacrelyear.
g. Types of crops grown on the land where sludge was applied.
Prior to any disposal or land application of sewage sludge, or removal of sewage sludge from the wastewater treatment plant site, the monitoring and record keeping requirements of 40 CFR 503 shall be met.
REPORTING
Daily, weekly, and monthly monitoring data shall be reported in monthly monitoring reports. Monthly and Quarterly monitoring reports shall be submitted to the Board by the 1" day of the second month following sample collection. Annual monitoring reports shall be submitted by 1 February of each year.
In reporting the monitoring data, the Discharger shall arrange the data in tabular form so that the date, the constituents and the constituent values are readily discernible. The data shall be summarized in such a manner that illustrates clearly whether the Discharger complies with waste discharge requirements.
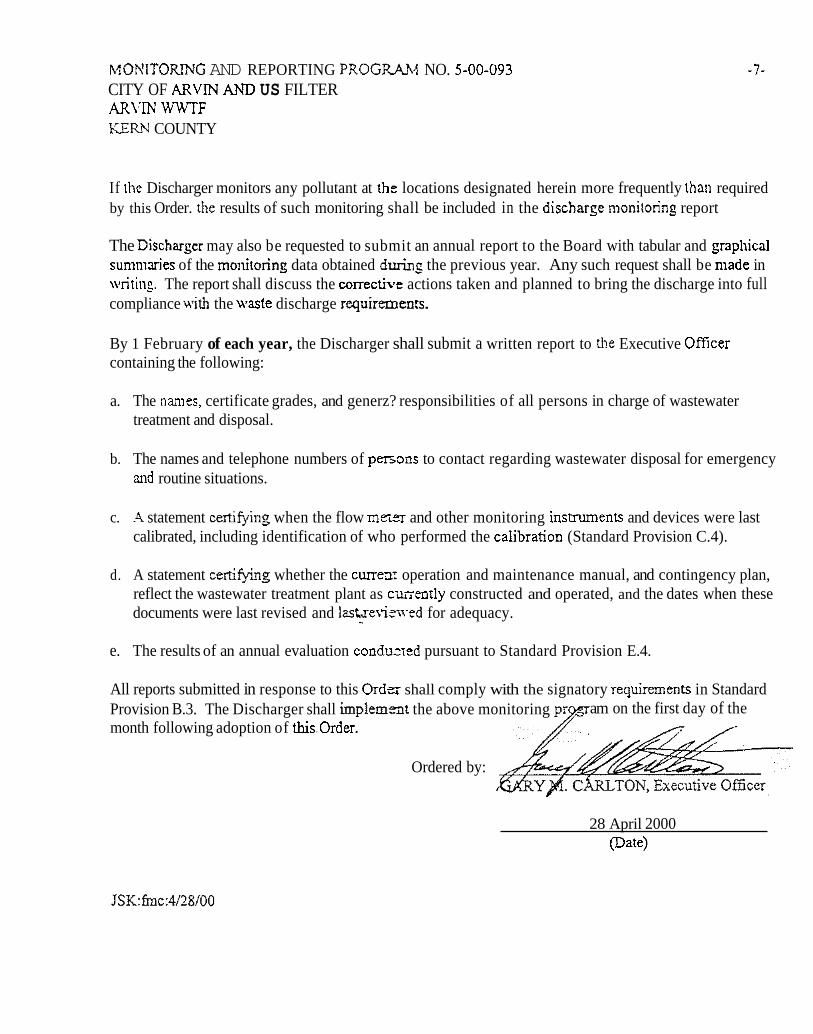
hlONlTORMG AND REPORTING PROGRAM NO. 5-00-093 CITY OF ARVM AND US FILTER AR\'M WWTF mw COUNTY
If the Discharger monitors any pollutant at thz locations designated herein more frequently than required by this Order. the results of such monitoring shall be included in the dischar~e monitorins report
The ~ i s c h a r ~ e r may also be requested to submit an annual report to the Board with tabular and ~raphical sun~nlaries of the monitoring data obtained dmin_c the previous year. Any such request shall be made in writins. The report shall discuss the corrective actions taken and planned to bring the discharge into full compliance ~ l t h the waste discharge requiremenrs.
By 1 February of each year, the Discharger shall submit a written report to the Executive Officer containing the following:
a. The names, certificate grades, and generz? responsibilities of all persons in charge of wastewater treatment and disposal.
b. The names and telephone numbers of p=ons to contact regarding wastewater disposal for emergency and routine situations.
c. -4 statement certifiing when the flow m e i i and other monitoring instruments and devices were last calibrated, including identification of who performed the calibration (Standard Provision C.4).
d. A statement certifying whether the curreaz operation and maintenance manual, and contingency plan, reflect the wastewater treatment plant as c-iiently constructed and operated, and the dates when these documents were last revised and lastzevku-ed for adequacy.
s
e. The results of an annual evaluation conduzrtd pursuant to Standard Provision E.4.
All reports submitted in response to this Ordzr shall comply with the signatory requirements in Standard Provision B.3. The Discharger shall implemzat the above monitoring am on the first day of the month following adoption of this.0rder.
Ordered by:
28 April 2000 @ate)
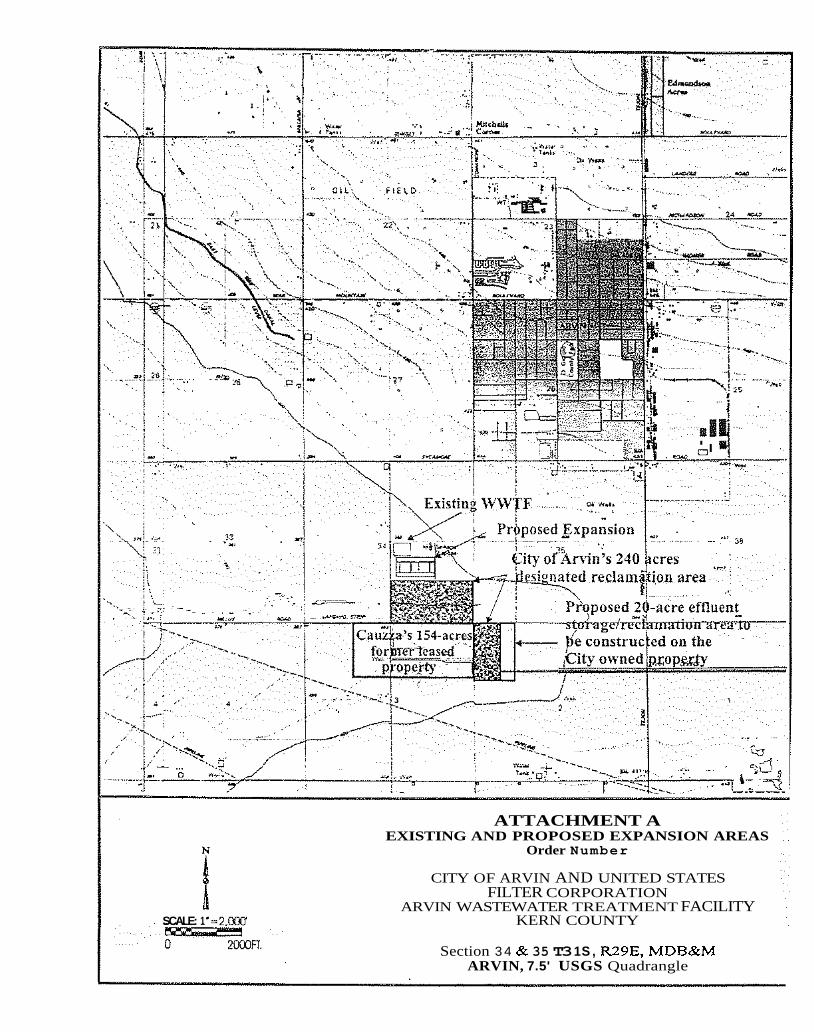
' . . . ,..
. . . , , . . , . . . . , . .. . . . -.
ATTACHMENT A EXISTING AND PROPOSED EXPANSION AREAS
Order Number
CITY OF ARVIN AND UNITED STATES FILTER CORPORATION
ARVIN WASTEWATER TREATMENT FACILITY SCALE: 1 '=2,00(r KERN COUNTY
Section 3 4 & 35 T3 1 S , R29E, MDB&M ARVIN, 7.5' USGS Quadrangle
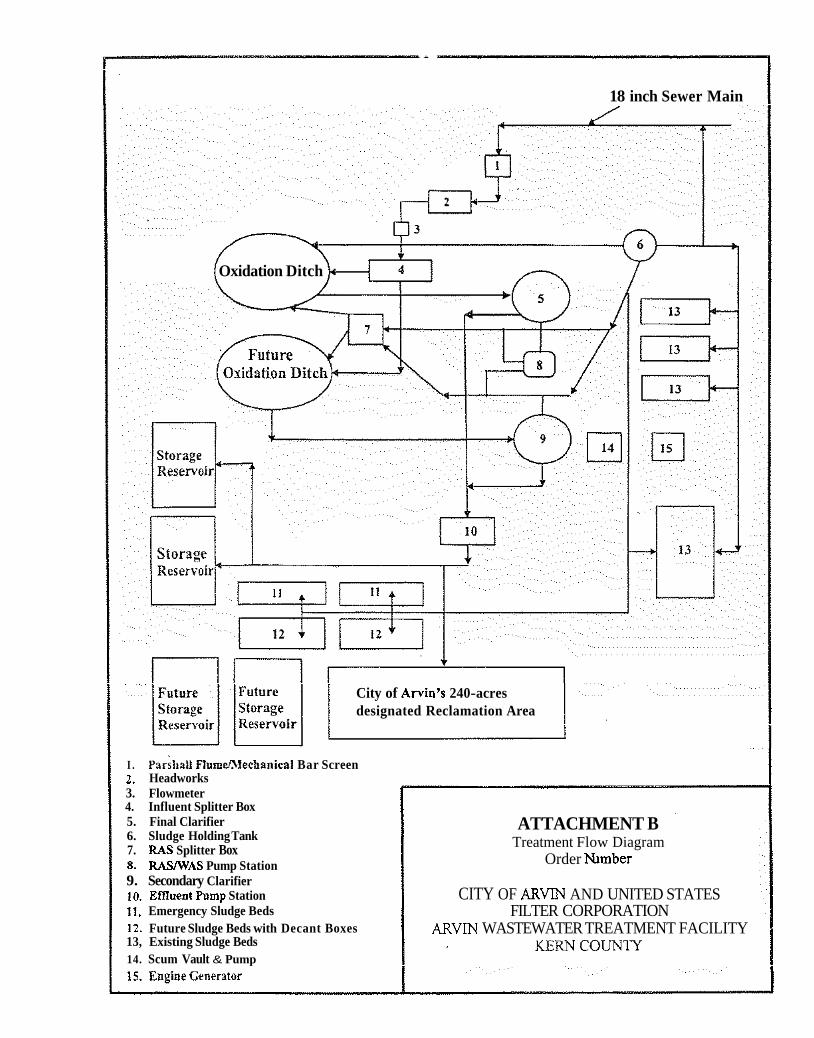
18 inch Sewer Main
Oxidation Ditch
City of Arvin's 240-acres designated Reclamation Area
I . ~ a r i h a ~ Flum&Iechanieal Bar Screen 2. Headworks 3. Flowmeter 4. Influent Splitter Box 5. Final Clarifier 6. Sludge Holding Tank
ATTACHMENT B 7. RAS Splitter Box Treatment Flow Diagram
8. RASJWAS Pump Station Order Kmber 9. Secondary Clarifier 10. Emuent Pomp Station CITY OF A R W AND UNITED STATES 11. Emergency Sludge Beds FILTER CORPORATION 12. Future Sludge Beds with Decant Boxes ARVM WASTEWATER TREATMENT FACILITY 13, Existing Sludge Beds KERN COUNTY 14. Scum Vault & Pump
ATTACHMENT C Order No.
CITY OF A R W AND UNlTED STATES FILTER CORPORATION
ARVIN WASTEWATER TREATMENT FACILITY KERN COUNTY
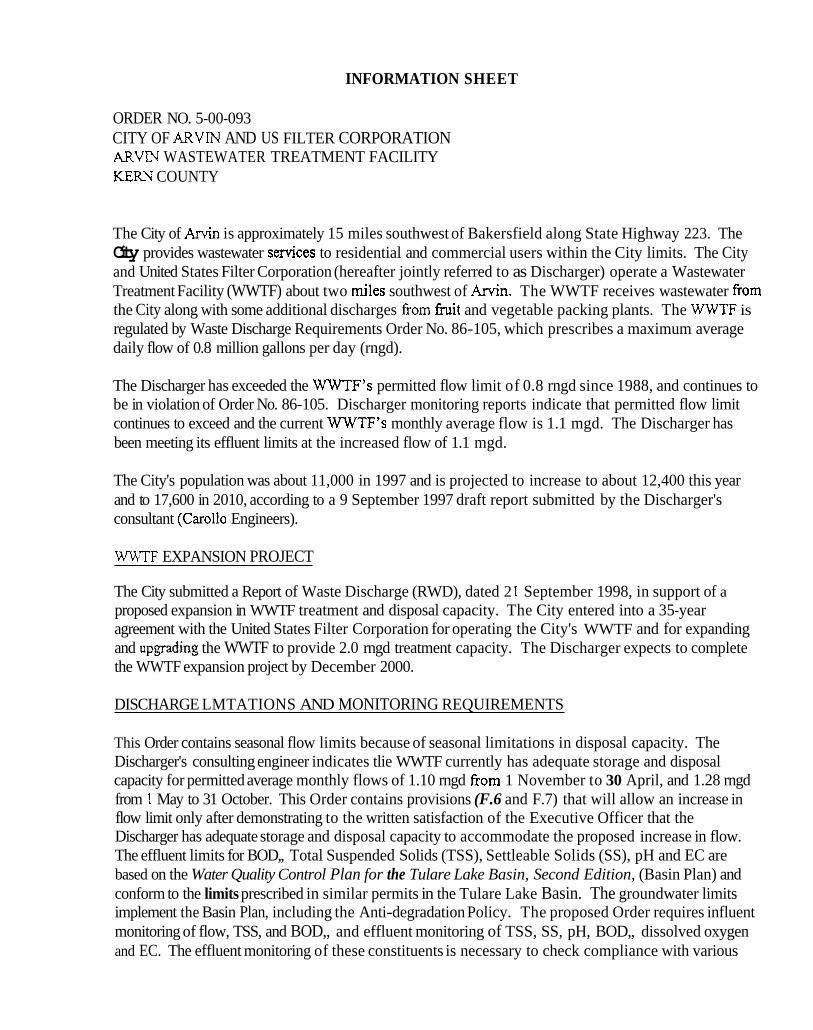
INFORMATION SHEET
ORDER NO. 5-00-093 CITY OF ARVIN AND US FILTER CORPORATION ARVN WASTEWATER TREATMENT FACILITY KER.?? COUNTY
The City of Arvin is approximately 15 miles southwest of Bakersfield along State Highway 223. The City provides wastewater s e ~ c e s to residential and commercial users within the City limits. The City and United States Filter Corporation (hereafter jointly referred to as Discharger) operate a Wastewater Treatment Facility (WWTF) about two miles southwest of Arvin. The WWTF receives wastewater fiom the City along with some additional discharges from h i t and vegetable packing plants. The WWTF is regulated by Waste Discharge Requirements Order No. 86-105, which prescribes a maximum average daily flow of 0.8 million gallons per day (rngd).
The Discharger has exceeded the WWTF's permitted flow limit of 0.8 rngd since 1988, and continues to be in violation of Order No. 86-105. Discharger monitoring reports indicate that permitted flow limit continues to exceed and the current WWTF's monthly average flow is 1.1 mgd. The Discharger has been meeting its effluent limits at the increased flow of 1.1 mgd.
The City's population was about 1 1,000 in 1997 and is projected to increase to about 12,400 this year and to 17,600 in 2010, according to a 9 September 1997 draft report submitted by the Discharger's consultant (Carollo Engineers).
WTF EXPANSION PROJECT
The City submitted a Report of Waste Discharge (RWD), dated 2 1 September 1998, in support of a proposed expansion in WWTF treatment and disposal capacity. The City entered into a 35-year agreement with the United States Filter Corporation for operating the City's WWTF and for expanding and upprading the WWTF to provide 2.0 rngd treatment capacity. The Discharger expects to complete the WWTF expansion project by December 2000.
DISCHARGE LMTATIONS AND MONITORING REQUIREMENTS
This Order contains seasonal flow limits because of seasonal limitations in disposal capacity. The Discharger's consulting engineer indicates tlie WWTF currently has adequate storage and disposal capacity for permitted average monthly flows of 1.10 rngd from 1 November to 30 April, and 1.28 rngd from 1 May to 31 October. This Order contains provisions (F.6 and F.7) that will allow an increase in flow limit only after demonstrating to the written satisfaction of the Executive Officer that the Discharger has adequate storage and disposal capacity to accommodate the proposed increase in flow. The effluent limits for BOD,, Total Suspended Solids (TSS), Settleable Solids (SS), pH and EC are based on the Water Quality Control Plan for the Tulare Lake Basin, Second Edition, (Basin Plan) and conform to the limits prescribed in similar permits in the Tulare Lake Basin. The groundwater limits implement the Basin Plan, including the Anti-degradation Policy. The proposed Order requires influent monitoring of flow, TSS, and BOD,, and effluent monitoring of TSS, SS, pH, BOD,, dissolved oxygen and EC. The effluent monitoring of these constituents is necessary to check compliance with various