2022 use-value manual for agricultural, horticultural and
TRANSCRIPT
2022 USE-VALUE MANUAL
FOR AGRICULTURAL, HORTICULTURAL
AND
FOREST LAND
April 2021
North Carolina Use-Value Advisory Board North Carolina Department of Revenue
Raleigh, North Carolina
Table of Contents
Foreword..................................................................................................................1 Use-Value Advisory Board Members......................................................................3 Use-Value Advisory Board Subcommittee Members..............................................4 Use-Value Advisory Board Manual.........................................................................5 North Carolina Major Land Resource Areas (MLRA Map)....................................9 Agricultural Schedule.............................................................................................10 Horticultural Schedule............................................................................................11 Forestry Schedule...................................................................................................12 Cash Rents Survey..................................................................................................13 Christmas Tree Guidelines......................................................................................20 Procedure for Forestry Schedules...........................................................................23 Forestry Net Present Values Table.........................................................................28 MLRA 130 Soil Survey..........................................................................................30 MLRA 133A Soil Survey.......................................................................................40 MLRA 136 Soil Survey..........................................................................................45 MLRA 137 Soil Survey..........................................................................................64 MLRA 153A Soil Survey.......................................................................................66 MLRA 153B Soil Survey.......................................................................................70
1
Foreword
When originally enacted in 1973, the objective of the present-use value program was to keep “the
family farm in the hands of the farming family.” By the early 1970’s, North Carolina had become
a prime site for industrial and commercial companies to relocate because of its plentiful and
reliable work force. With this growth came other improvements to the State’s infrastructure to
accommodate this growth, such as new and larger road systems, more residential subdivisions, and
new industrial and commercial developments. The land on which to build these improvements
came primarily from one source: farmland. As the demand for this land skyrocketed, so did its
price as well as its assessed value, as counties changed from a fractional assessment to a market
value system. Farmers who owned land near these sites soon could not afford the increase in
property values and sought relief from the General Assembly.
In response, the General Assembly passed legislation known as the Present-Use Value program.
As originally enacted, the basic tenets of this program were that only individuals who lived on the
land for which they were applying could immediately qualify and that the land had to have a
highest and best use as agriculture, horticulture or forest land. Land might also have qualified if
the farmer owned it for seven years. Passage of this law eased the financial burden of most farmers
and eliminated to some degree the “sticker shock” of the new property tax values. From that time
until the mid-1980’s, the present-use value schedules were based on farmer-to-farmer sales, and
quite often the market value schedules were very similar to the present use schedules, especially
in the more rural areas.
2
Virtually every session of the General Assembly has seen new changes to the law, causing a
constant rethinking as to how the law is to be administered. The mid-1980’s saw several court
cases that aided in this transformation. Among the legislative changes that resulted from these
cases were the use of soil productivity to determine value, the use of a 9% capitalization rate, and
the utilization of the “unit concept” to bring smaller tracts under the present use value guidelines.
Through the years the General Assembly has expanded the present-use value program to include
new types of ownership such as business entities, tenants in common, trusts, and testamentary
trusts. Legislation also expanded the definition of a relative. More recent legislation has
established cash rents as the basis for determining present-use value for agricultural and
horticultural land, while retaining the net income basis for determining present-use value for
forestland.
This Use-Value Advisory Board Manual is published yearly to communicate the UVAB
recommended present-use value rates and to explain the methodology used in establishing the
recommended rates.
3
NORTH CAROLINA USE-VALUE ADVISORY BOARD
Chairman Dr. A. Richard Bonanno Associate Dean & Director
North Carolina Cooperative Extension Service North Carolina State University
NCSU Box 7602 Raleigh, NC 27695-7602
919.515.1372 (T) 919.515.3135 (F)
[email protected] (Representing the NC Cooperative Extension Service at NCSU)
Members
Mr. Sean M. Brogan Dr. Rosalind Dale Forest Management & Forest Development Associate Dean & Extension Administrator NC Forest Service NC Cooperative Extension Program Archdale Building-10th Fl NC A&T State University Raleigh, NC 27699-1616 PO Box 21928 Telephone: 919.857.4818 Greensboro, NC 27420-1928 Fax: 919.857.4805 Telephone: 336.334.7956 Email: [email protected] Email: [email protected] (Representing NC Forest Service, NC Department (Representing the NC Cooperative Extension of Agricultural and Consumer Services) Program at NC A&T State University Ms. Tina Hlabse Mr. Steve Woodson General Counsel Associate General Counsel NC Dept. of Agriculture & Consumer Services North Carolina Farm Bureau Mail Service Center 1001 PO Box 27766 Raleigh, NC 27699 Raleigh, NC 27611 Telephone: 919.707.3013 Telephone: 919.788.1018 Fax: 919.716.0090 Fax: 919.783.3593 Email: [email protected] Email: [email protected] (Representing Dept. of Agriculture & Consumer Services) (Representing NC Farm Bureau Federation, Inc.) Mr. Sam Croom Mr. Tony Simpson Pitt County Assessor Director, Local Government Division PO Box 43 NC Department of Revenue Greenville, NC 27835 PO Box 871 Telephone: 252.902.3400 Raleigh, NC 27602 Fax: 252.830.0753 Telephone: 919.814.1129 Email: [email protected] Fax: 919.715.3107 (Representing NC Assn. Of Assessing Officers) Email: [email protected] (Representing NC Dept. of Revenue) Mr. David Allen Mr. John Hatcher Randolph County Commissioner Executive VP, NC Forestry Association Randolph County Office Building 1600 Glenwood Avenue 725 McDowell Rd, 2nd Floor Raleigh, NC 27608 Asheboro, NC 27205 Telephone: 919.834.3943 (press 5) Telephone: 336.318.6301 Fax: 919.832.6188 Email: [email protected] Email: [email protected] (Representing NC Assn. Of County Commissioners) (Representing NC Forestry Association)
4
USE-VALUE ADVISORY BOARD SUBCOMMITTEES Administration and Implementation Tony Simpson, NCDOR Steve Woodson, Farm Bureau Dee Webb, NCDA&CS David Baker, NCACC Sam Croom, Pitt County Daniel J. Whittle, Environmental Defense Robert Horton, NRCS Soils Rafeal Vega, NRCS Milton Cortes, NRCS Doug Huffman, NCDOR Chris Green, Cleveland County Godfrey Gayle, NC A&T State University Vacant, Soil Science, NCSU Cash Rents Doug Huffman, NCDOR Tony Simpson, NCDOR Sam Croom, Pitt County Steve Woodson, Farm Bureau Vacant, Crop Science, NCSU Forestry Robert Bardon, Forestry, NCSU Tony Simpson, NCDOR Doug Huffman, NCDOR Steve Whitfield, NC Forest Landowners Assn. John Hatcher, NC Forestry Association Robert Ross, Utilization Forester, NCFS
5
USE-VALUE ADVISORY BOARD MANUAL Following are explanations of the major components of this manual. I. Cash Rents
Beginning in 1985, the basis for determining present-use value for agricultural land was based on
the soil productivity for growing corn and soybeans. At that time, corn and soybeans were
considered the predominant crops in the state. Over time, fewer and fewer acres went into the
production of corn and soybeans and the land used for these crops tended to be lower quality. As
a result, both the productivity and value of these crops plummeted, thus resulting in lower present-
use values. A viable alternative was sought to replace corn and soybeans as the basis for present-
use value. Following a 1998 study by North Carolina State University, cash rents for agricultural
and horticultural land were determined to be the preferred alternative. Cash rents are a very good
indicator of net income, which can be converted into a value using an appropriate capitalization
rate.
The General Assembly passed legislation that established cash rents as the required method for
determining the recommended present-use values for agricultural and horticultural land. The cash
rents data from the NCSU study served as the basis for determining present-use value for the 2004-
2007 UVAB manuals. However, starting in 2006, funding became available for the North Carolina
Department of Agriculture to perform an extensive statewide cash rents survey on a yearly basis.
The 2006 survey became the basis for the 2008 UVAB recommended values, and this process will
6
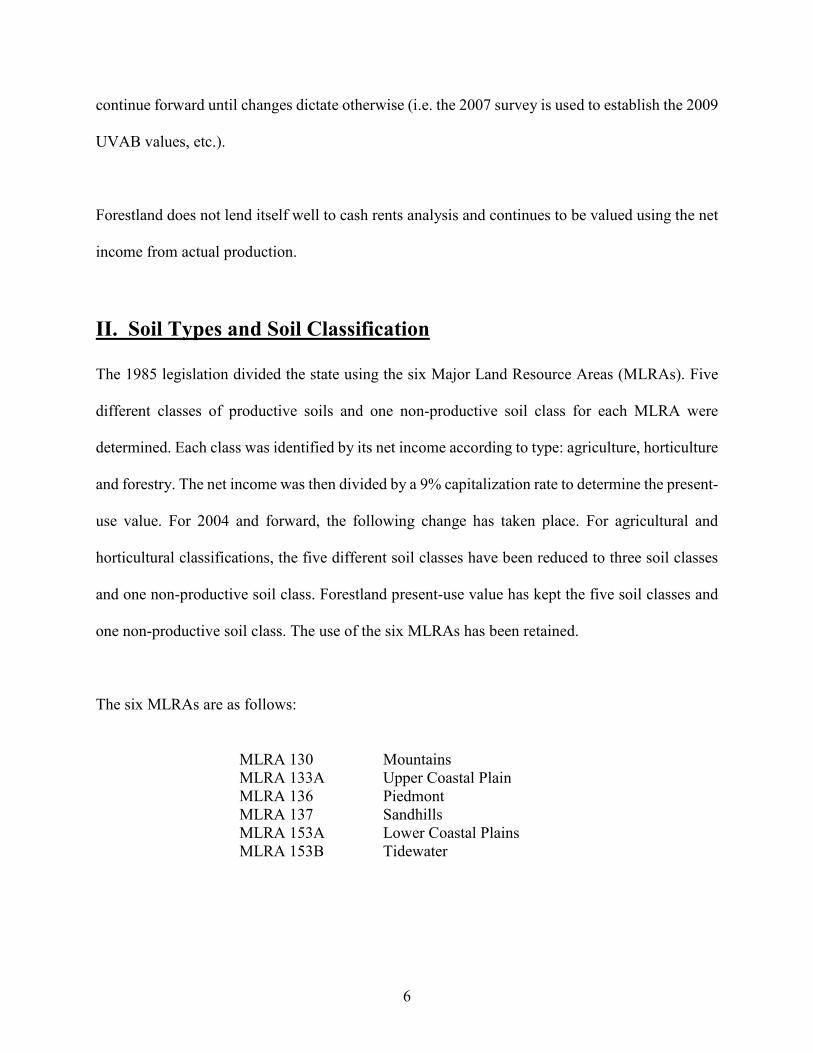
continue forward until changes dictate otherwise (i.e. the 2007 survey is used to establish the 2009
UVAB values, etc.).
Forestland does not lend itself well to cash rents analysis and continues to be valued using the net
income from actual production.
II. Soil Types and Soil Classification
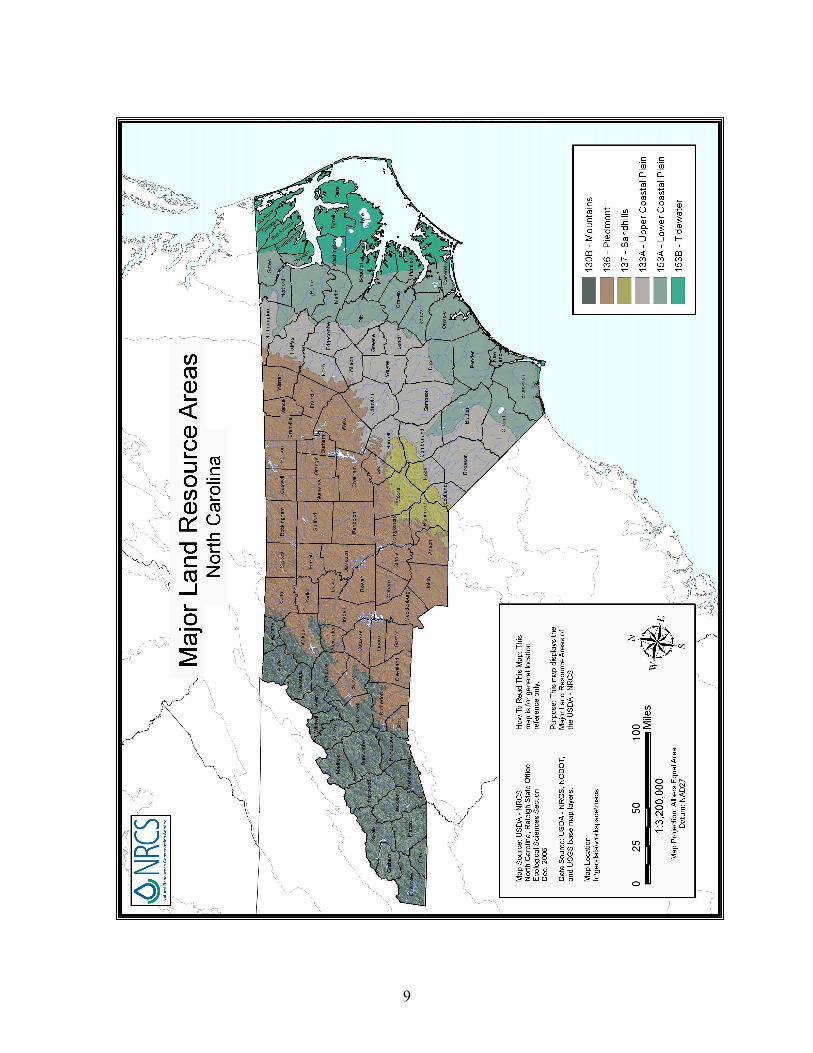
The 1985 legislation divided the state using the six Major Land Resource Areas (MLRAs). Five
different classes of productive soils and one non-productive soil class for each MLRA were
determined. Each class was identified by its net income according to type: agriculture, horticulture
and forestry. The net income was then divided by a 9% capitalization rate to determine the present-
use value. For 2004 and forward, the following change has taken place. For agricultural and
horticultural classifications, the five different soil classes have been reduced to three soil classes
and one non-productive soil class. Forestland present-use value has kept the five soil classes and
one non-productive soil class. The use of the six MLRAs has been retained.
The six MLRAs are as follows:
MLRA 130 Mountains
MLRA 133A Upper Coastal Plain MLRA 136 Piedmont MLRA 137 Sandhills MLRA 153A Lower Coastal Plains MLRA 153B Tidewater
7
The soils are listed in this manual according to the MLRA in which they occur. They are then
further broken down into their productivity for each of the three types of use: agriculture,
horticulture and forestry. Every soil listed in each of the MLRAs is ranked by its productivity into
four classes (with the exception of forestry which retained its previous six classes). The classes for
agricultural and horticultural land are as follows:
CLASS I Best Soils CLASS II Average Soils CLASS III Fair Soils CLASS IV Non-Productive Soils It should be noted that, in some soil types, all the various slopes of that soil have the same
productivity class for each of the usages, and therefore for the sake of brevity, the word “ALL” is
listed to combine these soils. Each of the classes set up by the UVAB soils subcommittee
corresponds to a cash rent income established by the most recent cash rents survey conducted by
the North Carolina Department of Agriculture. This rent income is then capitalized by a rate
established each year by the UVAB (see below). The criteria for establishing present-use value for
forestry have remained basically unchanged from previous years due to the quantity and quality of
information already available.
III. Capitalization Rate
The capitalization rate mandated by the 1985 legislation for all types of present-use value land was
9%. The 1998 study by NCSU strongly indicated that a lower capitalization rate for agricultural
and horticultural land was more in line with current sales and rental information. The 2002
legislation mandated a rate between 6%-7% for agricultural and horticultural land.
8
For the year 2004 and the subsequent years, the UVAB has set the capitalization rate at 6.5% for
agricultural and horticultural land.
The capitalization rate for forestland continues to be fixed at 9% as mandated by the statutes.
IV. Other Issues
The value for the best agricultural land can be no higher than $1,200 an acre for any MLRA.
9
10
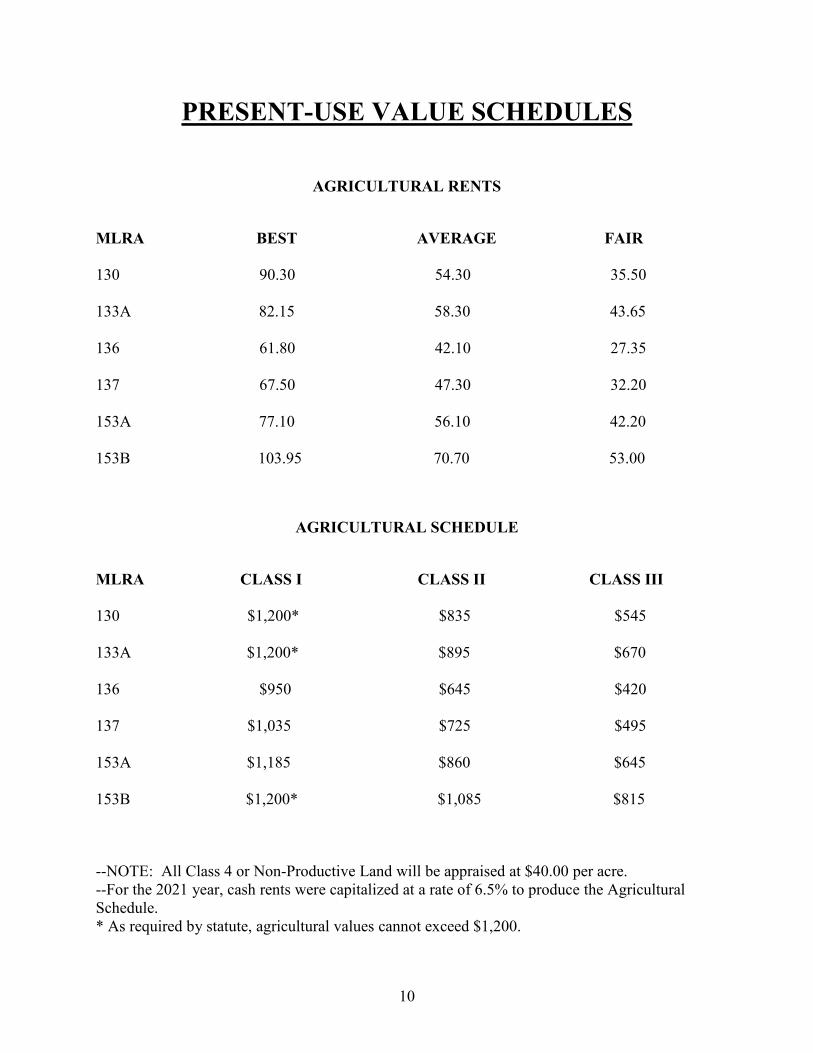
PRESENT-USE VALUE SCHEDULES
AGRICULTURAL RENTS MLRA BEST AVERAGE FAIR 130 90.30 54.30 35.50 133A 82.15 58.30 43.65 136 61.80 42.10 27.35 137 67.50 47.30 32.20 153A 77.10 56.10 42.20 153B 103.95 70.70 53.00
AGRICULTURAL SCHEDULE
MLRA CLASS I CLASS II CLASS III 130 $1,200* $835 $545 133A $1,200* $895 $670 136 $950 $645 $420 137 $1,035 $725 $495 153A $1,185 $860 $645 153B $1,200* $1,085 $815
--NOTE: All Class 4 or Non-Productive Land will be appraised at $40.00 per acre. --For the 2021 year, cash rents were capitalized at a rate of 6.5% to produce the Agricultural Schedule. * As required by statute, agricultural values cannot exceed $1,200.
11
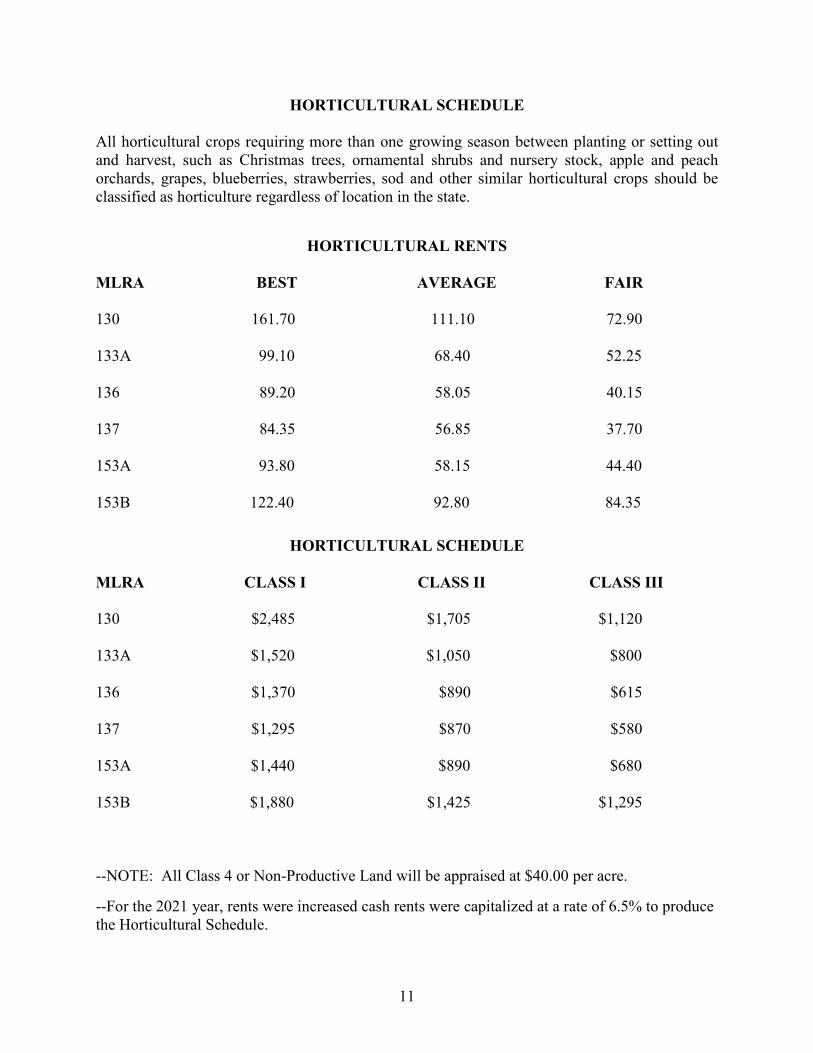
HORTICULTURAL SCHEDULE All horticultural crops requiring more than one growing season between planting or setting out and harvest, such as Christmas trees, ornamental shrubs and nursery stock, apple and peach orchards, grapes, blueberries, strawberries, sod and other similar horticultural crops should be classified as horticulture regardless of location in the state.
HORTICULTURAL RENTS MLRA BEST AVERAGE FAIR 130 161.70 111.10 72.90 133A 99.10 68.40 52.25 136 89.20 58.05 40.15 137 84.35 56.85 37.70 153A 93.80 58.15 44.40 153B 122.40 92.80 84.35
HORTICULTURAL SCHEDULE
MLRA CLASS I CLASS II CLASS III 130 $2,485 $1,705 $1,120 133A $1,520 $1,050 $800 136 $1,370 $890 $615 137 $1,295 $870 $580 153A $1,440 $890 $680 153B $1,880 $1,425 $1,295 --NOTE: All Class 4 or Non-Productive Land will be appraised at $40.00 per acre. --For the 2021 year, rents were increased cash rents were capitalized at a rate of 6.5% to produce the Horticultural Schedule.
12
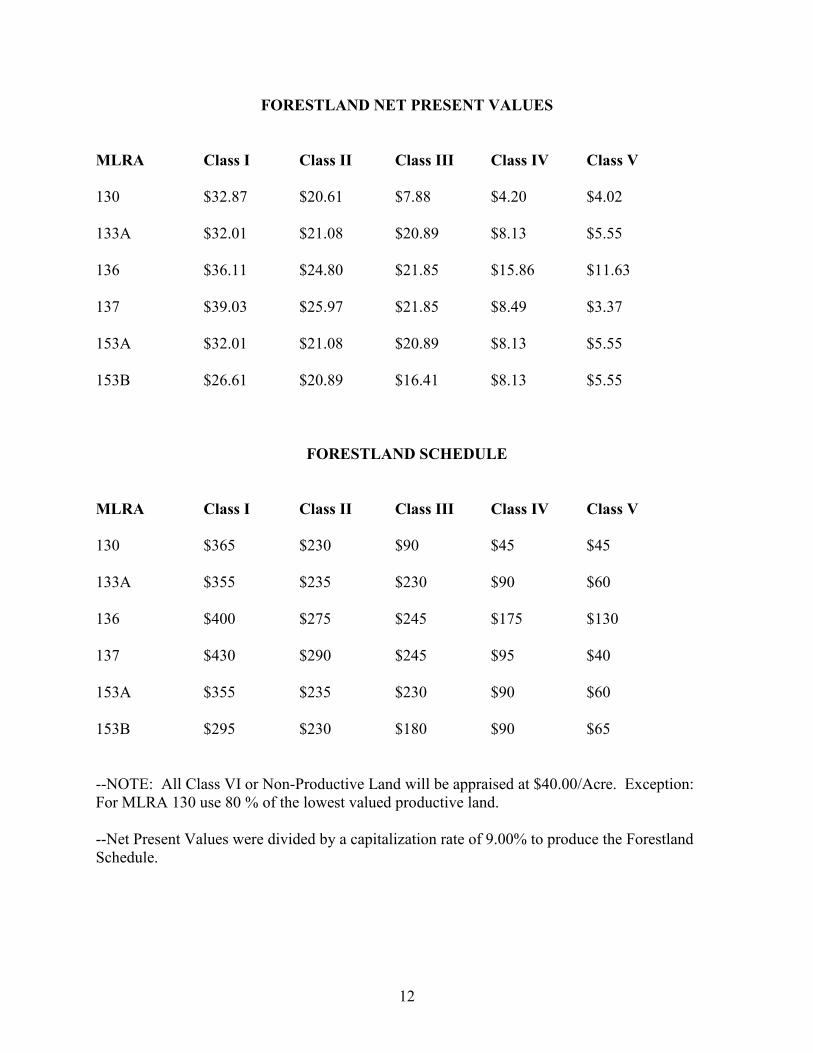
FORESTLAND NET PRESENT VALUES MLRA Class I Class II Class III Class IV Class V 130 $32.87 $20.61 $7.88 $4.20 $4.02 133A $32.01 $21.08 $20.89 $8.13 $5.55 136 $36.11 $24.80 $21.85 $15.86 $11.63 137 $39.03 $25.97 $21.85 $8.49 $3.37 153A $32.01 $21.08 $20.89 $8.13 $5.55 153B $26.61 $20.89 $16.41 $8.13 $5.55
FORESTLAND SCHEDULE
MLRA Class I Class II Class III Class IV Class V 130 $365 $230 $90 $45 $45 133A $355 $235 $230 $90 $60 136 $400 $275 $245 $175 $130 137 $430 $290 $245 $95 $40 153A $355 $235 $230 $90 $60 153B $295 $230 $180 $90 $65 --NOTE: All Class VI or Non-Productive Land will be appraised at $40.00/Acre. Exception: For MLRA 130 use 80 % of the lowest valued productive land. --Net Present Values were divided by a capitalization rate of 9.00% to produce the Forestland Schedule.
13
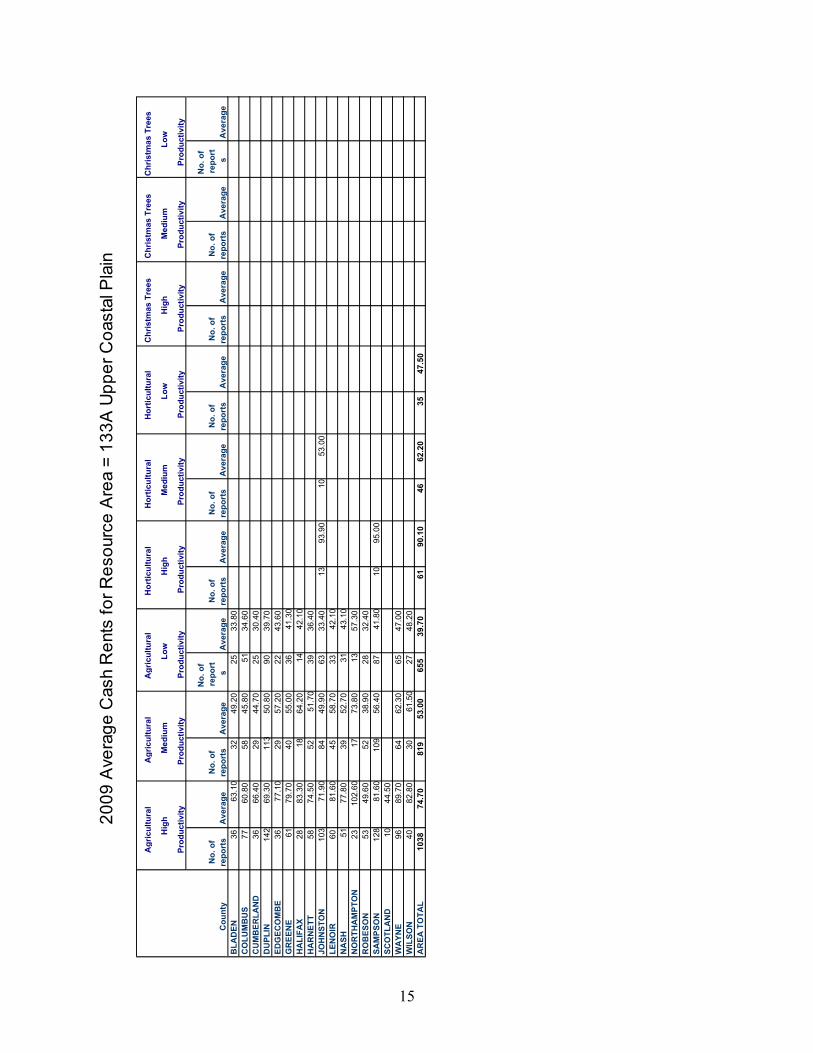
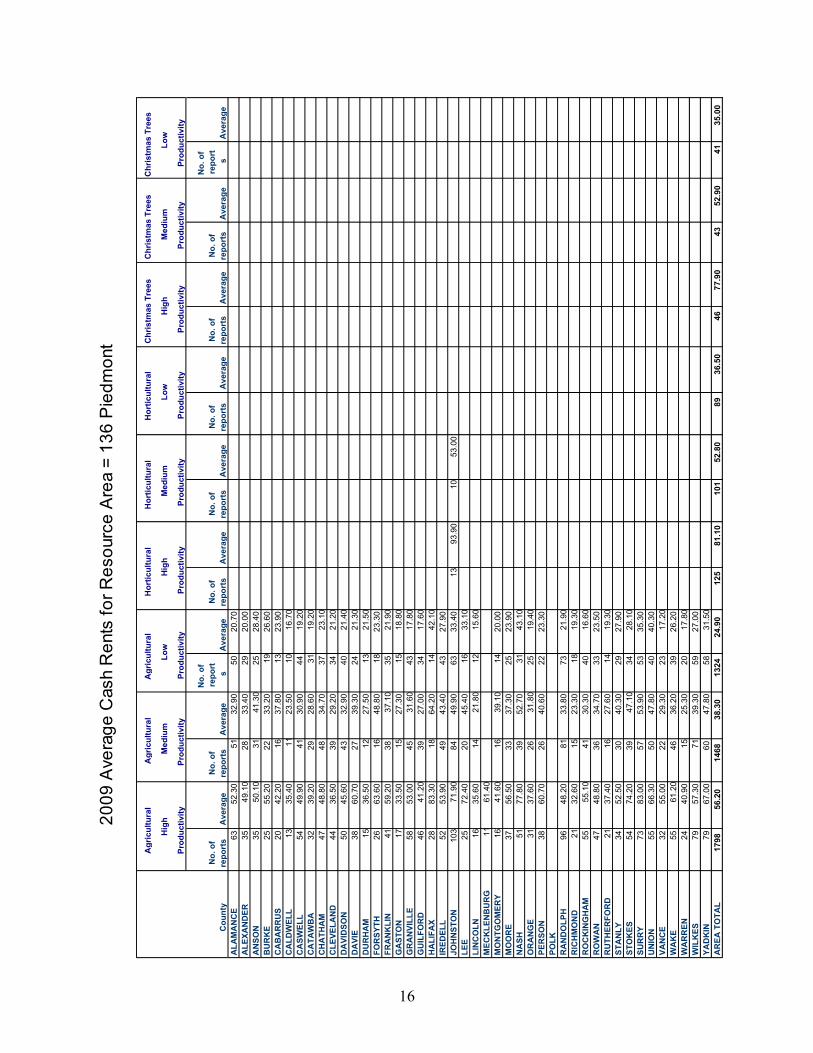
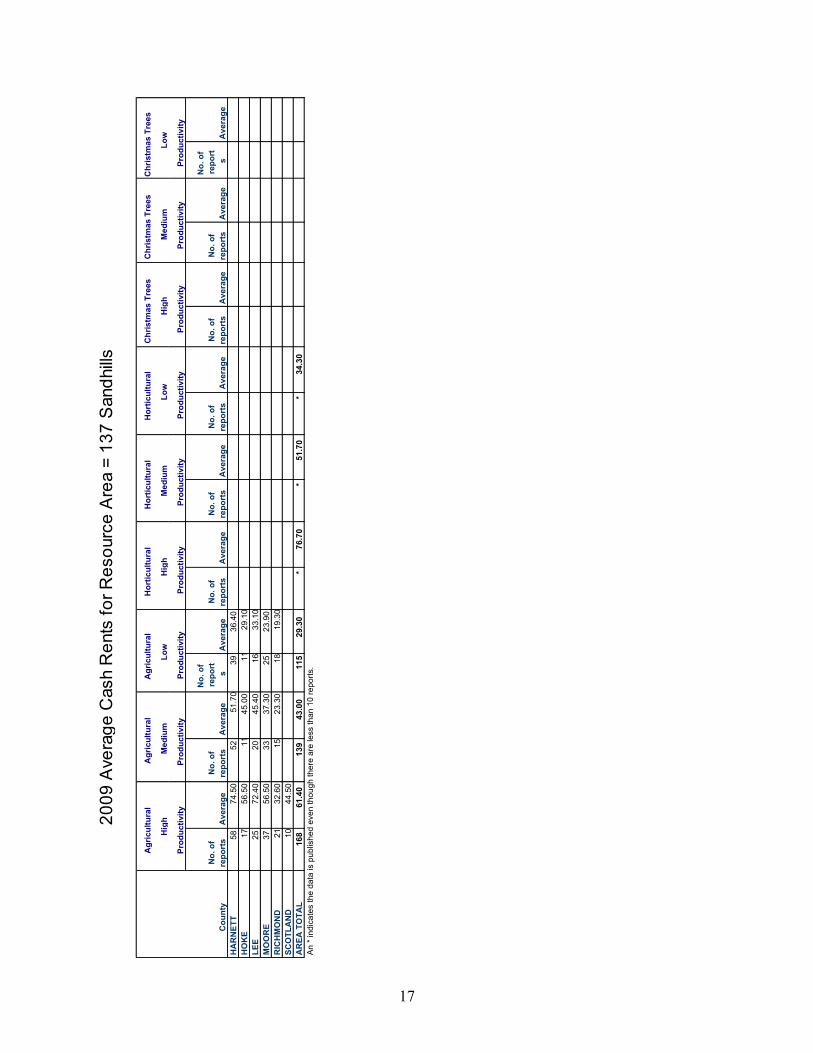
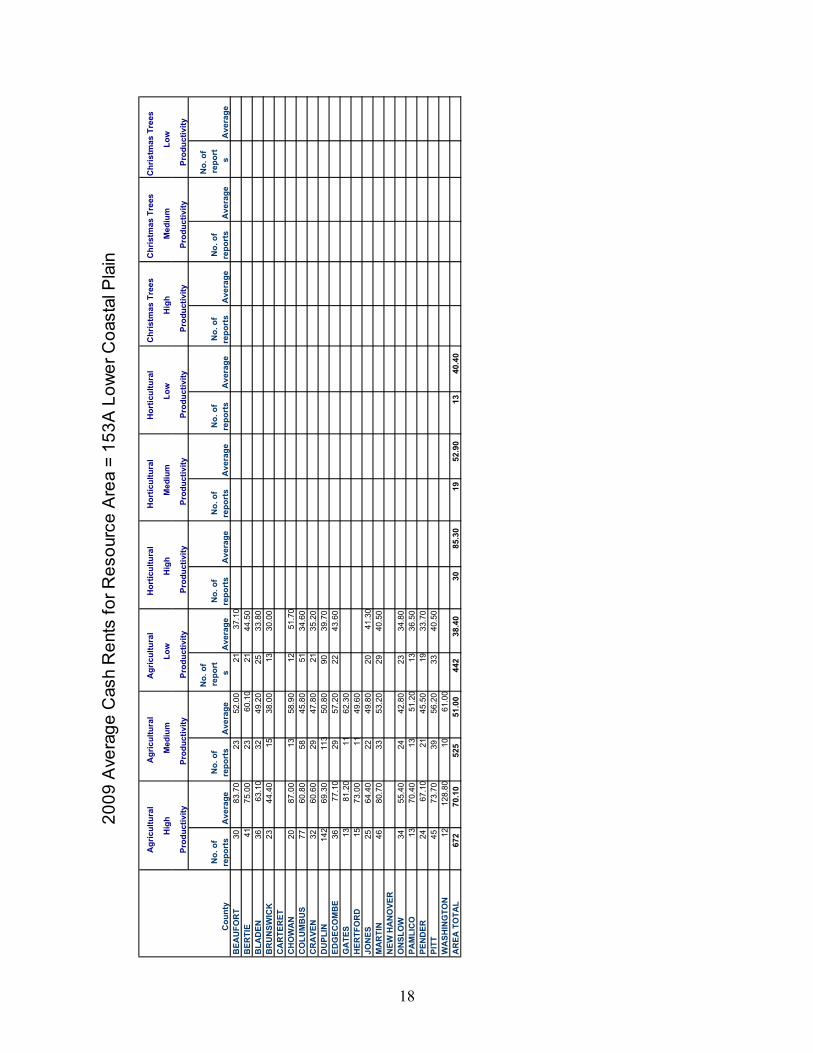
2009 Cash Rent Study
INTRODUCTION
The National Agricultural Statistics Service in cooperation with the North Carolina Department of Agricultural and Consumer Services collected cash rents data on the 2009 County Estimates Survey. North Carolina farmers were surveyed to obtain cash rent values per acre for three land types: Agricultural, horticultural, and Christmas tree land. Supporting funds for this project were provided by the North Carolina Legislature. Appreciation is expressed to all survey participants who provided the data on which this report is based.
THE SURVEY
The survey was conducted by mail with telephone follow-up during September through February. Values relate to the data collection time period when the respondent completed the survey.
THE DATA
This report includes the most current number of responses and average rental rate per acre. Producers were asked to provide their best estimate of cash rent values in their county by land quality. The data published here are simple averages of the best estimate of the cash rent value per acre. These averages are not official estimates of actual sales. Reported data that did not represent agricultural usage were removed in order to give a more accurate reflection of agricultural rents and values. To ensure respondent confidentiality and provide more statistical reliability, counties and districts with fewer than 10 reports are not published individually, but are included in aggregate totals. Published values in this report should never be used as the only factor to establish rental arrangements. Data were collected for three land types: Agricultural, horticultural, and Christmas tree land. Agricultural land includes land used to produce row crops such as soybeans, corn, peanuts, and small grains, pasture land, and hay. Agricultural land also includes any land on which livestock are grown. Horticultural land includes commercial production or growing of fruits or vegetables or nursery or floral products such as apple orchards, blueberries, cucumbers, tomatoes, potted plants, flowers, shrubs, sod, and turf grass. Christmas tree land includes any land to produce Christmas trees, including cut and balled Christmas trees.
14
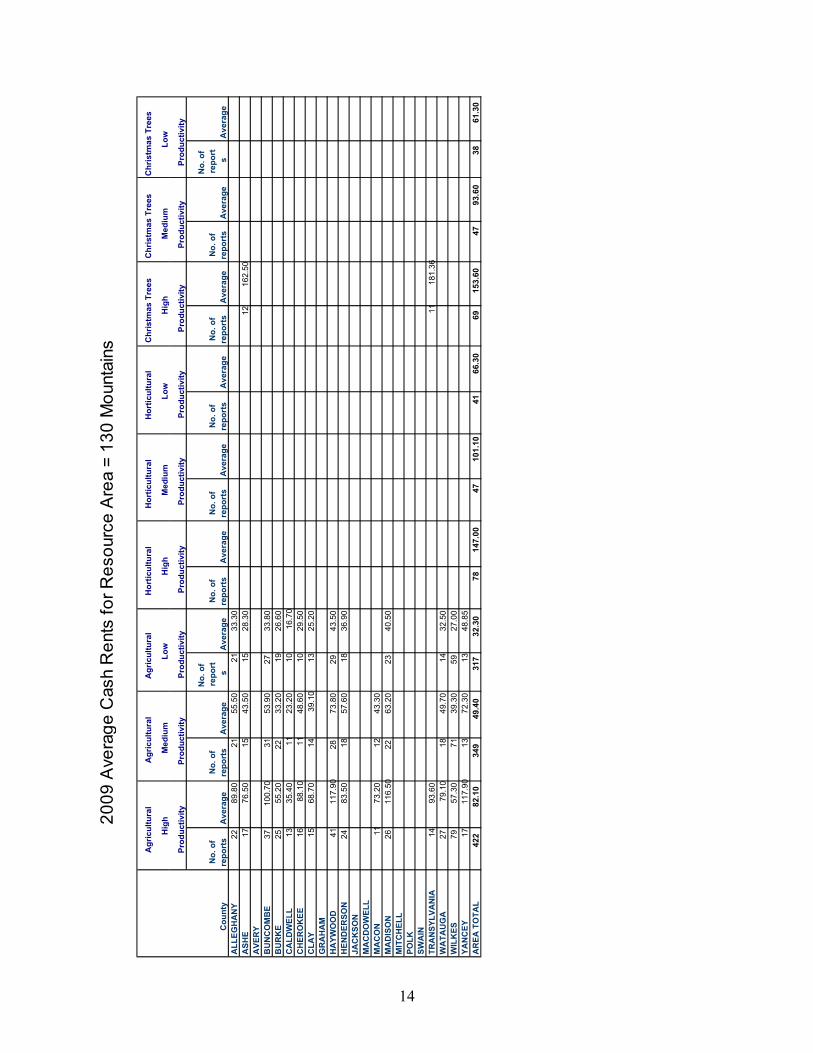
2009
Ave
rage
Cas
h R
ents
for R
esou
rce
Are
a =
130
Mou
ntai
ns
No.
of
repo
rts
Ave
rage
No.
of
repo
rts
Ave
rage
No.
of
repo
rts
Ave
rage
No.
of
repo
rts
Ave
rage
No.
of
repo
rts
Ave
rage
No.
of
repo
rts
Ave
rage
No.
of
repo
rts
Ave
rage
No.
of
repo
rts
Ave
rage
No.
of
repo
rts
Ave
rage
ALL
EGH
AN
Y22
89.8
021
55.5
021
33.3
0A
SHE
1776
.50
1543
.50
1528
.30
1216
2.50
AVE
RY
BU
NC
OM
BE
3710
0.70
3153
.90
2733
.80
BU
RK
E25
55.2
022
33.2
019
26.6
0C
ALD
WEL
L13
35.4
011
23.2
010
16.7
0C
HER
OK
EE16
88.1
011
48.6
010
29.5
0C
LAY
1568
.70
1439
.10
1325
.20
GR
AH
AM
HA
YWO
OD
4111
7.90
2873
.80
2943
.50
HEN
DER
SON
2483
.50
1857
.60
1836
.90
JAC
KSO
NM
AC
DO
WEL
LM
AC
ON
1173
.20
1243
.30
MA
DIS
ON
2611
6.50
2263
.20
2340
.50
MIT
CH
ELL
POLK
SWA
INTR
AN
SYLV
AN
IA14
93.6
011
181.
36W
ATA
UG
A27
79.1
018
49.7
014
32.5
0W
ILK
ES79
57.3
071
39.3
059
27.0
0YA
NC
EY17
117.
9013
72.3
013
48.8
5A
REA
TO
TAL
422
82.1
034
949
.40
317
32.3
078
147.
0047
101.
1041
66.3
069
153.
6047
93.6
038
61.3
0
Chr
istm
as T
rees
Low
Chr
istm
as T
rees
Hig
h
Chr
istm
as T
rees
Med
ium
Hor
ticul
tura
l
Med
ium
Hor
ticul
tura
l
Low
Agr
icul
tura
l
Low
Hor
ticul
tura
l
Hig
h
Agr
icul
tura
l
Hig
h
Agr
icul
tura
l
Med
ium
Cou
nty
Pro
duct
ivity
Prod
uctiv
ity P
rodu
ctiv
ity P
rodu
ctiv
ity P
rodu
ctiv
ity P
rodu
ctiv
ity P
rodu
ctiv
ityPr
oduc
tivity
Prod
uctiv
ity
15
2009
Ave
rage
Cas
h R
ents
for R
esou
rce
Are
a =
133A
Upp
er C
oast
al P
lain
No.
of
repo
rts
Ave
rage
No.
of
repo
rts
Ave
rage
No.
of
repo
rts
Ave
rage
No.
of
repo
rts
Ave
rage
No.
of
repo
rts
Ave
rage
No.
of
repo
rts
Ave
rage
No.
of
repo
rts
Ave
rage
No.
of
repo
rts
Ave
rage
No.
of
repo
rts
Ave
rage
BLA
DEN
3663
.10
3249
.20
2533
.80
CO
LUM
BU
S77
60.8
058
45.8
051
34.6
0C
UM
BER
LAN
D36
66.4
029
44.7
025
30.4
0D
UPL
IN14
269
.30
113
50.8
090
39.7
0ED
GEC
OM
BE
3677
.10
2957
.20
2243
.60
GR
EEN
E61
79.7
040
55.0
036
41.3
0H
ALI
FAX
2883
.30
1864
.20
1442
.10
HA
RN
ETT
5874
.50
5251
.70
3936
.40
JOH
NST
ON
103
71.9
084
49.9
063
33.4
013
93.9
010
53.0
0LE
NO
IR60
81.6
045
58.7
033
42.1
0N
ASH
5177
.80
3952
.70
3143
.10
NO
RTH
AM
PTO
N23
102.
6017
73.8
013
57.3
0R
OB
ESO
N53
49.6
052
38.9
028
32.4
0SA
MPS
ON
128
81.6
010
956
.40
8741
.80
1095
.00
SCO
TLA
ND
1044
.50
WA
YNE
9689
.70
6462
.30
6547
.00
WIL
SON
4082
.80
3061
.50
2748
.20
AR
EA T
OTA
L10
3874
.70
819
53.0
065
539
.70
6190
.10
4662
.20
3547
.50
Pro
duct
ivity
Pro
duct
ivity
Prod
uctiv
ityPr
oduc
tivity
Cou
nty
Pro
duct
ivity
Prod
uctiv
ity P
rodu
ctiv
ity P
rodu
ctiv
ity P
rodu
ctiv
ity
Agr
icul
tura
lA
gric
ultu
ral
Agr
icul
tura
l H
ortic
ultu
ral
Hor
ticul
tura
l H
ortic
ultu
ral
Low
Hig
hM
ediu
m
Low
Chr
istm
as T
rees
Chr
istm
as T
rees
Chr
istm
as T
rees
Hig
h M
ediu
mLo
wH
igh
Med
ium
16
2009
Ave
rage
Cas
h R
ents
for R
esou
rce
Are
a =
136
Pie
dmon
t
No.
of
repo
rts
Ave
rage
No.
of
repo
rts
Ave
rage
No.
of
repo
rts
Ave
rage
No.
of
repo
rts
Ave
rage
No.
of
repo
rts
Ave
rage
No.
of
repo
rts
Ave
rage
No.
of
repo
rts
Ave
rage
No.
of
repo
rts
Ave
rage
No.
of
repo
rts
Ave
rage
ALA
MA
NC
E63
52.3
051
32.9
050
20.7
0A
LEXA
ND
ER35
49.1
028
33.4
029
20.0
0A
NSO
N35
50.1
031
41.3
025
28.4
0B
UR
KE
2555
.20
2233
.20
1926
.60
CA
BA
RR
US
2042
.20
1637
.80
1323
.90
CA
LDW
ELL
1335
.40
1123
.50
1016
.70
CA
SWEL
L54
49.9
041
30.9
044
19.2
0C
ATA
WB
A32
39.2
029
28.6
031
19.2
0C
HA
THA
M47
48.8
048
34.7
037
23.1
0C
LEVE
LAN
D44
36.5
039
29.2
034
21.2
0D
AVI
DSO
N50
45.6
043
32.9
040
21.4
0D
AVI
E38
60.7
027
39.3
024
21.3
0D
UR
HA
M15
36.5
012
27.5
013
21.5
0FO
RSY
TH26
63.6
016
48.8
018
23.3
0FR
AN
KLI
N41
59.2
038
37.1
035
21.9
0G
AST
ON
1733
.50
1527
.30
1518
.80
GR
AN
VILL
E58
53.0
045
31.6
043
17.8
0G
UIL
FOR
D46
41.2
039
27.0
034
17.6
0H
ALI
FAX
2883
.30
1864
.20
1442
.10
IRED
ELL
5253
.90
4943
.40
4327
.90
JOH
NST
ON
103
71.9
084
49.9
063
33.4
013
93.9
010
53.0
0LE
E25
72.4
020
45.4
016
33.1
0LI
NC
OLN
1635
.60
1421
.80
1215
.60
MEC
KLE
NB
UR
G11
61.4
0M
ON
TGO
MER
Y16
41.6
016
39.1
014
20.0
0M
OO
RE
3756
.50
3337
.30
2523
.90
NA
SH51
77.8
039
52.7
031
43.1
0O
RA
NG
E31
37.6
026
31.8
025
19.4
0PE
RSO
N38
60.7
026
40.6
022
23.3
0PO
LKR
AN
DO
LPH
9648
.20
8133
.80
7321
.90
RIC
HM
ON
D21
32.6
015
23.3
018
19.3
0R
OC
KIN
GH
AM
5555
.10
4130
.30
4016
.60
RO
WA
N47
48.8
036
34.7
033
23.5
0R
UTH
ERFO
RD
2137
.40
1627
.60
1419
.30
STA
NLY
3452
.50
3040
.30
2927
.90
STO
KES
5474
.20
3947
.10
3428
.10
SUR
RY
7383
.00
5753
.90
5335
.30
UN
ION
5566
.30
5047
.80
4040
.30
VAN
CE
3255
.00
2229
.30
2317
.20
WA
KE
5561
.20
4636
.20
3926
.20
WA
RR
EN24
40.9
015
25.3
020
17.8
0W
ILK
ES79
57.3
071
39.3
059
27.0
0YA
DK
IN79
67.0
060
47.8
058
31.5
0A
REA
TO
TAL
1798
56.2
014
6838
.30
1324
24.9
012
581
.10
101
52.8
089
36.5
046
77.9
043
52.9
041
35.0
0
Pro
duct
ivity
Pro
duct
ivity
Prod
uctiv
ityPr
oduc
tivity
Cou
nty
Pro
duct
ivity
Prod
uctiv
ity P
rodu
ctiv
ity P
rodu
ctiv
ity P
rodu
ctiv
ity
Agr
icul
tura
lA
gric
ultu
ral
Agr
icul
tura
l H
ortic
ultu
ral
Low
Hig
hM
ediu
m
Low
Hor
ticul
tura
l H
ortic
ultu
ral
Chr
istm
as T
rees
Chr
istm
as T
rees
Chr
istm
as T
rees
Hig
h M
ediu
mLo
wH
igh
Med
ium
17
2009
Ave
rage
Cas
h R
ents
for R
esou
rce
Are
a =
137
San
dhills
No.
of
repo
rts
Ave
rage
No.
of
repo
rts
Ave
rage
No.
of
repo
rts
Ave
rage
No.
of
repo
rts
Ave
rage
No.
of
repo
rts
Ave
rage
No.
of
repo
rts
Ave
rage
No.
of
repo
rts
Ave
rage
No.
of
repo
rts
Ave
rage
No.
of
repo
rts
Ave
rage
HA
RN
ETT
5874
.50
5251
.70
3936
.40
HO
KE
1756
.50
1145
.00
1129
.10
LEE
2572
.40
2045
.40
1633
.10
MO
OR
E37
56.5
033
37.3
025
23.9
0R
ICH
MO
ND
2132
.60
1523
.30
1819
.30
SCO
TLA
ND
1044
.50
AR
EA T
OTA
L16
861
.40
139
43.0
011
529
.30
*76
.70
*51
.70
*34
.30
An *
indi
cate
s th
e da
ta is
pub
lishe
d ev
en th
ough
ther
e ar
e le
ss th
an 1
0 re
ports
.
Pro
duct
ivity
Pro
duct
ivity
Prod
uctiv
ityPr
oduc
tivity
Cou
nty
Pro
duct
ivity
Prod
uctiv
ity P
rodu
ctiv
ity P
rodu
ctiv
ity P
rodu
ctiv
ity
Agr
icul
tura
lA
gric
ultu
ral
Agr
icul
tura
l H
ortic
ultu
ral
Low
Hig
hM
ediu
m
Low
Hor
ticul
tura
l H
ortic
ultu
ral
Chr
istm
as T
rees
Chr
istm
as T
rees
Chr
istm
as T
rees
Hig
h M
ediu
mLo
wH
igh
Med
ium
18
2009
Ave
rage
Cas
h R
ents
for R
esou
rce
Are
a =
153A
Low
er C
oast
al P
lain
No.
of
repo
rts
Ave
rage
No.
of
repo
rts
Ave
rage
No.
of
repo
rts
Ave
rage
No.
of
repo
rts
Ave
rage
No.
of
repo
rts
Ave
rage
No.
of
repo
rts
Ave
rage
No.
of
repo
rts
Ave
rage
No.
of
repo
rts
Ave
rage
No.
of
repo
rts
Ave
rage
BEA
UFO
RT
3083
.70
2352
.00
2137
.10
BER
TIE
4175
.00
2360
.10
2144
.50
BLA
DEN
3663
.10
3249
.20
2533
.80
BR
UN
SWIC
K23
44.4
015
38.0
013
30.0
0C
AR
TER
ETC
HO
WA
N20
87.0
013
58.9
012
51.7
0C
OLU
MB
US
7760
.80
5845
.80
5134
.60
CR
AVE
N32
60.6
029
47.8
021
35.2
0D
UPL
IN14
269
.30
113
50.8
090
39.7
0ED
GEC
OM
BE
3677
.10
2957
.20
2243
.60
GA
TES
1381
.20
1162
.30
HER
TFO
RD
1573
.00
1149
.60
JON
ES25
64.4
022
49.8
020
41.3
0M
AR
TIN
4680
.70
3353
.20
2940
.50
NEW
HA
NO
VER
ON
SLO
W34
55.4
024
42.8
023
34.8
0PA
MLI
CO
1370
.40
1351
.20
1336
.50
PEN
DER
2467
.10
2145
.50
1933
.70
PITT
4573
.70
3956
.20
3340
.50
WA
SHIN
GTO
N12
128.
8010
61.0
0A
REA
TO
TAL
672
70.1
052
551
.00
442
38.4
030
85.3
019
52.9
013
40.4
0
Pro
duct
ivity
Pro
duct
ivity
Prod
uctiv
ityPr
oduc
tivity
Cou
nty
Pro
duct
ivity
Prod
uctiv
ity P
rodu
ctiv
ity P
rodu
ctiv
ity P
rodu
ctiv
ity
Agr
icul
tura
lA
gric
ultu
ral
Agr
icul
tura
l H
ortic
ultu
ral
Low
Hig
hM
ediu
m
Low
Hor
ticul
tura
l H
ortic
ultu
ral
Chr
istm
as T
rees
Chr
istm
as T
rees
Chr
istm
as T
rees
Hig
h M
ediu
mLo
wH
igh
Med
ium
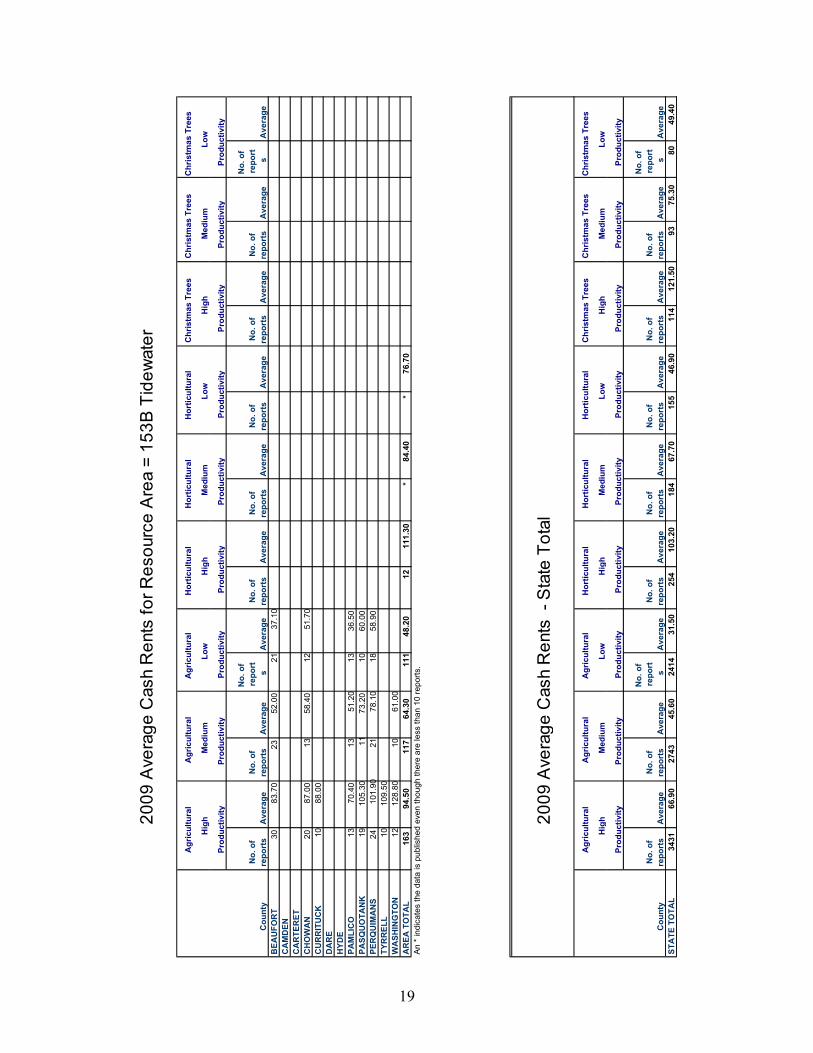
19
2009
Ave
rage
Cas
h R
ents
for R
esou
rce
Are
a =
153B
Tid
ewat
er
No.
of
repo
rts
Ave
rage
No.
of
repo
rts
Ave
rage
No.
of
repo
rts
Ave
rage
No.
of
repo
rts
Ave
rage
No.
of
repo
rts
Ave
rage
No.
of
repo
rts
Ave
rage
No.
of
repo
rts
Ave
rage
No.
of
repo
rts
Ave
rage
No.
of
repo
rts
Ave
rage
BEA
UFO
RT
3083
.70
2352
.00
2137
.10
CA
MD
ENC
AR
TER
ETC
HO
WA
N20
87.0
013
58.4
012
51.7
0C
UR
RIT
UC
K10
88.0
0D
AR
EH
YDE
PAM
LIC
O13
70.4
013
51.2
013
36.5
0PA
SQU
OTA
NK
1910
5.30
1173
.20
1060
.00
PER
QU
IMA
NS
2410
1.90
2178
.10
1858
.90
TYR
REL
L10
109.
50W
ASH
ING
TON
1212
8.80
1061
.00
AR
EA T
OTA
L16
394
.50
117
64.3
011
148
.20
1211
1.30
*84
.40
*76
.70
An *
indi
cate
s th
e da
ta is
pub
lishe
d ev
en th
ough
ther
e ar
e le
ss th
an 1
0 re
ports
.
2009
Ave
rage
Cas
h R
ents
- S
tate
Tot
al
No.
of
repo
rts
Ave
rage
No.
of
repo
rts
Ave
rage
No.
of
repo
rts
Ave
rage
No.
of
repo
rts
Ave
rage
No.
of
repo
rts
Ave
rage
No.
of
repo
rts
Ave
rage
No.
of
repo
rts
Ave
rage
No.
of
repo
rts
Ave
rage
No.
of
repo
rts
Ave
rage
STA
TE T
OTA
L34
3166
.90
2743
45.6
024
1431
.50
254
103.
2018
467
.70
155
46.9
011
412
1.50
9375
.30
8049
.40
Prod
uctiv
ityPr
oduc
tivity
Chr
istm
as T
rees
Low
Cou
nty
Pro
duct
ivity
Prod
uctiv
ity P
rodu
ctiv
ityPr
oduc
tivity
Prod
uctiv
ity
Pro
duct
ivity
Pro
duct
ivity
Pro
duct
ivity
Pro
duct
ivity
Pro
duct
ivity
Pro
duct
ivity
Hor
ticul
tura
l H
ortic
ultu
ral
Chr
istm
as T
rees
Hig
h
Cou
nty
Pro
duct
ivity
Prod
uctiv
ity P
rodu
ctiv
ity P
rodu
ctiv
ity P
rodu
ctiv
ity
Agr
icul
tura
lA
gric
ultu
ral
Agr
icul
tura
l H
ortic
ultu
ral
Med
ium
Lo
w
Hor
ticul
tura
l H
ortic
ultu
ral
Chr
istm
as T
rees
Chr
istm
as T
rees
Hig
h
Chr
istm
as T
rees
Hig
h M
ediu
mLo
wH
igh
Med
ium
Low
Med
ium
Hig
h
Low
Hig
h
Chr
istm
as T
rees
Agr
icul
tura
lA
gric
ultu
ral
Agr
icul
tura
l H
ortic
ultu
ral
Med
ium
Low
Med
ium
20
Christmas Tree Guidelines This information replaces a previous memorandum issued by our office dated December 12, 1989. The 1989 General Assembly enacted an “in-lieu of income” provision allowing land previously qualified as horticulture to continue to receive benefits of the present-use value program when the crop being produced changed from any horticultural product to Christmas trees. It also directed the Department of Revenue to establish a separate gross income requirement different from the $1,000 gross income requirement for horticultural land, when the crop being grown was evergreens intended for use as Christmas trees. N.C.G.S. 105-289(a)(6) directs the Department of Revenue:
“To establish requirements for horticultural land, used to produce evergreens intended for use as Christmas trees, in lieu of a gross income requirement until evergreens are harvested from the land, and to establish a gross income requirement for this type of horticultural land, that differs from the income requirement for other horticultural land, when evergreens are harvested from the land.”
It should be noted that horticultural land used to produce evergreens intended for use as Christmas trees is the only use allowed benefit of the present-use value program without first having met a gross income requirement. The trade-off for this exception is a different gross income requirement in recognition of the potential for greater income than would normally be associated with other horticultural or agricultural commodities. While the majority of Christmas tree production occurs in the western mountain counties (MLRA 130), surveys as far back as 1996 indicate that there are approximately 135 Christmas tree operations in non-mountain counties (MLRAs 136, 137, 133A, 153A & 153B). They include such counties in the piedmont and coastal plain as Craven, Halifax, Robeson, Wake, and Warren. For this reason we have prepared separate in-lieu of income requirements and gross income requirements for these two areas of the State. The different requirements recognize the difference in species, growing practices, markets, and resulting gross income potential. After consulting with cooperative extension agents, the regional Christmas tree/horticultural specialist at the Western North Carolina Experimental Research Station, and various landowners/growers, we have determined the standards in the following attachments to be reasonable guidelines for compliance with G.S. 105-289(a)(6). Please note these requirements are subject to the whims of weather and other conditions that can have a significant impact. The combined effect of recent hurricanes, spring freezes, and ice storms across some parts of the State should be taken into consideration when appropriate within each county. As with other aspects of the present-use value program, owners of Christmas tree land should not be held accountable for conditions such as adverse weather or disease outbreak beyond their control. We encourage every county to contact their local Cooperative Extension Service Office to obtain the appropriate local data and expertise to support particular situations in each county.
21
I. Gross Income Requirement for Christmas Trees For MLRA 130, the gross income requirement for horticultural land used to grow evergreens intended for use as Christmas trees is $2,000 per acre. For all other MLRAs, the gross income requirement for horticultural land used to grow evergreens intended for use as Christmas trees is $1,500 per acre. II. In-Lieu of Income Requirement MLRA 130 – Mountains The in-lieu of income requirement is for acreage in production but not yet undergoing harvest, and will be determined by sound management practices, best evidenced by the following:
1. Sites prepared by controlling problem weeds and saplings, taking soil samples, and applying fertilizer and/or lime as appropriate.
2. Generally, a 5’ x 5’ spacing producing approximately 1,750 potential trees per acre. Spacing must allow for adequate air movement around the trees. (There is very little 4’ x 4’ or 4.5’ x 4.5’ spacing. Some experimentation has occurred with 5’ x 6’ spacing, primarily aimed at producing a 6’ tree in 5 years. All of the preceding examples should be acceptable.)
3. A program for insect and weed control.
4. Generally, an eight-to-ten year setting to harvest cycle. (Most leases are for 10 years, which allows for a replanting of non-established or dying seedlings up through the second year.)
The gross income requirement for acres undergoing Christmas tree harvest in the mountain region of North Carolina (MLRA 130) is $2,000 per acre. Once Christmas trees are harvested from specific acreage, the requirement for those harvested acres will revert to the in-lieu of income requirement. As an example, if the total amount of acres devoted to Christmas tree production is six acres, three of which are undergoing harvest and three of which have yet to reach maturity, the gross income requirement would be $6,000.
22
MLRA 136 – Piedmont, MLRA 137 – Sandhills, MLRA 133A – Upper Coastal Plain, MLRA 153A – Lower Coastal Plain, and MLRA 153B – Tidewater.
The in-lieu of income requirement is for acreage in production but not yet undergoing harvest, and will be determined by sound management practices, best evidenced by the following:
1. Sites prepared by controlling problem weeds and saplings, taking soil samples, and applying fertilizer and/or lime as appropriate.
2. Generally, a 7’ x 7’ spacing producing approximately 900 potential trees per acre. Spacing must allow for adequate air movement around the trees. (There may be variations in the spacing dependent on the species being grown, most likely Virginia Pine, White Pine, Eastern Red Cedar, and Leyland Cypress. All reasonable spacing practices should be acceptable.)
3. A program for insect and weed control.
4. Generally a five-to-six year setting to harvest cycle. (Due to the species being grown, soil conditions and growing practices, most operations are capable of producing trees for market in the five-to-six year range. However, the combined effect of adverse weather and disease outbreak may force greater replanting of damaged trees thereby lengthening the current cycle beyond that considered typical.)
The gross income requirement for acres undergoing Christmas tree harvest in the non-mountain regions of North Carolina (MLRAs 136, 137, 133A, 153A, and 153B) is $1,500 per acre. Once Christmas trees are harvested from specific acreage, the requirement for those harvested acres will revert to the in-lieu of income requirement. As an example, if the total amount of acres devoted to Christmas tree production is six acres, three of which are undergoing harvest and three of which have yet to reach maturity, the gross income requirement would be $4,500.
23
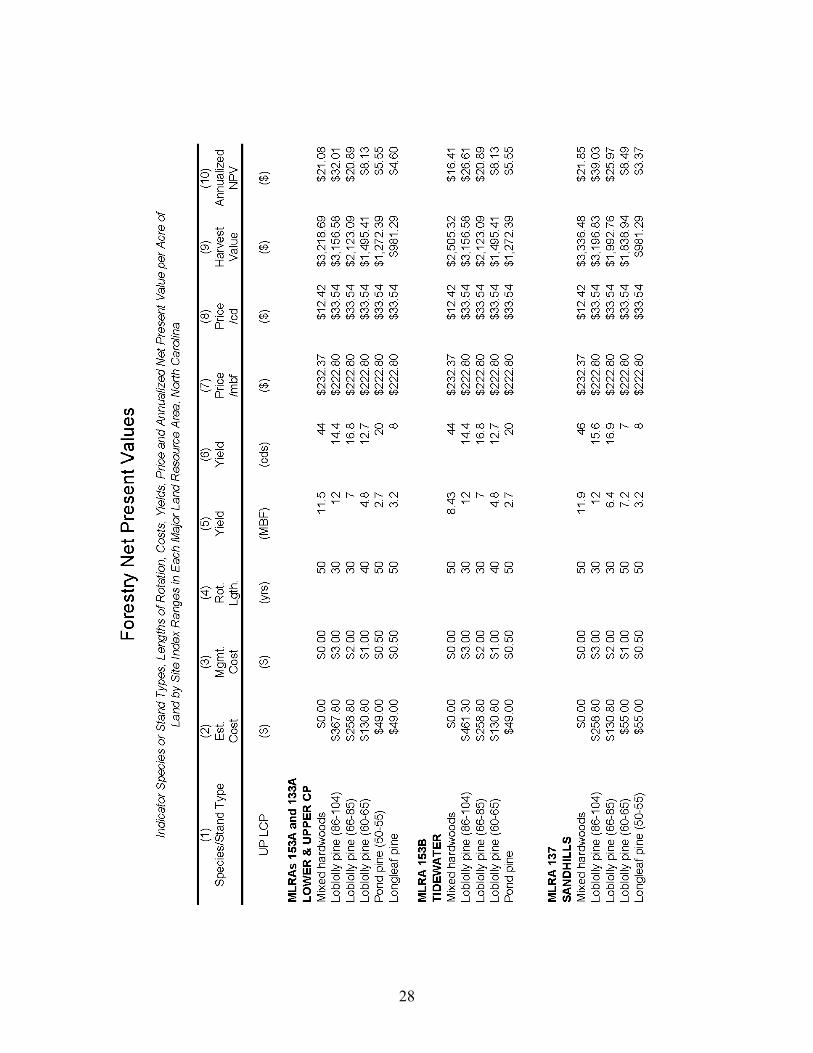
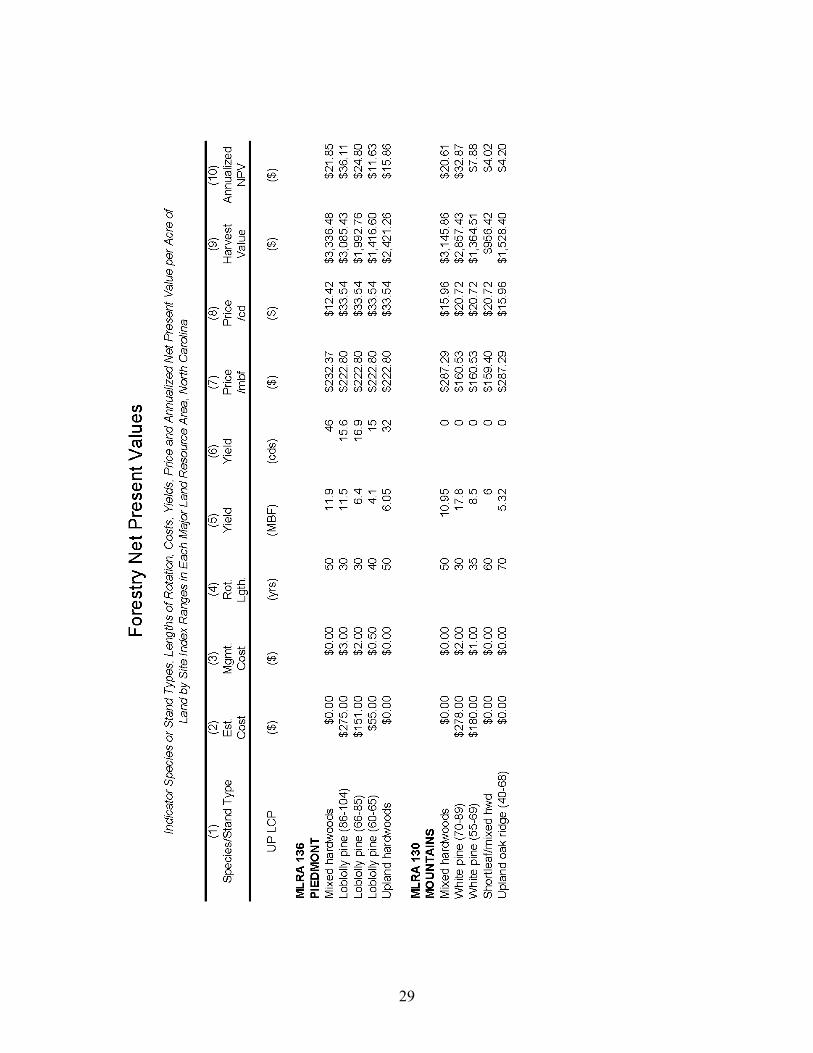
Procedure for Forestry Schedules The charge to the Forestry Group is to develop five net income per-acre ranges for each MLRA
based on the ability of the soils to produce timber income. The task is confounded by variable
species and stand type; management level, costs and opportunities; markets and stumpage prices;
topographies; and landowner objectives across North Carolina.
In an attempt to develop realistic net income per acre in each MLRA, the Forestry Group
considered the following items by area:
1. Soil productivity and indicator tree species (or stand type); 2. Average stand establishment and annual management costs; 3. Average rotation length and timber yield; and 4. Average timber stumpage prices.
Having selected the appropriate combinations above, the harvest value (gross income) from a
managed rotation on a given soil productivity level can be calculated, netted of costs and amortized
to arrive at the net income per acre per year soil expectation value. The ensuing discussion
introduces users of this manual to the procedure, literature and software citations and decisions
leading to the five forest land classes for each MLRA. Column numbers beside sub-headings refer
to columns in the Forestry Net Present Values Table.
Soil Productivity/Indicator Species Selection (Col. 1). Soil productivity in forestry is measured
by site index (SI). Site index is the height to which trees of a given species will grow on a given
soil/site over a designed period of time (usually 50 or 25 years, depending on species, site or age
24
of site table). The Forestry Group identified key indicator species (or stand types) for each MLRA
and then assigned site index ranges for the indicator species that captured the management
opportunities for that region. The site index ranges became the productivity class basis for further
calculations of timber yield and generally can be correlated to Natural Resource Conservation
Service (NRCS) cubic foot per acre productivity classes for most stand types. By MLRA, the
following site index ranges and species/stand types cover the overwhelming majority of soils/sites
and management opportunities.
MLRA 153A, 153B, 137, 136, 133A: Species/Stand Type SI Range (50 yr. basis)
Loblolly pine 86-104 Loblolly pine 66-85
Loblolly pine 60-65 Mixed hardwoods Mixed species and site indices on coves, river
bottoms, bottomlands Pond and/or longleaf pine 50-55 Upland hardwoods (MLRA 136) 40-68 (Upland oak)
MLRA 130: Species/Stand Type SI Range (50 yr. basis)
White pine 70-89 White pine 55-69 Shortleaf/mixed hardwoods Mixed species/sites (SI 42-58 shortleaf) Bottomland/cove hardwoods Mixed species/site indices on coves and bottoms Upland oak ridges 40-68
The site index ranges above, in most cases, can be correlated to individual soil series (and series’
phases) according to NRCS cubic foot per acre productivity classes. An exception will be the cove,
bottomland, river bottom, and other hardwood sites where topographic position must also be
25
considered. The Soils Group is responsible for assigning soil series to the appropriate class for
agriculture, horticulture and forestry.
Stand Establishment and Annual Management Costs (Columns 2 and 3). Stand establishment costs
include site preparation and tree planting costs. Costs vary from $0 to over $200 per acre depending
on soils, species, and management objectives. No cost would be incurred for natural regeneration
(as practiced for hardwoods) with costs increasing as pine plantations are intensively managed on
highly productive sites. The second column in the Forestry Net Present Values Table contains
average establishment costs for the past five years as reported by the N.C. Forest Service for site
classes in each MLRA.
Annual management may include costs of pine release, timber stand improvement activities,
prescribed burning, boundary line maintenance, consultant fees and other contractual services.
Cost may vary from $0 on typical floodplain or bottomland stands to as high as $6 per acre per
year on intensively managed pine plantations. Annual management costs in Forestry Net Present
Values Table are the best estimates under average stand management regimes by site class.
Rotation Length and Timber Yields (Columns 4, 5, 6). Saw timber rotations are recommended on
all sites in North Carolina. This decision is based on the market situation throughout the state,
particularly the scarce markets for low quality and small-diameter pine and hardwood, which
normally would be used for pulpwood. Timber thinnings are not available to most woodlot
managers and, therefore, rotations are assumed to proceed unthinned until the optimum economic
product mix is achieved.
26
Timber yields are based on the most current yield models developed at the N.C. State University
College of Natural Resources for loblolly pine. (Hafley, Smith, and Buford, 1982) and natural
hardwood stands (Gardner et al. 1982). White pine yields, mountain mixed stand yields, and
upland oak yields are derived from U.S. Forest Service yield models developed by Vimmerstedt
(1962) and McClure and Knight. Longleaf and pond pine yields are from Schumacher and Coile
(1960).
Timber Stumpage Prices (Columns 7 and 8). Cost of forestry operations are derived from the
past five-year regional data (provided by the NC Forest Service). For timber, stumpage prices
(prices paid for standing timber to landowners) are derived over the same 5-year period from
regional timber price data obtained from Timber Mart-South, Inc, or similar timber price reporting
system.
Harvest Values (Column 9). Multiplication of timber yields (columns 5 and 6) times the respective
timber stumpage prices (columns 7 and 8) gives the gross harvest value of one rotation.
Annualized Net Present Value (NPV) (Column 10). Harvest values (column 9) are discounted to
present value at a 4 percent discount rate, which is consistent with rates used and documented by
the U.S. Forest Service, forestry industry and forestry economists. This rate approximates the long-
term measures of the opportunity cost of capital in the private sector of the U. S. economy (Row
et al. 1981; Gunter and Haney, 1984). The respective establishment costs and the present value of
annual management costs are subtracted from the present value of the income to obtain the net

27
present value of the timber stand. This is then amortized over the life of the rotation to arrive at
the annualized net present value (or annual net income) figure.
28
29
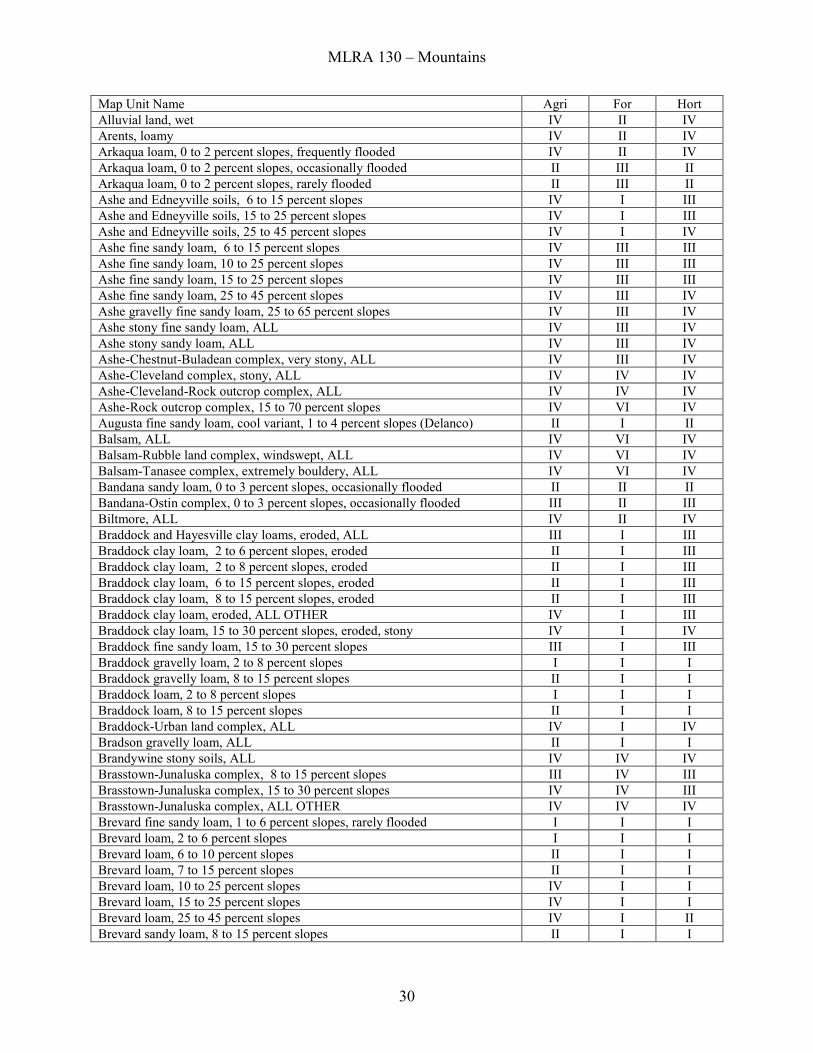
MLRA 130 – Mountains
30
Map Unit Name Agri For Hort Alluvial land, wet IV II IV Arents, loamy IV II IV Arkaqua loam, 0 to 2 percent slopes, frequently flooded IV II IV Arkaqua loam, 0 to 2 percent slopes, occasionally flooded II III II Arkaqua loam, 0 to 2 percent slopes, rarely flooded II III II Ashe and Edneyville soils, 6 to 15 percent slopes IV I III Ashe and Edneyville soils, 15 to 25 percent slopes IV I III Ashe and Edneyville soils, 25 to 45 percent slopes IV I IV Ashe fine sandy loam, 6 to 15 percent slopes IV III III Ashe fine sandy loam, 10 to 25 percent slopes IV III III Ashe fine sandy loam, 15 to 25 percent slopes IV III III Ashe fine sandy loam, 25 to 45 percent slopes IV III IV Ashe gravelly fine sandy loam, 25 to 65 percent slopes IV III IV Ashe stony fine sandy loam, ALL IV III IV Ashe stony sandy loam, ALL IV III IV Ashe-Chestnut-Buladean complex, very stony, ALL IV III IV Ashe-Cleveland complex, stony, ALL IV IV IV Ashe-Cleveland-Rock outcrop complex, ALL IV IV IV Ashe-Rock outcrop complex, 15 to 70 percent slopes IV VI IV Augusta fine sandy loam, cool variant, 1 to 4 percent slopes (Delanco) II I II Balsam, ALL IV VI IV Balsam-Rubble land complex, windswept, ALL IV VI IV Balsam-Tanasee complex, extremely bouldery, ALL IV VI IV Bandana sandy loam, 0 to 3 percent slopes, occasionally flooded II II II Bandana-Ostin complex, 0 to 3 percent slopes, occasionally flooded III II III Biltmore, ALL IV II IV Braddock and Hayesville clay loams, eroded, ALL III I III Braddock clay loam, 2 to 6 percent slopes, eroded II I III Braddock clay loam, 2 to 8 percent slopes, eroded II I III Braddock clay loam, 6 to 15 percent slopes, eroded II I III Braddock clay loam, 8 to 15 percent slopes, eroded II I III Braddock clay loam, eroded, ALL OTHER IV I III Braddock clay loam, 15 to 30 percent slopes, eroded, stony IV I IV Braddock fine sandy loam, 15 to 30 percent slopes III I III Braddock gravelly loam, 2 to 8 percent slopes I I I Braddock gravelly loam, 8 to 15 percent slopes II I I Braddock loam, 2 to 8 percent slopes I I I Braddock loam, 8 to 15 percent slopes II I I Braddock-Urban land complex, ALL IV I IV Bradson gravelly loam, ALL II I I Brandywine stony soils, ALL IV IV IV Brasstown-Junaluska complex, 8 to 15 percent slopes III IV III Brasstown-Junaluska complex, 15 to 30 percent slopes IV IV III Brasstown-Junaluska complex, ALL OTHER IV IV IV Brevard fine sandy loam, 1 to 6 percent slopes, rarely flooded I I I Brevard loam, 2 to 6 percent slopes I I I Brevard loam, 6 to 10 percent slopes II I I Brevard loam, 7 to 15 percent slopes II I I Brevard loam, 10 to 25 percent slopes IV I I Brevard loam, 15 to 25 percent slopes IV I I Brevard loam, 25 to 45 percent slopes IV I II Brevard sandy loam, 8 to 15 percent slopes II I I
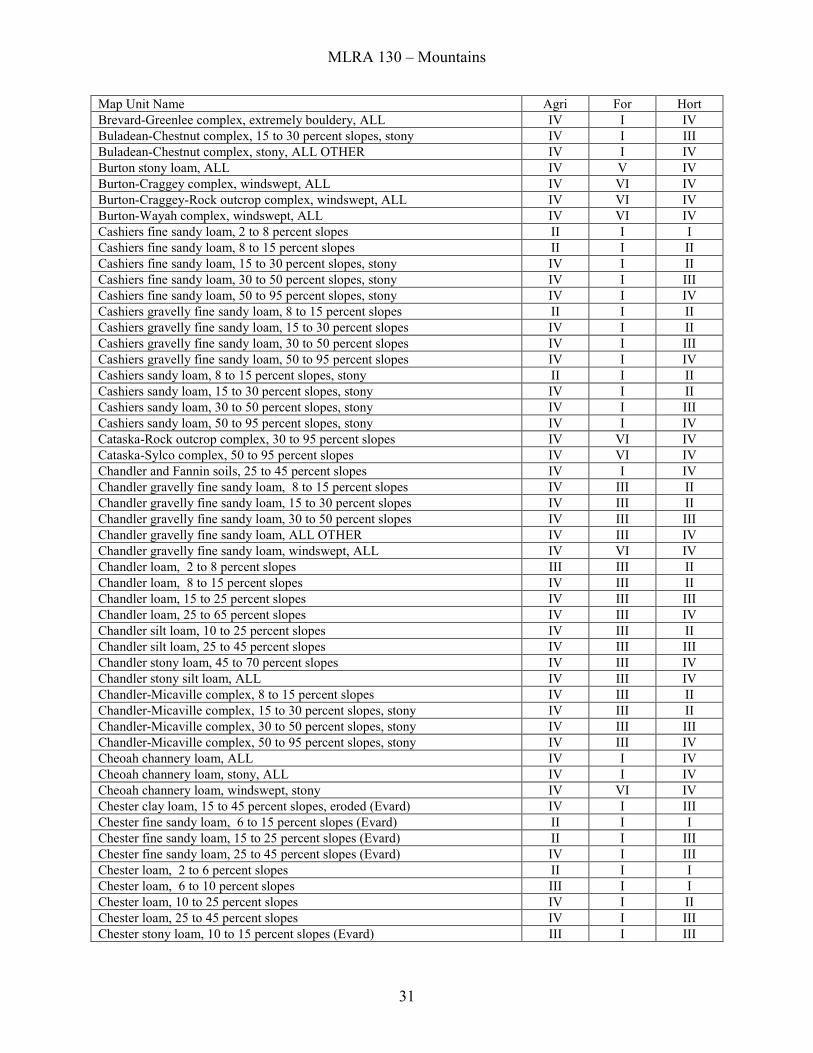
MLRA 130 – Mountains
31
Map Unit Name Agri For Hort Brevard-Greenlee complex, extremely bouldery, ALL IV I IV Buladean-Chestnut complex, 15 to 30 percent slopes, stony IV I III Buladean-Chestnut complex, stony, ALL OTHER IV I IV Burton stony loam, ALL IV V IV Burton-Craggey complex, windswept, ALL IV VI IV Burton-Craggey-Rock outcrop complex, windswept, ALL IV VI IV Burton-Wayah complex, windswept, ALL IV VI IV Cashiers fine sandy loam, 2 to 8 percent slopes II I I Cashiers fine sandy loam, 8 to 15 percent slopes II I II Cashiers fine sandy loam, 15 to 30 percent slopes, stony IV I II Cashiers fine sandy loam, 30 to 50 percent slopes, stony IV I III Cashiers fine sandy loam, 50 to 95 percent slopes, stony IV I IV Cashiers gravelly fine sandy loam, 8 to 15 percent slopes II I II Cashiers gravelly fine sandy loam, 15 to 30 percent slopes IV I II Cashiers gravelly fine sandy loam, 30 to 50 percent slopes IV I III Cashiers gravelly fine sandy loam, 50 to 95 percent slopes IV I IV Cashiers sandy loam, 8 to 15 percent slopes, stony II I II Cashiers sandy loam, 15 to 30 percent slopes, stony IV I II Cashiers sandy loam, 30 to 50 percent slopes, stony IV I III Cashiers sandy loam, 50 to 95 percent slopes, stony IV I IV Cataska-Rock outcrop complex, 30 to 95 percent slopes IV VI IV Cataska-Sylco complex, 50 to 95 percent slopes IV VI IV Chandler and Fannin soils, 25 to 45 percent slopes IV I IV Chandler gravelly fine sandy loam, 8 to 15 percent slopes IV III II Chandler gravelly fine sandy loam, 15 to 30 percent slopes IV III II Chandler gravelly fine sandy loam, 30 to 50 percent slopes IV III III Chandler gravelly fine sandy loam, ALL OTHER IV III IV Chandler gravelly fine sandy loam, windswept, ALL IV VI IV Chandler loam, 2 to 8 percent slopes III III II Chandler loam, 8 to 15 percent slopes IV III II Chandler loam, 15 to 25 percent slopes IV III III Chandler loam, 25 to 65 percent slopes IV III IV Chandler silt loam, 10 to 25 percent slopes IV III II Chandler silt loam, 25 to 45 percent slopes IV III III Chandler stony loam, 45 to 70 percent slopes IV III IV Chandler stony silt loam, ALL IV III IV Chandler-Micaville complex, 8 to 15 percent slopes IV III II Chandler-Micaville complex, 15 to 30 percent slopes, stony IV III II Chandler-Micaville complex, 30 to 50 percent slopes, stony IV III III Chandler-Micaville complex, 50 to 95 percent slopes, stony IV III IV Cheoah channery loam, ALL IV I IV Cheoah channery loam, stony, ALL IV I IV Cheoah channery loam, windswept, stony IV VI IV Chester clay loam, 15 to 45 percent slopes, eroded (Evard) IV I III Chester fine sandy loam, 6 to 15 percent slopes (Evard) II I I Chester fine sandy loam, 15 to 25 percent slopes (Evard) II I III Chester fine sandy loam, 25 to 45 percent slopes (Evard) IV I III Chester loam, 2 to 6 percent slopes II I I Chester loam, 6 to 10 percent slopes III I I Chester loam, 10 to 25 percent slopes IV I II Chester loam, 25 to 45 percent slopes IV I III Chester stony loam, 10 to 15 percent slopes (Evard) III I III
MLRA 130 – Mountains
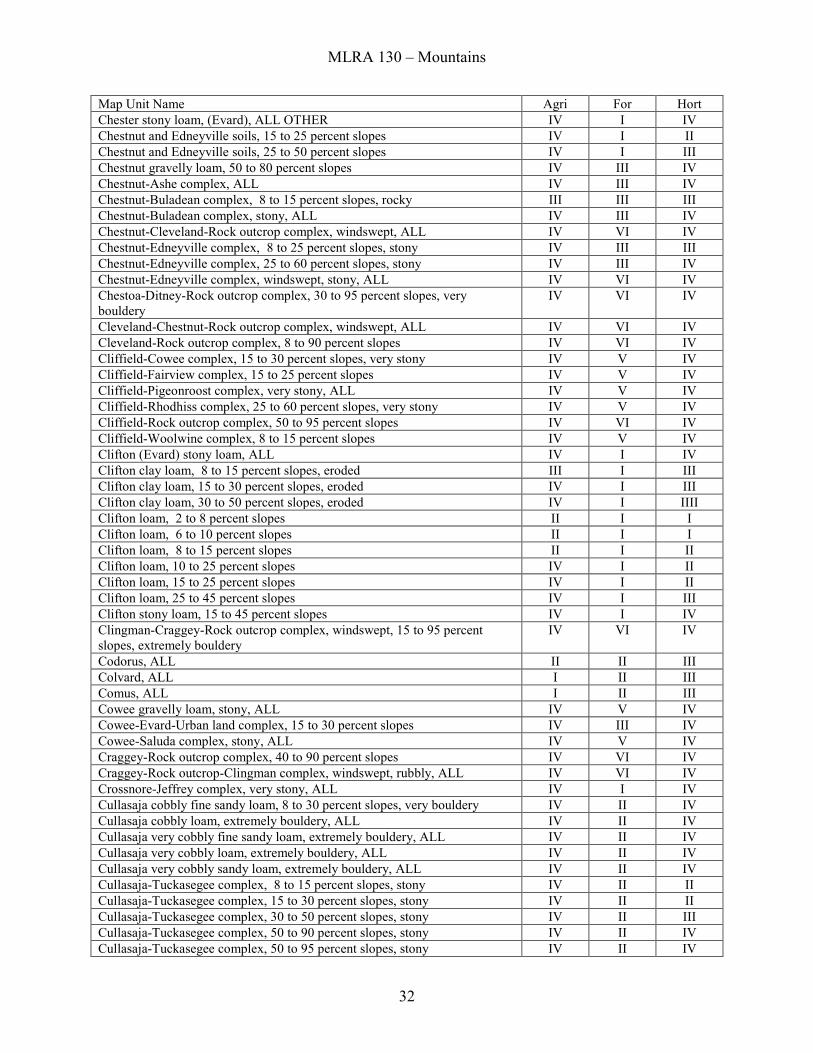
32
Map Unit Name Agri For Hort Chester stony loam, (Evard), ALL OTHER IV I IV Chestnut and Edneyville soils, 15 to 25 percent slopes IV I II Chestnut and Edneyville soils, 25 to 50 percent slopes IV I III Chestnut gravelly loam, 50 to 80 percent slopes IV III IV Chestnut-Ashe complex, ALL IV III IV Chestnut-Buladean complex, 8 to 15 percent slopes, rocky III III III Chestnut-Buladean complex, stony, ALL IV III IV Chestnut-Cleveland-Rock outcrop complex, windswept, ALL IV VI IV Chestnut-Edneyville complex, 8 to 25 percent slopes, stony IV III III Chestnut-Edneyville complex, 25 to 60 percent slopes, stony IV III IV Chestnut-Edneyville complex, windswept, stony, ALL IV VI IV Chestoa-Ditney-Rock outcrop complex, 30 to 95 percent slopes, very bouldery
IV VI IV
Cleveland-Chestnut-Rock outcrop complex, windswept, ALL IV VI IV Cleveland-Rock outcrop complex, 8 to 90 percent slopes IV VI IV Cliffield-Cowee complex, 15 to 30 percent slopes, very stony IV V IV Cliffield-Fairview complex, 15 to 25 percent slopes IV V IV Cliffield-Pigeonroost complex, very stony, ALL IV V IV Cliffield-Rhodhiss complex, 25 to 60 percent slopes, very stony IV V IV Cliffield-Rock outcrop complex, 50 to 95 percent slopes IV VI IV Cliffield-Woolwine complex, 8 to 15 percent slopes IV V IV Clifton (Evard) stony loam, ALL IV I IV Clifton clay loam, 8 to 15 percent slopes, eroded III I III Clifton clay loam, 15 to 30 percent slopes, eroded IV I III Clifton clay loam, 30 to 50 percent slopes, eroded IV I IIII Clifton loam, 2 to 8 percent slopes II I I Clifton loam, 6 to 10 percent slopes II I I Clifton loam, 8 to 15 percent slopes II I II Clifton loam, 10 to 25 percent slopes IV I II Clifton loam, 15 to 25 percent slopes IV I II Clifton loam, 25 to 45 percent slopes IV I III Clifton stony loam, 15 to 45 percent slopes IV I IV Clingman-Craggey-Rock outcrop complex, windswept, 15 to 95 percent slopes, extremely bouldery
IV VI IV
Codorus, ALL II II III Colvard, ALL I II III Comus, ALL I II III Cowee gravelly loam, stony, ALL IV V IV Cowee-Evard-Urban land complex, 15 to 30 percent slopes IV III IV Cowee-Saluda complex, stony, ALL IV V IV Craggey-Rock outcrop complex, 40 to 90 percent slopes IV VI IV Craggey-Rock outcrop-Clingman complex, windswept, rubbly, ALL IV VI IV Crossnore-Jeffrey complex, very stony, ALL IV I IV Cullasaja cobbly fine sandy loam, 8 to 30 percent slopes, very bouldery IV II IV Cullasaja cobbly loam, extremely bouldery, ALL IV II IV Cullasaja very cobbly fine sandy loam, extremely bouldery, ALL IV II IV Cullasaja very cobbly loam, extremely bouldery, ALL IV II IV Cullasaja very cobbly sandy loam, extremely bouldery, ALL IV II IV Cullasaja-Tuckasegee complex, 8 to 15 percent slopes, stony IV II II Cullasaja-Tuckasegee complex, 15 to 30 percent slopes, stony IV II II Cullasaja-Tuckasegee complex, 30 to 50 percent slopes, stony IV II III Cullasaja-Tuckasegee complex, 50 to 90 percent slopes, stony IV II IV Cullasaja-Tuckasegee complex, 50 to 95 percent slopes, stony IV II IV
MLRA 130 – Mountains
33
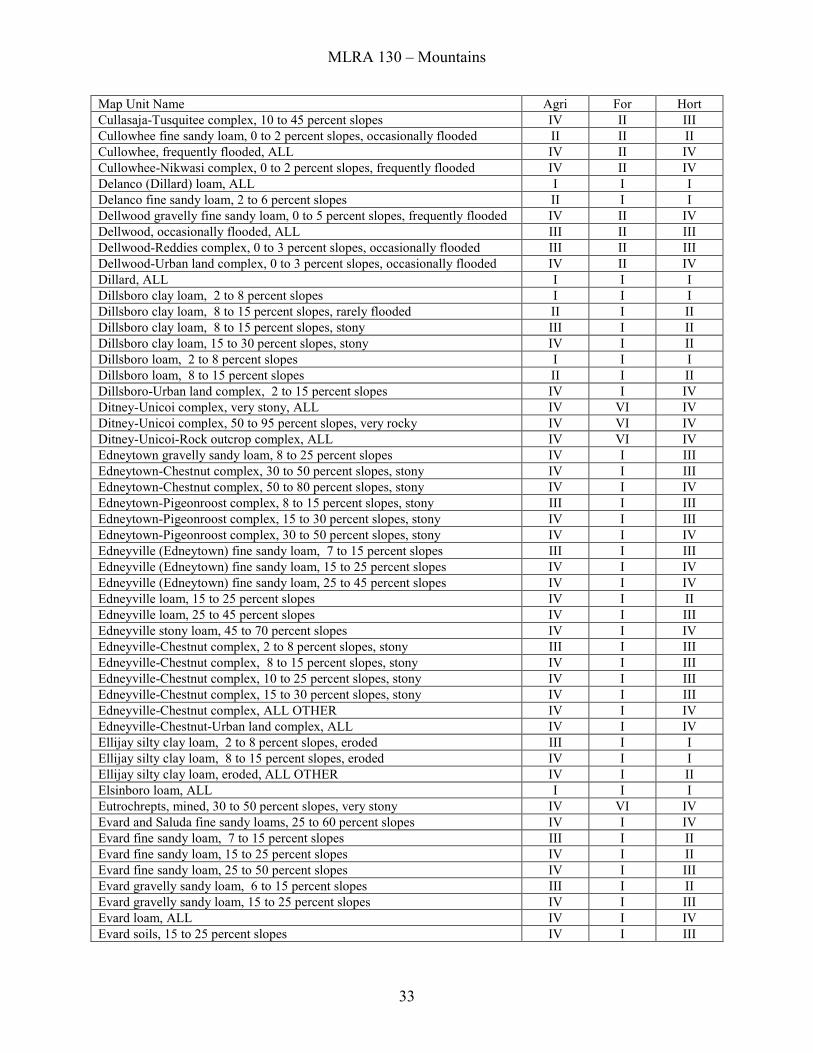
Map Unit Name Agri For Hort Cullasaja-Tusquitee complex, 10 to 45 percent slopes IV II III Cullowhee fine sandy loam, 0 to 2 percent slopes, occasionally flooded II II II Cullowhee, frequently flooded, ALL IV II IV Cullowhee-Nikwasi complex, 0 to 2 percent slopes, frequently flooded IV II IV Delanco (Dillard) loam, ALL I I I Delanco fine sandy loam, 2 to 6 percent slopes II I I Dellwood gravelly fine sandy loam, 0 to 5 percent slopes, frequently flooded IV II IV Dellwood, occasionally flooded, ALL III II III Dellwood-Reddies complex, 0 to 3 percent slopes, occasionally flooded III II III Dellwood-Urban land complex, 0 to 3 percent slopes, occasionally flooded IV II IV Dillard, ALL I I I Dillsboro clay loam, 2 to 8 percent slopes I I I Dillsboro clay loam, 8 to 15 percent slopes, rarely flooded II I II Dillsboro clay loam, 8 to 15 percent slopes, stony III I II Dillsboro clay loam, 15 to 30 percent slopes, stony IV I II Dillsboro loam, 2 to 8 percent slopes I I I Dillsboro loam, 8 to 15 percent slopes II I II Dillsboro-Urban land complex, 2 to 15 percent slopes IV I IV Ditney-Unicoi complex, very stony, ALL IV VI IV Ditney-Unicoi complex, 50 to 95 percent slopes, very rocky IV VI IV Ditney-Unicoi-Rock outcrop complex, ALL IV VI IV Edneytown gravelly sandy loam, 8 to 25 percent slopes IV I III Edneytown-Chestnut complex, 30 to 50 percent slopes, stony IV I III Edneytown-Chestnut complex, 50 to 80 percent slopes, stony IV I IV Edneytown-Pigeonroost complex, 8 to 15 percent slopes, stony III I III Edneytown-Pigeonroost complex, 15 to 30 percent slopes, stony IV I III Edneytown-Pigeonroost complex, 30 to 50 percent slopes, stony IV I IV Edneyville (Edneytown) fine sandy loam, 7 to 15 percent slopes III I III Edneyville (Edneytown) fine sandy loam, 15 to 25 percent slopes IV I IV Edneyville (Edneytown) fine sandy loam, 25 to 45 percent slopes IV I IV Edneyville loam, 15 to 25 percent slopes IV I II Edneyville loam, 25 to 45 percent slopes IV I III Edneyville stony loam, 45 to 70 percent slopes IV I IV Edneyville-Chestnut complex, 2 to 8 percent slopes, stony III I III Edneyville-Chestnut complex, 8 to 15 percent slopes, stony IV I III Edneyville-Chestnut complex, 10 to 25 percent slopes, stony IV I III Edneyville-Chestnut complex, 15 to 30 percent slopes, stony IV I III Edneyville-Chestnut complex, ALL OTHER IV I IV Edneyville-Chestnut-Urban land complex, ALL IV I IV Ellijay silty clay loam, 2 to 8 percent slopes, eroded III I I Ellijay silty clay loam, 8 to 15 percent slopes, eroded IV I I Ellijay silty clay loam, eroded, ALL OTHER IV I II Elsinboro loam, ALL I I I Eutrochrepts, mined, 30 to 50 percent slopes, very stony IV VI IV Evard and Saluda fine sandy loams, 25 to 60 percent slopes IV I IV Evard fine sandy loam, 7 to 15 percent slopes III I II Evard fine sandy loam, 15 to 25 percent slopes IV I II Evard fine sandy loam, 25 to 50 percent slopes IV I III Evard gravelly sandy loam, 6 to 15 percent slopes III I II Evard gravelly sandy loam, 15 to 25 percent slopes IV I III Evard loam, ALL IV I IV Evard soils, 15 to 25 percent slopes IV I III
MLRA 130 – Mountains
34
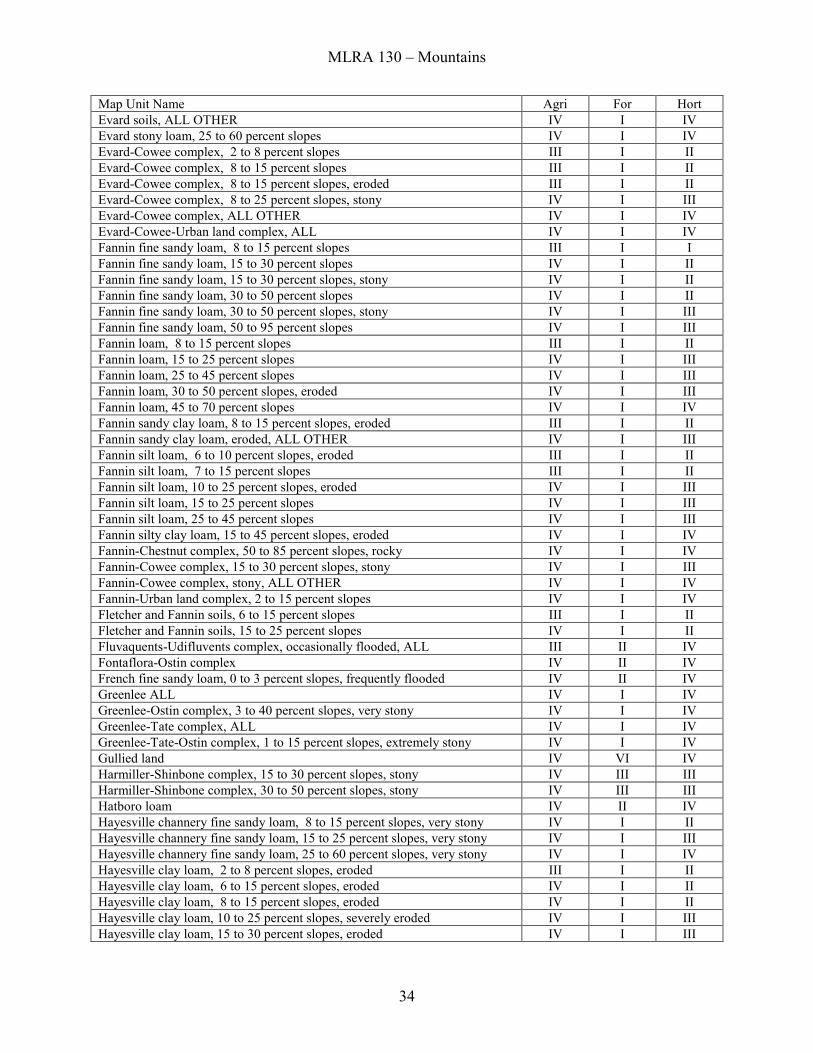
Map Unit Name Agri For Hort Evard soils, ALL OTHER IV I IV Evard stony loam, 25 to 60 percent slopes IV I IV Evard-Cowee complex, 2 to 8 percent slopes III I II Evard-Cowee complex, 8 to 15 percent slopes III I II Evard-Cowee complex, 8 to 15 percent slopes, eroded III I II Evard-Cowee complex, 8 to 25 percent slopes, stony IV I III Evard-Cowee complex, ALL OTHER IV I IV Evard-Cowee-Urban land complex, ALL IV I IV Fannin fine sandy loam, 8 to 15 percent slopes III I I Fannin fine sandy loam, 15 to 30 percent slopes IV I II Fannin fine sandy loam, 15 to 30 percent slopes, stony IV I II Fannin fine sandy loam, 30 to 50 percent slopes IV I II Fannin fine sandy loam, 30 to 50 percent slopes, stony IV I III Fannin fine sandy loam, 50 to 95 percent slopes IV I III Fannin loam, 8 to 15 percent slopes III I II Fannin loam, 15 to 25 percent slopes IV I III Fannin loam, 25 to 45 percent slopes IV I III Fannin loam, 30 to 50 percent slopes, eroded IV I III Fannin loam, 45 to 70 percent slopes IV I IV Fannin sandy clay loam, 8 to 15 percent slopes, eroded III I II Fannin sandy clay loam, eroded, ALL OTHER IV I III Fannin silt loam, 6 to 10 percent slopes, eroded III I II Fannin silt loam, 7 to 15 percent slopes III I II Fannin silt loam, 10 to 25 percent slopes, eroded IV I III Fannin silt loam, 15 to 25 percent slopes IV I III Fannin silt loam, 25 to 45 percent slopes IV I III Fannin silty clay loam, 15 to 45 percent slopes, eroded IV I IV Fannin-Chestnut complex, 50 to 85 percent slopes, rocky IV I IV Fannin-Cowee complex, 15 to 30 percent slopes, stony IV I III Fannin-Cowee complex, stony, ALL OTHER IV I IV Fannin-Urban land complex, 2 to 15 percent slopes IV I IV Fletcher and Fannin soils, 6 to 15 percent slopes III I II Fletcher and Fannin soils, 15 to 25 percent slopes IV I II Fluvaquents-Udifluvents complex, occasionally flooded, ALL III II IV Fontaflora-Ostin complex IV II IV French fine sandy loam, 0 to 3 percent slopes, frequently flooded IV II IV Greenlee ALL IV I IV Greenlee-Ostin complex, 3 to 40 percent slopes, very stony IV I IV Greenlee-Tate complex, ALL IV I IV Greenlee-Tate-Ostin complex, 1 to 15 percent slopes, extremely stony IV I IV Gullied land IV VI IV Harmiller-Shinbone complex, 15 to 30 percent slopes, stony IV III III Harmiller-Shinbone complex, 30 to 50 percent slopes, stony IV III III Hatboro loam IV II IV Hayesville channery fine sandy loam, 8 to 15 percent slopes, very stony IV I II Hayesville channery fine sandy loam, 15 to 25 percent slopes, very stony IV I III Hayesville channery fine sandy loam, 25 to 60 percent slopes, very stony IV I IV Hayesville clay loam, 2 to 8 percent slopes, eroded III I II Hayesville clay loam, 6 to 15 percent slopes, eroded IV I II Hayesville clay loam, 8 to 15 percent slopes, eroded IV I II Hayesville clay loam, 10 to 25 percent slopes, severely eroded IV I III Hayesville clay loam, 15 to 30 percent slopes, eroded IV I III
MLRA 130 – Mountains
35
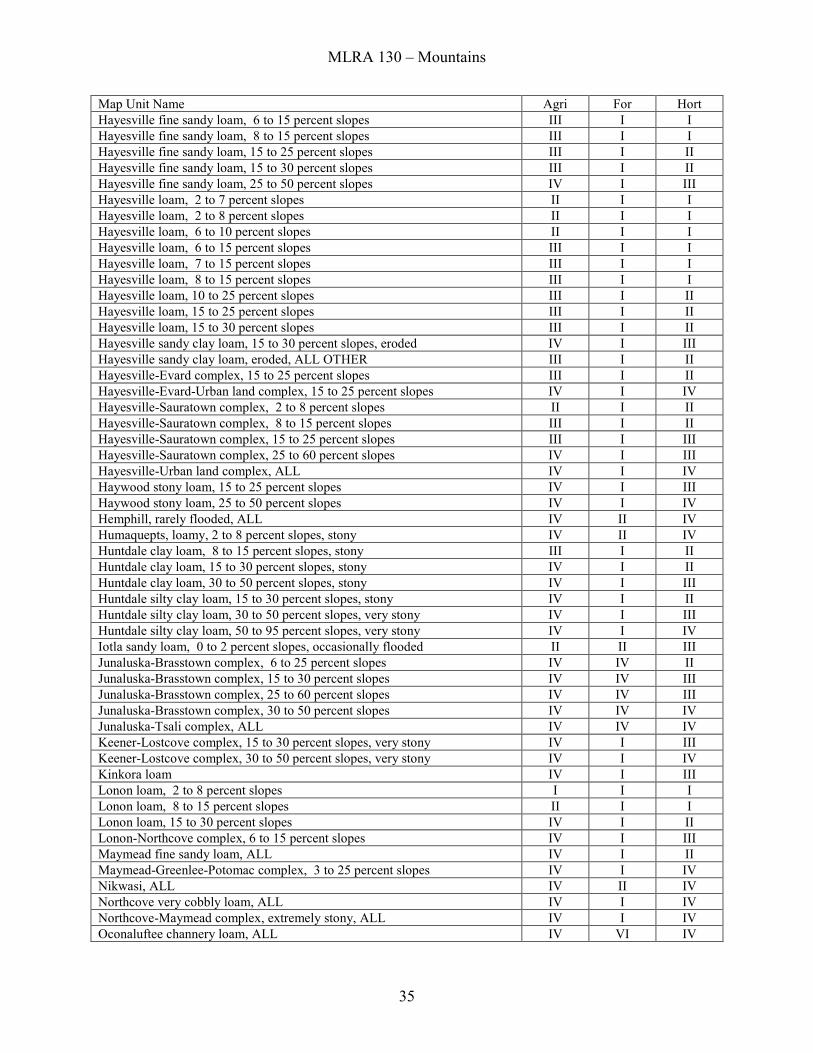
Map Unit Name Agri For Hort Hayesville fine sandy loam, 6 to 15 percent slopes III I I Hayesville fine sandy loam, 8 to 15 percent slopes III I I Hayesville fine sandy loam, 15 to 25 percent slopes III I II Hayesville fine sandy loam, 15 to 30 percent slopes III I II Hayesville fine sandy loam, 25 to 50 percent slopes IV I III Hayesville loam, 2 to 7 percent slopes II I I Hayesville loam, 2 to 8 percent slopes II I I Hayesville loam, 6 to 10 percent slopes II I I Hayesville loam, 6 to 15 percent slopes III I I Hayesville loam, 7 to 15 percent slopes III I I Hayesville loam, 8 to 15 percent slopes III I I Hayesville loam, 10 to 25 percent slopes III I II Hayesville loam, 15 to 25 percent slopes III I II Hayesville loam, 15 to 30 percent slopes III I II Hayesville sandy clay loam, 15 to 30 percent slopes, eroded IV I III Hayesville sandy clay loam, eroded, ALL OTHER III I II Hayesville-Evard complex, 15 to 25 percent slopes III I II Hayesville-Evard-Urban land complex, 15 to 25 percent slopes IV I IV Hayesville-Sauratown complex, 2 to 8 percent slopes II I II Hayesville-Sauratown complex, 8 to 15 percent slopes III I II Hayesville-Sauratown complex, 15 to 25 percent slopes III I III Hayesville-Sauratown complex, 25 to 60 percent slopes IV I III Hayesville-Urban land complex, ALL IV I IV Haywood stony loam, 15 to 25 percent slopes IV I III Haywood stony loam, 25 to 50 percent slopes IV I IV Hemphill, rarely flooded, ALL IV II IV Humaquepts, loamy, 2 to 8 percent slopes, stony IV II IV Huntdale clay loam, 8 to 15 percent slopes, stony III I II Huntdale clay loam, 15 to 30 percent slopes, stony IV I II Huntdale clay loam, 30 to 50 percent slopes, stony IV I III Huntdale silty clay loam, 15 to 30 percent slopes, stony IV I II Huntdale silty clay loam, 30 to 50 percent slopes, very stony IV I III Huntdale silty clay loam, 50 to 95 percent slopes, very stony IV I IV Iotla sandy loam, 0 to 2 percent slopes, occasionally flooded II II III Junaluska-Brasstown complex, 6 to 25 percent slopes IV IV II Junaluska-Brasstown complex, 15 to 30 percent slopes IV IV III Junaluska-Brasstown complex, 25 to 60 percent slopes IV IV III Junaluska-Brasstown complex, 30 to 50 percent slopes IV IV IV Junaluska-Tsali complex, ALL IV IV IV Keener-Lostcove complex, 15 to 30 percent slopes, very stony IV I III Keener-Lostcove complex, 30 to 50 percent slopes, very stony IV I IV Kinkora loam IV I III Lonon loam, 2 to 8 percent slopes I I I Lonon loam, 8 to 15 percent slopes II I I Lonon loam, 15 to 30 percent slopes IV I II Lonon-Northcove complex, 6 to 15 percent slopes IV I III Maymead fine sandy loam, ALL IV I II Maymead-Greenlee-Potomac complex, 3 to 25 percent slopes IV I IV Nikwasi, ALL IV II IV Northcove very cobbly loam, ALL IV I IV Northcove-Maymead complex, extremely stony, ALL IV I IV Oconaluftee channery loam, ALL IV VI IV
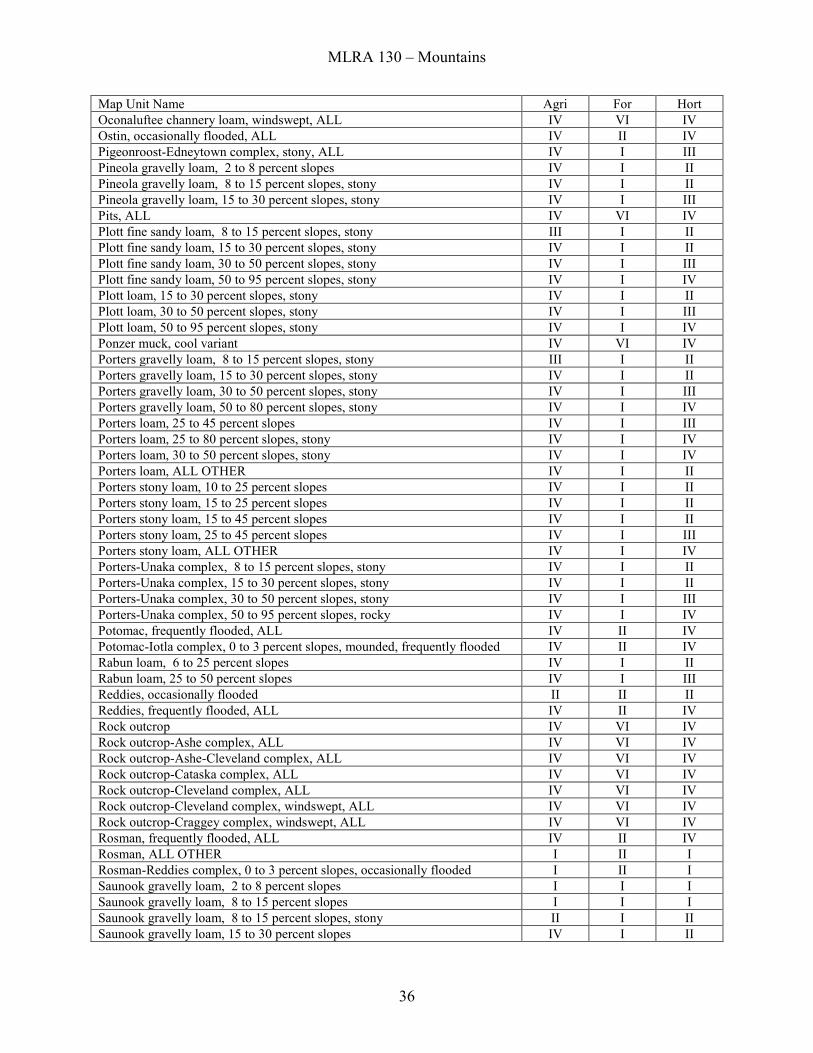
MLRA 130 – Mountains
36
Map Unit Name Agri For Hort Oconaluftee channery loam, windswept, ALL IV VI IV Ostin, occasionally flooded, ALL IV II IV Pigeonroost-Edneytown complex, stony, ALL IV I III Pineola gravelly loam, 2 to 8 percent slopes IV I II Pineola gravelly loam, 8 to 15 percent slopes, stony IV I II Pineola gravelly loam, 15 to 30 percent slopes, stony IV I III Pits, ALL IV VI IV Plott fine sandy loam, 8 to 15 percent slopes, stony III I II Plott fine sandy loam, 15 to 30 percent slopes, stony IV I II Plott fine sandy loam, 30 to 50 percent slopes, stony IV I III Plott fine sandy loam, 50 to 95 percent slopes, stony IV I IV Plott loam, 15 to 30 percent slopes, stony IV I II Plott loam, 30 to 50 percent slopes, stony IV I III Plott loam, 50 to 95 percent slopes, stony IV I IV Ponzer muck, cool variant IV VI IV Porters gravelly loam, 8 to 15 percent slopes, stony III I II Porters gravelly loam, 15 to 30 percent slopes, stony IV I II Porters gravelly loam, 30 to 50 percent slopes, stony IV I III Porters gravelly loam, 50 to 80 percent slopes, stony IV I IV Porters loam, 25 to 45 percent slopes IV I III Porters loam, 25 to 80 percent slopes, stony IV I IV Porters loam, 30 to 50 percent slopes, stony IV I IV Porters loam, ALL OTHER IV I II Porters stony loam, 10 to 25 percent slopes IV I II Porters stony loam, 15 to 25 percent slopes IV I II Porters stony loam, 15 to 45 percent slopes IV I II Porters stony loam, 25 to 45 percent slopes IV I III Porters stony loam, ALL OTHER IV I IV Porters-Unaka complex, 8 to 15 percent slopes, stony IV I II Porters-Unaka complex, 15 to 30 percent slopes, stony IV I II Porters-Unaka complex, 30 to 50 percent slopes, stony IV I III Porters-Unaka complex, 50 to 95 percent slopes, rocky IV I IV Potomac, frequently flooded, ALL IV II IV Potomac-Iotla complex, 0 to 3 percent slopes, mounded, frequently flooded IV II IV Rabun loam, 6 to 25 percent slopes IV I II Rabun loam, 25 to 50 percent slopes IV I III Reddies, occasionally flooded II II II Reddies, frequently flooded, ALL IV II IV Rock outcrop IV VI IV Rock outcrop-Ashe complex, ALL IV VI IV Rock outcrop-Ashe-Cleveland complex, ALL IV VI IV Rock outcrop-Cataska complex, ALL IV VI IV Rock outcrop-Cleveland complex, ALL IV VI IV Rock outcrop-Cleveland complex, windswept, ALL IV VI IV Rock outcrop-Craggey complex, windswept, ALL IV VI IV Rosman, frequently flooded, ALL IV II IV Rosman, ALL OTHER I II I Rosman-Reddies complex, 0 to 3 percent slopes, occasionally flooded I II I Saunook gravelly loam, 2 to 8 percent slopes I I I Saunook gravelly loam, 8 to 15 percent slopes I I I Saunook gravelly loam, 8 to 15 percent slopes, stony II I II Saunook gravelly loam, 15 to 30 percent slopes IV I II
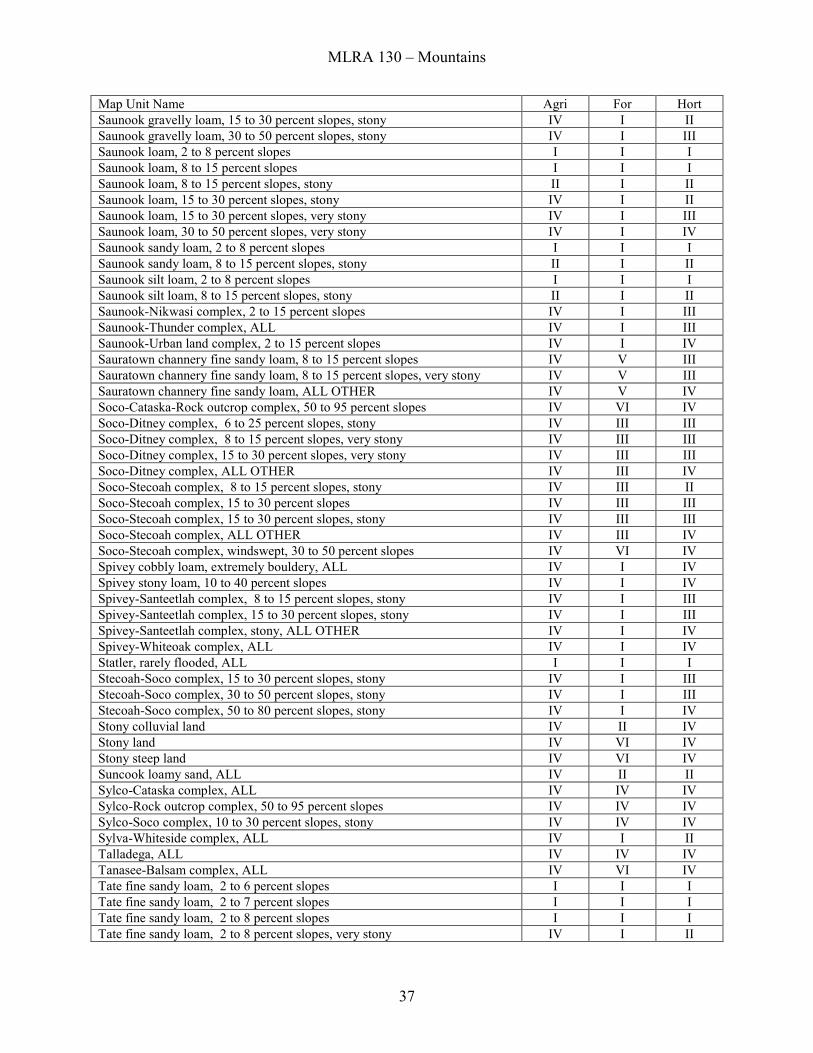
MLRA 130 – Mountains
37
Map Unit Name Agri For Hort Saunook gravelly loam, 15 to 30 percent slopes, stony IV I II Saunook gravelly loam, 30 to 50 percent slopes, stony IV I III Saunook loam, 2 to 8 percent slopes I I I Saunook loam, 8 to 15 percent slopes I I I Saunook loam, 8 to 15 percent slopes, stony II I II Saunook loam, 15 to 30 percent slopes, stony IV I II Saunook loam, 15 to 30 percent slopes, very stony IV I III Saunook loam, 30 to 50 percent slopes, very stony IV I IV Saunook sandy loam, 2 to 8 percent slopes I I I Saunook sandy loam, 8 to 15 percent slopes, stony II I II Saunook silt loam, 2 to 8 percent slopes I I I Saunook silt loam, 8 to 15 percent slopes, stony II I II Saunook-Nikwasi complex, 2 to 15 percent slopes IV I III Saunook-Thunder complex, ALL IV I III Saunook-Urban land complex, 2 to 15 percent slopes IV I IV Sauratown channery fine sandy loam, 8 to 15 percent slopes IV V III Sauratown channery fine sandy loam, 8 to 15 percent slopes, very stony IV V III Sauratown channery fine sandy loam, ALL OTHER IV V IV Soco-Cataska-Rock outcrop complex, 50 to 95 percent slopes IV VI IV Soco-Ditney complex, 6 to 25 percent slopes, stony IV III III Soco-Ditney complex, 8 to 15 percent slopes, very stony IV III III Soco-Ditney complex, 15 to 30 percent slopes, very stony IV III III Soco-Ditney complex, ALL OTHER IV III IV Soco-Stecoah complex, 8 to 15 percent slopes, stony IV III II Soco-Stecoah complex, 15 to 30 percent slopes IV III III Soco-Stecoah complex, 15 to 30 percent slopes, stony IV III III Soco-Stecoah complex, ALL OTHER IV III IV Soco-Stecoah complex, windswept, 30 to 50 percent slopes IV VI IV Spivey cobbly loam, extremely bouldery, ALL IV I IV Spivey stony loam, 10 to 40 percent slopes IV I IV Spivey-Santeetlah complex, 8 to 15 percent slopes, stony IV I III Spivey-Santeetlah complex, 15 to 30 percent slopes, stony IV I III Spivey-Santeetlah complex, stony, ALL OTHER IV I IV Spivey-Whiteoak complex, ALL IV I IV Statler, rarely flooded, ALL I I I Stecoah-Soco complex, 15 to 30 percent slopes, stony IV I III Stecoah-Soco complex, 30 to 50 percent slopes, stony IV I III Stecoah-Soco complex, 50 to 80 percent slopes, stony IV I IV Stony colluvial land IV II IV Stony land IV VI IV Stony steep land IV VI IV Suncook loamy sand, ALL IV II II Sylco-Cataska complex, ALL IV IV IV Sylco-Rock outcrop complex, 50 to 95 percent slopes IV IV IV Sylco-Soco complex, 10 to 30 percent slopes, stony IV IV IV Sylva-Whiteside complex, ALL IV I II Talladega, ALL IV IV IV Tanasee-Balsam complex, ALL IV VI IV Tate fine sandy loam, 2 to 6 percent slopes I I I Tate fine sandy loam, 2 to 7 percent slopes I I I Tate fine sandy loam, 2 to 8 percent slopes I I I Tate fine sandy loam, 2 to 8 percent slopes, very stony IV I II
MLRA 130 – Mountains
38
Map Unit Name Agri For Hort Tate fine sandy loam, 6 to 15 percent slopes II I I Tate fine sandy loam, 7 to 15 percent slopes II I I Tate fine sandy loam, 8 to 15 percent slopes II I I Tate fine sandy loam, 8 to 25 percent slopes IV I II Tate fine sandy loam, 15 to 25 percent slopes IV I II Tate gravelly loam, 8 to 15 percent slopes II I I Tate gravelly loam, 8 to 15 percent slopes, stony II I II Tate gravelly loam, 15 to 30 percent slopes, stony IV I II Tate loam, 2 to 6 percent slopes I I I Tate loam, 2 to 8 percent slopes I I I Tate loam, 6 to 10 percent slopes II I I Tate loam, 6 to 15 percent slopes II I I Tate loam, 8 to 15 percent slopes II I I Tate loam, 10 to 15 percent slopes II I I Tate loam, 15 to 25 percent slopes IV I II Tate loam, 15 to 30 percent slopes IV I II Tate-Cullowhee complex, 0 to 25 percent slopes IV I II Tate-French complex, 2 to 10 percent slopes II I II Tate-Greenlee complex, ALL IV I IV Thunder-Saunook complex, ALL IV II IV Toecane-Tusquitee complex, ALL IV II III Toxaway, ALL IV II IV Transylvania silt loam I II II Trimont gravelly loam, ALL IV I IV Tuckasegee-Cullasaja complex, 8 to 15 percent slopes, stony IV II III Tuckasegee-Cullasaja complex, 15 to 30 percent slopes, very stony IV II IV Tuckasegee-Cullasaja complex, 30 to 50 percent slopes, extremely stony IV II IV Tuckasegee-Whiteside complex, 2 to 8 percent slopes I II I Tuckasegee-Whiteside complex, 8 to 15 percent slopes II II I Tusquitee and Spivey stony soils, ALL IV I IV Tusquitee loam, 6 to 10 percent slopes I I I Tusquitee loam, 6 to 15 percent slopes II I I Tusquitee loam, 7 to 15 percent slopes II I I Tusquitee loam, 8 to 15 percent slopes II I I Tusquitee loam, 10 to 15 percent slopes II I I Tusquitee loam, 15 to 25 percent slopes IV I II Tusquitee stony loam, 25 to 45 percent slopes IV I IV Tusquitee stony loam, ALL OTHER IV I III Udifluvents, frequently flooded, ALL IV II IV Udorthents, loamy, ALL IV V IV Udorthents-Pits complex, mounded, 0 to 2 percent slopes, occasionally flooded
IV V IV
Udorthents-Urban land complex, ALL IV V IV Unaka-Porters complex, very rocky, ALL IV V IV Unaka-Rock outcrop complex, 50 to 95 percent slopes, very bouldery IV VI IV Unicoi-Rock outcrop complex, 30 to 95 percent slopes, extremely bouldery IV V IV Unison fine sandy loam, 2 to 8 percent slopes I I I Unison fine sandy loam, 8 to 15 percent slopes II I I Unison fine sandy loam, 15 to 25 percent slopes IV I II Unison loam, 2 to 8 percent slopes I I I Unison loam, 8 to 15 percent slopes II I I Unison loam, 15 to 30 percent slopes IV I II Urban land IV VI II
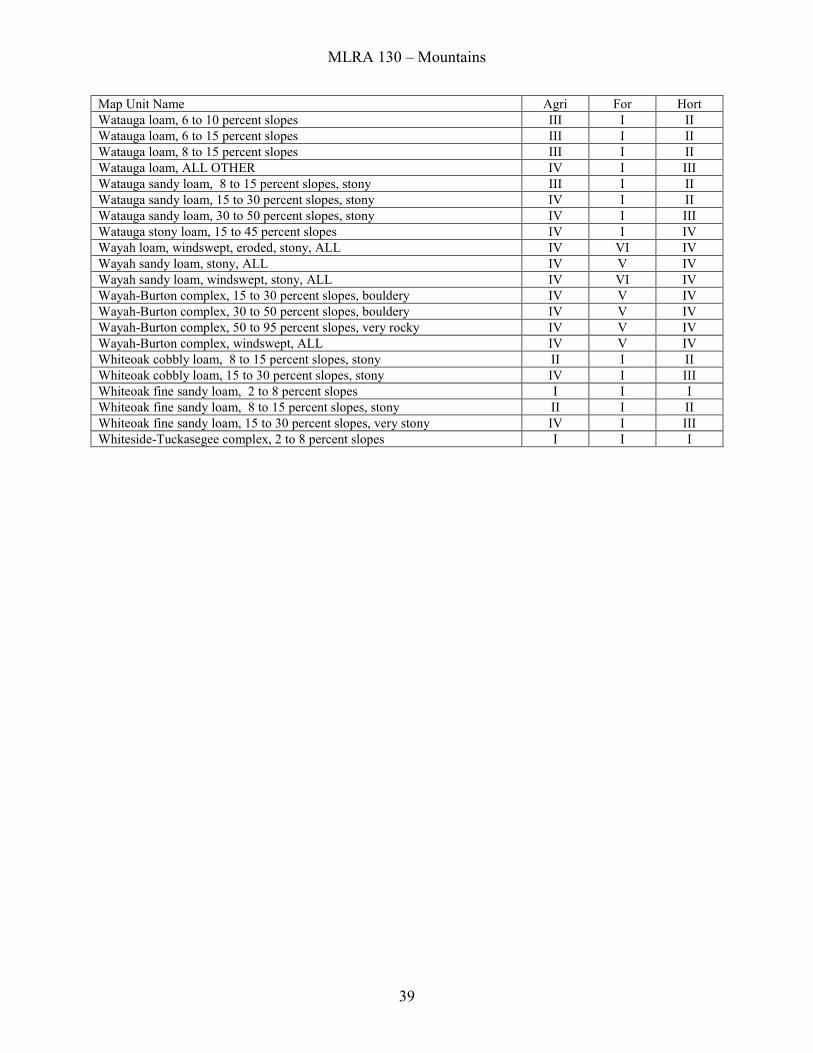
MLRA 130 – Mountains
39
Map Unit Name Agri For Hort Watauga loam, 6 to 10 percent slopes III I II Watauga loam, 6 to 15 percent slopes III I II Watauga loam, 8 to 15 percent slopes III I II Watauga loam, ALL OTHER IV I III Watauga sandy loam, 8 to 15 percent slopes, stony III I II Watauga sandy loam, 15 to 30 percent slopes, stony IV I II Watauga sandy loam, 30 to 50 percent slopes, stony IV I III Watauga stony loam, 15 to 45 percent slopes IV I IV Wayah loam, windswept, eroded, stony, ALL IV VI IV Wayah sandy loam, stony, ALL IV V IV Wayah sandy loam, windswept, stony, ALL IV VI IV Wayah-Burton complex, 15 to 30 percent slopes, bouldery IV V IV Wayah-Burton complex, 30 to 50 percent slopes, bouldery IV V IV Wayah-Burton complex, 50 to 95 percent slopes, very rocky IV V IV Wayah-Burton complex, windswept, ALL IV V IV Whiteoak cobbly loam, 8 to 15 percent slopes, stony II I II Whiteoak cobbly loam, 15 to 30 percent slopes, stony IV I III Whiteoak fine sandy loam, 2 to 8 percent slopes I I I Whiteoak fine sandy loam, 8 to 15 percent slopes, stony II I II Whiteoak fine sandy loam, 15 to 30 percent slopes, very stony IV I III Whiteside-Tuckasegee complex, 2 to 8 percent slopes I I I
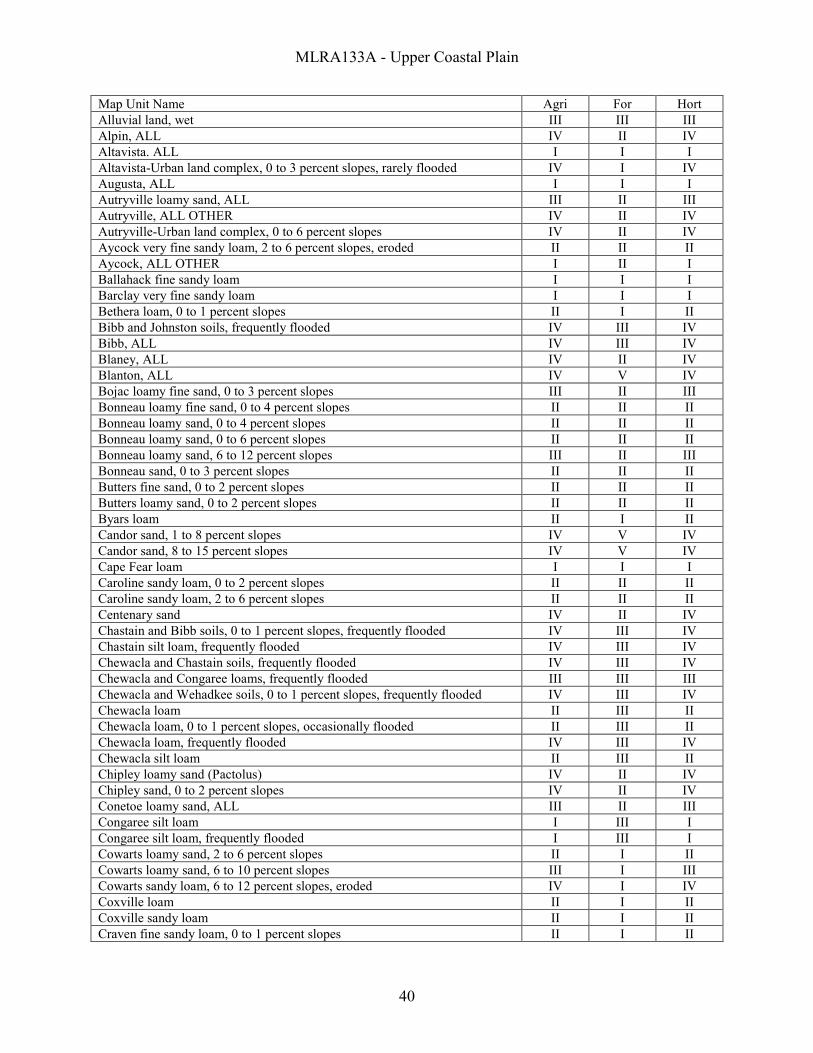
MLRA133A - Upper Coastal Plain
40
Map Unit Name Agri For Hort Alluvial land, wet III III III Alpin, ALL IV II IV Altavista. ALL I I I Altavista-Urban land complex, 0 to 3 percent slopes, rarely flooded IV I IV Augusta, ALL I I I Autryville loamy sand, ALL III II III Autryville, ALL OTHER IV II IV Autryville-Urban land complex, 0 to 6 percent slopes IV II IV Aycock very fine sandy loam, 2 to 6 percent slopes, eroded II II II Aycock, ALL OTHER I II I Ballahack fine sandy loam I I I Barclay very fine sandy loam I I I Bethera loam, 0 to 1 percent slopes II I II Bibb and Johnston soils, frequently flooded IV III IV Bibb, ALL IV III IV Blaney, ALL IV II IV Blanton, ALL IV V IV Bojac loamy fine sand, 0 to 3 percent slopes III II III Bonneau loamy fine sand, 0 to 4 percent slopes II II II Bonneau loamy sand, 0 to 4 percent slopes II II II Bonneau loamy sand, 0 to 6 percent slopes II II II Bonneau loamy sand, 6 to 12 percent slopes III II III Bonneau sand, 0 to 3 percent slopes II II II Butters fine sand, 0 to 2 percent slopes II II II Butters loamy sand, 0 to 2 percent slopes II II II Byars loam II I II Candor sand, 1 to 8 percent slopes IV V IV Candor sand, 8 to 15 percent slopes IV V IV Cape Fear loam I I I Caroline sandy loam, 0 to 2 percent slopes II II II Caroline sandy loam, 2 to 6 percent slopes II II II Centenary sand IV II IV Chastain and Bibb soils, 0 to 1 percent slopes, frequently flooded IV III IV Chastain silt loam, frequently flooded IV III IV Chewacla and Chastain soils, frequently flooded IV III IV Chewacla and Congaree loams, frequently flooded III III III Chewacla and Wehadkee soils, 0 to 1 percent slopes, frequently flooded IV III IV Chewacla loam II III II Chewacla loam, 0 to 1 percent slopes, occasionally flooded II III II Chewacla loam, frequently flooded IV III IV Chewacla silt loam II III II Chipley loamy sand (Pactolus) IV II IV Chipley sand, 0 to 2 percent slopes IV II IV Conetoe loamy sand, ALL III II III Congaree silt loam I III I Congaree silt loam, frequently flooded I III I Cowarts loamy sand, 2 to 6 percent slopes II I II Cowarts loamy sand, 6 to 10 percent slopes III I III Cowarts sandy loam, 6 to 12 percent slopes, eroded IV I IV Coxville loam II I II Coxville sandy loam II I II Craven fine sandy loam, 0 to 1 percent slopes II I II
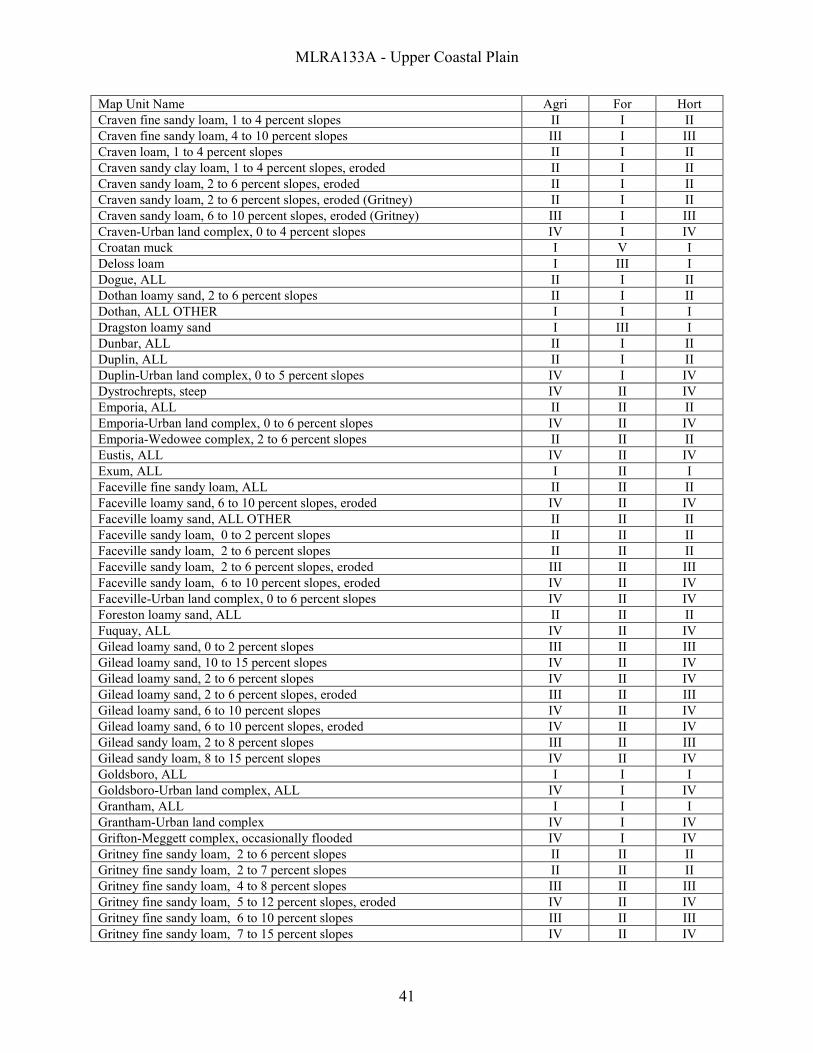
MLRA133A - Upper Coastal Plain
41
Map Unit Name Agri For Hort Craven fine sandy loam, 1 to 4 percent slopes II I II Craven fine sandy loam, 4 to 10 percent slopes III I III Craven loam, 1 to 4 percent slopes II I II Craven sandy clay loam, 1 to 4 percent slopes, eroded II I II Craven sandy loam, 2 to 6 percent slopes, eroded II I II Craven sandy loam, 2 to 6 percent slopes, eroded (Gritney) II I II Craven sandy loam, 6 to 10 percent slopes, eroded (Gritney) III I III Craven-Urban land complex, 0 to 4 percent slopes IV I IV Croatan muck I V I Deloss loam I III I Dogue, ALL II I II Dothan loamy sand, 2 to 6 percent slopes II I II Dothan, ALL OTHER I I I Dragston loamy sand I III I Dunbar, ALL II I II Duplin, ALL II I II Duplin-Urban land complex, 0 to 5 percent slopes IV I IV Dystrochrepts, steep IV II IV Emporia, ALL II II II Emporia-Urban land complex, 0 to 6 percent slopes IV II IV Emporia-Wedowee complex, 2 to 6 percent slopes II II II Eustis, ALL IV II IV Exum, ALL I II I Faceville fine sandy loam, ALL II II II Faceville loamy sand, 6 to 10 percent slopes, eroded IV II IV Faceville loamy sand, ALL OTHER II II II Faceville sandy loam, 0 to 2 percent slopes II II II Faceville sandy loam, 2 to 6 percent slopes II II II Faceville sandy loam, 2 to 6 percent slopes, eroded III II III Faceville sandy loam, 6 to 10 percent slopes, eroded IV II IV Faceville-Urban land complex, 0 to 6 percent slopes IV II IV Foreston loamy sand, ALL II II II Fuquay, ALL IV II IV Gilead loamy sand, 0 to 2 percent slopes III II III Gilead loamy sand, 10 to 15 percent slopes IV II IV Gilead loamy sand, 2 to 6 percent slopes IV II IV Gilead loamy sand, 2 to 6 percent slopes, eroded III II III Gilead loamy sand, 6 to 10 percent slopes IV II IV Gilead loamy sand, 6 to 10 percent slopes, eroded IV II IV Gilead sandy loam, 2 to 8 percent slopes III II III Gilead sandy loam, 8 to 15 percent slopes IV II IV Goldsboro, ALL I I I Goldsboro-Urban land complex, ALL IV I IV Grantham, ALL I I I Grantham-Urban land complex IV I IV Grifton-Meggett complex, occasionally flooded IV I IV Gritney fine sandy loam, 2 to 6 percent slopes II II II Gritney fine sandy loam, 2 to 7 percent slopes II II II Gritney fine sandy loam, 4 to 8 percent slopes III II III Gritney fine sandy loam, 5 to 12 percent slopes, eroded IV II IV Gritney fine sandy loam, 6 to 10 percent slopes III II III Gritney fine sandy loam, 7 to 15 percent slopes IV II IV
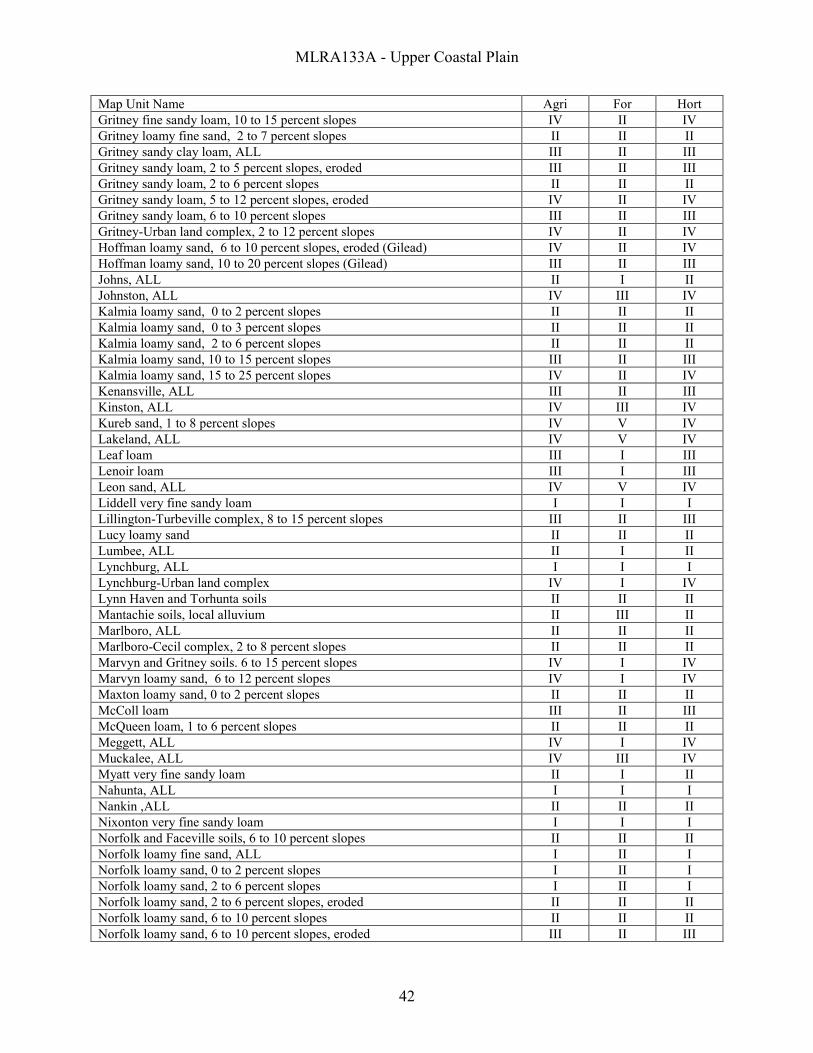
MLRA133A - Upper Coastal Plain
42
Map Unit Name Agri For Hort Gritney fine sandy loam, 10 to 15 percent slopes IV II IV Gritney loamy fine sand, 2 to 7 percent slopes II II II Gritney sandy clay loam, ALL III II III Gritney sandy loam, 2 to 5 percent slopes, eroded III II III Gritney sandy loam, 2 to 6 percent slopes II II II Gritney sandy loam, 5 to 12 percent slopes, eroded IV II IV Gritney sandy loam, 6 to 10 percent slopes III II III Gritney-Urban land complex, 2 to 12 percent slopes IV II IV Hoffman loamy sand, 6 to 10 percent slopes, eroded (Gilead) IV II IV Hoffman loamy sand, 10 to 20 percent slopes (Gilead) III II III Johns, ALL II I II Johnston, ALL IV III IV Kalmia loamy sand, 0 to 2 percent slopes II II II Kalmia loamy sand, 0 to 3 percent slopes II II II Kalmia loamy sand, 2 to 6 percent slopes II II II Kalmia loamy sand, 10 to 15 percent slopes III II III Kalmia loamy sand, 15 to 25 percent slopes IV II IV Kenansville, ALL III II III Kinston, ALL IV III IV Kureb sand, 1 to 8 percent slopes IV V IV Lakeland, ALL IV V IV Leaf loam III I III Lenoir loam III I III Leon sand, ALL IV V IV Liddell very fine sandy loam I I I Lillington-Turbeville complex, 8 to 15 percent slopes III II III Lucy loamy sand II II II Lumbee, ALL II I II Lynchburg, ALL I I I Lynchburg-Urban land complex IV I IV Lynn Haven and Torhunta soils II II II Mantachie soils, local alluvium II III II Marlboro, ALL II II II Marlboro-Cecil complex, 2 to 8 percent slopes II II II Marvyn and Gritney soils. 6 to 15 percent slopes IV I IV Marvyn loamy sand, 6 to 12 percent slopes IV I IV Maxton loamy sand, 0 to 2 percent slopes II II II McColl loam III II III McQueen loam, 1 to 6 percent slopes II II II Meggett, ALL IV I IV Muckalee, ALL IV III IV Myatt very fine sandy loam II I II Nahunta, ALL I I I Nankin ,ALL II II II Nixonton very fine sandy loam I I I Norfolk and Faceville soils, 6 to 10 percent slopes II II II Norfolk loamy fine sand, ALL I II I Norfolk loamy sand, 0 to 2 percent slopes I II I Norfolk loamy sand, 2 to 6 percent slopes I II I Norfolk loamy sand, 2 to 6 percent slopes, eroded II II II Norfolk loamy sand, 6 to 10 percent slopes II II II Norfolk loamy sand, 6 to 10 percent slopes, eroded III II III
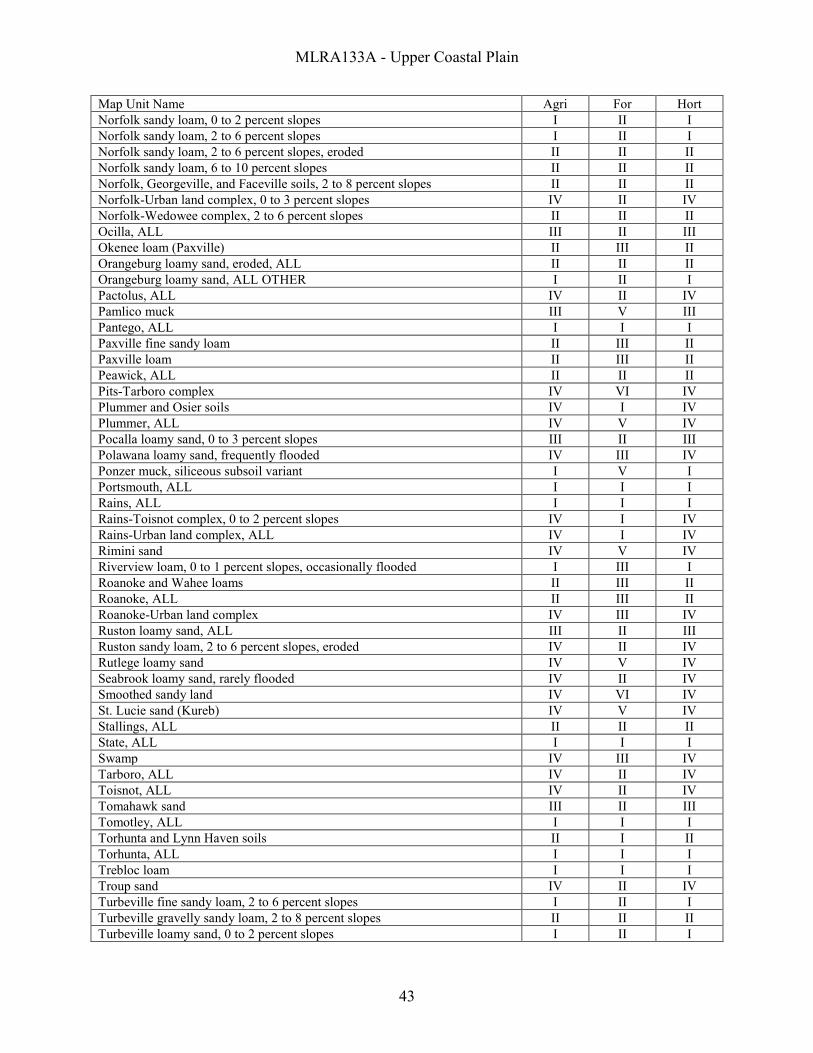
MLRA133A - Upper Coastal Plain
43
Map Unit Name Agri For Hort Norfolk sandy loam, 0 to 2 percent slopes I II I Norfolk sandy loam, 2 to 6 percent slopes I II I Norfolk sandy loam, 2 to 6 percent slopes, eroded II II II Norfolk sandy loam, 6 to 10 percent slopes II II II Norfolk, Georgeville, and Faceville soils, 2 to 8 percent slopes II II II Norfolk-Urban land complex, 0 to 3 percent slopes IV II IV Norfolk-Wedowee complex, 2 to 6 percent slopes II II II Ocilla, ALL III II III Okenee loam (Paxville) II III II Orangeburg loamy sand, eroded, ALL II II II Orangeburg loamy sand, ALL OTHER I II I Pactolus, ALL IV II IV Pamlico muck III V III Pantego, ALL I I I Paxville fine sandy loam II III II Paxville loam II III II Peawick, ALL II II II Pits-Tarboro complex IV VI IV Plummer and Osier soils IV I IV Plummer, ALL IV V IV Pocalla loamy sand, 0 to 3 percent slopes III II III Polawana loamy sand, frequently flooded IV III IV Ponzer muck, siliceous subsoil variant I V I Portsmouth, ALL I I I Rains, ALL I I I Rains-Toisnot complex, 0 to 2 percent slopes IV I IV Rains-Urban land complex, ALL IV I IV Rimini sand IV V IV Riverview loam, 0 to 1 percent slopes, occasionally flooded I III I Roanoke and Wahee loams II III II Roanoke, ALL II III II Roanoke-Urban land complex IV III IV Ruston loamy sand, ALL III II III Ruston sandy loam, 2 to 6 percent slopes, eroded IV II IV Rutlege loamy sand IV V IV Seabrook loamy sand, rarely flooded IV II IV Smoothed sandy land IV VI IV St. Lucie sand (Kureb) IV V IV Stallings, ALL II II II State, ALL I I I Swamp IV III IV Tarboro, ALL IV II IV Toisnot, ALL IV II IV Tomahawk sand III II III Tomotley, ALL I I I Torhunta and Lynn Haven soils II I II Torhunta, ALL I I I Trebloc loam I I I Troup sand IV II IV Turbeville fine sandy loam, 2 to 6 percent slopes I II I Turbeville gravelly sandy loam, 2 to 8 percent slopes II II II Turbeville loamy sand, 0 to 2 percent slopes I II I
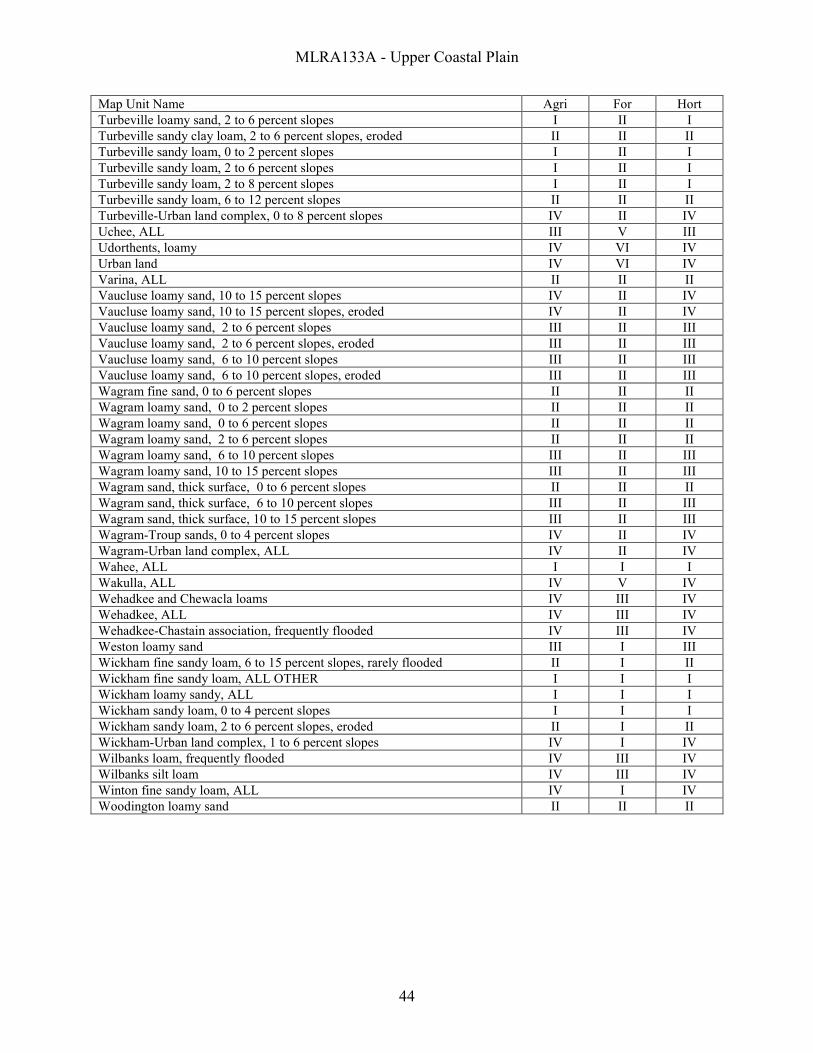
MLRA133A - Upper Coastal Plain
44
Map Unit Name Agri For Hort Turbeville loamy sand, 2 to 6 percent slopes I II I Turbeville sandy clay loam, 2 to 6 percent slopes, eroded II II II Turbeville sandy loam, 0 to 2 percent slopes I II I Turbeville sandy loam, 2 to 6 percent slopes I II I Turbeville sandy loam, 2 to 8 percent slopes I II I Turbeville sandy loam, 6 to 12 percent slopes II II II Turbeville-Urban land complex, 0 to 8 percent slopes IV II IV Uchee, ALL III V III Udorthents, loamy IV VI IV Urban land IV VI IV Varina, ALL II II II Vaucluse loamy sand, 10 to 15 percent slopes IV II IV Vaucluse loamy sand, 10 to 15 percent slopes, eroded IV II IV Vaucluse loamy sand, 2 to 6 percent slopes III II III Vaucluse loamy sand, 2 to 6 percent slopes, eroded III II III Vaucluse loamy sand, 6 to 10 percent slopes III II III Vaucluse loamy sand, 6 to 10 percent slopes, eroded III II III Wagram fine sand, 0 to 6 percent slopes II II II Wagram loamy sand, 0 to 2 percent slopes II II II Wagram loamy sand, 0 to 6 percent slopes II II II Wagram loamy sand, 2 to 6 percent slopes II II II Wagram loamy sand, 6 to 10 percent slopes III II III Wagram loamy sand, 10 to 15 percent slopes III II III Wagram sand, thick surface, 0 to 6 percent slopes II II II Wagram sand, thick surface, 6 to 10 percent slopes III II III Wagram sand, thick surface, 10 to 15 percent slopes III II III Wagram-Troup sands, 0 to 4 percent slopes IV II IV Wagram-Urban land complex, ALL IV II IV Wahee, ALL I I I Wakulla, ALL IV V IV Wehadkee and Chewacla loams IV III IV Wehadkee, ALL IV III IV Wehadkee-Chastain association, frequently flooded IV III IV Weston loamy sand III I III Wickham fine sandy loam, 6 to 15 percent slopes, rarely flooded II I II Wickham fine sandy loam, ALL OTHER I I I Wickham loamy sandy, ALL I I I Wickham sandy loam, 0 to 4 percent slopes I I I Wickham sandy loam, 2 to 6 percent slopes, eroded II I II Wickham-Urban land complex, 1 to 6 percent slopes IV I IV Wilbanks loam, frequently flooded IV III IV Wilbanks silt loam IV III IV Winton fine sandy loam, ALL IV I IV Woodington loamy sand II II II
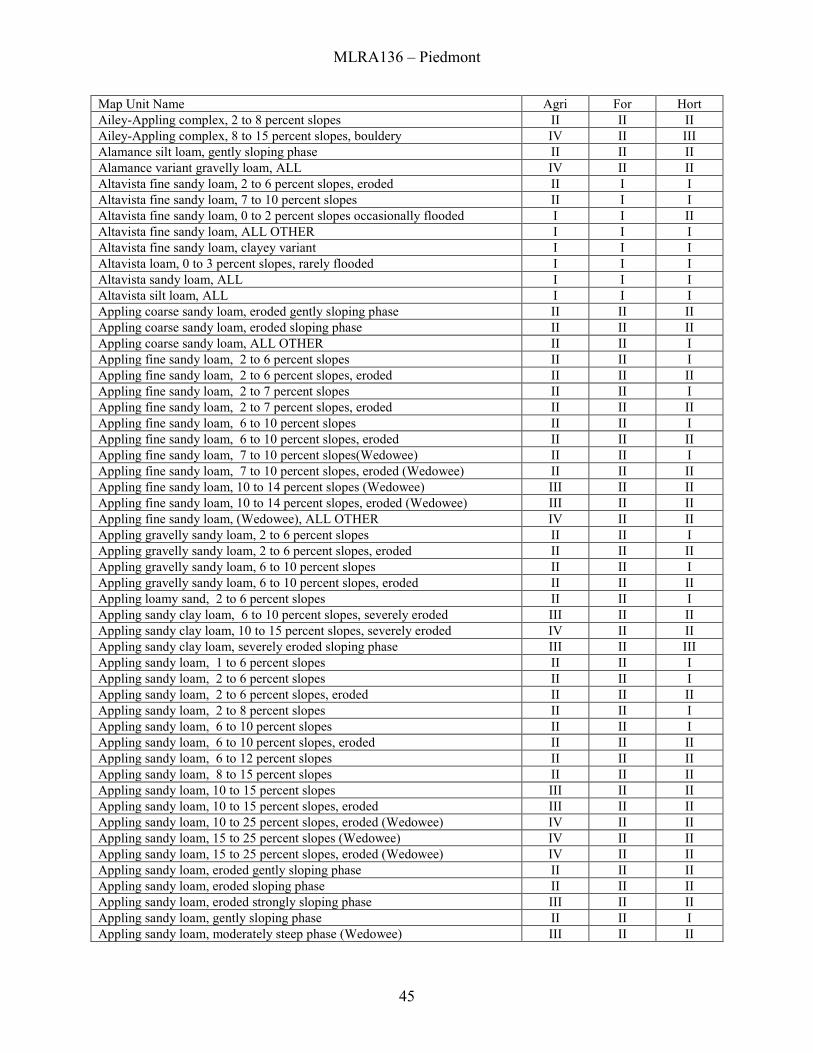
MLRA136 – Piedmont
45
Map Unit Name Agri For Hort Ailey-Appling complex, 2 to 8 percent slopes II II II Ailey-Appling complex, 8 to 15 percent slopes, bouldery IV II III Alamance silt loam, gently sloping phase II II II Alamance variant gravelly loam, ALL IV II II Altavista fine sandy loam, 2 to 6 percent slopes, eroded II I I Altavista fine sandy loam, 7 to 10 percent slopes II I I Altavista fine sandy loam, 0 to 2 percent slopes occasionally flooded I I II Altavista fine sandy loam, ALL OTHER I I I Altavista fine sandy loam, clayey variant I I I Altavista loam, 0 to 3 percent slopes, rarely flooded I I I Altavista sandy loam, ALL I I I Altavista silt loam, ALL I I I Appling coarse sandy loam, eroded gently sloping phase II II II Appling coarse sandy loam, eroded sloping phase II II II Appling coarse sandy loam, ALL OTHER II II I Appling fine sandy loam, 2 to 6 percent slopes II II I Appling fine sandy loam, 2 to 6 percent slopes, eroded II II II Appling fine sandy loam, 2 to 7 percent slopes II II I Appling fine sandy loam, 2 to 7 percent slopes, eroded II II II Appling fine sandy loam, 6 to 10 percent slopes II II I Appling fine sandy loam, 6 to 10 percent slopes, eroded II II II Appling fine sandy loam, 7 to 10 percent slopes(Wedowee) II II I Appling fine sandy loam, 7 to 10 percent slopes, eroded (Wedowee) II II II Appling fine sandy loam, 10 to 14 percent slopes (Wedowee) III II II Appling fine sandy loam, 10 to 14 percent slopes, eroded (Wedowee) III II II Appling fine sandy loam, (Wedowee), ALL OTHER IV II II Appling gravelly sandy loam, 2 to 6 percent slopes II II I Appling gravelly sandy loam, 2 to 6 percent slopes, eroded II II II Appling gravelly sandy loam, 6 to 10 percent slopes II II I Appling gravelly sandy loam, 6 to 10 percent slopes, eroded II II II Appling loamy sand, 2 to 6 percent slopes II II I Appling sandy clay loam, 6 to 10 percent slopes, severely eroded III II II Appling sandy clay loam, 10 to 15 percent slopes, severely eroded IV II II Appling sandy clay loam, severely eroded sloping phase III II III Appling sandy loam, 1 to 6 percent slopes II II I Appling sandy loam, 2 to 6 percent slopes II II I Appling sandy loam, 2 to 6 percent slopes, eroded II II II Appling sandy loam, 2 to 8 percent slopes II II I Appling sandy loam, 6 to 10 percent slopes II II I Appling sandy loam, 6 to 10 percent slopes, eroded II II II Appling sandy loam, 6 to 12 percent slopes II II II Appling sandy loam, 8 to 15 percent slopes II II II Appling sandy loam, 10 to 15 percent slopes III II II Appling sandy loam, 10 to 15 percent slopes, eroded III II II Appling sandy loam, 10 to 25 percent slopes, eroded (Wedowee) IV II II Appling sandy loam, 15 to 25 percent slopes (Wedowee) IV II II Appling sandy loam, 15 to 25 percent slopes, eroded (Wedowee) IV II II Appling sandy loam, eroded gently sloping phase II II II Appling sandy loam, eroded sloping phase II II II Appling sandy loam, eroded strongly sloping phase III II II Appling sandy loam, gently sloping phase II II I Appling sandy loam, moderately steep phase (Wedowee) III II II
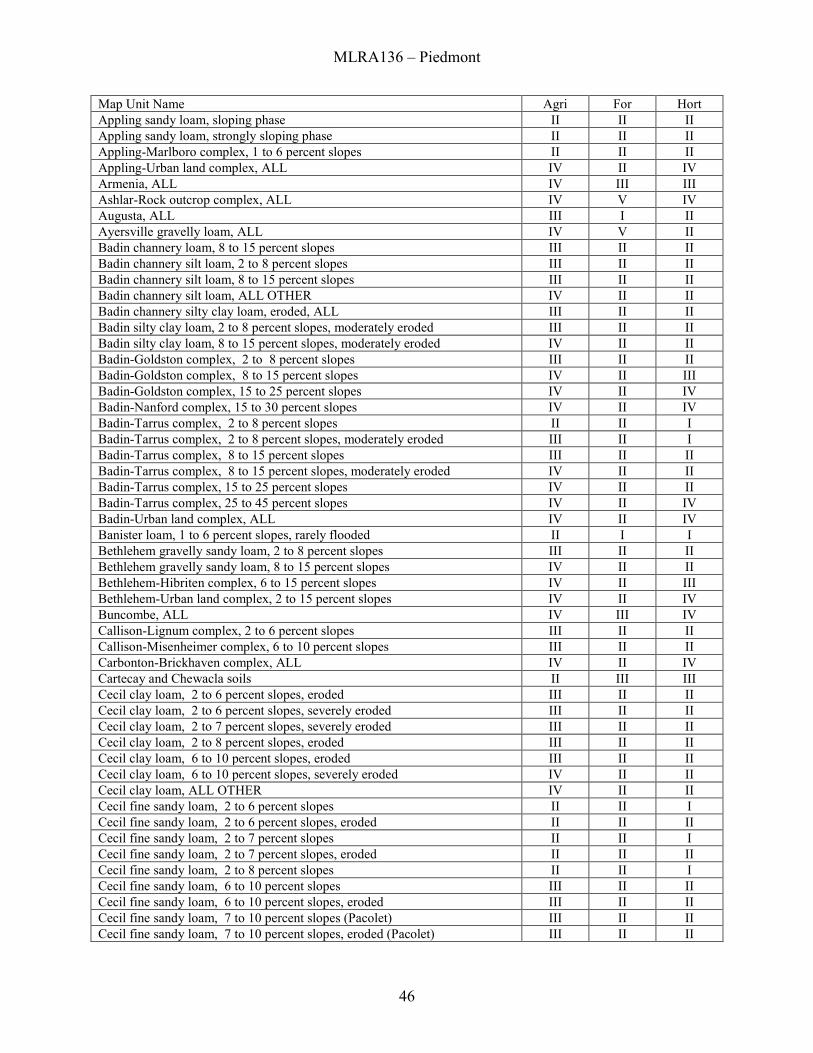
MLRA136 – Piedmont
46
Map Unit Name Agri For Hort Appling sandy loam, sloping phase II II II Appling sandy loam, strongly sloping phase II II II Appling-Marlboro complex, 1 to 6 percent slopes II II II Appling-Urban land complex, ALL IV II IV Armenia, ALL IV III III Ashlar-Rock outcrop complex, ALL IV V IV Augusta, ALL III I II Ayersville gravelly loam, ALL IV V II Badin channery loam, 8 to 15 percent slopes III II II Badin channery silt loam, 2 to 8 percent slopes III II II Badin channery silt loam, 8 to 15 percent slopes III II II Badin channery silt loam, ALL OTHER IV II II Badin channery silty clay loam, eroded, ALL III II II Badin silty clay loam, 2 to 8 percent slopes, moderately eroded III II II Badin silty clay loam, 8 to 15 percent slopes, moderately eroded IV II II Badin-Goldston complex, 2 to 8 percent slopes III II II Badin-Goldston complex, 8 to 15 percent slopes IV II III Badin-Goldston complex, 15 to 25 percent slopes IV II IV Badin-Nanford complex, 15 to 30 percent slopes IV II IV Badin-Tarrus complex, 2 to 8 percent slopes II II I Badin-Tarrus complex, 2 to 8 percent slopes, moderately eroded III II I Badin-Tarrus complex, 8 to 15 percent slopes III II II Badin-Tarrus complex, 8 to 15 percent slopes, moderately eroded IV II II Badin-Tarrus complex, 15 to 25 percent slopes IV II II Badin-Tarrus complex, 25 to 45 percent slopes IV II IV Badin-Urban land complex, ALL IV II IV Banister loam, 1 to 6 percent slopes, rarely flooded II I I Bethlehem gravelly sandy loam, 2 to 8 percent slopes III II II Bethlehem gravelly sandy loam, 8 to 15 percent slopes IV II II Bethlehem-Hibriten complex, 6 to 15 percent slopes IV II III Bethlehem-Urban land complex, 2 to 15 percent slopes IV II IV Buncombe, ALL IV III IV Callison-Lignum complex, 2 to 6 percent slopes III II II Callison-Misenheimer complex, 6 to 10 percent slopes III II II Carbonton-Brickhaven complex, ALL IV II IV Cartecay and Chewacla soils II III III Cecil clay loam, 2 to 6 percent slopes, eroded III II II Cecil clay loam, 2 to 6 percent slopes, severely eroded III II II Cecil clay loam, 2 to 7 percent slopes, severely eroded III II II Cecil clay loam, 2 to 8 percent slopes, eroded III II II Cecil clay loam, 6 to 10 percent slopes, eroded III II II Cecil clay loam, 6 to 10 percent slopes, severely eroded IV II II Cecil clay loam, ALL OTHER IV II II Cecil fine sandy loam, 2 to 6 percent slopes II II I Cecil fine sandy loam, 2 to 6 percent slopes, eroded II II II Cecil fine sandy loam, 2 to 7 percent slopes II II I Cecil fine sandy loam, 2 to 7 percent slopes, eroded II II II Cecil fine sandy loam, 2 to 8 percent slopes II II I Cecil fine sandy loam, 6 to 10 percent slopes III II II Cecil fine sandy loam, 6 to 10 percent slopes, eroded III II II Cecil fine sandy loam, 7 to 10 percent slopes (Pacolet) III II II Cecil fine sandy loam, 7 to 10 percent slopes, eroded (Pacolet) III II II
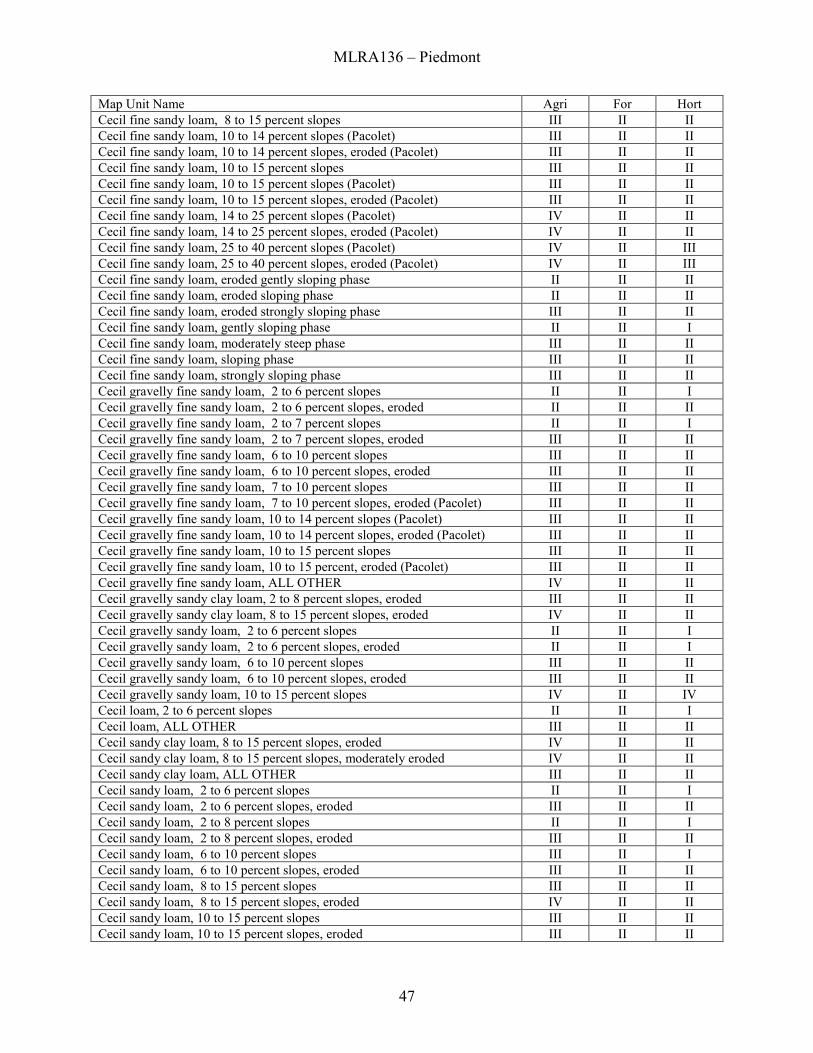
MLRA136 – Piedmont
47
Map Unit Name Agri For Hort Cecil fine sandy loam, 8 to 15 percent slopes III II II Cecil fine sandy loam, 10 to 14 percent slopes (Pacolet) III II II Cecil fine sandy loam, 10 to 14 percent slopes, eroded (Pacolet) III II II Cecil fine sandy loam, 10 to 15 percent slopes III II II Cecil fine sandy loam, 10 to 15 percent slopes (Pacolet) III II II Cecil fine sandy loam, 10 to 15 percent slopes, eroded (Pacolet) III II II Cecil fine sandy loam, 14 to 25 percent slopes (Pacolet) IV II II Cecil fine sandy loam, 14 to 25 percent slopes, eroded (Pacolet) IV II II Cecil fine sandy loam, 25 to 40 percent slopes (Pacolet) IV II III Cecil fine sandy loam, 25 to 40 percent slopes, eroded (Pacolet) IV II III Cecil fine sandy loam, eroded gently sloping phase II II II Cecil fine sandy loam, eroded sloping phase II II II Cecil fine sandy loam, eroded strongly sloping phase III II II Cecil fine sandy loam, gently sloping phase II II I Cecil fine sandy loam, moderately steep phase III II II Cecil fine sandy loam, sloping phase III II II Cecil fine sandy loam, strongly sloping phase III II II Cecil gravelly fine sandy loam, 2 to 6 percent slopes II II I Cecil gravelly fine sandy loam, 2 to 6 percent slopes, eroded II II II Cecil gravelly fine sandy loam, 2 to 7 percent slopes II II I Cecil gravelly fine sandy loam, 2 to 7 percent slopes, eroded III II II Cecil gravelly fine sandy loam, 6 to 10 percent slopes III II II Cecil gravelly fine sandy loam, 6 to 10 percent slopes, eroded III II II Cecil gravelly fine sandy loam, 7 to 10 percent slopes III II II Cecil gravelly fine sandy loam, 7 to 10 percent slopes, eroded (Pacolet) III II II Cecil gravelly fine sandy loam, 10 to 14 percent slopes (Pacolet) III II II Cecil gravelly fine sandy loam, 10 to 14 percent slopes, eroded (Pacolet) III II II Cecil gravelly fine sandy loam, 10 to 15 percent slopes III II II Cecil gravelly fine sandy loam, 10 to 15 percent, eroded (Pacolet) III II II Cecil gravelly fine sandy loam, ALL OTHER IV II II Cecil gravelly sandy clay loam, 2 to 8 percent slopes, eroded III II II Cecil gravelly sandy clay loam, 8 to 15 percent slopes, eroded IV II II Cecil gravelly sandy loam, 2 to 6 percent slopes II II I Cecil gravelly sandy loam, 2 to 6 percent slopes, eroded II II I Cecil gravelly sandy loam, 6 to 10 percent slopes III II II Cecil gravelly sandy loam, 6 to 10 percent slopes, eroded III II II Cecil gravelly sandy loam, 10 to 15 percent slopes IV II IV Cecil loam, 2 to 6 percent slopes II II I Cecil loam, ALL OTHER III II II Cecil sandy clay loam, 8 to 15 percent slopes, eroded IV II II Cecil sandy clay loam, 8 to 15 percent slopes, moderately eroded IV II II Cecil sandy clay loam, ALL OTHER III II II Cecil sandy loam, 2 to 6 percent slopes II II I Cecil sandy loam, 2 to 6 percent slopes, eroded III II II Cecil sandy loam, 2 to 8 percent slopes II II I Cecil sandy loam, 2 to 8 percent slopes, eroded III II II Cecil sandy loam, 6 to 10 percent slopes III II I Cecil sandy loam, 6 to 10 percent slopes, eroded III II II Cecil sandy loam, 8 to 15 percent slopes III II II Cecil sandy loam, 8 to 15 percent slopes, eroded IV II II Cecil sandy loam, 10 to 15 percent slopes III II II Cecil sandy loam, 10 to 15 percent slopes, eroded III II II
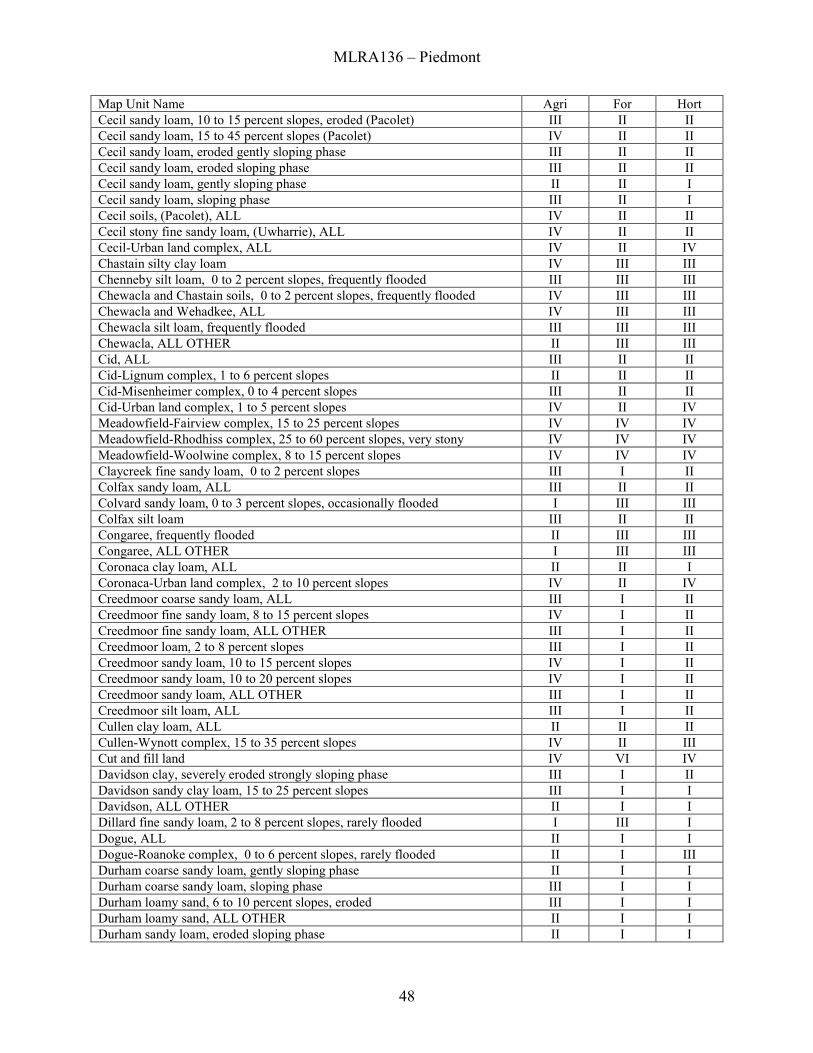
MLRA136 – Piedmont
48
Map Unit Name Agri For Hort Cecil sandy loam, 10 to 15 percent slopes, eroded (Pacolet) III II II Cecil sandy loam, 15 to 45 percent slopes (Pacolet) IV II II Cecil sandy loam, eroded gently sloping phase III II II Cecil sandy loam, eroded sloping phase III II II Cecil sandy loam, gently sloping phase II II I Cecil sandy loam, sloping phase III II I Cecil soils, (Pacolet), ALL IV II II Cecil stony fine sandy loam, (Uwharrie), ALL IV II II Cecil-Urban land complex, ALL IV II IV Chastain silty clay loam IV III III Chenneby silt loam, 0 to 2 percent slopes, frequently flooded III III III Chewacla and Chastain soils, 0 to 2 percent slopes, frequently flooded IV III III Chewacla and Wehadkee, ALL IV III III Chewacla silt loam, frequently flooded III III III Chewacla, ALL OTHER II III III Cid, ALL III II II Cid-Lignum complex, 1 to 6 percent slopes II II II Cid-Misenheimer complex, 0 to 4 percent slopes III II II Cid-Urban land complex, 1 to 5 percent slopes IV II IV Meadowfield-Fairview complex, 15 to 25 percent slopes IV IV IV Meadowfield-Rhodhiss complex, 25 to 60 percent slopes, very stony IV IV IV Meadowfield-Woolwine complex, 8 to 15 percent slopes IV IV IV Claycreek fine sandy loam, 0 to 2 percent slopes III I II Colfax sandy loam, ALL III II II Colvard sandy loam, 0 to 3 percent slopes, occasionally flooded I III III Colfax silt loam III II II Congaree, frequently flooded II III III Congaree, ALL OTHER I III III Coronaca clay loam, ALL II II I Coronaca-Urban land complex, 2 to 10 percent slopes IV II IV Creedmoor coarse sandy loam, ALL III I II Creedmoor fine sandy loam, 8 to 15 percent slopes IV I II Creedmoor fine sandy loam, ALL OTHER III I II Creedmoor loam, 2 to 8 percent slopes III I II Creedmoor sandy loam, 10 to 15 percent slopes IV I II Creedmoor sandy loam, 10 to 20 percent slopes IV I II Creedmoor sandy loam, ALL OTHER III I II Creedmoor silt loam, ALL III I II Cullen clay loam, ALL II II II Cullen-Wynott complex, 15 to 35 percent slopes IV II III Cut and fill land IV VI IV Davidson clay, severely eroded strongly sloping phase III I II Davidson sandy clay loam, 15 to 25 percent slopes III I I Davidson, ALL OTHER II I I Dillard fine sandy loam, 2 to 8 percent slopes, rarely flooded I III I Dogue, ALL II I I Dogue-Roanoke complex, 0 to 6 percent slopes, rarely flooded II I III Durham coarse sandy loam, gently sloping phase II I I Durham coarse sandy loam, sloping phase III I I Durham loamy sand, 6 to 10 percent slopes, eroded III I I Durham loamy sand, ALL OTHER II I I Durham sandy loam, eroded sloping phase II I I
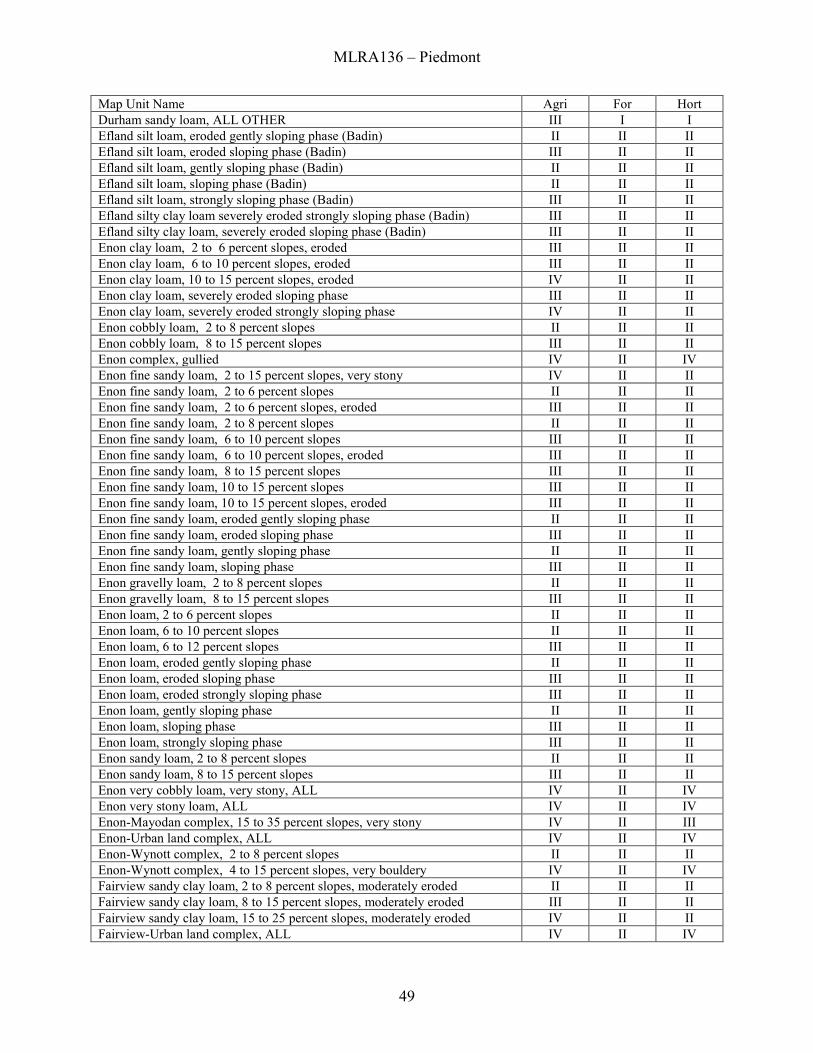
MLRA136 – Piedmont
49
Map Unit Name Agri For Hort Durham sandy loam, ALL OTHER III I I Efland silt loam, eroded gently sloping phase (Badin) II II II Efland silt loam, eroded sloping phase (Badin) III II II Efland silt loam, gently sloping phase (Badin) II II II Efland silt loam, sloping phase (Badin) II II II Efland silt loam, strongly sloping phase (Badin) III II II Efland silty clay loam severely eroded strongly sloping phase (Badin) III II II Efland silty clay loam, severely eroded sloping phase (Badin) III II II Enon clay loam, 2 to 6 percent slopes, eroded III II II Enon clay loam, 6 to 10 percent slopes, eroded III II II Enon clay loam, 10 to 15 percent slopes, eroded IV II II Enon clay loam, severely eroded sloping phase III II II Enon clay loam, severely eroded strongly sloping phase IV II II Enon cobbly loam, 2 to 8 percent slopes II II II Enon cobbly loam, 8 to 15 percent slopes III II II Enon complex, gullied IV II IV Enon fine sandy loam, 2 to 15 percent slopes, very stony IV II II Enon fine sandy loam, 2 to 6 percent slopes II II II Enon fine sandy loam, 2 to 6 percent slopes, eroded III II II Enon fine sandy loam, 2 to 8 percent slopes II II II Enon fine sandy loam, 6 to 10 percent slopes III II II Enon fine sandy loam, 6 to 10 percent slopes, eroded III II II Enon fine sandy loam, 8 to 15 percent slopes III II II Enon fine sandy loam, 10 to 15 percent slopes III II II Enon fine sandy loam, 10 to 15 percent slopes, eroded III II II Enon fine sandy loam, eroded gently sloping phase II II II Enon fine sandy loam, eroded sloping phase III II II Enon fine sandy loam, gently sloping phase II II II Enon fine sandy loam, sloping phase III II II Enon gravelly loam, 2 to 8 percent slopes II II II Enon gravelly loam, 8 to 15 percent slopes III II II Enon loam, 2 to 6 percent slopes II II II Enon loam, 6 to 10 percent slopes II II II Enon loam, 6 to 12 percent slopes III II II Enon loam, eroded gently sloping phase II II II Enon loam, eroded sloping phase III II II Enon loam, eroded strongly sloping phase III II II Enon loam, gently sloping phase II II II Enon loam, sloping phase III II II Enon loam, strongly sloping phase III II II Enon sandy loam, 2 to 8 percent slopes II II II Enon sandy loam, 8 to 15 percent slopes III II II Enon very cobbly loam, very stony, ALL IV II IV Enon very stony loam, ALL IV II IV Enon-Mayodan complex, 15 to 35 percent slopes, very stony IV II III Enon-Urban land complex, ALL IV II IV Enon-Wynott complex, 2 to 8 percent slopes II II II Enon-Wynott complex, 4 to 15 percent slopes, very bouldery IV II IV Fairview sandy clay loam, 2 to 8 percent slopes, moderately eroded II II II Fairview sandy clay loam, 8 to 15 percent slopes, moderately eroded III II II Fairview sandy clay loam, 15 to 25 percent slopes, moderately eroded IV II II Fairview-Urban land complex, ALL IV II IV
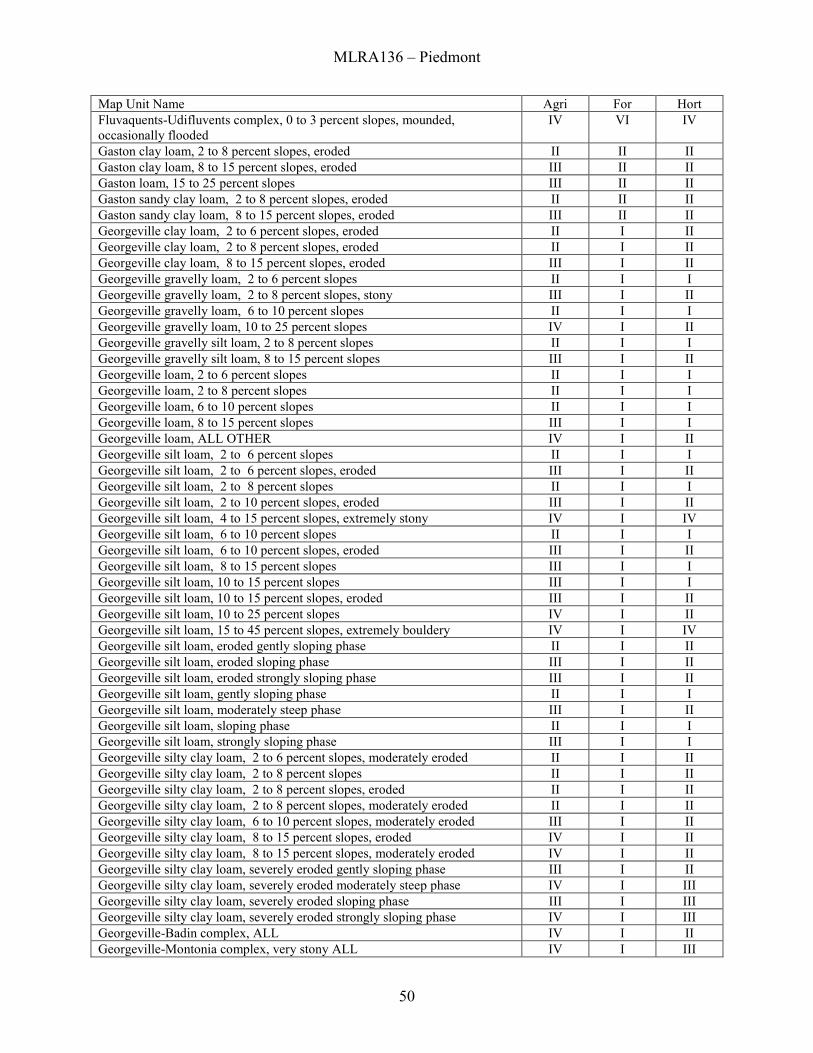
MLRA136 – Piedmont
50
Map Unit Name Agri For Hort Fluvaquents-Udifluvents complex, 0 to 3 percent slopes, mounded, occasionally flooded
IV VI IV
Gaston clay loam, 2 to 8 percent slopes, eroded II II II Gaston clay loam, 8 to 15 percent slopes, eroded III II II Gaston loam, 15 to 25 percent slopes III II II Gaston sandy clay loam, 2 to 8 percent slopes, eroded II II II Gaston sandy clay loam, 8 to 15 percent slopes, eroded III II II Georgeville clay loam, 2 to 6 percent slopes, eroded II I II Georgeville clay loam, 2 to 8 percent slopes, eroded II I II Georgeville clay loam, 8 to 15 percent slopes, eroded III I II Georgeville gravelly loam, 2 to 6 percent slopes II I I Georgeville gravelly loam, 2 to 8 percent slopes, stony III I II Georgeville gravelly loam, 6 to 10 percent slopes II I I Georgeville gravelly loam, 10 to 25 percent slopes IV I II Georgeville gravelly silt loam, 2 to 8 percent slopes II I I Georgeville gravelly silt loam, 8 to 15 percent slopes III I II Georgeville loam, 2 to 6 percent slopes II I I Georgeville loam, 2 to 8 percent slopes II I I Georgeville loam, 6 to 10 percent slopes II I I Georgeville loam, 8 to 15 percent slopes III I I Georgeville loam, ALL OTHER IV I II Georgeville silt loam, 2 to 6 percent slopes II I I Georgeville silt loam, 2 to 6 percent slopes, eroded III I II Georgeville silt loam, 2 to 8 percent slopes II I I Georgeville silt loam, 2 to 10 percent slopes, eroded III I II Georgeville silt loam, 4 to 15 percent slopes, extremely stony IV I IV Georgeville silt loam, 6 to 10 percent slopes II I I Georgeville silt loam, 6 to 10 percent slopes, eroded III I II Georgeville silt loam, 8 to 15 percent slopes III I I Georgeville silt loam, 10 to 15 percent slopes III I I Georgeville silt loam, 10 to 15 percent slopes, eroded III I II Georgeville silt loam, 10 to 25 percent slopes IV I II Georgeville silt loam, 15 to 45 percent slopes, extremely bouldery IV I IV Georgeville silt loam, eroded gently sloping phase II I II Georgeville silt loam, eroded sloping phase III I II Georgeville silt loam, eroded strongly sloping phase III I II Georgeville silt loam, gently sloping phase II I I Georgeville silt loam, moderately steep phase III I II Georgeville silt loam, sloping phase II I I Georgeville silt loam, strongly sloping phase III I I Georgeville silty clay loam, 2 to 6 percent slopes, moderately eroded II I II Georgeville silty clay loam, 2 to 8 percent slopes II I II Georgeville silty clay loam, 2 to 8 percent slopes, eroded II I II Georgeville silty clay loam, 2 to 8 percent slopes, moderately eroded II I II Georgeville silty clay loam, 6 to 10 percent slopes, moderately eroded III I II Georgeville silty clay loam, 8 to 15 percent slopes, eroded IV I II Georgeville silty clay loam, 8 to 15 percent slopes, moderately eroded IV I II Georgeville silty clay loam, severely eroded gently sloping phase III I II Georgeville silty clay loam, severely eroded moderately steep phase IV I III Georgeville silty clay loam, severely eroded sloping phase III I III Georgeville silty clay loam, severely eroded strongly sloping phase IV I III Georgeville-Badin complex, ALL IV I II Georgeville-Montonia complex, very stony ALL IV I III
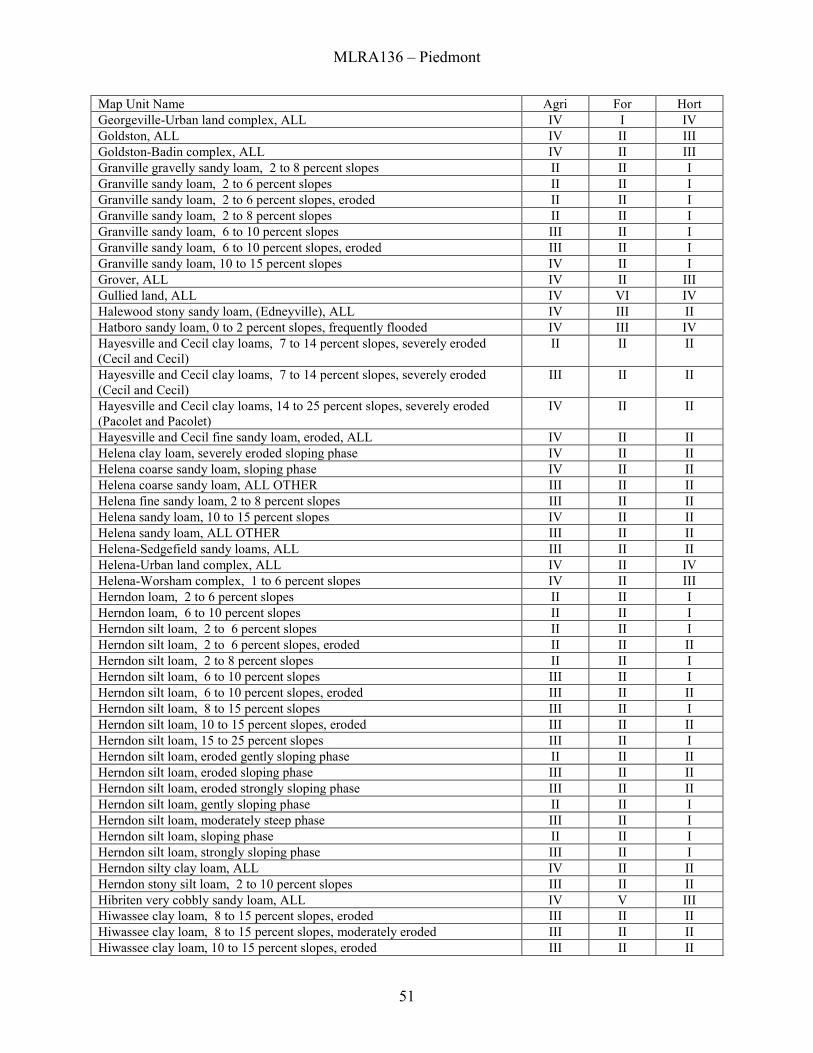
MLRA136 – Piedmont
51
Map Unit Name Agri For Hort Georgeville-Urban land complex, ALL IV I IV Goldston, ALL IV II III Goldston-Badin complex, ALL IV II III Granville gravelly sandy loam, 2 to 8 percent slopes II II I Granville sandy loam, 2 to 6 percent slopes II II I Granville sandy loam, 2 to 6 percent slopes, eroded II II I Granville sandy loam, 2 to 8 percent slopes II II I Granville sandy loam, 6 to 10 percent slopes III II I Granville sandy loam, 6 to 10 percent slopes, eroded III II I Granville sandy loam, 10 to 15 percent slopes IV II I Grover, ALL IV II III Gullied land, ALL IV VI IV Halewood stony sandy loam, (Edneyville), ALL IV III II Hatboro sandy loam, 0 to 2 percent slopes, frequently flooded IV III IV Hayesville and Cecil clay loams, 7 to 14 percent slopes, severely eroded (Cecil and Cecil)
II II II
Hayesville and Cecil clay loams, 7 to 14 percent slopes, severely eroded (Cecil and Cecil)
III II II
Hayesville and Cecil clay loams, 14 to 25 percent slopes, severely eroded (Pacolet and Pacolet)
IV II II
Hayesville and Cecil fine sandy loam, eroded, ALL IV II II Helena clay loam, severely eroded sloping phase IV II II Helena coarse sandy loam, sloping phase IV II II Helena coarse sandy loam, ALL OTHER III II II Helena fine sandy loam, 2 to 8 percent slopes III II II Helena sandy loam, 10 to 15 percent slopes IV II II Helena sandy loam, ALL OTHER III II II Helena-Sedgefield sandy loams, ALL III II II Helena-Urban land complex, ALL IV II IV Helena-Worsham complex, 1 to 6 percent slopes IV II III Herndon loam, 2 to 6 percent slopes II II I Herndon loam, 6 to 10 percent slopes II II I Herndon silt loam, 2 to 6 percent slopes II II I Herndon silt loam, 2 to 6 percent slopes, eroded II II II Herndon silt loam, 2 to 8 percent slopes II II I Herndon silt loam, 6 to 10 percent slopes III II I Herndon silt loam, 6 to 10 percent slopes, eroded III II II Herndon silt loam, 8 to 15 percent slopes III II I Herndon silt loam, 10 to 15 percent slopes, eroded III II II Herndon silt loam, 15 to 25 percent slopes III II I Herndon silt loam, eroded gently sloping phase II II II Herndon silt loam, eroded sloping phase III II II Herndon silt loam, eroded strongly sloping phase III II II Herndon silt loam, gently sloping phase II II I Herndon silt loam, moderately steep phase III II I Herndon silt loam, sloping phase II II I Herndon silt loam, strongly sloping phase III II I Herndon silty clay loam, ALL IV II II Herndon stony silt loam, 2 to 10 percent slopes III II II Hibriten very cobbly sandy loam, ALL IV V III Hiwassee clay loam, 8 to 15 percent slopes, eroded III II II Hiwassee clay loam, 8 to 15 percent slopes, moderately eroded III II II Hiwassee clay loam, 10 to 15 percent slopes, eroded III II II
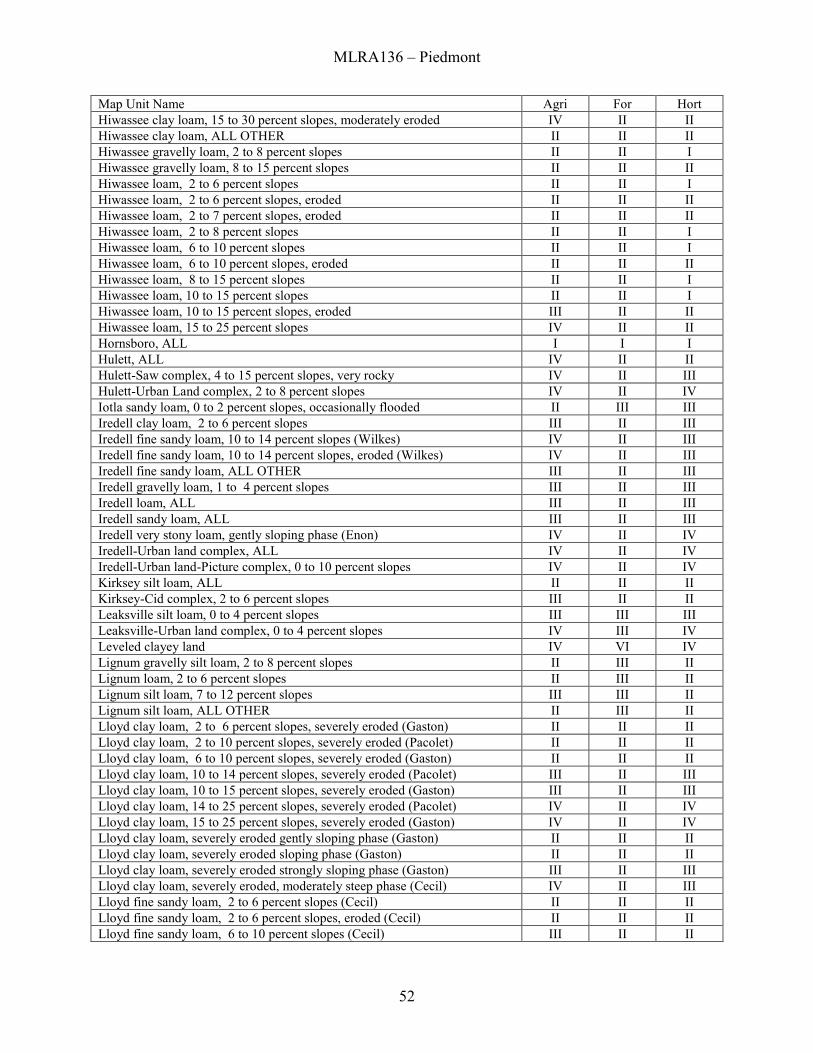
MLRA136 – Piedmont
52
Map Unit Name Agri For Hort Hiwassee clay loam, 15 to 30 percent slopes, moderately eroded IV II II Hiwassee clay loam, ALL OTHER II II II Hiwassee gravelly loam, 2 to 8 percent slopes II II I Hiwassee gravelly loam, 8 to 15 percent slopes II II II Hiwassee loam, 2 to 6 percent slopes II II I Hiwassee loam, 2 to 6 percent slopes, eroded II II II Hiwassee loam, 2 to 7 percent slopes, eroded II II II Hiwassee loam, 2 to 8 percent slopes II II I Hiwassee loam, 6 to 10 percent slopes II II I Hiwassee loam, 6 to 10 percent slopes, eroded II II II Hiwassee loam, 8 to 15 percent slopes II II I Hiwassee loam, 10 to 15 percent slopes II II I Hiwassee loam, 10 to 15 percent slopes, eroded III II II Hiwassee loam, 15 to 25 percent slopes IV II II Hornsboro, ALL I I I Hulett, ALL IV II II Hulett-Saw complex, 4 to 15 percent slopes, very rocky IV II III Hulett-Urban Land complex, 2 to 8 percent slopes IV II IV Iotla sandy loam, 0 to 2 percent slopes, occasionally flooded II III III Iredell clay loam, 2 to 6 percent slopes III II III Iredell fine sandy loam, 10 to 14 percent slopes (Wilkes) IV II III Iredell fine sandy loam, 10 to 14 percent slopes, eroded (Wilkes) IV II III Iredell fine sandy loam, ALL OTHER III II III Iredell gravelly loam, 1 to 4 percent slopes III II III Iredell loam, ALL III II III Iredell sandy loam, ALL III II III Iredell very stony loam, gently sloping phase (Enon) IV II IV Iredell-Urban land complex, ALL IV II IV Iredell-Urban land-Picture complex, 0 to 10 percent slopes IV II IV Kirksey silt loam, ALL II II II Kirksey-Cid complex, 2 to 6 percent slopes III II II Leaksville silt loam, 0 to 4 percent slopes III III III Leaksville-Urban land complex, 0 to 4 percent slopes IV III IV Leveled clayey land IV VI IV Lignum gravelly silt loam, 2 to 8 percent slopes II III II Lignum loam, 2 to 6 percent slopes II III II Lignum silt loam, 7 to 12 percent slopes III III II Lignum silt loam, ALL OTHER II III II Lloyd clay loam, 2 to 6 percent slopes, severely eroded (Gaston) II II II Lloyd clay loam, 2 to 10 percent slopes, severely eroded (Pacolet) II II II Lloyd clay loam, 6 to 10 percent slopes, severely eroded (Gaston) II II II Lloyd clay loam, 10 to 14 percent slopes, severely eroded (Pacolet) III II III Lloyd clay loam, 10 to 15 percent slopes, severely eroded (Gaston) III II III Lloyd clay loam, 14 to 25 percent slopes, severely eroded (Pacolet) IV II IV Lloyd clay loam, 15 to 25 percent slopes, severely eroded (Gaston) IV II IV Lloyd clay loam, severely eroded gently sloping phase (Gaston) II II II Lloyd clay loam, severely eroded sloping phase (Gaston) II II II Lloyd clay loam, severely eroded strongly sloping phase (Gaston) III II III Lloyd clay loam, severely eroded, moderately steep phase (Cecil) IV II III Lloyd fine sandy loam, 2 to 6 percent slopes (Cecil) II II II Lloyd fine sandy loam, 2 to 6 percent slopes, eroded (Cecil) II II II Lloyd fine sandy loam, 6 to 10 percent slopes (Cecil) III II II
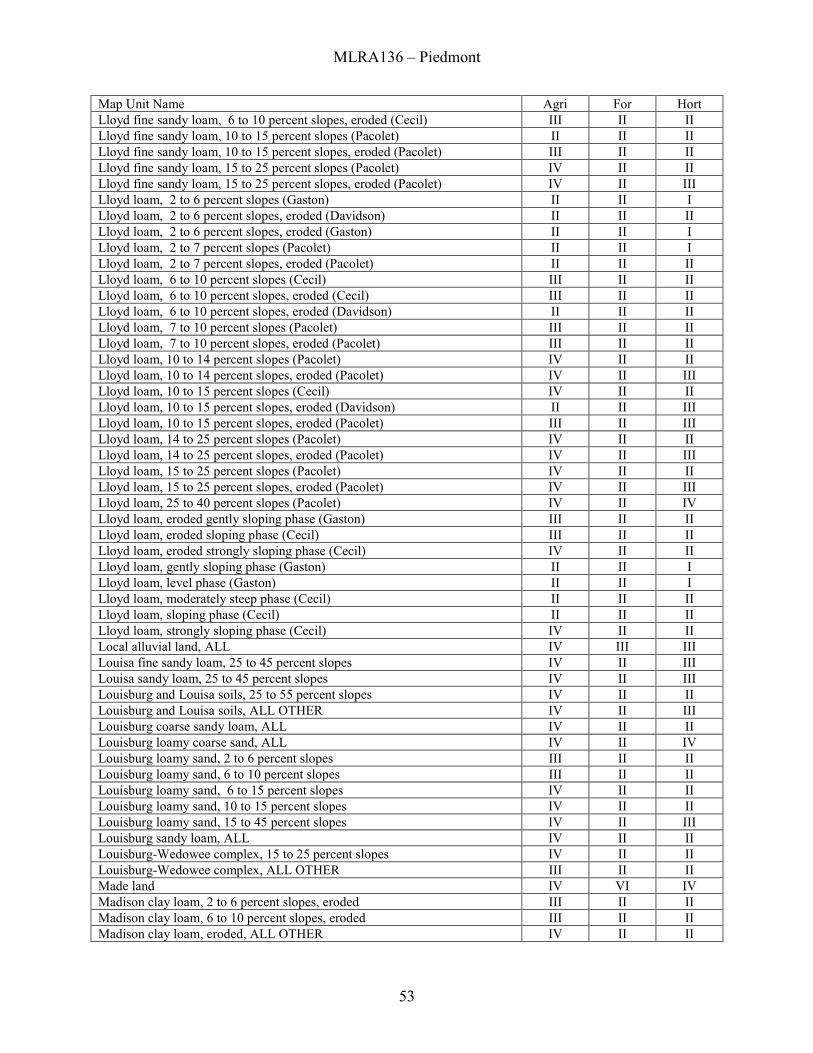
MLRA136 – Piedmont
53
Map Unit Name Agri For Hort Lloyd fine sandy loam, 6 to 10 percent slopes, eroded (Cecil) III II II Lloyd fine sandy loam, 10 to 15 percent slopes (Pacolet) II II II Lloyd fine sandy loam, 10 to 15 percent slopes, eroded (Pacolet) III II II Lloyd fine sandy loam, 15 to 25 percent slopes (Pacolet) IV II II Lloyd fine sandy loam, 15 to 25 percent slopes, eroded (Pacolet) IV II III Lloyd loam, 2 to 6 percent slopes (Gaston) II II I Lloyd loam, 2 to 6 percent slopes, eroded (Davidson) II II II Lloyd loam, 2 to 6 percent slopes, eroded (Gaston) II II I Lloyd loam, 2 to 7 percent slopes (Pacolet) II II I Lloyd loam, 2 to 7 percent slopes, eroded (Pacolet) II II II Lloyd loam, 6 to 10 percent slopes (Cecil) III II II Lloyd loam, 6 to 10 percent slopes, eroded (Cecil) III II II Lloyd loam, 6 to 10 percent slopes, eroded (Davidson) II II II Lloyd loam, 7 to 10 percent slopes (Pacolet) III II II Lloyd loam, 7 to 10 percent slopes, eroded (Pacolet) III II II Lloyd loam, 10 to 14 percent slopes (Pacolet) IV II II Lloyd loam, 10 to 14 percent slopes, eroded (Pacolet) IV II III Lloyd loam, 10 to 15 percent slopes (Cecil) IV II II Lloyd loam, 10 to 15 percent slopes, eroded (Davidson) II II III Lloyd loam, 10 to 15 percent slopes, eroded (Pacolet) III II III Lloyd loam, 14 to 25 percent slopes (Pacolet) IV II II Lloyd loam, 14 to 25 percent slopes, eroded (Pacolet) IV II III Lloyd loam, 15 to 25 percent slopes (Pacolet) IV II II Lloyd loam, 15 to 25 percent slopes, eroded (Pacolet) IV II III Lloyd loam, 25 to 40 percent slopes (Pacolet) IV II IV Lloyd loam, eroded gently sloping phase (Gaston) III II II Lloyd loam, eroded sloping phase (Cecil) III II II Lloyd loam, eroded strongly sloping phase (Cecil) IV II II Lloyd loam, gently sloping phase (Gaston) II II I Lloyd loam, level phase (Gaston) II II I Lloyd loam, moderately steep phase (Cecil) II II II Lloyd loam, sloping phase (Cecil) II II II Lloyd loam, strongly sloping phase (Cecil) IV II II Local alluvial land, ALL IV III III Louisa fine sandy loam, 25 to 45 percent slopes IV II III Louisa sandy loam, 25 to 45 percent slopes IV II III Louisburg and Louisa soils, 25 to 55 percent slopes IV II II Louisburg and Louisa soils, ALL OTHER IV II III Louisburg coarse sandy loam, ALL IV II II Louisburg loamy coarse sand, ALL IV II IV Louisburg loamy sand, 2 to 6 percent slopes III II II Louisburg loamy sand, 6 to 10 percent slopes III II II Louisburg loamy sand, 6 to 15 percent slopes IV II II Louisburg loamy sand, 10 to 15 percent slopes IV II II Louisburg loamy sand, 15 to 45 percent slopes IV II III Louisburg sandy loam, ALL IV II II Louisburg-Wedowee complex, 15 to 25 percent slopes IV II II Louisburg-Wedowee complex, ALL OTHER III II II Made land IV VI IV Madison clay loam, 2 to 6 percent slopes, eroded III II II Madison clay loam, 6 to 10 percent slopes, eroded III II II Madison clay loam, eroded, ALL OTHER IV II II
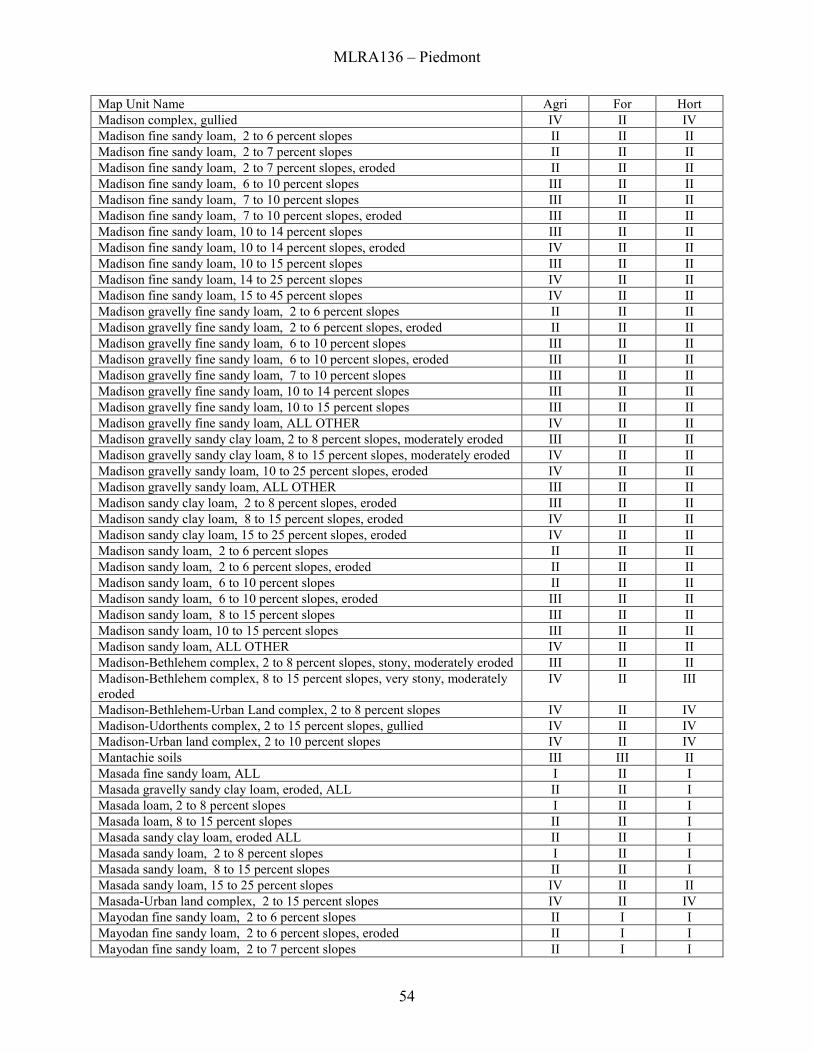
MLRA136 – Piedmont
54
Map Unit Name Agri For Hort Madison complex, gullied IV II IV Madison fine sandy loam, 2 to 6 percent slopes II II II Madison fine sandy loam, 2 to 7 percent slopes II II II Madison fine sandy loam, 2 to 7 percent slopes, eroded II II II Madison fine sandy loam, 6 to 10 percent slopes III II II Madison fine sandy loam, 7 to 10 percent slopes III II II Madison fine sandy loam, 7 to 10 percent slopes, eroded III II II Madison fine sandy loam, 10 to 14 percent slopes III II II Madison fine sandy loam, 10 to 14 percent slopes, eroded IV II II Madison fine sandy loam, 10 to 15 percent slopes III II II Madison fine sandy loam, 14 to 25 percent slopes IV II II Madison fine sandy loam, 15 to 45 percent slopes IV II II Madison gravelly fine sandy loam, 2 to 6 percent slopes II II II Madison gravelly fine sandy loam, 2 to 6 percent slopes, eroded II II II Madison gravelly fine sandy loam, 6 to 10 percent slopes III II II Madison gravelly fine sandy loam, 6 to 10 percent slopes, eroded III II II Madison gravelly fine sandy loam, 7 to 10 percent slopes III II II Madison gravelly fine sandy loam, 10 to 14 percent slopes III II II Madison gravelly fine sandy loam, 10 to 15 percent slopes III II II Madison gravelly fine sandy loam, ALL OTHER IV II II Madison gravelly sandy clay loam, 2 to 8 percent slopes, moderately eroded III II II Madison gravelly sandy clay loam, 8 to 15 percent slopes, moderately eroded IV II II Madison gravelly sandy loam, 10 to 25 percent slopes, eroded IV II II Madison gravelly sandy loam, ALL OTHER III II II Madison sandy clay loam, 2 to 8 percent slopes, eroded III II II Madison sandy clay loam, 8 to 15 percent slopes, eroded IV II II Madison sandy clay loam, 15 to 25 percent slopes, eroded IV II II Madison sandy loam, 2 to 6 percent slopes II II II Madison sandy loam, 2 to 6 percent slopes, eroded II II II Madison sandy loam, 6 to 10 percent slopes II II II Madison sandy loam, 6 to 10 percent slopes, eroded III II II Madison sandy loam, 8 to 15 percent slopes III II II Madison sandy loam, 10 to 15 percent slopes III II II Madison sandy loam, ALL OTHER IV II II Madison-Bethlehem complex, 2 to 8 percent slopes, stony, moderately eroded III II II Madison-Bethlehem complex, 8 to 15 percent slopes, very stony, moderately eroded
IV II III
Madison-Bethlehem-Urban Land complex, 2 to 8 percent slopes IV II IV Madison-Udorthents complex, 2 to 15 percent slopes, gullied IV II IV Madison-Urban land complex, 2 to 10 percent slopes IV II IV Mantachie soils III III II Masada fine sandy loam, ALL I II I Masada gravelly sandy clay loam, eroded, ALL II II I Masada loam, 2 to 8 percent slopes I II I Masada loam, 8 to 15 percent slopes II II I Masada sandy clay loam, eroded ALL II II I Masada sandy loam, 2 to 8 percent slopes I II I Masada sandy loam, 8 to 15 percent slopes II II I Masada sandy loam, 15 to 25 percent slopes IV II II Masada-Urban land complex, 2 to 15 percent slopes IV II IV Mayodan fine sandy loam, 2 to 6 percent slopes II I I Mayodan fine sandy loam, 2 to 6 percent slopes, eroded II I I Mayodan fine sandy loam, 2 to 7 percent slopes II I I
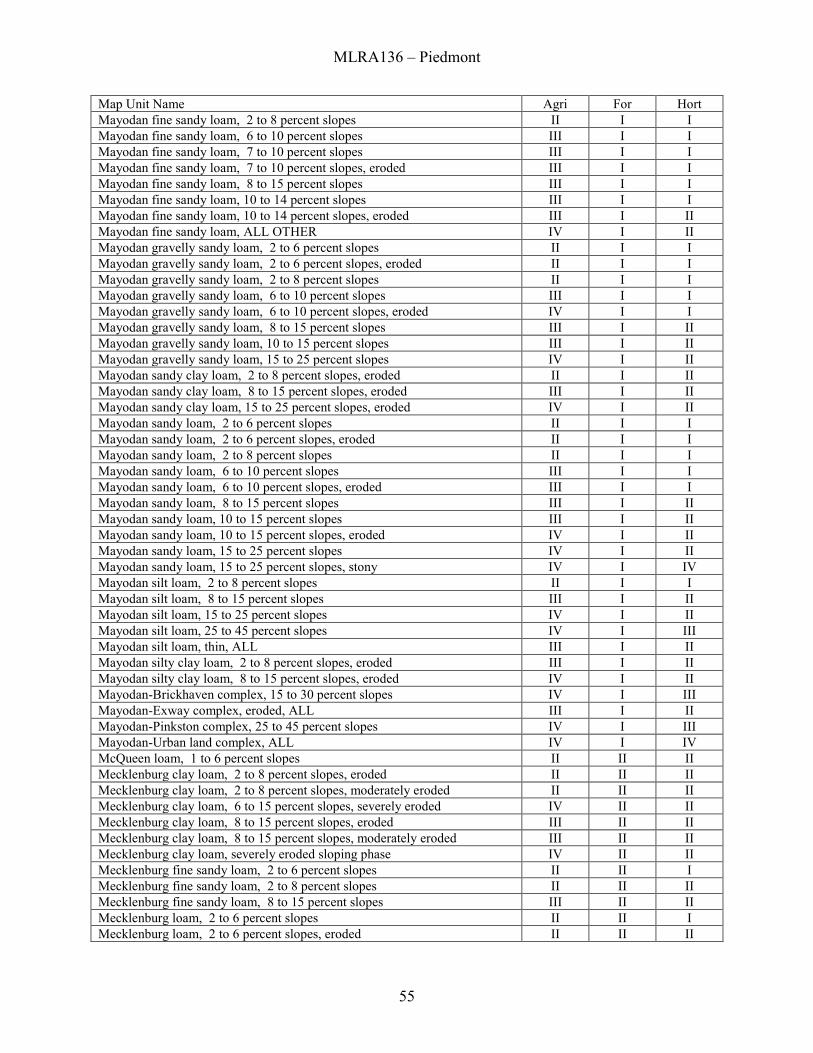
MLRA136 – Piedmont
55
Map Unit Name Agri For Hort Mayodan fine sandy loam, 2 to 8 percent slopes II I I Mayodan fine sandy loam, 6 to 10 percent slopes III I I Mayodan fine sandy loam, 7 to 10 percent slopes III I I Mayodan fine sandy loam, 7 to 10 percent slopes, eroded III I I Mayodan fine sandy loam, 8 to 15 percent slopes III I I Mayodan fine sandy loam, 10 to 14 percent slopes III I I Mayodan fine sandy loam, 10 to 14 percent slopes, eroded III I II Mayodan fine sandy loam, ALL OTHER IV I II Mayodan gravelly sandy loam, 2 to 6 percent slopes II I I Mayodan gravelly sandy loam, 2 to 6 percent slopes, eroded II I I Mayodan gravelly sandy loam, 2 to 8 percent slopes II I I Mayodan gravelly sandy loam, 6 to 10 percent slopes III I I Mayodan gravelly sandy loam, 6 to 10 percent slopes, eroded IV I I Mayodan gravelly sandy loam, 8 to 15 percent slopes III I II Mayodan gravelly sandy loam, 10 to 15 percent slopes III I II Mayodan gravelly sandy loam, 15 to 25 percent slopes IV I II Mayodan sandy clay loam, 2 to 8 percent slopes, eroded II I II Mayodan sandy clay loam, 8 to 15 percent slopes, eroded III I II Mayodan sandy clay loam, 15 to 25 percent slopes, eroded IV I II Mayodan sandy loam, 2 to 6 percent slopes II I I Mayodan sandy loam, 2 to 6 percent slopes, eroded II I I Mayodan sandy loam, 2 to 8 percent slopes II I I Mayodan sandy loam, 6 to 10 percent slopes III I I Mayodan sandy loam, 6 to 10 percent slopes, eroded III I I Mayodan sandy loam, 8 to 15 percent slopes III I II Mayodan sandy loam, 10 to 15 percent slopes III I II Mayodan sandy loam, 10 to 15 percent slopes, eroded IV I II Mayodan sandy loam, 15 to 25 percent slopes IV I II Mayodan sandy loam, 15 to 25 percent slopes, stony IV I IV Mayodan silt loam, 2 to 8 percent slopes II I I Mayodan silt loam, 8 to 15 percent slopes III I II Mayodan silt loam, 15 to 25 percent slopes IV I II Mayodan silt loam, 25 to 45 percent slopes IV I III Mayodan silt loam, thin, ALL III I II Mayodan silty clay loam, 2 to 8 percent slopes, eroded III I II Mayodan silty clay loam, 8 to 15 percent slopes, eroded IV I II Mayodan-Brickhaven complex, 15 to 30 percent slopes IV I III Mayodan-Exway complex, eroded, ALL III I II Mayodan-Pinkston complex, 25 to 45 percent slopes IV I III Mayodan-Urban land complex, ALL IV I IV McQueen loam, 1 to 6 percent slopes II II II Mecklenburg clay loam, 2 to 8 percent slopes, eroded II II II Mecklenburg clay loam, 2 to 8 percent slopes, moderately eroded II II II Mecklenburg clay loam, 6 to 15 percent slopes, severely eroded IV II II Mecklenburg clay loam, 8 to 15 percent slopes, eroded III II II Mecklenburg clay loam, 8 to 15 percent slopes, moderately eroded III II II Mecklenburg clay loam, severely eroded sloping phase IV II II Mecklenburg fine sandy loam, 2 to 6 percent slopes II II I Mecklenburg fine sandy loam, 2 to 8 percent slopes II II II Mecklenburg fine sandy loam, 8 to 15 percent slopes III II II Mecklenburg loam, 2 to 6 percent slopes II II I Mecklenburg loam, 2 to 6 percent slopes, eroded II II II
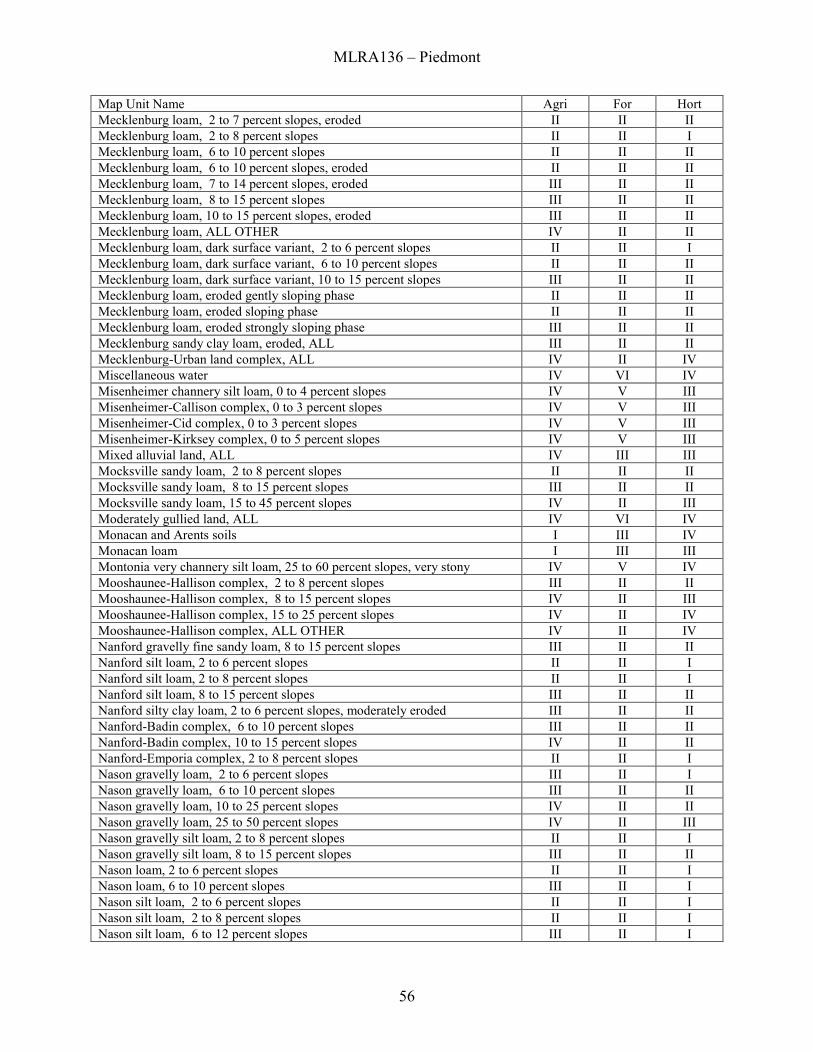
MLRA136 – Piedmont
56
Map Unit Name Agri For Hort Mecklenburg loam, 2 to 7 percent slopes, eroded II II II Mecklenburg loam, 2 to 8 percent slopes II II I Mecklenburg loam, 6 to 10 percent slopes II II II Mecklenburg loam, 6 to 10 percent slopes, eroded II II II Mecklenburg loam, 7 to 14 percent slopes, eroded III II II Mecklenburg loam, 8 to 15 percent slopes III II II Mecklenburg loam, 10 to 15 percent slopes, eroded III II II Mecklenburg loam, ALL OTHER IV II II Mecklenburg loam, dark surface variant, 2 to 6 percent slopes II II I Mecklenburg loam, dark surface variant, 6 to 10 percent slopes II II II Mecklenburg loam, dark surface variant, 10 to 15 percent slopes III II II Mecklenburg loam, eroded gently sloping phase II II II Mecklenburg loam, eroded sloping phase II II II Mecklenburg loam, eroded strongly sloping phase III II II Mecklenburg sandy clay loam, eroded, ALL III II II Mecklenburg-Urban land complex, ALL IV II IV Miscellaneous water IV VI IV Misenheimer channery silt loam, 0 to 4 percent slopes IV V III Misenheimer-Callison complex, 0 to 3 percent slopes IV V III Misenheimer-Cid complex, 0 to 3 percent slopes IV V III Misenheimer-Kirksey complex, 0 to 5 percent slopes IV V III Mixed alluvial land, ALL IV III III Mocksville sandy loam, 2 to 8 percent slopes II II II Mocksville sandy loam, 8 to 15 percent slopes III II II Mocksville sandy loam, 15 to 45 percent slopes IV II III Moderately gullied land, ALL IV VI IV Monacan and Arents soils I III IV Monacan loam I III III Montonia very channery silt loam, 25 to 60 percent slopes, very stony IV V IV Mooshaunee-Hallison complex, 2 to 8 percent slopes III II II Mooshaunee-Hallison complex, 8 to 15 percent slopes IV II III Mooshaunee-Hallison complex, 15 to 25 percent slopes IV II IV Mooshaunee-Hallison complex, ALL OTHER IV II IV Nanford gravelly fine sandy loam, 8 to 15 percent slopes III II II Nanford silt loam, 2 to 6 percent slopes II II I Nanford silt loam, 2 to 8 percent slopes II II I Nanford silt loam, 8 to 15 percent slopes III II II Nanford silty clay loam, 2 to 6 percent slopes, moderately eroded III II II Nanford-Badin complex, 6 to 10 percent slopes III II II Nanford-Badin complex, 10 to 15 percent slopes IV II II Nanford-Emporia complex, 2 to 8 percent slopes II II I Nason gravelly loam, 2 to 6 percent slopes III II I Nason gravelly loam, 6 to 10 percent slopes III II II Nason gravelly loam, 10 to 25 percent slopes IV II II Nason gravelly loam, 25 to 50 percent slopes IV II III Nason gravelly silt loam, 2 to 8 percent slopes II II I Nason gravelly silt loam, 8 to 15 percent slopes III II II Nason loam, 2 to 6 percent slopes II II I Nason loam, 6 to 10 percent slopes III II I Nason silt loam, 2 to 6 percent slopes II II I Nason silt loam, 2 to 8 percent slopes II II I Nason silt loam, 6 to 12 percent slopes III II I
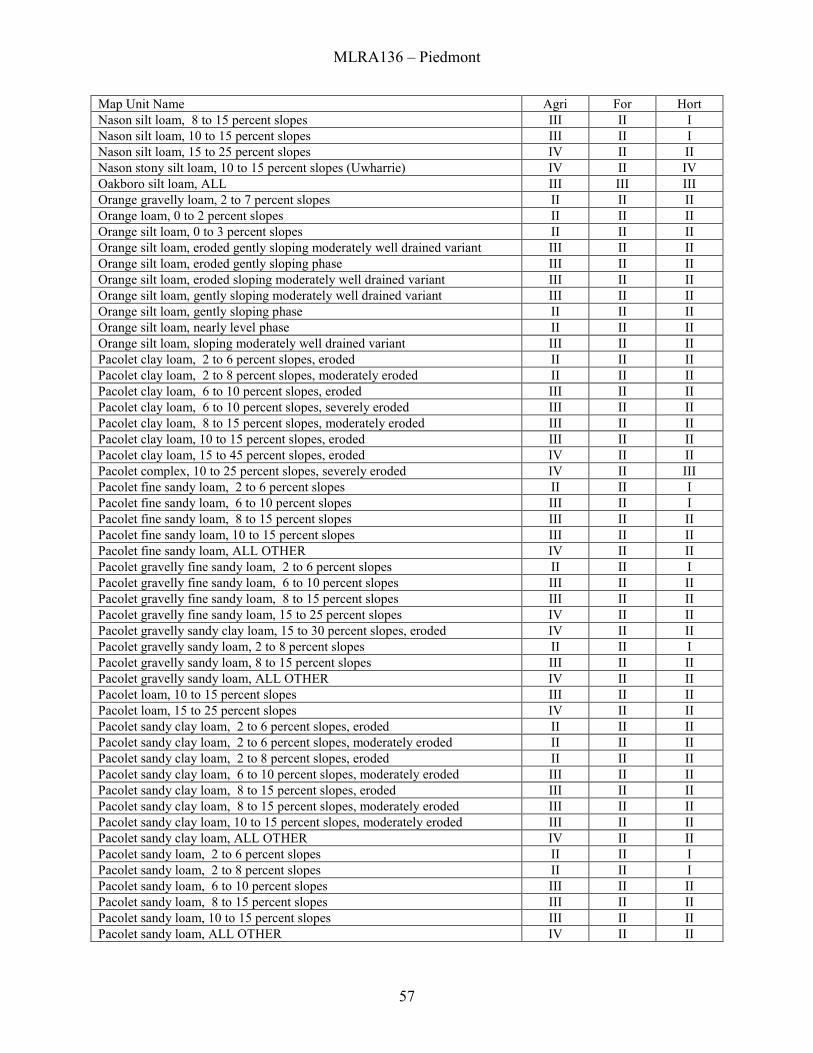
MLRA136 – Piedmont
57
Map Unit Name Agri For Hort Nason silt loam, 8 to 15 percent slopes III II I Nason silt loam, 10 to 15 percent slopes III II I Nason silt loam, 15 to 25 percent slopes IV II II Nason stony silt loam, 10 to 15 percent slopes (Uwharrie) IV II IV Oakboro silt loam, ALL III III III Orange gravelly loam, 2 to 7 percent slopes II II II Orange loam, 0 to 2 percent slopes II II II Orange silt loam, 0 to 3 percent slopes II II II Orange silt loam, eroded gently sloping moderately well drained variant III II II Orange silt loam, eroded gently sloping phase III II II Orange silt loam, eroded sloping moderately well drained variant III II II Orange silt loam, gently sloping moderately well drained variant III II II Orange silt loam, gently sloping phase II II II Orange silt loam, nearly level phase II II II Orange silt loam, sloping moderately well drained variant III II II Pacolet clay loam, 2 to 6 percent slopes, eroded II II II Pacolet clay loam, 2 to 8 percent slopes, moderately eroded II II II Pacolet clay loam, 6 to 10 percent slopes, eroded III II II Pacolet clay loam, 6 to 10 percent slopes, severely eroded III II II Pacolet clay loam, 8 to 15 percent slopes, moderately eroded III II II Pacolet clay loam, 10 to 15 percent slopes, eroded III II II Pacolet clay loam, 15 to 45 percent slopes, eroded IV II II Pacolet complex, 10 to 25 percent slopes, severely eroded IV II III Pacolet fine sandy loam, 2 to 6 percent slopes II II I Pacolet fine sandy loam, 6 to 10 percent slopes III II I Pacolet fine sandy loam, 8 to 15 percent slopes III II II Pacolet fine sandy loam, 10 to 15 percent slopes III II II Pacolet fine sandy loam, ALL OTHER IV II II Pacolet gravelly fine sandy loam, 2 to 6 percent slopes II II I Pacolet gravelly fine sandy loam, 6 to 10 percent slopes III II II Pacolet gravelly fine sandy loam, 8 to 15 percent slopes III II II Pacolet gravelly fine sandy loam, 15 to 25 percent slopes IV II II Pacolet gravelly sandy clay loam, 15 to 30 percent slopes, eroded IV II II Pacolet gravelly sandy loam, 2 to 8 percent slopes II II I Pacolet gravelly sandy loam, 8 to 15 percent slopes III II II Pacolet gravelly sandy loam, ALL OTHER IV II II Pacolet loam, 10 to 15 percent slopes III II II Pacolet loam, 15 to 25 percent slopes IV II II Pacolet sandy clay loam, 2 to 6 percent slopes, eroded II II II Pacolet sandy clay loam, 2 to 6 percent slopes, moderately eroded II II II Pacolet sandy clay loam, 2 to 8 percent slopes, eroded II II II Pacolet sandy clay loam, 6 to 10 percent slopes, moderately eroded III II II Pacolet sandy clay loam, 8 to 15 percent slopes, eroded III II II Pacolet sandy clay loam, 8 to 15 percent slopes, moderately eroded III II II Pacolet sandy clay loam, 10 to 15 percent slopes, moderately eroded III II II Pacolet sandy clay loam, ALL OTHER IV II II Pacolet sandy loam, 2 to 6 percent slopes II II I Pacolet sandy loam, 2 to 8 percent slopes II II I Pacolet sandy loam, 6 to 10 percent slopes III II II Pacolet sandy loam, 8 to 15 percent slopes III II II Pacolet sandy loam, 10 to 15 percent slopes III II II Pacolet sandy loam, ALL OTHER IV II II
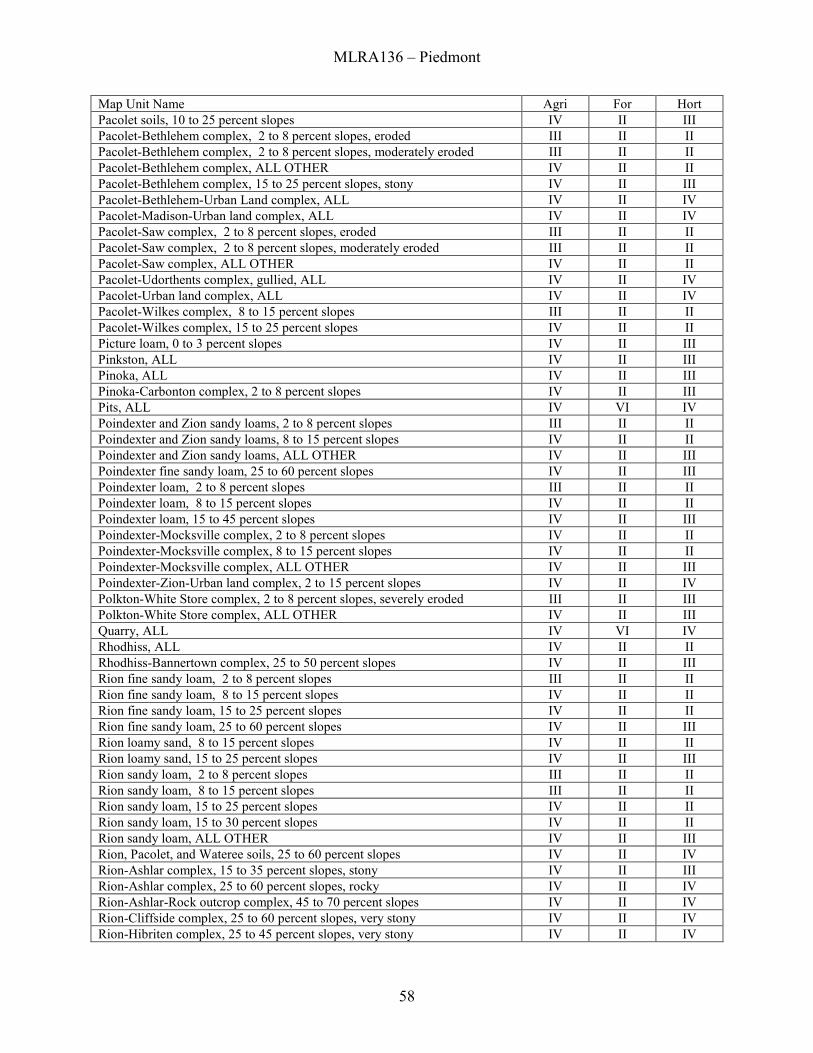
MLRA136 – Piedmont
58
Map Unit Name Agri For Hort Pacolet soils, 10 to 25 percent slopes IV II III Pacolet-Bethlehem complex, 2 to 8 percent slopes, eroded III II II Pacolet-Bethlehem complex, 2 to 8 percent slopes, moderately eroded III II II Pacolet-Bethlehem complex, ALL OTHER IV II II Pacolet-Bethlehem complex, 15 to 25 percent slopes, stony IV II III Pacolet-Bethlehem-Urban Land complex, ALL IV II IV Pacolet-Madison-Urban land complex, ALL IV II IV Pacolet-Saw complex, 2 to 8 percent slopes, eroded III II II Pacolet-Saw complex, 2 to 8 percent slopes, moderately eroded III II II Pacolet-Saw complex, ALL OTHER IV II II Pacolet-Udorthents complex, gullied, ALL IV II IV Pacolet-Urban land complex, ALL IV II IV Pacolet-Wilkes complex, 8 to 15 percent slopes III II II Pacolet-Wilkes complex, 15 to 25 percent slopes IV II II Picture loam, 0 to 3 percent slopes IV II III Pinkston, ALL IV II III Pinoka, ALL IV II III Pinoka-Carbonton complex, 2 to 8 percent slopes IV II III Pits, ALL IV VI IV Poindexter and Zion sandy loams, 2 to 8 percent slopes III II II Poindexter and Zion sandy loams, 8 to 15 percent slopes IV II II Poindexter and Zion sandy loams, ALL OTHER IV II III Poindexter fine sandy loam, 25 to 60 percent slopes IV II III Poindexter loam, 2 to 8 percent slopes III II II Poindexter loam, 8 to 15 percent slopes IV II II Poindexter loam, 15 to 45 percent slopes IV II III Poindexter-Mocksville complex, 2 to 8 percent slopes IV II II Poindexter-Mocksville complex, 8 to 15 percent slopes IV II II Poindexter-Mocksville complex, ALL OTHER IV II III Poindexter-Zion-Urban land complex, 2 to 15 percent slopes IV II IV Polkton-White Store complex, 2 to 8 percent slopes, severely eroded III II III Polkton-White Store complex, ALL OTHER IV II III Quarry, ALL IV VI IV Rhodhiss, ALL IV II II Rhodhiss-Bannertown complex, 25 to 50 percent slopes IV II III Rion fine sandy loam, 2 to 8 percent slopes III II II Rion fine sandy loam, 8 to 15 percent slopes IV II II Rion fine sandy loam, 15 to 25 percent slopes IV II II Rion fine sandy loam, 25 to 60 percent slopes IV II III Rion loamy sand, 8 to 15 percent slopes IV II II Rion loamy sand, 15 to 25 percent slopes IV II III Rion sandy loam, 2 to 8 percent slopes III II II Rion sandy loam, 8 to 15 percent slopes III II II Rion sandy loam, 15 to 25 percent slopes IV II II Rion sandy loam, 15 to 30 percent slopes IV II II Rion sandy loam, ALL OTHER IV II III Rion, Pacolet, and Wateree soils, 25 to 60 percent slopes IV II IV Rion-Ashlar complex, 15 to 35 percent slopes, stony IV II III Rion-Ashlar complex, 25 to 60 percent slopes, rocky IV II IV Rion-Ashlar-Rock outcrop complex, 45 to 70 percent slopes IV II IV Rion-Cliffside complex, 25 to 60 percent slopes, very stony IV II IV Rion-Hibriten complex, 25 to 45 percent slopes, very stony IV II IV
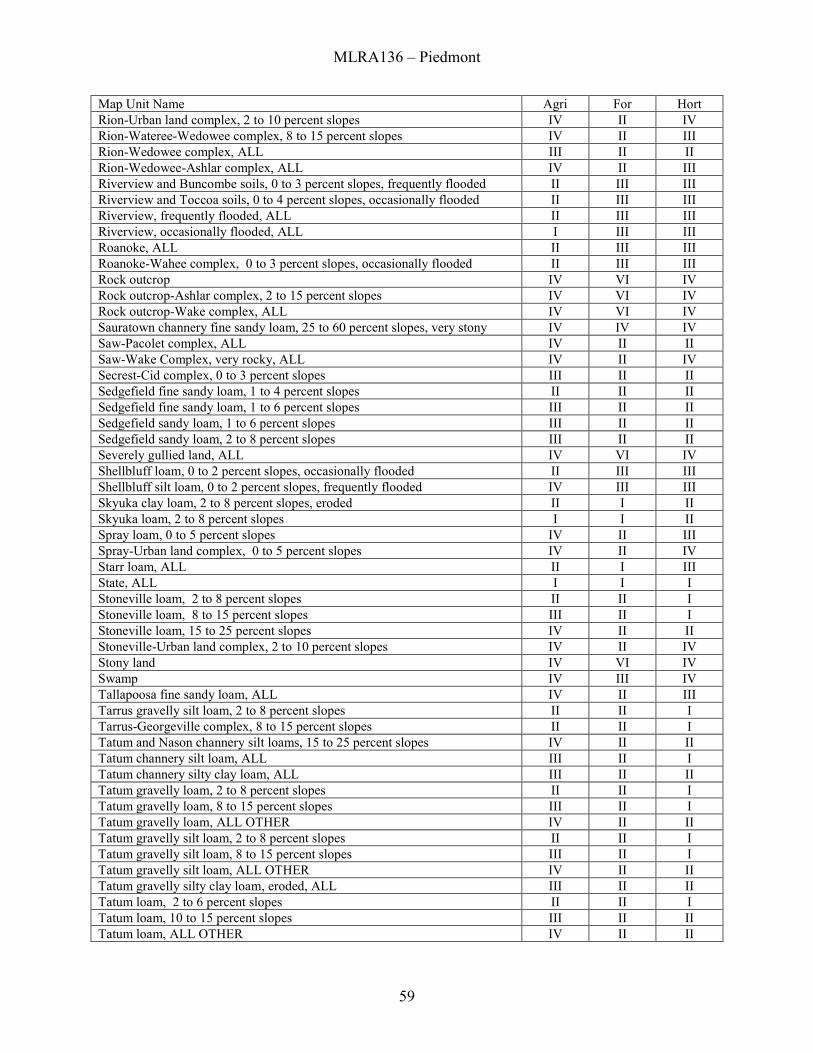
MLRA136 – Piedmont
59
Map Unit Name Agri For Hort Rion-Urban land complex, 2 to 10 percent slopes IV II IV Rion-Wateree-Wedowee complex, 8 to 15 percent slopes IV II III Rion-Wedowee complex, ALL III II II Rion-Wedowee-Ashlar complex, ALL IV II III Riverview and Buncombe soils, 0 to 3 percent slopes, frequently flooded II III III Riverview and Toccoa soils, 0 to 4 percent slopes, occasionally flooded II III III Riverview, frequently flooded, ALL II III III Riverview, occasionally flooded, ALL I III III Roanoke, ALL II III III Roanoke-Wahee complex, 0 to 3 percent slopes, occasionally flooded II III III Rock outcrop IV VI IV Rock outcrop-Ashlar complex, 2 to 15 percent slopes IV VI IV Rock outcrop-Wake complex, ALL IV VI IV Sauratown channery fine sandy loam, 25 to 60 percent slopes, very stony IV IV IV Saw-Pacolet complex, ALL IV II II Saw-Wake Complex, very rocky, ALL IV II IV Secrest-Cid complex, 0 to 3 percent slopes III II II Sedgefield fine sandy loam, 1 to 4 percent slopes II II II Sedgefield fine sandy loam, 1 to 6 percent slopes III II II Sedgefield sandy loam, 1 to 6 percent slopes III II II Sedgefield sandy loam, 2 to 8 percent slopes III II II Severely gullied land, ALL IV VI IV Shellbluff loam, 0 to 2 percent slopes, occasionally flooded II III III Shellbluff silt loam, 0 to 2 percent slopes, frequently flooded IV III III Skyuka clay loam, 2 to 8 percent slopes, eroded II I II Skyuka loam, 2 to 8 percent slopes I I II Spray loam, 0 to 5 percent slopes IV II III Spray-Urban land complex, 0 to 5 percent slopes IV II IV Starr loam, ALL II I III State, ALL I I I Stoneville loam, 2 to 8 percent slopes II II I Stoneville loam, 8 to 15 percent slopes III II I Stoneville loam, 15 to 25 percent slopes IV II II Stoneville-Urban land complex, 2 to 10 percent slopes IV II IV Stony land IV VI IV Swamp IV III IV Tallapoosa fine sandy loam, ALL IV II III Tarrus gravelly silt loam, 2 to 8 percent slopes II II I Tarrus-Georgeville complex, 8 to 15 percent slopes II II I Tatum and Nason channery silt loams, 15 to 25 percent slopes IV II II Tatum channery silt loam, ALL III II I Tatum channery silty clay loam, ALL III II II Tatum gravelly loam, 2 to 8 percent slopes II II I Tatum gravelly loam, 8 to 15 percent slopes III II I Tatum gravelly loam, ALL OTHER IV II II Tatum gravelly silt loam, 2 to 8 percent slopes II II I Tatum gravelly silt loam, 8 to 15 percent slopes III II I Tatum gravelly silt loam, ALL OTHER IV II II Tatum gravelly silty clay loam, eroded, ALL III II II Tatum loam, 2 to 6 percent slopes II II I Tatum loam, 10 to 15 percent slopes III II II Tatum loam, ALL OTHER IV II II
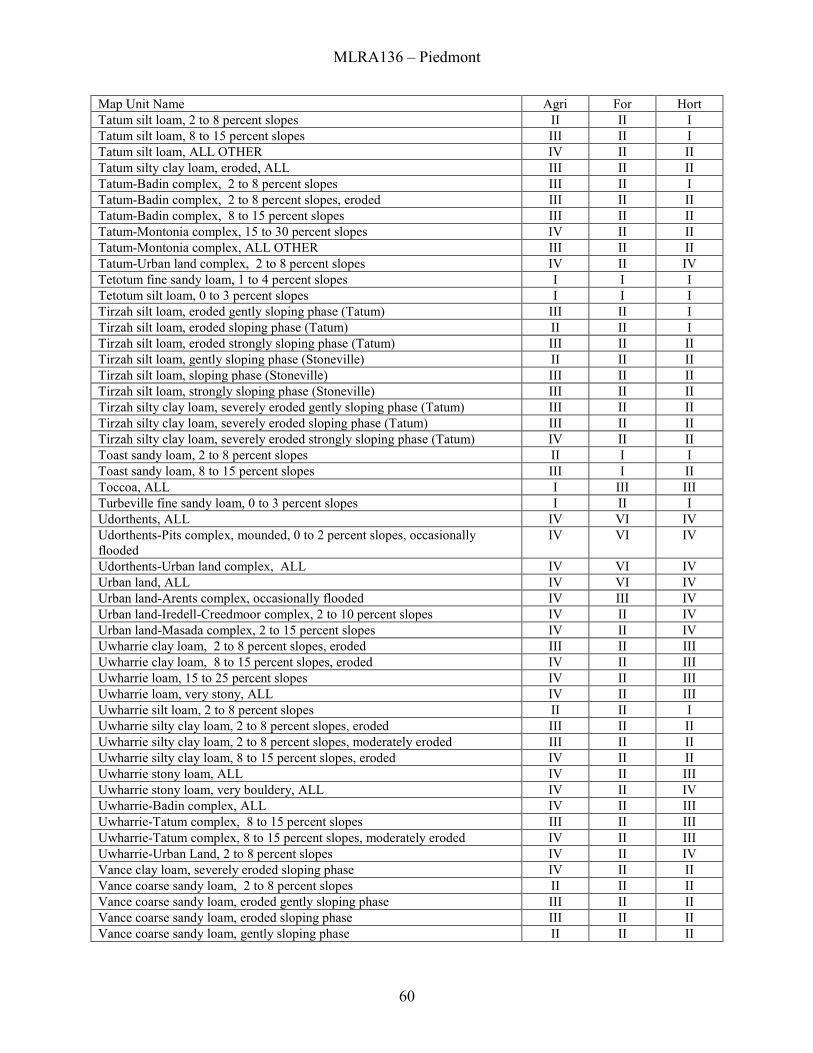
MLRA136 – Piedmont
60
Map Unit Name Agri For Hort Tatum silt loam, 2 to 8 percent slopes II II I Tatum silt loam, 8 to 15 percent slopes III II I Tatum silt loam, ALL OTHER IV II II Tatum silty clay loam, eroded, ALL III II II Tatum-Badin complex, 2 to 8 percent slopes III II I Tatum-Badin complex, 2 to 8 percent slopes, eroded III II II Tatum-Badin complex, 8 to 15 percent slopes III II II Tatum-Montonia complex, 15 to 30 percent slopes IV II II Tatum-Montonia complex, ALL OTHER III II II Tatum-Urban land complex, 2 to 8 percent slopes IV II IV Tetotum fine sandy loam, 1 to 4 percent slopes I I I Tetotum silt loam, 0 to 3 percent slopes I I I Tirzah silt loam, eroded gently sloping phase (Tatum) III II I Tirzah silt loam, eroded sloping phase (Tatum) II II I Tirzah silt loam, eroded strongly sloping phase (Tatum) III II II Tirzah silt loam, gently sloping phase (Stoneville) II II II Tirzah silt loam, sloping phase (Stoneville) III II II Tirzah silt loam, strongly sloping phase (Stoneville) III II II Tirzah silty clay loam, severely eroded gently sloping phase (Tatum) III II II Tirzah silty clay loam, severely eroded sloping phase (Tatum) III II II Tirzah silty clay loam, severely eroded strongly sloping phase (Tatum) IV II II Toast sandy loam, 2 to 8 percent slopes II I I Toast sandy loam, 8 to 15 percent slopes III I II Toccoa, ALL I III III Turbeville fine sandy loam, 0 to 3 percent slopes I II I Udorthents, ALL IV VI IV Udorthents-Pits complex, mounded, 0 to 2 percent slopes, occasionally flooded
IV VI IV
Udorthents-Urban land complex, ALL IV VI IV Urban land, ALL IV VI IV Urban land-Arents complex, occasionally flooded IV III IV Urban land-Iredell-Creedmoor complex, 2 to 10 percent slopes IV II IV Urban land-Masada complex, 2 to 15 percent slopes IV II IV Uwharrie clay loam, 2 to 8 percent slopes, eroded III II III Uwharrie clay loam, 8 to 15 percent slopes, eroded IV II III Uwharrie loam, 15 to 25 percent slopes IV II III Uwharrie loam, very stony, ALL IV II III Uwharrie silt loam, 2 to 8 percent slopes II II I Uwharrie silty clay loam, 2 to 8 percent slopes, eroded III II II Uwharrie silty clay loam, 2 to 8 percent slopes, moderately eroded III II II Uwharrie silty clay loam, 8 to 15 percent slopes, eroded IV II II Uwharrie stony loam, ALL IV II III Uwharrie stony loam, very bouldery, ALL IV II IV Uwharrie-Badin complex, ALL IV II III Uwharrie-Tatum complex, 8 to 15 percent slopes III II III Uwharrie-Tatum complex, 8 to 15 percent slopes, moderately eroded IV II III Uwharrie-Urban Land, 2 to 8 percent slopes IV II IV Vance clay loam, severely eroded sloping phase IV II II Vance coarse sandy loam, 2 to 8 percent slopes II II II Vance coarse sandy loam, eroded gently sloping phase III II II Vance coarse sandy loam, eroded sloping phase III II II Vance coarse sandy loam, gently sloping phase II II II
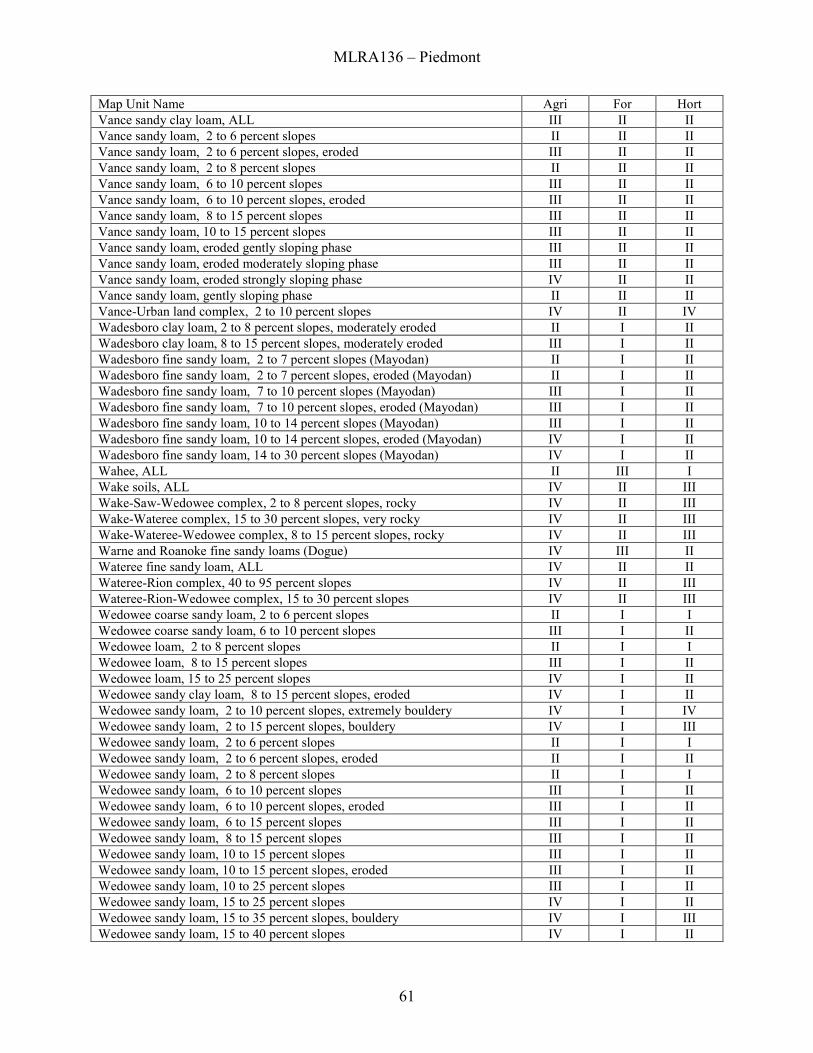
MLRA136 – Piedmont
61
Map Unit Name Agri For Hort Vance sandy clay loam, ALL III II II Vance sandy loam, 2 to 6 percent slopes II II II Vance sandy loam, 2 to 6 percent slopes, eroded III II II Vance sandy loam, 2 to 8 percent slopes II II II Vance sandy loam, 6 to 10 percent slopes III II II Vance sandy loam, 6 to 10 percent slopes, eroded III II II Vance sandy loam, 8 to 15 percent slopes III II II Vance sandy loam, 10 to 15 percent slopes III II II Vance sandy loam, eroded gently sloping phase III II II Vance sandy loam, eroded moderately sloping phase III II II Vance sandy loam, eroded strongly sloping phase IV II II Vance sandy loam, gently sloping phase II II II Vance-Urban land complex, 2 to 10 percent slopes IV II IV Wadesboro clay loam, 2 to 8 percent slopes, moderately eroded II I II Wadesboro clay loam, 8 to 15 percent slopes, moderately eroded III I II Wadesboro fine sandy loam, 2 to 7 percent slopes (Mayodan) II I II Wadesboro fine sandy loam, 2 to 7 percent slopes, eroded (Mayodan) II I II Wadesboro fine sandy loam, 7 to 10 percent slopes (Mayodan) III I II Wadesboro fine sandy loam, 7 to 10 percent slopes, eroded (Mayodan) III I II Wadesboro fine sandy loam, 10 to 14 percent slopes (Mayodan) III I II Wadesboro fine sandy loam, 10 to 14 percent slopes, eroded (Mayodan) IV I II Wadesboro fine sandy loam, 14 to 30 percent slopes (Mayodan) IV I II Wahee, ALL II III I Wake soils, ALL IV II III Wake-Saw-Wedowee complex, 2 to 8 percent slopes, rocky IV II III Wake-Wateree complex, 15 to 30 percent slopes, very rocky IV II III Wake-Wateree-Wedowee complex, 8 to 15 percent slopes, rocky IV II III Warne and Roanoke fine sandy loams (Dogue) IV III II Wateree fine sandy loam, ALL IV II II Wateree-Rion complex, 40 to 95 percent slopes IV II III Wateree-Rion-Wedowee complex, 15 to 30 percent slopes IV II III Wedowee coarse sandy loam, 2 to 6 percent slopes II I I Wedowee coarse sandy loam, 6 to 10 percent slopes III I II Wedowee loam, 2 to 8 percent slopes II I I Wedowee loam, 8 to 15 percent slopes III I II Wedowee loam, 15 to 25 percent slopes IV I II Wedowee sandy clay loam, 8 to 15 percent slopes, eroded IV I II Wedowee sandy loam, 2 to 10 percent slopes, extremely bouldery IV I IV Wedowee sandy loam, 2 to 15 percent slopes, bouldery IV I III Wedowee sandy loam, 2 to 6 percent slopes II I I Wedowee sandy loam, 2 to 6 percent slopes, eroded II I II Wedowee sandy loam, 2 to 8 percent slopes II I I Wedowee sandy loam, 6 to 10 percent slopes III I II Wedowee sandy loam, 6 to 10 percent slopes, eroded III I II Wedowee sandy loam, 6 to 15 percent slopes III I II Wedowee sandy loam, 8 to 15 percent slopes III I II Wedowee sandy loam, 10 to 15 percent slopes III I II Wedowee sandy loam, 10 to 15 percent slopes, eroded III I II Wedowee sandy loam, 10 to 25 percent slopes III I II Wedowee sandy loam, 15 to 25 percent slopes IV I II Wedowee sandy loam, 15 to 35 percent slopes, bouldery IV I III Wedowee sandy loam, 15 to 40 percent slopes IV I II
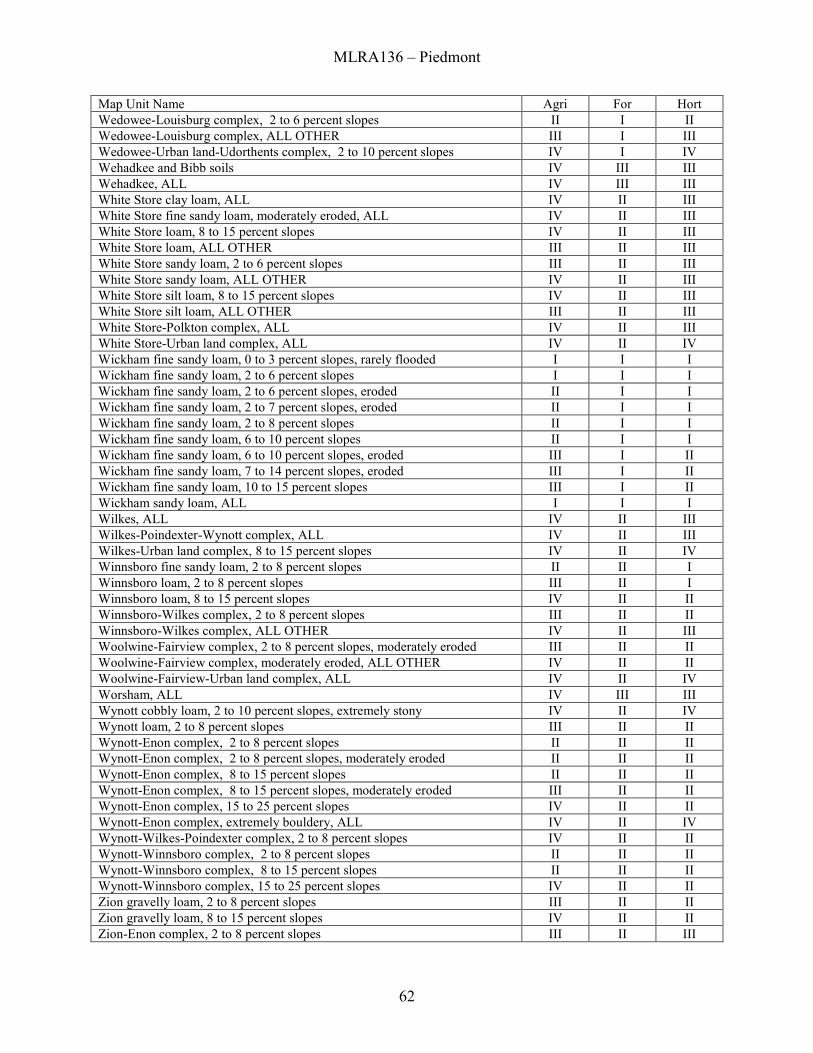
MLRA136 – Piedmont
62
Map Unit Name Agri For Hort Wedowee-Louisburg complex, 2 to 6 percent slopes II I II Wedowee-Louisburg complex, ALL OTHER III I III Wedowee-Urban land-Udorthents complex, 2 to 10 percent slopes IV I IV Wehadkee and Bibb soils IV III III Wehadkee, ALL IV III III White Store clay loam, ALL IV II III White Store fine sandy loam, moderately eroded, ALL IV II III White Store loam, 8 to 15 percent slopes IV II III White Store loam, ALL OTHER III II III White Store sandy loam, 2 to 6 percent slopes III II III White Store sandy loam, ALL OTHER IV II III White Store silt loam, 8 to 15 percent slopes IV II III White Store silt loam, ALL OTHER III II III White Store-Polkton complex, ALL IV II III White Store-Urban land complex, ALL IV II IV Wickham fine sandy loam, 0 to 3 percent slopes, rarely flooded I I I Wickham fine sandy loam, 2 to 6 percent slopes I I I Wickham fine sandy loam, 2 to 6 percent slopes, eroded II I I Wickham fine sandy loam, 2 to 7 percent slopes, eroded II I I Wickham fine sandy loam, 2 to 8 percent slopes II I I Wickham fine sandy loam, 6 to 10 percent slopes II I I Wickham fine sandy loam, 6 to 10 percent slopes, eroded III I II Wickham fine sandy loam, 7 to 14 percent slopes, eroded III I II Wickham fine sandy loam, 10 to 15 percent slopes III I II Wickham sandy loam, ALL I I I Wilkes, ALL IV II III Wilkes-Poindexter-Wynott complex, ALL IV II III Wilkes-Urban land complex, 8 to 15 percent slopes IV II IV Winnsboro fine sandy loam, 2 to 8 percent slopes II II I Winnsboro loam, 2 to 8 percent slopes III II I Winnsboro loam, 8 to 15 percent slopes IV II II Winnsboro-Wilkes complex, 2 to 8 percent slopes III II II Winnsboro-Wilkes complex, ALL OTHER IV II III Woolwine-Fairview complex, 2 to 8 percent slopes, moderately eroded III II II Woolwine-Fairview complex, moderately eroded, ALL OTHER IV II II Woolwine-Fairview-Urban land complex, ALL IV II IV Worsham, ALL IV III III Wynott cobbly loam, 2 to 10 percent slopes, extremely stony IV II IV Wynott loam, 2 to 8 percent slopes III II II Wynott-Enon complex, 2 to 8 percent slopes II II II Wynott-Enon complex, 2 to 8 percent slopes, moderately eroded II II II Wynott-Enon complex, 8 to 15 percent slopes II II II Wynott-Enon complex, 8 to 15 percent slopes, moderately eroded III II II Wynott-Enon complex, 15 to 25 percent slopes IV II II Wynott-Enon complex, extremely bouldery, ALL IV II IV Wynott-Wilkes-Poindexter complex, 2 to 8 percent slopes IV II II Wynott-Winnsboro complex, 2 to 8 percent slopes II II II Wynott-Winnsboro complex, 8 to 15 percent slopes II II II Wynott-Winnsboro complex, 15 to 25 percent slopes IV II II Zion gravelly loam, 2 to 8 percent slopes III II II Zion gravelly loam, 8 to 15 percent slopes IV II II Zion-Enon complex, 2 to 8 percent slopes III II III
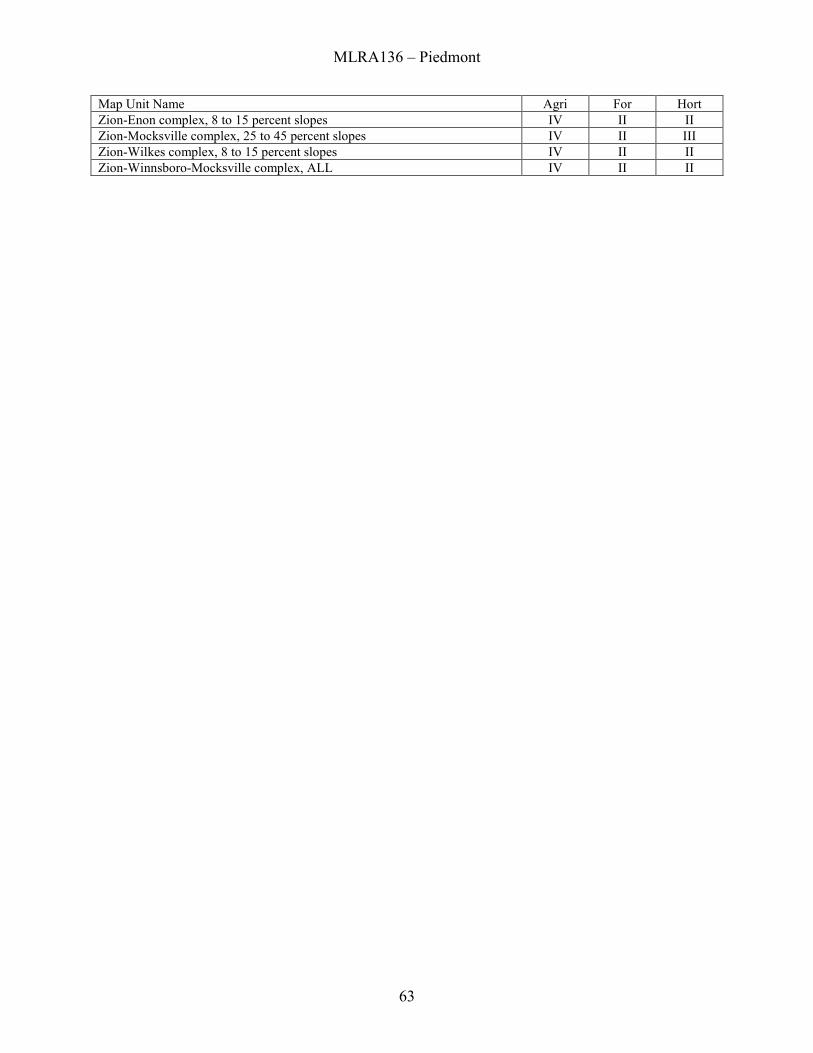
MLRA136 – Piedmont
63
Map Unit Name Agri For Hort Zion-Enon complex, 8 to 15 percent slopes IV II II Zion-Mocksville complex, 25 to 45 percent slopes IV II III Zion-Wilkes complex, 8 to 15 percent slopes IV II II Zion-Winnsboro-Mocksville complex, ALL IV II II
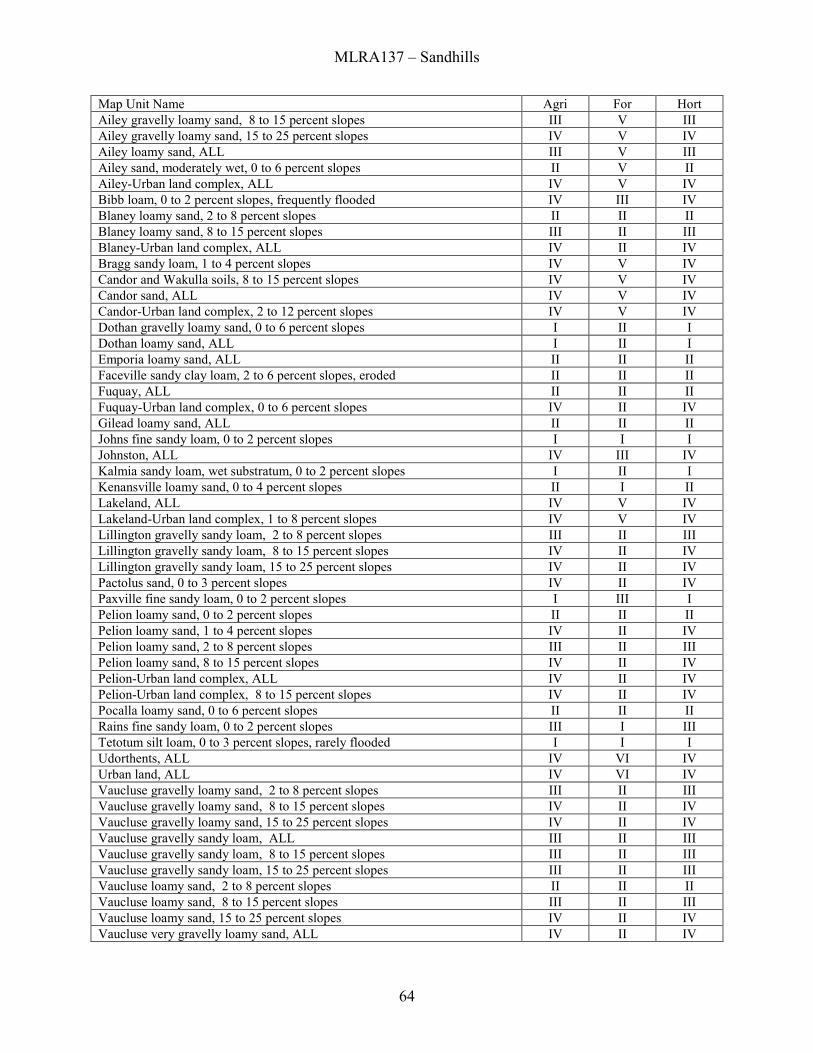
MLRA137 – Sandhills
64
Map Unit Name Agri For Hort Ailey gravelly loamy sand, 8 to 15 percent slopes III V III Ailey gravelly loamy sand, 15 to 25 percent slopes IV V IV Ailey loamy sand, ALL III V III Ailey sand, moderately wet, 0 to 6 percent slopes II V II Ailey-Urban land complex, ALL IV V IV Bibb loam, 0 to 2 percent slopes, frequently flooded IV III IV Blaney loamy sand, 2 to 8 percent slopes II II II Blaney loamy sand, 8 to 15 percent slopes III II III Blaney-Urban land complex, ALL IV II IV Bragg sandy loam, 1 to 4 percent slopes IV V IV Candor and Wakulla soils, 8 to 15 percent slopes IV V IV Candor sand, ALL IV V IV Candor-Urban land complex, 2 to 12 percent slopes IV V IV Dothan gravelly loamy sand, 0 to 6 percent slopes I II I Dothan loamy sand, ALL I II I Emporia loamy sand, ALL II II II Faceville sandy clay loam, 2 to 6 percent slopes, eroded II II II Fuquay, ALL II II II Fuquay-Urban land complex, 0 to 6 percent slopes IV II IV Gilead loamy sand, ALL II II II Johns fine sandy loam, 0 to 2 percent slopes I I I Johnston, ALL IV III IV Kalmia sandy loam, wet substratum, 0 to 2 percent slopes I II I Kenansville loamy sand, 0 to 4 percent slopes II I II Lakeland, ALL IV V IV Lakeland-Urban land complex, 1 to 8 percent slopes IV V IV Lillington gravelly sandy loam, 2 to 8 percent slopes III II III Lillington gravelly sandy loam, 8 to 15 percent slopes IV II IV Lillington gravelly sandy loam, 15 to 25 percent slopes IV II IV Pactolus sand, 0 to 3 percent slopes IV II IV Paxville fine sandy loam, 0 to 2 percent slopes I III I Pelion loamy sand, 0 to 2 percent slopes II II II Pelion loamy sand, 1 to 4 percent slopes IV II IV Pelion loamy sand, 2 to 8 percent slopes III II III Pelion loamy sand, 8 to 15 percent slopes IV II IV Pelion-Urban land complex, ALL IV II IV Pelion-Urban land complex, 8 to 15 percent slopes IV II IV Pocalla loamy sand, 0 to 6 percent slopes II II II Rains fine sandy loam, 0 to 2 percent slopes III I III Tetotum silt loam, 0 to 3 percent slopes, rarely flooded I I I Udorthents, ALL IV VI IV Urban land, ALL IV VI IV Vaucluse gravelly loamy sand, 2 to 8 percent slopes III II III Vaucluse gravelly loamy sand, 8 to 15 percent slopes IV II IV Vaucluse gravelly loamy sand, 15 to 25 percent slopes IV II IV Vaucluse gravelly sandy loam, ALL III II III Vaucluse gravelly sandy loam, 8 to 15 percent slopes III II III Vaucluse gravelly sandy loam, 15 to 25 percent slopes III II III Vaucluse loamy sand, 2 to 8 percent slopes II II II Vaucluse loamy sand, 8 to 15 percent slopes III II III Vaucluse loamy sand, 15 to 25 percent slopes IV II IV Vaucluse very gravelly loamy sand, ALL IV II IV
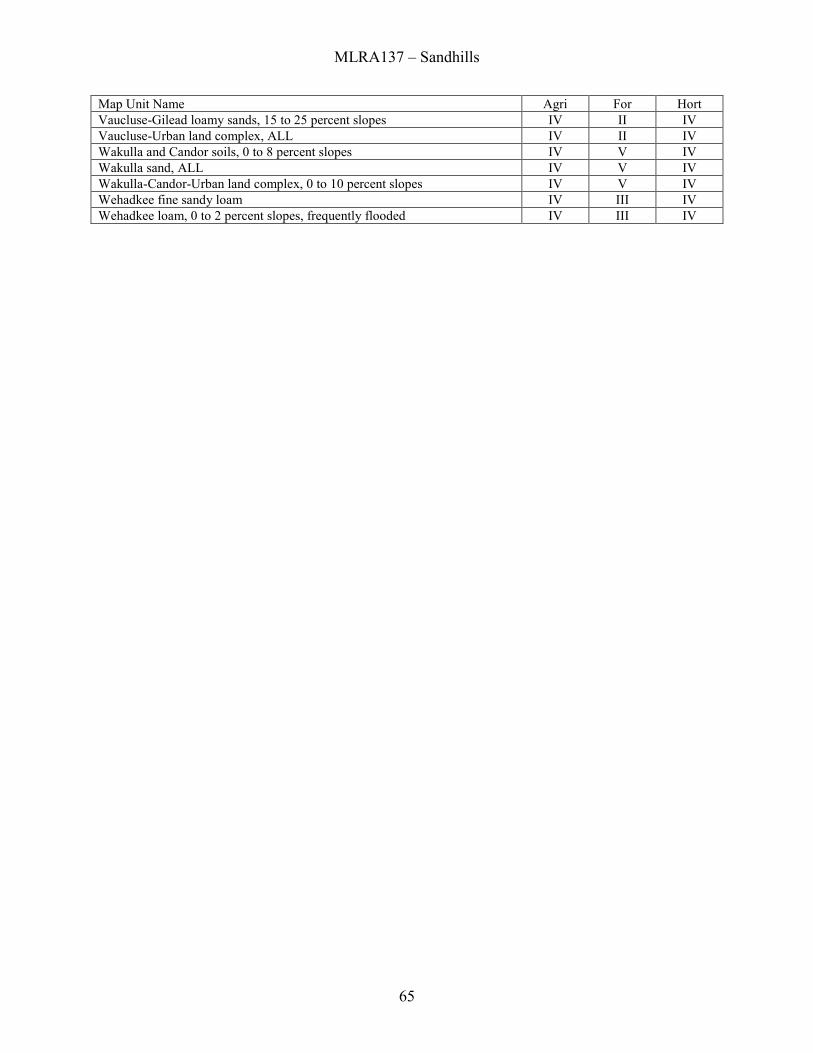
MLRA137 – Sandhills
65
Map Unit Name Agri For Hort Vaucluse-Gilead loamy sands, 15 to 25 percent slopes IV II IV Vaucluse-Urban land complex, ALL IV II IV Wakulla and Candor soils, 0 to 8 percent slopes IV V IV Wakulla sand, ALL IV V IV Wakulla-Candor-Urban land complex, 0 to 10 percent slopes IV V IV Wehadkee fine sandy loam IV III IV Wehadkee loam, 0 to 2 percent slopes, frequently flooded IV III IV
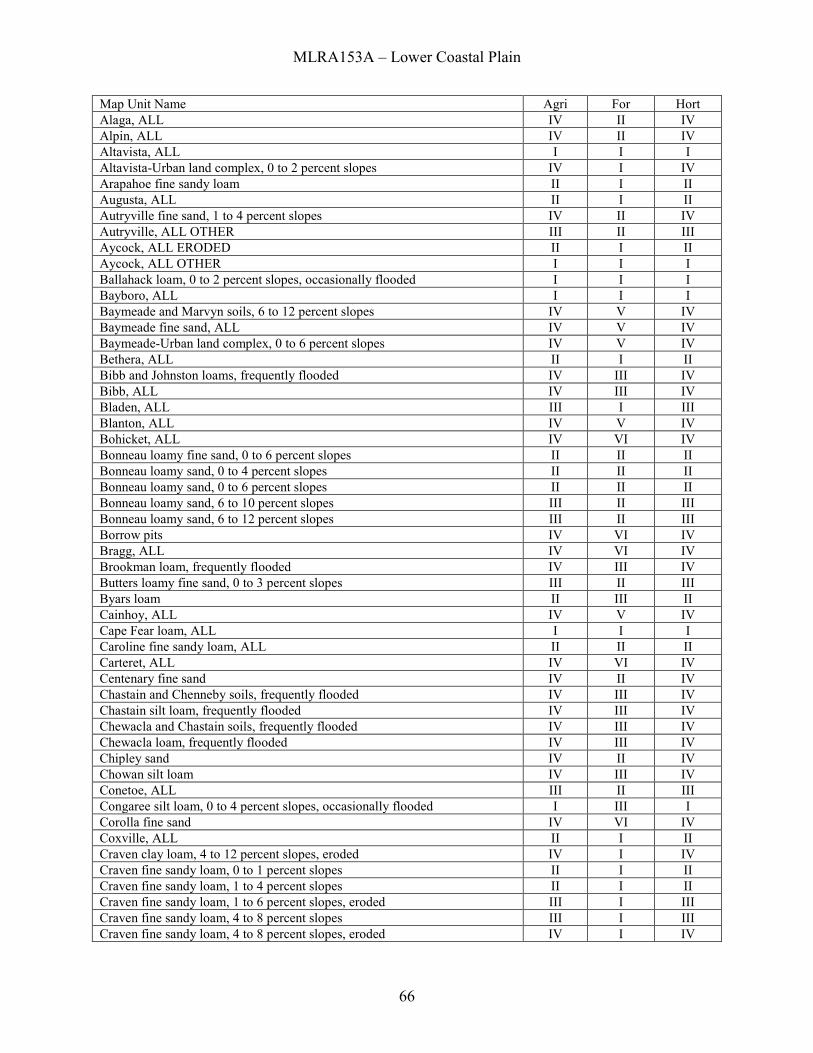
MLRA153A – Lower Coastal Plain
66
Map Unit Name Agri For Hort Alaga, ALL IV II IV Alpin, ALL IV II IV Altavista, ALL I I I Altavista-Urban land complex, 0 to 2 percent slopes IV I IV Arapahoe fine sandy loam II I II Augusta, ALL II I II Autryville fine sand, 1 to 4 percent slopes IV II IV Autryville, ALL OTHER III II III Aycock, ALL ERODED II I II Aycock, ALL OTHER I I I Ballahack loam, 0 to 2 percent slopes, occasionally flooded I I I Bayboro, ALL I I I Baymeade and Marvyn soils, 6 to 12 percent slopes IV V IV Baymeade fine sand, ALL IV V IV Baymeade-Urban land complex, 0 to 6 percent slopes IV V IV Bethera, ALL II I II Bibb and Johnston loams, frequently flooded IV III IV Bibb, ALL IV III IV Bladen, ALL III I III Blanton, ALL IV V IV Bohicket, ALL IV VI IV Bonneau loamy fine sand, 0 to 6 percent slopes II II II Bonneau loamy sand, 0 to 4 percent slopes II II II Bonneau loamy sand, 0 to 6 percent slopes II II II Bonneau loamy sand, 6 to 10 percent slopes III II III Bonneau loamy sand, 6 to 12 percent slopes III II III Borrow pits IV VI IV Bragg, ALL IV VI IV Brookman loam, frequently flooded IV III IV Butters loamy fine sand, 0 to 3 percent slopes III II III Byars loam II III II Cainhoy, ALL IV V IV Cape Fear loam, ALL I I I Caroline fine sandy loam, ALL II II II Carteret, ALL IV VI IV Centenary fine sand IV II IV Chastain and Chenneby soils, frequently flooded IV III IV Chastain silt loam, frequently flooded IV III IV Chewacla and Chastain soils, frequently flooded IV III IV Chewacla loam, frequently flooded IV III IV Chipley sand IV II IV Chowan silt loam IV III IV Conetoe, ALL III II III Congaree silt loam, 0 to 4 percent slopes, occasionally flooded I III I Corolla fine sand IV VI IV Coxville, ALL II I II Craven clay loam, 4 to 12 percent slopes, eroded IV I IV Craven fine sandy loam, 0 to 1 percent slopes II I II Craven fine sandy loam, 1 to 4 percent slopes II I II Craven fine sandy loam, 1 to 6 percent slopes, eroded III I III Craven fine sandy loam, 4 to 8 percent slopes III I III Craven fine sandy loam, 4 to 8 percent slopes, eroded IV I IV
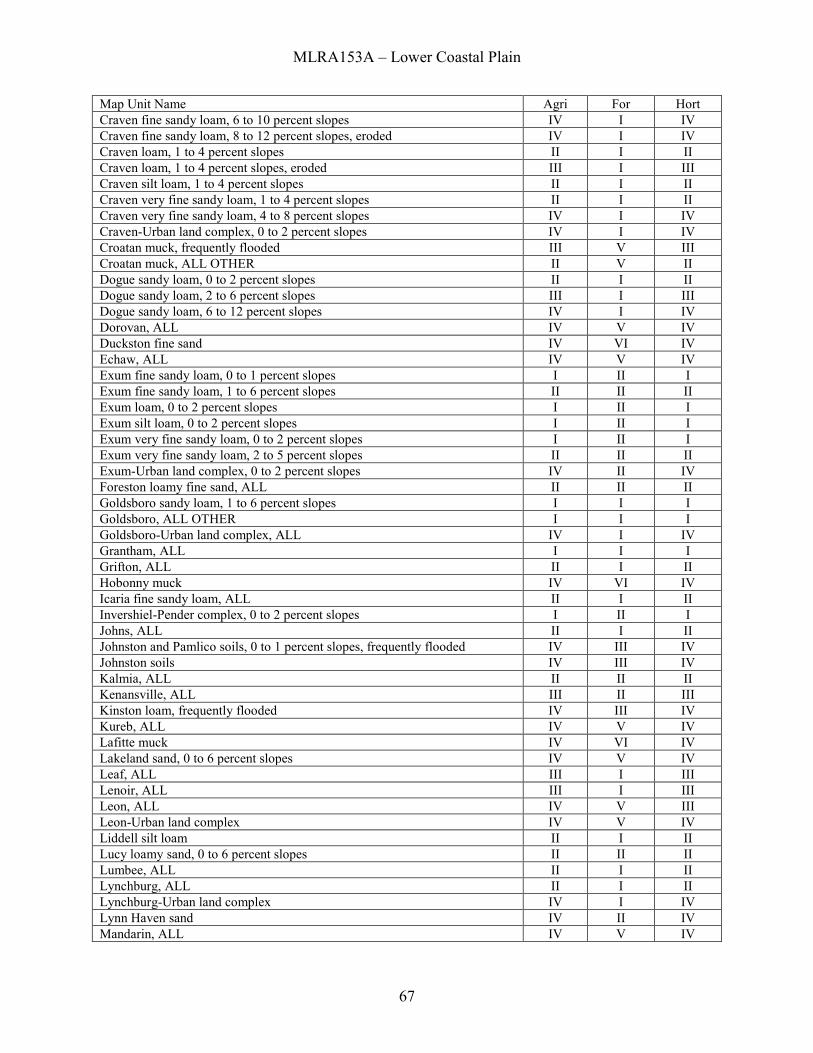
MLRA153A – Lower Coastal Plain
67
Map Unit Name Agri For Hort Craven fine sandy loam, 6 to 10 percent slopes IV I IV Craven fine sandy loam, 8 to 12 percent slopes, eroded IV I IV Craven loam, 1 to 4 percent slopes II I II Craven loam, 1 to 4 percent slopes, eroded III I III Craven silt loam, 1 to 4 percent slopes II I II Craven very fine sandy loam, 1 to 4 percent slopes II I II Craven very fine sandy loam, 4 to 8 percent slopes IV I IV Craven-Urban land complex, 0 to 2 percent slopes IV I IV Croatan muck, frequently flooded III V III Croatan muck, ALL OTHER II V II Dogue sandy loam, 0 to 2 percent slopes II I II Dogue sandy loam, 2 to 6 percent slopes III I III Dogue sandy loam, 6 to 12 percent slopes IV I IV Dorovan, ALL IV V IV Duckston fine sand IV VI IV Echaw, ALL IV V IV Exum fine sandy loam, 0 to 1 percent slopes I II I Exum fine sandy loam, 1 to 6 percent slopes II II II Exum loam, 0 to 2 percent slopes I II I Exum silt loam, 0 to 2 percent slopes I II I Exum very fine sandy loam, 0 to 2 percent slopes I II I Exum very fine sandy loam, 2 to 5 percent slopes II II II Exum-Urban land complex, 0 to 2 percent slopes IV II IV Foreston loamy fine sand, ALL II II II Goldsboro sandy loam, 1 to 6 percent slopes I I I Goldsboro, ALL OTHER I I I Goldsboro-Urban land complex, ALL IV I IV Grantham, ALL I I I Grifton, ALL II I II Hobonny muck IV VI IV Icaria fine sandy loam, ALL II I II Invershiel-Pender complex, 0 to 2 percent slopes I II I Johns, ALL II I II Johnston and Pamlico soils, 0 to 1 percent slopes, frequently flooded IV III IV Johnston soils IV III IV Kalmia, ALL II II II Kenansville, ALL III II III Kinston loam, frequently flooded IV III IV Kureb, ALL IV V IV Lafitte muck IV VI IV Lakeland sand, 0 to 6 percent slopes IV V IV Leaf, ALL III I III Lenoir, ALL III I III Leon, ALL IV V III Leon-Urban land complex IV V IV Liddell silt loam II I II Lucy loamy sand, 0 to 6 percent slopes II II II Lumbee, ALL II I II Lynchburg, ALL II I II Lynchburg-Urban land complex IV I IV Lynn Haven sand IV II IV Mandarin, ALL IV V IV
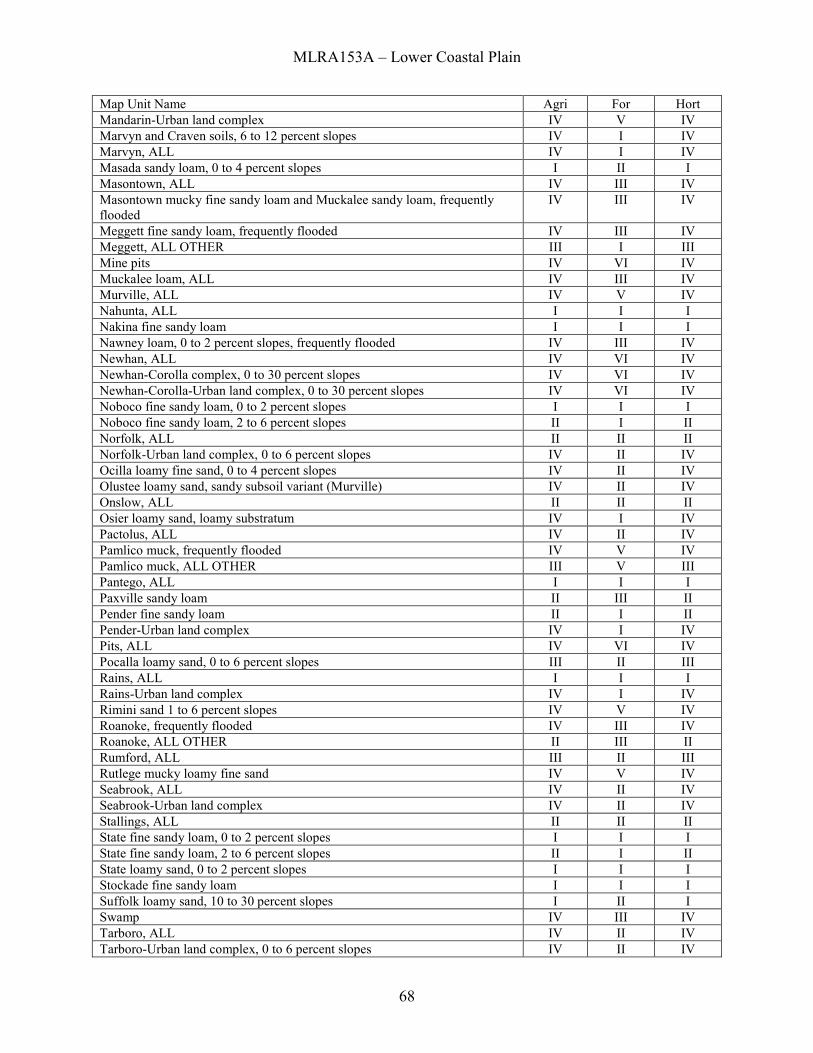
MLRA153A – Lower Coastal Plain
68
Map Unit Name Agri For Hort Mandarin-Urban land complex IV V IV Marvyn and Craven soils, 6 to 12 percent slopes IV I IV Marvyn, ALL IV I IV Masada sandy loam, 0 to 4 percent slopes I II I Masontown, ALL IV III IV Masontown mucky fine sandy loam and Muckalee sandy loam, frequently flooded
IV III IV
Meggett fine sandy loam, frequently flooded IV III IV Meggett, ALL OTHER III I III Mine pits IV VI IV Muckalee loam, ALL IV III IV Murville, ALL IV V IV Nahunta, ALL I I I Nakina fine sandy loam I I I Nawney loam, 0 to 2 percent slopes, frequently flooded IV III IV Newhan, ALL IV VI IV Newhan-Corolla complex, 0 to 30 percent slopes IV VI IV Newhan-Corolla-Urban land complex, 0 to 30 percent slopes IV VI IV Noboco fine sandy loam, 0 to 2 percent slopes I I I Noboco fine sandy loam, 2 to 6 percent slopes II I II Norfolk, ALL II II II Norfolk-Urban land complex, 0 to 6 percent slopes IV II IV Ocilla loamy fine sand, 0 to 4 percent slopes IV II IV Olustee loamy sand, sandy subsoil variant (Murville) IV II IV Onslow, ALL II II II Osier loamy sand, loamy substratum IV I IV Pactolus, ALL IV II IV Pamlico muck, frequently flooded IV V IV Pamlico muck, ALL OTHER III V III Pantego, ALL I I I Paxville sandy loam II III II Pender fine sandy loam II I II Pender-Urban land complex IV I IV Pits, ALL IV VI IV Pocalla loamy sand, 0 to 6 percent slopes III II III Rains, ALL I I I Rains-Urban land complex IV I IV Rimini sand 1 to 6 percent slopes IV V IV Roanoke, frequently flooded IV III IV Roanoke, ALL OTHER II III II Rumford, ALL III II III Rutlege mucky loamy fine sand IV V IV Seabrook, ALL IV II IV Seabrook-Urban land complex IV II IV Stallings, ALL II II II State fine sandy loam, 0 to 2 percent slopes I I I State fine sandy loam, 2 to 6 percent slopes II I II State loamy sand, 0 to 2 percent slopes I I I Stockade fine sandy loam I I I Suffolk loamy sand, 10 to 30 percent slopes I II I Swamp IV III IV Tarboro, ALL IV II IV Tarboro-Urban land complex, 0 to 6 percent slopes IV II IV
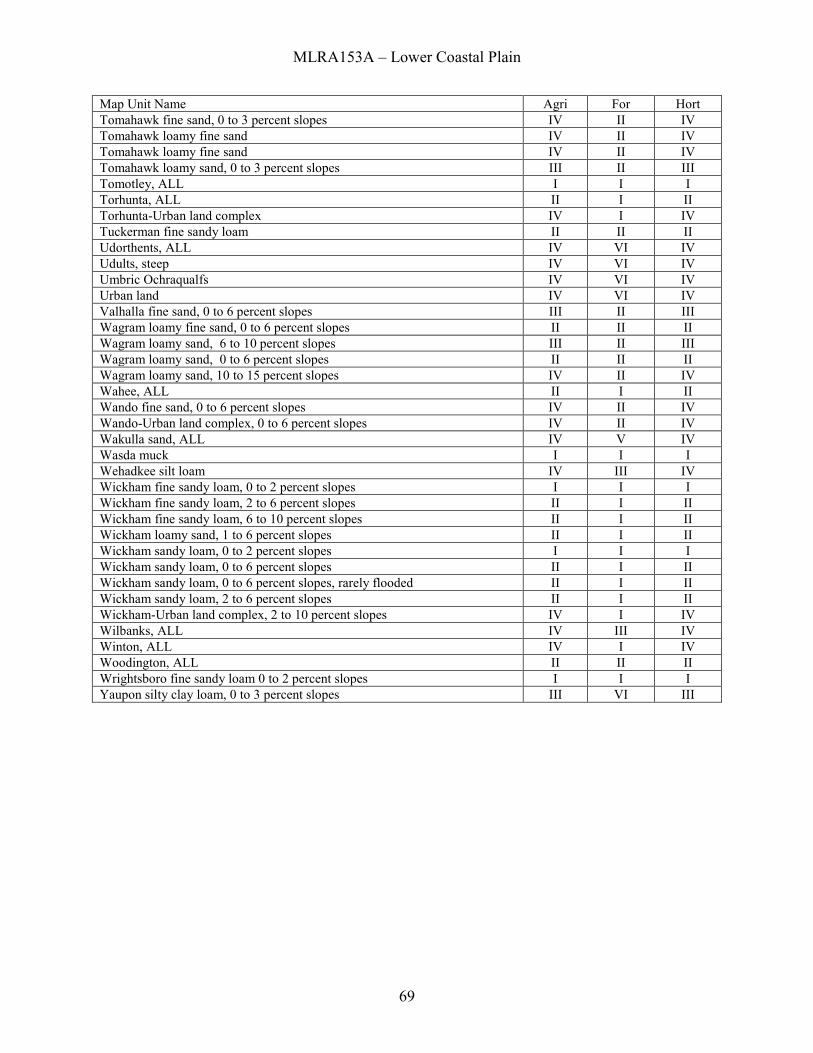
MLRA153A – Lower Coastal Plain
69
Map Unit Name Agri For Hort Tomahawk fine sand, 0 to 3 percent slopes IV II IV Tomahawk loamy fine sand IV II IV Tomahawk loamy fine sand IV II IV Tomahawk loamy sand, 0 to 3 percent slopes III II III Tomotley, ALL I I I Torhunta, ALL II I II Torhunta-Urban land complex IV I IV Tuckerman fine sandy loam II II II Udorthents, ALL IV VI IV Udults, steep IV VI IV Umbric Ochraqualfs IV VI IV Urban land IV VI IV Valhalla fine sand, 0 to 6 percent slopes III II III Wagram loamy fine sand, 0 to 6 percent slopes II II II Wagram loamy sand, 6 to 10 percent slopes III II III Wagram loamy sand, 0 to 6 percent slopes II II II Wagram loamy sand, 10 to 15 percent slopes IV II IV Wahee, ALL II I II Wando fine sand, 0 to 6 percent slopes IV II IV Wando-Urban land complex, 0 to 6 percent slopes IV II IV Wakulla sand, ALL IV V IV Wasda muck I I I Wehadkee silt loam IV III IV Wickham fine sandy loam, 0 to 2 percent slopes I I I Wickham fine sandy loam, 2 to 6 percent slopes II I II Wickham fine sandy loam, 6 to 10 percent slopes II I II Wickham loamy sand, 1 to 6 percent slopes II I II Wickham sandy loam, 0 to 2 percent slopes I I I Wickham sandy loam, 0 to 6 percent slopes II I II Wickham sandy loam, 0 to 6 percent slopes, rarely flooded II I II Wickham sandy loam, 2 to 6 percent slopes II I II Wickham-Urban land complex, 2 to 10 percent slopes IV I IV Wilbanks, ALL IV III IV Winton, ALL IV I IV Woodington, ALL II II II Wrightsboro fine sandy loam 0 to 2 percent slopes I I I Yaupon silty clay loam, 0 to 3 percent slopes III VI III
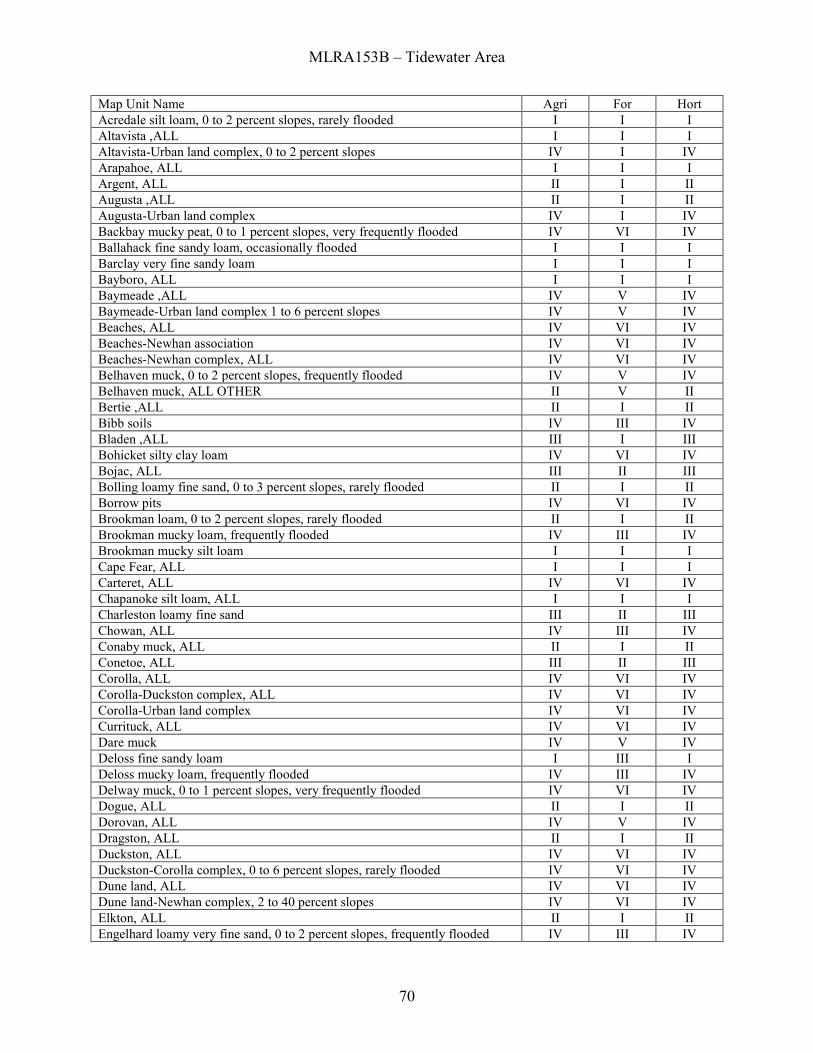
MLRA153B – Tidewater Area
70
Map Unit Name Agri For Hort Acredale silt loam, 0 to 2 percent slopes, rarely flooded I I I Altavista ,ALL I I I Altavista-Urban land complex, 0 to 2 percent slopes IV I IV Arapahoe, ALL I I I Argent, ALL II I II Augusta ,ALL II I II Augusta-Urban land complex IV I IV Backbay mucky peat, 0 to 1 percent slopes, very frequently flooded IV VI IV Ballahack fine sandy loam, occasionally flooded I I I Barclay very fine sandy loam I I I Bayboro, ALL I I I Baymeade ,ALL IV V IV Baymeade-Urban land complex 1 to 6 percent slopes IV V IV Beaches, ALL IV VI IV Beaches-Newhan association IV VI IV Beaches-Newhan complex, ALL IV VI IV Belhaven muck, 0 to 2 percent slopes, frequently flooded IV V IV Belhaven muck, ALL OTHER II V II Bertie ,ALL II I II Bibb soils IV III IV Bladen ,ALL III I III Bohicket silty clay loam IV VI IV Bojac, ALL III II III Bolling loamy fine sand, 0 to 3 percent slopes, rarely flooded II I II Borrow pits IV VI IV Brookman loam, 0 to 2 percent slopes, rarely flooded II I II Brookman mucky loam, frequently flooded IV III IV Brookman mucky silt loam I I I Cape Fear, ALL I I I Carteret, ALL IV VI IV Chapanoke silt loam, ALL I I I Charleston loamy fine sand III II III Chowan, ALL IV III IV Conaby muck, ALL II I II Conetoe, ALL III II III Corolla, ALL IV VI IV Corolla-Duckston complex, ALL IV VI IV Corolla-Urban land complex IV VI IV Currituck, ALL IV VI IV Dare muck IV V IV Deloss fine sandy loam I III I Deloss mucky loam, frequently flooded IV III IV Delway muck, 0 to 1 percent slopes, very frequently flooded IV VI IV Dogue, ALL II I II Dorovan, ALL IV V IV Dragston, ALL II I II Duckston, ALL IV VI IV Duckston-Corolla complex, 0 to 6 percent slopes, rarely flooded IV VI IV Dune land, ALL IV VI IV Dune land-Newhan complex, 2 to 40 percent slopes IV VI IV Elkton, ALL II I II Engelhard loamy very fine sand, 0 to 2 percent slopes, frequently flooded IV III IV
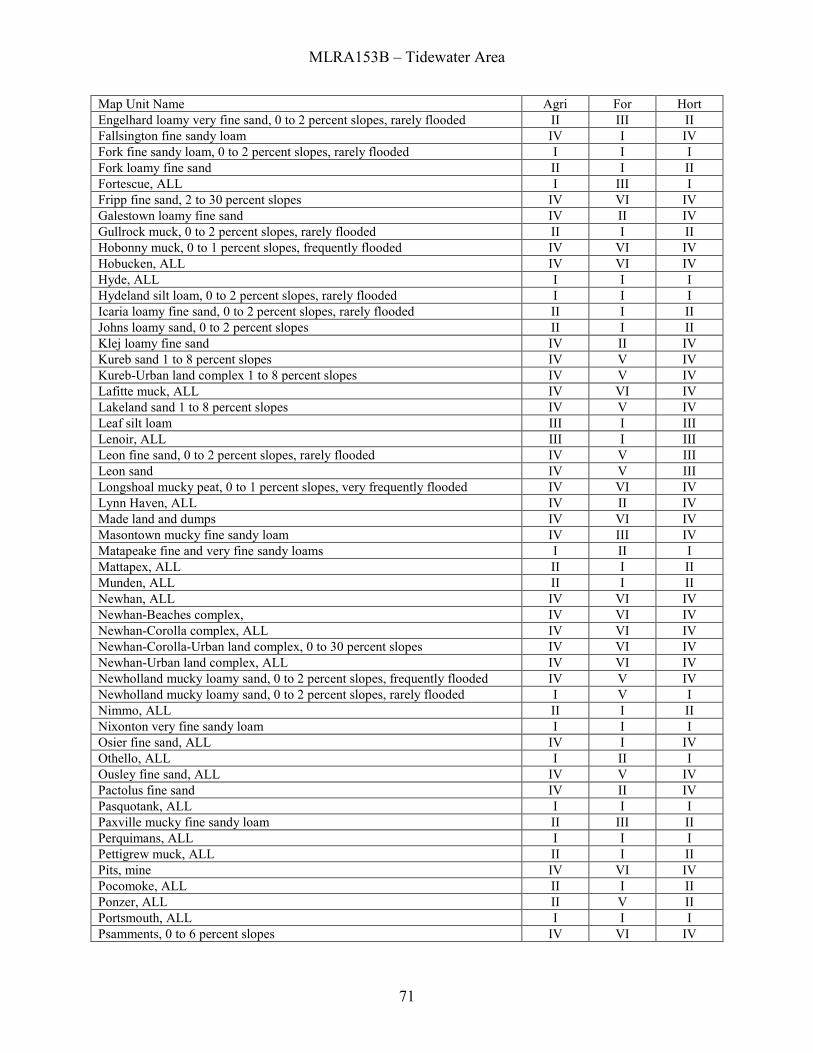
MLRA153B – Tidewater Area
71
Map Unit Name Agri For Hort Engelhard loamy very fine sand, 0 to 2 percent slopes, rarely flooded II III II Fallsington fine sandy loam IV I IV Fork fine sandy loam, 0 to 2 percent slopes, rarely flooded I I I Fork loamy fine sand II I II Fortescue, ALL I III I Fripp fine sand, 2 to 30 percent slopes IV VI IV Galestown loamy fine sand IV II IV Gullrock muck, 0 to 2 percent slopes, rarely flooded II I II Hobonny muck, 0 to 1 percent slopes, frequently flooded IV VI IV Hobucken, ALL IV VI IV Hyde, ALL I I I Hydeland silt loam, 0 to 2 percent slopes, rarely flooded I I I Icaria loamy fine sand, 0 to 2 percent slopes, rarely flooded II I II Johns loamy sand, 0 to 2 percent slopes II I II Klej loamy fine sand IV II IV Kureb sand 1 to 8 percent slopes IV V IV Kureb-Urban land complex 1 to 8 percent slopes IV V IV Lafitte muck, ALL IV VI IV Lakeland sand 1 to 8 percent slopes IV V IV Leaf silt loam III I III Lenoir, ALL III I III Leon fine sand, 0 to 2 percent slopes, rarely flooded IV V III Leon sand IV V III Longshoal mucky peat, 0 to 1 percent slopes, very frequently flooded IV VI IV Lynn Haven, ALL IV II IV Made land and dumps IV VI IV Masontown mucky fine sandy loam IV III IV Matapeake fine and very fine sandy loams I II I Mattapex, ALL II I II Munden, ALL II I II Newhan, ALL IV VI IV Newhan-Beaches complex, IV VI IV Newhan-Corolla complex, ALL IV VI IV Newhan-Corolla-Urban land complex, 0 to 30 percent slopes IV VI IV Newhan-Urban land complex, ALL IV VI IV Newholland mucky loamy sand, 0 to 2 percent slopes, frequently flooded IV V IV Newholland mucky loamy sand, 0 to 2 percent slopes, rarely flooded I V I Nimmo, ALL II I II Nixonton very fine sandy loam I I I Osier fine sand, ALL IV I IV Othello, ALL I II I Ousley fine sand, ALL IV V IV Pactolus fine sand IV II IV Pasquotank, ALL I I I Paxville mucky fine sandy loam II III II Perquimans, ALL I I I Pettigrew muck, ALL II I II Pits, mine IV VI IV Pocomoke, ALL II I II Ponzer, ALL II V II Portsmouth, ALL I I I Psamments, 0 to 6 percent slopes IV VI IV
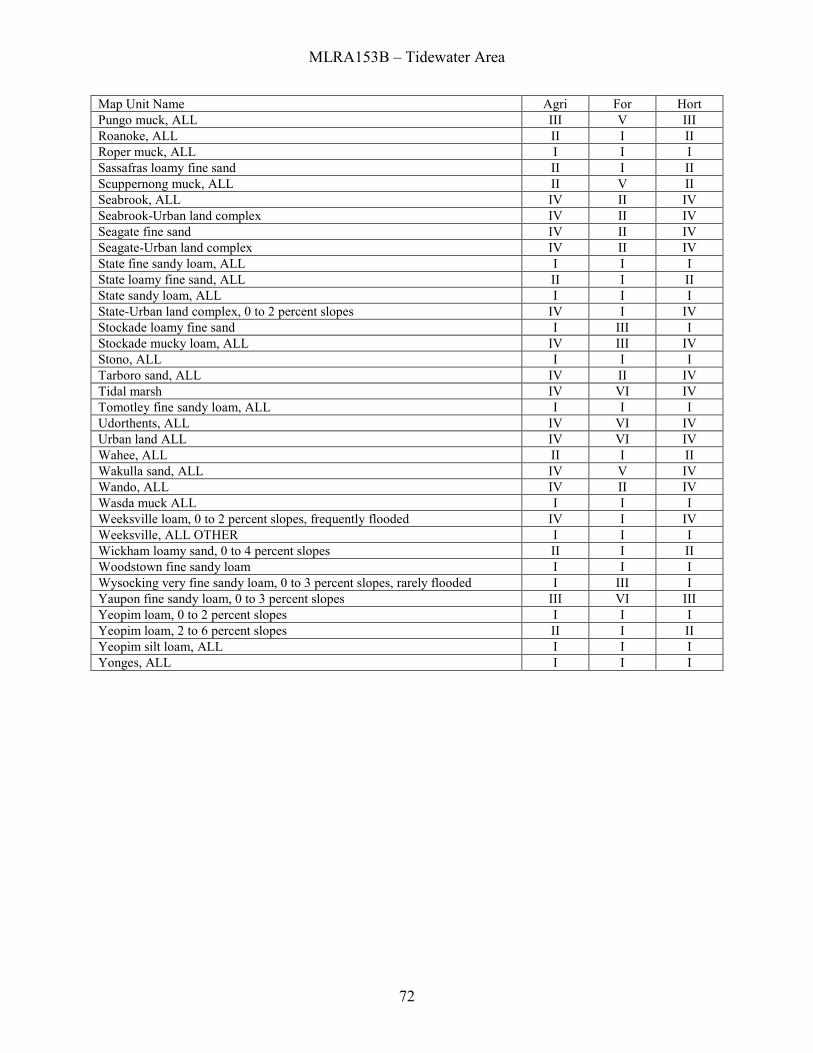
MLRA153B – Tidewater Area
72
Map Unit Name Agri For Hort Pungo muck, ALL III V III Roanoke, ALL II I II Roper muck, ALL I I I Sassafras loamy fine sand II I II Scuppernong muck, ALL II V II Seabrook, ALL IV II IV Seabrook-Urban land complex IV II IV Seagate fine sand IV II IV Seagate-Urban land complex IV II IV State fine sandy loam, ALL I I I State loamy fine sand, ALL II I II State sandy loam, ALL I I I State-Urban land complex, 0 to 2 percent slopes IV I IV Stockade loamy fine sand I III I Stockade mucky loam, ALL IV III IV Stono, ALL I I I Tarboro sand, ALL IV II IV Tidal marsh IV VI IV Tomotley fine sandy loam, ALL I I I Udorthents, ALL IV VI IV Urban land ALL IV VI IV Wahee, ALL II I II Wakulla sand, ALL IV V IV Wando, ALL IV II IV Wasda muck ALL I I I Weeksville loam, 0 to 2 percent slopes, frequently flooded IV I IV Weeksville, ALL OTHER I I I Wickham loamy sand, 0 to 4 percent slopes II I II Woodstown fine sandy loam I I I Wysocking very fine sandy loam, 0 to 3 percent slopes, rarely flooded I III I Yaupon fine sandy loam, 0 to 3 percent slopes III VI III Yeopim loam, 0 to 2 percent slopes I I I Yeopim loam, 2 to 6 percent slopes II I II Yeopim silt loam, ALL I I I Yonges, ALL I I I