2021 vacation home counties report
TRANSCRIPT

2021Vacation Home Counties ReportNational Association of REALTORS® Research Group

©2021 National Association of REALTORS®
All Rights Reserved. May not be reprinted in whole or in part without permission of the National Association of REALTORS®.
For questions about this report or reprint information, contact [email protected].
VACATION HOME COUNTIES REPORTJune 2021
LAWRENCE YUN, PhDChief Economist & Senior Vice President for Research
JESSICA LAUTZ, Doctor of Real EstateVice President of Demographics and Behavioral Insights
GAY CORORATON Senior Economist & Director of Housing and Commercial Research
HUA ZHONGData Scientist
MEREDITH DUNNResearch Manager

Report Highlights
The Vacation Home Counties 2021 Report seeks to analyze and contribute information on how the COVID-19 pandemic impacted the demand for vacation homes as government orders and advisories led to working from home, virtual schooling, and online meetings.
In conducting the analysis, NAR used Multiple Listing Service data in 1,205 counties, survey data from the monthly REALTORS® Confidence Index Survey, and publicly available data from the US Census Bureau.
Vacation home sales trendsThe share of vacation homes increased to 5.5% in 2020 and to an average of 6.7% during January-April 2021. Vacation home sales rose by 16.4% to 310,600 in 2020, outpacing the pace of total existing home sale of 5.6%. Sales are up 57.2% year-over-year during January-April 2021 compared to the 20% year-over-year changein total existing home sales. Vacation home sales averaged 412,500 during the first four months measured on a seasonally adjusted annual basis.
Overall, the housing market made a sharp rebound in the second half of 2020 that wiped out the losses in the first half of the year. However, the market was even hotter in what NAR delineated as vacation home counties, which are counties where vacant seasonal, occasional, or recreational use housing account for at least 20% of the housing stock.
Based on data from 1,205 counties (145 vacation home counties and 1,060 non-vacation home counties), existing home sales rose by 24.2% on average in vacation home counties, more than double the 11.2% annual pace in non-vacation home counties.
Home prices rose at a stronger pace in vacation home counties. The median existing home sales price typically rose by 14.2% in vacation home counties, compared to 10.1% in non-vacation home counties.
Properties typically stayed longer on the market in vacation home counties at 59 days compared to 30 days in non-vacation home counties in 2020. However, the time to sell a home in vacation home counties has speeded up more than in non-vacation home counties. In 2020, properties in vacation home counties typically sold more quickly by 13 days compared to 8 days in non-vacation home counties.
Vacation home buyers are more likely to pay all-cash. During January-April 2021, all-cash sales rose to 53% of all vacation home purchases, a higher share compared to less than 50% in past years. In comparison, 22% of all existing-home sales in January-April 2021 were cash sales.
3

Report Highlights
In 2020, 6.1% of workers 16 years old and over in vacation home counties typically worked from home compared to 4.3% of workers in non-vacation home counties. The opportunity to work from home could further raise the demand for vacation homes in future years.
A lower fraction of households in vacation home counties have broadband internet service, typically at 55.3%, compared to 56.7% in non-vacation home counties. Increasing the access to broadband service will be key to attracting vacation home buyers who want to use their vacation home as a workplace on weekends or for longer days during seasonal holidays and school breaks.
There was a noticeable increase in net domestic migration in vacation home counties in 2020. In 2020, the median number of net movers rose to 98,279, from 78,114 in 2019.
Top 1% Vacation Home Counties
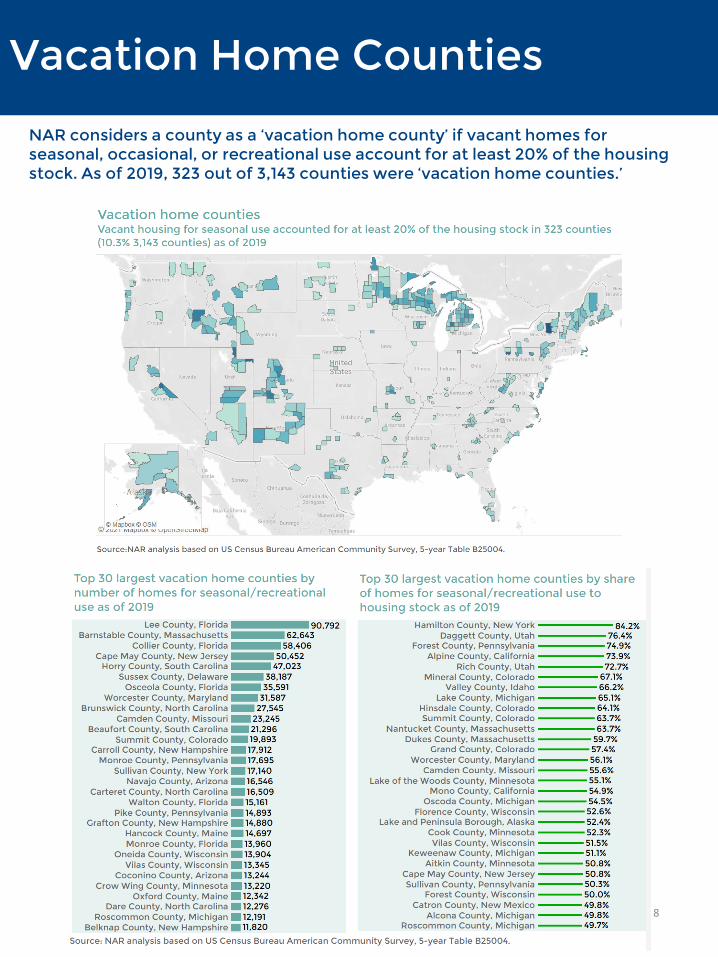
NAR classified a county as a vacation home county if the vacant housing for seasonal/occasion/recreational use accounted for at least 20% of the housing stock. Based on the US Census Bureau’s 2019 American Community Survey 5-year estimates, NAR identified 323 out of 3,143 counties (including independent cities) as vacation home counties, representing 10.3% of U.S. counties.
Of the 145 counties in which NAR has market data, NAR identified the top 1% (roughly 30 markets) hottest vacation home counties in 2020 based on sales growth, price growth, change in days on market, and the number of seasonal homes in 2019 to account for market size. An additional criteria for being in the top 1% was that the county had to meet all three criteria of having higher price, higher sales growth, and faster days on market. Only counties with non-zero sales during the years 2017 through 2020 and with at least 10 sales were included in the analysis.
The top 1% of vacation home counties were in 16 states. North Carolina had four vacation counties (Swain, Alleghany, Macon, Watauga); there were three each in New York (Greene, Sullivan, Hamilton), Vermont (Windham, Bennington, Windsor), Massachusetts (Dukes, Barnstable, Nantucket), and Michigan (Oscoda, Alcona, Clare); there were two each in Florida (Lee, Collier), Missouri (Hickory, Camden), and Maryland (Garrett, Worcester). Oklahoma, Maine, Arizona, New Jersey, Georgia, New Mexico, Delaware, and Minnesota each had one vacation home county that landed in the top 1% list.
4

Vacation Home Sales
Share of vacation homes to total sales rise to nearly 7% in January-April 2021Vacation home sales rose strongly in 2020 and in January-April 2021. With no other major event happening since 2020 other than the pandemic, the rise in vacation home sales can be reasonably attributed to the demand for vacation homes with people able to work from home, students schooled virtually, and as the population sought for safety and recreation away from urban areas.
According to a monthly survey of the sales transactions of REALTORS®1, the share of vacation home sales to total existing home sales rose to 5.5% in 2020 and to 6.7% in the first four months of 2021. As of April, the share was at 8%. In past years, vacation home sales accounted for about 5% of existing-home sales. Vacation home sales rose by 16.4% to 310,600 in 2020, outpacing the 5.6% growth in total existing home sales and by 57.2% year-over-year during January-April 202 compared to the 20% growth in existing home sales. Salesare averaging at 412,500 on a seasonally adjusted annual basis during the firstfour months of 2021.
1 REALTORS® Confidence Index (RCI) Survey. The RCI survey is a random survey sent to 50,000 REALTORS®, of which about 5,000 respond to the survey, and of which about 1,500 to 2,000 reported they had a transaction during the month. The survey asks about the most recent transaction during the month and the responses can be considered as a random sample. 5

Vacation Home Buyers
53% of vacation home sales were all-cash
Vacation home buyers are more likely to pay all-cash. During January-April 2021, all-cash sales rose to 53% of all vacation home purchases, a higher share compared to less than 50% in past years. In comparison, 22% of all existing-home sales in January-April 2021 were cash sales.
In the monthly surveys, REALTORS® have reported that buyers with the wherewithal are paying all-cash to increase the attractiveness of their offer in a severely competitive market characterized by the lowest level of inventory of homes for sale since 1968. As of April, the inventory of unsold homes stood at 1.16 million nationally, down 20.5% from one year ago, which is equivalent to just 2.2 months of the monthly pace of demand. A balanced market needs six months of supply.
77% of vacation home buyers made a down payment of at least 20%
Vacation home buyers are more likely to put down a higher down payment compared to all existing-home buyers. Seventy-seven percent of vacation home buyers put down at least 20% down payment compared to just 49% among all existing-home buyers.
6

Vacation Home Buyers
21% of vacation home buyers purchased a condo/coop
During January-April 2020, 21% of vacation home buyers purchased an existing condominium or coop, a higher share compared to nearly 12% among all existing home buyers. The share of condo/coop purchases to vacation home sales has trended downwards from 30% in 2016 to 21% as of January-April 2021. In 2020 and 2021, the decline could be due to the reluctance of vacation home buyers to purchase condominiums for health safety reasons as well as the expectation that renting out a condominium (when they are not using the property) could be more difficult with the COVID-19 pandemic still raging.
4% of vacation home buyers were first-time buyers
Not every vacation home buyer is a second home buyer. About 4% of vacation home buyers were first-time buyers.
7
Vacation Home Counties
8
NAR considers a county as a ‘vacation home county’ if vacant homes for seasonal, occasional, or recreational use account for at least 20% of the housing stock. As of 2019, 323 out of 3,143 counties were ‘vacation home counties.’

The housing market is hot in vacation home counties compared to non-vacation home countiesOverall, the housing market made a sharp rebound in the second half of 2020 that wiped out the losses in the first half of the year. However, the market was even hotter in what NAR delineated as vacation home counties, which are counties where vacant seasonal, occasional, or recreational use housing account for at least 20% of the housing stock. Based on the 2019 5-year US Census Bureau’s American Community Survey, NAR identified 323 out of 3,143 counties (including independent cities) as vacation home counties, representing 10.3% of U.S. counties.
Based on Multiple Listing Service (MLS) data in 145 vacation home counties and 1,060 non-vacation home counties, existing home sales typically rose by 24.2% on average in vacation home counties, more than double the 11.2% annual pace in non-vacation home counties.2
Home prices rose at a stronger pace in vacation home counties. The median existing home sales price typically rose by 14.2% in vacation home counties, compared to 10.1% in non-vacation home counties.
Properties typically stayed longer on the market in vacation home counties at 59 days compared to 30 days in non-vacation home counties in 2020. However, the time to sell a home in vacation home counties has speeded up more than in non-vacation home counties. In 2020, properties in vacation home counties typically sold more quickly by 13 days compared to 8 days in non-vacation home counties.
2 NAR analysis of Multiple Listing Service (MLS) data
9
Vacation Home Counties

Sales growth in vacation home counties outpaced sales growth in non-vacation home counties in 2020
In 2020, existing home sales typically rose at a faster pace in vacation home counties compared to non-vacation home counties. Home sales typically rose by double-digit pace in 2020 in vacation home counties except in the Pacific division.
The strongest sales growth was in the South Atlantic division (Delaware, Maryland, Virginia, West Virginia, North Carolina, South Carolina, Georgia, Florida, and the District of Columbia), with home sales typically up nearly 31% in the vacation home counties in this division.
The second highest sales growth was in the Middle Atlantic division (New York, New Jersey, and Pennsylvania), with home sales typically up 27.8% in the vacation home counties in this division.
In the West South Central division (Arkansas, Louisiana, Oklahoma, and Texas), sales typically rose by 25.7% in the vacation home counties. In the New England division (Connecticut, Maine, Massachusetts, New Hampshire, Rhode Island, and Vermont), sales typically rose 25.3% in the vacation home counties.
10
Vacation Home Counties
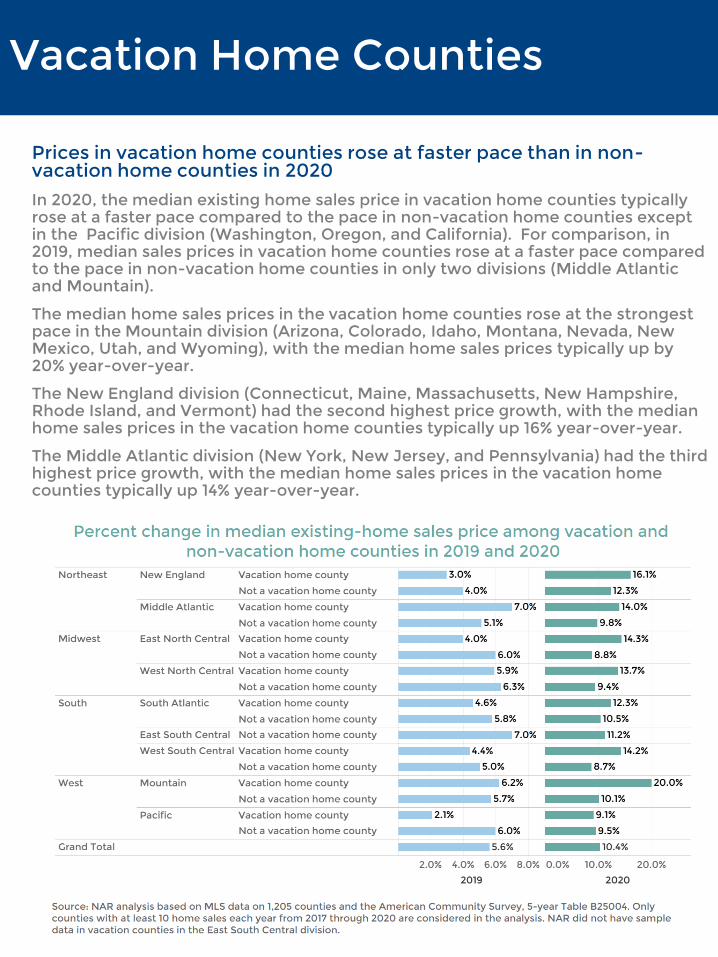
Prices in vacation home counties rose at faster pace than in non-vacation home counties in 2020In 2020, the median existing home sales price in vacation home counties typically rose at a faster pace compared to the pace in non-vacation home counties except in the Pacific division (Washington, Oregon, and California). For comparison, in 2019, median sales prices in vacation home counties rose at a faster pace compared to the pace in non-vacation home counties in only two divisions (Middle Atlantic and Mountain).
The median home sales prices in the vacation home counties rose at the strongest pace in the Mountain division (Arizona, Colorado, Idaho, Montana, Nevada, New Mexico, Utah, and Wyoming), with the median home sales prices typically up by 20% year-over-year.
The New England division (Connecticut, Maine, Massachusetts, New Hampshire, Rhode Island, and Vermont) had the second highest price growth, with the median home sales prices in the vacation home counties typically up 16% year-over-year.
The Middle Atlantic division (New York, New Jersey, and Pennsylvania) had the third highest price growth, with the median home sales prices in the vacation home counties typically up 14% year-over-year.
11
Vacation Home Counties

Homes sold faster in vacation home counties than in non-vacation home counties in 2020
In nearly all U.S. divisions, properties for sale in vacation home counties typically stayed for fewer days on the market in 2020 compared to properties for sale in non-vacation home counties.
In the New England division (Connecticut, Maine, Massachusetts, New Hampshire, Rhode Island, and Vermont), properties in vacation home counties typically sold 24 days faster compared to 9 days in non-vacation home counties.
In the South Atlantic division (Delaware, Maryland, Virginia, West Virginia, North Carolina, South Carolina, Georgia, Florida, and the District of Columbia), properties in vacation home counties typically sold 15 days faster compared to 9 days in non-vacation home counties.
In the West South Central division ( Texas, Arkansas, Louisiana, Oklahoma) and in the Pacific division (Washington, Oregon, and California), properties typically sold 14 days faster in vacation home counties compared to 6 and 9 days respectively in the non-vacation home counties in these divisions.
12
Vacation Home Counties

Top 1% Vacation Home Counties
3 NAR defined a vacation home county as one where vacant homes for seasonal use accounted for at least 20% of the housing stock (19.5% and above are rounded to 20%). In calculating the ranking, NAR considered four factors: number of vacant seasonal homes (size effect), y/y percent change in home sales, y/y percent change in the median sales price, y/y change in days on market. Then, only counties that had higher sales and prices and faster days on market in 2020 were selected to be a candidate hot market (92 counties). An average z-score is then calculated on each of the four variables. The higher the z-score, the higher is the ranking. All these top 30 markets had positive z-scores (upper half of distribution). Small vacation counties can exhibit large fluctuations in sales and prices as a smaller base can lead to large percentage changes.
Top 1% vacation home counties are scattered across 16 states
Of the 145 counties that NAR has market, it identified the top 1% (roughly 30 markets) hottest vacation home counties in 2020 based on sales growth, price growth, change in days on market, and the number of seasonal homes in 2019 to account for market size. An additional criteria for being in the top 1% was that the county had to meet all three criteria of having higher price, higher sales growth, and faster days on market. Only counties with non-zero sales during the years 2017 through 2020 and with at least 10 sales were included in the analysis.3
The top 1% of vacation home counties were in 16 states. North Carolina had four vacation counties (Swain, Alleghany, Macon, Watauga); there were three each in New York (Greene, Sullivan, Hamilton), Vermont (Windham, Bennington, Windsor), Massachusetts (Dukes, Barnstable, Nantucket), and Michigan (Oscoda, Alcona, Clare); there were two each in Florida (Lee, Collier), Missouri (Hickory, Camden), Maryland (Garrett, Worcester). Oklahoma, Maine, Arizona, New Jersey, Georgia, New Mexico, Delaware, and Minnesota each had one vacation home county that landed in the top 1% list.

Top 10 Vacation Home Counties
Lee County, Florida is located in Southwest Florida on the Gulf Coast. Fort Myers and Cape Coral are the popular destination spots. It has the largest number of seasonal vacation homes, at 90,792, which accounts for 23% of the housing stock. In 2020, home sales rose 10%, the median sales price rose 12.3%, and properties sold 45 days faster than in 2019. Home prices are in the mid-price range with the median sales price at $247,000.
Oscoda County, Michigan is located on the northern side of the Au Sable River that runs into Lake Huron. Detroit is about four hours away. It boasts of the Huron-Manistee National Forests, Oscoda Beach Park, Clark Marsh, and Turtle Marsh. It is one of the smallest vacation home counties with 5,028 seasonal vacant homes that account for 54.5% of the housing stock. In 2020, home sales rose 53.8%, the median sales price rose 79.2%, and properties sold 30 days faster than in 2019. It is one of the most inexpensive vacation counties with a median sales price of $107,500.
Swain County, North Carolina is located on the far western border of North Carolina. Knoxville, Tennessee is about two hours away. The Great Smokey Mountains National Park is a major draw for tourists and homebuyers. Another draw is Dollywood Parks and Resorts. It is one of the smallest vacation counties with 2,066 seasonal vacant homes that account for 22.9% of its housing stock. In 2020, home sales rose 140.7%, the median sales price rose 19.8%, and properties sold 48 days faster than in 2019. Home prices are in the mid-price range with the median sales price at $245,000.
Collier County, Florida is located on the Gulf of Mexico in Southwest Florida. Popular natural wonders are the Everglades National Park, Naples Zoo, and the Bird Garden. It is the third largest vacation home county with 58,406 seasonal vacant homes which account for 27.2% of its housing stock. In 2020, home sales rose 4.6%, the median sales price rose 10.2%, and properties sold 53 days faster than in 2019. Home prices are still in the mid-price range with the median sales price at $314,000.
Dukes County, Massachusetts consists of the island of Martha’s Vineyard, Chappaquiddick Island, the Elizabeth Islands, the island of Nomans Land and other islets. It has 10,681 seasonal vacant homes which account for 59.7% of its housing stock. In 2020, home sales rose 13.8%, the median sales price rose 63.6%, and properties sold 38 days faster than in 2019. It is the second most expensive vacation home county with a median sales price of $1.4 million in 2020.
14

Top 10 Vacation Home Counties
Alleghany County, North Carolina is located in the Blue Ridge Mountains of Northwestern North Carolina, so its main attraction is the Blue Ridge Mountains and its parks and rivers. It is a small vacation home county with 2,432 vacation homes that account for 29.7% of its housing stock. In 2020, home sales rose 248%, the median sales price rose 9.9%, and properties sold six days faster than in 2019. Home prices are in the mid-price range with the median sales price at $219,900.
Garrett County, Maryland is the westernmost county of Maryland. It is in the Appalachian Mountains and is drained by the Potomac and Youghiogheny rivers, so it offers vacation spots for hiking, kayaking, and camping. It is a small vacation county with 4,623 seasonal homes that make up 23.9% of its housing stock. In 2020, home sales rose 35.8%, the median sales price rose 35.4%, and properties sold 48 days faster than in 2019. Home prices are in the mid-price range with the median sales price at $325,000.
Barnstable County, Massachusetts consists mainly of Cape Cod and several small islands. It was formed as part of the Plymouth Colony in 1865. It is the second largest vacation home county, with 62,643 seasonally vacant homes that make up 38.3% of its housing stock. In 2020, home sales rose 20.4%, the median sales price rose 16.1%, and properties sold 20 days faster than in 2019. Home prices are bordering in the high price range with the median sales price at $475,000, although home prices are relatively affordable compared to the homes in Dukes and Nantucket.
Alcona County, Michigan is in the Northeastern Lower Peninsula with six miles of Lake Huron coastline. It is heavily forested by the Huron-Manistee National Forest. Detroit is about four hours away. It is one of the smallest vacation home counties, with 5,573 seasonally vacant homes that make up 49.8% of its housing stock. In 2020, home sales rose 80.4%, the median sales price rose 51.5%, and properties sold 10 days faster than in 2019. Houses are inexpensive, with the median sales price at $150,000.
Macon County, North Carolina is in western North Carolina. The Nantahala River, one of the most popular whitewater rafting destinations, runs through it. It’s a relatively small vacation home county with 7,633 vacation homes that account for 29.8% of its housing stock. In 2020, home sales rose 155.3%, the median sales price rose 30.6%, and properties sold two days faster than in 2019. Houses are in the mid-price range, with the median sales price at $320,000.
15

Other Top Vacation Home Counties in 2020

A higher fraction of the workforce work from home in vacation home counties, but a lower share of households have broadband internet
In 2020, across all nine divisions, the fraction of the workforce that work from home is typically higher in the vacation home counties than in the non-vacation home counties. In the vacation home counties, 6.1% of workers 16 years old and over typically worked from home compared to 4.3% of workers in non-vacation home counties. As of May 2021, 16.6% of employed workers 16 years old and over worked from home, and among workers with computer and mathematical occupations, 55% worked from home.4 The opportunity to work from home could further raise the demand for vacation homes in future years.
However, a slightly lower fraction of households in vacation home counties have broadband internet service, typically at 55.3%, compared to 56.7% in non-vacation home counties. Increasing the access to broadband service will be key to attracting vacation home buyers who want to use their vacation home as a workplace on weekends or for longer days during seasonal holidays and school breaks.
The New England division (Maine, Vermont, New Hampshire, Massachusetts, Connecticut and Rhode Island) vacation home counties have the highest share of households with broadband internet service, typically at 69.6%, although this fraction is still below the 74.5% fraction of households that typically have broadband internet service in non-vacation home counties.
17
Vacation Home Counties
4 Source: Bureau of Labor Statistics

Net domestic migration rose in vacation home counties in 2020
There was a noticeable increase in net domestic migration in vacation home counties in 2020 as the median number of net movers rose to 98,279 from 78,114 in 2019. Only the Middle Atlantic division (New York, New Jersey, Pennsylvania) had a net outflow in both vacation and non-vacation home counties.
The number of people who move into a vacation home county is an indicator of the attractiveness of a county as a place to live and work in. The opportunity to work from home could further raise the demand for homes in the affordable vacation home counties with good broadband internet service in future years, with workers purchasing a home either for vacation use or as a primary residence among workers who are able to work from home full-time or permanently.
Total net domestic migration of the vacation and non-vacation counties should be zero but there's a slight discrepancy because Chugach Census Area (Alaska) is not reported in the list of counties in the 2019 American Community Survey Table B25004 but it is reported in the US Census Bureau's list of counties in the July 2020 Vintage Population Estimates.
18
Vacation Home Counties

Vacation Home Counties
Vacation home counties with the largest net domestic migration
Vacation home counties were impacted differently by the pandemic in 2020, with some counties experiencing net domestic migration and some counties experiencing a net outflow.
Lee County, Florida (popular vacation spot is Naples/Fort Myers) had the largest net domestic migration. Horry County, South Carolina (popular vacation spot is Myrtle Beach) came in second, followed by Sussex County, Delaware (popular vacation spot is Rehoboth Beach), Brunswick County, North Carolina (popular spot is Brunswick Landing) and Osceola County, Florida (popular spot is Walt Disney World®).
On the other hand, Coconino County, Arizona (popular spot is Grand Canyon); Eagle County and Summit County in Colorado (popular destination is Breckenridge), and Allegany County, New York (popular spot is Allegany River trails) had net domestic out-migration.
19

The National Association of REALTORS® is America’s largest trade association, representing more than 1.4 million members, including NAR’s institutes, societies and councils, involved in all aspects of the real estate industry. NAR membership includes brokers, salespeople, property managers, appraisers, counselors and others engaged in both residential and commercial real estate. The term REALTOR® is a registered collective membership mark that identifies a real estate professional who is a member of the National Association of REALTORS® and subscribes to its strict Code of Ethics. Working for America's property owners, the National Association provides a facility for professional development, research and exchange of information among its members and to the public and government for the purpose of preserving the free enterprise system and the right to own real property.
NATIONAL ASSOCIATION OF REALTORS® RESEARCH GROUP
The Mission of the NATIONAL ASSOCIATION OF REALTORS® Research Group is to produce timely, data-driven market analysis and authoritative business intelligence to serve members, and inform consumers, policymakers and the media in a professional and accessible manner.
To find out about other products from NAR’s Research Group, visit www.nar.realtor/research-and-statistics
500 New Jersey Avenue, NWWashington, DC 20001202.383.1000