2021 third quarter report
TRANSCRIPT

Q3 2021 THIRD QUARTER REPORT
Sherritt International Corporation For the three and nine months ended September 30, 2021

Sherritt International Corporation 1
For immediate release
Sherritt Outlines Moa JV Expansion Strategy and Reports Q3 Results
NOT FOR DISTRIBUTION TO U.S. NEWSWIRE SERVICES OR FOR DISSEMINATION IN THE U.S.
Toronto – November 3, 2021 – Sherritt International Corporation (“Sherritt”, the “Corporation”, the “Company”) (TSX: S), a world leader in the mining and hydrometallurgical refining of nickel and cobalt from lateritic ores, today reported its financial results for the three and nine months ended September 30, 2021, and announced it is embarking on an expansion strategy with its Cuban partners to capitalize on the growing demand for high purity nickel and cobalt being driven by the accelerated adoption of electric vehicles. The strategy, which will build on the 26-year successful track record of the Moa Joint Venture, centres on growing finished nickel and cobalt production by 15 to 20% per year from the 34,876 tonnes produced in 2020 and extending the life of mine at Moa beyond 2040 through the conversion of mineral resources into reserves using an economic cut-off grade.
“Backed by a strengthened balance sheet and a favourable outlook for nickel and cobalt, we are moving forward with a multi-pronged strategy focused on generating incremental cash flow and transformative growth,” said Leon Binedell, President and CEO of Sherritt International Corporation. “In addition to commercializing projects developed by Sherritt Technologies, our growth will centre on brownfield opportunities, where working in close collaboration with our Cuban partners, we plan to increase finished nickel and cobalt production and extend Moa’s mine life. Preliminary economics of the brownfield projects identified are quite encouraging and suggest a high rate of return on investment and low capital intensity.
“By taking advantage of embedded growth opportunities, Sherritt will be better positioned to capitalize on the expected strong demand for green metals in the coming years and significantly grow shareholder value.”
Expansion plans for the Moa JV consist of a multi-phased approach, and includes completion of the new slurry preparation plant and other expansion circuits at Moa, installation of new equipment and upgrading existing equipment at the refinery in Fort Saskatchewan, Alberta, updating the 43-101 Technical Report published in June 2019 that reported more than 158 million tonnes of measured and indicated resources at 1% nickel and 0.13% cobalt at Moa to reflect production based on economic rather than a fixed, cut-off grade, and leveraging the expertise of Sherritt Technologies to optimize mine planning and performance.
Sherritt and its Cuban partners are currently finalizing timelines, capital estimates, and economics of the various projects, including identifying financing alternatives. Sherritt expects to provide an update on the rollout of the Moa JV expansion strategy by the end of the first quarter of 2022.
SELECTED Q3 2021 DEVELOPMENTS
Received US$10 million in distributions from the Moa JV representing Sherritt’s 50% share of distributions declared by the Moa JV. Through September 30, Sherritt has received a total of US$43 million in direct and re-directed distributions from the Moa JV and its partner.
Adjusted EBITDA(1) was $17.6 million, up 14% from last year. The higher total was indicative of improved nickel and cobalt prices, but offset by increased input costs, $3.1 million in other contractual benefits expenses and $0.5 million of accelerated share-based compensation expenses, both of which relate to the departure of senior executives.
Sherritt’s share of finished nickel production at the Moa JV was 2,908 tonnes, down 22% from last year while Sherritt’s share of finished cobalt production was 334 tonnes, down 18%. Finished nickel and cobalt production were negatively impacted by a combination of factors, including the spread of COVID-19, timing of the full-facility shutdown at the refinery in Fort Saskatchewan, Alberta, and unplanned maintenance activities that temporarily disrupted production activities. All production has since resumed to normal, and Sherritt has adjusted its production guidance for 2021 to reflect Q3 developments and anticipated production for the balance of the year.
Net Direct Cash Cost (NDCC)(1) at the Moa JV was US$4.53/lb, up 12% from last year. Despite a 52% improvement in cobalt by-product credits, unit costs per pound of finished nickel sold were impacted by the 126% increase in sulphur prices, 69% increase in fuel oil prices, and 59% increase in natural gas prices as well as by lower sales volumes. NDCC guidance for 2021 remains unchanged at US$4.25 to $4.75 per pound of nickel sold as the recent rise in cobalt prices partially offsets the rise in input costs.
Received US$6.4 million in Cuban energy payments. Sherritt anticipates continued variability in the timing of collections through the remainder of 2021, and is working with its Cuban partners to ensure timely receipts.

2021 Third Quarter Report Press Release
2 Sherritt International Corporation
Sherritt released its 2020 Sustainability Report that featured a number of upgraded environmental, social, and governance (ESG) targets, including achieving net zero greenhouse emissions by 2050, obtaining 15% of overall energy from renewable sources by 2030, reducing nitrogen oxide emission intensity by 10% by 2024, and increasing the number of women in the workforce to 36% by 2030.
Named Yasmin Gabriel as Chief Financial Officer, Greg Honig as Chief Commercial Officer, and Chad Ross as Chief Human Resources Officer as part of senior leadership changes. The appointments underscore Sherritt’s two-pronged growth strategy focused on capitalizing on the accelerating demand for high-purity nickel and cobalt from the electric vehicle industry and commercializing innovative process technology solutions for resources companies looking to improve their environmental performance and increase economic value.
DEVELOPMENTS SUBSEQUENT TO THE QUARTER END
Sherritt amended its syndicated revolving-term credit facility with its lenders, increasing the maximum amount of credit available to $100 million from $70 million and extending the maturity to April 2024. Under the new terms, borrowings on the credit facility are available to fund capital as well as for working capital purposes. Spending on capital expenditures cannot exceed $75 million in a fiscal year. Capital expenditure restrictions do not apply to planned spending of Moa Nickel S.A. The increase in credit facility is indicative of Sherritt’s strengthened financial position and favorable outlook in light of improved nickel market fundamentals.
Environmental rehabilitation obligations (ERO) held by Sherritt’s Spanish Oil and Gas operations were secured by a parent company guarantee of €31.5 million ($46.7 million) until December 31, 2023. Unlike the $47 million letter of credit issued previously to support the ERO and backed by Sherritt’s credit facility, the new guarantee has no impact on the Corporation’s available liquidity.
Planned capital spending at the Moa JV for 2021 has been reduced to US$35 million from US$44 million (Moa JV 50% basis Fort Site 100% basis). The reduction in planned capital spending reflects operational challenges experienced through September 30, including freight and order delays caused by COVID-19.
(1) For additional information see the Non-GAAP and other financial measures section of this press release.
Q3 2021 FINANCIAL HIGHLIGHTS
For the three months ended For the nine months ended 2021 2020 2021 2020$ millions, except per share amount September 30 September 30 Change September 30 September 30 Change
Revenue 20.7 24.9 (17%) $ 73.6 $ 91.6 (20%)
Combined revenue(1) 120.2 115.3 4% 414.2 361.1 15%
Loss from operations and joint venture (10.8) (124.7) 91% (12.0) (163.2) 93%
Net (loss) earnings from continuing operations (15.5) 11.4 (236%) (27.8) (36.4) 24%
Net (loss) earnings for the period (16.2) 228.5 (107%) (32.5) 71.8 (145%)
Adjusted EBITDA(1) 17.6 15.5 14% 65.8 28.2 133%Cash provided by continuing operations for operating activities 16.2 25.3 (36%) 14.7 35.3 (58%)Combined free cash flow(1) 19.3 27.1 (29%) 40.9 29.5 39%Average exchange rate (CAD/US$) 1.260 1.332 (5%) 1.251 1.354 (8%)
Net (loss) earnings from continuing operations ($ per share) (0.04) 0.03 (233%) (0.07) (0.09) 22%
(1) For additional information see the Non-GAAP and other financial measures section.
2021 2020
$ millions, as at September 30 December 31 Change
Cash, cash equivalents and short term investments $ 163.4 $ 167.4 (2%)Loans and borrowings 444.7 441.4 1%
Cash, cash equivalents, and short-term investments at September 30, 2021 were $163.4 million, up from $153.8 million at June 30, 2021. The increase was due to a number of developments in the quarter, including the receipt of US$6.4 million in Cuban energy payments, strong fertilizer presales of $13.9 million, and the receipt of US$10 million in distributions from the Moa JV. The increase was partly offset by sustaining capital expenditures of $3.6 million.

Sherritt International Corporation 3
Since the start of 2021, Sherritt has received a total of US$43 million in direct and re-directed distributions from the Moa JV and its partner. Sherritt anticipates receipt of additional distributions from the Moa JV through to the end of 2021 based on prevailing nickel and cobalt prices, planned capital spend, and liquidity requirements for the Moa JV.
As a result of the restructuring of its balance sheet in August 2020 that eliminated $30 million in cash interest payments annually, Sherritt did not have any cash interest payments in Q3 2021.
Collections against overdue amounts owed to Sherritt by its Cuban energy partners continue to be adversely impacted by a combination of factors, including the ongoing effects of U.S. sanctions against Cuba and Cuba’s reduced access to foreign currency on account of the global pandemic which has eliminated almost all tourism revenue over the past 18 months. Cuba has announced plans to fully open its borders to international travelers on November 15, 2021 in advance of the winter travel season. As at October 31, 88% of Cuba’s population had received at least one vaccine dose and 64% have been fully vaccinated(1).
Total overdue scheduled receivables at September 30, 2021 were US$152.5 million, down from US$154.7 million at June 30, 2021. Subsequent to quarter end, Sherritt received US$2.5 million in Cuban energy payments. Sherritt anticipates variability in the timing and the amount of energy payments in the near term, and continues to work with its Cuban partners to ensure timely receipt of energy payments. With the opening up of Cuba’s borders, the resumption of international tourism and the influx of foreign currency, Sherritt anticipates economic conditions in Cuba to improve in 2022.
As at September 30, 2021, Sherritt held cash, cash equivalents and short-term investment in Canada totaling $82.1 million, up from $77.4 million at June 30, 2021.
(1) Source: Our World in Data.
Adjusted net loss(1)
2021 2020
For the three months ended September 30 $ millions $/share $ millions $/share Net (loss) earnings from continuing operations (15.5) (0.04) 11.4 0.03
Adjusting items: Unrealized foreign exchange loss (gain) - continuing operations 7.9 0.02 (3.6) (0.01)Other contractual benefits expense 3.1 0.01 - -Losses on commodity put options 0.4 - - -Gain on debenture exchange - - (143.4) (0.36)Impairment loss of Oil assets - - 115.6 0.29Realized foreign exchange gain due to Cuban currency unification (10.0) (0.03) - -Other 0.7 0.01 3.9 0.01
Adjusted net loss from continuing operations (13.4) (0.03) (16.1) (0.04) 2021 2020
For the nine months ended September 30 $ millions $/share $ millions $/share Net loss from continuing operations (27.8) (0.07) (36.4) (0.09)
Adjusting items: Unrealized foreign exchange gain - continuing operations (3.3) (0.01) (8.7) (0.02)Severance and other contractual benefits expense 5.5 0.02 - -Losses on commodity put options 5.5 0.02 - -Gain on repurchase of notes (2.1) (0.01) - -Gain on debenture exchange - - (143.4) (0.36)Impairment loss of Oil assets - - 115.6 0.29Realized foreign exchange gain due to Cuban currency unification (10.0) (0.03) - -Moa JV expansion loans receivable ACL revaluation - - (6.4) (0.02)Other 3.5 0.01 6.3 0.02
Adjusted net loss from continuing operations (28.7) (0.07) (73.0) (0.18)
(1) For additional information see the Non-GAAP and other financial measures section.
Adjusted net loss from continuing operations was $13.4 million, or $0.03 per share, for the quarter ended September 30, 2021. In the same period last year adjusted net loss was $16.1 million or $0.04 per share. Sherritt’s adjusted net loss for Q3 2021 excluded an unrealized foreign exchange loss of $7.9 million, the realized gain on Cuban currency unification, and other contractual benefits expense of $3.1 million. In Q3 2020, the primary adjustments, in addition to an unrealized foreign exchange gain of $3.6 million, included the gain on debenture exchange offset by the impairment of oil assets related to Block 10.

2021 Third Quarter Report Press Release
4 Sherritt International Corporation
METALS MARKET
Nickel
Nickel prices hit a seven-year high in Q3, climbing to US$9.24/lb on September 10. The price increase was driven by improving market fundamentals, including strong demand from across multiple industries, reduced inventory levels, and supply disruptions caused in part by COVID-19. By the end of the quarter, nickel prices retreated closing at US$8.25/lb on September 30 on concerns of a potential debt crisis in China as well as by speculation that stainless steel production would be impacted by China’s efforts to ration power supply. Since the start of Q4, nickel prices have recovered, reaching a high of US$9.31/lb on October 21. It is anticipated that nickel prices will be sustained at current levels through end of year.
Strong nickel demand in Q3 was reflected by the continued decrease in inventory levels since the start of 2021. In Q3, nickel inventory levels on the London Metals Exchange (LME) fell by 32% from 232,476 tonnes at the start of the period to 157,062 tonnes on September 30. Similarly, inventory levels on the Shanghai Futures Exchange fell to 3,728 tonnes, down 25% from 4,982 tonnes at the start of the quarter.
Continued strong demand and market tightness led a number of industry analysts, including Wood Mackenzie and S&P Global, to forecast a nickel supply deficit in 2021 in contrast to forecasts of a nickel surplus at the start of the year. As at October 15, nickel inventories on the LME declined further to 146,022 tonnes.
Although market conditions are currently favorable for nickel producers, nickel inventory level uncertainty is anticipated in 2022 and 2023 with some industry analysts forecasting an inventory surplus in the coming years. Visibility of market conditions in the medium term is limited and no new sources of supply are anticipated.
The long-term outlook for nickel remains bullish on account of the strong demand expected from the electric vehicle battery market. Some market observers, such as Wood Mackenzie, have forecast a prolonged nickel supply deficit beginning in 2025 due to recent developments in the electric vehicle market and no new nickel production coming on stream in the near term.
Over the past year, in particular, multiple automakers and governments have announced plans for significant investments to expand electric vehicle production capacity to meet growing demand as well as more aggressive timelines to phase out the sale of internal combustion engines. In 2020, more than three million plug-in electric vehicles (PEV) were sold despite the global pandemic. Industry observers estimate that the number of PEVs sold in 2021 will double to 6.1 million units. CRU has forecast that electric vehicles sales will grow to 13.7 million units by 2025.
As a result of its unique properties, high-nickel cathode formulations remain the dominant choice for long-range vehicles manufactured by automakers with Class 1 nickel being an essential feedstock in the battery supply chain. Sherritt is particularly well positioned given our Class 1 production capabilities and the fact that Cuba possesses the world’s fourth largest nickel reserves.
Cobalt
Cobalt prices in Q3 2021 were marked by a steady rise, closing on September 30 at US$25.88/lb, up 13% from US$22.90/lb at the start of the quarter according to data collected by Fastmarkets MB.
Higher cobalt prices in Q3 2021 were largely driven by increased buying from electric vehicle battery manufacturers. Cobalt is a key component of rechargeable batteries providing energy stability. Higher cobalt prices in Q3 2021 were also driven by increased stockpiling from consumers and by supply logistics disruptions in South Africa, where cobalt produced in the Democratic Republic of Congo, the source of almost two-thirds of the world’s supply, is sent before being shipped internationally.
Industry observers, such as CRU, expect cobalt prices to continue to rise in the near term with prices forecast to peak at US$31/lb in 2024 as limited new sources of supply have been announced to fill expected demand over the next five years.
The outlook for cobalt over the long term remains bullish as demand is expected to grow to 270,000 tonnes by 2025, representing a compound annual growth rate of 13.5% according to CRU.

Sherritt International Corporation 5
REVIEW OF OPERATIONS
Moa Joint Venture (50% interest) and Fort Site (100%)
For the three months ended For the nine months ended
2021 2020 2021 2020
$ millions (Sherritt's share), except as otherwise noted September 30 September 30 Change September 30 September 30 Change
FINANCIAL HIGHLIGHTS Revenue(1) $ 108.9 $ 97.7 11% $ 377.4 $ 306.7 23%Earnings (loss) from operations 14.6 3.0 387% 62.1 (0.5) nm(2)
Adjusted EBITDA(3) 27.1 17.4 56% 102.9 43.9 134% CASH FLOW Cash provided by operations $ 36.5 $ 23.1 58% $ 81.6 $ 40.3 102%Free cash flow(3) 23.2 16.3 42% 55.9 20.4 174%Dividend distributions from the Moa Joint Venture(4) 12.7 - - 35.9 13.3 170% PRODUCTION VOLUMES (tonnes) Mixed Sulphides 4,666 4,671 - 12,617 13,008 (3%)Finished Nickel 2,908 3,750 (22%) 11,326 11,733 (3%)Finished Cobalt 334 409 (18%) 1,287 1,234 4%Fertilizer 46,730 53,743 (13%) 180,038 179,609 - NICKEL RECOVERY (%) 87% 90% (3%) 85% 86% (1%) SALES VOLUMES (tonnes) Finished Nickel 2,989 3,568 (16%) 11,434 11,510 (1%)Finished Cobalt 372 501 (26%) 1,301 1,235 5%Fertilizer 25,201 36,169 (30%) 117,034 139,380 (16%) AVERAGE-REFERENCE PRICE (US$ per pound) Nickel $ 8.67 $ 6.45 34% $ 8.18 $ 5.93 38%Cobalt(5) 24.55 14.87 65% 22.46 15.52 45% AVERAGE-REALIZED PRICE(3) Nickel ($ per pound) $ 10.76 $ 8.36 29% $ 9.99 $ 7.80 28%Cobalt ($ per pound) 27.03 16.71 62% 23.69 17.95 32%Fertilizer ($ per tonne) 433 289 50% 392 359 9% UNIT OPERATING COST(3) (US$ per pound) Nickel - net direct cash cost $ 4.53 $ 4.04 12% $ 4.30 $ 4.09 5% SPENDING ON CAPITAL Sustaining $ 13.2 $ 6.8 94% $ 25.6 $ 22.9 12% $ 13.2 $ 6.8 94% $ 25.6 $ 22.9 12%
(1) Revenue of Moa Joint Venture and Fort Site is composed of revenue recognized by the Moa Joint Venture at Sherritt’s 50% share, which is equity-accounted and
included in share of earnings (loss) of Moa Joint Venture, net of tax, and revenue recognized by Fort Site, which is included in consolidated revenue. For additional
information, see the Non-GAAP and other financial measures section in the MD&A.
(2) Not meaningful (nm).
(3) For additional information see the Non-GAAP and other financial measures section.
(4) Excludes redirections of dividends from Sherritt’s joint venture partner.
(5) Average standard grade cobalt published price per Fastmarkets MB.
Despite additional measures taken to protect employees, suppliers and various stakeholders at operations at Moa and at the refinery in Fort Saskatchewan since the start of the pandemic in March 2020, the significant rise in the number of cases as a result of the spread of the Delta variant of COVID-19 negatively impacted mining operations and transportation activities in Q3 2021.
Most notably at Moa, the considerable increase in the number of COVID-19 cases in the Holguin province of Cuba adversely affected mining activities and delayed shipment of mixed sulphides. While these developments had minimal impact on mixed sulphides production in the quarter, measures to recover ore stockpiling inventory, including the use of contract mining services, have been implemented in advance of the traditional rainy season at Moa. Mixed sulphides production at the Moa JV in Q3 2021 was 4,666 tonnes, essentially unchanged from the 4,671 tonnes produced in Q3 2020.
At the refinery in Fort Saskatchewan, the rise in number of COVID-19 cases in Alberta coupled with reduced contractor availability resulted in the rescheduling and extension of the full-facility shutdown by two additional days than originally anticipated. This year’s shutdown lasted 13 days compared to the typical five-day annual shutdowns, and included all of the refinery and utility plants. Full-facility shutdowns occur once every six years.

2021 Third Quarter Report Press Release
6 Sherritt International Corporation
Refinery operations were also disrupted by unplanned maintenance activities due to equipment and service failures in advance of the full-facility shutdown. Subsequent to the shutdown, repairs to the cobalt reduction autoclave nozzle were required, resulting in a temporary reduction in plant capacity.
As a result of the cumulative impact of these developments, finished nickel production in Q3 2021 totaled 2,908 tonnes, down 22% from the 3,750 tonnes produced in Q3 2020 while finished cobalt production for Q3 2021 was 334 tonnes, down 18% from the 409 tonnes produced in Q3 2020.
Finished nickel and cobalt production for the nine-month period of 2021 were 11,326 tonnes and 1,287 tonnes, respectively. The totals compare to 11,733 tonnes and 1,234 tonnes for the same period of 2020. As a result of developments in Q3 and anticipated performance through the balance of the year, Sherritt has adjusted its guidance for 2021 and now expects to produce 31,000 – 32,000 tonnes of nickel (100% basis). Guidance for cobalt production is unchanged at 3,300 – 3,600 tonnes (100% basis).
Sales volume for finished nickel and cobalt in Q3 2021 were down 16% and 26%, respectively, from last year. The year-over-year decrease was due to lower production volumes and the impact of the full-facility shutdown.
Despite the decrease in sales volume total, Moa JV revenue in Q3 2021 increased by 11% to $108.9 million from $97.7 million last year. The revenue increase was largely attributable to higher average-realized nickel, cobalt, and fertilizer prices. In Q3 2021, average-realized nickel, cobalt, and fertilizer prices were up 29%, 62% and 50%, respectively, from last year. Average-realized prices are impacted by the timing of deliveries, settlement against contract terms, and fluctuations in the value of the Canadian currency.
Mining, processing and refining (MPR) costs per pound of nickel sold for Q3 2021 were US$6.43/lb, up 31% from last year. MPR costs in Q3 2021 increased due to a combination of factors, including higher input costs and the impact of lower production volumes on period costs. Input costs, in particular, were negatively impacted by the 126% increase in sulphur prices, 69% increase in fuel oil prices, and 59% increase in natural gas prices. Higher MPR costs were partially offset by the effect of Cuba’s unification of its currencies in lowering labour and other service expenses.
Net direct cash cost (NDCC) per pound of nickel sold in Q3 2021 was US$4.53/lb, up 12% from last year. The increase was primarily driven by higher MPR costs and higher third-party feed costs, but partially offset by the 52% improvement in cobalt by-product credits due to higher average-realized prices and by higher fertilizer and other by-product credits. NDCC guidance for 2021 remains unchanged at US$4.25 - $4.75 per pound of nickel sold as the recent rise in cobalt prices partially offsets the rise in input costs.
Sustaining capital spending in Q3 2021 was $13.2 million, up 94% from $6.8 million in Q3 2020 for the same period last year. The year-over-year increase was due primarily to the timing of planned capital expenditures, including receipt of new mining equipment at Moa. Sherritt’s share of planned spending at the Moa JV and Fort Site in 2021 has been reduced to US$35 million from US$44 million, and is primarily earmarked for the continued replacement of mine and plant equipment. The reduction in planned capital spending reflects operating challenges, including freight and order delays caused by COVID-19.
In Q3 2021, the Moa JV advanced with its commitment to reduce carbon emissions through the use of renewable energy and electric fleet equipment. As at September 30, 2021, the Moa JV received delivery of eight electric light vehicles with an additional vehicle slated for delivery by end of year. Plans for the increased use of renewable energy and electric light vehicles beyond 2021 are being developed.

Sherritt International Corporation 7
Power
For the three months ended For the nine months ended
2021 2020 2021 2020
$ millions (33 ⅓% basis), except as otherwise noted September 30 September 30 Change September 30 September 30 Change
FINANCIAL HIGHLIGHTS Revenue $ 7.3 $ 9.4 (22%) $ 20.2 $ 28.4 (29%)(Loss) earnings from operations 0.2 1.6 (88%) (1.1) 4.5 (124%)Adjusted EBITDA(1) 4.1 6.8 (40%) 10.6 20.3 (48%) CASH FLOW Cash provided by operations $ 3.0 $ 20.9 (86%) $ 17.3 $ 47.6 (64%)Free cash flow(1) 3.0 20.2 (85%) 17.3 46.9 (63%) PRODUCTION AND SALES Electricity (GWh(2)) 110 152 (28%) 320 458 (30%) AVERAGE-REALIZED PRICE(1) Electricity ($/MWh(2)) $ 54.57 $ 57.55 (5%) $ 53.93 $ 57.67 (6%) UNIT OPERATING COSTS(1) Electricity ($/MWh) 23.14 14.63 58% 23.19 14.44 61% NET CAPACITY FACTOR (%) 35 48 (27%) 34 48 (29%) SPENDING ON CAPITAL Sustaining $ - $ 0.8 (100%) $ - $ 0.8 (100%) $ - $ 0.8 -100.0% $ - $ 0.8 -100.0%
(1) For additional information see the Non-GAAP and other financial measures section.
(2) Gigawatt hours (GWh), Megawatt hours (MWh).
Power production in Q3 2021 was 110 gigawatt hours (GWh) of electricity, down 28% from 152 GWh produced in the comparable period of 2020. The production decline was due to maintenance activities deferred from 2020 on account of limited liquidity availability and reduced availability of spare parts.
Revenue in Q3 2021 totaled $7.3 million, down 22% from $9.4 million for the same quarter last year. The revenue decline was primarily due to lower power production.
The average-realized price in Q3 2021 was $54.57/MWh, down 5% from Q3 2020. The decrease was primarily due to the strengthening of the Canadian currency relative to the U.S. dollar.
Unit operating costs in Q3 2021 were $23.14/MWh, up 58% from $14.63/MWh for last year. The year-over-year increase was attributable to lower sales volume and higher operational spending on maintenance activities deferred from 2020. The increase in unit operating costs in Q3 2021 was partially offset by the impact of a strengthening Canadian dollar as costs are denominated in U.S. currency, and by the effect of Cuba’s unification of its currencies in lowering labour and third-party service costs.
The Power business unit had negligible capital spend for the three months ended September 30, 2021.
Sherritt continues to be in discussion with its Cuban partners to extend its power generation agreement with Energas, which is currently slated to expire in March 2023.

2021 Third Quarter Report Press Release
8 Sherritt International Corporation
Technologies
Sherritt Technologies continued its efforts to transition from a cost centre to an incubator of industry solutions that can also be commercialized externally or applied internally to improve operational performance, reduce carbon emissions, and support growth initiatives, such as efforts to de-bottleneck production, evaluate brownfield expansion opportunities and increase mineral reserves.
In Q3, the primary activities of Sherritt Technologies centred on supporting brownfield expansion opportunities at the Moa JV, including preparations for final testing to support a change in mine planning to use an economic cut-off grade to potentially upgrade resources into reserves and significantly expand the life of mine, and support Sherritt’s growth strategy.
Other activities included efforts to commercialize Sherritt’s most advanced, innovative technologies. In particular, Sherritt Technologies continued to make progress on its enhanced proprietary process to fully upgrade heavy oil, refining residues and bitumen. Sherritt’s process provides a number of environmental and business benefits, including eliminating the need for bitumen diluent and thereby increasing pipeline capacity, increasing the economic value of the oil transported to downstream markets, as well as reduced energy consumption due to the elimination of energy intensive unit operations, which results in lower carbon emissions. Discussions with external parties regarding the potential use of Sherritt’s process have identified multiple, distinct scenarios for the application of this technology. External industry expertise has been engaged to assist in further developing these specific opportunities. Piloting of the new catalyst system, which allows for full upgrading instead of partial upgrading, is scheduled to occur during 2022, and will be designed to test the multiple product and processing scenarios.
Sherritt Technologies is also pursuing the commercialization of its proprietary process for the treatment of copper concentrates with higher arsenic content. Arsenic is a poisonous element requiring significant mitigation and management costs rendering certain copper projects uneconomical. With copper demand expected to grow significantly over the next decade, Sherritt’s advanced hydrometallurgical process technology fulfills a pressing industry need, presenting a significant step change in the stabilization of arsenic bearing solid waste, produces net zero carbon emissions, extends the life of aging copper mines, reduces treatment costs and capitalizes on existing infrastructure. Discussions have started with external parties on a variety of potential commercialization routes on optimal sourcing options for laterite ore and copper concentrate. Different copper products can be considered, depending on specific project drivers and circumstances.
OUTLOOK
2021 Production, unit operating costs and capital spending guidance
Based on operational results achieved through September 30, prevailing commodity prices, anticipated performance and expected input cost and planned capital spend for the year, Sherritt updated its production and planned capital spend guidance for 2021.
Guidance Year-to-date Updated
for 2021 - actuals - 2021 guidance -Production volumes, unit operating costs and spending on capital Total Total Total Production volumes Moa Joint Venture (tonnes, 100% basis) Nickel, finished 32,000 - 34,000 22,652 31,000 - 32,000 Cobalt, finished 3,300 - 3,600 2,574 No changeElectricity (GWh, 33⅓% basis) 450 - 500 320 No change Unit operating costs Moa Joint Venture - NDCC (US$ per pound) $4.25 - $4.75 $4.30 No changeElectricity (unit operating cost, $ per MWh) $30.50 - $32.00 $23.19 No change Spending on capital Moa Joint Venture (50% basis), Fort Site (100% basis)(1) US$44 (CDN$57) US$21 (CDN$26) US$35 (CDN$44)Power (33⅓% basis) US$1 (CDN$1.3) US$0 (CDN$0) No changeSpending on capital (excluding Corporate) US$45 (CDN$58) US$21 (CDN$26) US$36 (CDN$45)
(1) Spending is 50% of US$ expenditures for the Moa JV and 100% expenditures for Fort Site fertilizer and utilities.

Sherritt International Corporation 9
NON-GAAP AND OTHER FINANCIAL MEASURES
Management uses the following non-GAAP and other financial measures in this press release and other documents: combined revenue, adjusted EBITDA, average-realized price, unit operating cost/net direct cash cost (NDCC), adjusted net earnings/loss from continuing operations, adjusted earnings/loss from continuing operations per share and combined free cash flow.
Management uses these measures to monitor the financial performance of the Corporation and its operating divisions and believes these measures enable investors and analysts to compare the Corporation’s financial performance with its competitors and/or evaluate the results of its underlying business. These measures are intended to provide additional information, not to replace International Financial Reporting Standards (IFRS) measures, and do not have a standard definition under IFRS and should not be considered in isolation or as a substitute for measures of performance prepared in accordance with IFRS. As these measures do not have a standardized meaning, they may not be comparable to similar measures provided by other companies.
The non-GAAP and other financial measures are reconciled to their most directly comparable IFRS measures in the non-GAAP and other financial measures section of Sherritt’s Management’s Discussion and Analysis for the three and nine months ended September 30, 2021.
CONFERENCE CALL AND WEBCAST
Sherritt will hold its conference call and webcast November 4, 2021 at 10:00 a.m. Eastern Time to review its Q3 2021 results. Dial-in and webcast details are as follows:
North American callers, please dial: 1 (866) 521-4909
International callers, please dial: (647) 427-2311
Live webcast: www.sherritt.com
Please dial in 15 minutes before the start of the call to secure a line. Alternatively, listeners can access the conference call and presentation via the webcast available on Sherritt’s website.
An archive of the webcast and replay of the conference call will also be available on the website.
FINANCIAL STATEMENTS AND MANAGEMENT’S DISCUSSION AND ANALYSIS
Sherritt’s condensed consolidated financial statements and MD&A for the three and nine months ended September 30, 2021 are available at www.sherritt.com and should be read in conjunction with this news release. Financial and operating data can also viewed in the investor relations section of Sherritt’s website.
ABOUT SHERRITT
Sherritt is a world leader in the mining and refining of nickel and cobalt – metals essential for the growing adoption of electric vehicles. Its Technologies Group creates innovative, proprietary solutions for oil and mining companies around the world to improve environmental performance and increase economic value. Sherritt is also the largest independent energy producer in Cuba. Sherritt’s common shares are listed on the Toronto Stock Exchange under the symbol “S”.

2021 Third Quarter Report Press Release
10 Sherritt International Corporation
FORWARD-LOOKING STATEMENTS
This press release contains certain forward-looking statements. Forward-looking statements can generally be identified by the use of statements that include such words as “believe”, “expect”, “anticipate”, “intend”, “plan”, “forecast”, “likely”, “may”, “will”, “could”, “should”, “suspect”, “outlook”, “potential”, “projected”, “continue” or other similar words or phrases. Specifically, forward-looking statements in this document include, but are not limited to, statements regarding strategies, plans and estimated production amounts resulting from expansion of mining operations at the Moa JV, growing and increasing nickel and cobalt production, extending the Moa life of mine, conversion of mineral resources to reserves; commercializing Technologies projects, growing shareholder value, updating technical reports and optimizing mine planning and performance; statements set out in the “Outlook” section of this press release and certain expectations regarding production volumes, operating costs and capital spending; supply, demand and pricing outlook in the nickel, cobalt and electric vehicle markets; the impact of COVID-19; Sherritt’s strategy, plans, targets and goals in respect of environmental and social governance issues, including climate change and greenhouse gas emissions reduction targets; anticipated payments of outstanding receivables, including re-directed distributions from the Corporation’s Moa Joint Venture partner; the impact of U.S. sanctions on Cuba; anticipated economic conditions in Cuba; the anticipated renewal of a joint venture agreement; and amounts of certain other commitments.
Forward-looking statements are not based on historical facts, but rather on current expectations, assumptions and projections about future events, including commodity and product prices and demand; the level of liquidity and access to funding; share price volatility; production results; realized prices for production; earnings and revenues; global demand for electric vehicles; the commercialization of certain proprietary technologies and services; advancements in environmental and greenhouse gas reduction technology; environmental rehabilitation provisions; availability of regulatory and creditor approvals and waivers; compliance with applicable environmental laws and regulations; debt repayments; redemptions and interest deferrals; collection of accounts receivable; and certain corporate objectives, goals and plans. By their nature, forward-looking statements require the Corporation to make assumptions and are subject to inherent risks and uncertainties. There is significant risk that predictions, forecasts, conclusions or projections will not prove to be accurate, that those assumptions may not be correct and that actual results may differ materially from such predictions, forecasts, conclusions or projections. The Corporation cautions readers of this press release not to place undue reliance on any forward-looking statement as a number of factors could cause actual future results, conditions, actions or events to differ materially from the targets, expectations, estimates or intentions expressed in the forward-looking statements. These risks, uncertainties and other factors include, but are not limited to, the impact of the COVID-19 pandemic, changes in the global price for nickel, cobalt, oil and gas, fertilizers or certain other commodities; security market fluctuations and price volatility; level of liquidity; access to capital; access to financing; the risk to Sherritt’s entitlements to future distributions from the Moa Joint Venture; uncertainty about the pace of technological advancements required in relation to achieving ESG targets; risk of future non-compliance with debt restrictions and covenants and mandatory repayments; Sherritt’s ability to replace depleted mineral reserves; risks associated with the Corporation’s joint venture partners; variability in production at Sherritt’s operations in Cuba; risks related to Sherritt’s operations in Cuba; risks related to the U.S. government policy toward Cuba, including the U.S. embargo on Cuba and the Helms-Burton legislation; potential interruptions in transportation; uncertainty of gas supply for electrical generation; the Corporation’s reliance on key personnel and skilled workers; growth opportunity risks; the possibility of equipment and other failures; risks associated with mining, processing and refining activities; uncertainty of resources and reserve estimates; the potential for shortages of equipment and supplies, including diesel; supplies quality issues; risks related to environmental liabilities including liability for reclamation costs, tailings facility failures and toxic gas releases; risks related to the Corporation’s corporate structure; political, economic and other risks of foreign operations; risks associated with Sherritt’s operation of large projects generally; risks related to the accuracy of capital and operating cost estimates; foreign exchange and pricing risks; compliance with applicable environment, health and safety legislation and other associated matters; risks associated with governmental regulations regarding climate change and greenhouse gas emissions; risks relating to community relations and maintaining the Corporation’s social license to grow and operate; credit risks; competition in product markets; future market access; interest rate changes; risks in obtaining insurance; uncertainties in labour relations; uncertainty in the ability of the Corporation to enforce legal rights in foreign jurisdictions; uncertainty regarding the interpretation and/or application of the applicable laws in foreign jurisdictions; legal contingencies; risks related to the Corporation’s accounting policies; identification and management of growth opportunities; uncertainty in the ability of the Corporation to obtain government permits; risks to information technologies systems and cybersecurity; failure to comply with, or changes to, applicable government regulations; bribery and corruption risks, including failure to comply with the Corruption of Foreign Public Officials Act or applicable local anti-corruption law; the ability to accomplish corporate objectives, goals and plans for 2021; and the Corporation’s ability to meet other factors listed from time to time in the Corporation’s continuous disclosure documents. The Corporation, together with its Moa Joint Venture and Fort Site and Technologies segments, are pursuing a range of growth and expansion opportunities, including without limitation, process technology solutions, development projects, commercial implementation opportunities, life of mine extension opportunities and the conversion of mineral resources to reserves. In addition to the risks noted above, factors that could, alone or in combination, prevent us from successfully achieving these opportunities may include, without limitation: identifying suitable commercialization and other partners; successfully advancing discussions and successfully concluding applicable agreements with external parties and/or partners; successfully attracting required financing; successfully developing and proving technology required for the potential opportunity; successfully overcoming technical and technological challenges; successful environmental assessment and stakeholder engagement; successfully obtaining intellectual property protection; successfully completing test work and engineering studies, prefeasibility and feasibility studies, piloting, scaling from small scale to large scale production, commissioning, procurement, construction, commissioning, ramp-up to commercial scale production and completion; and securing regulatory and government approvals. There can be no assurance that any opportunity will be successful, commercially viable, or will generate any meaningful revenues, savings or earnings, as the case may be, for the Corporation. In addition, the Corporation will incur costs in pursuing any particular opportunity, which may be significant. Additional risks, uncertainties and other factors include, but are not limited to, the ability of the Corporation to achieve its financial goals; the ability of the Corporation to continue to realize its assets and discharge its liabilities and commitments; the Corporation’s future liquidity position,

Sherritt International Corporation 11
and access to capital, to fund ongoing operations and obligations (including debt obligations); the ability of the Corporation to stabilize its business and financial condition; the ability of the Corporation to implement and successfully achieve its business priorities; and the ability of the Corporation to comply with its contractual obligations, including without limitation, its obligations under debt arrangements. Readers are cautioned that the foregoing list of factors is not exhaustive and should be considered in conjunction with the risk factors described in this press release and in the Corporation’s other documents filed with the Canadian securities authorities, including without limitation the “Managing Risk” section of the Management’s Discussion and Analysis for the three and nine months ended September 30, 2021 and the Annual Information Form of the Corporation dated March 17, 2021 for the period ending December 31, 2020, which is available on SEDAR at www.sedar.com.
The Corporation may, from time to time, make oral forward-looking statements. The Corporation advises that the above paragraph and the risk factors described in this press release and in the Corporation’s other documents filed with the Canadian securities authorities should be read for a description of certain factors that could cause the actual results of the Corporation to differ materially from those in the oral forward-looking statements. The forward-looking information and statements contained in this press release are made as of the date hereof and the Corporation undertakes no obligation to update publicly or revise any oral or written forward-looking information or statements, whether as a result of new information, future events or otherwise, except as required by applicable securities laws. The forward-looking information and statements contained herein are expressly qualified in their entirety by this cautionary statement.
For further investor information contact: Joe Racanelli, Director of Investor Relations Telephone: (416) 935-2457 Toll-free: 1 (800) 704-6698 E-mail: [email protected]
Sherritt International Corporation Bay Adelaide Centre, East Tower 22 Adelaide St. West, Suite 4220 Toronto, ON M5H 4E3 www.sherritt.com

Management’s discussion and analysis
12 Sherritt International Corporation
MANAGEMENT'S DISCUSSION AND ANALYSIS For the three and nine months ended September 30, 2021
This Management’s Discussion and Analysis (MD&A) is intended to help the reader understand Sherritt International Corporation’s operations, financial performance and the present and future business environment. This MD&A, which has been prepared as of November 3, 2021, should be read in conjunction with Sherritt’s condensed consolidated financial statements for the three and nine months ended September 30, 2021 and Sherritt's audited consolidated financial statements and the MD&A for the year ended December 31, 2020. Additional information related to the Corporation, including the Corporation’s Annual Information Form, is available on SEDAR at www.sedar.com or on the Corporation’s website at www.sherritt.com.
References to “Sherritt” or the “Corporation” refer to Sherritt International Corporation and its share of consolidated subsidiaries, joint operations, joint ventures and associate, unless the context indicates otherwise. All amounts are in Canadian dollars, unless otherwise indicated. References to “US$” are to United States (U.S.) dollars and to “€” are to euro.
Securities regulators encourage companies to disclose forward-looking information to help investors understand a company’s future prospects. This MD&A contains statements about Sherritt’s future financial condition, results of operations and business. See the end of this report for more information on forward-looking statements.
The business we manage 13 Highlights 14 Financial results 18 Liquidity 22 Outlook 25 Significant factors influencing operations 26 Review of operations 27 Moa Joint Venture and Fort Site 27 Power 32 Technologies 33 Corporate 34 Capital resources 35 Contractual obligations and commitments 35 Syndicated revolving-term credit facility 35 Moa Joint Venture commitments 36 Common shares 36 Managing risk 36 Basis of presentation and critical accounting judgments 37 Summary of quarterly results 38 Off-balance sheet arrangements 39 Transactions with related parties 39 Supplementary information 39 Sensitivity analysis 39 Non-GAAP and other financial measures 40 Controls and procedures 49 Forward-looking statements 50

Sherritt International Corporation 13
The business we manage Sherritt International Corporation (“Sherritt” or the “Corporation”) is a world leader in the mining and refining of nickel and cobalt – metals essential for the growing adoption of electric vehicles. Its Technologies Group creates innovative, proprietary solutions for oil and mining companies around the world to improve environmental performance and increase economic value. The Corporation is also the largest independent energy producer in Cuba. Sherritt manages its mining, oil and gas, power and technologies operations through different legal structures including 100%-owned subsidiaries, joint arrangements and production-sharing contracts. The relationship for accounting purposes that Sherritt has with these operations and the interest recognized in the Corporation’s financial statements are as follows:
Relationship for Basis of accounting purposes Interest accounting Moa Joint Venture Joint venture 50% Equity method
Metals Other Subsidiaries 100% Consolidation
Oil and Gas Subsidiary 100% Consolidation
Power Joint operation 33⅓% Share of assets, liabilities revenues and expenses
Ambatovy Joint Venture(1) Associate 0% Discontinued operations (1) On August 31, 2020, the Corporation’s economic interest in the Ambatovy Joint Venture was reduced from 12% to nil as a result of the implementation of a transaction.
The Fort Site, Technologies and Corporate operations are a part of Sherritt International Corporation, the parent company, and are not separate legal entities.
For financial statement purposes, the Moa Joint Venture is accounted for using the equity method of accounting which recognizes the Corporation’s share of earnings (loss) from Moa Joint Venture and its net assets as the Corporation’s investment in Moa Joint Venture. The financial results and review of operations sections in this MD&A presents amounts by reportable segment, based on the Corporation’s economic interest. The Corporation’s reportable segments are as follows:
Moa Joint Venture and Fort Site: 50% interest in the Moa Joint Venture and 100% interest in the utility and fertilizer operations at Fort Site.
Metals Other: 100% interests in wholly-owned subsidiaries established to buy, market and sell certain Moa Joint Venture’s nickel and cobalt production.
Oil and Gas: 100% interest in its Oil and Gas business.
Power: 33⅓% interest in Energas S.A. (Energas).
Technologies: 100% interest in its Technologies business.
Corporate: head office activities.
Operating and financial results presented in this MD&A for reportable segments can be reconciled to note 4 of the condensed consolidated financial statements for the three and nine months ended September 30, 2021.
NON-GAAP AND OTHER FINANCIAL MEASURES
Management uses the following non-GAAP and other financial measures in this MD&A and other documents: combined revenue, adjusted EBITDA, average-realized price, unit operating cost/net direct cash cost (NDCC), adjusted net earnings/loss from continuing operations, adjusted earnings/loss from continuing operations per share and combined free cash flow.
Management uses these measures to monitor the financial performance of the Corporation and its operating divisions and believes these measures enable investors and analysts to compare the Corporation’s financial performance with its competitors and/or evaluate the results of its underlying business. These measures are intended to provide additional information, not to replace International Financial Reporting Standards (IFRS) measures, and do not have a standard definition under IFRS and should not be considered in isolation or as a substitute for measures of performance prepared in accordance with IFRS. As these measures do not have a standardized meaning, they may not be comparable to similar measures provided by other companies. The non-GAAP and other financial measures are reconciled to their most directly comparable IFRS measures in the non-GAAP and other financial measures section starting on page 40.

Management’s discussion and analysis
14 Sherritt International Corporation
Highlights
EXPANSION AND GROWTH OPPORTUNITIES
The Corporation will be embarking on an expansion strategy with its Cuban partners to capitalize on the growing demand for high-purity nickel and cobalt being driven by the accelerated adoption of electric vehicles. The strategy, which will build on the 25-year successful track record of the Moa Joint Venture, centres on growing finished nickel and cobalt production by 15 to 20% per year from the 34,876 tonnes produced in 2020 and extending the life of mine at Moa from 2034 beyond 2040 through the conversion of mineral resources into reserves using an economic cut-off grade.
Expansion plans for the Moa Joint Venture consist of a multi-phased approach, and includes completion of the new slurry preparation plant and other expansion circuits at Moa, installation of new equipment and upgrading existing equipment at the refinery in Fort Saskatchewan, Alberta, updating the 43-101 Technical Report published in June 2019 that reported more than 158 million tonnes of measured and indicated resources at 1% nickel and 0.13% cobalt at Moa to reflect production based on economic rather than a fixed, cut-off grade, and leveraging the expertise of Sherritt Technologies to optimize mine planning and performance.
Sherritt and its Cuban partners are currently finalizing timelines, capital estimates, and economics of the various projects, including identifying financing alternatives. Sherritt expects to provide an update on the rollout of the Moa Joint Venture expansion strategy by the end of the first quarter of 2022.
MOA JOINT VENTURE
Sherritt’s share of finished nickel production for the three months ended September 30, 2021 was 2,908 tonnes, 22% lower compared to the prior year period, and finished cobalt production of 334 tonnes was 18% lower compared to the prior year period. Finished nickel and cobalt production was lower than the same period in the prior year due to a longer annual maintenance shutdown of the refinery in Fort Saskatchewan, unplanned maintenance and transportation delays in shipping mixed sulphides from Moa to the refinery due to the impact of COVID-19. These transportation delays in shipping mixed sulphides have since ended. The rise in number of COVID-19 cases in Alberta coupled with reduced contractor availability resulted in the rescheduling and extension of the full-facility shutdown by two additional days than originally anticipated. Refinery operations were disrupted by unplanned maintenance activities due to equipment and service failures in advance of the full-facility shutdown. Subsequent to the shutdown, repairs to the cobalt reduction autoclave nozzle were required, resulting in a temporary reduction in plant capacity.
Finished nickel and cobalt production at the Moa Joint Venture and Fort Site during the three and nine months ended September 30, 2021 was not materially impacted by COVID-19. COVID-19 has marginally impacted production and supply chain logistics during the three months ended September 30, 2021 due to factors outside of the Corporation’s control. Despite additional measures taken to protect employees, suppliers and various stakeholders at operations at Moa and at the refinery in Fort Saskatchewan since the start of the pandemic in March 2020, the significant rise in the number of cases as a result of the fourth wave of COVID-19 negatively impacted mining operations and transportation activities in Q3 2021.
Given the increased vaccination rates in Cuba, with 88% of the population receiving at least one dose and 64% having been fully vaccinated, per Our World in Data, the Corporation is optimistic that there will be minimal impacts from COVID-19 going forward. The Corporation has updated its production guidance for 2021 to reflect developments in the three months ended September 30, 2021 and anticipated production for the balance of the year.
NDCC for the three months ended September 30, 2021 was US$4.53 per pound, 12% higher compared to the same period in the prior year. Despite a 52% improvement in cobalt by-product credits, unit costs per pound of finished nickel sold were impacted by the 126% increase in sulphur prices, 69% increase in fuel oil prices, 59% increase in natural gas prices and lower sales volumes. NDCC guidance for 2021 remains unchanged at US$4.25 to $4.75 per pound of nickel sold as the recent rise in cobalt prices partially offsets the rise in input costs.

Sherritt International Corporation 15
DISTRIBUTIONS FROM THE MOA JOINT VENTURE
During the three and nine months ended September 30, 2021, the Moa Joint Venture paid distributions of US$20.0 million and US$58.0 million, respectively, to its shareholders, of which US$10.0 million and US$29.0 million, respectively, was paid to Sherritt directly, representing its 50% share. In addition, GNC, Sherritt’s joint venture partner, redirected US$14.0 million of distributions during the nine months ended September 30, 2021 to the Corporation to fund Energas operations. Higher distributions in the current year periods were indicative of improved average-realized nickel and cobalt prices and sales volumes of nickel and cobalt. Sherritt anticipates receipt of additional distributions from the Moa Joint Venture through to the end of 2021 based on prevailing nickel and cobalt prices, planned capital spend and liquidity requirements for the Moa Joint Venture.
ENVIRONMENTAL, SOCIAL AND GOVERNANCE (ESG) UPDATE
The Corporation released its 2020 Sustainability Report, which is available on the Sherritt website and featured a number of upgraded ESG targets in four categories, a selection of which are shown below:
Health and Safety Achieve level A of Towards Sustainable Mining (TSM) Safety and Health Protocol in all operations by 2024
Climate and Environment Achieve net zero greenhouse gas (GHG) emissions by 2050
Obtain overall 15% of energy from renewable sources by 2030
Reduce nitrogen oxides (NOx) emissions intensity by 10% by 2024
Diversity and Inclusion Increase women in the workforce to 36% by 2030
Responsible Sourcing Be fully compliant with all material responsible sourcing frameworks (Organisation for Economic Co-operation and Development, London Metal Exchange and Cobalt Industry Responsible Assessment Framework) by 2024
During the three months ended September 30, 2021, the Fort Site deployed its first electric vehicle. At the Moa Joint Venture, four additional electric vehicles have been delivered during the three months ended September 30, 2021, bringing the total number of electric vehicles delivered to eight and one additional electric vehicle expected to be delivered by the end of the year. These milestones represent Sherritt’s commitment to achieving a target of net zero greenhouse gas emissions by 2050. Plans are being implemented for further electric vehicle replacements and other renewable energy projects beyond 2021.
During the three months ended September 30, 2021, the Corporation appointed a new Chief Financial Officer, Chief Commercial Officer and Chief Human Resources Officer as part of senior leadership changes. The appointments underscore Sherritt’s two-pronged growth strategy focused on capitalizing on the accelerating demand for high-purity nickel and cobalt from the electric vehicle industry and commercializing innovative process technology solutions for resources companies looking to improve their environmental performance and increase economic value.
NICKEL AND COBALT PRICE
The nickel reference price on the London Metal Exchange (LME) closed on September 30, 2021 at US$8.25/lb, comparable with the reference price of US$8.37/lb at the start of the quarter, driven by a number of market developments suggesting strong near-term demand for nickel and lower available supply by year-end.
The cobalt reference price closed on September 30, 2021 at US$25.88/lb according to data collected by Fastmarkets MB, up 13% from $22.90/lb at the start of the quarter, largely as a result of increased buying from electric vehicle battery manufacturers in Europe, increased stockpiling from consumers and supply logistics disruptions. Cobalt is a key component of rechargeable batteries providing energy density and stability.
Refer to the Significant factors influencing operations section in this MD&A for further updates on nickel and cobalt.
WORKING CAPITAL
Cash, cash equivalents and short-term investments as at September 30, 2021 were $163.4 million, down from $167.4 million as at December 31, 2020. As at September 30, 2021, Sherritt held cash, cash equivalents and short-term investments in Canada totaling $82.1 million, down from $84.8 million as at December 31, 2020.

Management’s discussion and analysis
16 Sherritt International Corporation
During the nine months ended September 30, 2021, cash decreased due to a number of factors, including $15.2 million of interest paid on the 8.50% second lien secured notes due 2026, $7.8 million of capital expenditures, $5.5 million of cash used by discontinued operations and $4.6 million on repurchase of the second lien secured notes, partially offset by $35.9 million of distributions received from the Moa Joint Venture, $11.3 million of dividend redirections from the Corporation’s joint venture partner, General Nickel Company S.A. (GNC), prepayments received for deliveries of nickel and fertilizer in 2021 and $3.6 million of interest received on the Energas conditional sales agreement (CSA).
CUBAN OVERDUE RECEIVABLES AGREEMENTS
Cuban energy payments received under the overdue receivables agreements are shown below:
Received on Overdue overdue receivables OverdueUS$ millions (100% basis) June 30, 2021 Expected/Due Received agreements September 30, 2021 Oil and Gas receivables $ 26.0 0.1 $ (2.3) $ - $ 23.8Power receivables: Trade receivables - 4.1 (0.3) (3.6) 0.2 Energas CSA 128.7 - (0.2) - 128.5 $ 154.7 4.2 $ (2.8) $ (3.6) $ 152.5
During the quarter, US$6.4 million of Cuban energy payments were received, compared to US$24.5 million in the second quarter of 2021, when dividend redirections were received. Starting in May 2021, amounts received on the overdue receivables agreement are being used to fund Energas operations until the end of 2021.
Cuban energy payments continue to be impacted by restrictions on tourism as a result of COVID-19, which has eliminated almost all tourism revenue over the past 18 months, and ongoing impact of U.S. sanctions limiting Cuba’s access to foreign currency, in addition to the impact of Cuban currency unification. Cuba has announced plans to fully open its borders to international travelers on November 15, 2021 in advance of the winter travel season. Further information on Cuban currency unification is included in note 10 of the Corporation’s condensed consolidated financial statements for the three and nine months ended September 30, 2021. Sherritt anticipates continued near-term variability in the timing and the amount of energy payments through the remainder of 2021 and continues to work with its Cuban partners to ensure timely receipt of energy payments. With the re-opening of Cuba’s borders, increase in vaccination rates with 88% of the population receiving at least one dose and 64% having been fully vaccinated, per Our World in Data, the resumption of international tourism and the influx of foreign currency, Sherritt anticipates economic conditions in Cuba to improve in 2022.
Subsequent to September 30, 2021, the Corporation received US$2.5 million in Canada as part of the Cuban overdue receivables agreements.
TECHNOLOGIES
Sherritt Technologies has continued its efforts to transition from a cost centre to an incubator of industry solutions that can also be commercialized externally or applied internally to improve operational performance, reduce carbon emissions and support growth initiatives, such as efforts to de-bottleneck production, evaluate brownfield expansion opportunities and increase mineral reserves.
During the three months ended September 30, 2021, the Corporation appointed a Chief Commercial Officer (CCO) with a diverse and extensive mining background. The CCO’s experience in the development and implementation of business strategies and in the sourcing, evaluation and implementation of investment opportunities will be vital to the success of the Technologies business.
During the three months ended September 30, 2021, the Technologies business main activities were focused on the internal support of the brownfield expansion at the Moa Joint Venture, including preparations for final testing to support a change in mine planning to use an economic cut-off grade to potentially update reserves, significantly expand the life of mine and support Sherritt’s growth strategy.

Sherritt International Corporation 17
Sherritt Technologies continued to make progress on the commercialization of its enhanced proprietary process to fully upgrade heavy oil, refining residues and bitumen, which provides a number of environmental and business benefits, such as eliminating the need for bitumen diluent, thereby increasing pipeline capacity, and increasing the economic value of the oil transported to downstream markets, as well as reduced energy consumption due to the elimination of energy intensive unit operations, which translates into a reduced carbon footprint for the process. Discussions with external parties regarding the potential use of this process have identified multiple, distinct scenarios for the application of this technology and external industry expertise has been engaged to assist in further developing these specific opportunities. Piloting of the new catalyst system, which allows for full upgrading instead of partial upgrading, is scheduled to occur during 2022 and will be designed to test the multiple product and processing scenarios mentioned above.
Sherritt Technologies is also pursuing the commercialization of its proprietary process for the treatment of copper concentrates with higher arsenic content. Arsenic is a poisonous element requiring significant mitigation and management costs rendering certain copper projects uneconomical. With copper demand expected to grow significantly over the next decade, Sherritt Technologies’ advanced hydrometallurgical process technology fulfills a pressing industry need, presenting a significant step change in the stabilization of arsenic bearing solid waste, produces net zero carbon emissions, extends the life of aging copper mines, reduces treatment costs and capitalizes on existing infrastructure. Discussions have started with external parties on a variety of potential commercialization routes on optimal sourcing options for laterite ore and copper concentrate. Different copper products can be considered, depending on specific project drivers and circumstances.
PRESERVING LIQUIDITY AND MANAGING COSTS
The Corporation continues to implement a number of cost control measures for capital spend projects and administrative and operating expenses while sustaining safe operations. These measures include optimizing capital spending, eliminating discretionary spending not affecting safe operations, applying for government grants, deferring external hiring and reducing the workforce, maximizing sales terms to improve collections and negotiating with vendors for improved payment terms.
For the three and nine months ended September 30, 2021, administrative expenses increased by $5.5 million and $13.7 million, respectively, which includes a decrease and increase in share-based compensation expense of $0.8 million and $11.8 million, respectively, and increases in severance and other contractual benefits expense of $3.3 million and $4.9 million, respectively, related to the departures of two senior executives. For the three and nine months ended September 30, 2021, employee costs within administrative expenses were comparable and decreased by $2.1 million, respectively.
INCREASE AND EXTENSION OF SYNDICATED REVOLVING-TERM CREDIT FACILITY
On October 28, 2021, subsequent to period-end, the maximum credit for the syndicated revolving-term credit facility was increased from $70.0 million to $100.0 million and the terms were amended to extend the maturity for two years from April 30, 2022 to April 30, 2024. Borrowings on the credit facility are available to fund working capital and capital expenditures. Spending on capital expenditures cannot exceed $75.0 million in a fiscal year. This restriction does not apply to capital expenditures of Moa Nickel S.A.

Management’s discussion and analysis
18 Sherritt International Corporation
Financial results
For the three months ended For the nine months ended 2021 2020 2021 2020$ millions, except as otherwise noted September 30 September 30 Change September 30 September 30 Change
FINANCIAL HIGHLIGHTS Revenue $ 20.7 $ 24.9 (17%) $ 73.6 $ 91.6 (20%)Combined revenue(1) 120.2 115.3 4% 414.2 361.1 15%Loss from operations and joint venture (10.8) (124.7) 91% (12.0) (163.2) 93%Net (loss) earnings from continuing operations (15.5) 11.4 (236%) (27.8) (36.4) 24%(Loss) earnings from discontinued operations, net of tax (0.7) 217.1 (100%) (4.7) 108.2 (104%)Net (loss) earnings for the period (16.2) 228.5 (107%) (32.5) 71.8 (145%)Adjusted net loss from continuing operations(1) (13.4) (16.1) 17% (28.7) (73.0) 61%Adjusted EBITDA(1) 17.6 15.5 14% 65.8 28.2 133%
Net (loss) earnings from continuing operations ($ per share) (basic and diluted) $ (0.04) $ 0.03 (233%) $ (0.07) $ (0.09) 22%Net (loss) earnings ($ per share) (basic and diluted) (0.04) 0.58 (107%) (0.08) 0.18 (144%)
CASH Cash, cash equivalents and short-term investments $ 163.4 $ 167.4 (2%) $ 163.4 $ 167.4 (2%) (prior period, December 31, 2020)Cash provided by continuing operations for operating activities 16.2 25.3 (36%) 14.7 35.3 (58%)Combined free cash flow(1) 19.3 27.1 (29%) 40.9 29.5 39%Distributions received from Moa Joint Venture(2) 12.7 - - 35.9 13.3 170% OPERATIONAL DATA
SPENDING ON CAPITAL AND INTANGIBLE ASSETS 13.3 $ 5.8 129% $ 26.4 $ 24.7 7%
PRODUCTION VOLUMES Finished nickel (50% basis, tonnes) 2,908 3,750 (22%) 11,326 11,733 (3%)Finished cobalt (50% basis, tonnes) 334 409 (18%) 1,287 1,234 4%Electricity (gigawatt hours) (33⅓% basis) 110 152 (28%) 320 458 (30%)
AVERAGE EXCHANGE RATE (CAD/US$) 1.260 1.332 (5%) 1.251 1.354 (8%)
AVERAGE-REALIZED PRICES(1) Nickel ($ per pound) $ 10.76 $ 8.36 29% $ 9.99 $ 7.80 28%Cobalt ($ per pound) 27.03 16.71 62% 23.69 17.95 32%Electricity ($ per megawatt hour) 54.57 57.55 (5%) 53.93 57.67 (6%) UNIT OPERATING COSTS(1) Nickel (NDCC) (US$ per pound) $ 4.53 $ 4.04 12% $ 4.30 $ 4.09 5%Electricity ($ per megawatt hour) 23.14 14.63 58% 23.19 14.44 61%
(1) For additional information, see the Non-GAAP and other financial measures section.
(2) Excludes redirections of dividends from Sherritt’s joint venture partner.

Sherritt International Corporation 19
Revenue for the three and nine months ended September 30, 2021 of $20.7 million and $73.6 million, respectively, which excludes revenue from the Moa Joint Venture as it is accounted for under the equity method, was lower compared to the same periods in the prior year primarily due to lower oil and gas revenue, lower power generation and lower fertilizer revenue for the nine months ended September 30, 2021. Oil and gas revenue decreased during the three and nine months ended September 30, 2021 compared to the prior year periods as a result of the expiration of the Puerto Escondido/Yumuri production-sharing contract during the first quarter of 2021.
The Corporation uses combined revenue as a measure to help management assess the Corporation’s financial performance, including the Corporation’s consolidated financial results and the results of its 50% share of the Moa Joint Venture.
Combined revenue(1) is composed of the following:
(1) For additional information, see the Non-GAAP and other financial measures section.
The change in net earnings (loss) from continuing operations(1) is detailed below:

Management’s discussion and analysis
20 Sherritt International Corporation
At the Moa Joint Venture and Fort Site, revenue for the three and nine months ended September 30, 2021 was 11% and 23% higher, respectively, than the same periods in the prior year primarily due to higher average-realized nickel, cobalt and fertilizer prices, partially offset by lower nickel, cobalt and fertilizer sales volumes for the three months ended September 30, 2021 and lower fertilizer sales volume for the nine months ended September 30, 2021. NDCC for the three and nine months ended September 30, 2021 was 12% and 5% higher, respectively, than the same periods in the prior year primarily due to higher mining, processing and refining costs, higher third-party feed costs and higher fertilizer and sulphuric acid by-product costs, partially offset by higher cobalt, fertilizer and sulphuric acid by-product credits due to higher average-realized prices. The increase in average-realized nickel prices more than offset the increase in NDCC.
In the prior year periods, the Corporation recognized an impairment loss of Oil assets of $115.6 million and a gain on debenture exchange of $143.4 million related to a transaction in the prior year, with no comparable amounts in the current year periods.
Within administrative expenses, for the three and nine months ended September 30, 2021, severance and other contractual benefits expense increased by $3.3 million and $4.9 million, respectively, primarily due to the departures of two senior executives. Within administrative expenses, for the nine months ended September 30, 2021, share-based compensation expense increased by $11.8 million primarily as a result of an increase in the Corporation’s share price since December 31, 2020, coupled with accelerated share-based compensation expense of $4.6 million as a result of the departures of two senior executives and $0.8 million as a result of the May 2021 reduction of 10% of the Corporate office salaried workforce.
Interest expense for the three and nine months ended September 30, 2021 decreased by $3.1 million and $11.9 million, respectively, compared to the prior year periods due to the reduction in loans and borrowings. For the nine months ended September 30, 2020, the Corporation recognized a gain on revaluation of the Moa Joint Venture expansion loans receivable allowance for expected credit loss, with no comparable gain in the current period given the extinguishment of the loans receivable in the prior year.
At the Moa Joint Venture, income tax expense for the three and nine months ended September 30, 2021 increased by $6.3 million and $15.5 million, respectively, compared to the prior year periods primarily due to an increase in taxable earnings of the operating companies in the Moa Joint Venture.

Sherritt International Corporation 21
ADJUSTED EBITDA
Total Adjusted EBITDA(1) for the three and nine months ended September 30, 2021 was $17.6 million and $65.8 million, respectively, compared to $15.5 million and $28.2 million, respectively, in the same periods in the prior year, representing increases of 14% and 133%, respectively, over the prior year periods. Adjusted EBITDA by segment is as follows:
(1) For additional information, see the Non-GAAP and other financial measures section.

Management’s discussion and analysis
22 Sherritt International Corporation
Liquidity As at September 30, 2021, total available liquidity was $217.6 million, which is composed of cash, cash equivalents, short-term investments and $54.2 million of available credit facilities. Refer to the Capital resources section for further details on the amendment to the syndicated revolving-term credit facility. Effective September 30, 2020, the Corporation did not renew a $47.0 million letter of credit issued to support its share of the environmental rehabilitation obligations held by its Spanish operations. Subsequent to period-end, the environmental rehabilitation obligations held by the Corporation’s Spanish Oil and Gas operations were secured by a parent company guarantee of €31.5 million until December 31, 2023, with no impact on the Corporation’s available liquidity. Total available liquidity excludes restricted cash of $1.3 million.
Cash, cash equivalents and short-term investments as at September 30, 2021 decreased by $4.0 million from December 31, 2020. The components of this change are shown below:
(1) Excludes receipt of distributions from the Moa Joint Venture, dividend redirections from GNC, interest received on the Energas CSA and interest paid on notes
presented separately above.
(2) Dividend redirections from GNC and interest received on the Energas CSA are net of a 33⅓% elimination.
The Corporation’s cash, cash equivalent and short-term investments are deposited in the following countries:
Cash equivalents and short-term$ millions, as at September 30, 2021 Cash investments Total
Canada $ 58.0 $ 24.1 $ 82.1Cuba 80.1 - 80.1Other 1.2 - 1.2 $ 139.3 $ 24.1 $ 163.4 Sherritt's share of cash in the Moa Joint Venture, not included in the above balances: $ 37.6

Sherritt International Corporation 23
SOURCES AND USES OF CASH
The Corporation’s cash flows from operating, investing and financing activities are summarized in the following table as derived from Sherritt’s condensed consolidated statements of cash flow.
For the three months ended For the nine months ended
2021 2020 2021 2020$ millions September 30 September 30 Change September 30 September 30 Change Cash provided (used) by operating activities Fort Site cash provided (used) by operating activities $ 7.2 $ 13.2 (45%) $ (7.2) $ 7.9 (191%)Metals Other cash (used) provided by operating activities (2.3) 0.1 nm(4) 8.2 7.0 17%Oil and Gas cash provided (used) by operating activities 2.1 (5.2) 140% 1.9 (21.2) 109%Power cash provided by operating activities(1) 2.8 16.6 (83%) 2.4 26.8 (91%)Technologies cash used by operating activities (2.9) (2.4) (21%) (8.8) (7.2) (22%)Corporate cash used by operating activities(2) (3.6) (1.3) (177%) (17.4) (12.0) (45%)Distributions received from Moa Joint Venture 12.7 - - 35.9 13.3 170%Dividend redirections from GNC - - - 11.3 - -Interest received on Energas CSA 0.2 4.3 (95%) 3.6 20.8 (83%)Interest paid on notes/debentures - - - (15.2) - -Other cash used by operating activities - - - - (0.1) 100%Cash provided by continuing operations 16.2 25.3 (36%) 14.7 35.3 (58%)Cash used by discontinued operations (4.9) (4.6) (7%) (5.5) (5.7) 4%Cash provided by operating activities $ 11.3 $ 20.7 (45%) $ 9.2 $ 29.6 (69%) Cash (used) provided by investing and financing activitiesProperty, plant, equipment and intangible asset expenditures $ (3.6) $ (2.5) (44%) $ (7.8) $ (8.7) 10%Receipts of advances, loans receivable and other financial assets 0.2 0.2 - 0.6 0.5 20%Repayment of other financial liabilities (0.5) (0.4) (25%) (1.1) (1.5) 27%Repurchase of notes - - - (4.6) - -Fees paid on debenture exchange - (23.3) 100% (0.2) (23.3) 99%Cash used by investing and financing activities $ (3.9) $ (26.0) 85% $ (13.1) $ (33.0) 60%Effect of exchange rate changes on cash and cash equivalents 2.2 (2.0) 210% (0.1) 2.4 (104%)Increase (decrease) in cash and cash equivalents 9.6 (7.3) 232% (4.0) (1.0) (300%) Cash, cash equivalents and short-term investments: Beginning of the period 153.8 172.4 (11%) 167.4 166.1 1%End of the period(3) $ 163.4 $ 165.1 (1%) $ 163.4 $ 165.1 (1%)
(1) Excluding interest received on the Energas CSA and dividend redirections from GNC, which are presented separately.
(2) Excluding distributions received from the Moa Joint Venture and interest paid on notes/debentures, which are presented separately.
(3) As at September 30, 2021, $76.7 million of the Corporation’s cash and cash equivalents was held by Energas (December 31, 2020 - $75.0 million).
(4) Not meaningful (nm).
The following significant items affected the sources and uses of cash:
Cash provided by operating activities was lower for the three and nine months ended September 30, 2021, respectively, compared to the same periods in the prior year, primarily as a result of the following:
lower cash provided by operating activities at Fort Site for the three and nine months ended September 30, 2021, respectively, primarily due to the timing of working capital receipts and payments;
higher cash used by operating activities at Metals Other for the three months ended September 30, 2021 primarily due to timing of working capital receipts and payments. Cash provided by operating activities at Metals Other was higher for the nine months ended September 30, 2021 primarily due to timing of working capital receipts and payments and a $20.3 million prepayment received for deliveries of nickel in 2021, compared to a prepayment of $16.0 million received in the prior year period;
higher cash provided by operating activities at Oil and Gas for the three and nine months ended September 30, 2021 primarily due to higher Cuban energy receipts and lower operational spending as a result of the expiration of the Puerto Escondido/Yumuri production-sharing contract during the first quarter of 2021;
lower cash provided by operating activities at Power for three and nine months ended September 30, 2021 primarily due to lower electricity production and increased maintenance activities;
higher cash used by operating activities at Corporate for the three and nine months ended September 30, 2021 primarily due to the timing of working capital payments;

Management’s discussion and analysis
24 Sherritt International Corporation
higher distributions received from the Moa Joint Venture for the three and nine months ended September 30, 2021, indicative of improved nickel and cobalt average-realized prices;
higher dividend redirections from GNC for the nine months ended September 30, 2021 to fund Energas operations. Dividend redirections from GNC are net of a 33⅓% elimination;
lower interest received on the Energas CSA for the three and nine months ended September 30, 2021 due to Cuba’s limited access to foreign currency and Cuban currency unification. Interest received on the Energas CSA is net of a 33⅓% elimination; and
higher interest paid for the nine months ended September 30, 2021 on the 8.50% second lien secured notes due 2026 due to the deferral of interest payments in the prior year period.
Included in investing and financing activities for the three and nine months ended September 30, 2021 are expenditures on property, plant and equipment and intangible assets, which were comparable to the prior year periods, and nil and $4.6 million, respectively, of repurchases of the 8.50% second lien secured notes due 2026.
The Corporation’s increase and decrease in cash, cash equivalents and short-term investments reconcile to Adjusted EBITDA as follows for the three and nine months ended September 30, 2021, respectively:
For the three months ended For the nine months ended$ millions September 30, 2021 September 30, 2021 Adjusted EBITDA(1) $ 17.6 $ 65.8Add (deduct): Moa Joint Venture Adjusted EBITDA (28.8) (105.5) Distributions from the Moa Joint Venture 12.7 35.9 Interest received on Energas conditional sales agreement 0.2 3.6 Interest paid on notes - (15.2) Net change in non-cash working capital 13.5 16.1 Share-based compensation expense 0.8 15.0 Other 0.2 (1.0)Cash provided by continuing operations for operating activities per financial statements
16.2 14.7
Deduct: Cash used by discontinued operations (4.9) (5.5) Repurchase of notes - (4.6) Property, plant, equipment and intangible asset expenditures (3.6) (7.8) Fees paid on debenture exchange - (0.2) Effect of exchange rate changes on cash and cash equivalents 2.2 (0.1) Other (0.3) (0.5)Change in cash, cash equivalents and short-term investments $ 9.6 $ (4.0)
(1) For additional information see the Non-GAAP and other financial measures section.
CONSOLIDATED FINANCIAL POSITION
The following table summarizes the significant items as derived from the condensed consolidated statements of financial position:
2021 2020$ millions, except as noted, as at September 30 December 31 Change
Financial condition Cash, cash equivalents and short-term investments $ 163.4 $ 167.4 (2%)Working capital 170.4 211.8 (20%)Current ratio 1.94:1 2.25:1 (16%)Total assets $ 1,333.1 $ 1,352.2 (1%)Loans and borrowings 444.7 441.4 1%Total liabilities 759.8 745.4 2%Shareholders' equity 573.3 606.8 (6%)

Sherritt International Corporation 25
Outlook 2021 PRODUCTION, UNIT OPERATING COST AND CAPITAL SPENDING GUIDANCE
Based on operational results achieved through September 30, prevailing commodity prices, anticipated performance and expected input cost and planned capital spend for the year, Sherritt updated its production and planned capital spend guidance for 2021. Guidance Year-to-date Updated
for 2021 - actuals - 2021 guidance -Production volumes, unit operating costs and spending on capital Total Total Total Production volumes Moa Joint Venture (tonnes, 100% basis) Nickel, finished 32,000 - 34,000 22,652 31,000 - 32,000 Cobalt, finished 3,300 - 3,600 2,574 No changeElectricity (GWh, 33⅓% basis) 450 - 500 320 No change Unit operating costs Moa Joint Venture - NDCC (US$ per pound) $4.25 - $4.75 $4.30 No changeElectricity (unit operating cost, $ per MWh) $30.50 - $32.00 $23.19 No change Spending on capital Moa Joint Venture (50% basis), Fort Site (100% basis)(1) US$44 (CDN$57) US$21 (CDN$26) US$35 (CDN$44)Power (33⅓% basis) US$1 (CDN$1.3) US$0 (CDN$0) No changeSpending on capital (excluding Corporate) US$45 (CDN$58) US$21 (CDN$26) US$36 (CDN$45)
(1) Spending is 50% of US$ expenditures for the Moa JV and 100% expenditures for Fort Site fertilizer and utilities.

Management’s discussion and analysis
26 Sherritt International Corporation
Significant factors influencing operations As a commodity-based business, Sherritt’s operating results are primarily influenced by the prices of nickel and cobalt.
Nickel
Nickel prices hit a seven-year high in Q3, climbing to US$9.24/lb on September 10. The price increase was driven by improving market fundamentals, including strong demand from across multiple industries, reduced inventory levels, and supply disruptions caused in part by COVID-19. By the end of the quarter, nickel prices retreated closing at US$8.25/lb on September 30 on concerns of a potential debt crisis in China as well as by speculation that stainless steel production would be impacted by China’s efforts to ration power supply. Since the start of Q4, nickel prices have recovered, reaching a high of US$9.31/lb on October 21. It is anticipated that nickel prices will be sustained at current levels through end of year.
Strong nickel demand in Q3 was reflected by the continued decrease in inventory levels since the start of 2021. In Q3, nickel inventory levels on the London Metals Exchange (LME) fell by 32% from 232,476 tonnes at the start of the period to 157,062 tonnes on September 30. Similarly, inventory levels on the Shanghai Futures Exchange fell to 3,728 tonnes, down 25% from 4,982 tonnes at the start of the quarter.
Continued strong demand and market tightness led a number of industry analysts, including Wood Mackenzie and S&P Global, to forecast a nickel supply deficit in 2021 in contrast to forecasts of a nickel surplus at the start of the year. As at October 15, nickel inventories on the LME declined further to 146,022 tonnes.
Although market conditions are currently favorable for nickel producers, nickel inventory level uncertainty is anticipated in 2022 and 2023 with some industry analysts forecasting an inventory surplus in the coming years. Visibility of market conditions in the medium term is limited and no new sources of supply are anticipated.
The long-term outlook for nickel remains bullish on account of the strong demand expected from the electric vehicle battery market. Some market observers, such as Wood Mackenzie, have forecast a prolonged nickel supply deficit beginning in 2025 due to recent developments in the electric vehicle market and no new nickel production coming on stream in the near term.
Over the past year, in particular, multiple automakers and governments have announced plans for significant investments to expand electric vehicle production capacity to meet growing demand as well as more aggressive timelines to phase out the sale of internal combustion engines. In 2020, more than three million plug-in electric vehicles (PEV) were sold despite the global pandemic. Industry observers estimate that the number of PEVs sold in 2021 will double to 6.1 million units. CRU has forecast that electric vehicles sales will grow to 13.7 million units by 2025.
As a result of its unique properties, high-nickel cathode formulations remain the dominant choice for long-range vehicles manufactured by automakers with Class 1 nickel being an essential feedstock in the battery supply chain. Sherritt is particularly well positioned given our Class 1 production capabilities and the fact that Cuba possesses the world’s fourth largest nickel reserves.
Cobalt
Cobalt prices in Q3 2021 were marked by a steady rise, closing on September 30 at US$25.88/lb, up 13% from US$22.90/lb at the start of the quarter according to data collected by Fastmarkets MB.
Higher cobalt prices in Q3 2021 were largely driven by increased buying from electric vehicle battery manufacturers. Cobalt is a key component of rechargeable batteries providing energy stability. Higher cobalt prices in Q3 2021 were also driven by increased stockpiling from consumers and by supply logistics disruptions in South Africa, where cobalt produced in the Democratic Republic of Congo, the source of almost two-thirds of the world’s supply, is sent before being shipped internationally.
Industry observers, such as CRU, expect cobalt prices to continue to rise in the near term with prices forecast to peak at US$31/lb in 2024 as limited new sources of supply have been announced to fill expected demand over the next five years.
The outlook for cobalt over the long term remains bullish as demand is expected to grow to 270,000 tonnes by 2025, representing a compound annual growth rate of 13.5% according to CRU.

Sherritt International Corporation 27
Review of operations
MOA JOINT VENTURE AND FORT SITE For the three months ended For the nine months ended 2021 2020 2021 2020 $ millions (Sherritt's share), except as otherwise noted September 30 September 30 Change September 30 September 30 Change
FINANCIAL HIGHLIGHTS Revenue(1)(2) $ 108.9 $ 97.7 11% $ 377.4 $ 306.7 23%Earnings (loss) from operations 14.6 3.0 387% 62.1 (0.5) nm(4)
Adjusted EBITDA(1) 27.1 17.4 56% 102.9 43.9 134%
CASH FLOW Cash provided by operations $ 36.5 $ 23.1 58% $ 81.6 $ 40.3 102%Free cash flow(1) 23.2 16.3 42% 55.9 20.4 174%
PRODUCTION VOLUME (tonnes) Mixed Sulphides 4,666 4,671 - 12,617 13,008 (3%)Finished Nickel 2,908 3,750 (22%) 11,326 11,733 (3%)Finished Cobalt 334 409 (18%) 1,287 1,234 4%Fertilizer 46,730 53,743 (13%) 180,038 179,609 -
NICKEL RECOVERY (%) 87% 90% (3%) 85% 86% (1%)
SALES VOLUME (tonnes) Finished Nickel 2,989 3,568 (16%) 11,434 11,510 (1%)Finished Cobalt 372 501 (26%) 1,301 1,235 5%Fertilizer 25,201 36,169 (30%) 117,034 139,380 (16%)
AVERAGE REFERENCE PRICE (US$ per pound) Nickel $ 8.67 $ 6.45 34% $ 8.18 $ 5.93 38%Cobalt(3) 24.55 14.87 65% 22.46 15.52 45%
AVERAGE-REALIZED PRICE(1) Nickel ($ per pound) $ 10.76 $ 8.36 29% $ 9.99 $ 7.80 28%Cobalt ($ per pound) 27.03 16.71 62% 23.69 17.95 32%Fertilizer ($ per tonne) 432.63 289.04 50% 391.73 359.27 9%
UNIT OPERATING COST(1) (US$ per pound)
Nickel - net direct cash cost $ 4.53 $ 4.04 12% $ 4.30 $ 4.09 5%
SPENDING ON CAPITAL
Sustaining $ 13.2 $ 6.8 94% $ 25.6 $ 22.9 12%
$ 13.2 $ 6.8 94% $ 25.6 $ 22.9 12%
(1) For additional information, see the Non-GAAP and other financial measures section.
(2) Revenue of Moa Joint Venture and Fort Site for the three months ended September 30, 2021 is composed of revenue recognized by the Moa Joint Venture of $99.5
million (50% basis), which is equity-accounted and included in share of earnings (loss) of Moa Joint Venture, net of tax, and revenue recognized by Fort Site of $9.4
million, which is included in consolidated revenue (for the three months ended September 30, 2020 - $90.4 million and $7.3 million, respectively). Revenue of Moa
Joint Venture and Fort Site for the nine months ended September 30, 2021 is composed of revenue recognized by the Moa Joint Venture of $340.6 million (50%
basis), which is equity-accounted and included in share of earnings (loss) of Moa Joint Venture, net of tax, and revenue recognized by Fort Site of $36.8 million, which
is included in consolidated revenue (for the nine months ended September 30, 2020 - $269.5 million and $37.2 million, respectively).
(3) Average standard-grade cobalt published price per Fastmarkets MB.
(4) Not meaningful (nm).

Management’s discussion and analysis
28 Sherritt International Corporation
Revenue, cost of sales and NDCC are composed of the following:
For the three months ended For the nine months ended
2021 2020 2021 2020
$ millions, except as otherwise noted September 30 September 30 Change September 30 September 30 Change
REVENUE
Nickel $ 70.9 $ 65.8 8% $ 251.7 $ 198.0 27%
Cobalt 22.2 18.4 21% 67.9 48.8 39%
Fertilizers 10.9 10.5 4% 45.8 50.1 (9%)
Other 4.9 3.0 63% 12.0 9.8 22% $ 108.9 $ 97.7 11% $ 377.4 $ 306.7 23%
COST OF SALES(1)
Mining, processing and refining (MPR) $ 50.9 $ 50.6 1% $ 175.0 $ 170.3 3%
Third-party feed costs 4.0 3.7 8% 15.1 11.3 34%
Fertilizers 9.5 12.9 (26%) 40.5 45.5 (11%)
Selling costs 4.0 3.7 8% 12.7 13.1 (3%)
Other 11.4 7.5 52% 24.8 15.8 57% $ 79.8 $ 78.4 2% $ 268.1 $ 256.0 5%
NET DIRECT CASH COST(2) (US$ per pound of nickel) Mining, processing and refining costs $ 6.43 $ 4.90 31% $ 5.73 $ 5.00 15%Third-party feed costs 0.48 0.36 33% 0.48 0.33 45%Cobalt by-product credits (2.67) (1.76) (52%) (2.15) (1.43) (50%)Other(3) 0.29 0.54 (46%) 0.24 0.19 26% $ 4.53 $ 4.04 12% $ 4.30 $ 4.09 5%
(1) Excludes depletion, depreciation and amortization
(2) For additional information, see the Non-GAAP and other financial measures section.
(3) Includes the Moa Joint Venture and Fort Site refinery fertilizer by-product profit or loss and marketing costs, discounts, and other by-product credits.

Sherritt International Corporation 29
The change in earnings (loss) from operations is detailed below:

Management’s discussion and analysis
30 Sherritt International Corporation
Average-realized prices for nickel were 29% and 28% higher for the three and nine months ended September 30, 2021, respectively, compared to the same periods in the prior year, while average-realized prices for cobalt were 62% and 32% higher compared to the same periods in the prior year, respectively. Average-realized prices are impacted by the timing of deliveries, settlement against contract terms and fluctuations in the value of the Canadian currency. Average-realized prices for the three and nine months ended September 30, 2021 were negatively impacted by a weaker U.S. dollar relative to the Canadian dollar compared to the same periods in the prior year.
Despite additional measures taken to protect employees, suppliers and various stakeholders at operations at Moa and at the refinery in Fort Saskatchewan since the start of the pandemic in March 2020, the significant rise in the number of cases as a result of the spread of the Delta variant of COVID-19 negatively impacted mining operations and transportation activities in Q3 2021. Most notably at Moa, the considerable increase in the number of COVID-19 cases in the Holguin province of Cuba adversely affected mining activities and delayed shipment of mixed sulphides.
Finished nickel and cobalt production at the Moa Joint Venture and Fort Site during the three and nine months ended September 30, 2021 was not materially impacted by COVID-19. For the three months ended September 30, 2021, finished nickel and cobalt production was lower than the same period in the prior year due to a longer annual maintenance shutdown of the refinery in Fort Saskatchewan, unplanned maintenance and transportation delays in shipping mixed sulphides from Moa to the refinery. At the refinery, the rise in number of COVID-19 cases in Alberta coupled with reduced contractor availability resulted in the rescheduling and extension of the full-facility shutdown by two additional days than originally anticipated. This year’s shutdown was a full-facility shutdown, which occurs once every six years, lasted 13 days compared to the typical five-day annual shutdowns and included all of the refinery and utility plants. Refinery operations were also disrupted by unplanned maintenance activities due to equipment and service failures in advance of the full-facility shutdown. Subsequent to the shutdown, repairs to the cobalt reduction autoclave nozzle were required, resulting in a temporary reduction in plant capacity. Mixed sulphides transportation delays early in the third quarter also contributed to the production loss, which were caused by a shipping vessel cancellation due to the impact of COVID-19. These transportation delays in shipping mixed sulphides have since ended. For the nine months ended September 30, 2021, finished nickel production was marginally lower and finished cobalt production was marginally higher than the same period in the prior year. Sherritt’s guidance for 2021 production, unit cost and capital spend at the Moa Joint Venture was based on a full-facility shutdown. As a result of developments in the three months ended September 30, 2021 and anticipated performance through the balance of the year, Sherritt has adjusted its guidance for 2021 and now expects to produce 31,000 to 32,000 tonnes of finished nickel for 2021 (100% basis). Guidance for finished cobalt production is unchanged at 3,300 to 3,600 tonnes (100% basis).
Mixed sulphides production was comparable and 3% lower for the three and nine months ended September 30, 2021, respectively, compared to the same periods in the prior year. The lower production for the nine months ended September 30, 2021 compared to the same period in the prior year was primarily due to lower sulphur availability caused by shipment and unloading delays at the Moa port during the second quarter of 2021. This resulted in the shutdown of the acid plants, which in turn caused the shutdown of the leach plant for approximately four days, which has since returned to production capacity. Furthermore, mixed sulphides production was negatively impacted in the first quarter of 2021 by lower ore quality caused by the impact of heavy rainfall on mining operations, which was offset by high feed inventory levels at the refinery in Fort Saskatchewan.
The nickel recovery rates for the three and nine months ended September 30, 2021 were 3% and 1% lower, respectively, than the same periods in the prior year primarily due to lower sulphuric acid availability and lower wash efficiencies.
The ratios of finished nickel to cobalt production for the three and nine months ended September 30, 2021 were comparable with the same periods in the prior year.
Fertilizer production for the three months ended September 30, 2021 was 13% lower than the same period in the prior year reflecting lower metals production and timing of planned maintenance activities. Fertilizer production for the nine months ended September 30, 2021 was comparable to the same period in the prior year.
Mining, processing and refining (MPR) unit costs were 31% and 15% higher for the three and nine months ended September 30, 2021, respectively, compared to the same periods in the prior year primarily due to higher sulphur and fuel oil prices, and the impact of lower production volumes on period costs, partially offset by lower labour and other service costs at Moa as a result of Cuban currency unification. MPR costs for the nine months ended September 30, 2021 were also impacted by higher purchased sulphuric acid consumption due to the planned sulphuric acid plant shutdown at Moa in the second quarter of 2021. The Corporation continues to monitor the impact of currency unification on labour and other service costs, which may change if further legislation and regulation is issued in 2021 as the Cuban government evaluates the impact of the currency unification process.
Sherritt International Corporation 31
NDCC for the three and nine months ended September 30, 2021 was US$4.53 per pound and US$4.30 per pound, respectively, 12% and 5% higher, compared to the same periods in the prior year. NDCC was higher primarily as a result of higher MPR costs, as discussed above, higher third-party feed costs and higher fertilizer and sulphuric acid by-product costs, partially offset by higher cobalt, fertilizer and sulphuric acid by-product credits due to higher average-realized prices. Higher fertilizer and sulphuric acid by-product costs were primarily due to higher sulphur and energy prices. NDCC guidance for 2021 remains unchanged at US$4.25 to $4.75 per pound of nickel sold as the recent rise in cobalt prices partially offsets the rise in input costs.
Sustaining capital spending for the three and nine months ended September 30, 2021 was higher compared to the same periods in the prior year primarily due to the timing of planned capital expenditures and the receipt of new mining equipment at Moa. Sustaining capital spending for the nine months ended September 30, 2020 was impacted by the cost control measures implemented in Q1 2020 in response to volatile commodity prices and uncertainties related to the impact of COVID-19. Sherritt’s share of planned spending at the Moa Joint Venture and Fort Site in 2021 has been reduced to US$35 million from US$44 million, and is primarily earmarked for the continued replacement of mine and plant equipment. The reduction in planned capital spending reflects operating challenges, including freight and order delays caused by COVID-19.
During the three and nine months ended September 30, 2021, the Moa Joint Venture paid distributions of US$20.0 million and US$58.0 million, respectively, to its shareholders, of which US$10.0 million and US$29.0 million, respectively, was paid to Sherritt directly, representing its 50% share. During the three and nine months ended September 30, 2021, GNC, Sherritt’s joint venture partner, redirected nil and US$14.0 million, respectively, of distributions to the Corporation to fund Energas operations. Higher distributions in the current year periods were indicative of improved average-realized nickel and cobalt prices. Sherritt anticipates receipt of additional distributions from the Moa Joint Venture through to the end of 2021 based on prevailing nickel and cobalt prices, planned capital spend and liquidity requirements for the Moa Joint Venture.
In 2020, an initiative was launched at the Moa Joint Venture to reduce carbon emissions through the use of renewable energy, including a project to electrify light vehicles. As of September 30, 2021, eight electric light vehicles have been delivered and an additional one is expected to be delivered by the end of the year. In addition, plans are being implemented for further electric vehicle replacements and other renewable energy projects beyond 2021.
With support from Sherritt Technologies, the Moa Joint Venture and Fort Site are exploring a number of expansion opportunities, including brownfield development opportunities with the Corporation’s joint venture partner to improve operational performance and reduce carbon emissions. Expansion plans consist of a multi-phased approach, and includes completion of the new slurry preparation plant and other expansion circuits at Moa, installation of new equipment and upgrading existing equipment at the refinery in Fort Saskatchewan, Alberta, updating the 43-101 Technical Report published in June 2019 that reported more than 158 million tonnes of measured and indicated resources at 1% nickel and 0.13% cobalt at Moa to reflect production based on economic rather than a fixed, cut-off grade, and leveraging the expertise of Sherritt Technologies to optimize mine planning and performance.
Sherritt and its Cuban partners are currently finalizing the timelines and economics of the various projects, including determining funding requirements. Sherritt expects to provide an update on the rollout of the Moa Joint Venture expansion strategy by the end of the first quarter of 2022.

Management’s discussion and analysis
32 Sherritt International Corporation
POWER For the three months ended For the nine months ended 2021 2020 2021 2020 $ millions (33⅓% basis), except as otherwise noted September 30 September 30 Change September 30 September 30 Change
FINANCIAL HIGHLIGHTS Revenue $ 7.3 $ 9.4 (22%) $ 20.2 $ 28.4 (29%)Earnings (loss) from operations 0.2 1.6 (88%) (1.1) 4.5 (124%)Adjusted EBITDA(1) 4.1 6.8 (40%) 10.6 20.3 (48%) CASH FLOW Cash provided by operations $ 3.0 $ 20.9 (86%) $ 17.3 $ 47.6 (64%)Free cash flow(1) 3.0 20.2 (85%) 17.3 46.9 (63%) PRODUCTION AND SALES Electricity (GWh(2)) 110 152 (28%) 320 458 (30%) AVERAGE-REALIZED PRICE(1) Electricity (per MWh(2)) $ 54.57 $ 57.55 (5%) $ 53.93 $ 57.67 (6%) UNIT OPERATING COST Electricity (per MWh(1)(2)) 23.14 14.63 58% 23.19 14.44 61% SPENDING ON CAPITAL Sustaining $ - $ 0.8 (100%) $ - $ 0.8 (100%) $ - $ 0.8 (100%) $ - $ 0.8 (100%)
(1) For additional information see the Non-GAAP and other financial measures section.
(2) Gigawatt hours (GWh), Megawatt hours (MWh).
Power revenue is composed of the following:
For the three months ended For the nine months ended 2021 2020 2021 2020 $ millions (33⅓% basis) September 30 September 30 Change September 30 September 30 Change
Electricity sales $ 6.1 $ 8.7 (30%) $ 17.3 $ 26.4 (34%)By-products and other 1.2 0.7 71% 2.9 2.0 45% $ 7.3 $ 9.4 (22%) $ 20.2 $ 28.4 (29%)
Maintenance activities continued in the third quarter of 2021, which contributed to lower electricity production and sales volume for the three and nine months ended September 30, 2021 compared to the same periods in the prior year. The Corporation has prioritized spending of available liquidity and will continue with completion of deferred and scheduled maintenance for the remainder of the year.
The decrease in the average-realized price of electricity for the three and nine months ended September 30, 2021 compared to the same periods in the prior year was due to the weaker U.S. dollar relative to the Canadian dollar.

Sherritt International Corporation 33
Unit operating costs were higher for the three and nine months ended September 30, 2021 compared to the same periods in the prior year as a result of lower sales volume and higher operational spending on maintenance activities. These increases were partially offset by the positive impact of a weaker U.S. dollar relative to the Canadian dollar, as costs are primarily denominated in U.S. dollars, and by the impact of Cuban currency unification, which lowered labour and third-party service costs.
The Corporation’s current contract term for power generation from Energas expires in March 2023 and the Corporation is continuing discussions with its Cuban partners to extend the contract term.
TECHNOLOGIES For the three months ended For the nine months ended 2021 2020 2021 2020 $ millions September 30 September 30 Change September 30 September 30 Change
FINANCIAL HIGHLIGHTS Revenue $ 0.2 $ 0.1 100% $ 0.4 $ 0.4 -Cost of sales (3.0) (2.2) (36%) (9.4) (7.9) (19%)Loss from operations $ (2.8) $ (2.1) (33%) $ (9.0) $ (7.5) (20%)
With a renewed emphasis on leveraging the value of its Technologies business, the Corporation is committed to identifying commercial implementation opportunities that address improving current operations’ financial performance and product quality, as well as making next-generation nickel mining more economically viable and more sustainable and developing project opportunities for the generation of battery-grade nickel and cobalt products from lateritic ores. Value levers include improving the purity of nickel, reducing environmental impacts such as water, greenhouse gas emissions and a reduction in tailings, extending the life of existing assets, increasing the recovery of high-value metals, and reducing operating costs and capital requirements.
Sherritt Technologies continued its efforts to transition from a cost centre to an incubator of industry solutions that can also be commercialized externally or applied internally to improve operational performance, reduce carbon emissions, and support growth initiatives, such as efforts to de-bottleneck production, evaluate brownfield expansion opportunities and increase mineral reserves. Sherritt Technologies’ innovation pipeline is an efficient vehicle for rapidly evaluating new ideas and is involved in strategic growth initiatives and the evaluation of merger and acquisition opportunities.
During the three months ended September 30, 2021, the Corporation appointed a Chief Commercial Officer (CCO) with a diverse and extensive mining background. The CCO’s experience in the development and implementation of business strategies and in the sourcing, evaluation, and implementation of investment opportunities will be vital to the success of Sherritt Technologies.
Technologies’ cost of sales relates to the ongoing support for the development of growth opportunities for Sherritt, including process technology solutions and brownfield development projects where Sherritt Technologies has been engaged by the Moa Joint Venture and Fort Site to improve operational performance, some of which are detailed below. Sherritt Technologies’ efforts build on its considerable depth of project and operational experience, and its scientific expertise developed over the years; particularly in hydrometallurgy and lateritic ore processing, representing a key point of differentiation for Sherritt.
During the three months ended September 30, 2021, Sherritt Technologies’ main activities centred on supporting brownfield expansion opportunities in Cuba, including efforts to use of an economic cut-off grade to potentially upgrade resources into reserves, and significantly expand the life of mine.
Other activities included efforts to commercialize Sherritt’s most advanced, innovative technologies. In particular, Sherritt Technologies continued to make progress on its enhanced proprietary process to fully upgrade heavy oil, refining residues and bitumen. Sherritt’s process provides a number of environmental and business benefits, including eliminating the need for bitumen diluent and thereby increasing pipeline capacity, increasing the economic value of the oil transported to downstream markets, as well as reduced energy consumption due to the elimination of energy intensive unit operations, which results in lower carbon emissions. Discussions with external parties regarding the potential use of Sherritt’s process has identified multiple, distinct scenarios for the application of this technology. External industry expertise has been engaged to assist in further developing these specific opportunities. Piloting of the new catalyst system, which allows for full upgrading instead of partial upgrading, will occur during 2022 and will be designed to test the multiple product and processing scenarios. This process has reached a Technology Readiness Level of 5, however, Sherritt Technologies will undergo piloting again with a new catalyst system which allows for full upgrading instead of partial upgrading. The Technology Readiness Level is a measure used to assess a project’s stage of development. There are 9 Technology Readiness Levels, with Level 1 representing the stage at which scientific research begins to be translated into applied research and development and Level 9 representing the stage at which the technology is in its final form and is applied in full scale commercial conditions.

Management’s discussion and analysis
34 Sherritt International Corporation
Sherritt Technologies is also pursuing the commercialization of its proprietary process for the treatment of copper concentrates with higher arsenic content. Arsenic is a poisonous element requiring significant mitigation and management costs rendering certain copper projects uneconomical. With copper demand expected to grow significantly over the next decade, Sherritt’s advanced hydrometallurgical process technology fulfills a pressing industry need, presenting a significant step change in the stabilization of arsenic bearing solid waste, produces net zero carbon emissions, extends the life of aging copper mines, reduces treatment costs and capitalizes on existing infrastructure. Discussions have started with external parties on a variety of potential commercialization routes on optimal sourcing options for laterite ore and copper concentrate. Different copper products can be considered, depending on specific project drivers and circumstances. This process has reached a Technology Readiness Level of 4 after completing successful batch testing and completion of a pilot plant.
CORPORATE For the three months ended For the nine months ended 2021 2020 2021 2020 $ millions September 30 September 30 Change September 30 September 30 Change
EXPENSES Administrative expenses $ 9.1 $ 3.3 176% $ 32.2 $ 18.6 73%
Corporate’s administrative expenses are primarily composed of employee costs, share-based compensation expense, severance and other contractual benefits expense, legal fees and third-party consulting and audit fees.
Administrative expenses at Corporate for the three months ended September 30, 2021 increased by $5.8 million compared to the same period in the prior year primarily due to an increase in other contractual benefits expense of $3.1 million and due to a recovery of $2.7 million recognized in the prior year period for legal and third-party consulting fees reclassified to (loss) earnings from discontinued operations, net of tax. Administrative expenses at Corporate for the nine months ended September 30, 2021 increased by $13.6 million compared to the same period in the prior year primarily due to increases in share-based compensation expense of $10.6 million and severance and other contractual benefits expense of $5.5 million, partially offset by reductions in employee costs of $1.4 million and legal fees incurred of $0.9 million. The increase in share-based compensation expense for the nine months ended September 30, 2021 is primarily due to accelerated vesting as a result of the Corporate workforce reduction and departures, described below, as well as an increase of $0.04 in the Corporation’s share price since December 31, 2020.
During the three and nine months ended September 30, 2021, the Corporation recognized severance expense of nil and $1.0 million, respectively, and accelerated share-based compensation of expense of nil and $0.8 million, respectively, related to the May 2021 reduction of 10% of the Corporate office salaried workforce. The Corporation expects to achieve estimated annual savings of approximately $1.3 million in employee costs going forward as a result of the workforce reduction.
During the three and nine months ended September 30, 2021, the Corporation recognized other contractual benefits expense of $3.1 million and $4.5 million, respectively, and accelerated share-based compensation expense of $0.5 million and $4.6 million, respectively, related to the departures of two senior executives on September 30, 2021 and December 31, 2021. Additional other contractual benefits of $0.5 million will be recognized during the three months ended December 31, 2021 as one of the senior executives completes their service.
Accelerated share-based compensation expense is a result of changes in accounting estimates to reduce the above employees’ vesting periods and forfeiture rates for share-based units previously granted. The timing of recognition of share-based compensation expenses for one of the departing senior executives will also be accelerated during the three months ended December 31, 2021 as they complete their service for share-based units previously granted. The amount of share-based compensation expense to be recognized in future periods will be based on the Corporation’s share price in those periods.

Sherritt International Corporation 35
Capital resources
CONTRACTUAL OBLIGATIONS AND COMMITMENTS
The following table provides a summary of consolidated significant liquidity and capital commitments based on existing commitments and debt obligations (including accrued interest):
Falling Falling Falling Falling FallingFalling due due due due due in
due within between between between between more thanCanadian $ millions, as at September 30, 2021 Total 1 year 1-2 years 2-3 years 3-4 years 4-5 years 5 years
Trade accounts payable and
accrued liabilities $ 137.3 $ 137.3 $ - $ - $ - $ - $ -Income taxes payable 1.1 1.1 - - - - -8.50% second lien secured notes due 2026 535.7 29.8 29.8 30.1 53.8 59.3 332.910.75% unsecured PIK option notes due 2029 192.6 - - - - - 192.6Syndicated revolving-term credit facility 8.2 8.2 - - - - -Provisions 137.8 3.6 4.6 1.6 0.4 0.3 127.3Lease liabilities 18.8 2.6 2.5 2.4 2.4 1.6 7.3Capital commitments 6.5 6.5 - - - - -Other 0.3 - 0.3 - - - -Total $ 1,038.3 $ 189.1 $ 37.2 $ 34.1 $ 56.6 $ 61.2 $ 660.1
SYNDICATED REVOLVING-TERM CREDIT FACILITY
As at September 30, 2021, the Corporation was in compliance with all syndicated revolving-term credit facility covenants.
On October 28, 2021, subsequent to period-end, the syndicated revolving-term credit facility was amended and its maturity extended for two years from April 30, 2022 to April 30, 2024. The maximum credit available increased from $70.0 million to $100.0 million and the interest rates are bankers’ acceptance plus 4.00%, which remain unchanged. Borrowings on the credit facility are available to fund working capital and capital expenditures. Spending on capital expenditures cannot exceed $75.0 million in a fiscal year. This restriction does not apply to capital expenditures of Moa Nickel S.A. The total available draw is based on eligible receivables and inventories, which are pledged as collateral. Certain cash held in banks in Canada is also pledged as collateral.
The facility is subject to the following financial covenants and restrictions as of October 28, 2021:
Net Available Cash covenant, as defined in the agreement, of $25.0 million. The amount compared against this covenant is comprised of cash and cash equivalents and short-term investments of the Corporation and its wholly-owned subsidiaries held in Canada, plus undrawn amounts on the credit facility;
Senior Secured Net Debt-to-EBITDA covenant, as defined in the agreement, of less than 2:1. Senior Secured Net Debt is calculated as first-lien debt, or amounts drawn on the credit facility, any derivative liability and any additional security ranked equal to first-lien debt, less cash and cash equivalents and short-term investments of the Corporation and its wholly-owned subsidiaries held in Canada up to $25.0 million. EBITDA is calculated on a 12-month trailing basis with Energas included on a cash basis.
EBITDA-to-Interest Expense covenant, as defined in the agreement, of not less than 1.5:1 prior to September 30, 2022 and not less than 2:1 thereafter. EBITDA is calculated on a 12-month trailing basis with Energas included on a cash basis. Interest expense excludes the payment-in-kind (PIK) interest on the Corporation’s 10.75% unsecured PIK option notes due 2029; and
Minimum Tangible Net Worth covenant, as defined in the agreement, of $600.0 million plus 50% of positive net earnings. In the event of expiration of the Corporation’s current contract term for power generation from Energas in March 2023, the Minimum Tangible Net Worth covenant decreases to $550.0 million plus 50% of positive net earnings, effective upon the date of expiration, if applicable. Tangible Net Worth is calculated as total assets, less intangible assets, less amounts drawn on the credit facility, less the principal amount of the 8.50% second lien secured notes due in 2026, less the principal amount of the 10.75% unsecured PIK option notes due in 2029, less any derivative liability and less any additional secured financing ranked equal to first-lien debt.

Management’s discussion and analysis
36 Sherritt International Corporation
Effective September 30, 2020, the Corporation did not renew a $47.0 million letter of credit issued to support its share of the environmental rehabilitation obligations held by its Spanish Oil and Gas operations. Subsequent to period-end, the environmental rehabilitation obligations held by the Corporation’s Spanish Oil and Gas operations were secured by a parent company guarantee of €31.5 million until December 31, 2023, with no impact on the Corporation’s available liquidity.
MOA JOINT VENTURE COMMITMENTS
As a result of the Corporation’s 50% interest in the Moa Joint Venture, its proportionate share of significant commitments of the joint venture includes the following, which are not reflected in the table above:
Environmental rehabilitation commitments of $89.7 million, with no significant payments due in the next five years;
Trade accounts payable and accrued liabilities of $29.1 million;
Income taxes payable of $10.4 million;
Lease liabilities of $0.5 million;
Loans and borrowings of $10.9 million; and
Property, plant and equipment commitments of $27.1 million.
Property, plant and equipment commitments include normal course expenditures associated with tailings management facilities.
COMMON SHARES
As at November 3, 2021, the Corporation had 397,288,680 common shares outstanding. An additional 8,611,366 common shares are issuable upon exercise of outstanding stock options granted to employees and directors pursuant to the Corporation’s stock option plan. During the nine months ended September 30, 2021, the 2016 debenture warrants expired and were not exercised.
Managing risk During the three and nine months ended September 30, 2021, Cuba experienced increased hardships as a result of the impact of COVID-19 and continued U.S. sanctions, impacting the country’s tourism and other industries, hampering the country’s foreign currency liquidity and resulting in prolonged border closures, food and medicine shortages, electricity outages and sporadic civil demonstrations. In addition, the number of new cases of COVID-19 in Cuba increased during the nine months ended September 30, 2021, which have since decreased subsequent to period-end. As at October 31, 2021, 88% of Cuba’s population had received at least one vaccine dose and 64% have been fully vaccinated, per Our World in Data. The foregoing may contribute to increased political, economic and related risks to the Corporation. See the discussion of risks associated with COVID-19 in “Risk Factors – Liquidity and Access to Capital” and “Risk Factors – Political, Economic and Other Risks of Foreign Operations” in the Corporation’s Annual Information Form.
The Corporation, together with its Moa Joint Venture and Fort Site and Technologies segments are pursuing a range of growth and expansion opportunities, including without limitation, process technology solutions, development projects, commercial implementation opportunities, life of mine extension opportunities and the conversion of mineral resources to reserves. Certain factors that could, alone or in combination, prevent us from successfully achieving these growth or commercialization opportunities may include, without limitation: identifying suitable commercialization and other partners; successfully advancing discussions and successfully concluding applicable agreements with external parties and/or partners; successfully attracting required financing; successfully developing and proving technology required for the potential opportunity; successfully overcoming technical and technological challenges; successful environmental assessment and stakeholder engagement; successfully obtaining intellectual property protection; successfully completing test work and engineering studies, prefeasibility and feasibility studies, piloting, scaling from small scale to large scale production, commissioning, procurement, construction, commissioning, ramp-up to commercial scale production and completion; securing regulatory and government approvals. There can be no assurance that any growth or commercialization opportunity will be successful, commercially viable, or will generate any meaningful revenues, savings or earnings, as the case may be, for the Corporation. In addition, the Corporation will incur costs in pursuing any particular opportunity, which may be significant.

Sherritt International Corporation 37
Sherritt manages a number of risks in each of its businesses in order to achieve an acceptable level of risk without appreciably hindering its ability to maximize returns. Management has procedures to identify and manage significant operational and financial risks. A comprehensive list of the Corporation’s significant business risks and strategies designed to manage these risks can be found in the Corporation’s Annual Information Form.
Basis of presentation and critical accounting judgments The condensed consolidated financial statements referenced in this MD&A have been prepared in accordance with International Accounting Standard 34 Interim Financial Reporting (IAS 34), as issued by the International Accounting Standards Board (IASB). Accordingly, certain information and footnote disclosures normally included in the annual financial statements prepared in accordance with International Financial Reporting Standards (IFRS), as issued by the IASB, have been omitted or condensed.
The condensed consolidated financial statements are prepared on a going concern basis, under the historical cost convention, except for certain financial assets and liabilities and cash-settled share-based payments, which have been measured at fair value. The going concern basis assumes that the Corporation will continue in operation for the foreseeable future and will be able to realize its assets and discharge its liabilities and commitments in the normal course of business.
The condensed consolidated financial statements have been prepared using the same accounting policies and methods of computation as the annual consolidated financial statements of the Corporation as at and for the year ended December 31, 2020.
The critical accounting estimates and judgments used in the preparation of the condensed consolidated financial statements are consistent with those used in the Corporation’s annual consolidated financial statements as at and for the year ended December 31, 2020. The annual consolidated financial statements included a critical accounting judgment related to impairment of non-financial assets, in part due to uncertainty as a result of COVID-19 and its potential impact on commodity prices and collection of Cuban receivables.
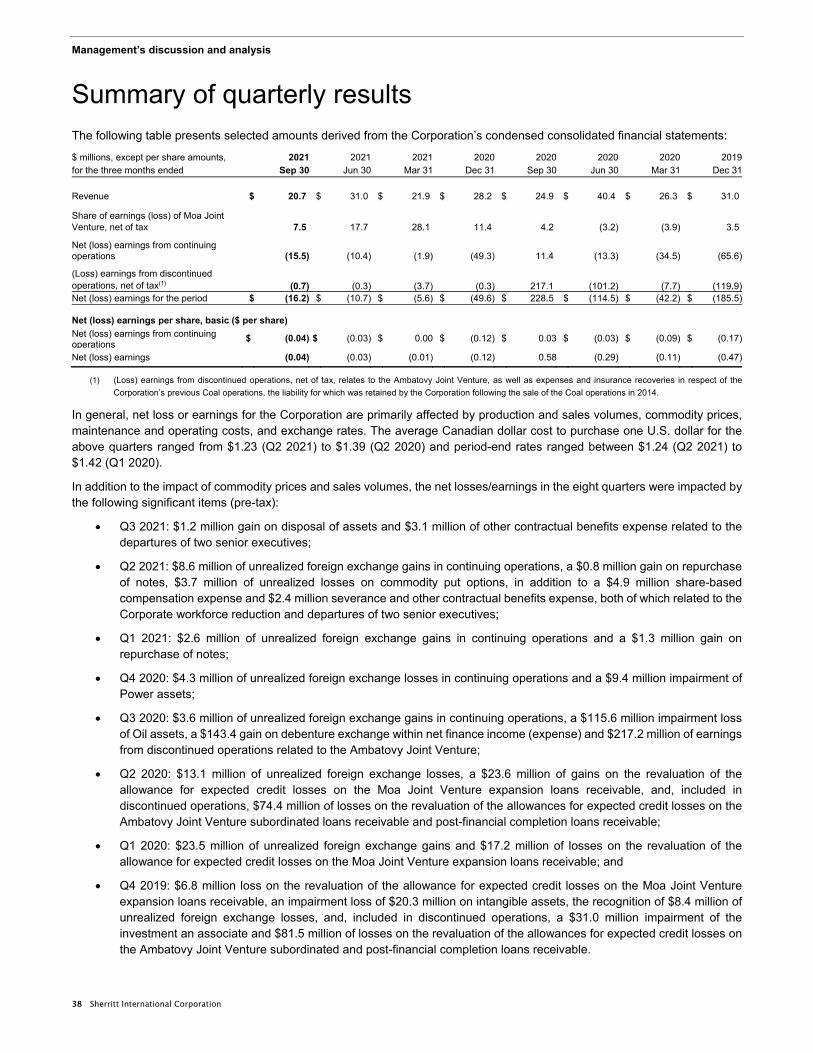
Management’s discussion and analysis
38 Sherritt International Corporation
Summary of quarterly results The following table presents selected amounts derived from the Corporation’s condensed consolidated financial statements:
$ millions, except per share amounts, 2021 2021 2021 2020 2020 2020 2020 2019for the three months ended Sep 30 Jun 30 Mar 31 Dec 31 Sep 30 Jun 30 Mar 31 Dec 31
Revenue $ 20.7 $ 31.0 $ 21.9 $ 28.2 $ 24.9 $ 40.4 $ 26.3 $ 31.0
Share of earnings (loss) of Moa Joint Venture, net of tax 7.5 17.7 28.1 11.4 4.2 (3.2) (3.9) 3.5
Net (loss) earnings from continuing operations (15.5) (10.4) (1.9) (49.3) 11.4 (13.3) (34.5) (65.6)
(Loss) earnings from discontinued operations, net of tax(1) (0.7) (0.3) (3.7) (0.3) 217.1 (101.2) (7.7) (119.9)Net (loss) earnings for the period $ (16.2) $ (10.7) $ (5.6) $ (49.6) $ 228.5 $ (114.5) $ (42.2) $ (185.5)
Net (loss) earnings per share, basic ($ per share)
Net (loss) earnings from continuing operations
$ (0.04) $ (0.03) $ 0.00 $ (0.12) $ 0.03 $ (0.03) $ (0.09) $ (0.17)
Net (loss) earnings (0.04) (0.03) (0.01) (0.12) 0.58 (0.29) (0.11) (0.47)
(1) (Loss) earnings from discontinued operations, net of tax, relates to the Ambatovy Joint Venture, as well as expenses and insurance recoveries in respect of the
Corporation’s previous Coal operations, the liability for which was retained by the Corporation following the sale of the Coal operations in 2014.
In general, net loss or earnings for the Corporation are primarily affected by production and sales volumes, commodity prices, maintenance and operating costs, and exchange rates. The average Canadian dollar cost to purchase one U.S. dollar for the above quarters ranged from $1.23 (Q2 2021) to $1.39 (Q2 2020) and period-end rates ranged between $1.24 (Q2 2021) to $1.42 (Q1 2020).
In addition to the impact of commodity prices and sales volumes, the net losses/earnings in the eight quarters were impacted by the following significant items (pre-tax):
Q3 2021: $1.2 million gain on disposal of assets and $3.1 million of other contractual benefits expense related to the departures of two senior executives;
Q2 2021: $8.6 million of unrealized foreign exchange gains in continuing operations, a $0.8 million gain on repurchase of notes, $3.7 million of unrealized losses on commodity put options, in addition to a $4.9 million share-based compensation expense and $2.4 million severance and other contractual benefits expense, both of which related to the Corporate workforce reduction and departures of two senior executives;
Q1 2021: $2.6 million of unrealized foreign exchange gains in continuing operations and a $1.3 million gain on repurchase of notes;
Q4 2020: $4.3 million of unrealized foreign exchange losses in continuing operations and a $9.4 million impairment of Power assets;
Q3 2020: $3.6 million of unrealized foreign exchange gains in continuing operations, a $115.6 million impairment loss of Oil assets, a $143.4 gain on debenture exchange within net finance income (expense) and $217.2 million of earnings from discontinued operations related to the Ambatovy Joint Venture;
Q2 2020: $13.1 million of unrealized foreign exchange losses, a $23.6 million of gains on the revaluation of the allowance for expected credit losses on the Moa Joint Venture expansion loans receivable, and, included in discontinued operations, $74.4 million of losses on the revaluation of the allowances for expected credit losses on the Ambatovy Joint Venture subordinated loans receivable and post-financial completion loans receivable;
Q1 2020: $23.5 million of unrealized foreign exchange gains and $17.2 million of losses on the revaluation of the allowance for expected credit losses on the Moa Joint Venture expansion loans receivable; and
Q4 2019: $6.8 million loss on the revaluation of the allowance for expected credit losses on the Moa Joint Venture expansion loans receivable, an impairment loss of $20.3 million on intangible assets, the recognition of $8.4 million of unrealized foreign exchange losses, and, included in discontinued operations, a $31.0 million impairment of the investment an associate and $81.5 million of losses on the revaluation of the allowances for expected credit losses on the Ambatovy Joint Venture subordinated and post-financial completion loans receivable.

Sherritt International Corporation 39
Off-balance sheet arrangements As at September 30, 2021, the Corporation had no foreign exchange options, futures or forward contracts and no commodity futures or forward contracts.
During the year ended December 31, 2020, the Corporation purchased put options on nickel. For further details, refer to note 15 of the Corporation’s consolidated financial statements for the year ended December 31, 2020.
Transactions with related parties The Corporation enters into transactions related to its joint arrangements. For further detail, refer to notes 6 and 18 of the Corporation’s condensed consolidated financial statements for the three and nine months ended September 30, 2021.
All amounts outstanding are unsecured and will be settled in cash. No guarantees have been given or received on the outstanding amounts. No expense has been recognized in the current or prior periods for bad debts in respect of amounts owed by related parties.
Supplementary information SENSITIVITY ANALYSIS
The following table shows the approximate impact on the Corporation’s net earnings and earnings per share from continuing operations for the three months ended September 30, 2021 from a change in selected key variables. The impact is measured changing one variable at a time and may not necessarily be indicative of sensitivities on future results.
Approximate
change in quarterly Approximate
net earnings change in quarterly
(CAD$ millions) basic EPS
Factor IncreaseIncrease/
(decrease)Increase/
(decrease)
Prices Nickel - LME price per pound(1) US$ 1.00 $ 6 $ 0.02Cobalt - Fastmarkets MB price per pound(1) US$ 5.00 4 0.01 Exchange rate Strengthening of the Canadian dollar relative to the U.S. dollar $ 0.05 (4) (0.01) Operating costs(1) Natural gas - per gigajoule (Moa Joint Venture and Fort Site) $ 1.00 - -Fuel oil - cost per tonne (Moa Joint Venture and Fort Site) US$ 50.00 (1) -Sulphur - per tonne (Moa Joint Venture and Fort Site) US$ 25.00 (1) -
(1) Changes are applied at the operating level with the approximate change in net earnings and basic EPS representing the Corporation’s 50% interest in the Moa Joint
Venture.

Management’s discussion and analysis
40 Sherritt International Corporation
NON-GAAP AND OTHER FINANCIAL MEASURES
Combined revenue
The Corporation uses combined revenue as a measure to help management assess the Corporation’s financial performance across its operations. Combined revenue includes the Corporation’s consolidated revenue and revenue of the Moa Joint Venture on a 50% basis, which is accounted for using the equity method for accounting purposes. Management uses this measure to reflect the Corporation’s economic interest in its operations prior to the application of equity accounting to help allocate financial resources and provide investors with information that it believes is useful in understanding the scope of Sherritt’s business, based on its economic interest, irrespective of the accounting treatment.
The table below reconciles combined revenue to revenue per the financial statements: For the three months ended For the nine months ended
2021 2020 2021 2020
$ millions September 30 September 30 Change September 30 September 30 Change
Revenue by reportable segment Moa Joint Venture and Fort Site(1) $ 108.9 $ 97.7 11% $ 377.4 $ 306.7 23%Metals Other 1.3 2.3 (43%) 4.7 6.4 (27%)Oil and Gas 2.2 5.6 (61%) 10.9 18.7 (42%)Power 7.3 9.4 (22%) 20.2 28.4 (29%)Technologies 0.2 0.1 100% 0.4 0.4 -Corporate 0.3 0.2 50% 0.6 0.5 20%Combined revenue $ 120.2 $ 115.3 4% $ 414.2 $ 361.1 15%Adjustment for Moa Joint Venture (99.5) (90.4) (340.6) (269.5)Financial statement revenue $ 20.7 $ 24.9 (17%) $ 73.6 $ 91.6 (20%)
(1) Revenue of Moa Joint Venture and Fort Site for the three months ended September 30, 2021 is composed of revenue recognized by the Moa Joint Venture of $99.5
million (50% basis), which is equity-accounted and included in share of earnings (loss) of Moa Joint Venture, net of tax, and revenue recognized by Fort Site of $9.4
million, which is included in consolidated revenue (for the three months ended September 30, 2020 - $90.4 million and $7.3 million, respectively). Revenue of Moa
Joint Venture and Fort Site for the nine months ended September 30, 2021 is composed of revenue recognized by the Moa Joint Venture of $340.6 million (50%
basis), which is equity-accounted and included in share of earnings (loss) of Moa Joint Venture, net of tax, and revenue recognized by Fort Site of $36.8 million, which
is included in consolidated revenue (for the nine months ended September 30, 2020 - $269.5 million and $37.2 million, respectively).

Sherritt International Corporation 41
Adjusted EBITDA
The Corporation defines Adjusted EBITDA as earnings (loss) from operations and joint venture, which excludes net finance expense and earnings (loss) from discontinued operations, net of tax, as reported in the financial statements for the period, adjusted for: depletion, depreciation and amortization; impairment losses for long-lived assets, intangible assets, goodwill and investments; gains or losses on disposal of property, plant and equipment of the Corporation or the Moa Joint Venture; and gains or losses on disposition of an interest in the investment in Moa Joint Venture of the Corporation. The exclusion of impairment losses eliminates the non-cash impact of the losses. Management uses Adjusted EBITDA internally to evaluate Sherritt’s operating divisions on a combined and individual basis as an indicator of ability to fund working capital needs, service debt and fund capital expenditure, as well as provide a level of comparability to similar entities. Management believes that Adjusted EBITDA provides useful information to investors in evaluating the Corporation’s operating results in the same manner as management and the Board of Directors.
The tables below reconcile earnings (loss) from operations and joint venture to Adjusted EBITDA:
$ millions, for the three months ended September 30 2021 Adjustment for Moa Moa JV and Metals Oil and Techno- Joint Fort Site Other Gas Power logies Corporate Venture Total
Earnings (loss) from operations and joint venture
per financial statements $ 14.6 $ (0.5) $ (2.0) $ 0.2 $ (2.8) $ (8.8) $ (11.5) $ (10.8)
Add (deduct):
Depletion, depreciation and amortization 2.6 0.1 1.3 3.9 - 0.3 - 8.2
Gain on disposal of assets - - (1.2) - - - - (1.2)
Adjustments for share of joint venture:
Depletion, depreciation and amortization 9.9 - - - - - - 9.9
Net finance expense - - - - - - 1.6 1.6
Income tax expense - - - - - - 9.9 9.9
Adjusted EBITDA $ 27.1 $ (0.4) $ (1.9) $ 4.1 $ (2.8) $ (8.5) $ - $ 17.6
$ millions, for the three months ended September 30 2020 Adjustment for Moa Moa JV and Metals Oil and Techno- Joint Fort Site Other Gas Power logies Corporate Venture Total
Earnings (loss) from operations and joint venture per financial statements $ 3.0 $ (0.6) $ (120.4) $ 1.6 $ (2.1) $ (3.1) $ (3.1) $ (124.7)Add (deduct):
Depletion, depreciation and amortization 2.7 0.1 1.6 5.2 - 0.2 - 9.8Impairment loss of Oil assets - - 115.6 - - - 115.6
Adjustments for share of joint venture: Depletion, depreciation and amortization 11.7 - - - - - - 11.7Net finance income - - - - - - (0.5) (0.5)Income tax expense - - - - - - 3.6 3.6
Adjusted EBITDA $ 17.4 $ (0.5) $ (3.2) $ 6.8 $ (2.1) $ (2.9) $ - $ 15.5

Management’s discussion and analysis
42 Sherritt International Corporation
$ millions, for the nine months ended September 30 2021 Adjustment for Moa Moa JV and Metals Oil and Techno- Joint Fort Site Other Gas Power logies Corporate Venture Total
Earnings (loss) from operations and joint venture
per financial statements $ 62.1 $ (1.6) $ (10.9) $ (1.1) $ (9.0) $ (31.6) $ (19.9) $ (12.0)
Add (deduct):
Depletion, depreciation and amortization 8.3 0.2 5.6 11.7 0.1 0.7 - 26.6
Gain on disposal of assets - - (1.2) - - - - (1.2)
Adjustments for share of joint venture:
Depletion, depreciation and amortization 32.5 - - - - - - 32.5
Net finance income - - - - - - (0.7) (0.7)
Income tax expense - - - - - - 20.6 20.6
Adjusted EBITDA $ 102.9 $ (1.4) $ (6.5) $ 10.6 $ (8.9) $ (30.9) $ - $ 65.8
$ millions, for the nine months ended September 30 2020 Adjustment for Moa Moa JV and Metals Oil and Techno- Joint Fort Site Other Gas Power logies Corporate Venture Total
(Loss) earnings from operations and joint venture per financial statements $ (0.5) $ (1.5) $ (130.5) $ 4.5 $ (7.5) $ (18.1) $ (9.6) $ (163.2)Add (deduct):
Depletion, depreciation and amortization 8.1 0.2 5.0 15.8 0.1 0.7 - 29.9Impairment loss of Oil assets - - 115.6 - - - - 115.6
Adjustments for share of joint venture: Depletion, depreciation and amortization 36.3 - - - - - - 36.3Net finance expense - - - - - - 4.5 4.5Income tax expense - - - - - - 5.1 5.1
Adjusted EBITDA $ 43.9 $ (1.3) $ (9.9) $ 20.3 $ (7.4) $ (17.4) $ - $ 28.2

Sherritt International Corporation 43
Average-realized price
Average-realized price is generally calculated by dividing revenue by sales volume for the given product in a given division. The average-realized price for nickel, cobalt and fertilizer excludes the impact of by-product revenue. Transactions by a Moa Joint Venture marketing company, included in other revenue, are excluded. Management uses this measure, and believes investors use this measure, to compare the relationship between the revenue and direct costs on a per unit basis in each reporting period for nickel, cobalt, fertilizer and power and provide comparability with other similar external operations.
The tables below reconcile revenue per the financial statements to average-realized price: $ millions, except average-realized price and sales volume, for the three months ended September 30 2021
Moa Joint Venture and Fort Site Adjustment for Moa Joint Nickel Cobalt Fertilizer Power Other Venture Total
Revenue per financial statements $ 70.9 $ 22.2 $ 10.9 $ 7.3 $ 8.9 $ (99.5) $ 20.7Adjustments to revenue: By-product revenue - - - (1.2)
Revenue for purposes of average-realized price calculation 70.9 22.2 10.9 6.1
Sales volume for the period 6.6 0.8 25.2 110
Volume units Millions of Millions of Thousands Gigawatt
pounds pounds of tonnes hours
Average-realized price(1)(2)(3) $ 10.76 $ 27.03 $ 432.63 $ 54.57
$ millions, except average-realized price and sales volume, for the three months ended September 30 2020
Moa Joint Venture and Fort Site Adjustment for Moa Joint Nickel Cobalt Fertilizer Power Other Venture Total
Revenue per financial statements $ 65.8 $ 18.4 $ 10.5 $ 9.4 $ 11.2 $ (90.4) $ 24.9Adjustments to revenue: By-product revenue - - - (0.7)
Revenue for purposes of average-realized price calculation 65.8 18.4 10.5 8.7
Sales volume for the period 7.9 1.1 36.2 152
Volume units Millions of Millions of Thousands Gigawatt
pounds pounds of tonnes hours
Average-realized price(1)(2)(3) $ 8.36 $ 16.71 $ 289.04 $ 57.55
$ millions, except average-realized price and sales volume, for the nine months ended September 30 2021
Moa Joint Venture and Fort Site Adjustment for Moa Joint Nickel Cobalt Fertilizer Power Other Venture Total
Revenue per financial statements $ 251.7 $ 67.9 $ 45.8 $ 20.2 $ 28.6 $ (340.6) $ 73.6Adjustments to revenue: By-product revenue - - - (2.9)
Revenue for purposes of average-realized price calculation 251.7 67.9 45.8 17.3
Sales volume for the period 25.2 2.9 117.0 320
Volume units Millions of Millions of Thousands Gigawatt
pounds pounds of tonnes hours
Average-realized price(1)(2)(3) $ 9.99 $ 23.69 $ 391.73 $ 53.93

Management’s discussion and analysis
44 Sherritt International Corporation
$ millions, except average-realized price and sales volume, for the nine months ended September 30 2020
Moa Joint Venture and Fort Site Adjustment for Moa Joint Nickel Cobalt Fertilizer Power Other Venture Total
Revenue per financial statements $ 198.0 $ 48.8 $ 50.1 $ 28.4 $ 35.8 $ (269.5) $ 91.6Adjustments to revenue: By-product revenue - - - (2.0)
Revenue for purposes of average-realized price calculation 198.0 48.8 50.1 26.4
Sales volume for the period 25.4 2.7 139.4 458
Volume units Millions of Millions of Thousands Gigawatt
pounds pounds of tonnes hours
Average-realized price(1)(2)(3) $ 7.80 $ 17.95 $ 359.27 $ 57.67
(1) Average-realized price may not calculate exactly based on amounts presented due to foreign exchange and rounding.
(2) Power, average-realized price per MWh.
(3) Fertilizer, average-realized price per tonne.
Unit operating cost/NDCC
With the exception of the Moa Joint Venture, which uses NDCC, unit operating cost is generally calculated by dividing cost of sales as reported in the financial statements, less depreciation, depletion and amortization in cost of sales, the impact of impairment losses, gains and losses on property, plant, and equipment and exploration and evaluation assets and certain other non-production related costs, by the number of units sold.
The Moa Joint Venture’s NDCC is calculated by dividing cost of sales, as reported in the financial statements, adjusted for the following: depreciation, depletion, amortization and impairment losses in cost of sales; cobalt by-product, fertilizer and other revenue; and other costs primarily related to the impact of opening and closing inventory values, by the number of finished nickel pounds sold in the period, expressed in U.S. dollars.
Unit operating costs for nickel and electricity are key measures that management and investors uses to monitor performance. NDCC of nickel is a widely-used performance measure for nickel producers. Management uses unit operating costs/NDCC to assess how well the Corporation’s producing mine and power facilities are performing and to assess overall production efficiency and effectiveness internally across periods and compared to its competitors.
The table below reconciles cost of sales per the financial statements to unit operating cost/NDCC: $ millions, except unit cost and sales volume, for the three months ended September 30 2021 Adjustment Moa JV and for Moa Fort Site Power Other(1) Joint Venture Total
Cost of sales per financial statements $ 92.1 $ 6.5 $ 8.4 $ (79.3) $ 27.7Less: Depletion, depreciation and amortization in cost of sales (12.5) (3.9)
79.6 2.6 Adjustments to cost of sales: Cobalt by-product, fertilizer and other revenue (38.0) - Impact of opening/closing inventory and other (3.7) -
Cost of sales for purposes of unit cost calculation 37.9 2.6 Sales volume for the period 6.6 110
Volume units Millions of Gigawatt
pounds hours
Unit operating cost(2)(3) $ 5.75 $ 23.14Unit operating cost (US$) (NDCC)(4) $ 4.53

Sherritt International Corporation 45
$ millions, except unit cost and sales volume, for the three months ended September 30 2020 Adjustment Moa JV and for Moa Fort Site Power Other(1) Joint Venture Total
Cost of sales per financial statements $ 92.8 $ 7.4 $ 14.2 $ (82.0) $ 32.4Less: Depletion, depreciation and amortization in cost of sales (14.4) (5.2)
78.4 2.2 Adjustments to cost of sales: Cobalt by-product, fertilizer and other revenue (31.9) - Impact of opening/closing inventory and other (3.2) - Impairment on assets (1.3) -
Cost of sales for purposes of unit cost calculation 42.0 2.2 Sales volume for the period 7.9 152
Volume units Millions of Gigawatt
pounds hours
Unit operating cost(2)(3) $ 5.34 $ 14.63Unit operating cost (US$) (NDCC)(4) $ 4.04
$ millions, except unit cost and sales volume, for the nine months ended September 30 2021 Adjustment Moa JV and for Moa Fort Site Power Other(1) Joint Venture Total
Cost of sales per financial statements $ 308.7 $ 19.1 $ 34.3 $ (263.7) $ 98.4Less: Depletion, depreciation and amortization in cost of sales (40.8) (11.7)
267.9 7.4 Adjustments to cost of sales: Cobalt by-product, fertilizer and other revenue (125.7) - Impact of opening/closing inventory and other (6.8) -
Cost of sales for purposes of unit cost calculation 135.4 7.4 Sales volume for the period 25.2 320
Volume units Millions of Gigawatt
pounds hours
Unit operating cost(2)(3) $ 5.37 $ 23.19Unit operating cost (US$) (NDCC)(4) $ 4.30
$ millions, except unit cost and sales volume, for the nine months ended September 30 2020 Adjustment Moa JV and for Moa Fort Site Power Other(1) Joint Venture Total
Cost of sales per financial statements $ 300.4 $ 22.4 $ 45.4 $ (258.7) $ 109.5Less: Depletion, depreciation and amortization in cost of sales (44.4) (15.8)
256.0 6.6 Adjustments to cost of sales: Cobalt by-product, fertilizer and other revenue (108.7) - Impact of opening/closing inventory and other (5.6) - Impairment on assets (1.3) -
Cost of sales for purposes of unit cost calculation 140.4 6.6 Sales volume for the period 25.4 458
Volume units Millions of Gigawatt
pounds hours
Unit operating cost(2)(3) $ 5.53 $ 14.44Unit operating cost (US$) (NDCC)(4) $ 4.09
(1) Other includes the cost of sales of the Metals Other, Oil and Gas and Technologies reportable segments.
(2) Unit operating cost/NDCC may not calculate exactly based on amounts presented due to foreign exchange and rounding.
(3) Power, unit operating cost price per MWh.
(4) Unit operating costs in US$ are converted at the average exchange rate for the period.

Management’s discussion and analysis
46 Sherritt International Corporation
Adjusted net earnings/loss from continuing operations and adjusted net earnings/loss from continuing operations per share
The Corporation defines adjusted net earnings/loss from continuing operations as earnings/loss from continuing operations less items not reflective of operational performance. These adjusting items include, but are not limited to, inventory obsolescence, impairment of assets, gains and losses on the acquisition or disposal of assets, gains and losses on unrealized foreign exchange, gains and losses on financial assets and liabilities and other one-time adjustments. While some adjustments are recurring (such as unrealized foreign exchange (gain) loss and revaluations of allowances for expected credit losses (ACL)), management believes that they do not reflect the Corporation’s operational performance or future operational performance. Adjusted net earnings/loss from continuing operations per share is defined consistent with the definition above and divided by the Corporation’s weighted-average number of common shares outstanding.
Management uses these measures internally and believes that they provide investors with performance measures with which to assess the Corporation’s core operations by adjusting for items or transactions that are not reflective of its core operating activities.
The table below reconciles net (loss) earnings from continuing operations and net (loss) earnings from continuing operations per share, both per the financial statements, to adjusted net loss from continuing operations and adjusted net loss from continuing operations per share, respectively:
2021 2020
For the three months ended September 30 $ millions $/share $ millions $/share
Net (loss) earnings from continuing operations $ (15.5) $ (0.04) $ 11.4 $ 0.03
Adjusting items:
Sherritt - Unrealized foreign exchange loss (gain) - continuing operations 7.9 0.02 (3.6) (0.01)
Corporate - Gain on debenture exchange - - (143.4) (0.36)
Corporate - Other contractual benefits expense 3.1 0.01 - -
Corporate - Unrealized gains on commodity put options (1.3) - - -
Corporate - Realized losses on commodity put options 1.7 0.01 - -
Moa JV - Inventory obsolescence 1.3 - - -
Fort Site - Inventory obsolescence 1.0 - - -
Oil and Gas - Impairment loss of Oil assets - - 115.6 0.29
Oil and Gas - Gain on disposal of assets (1.2) - - -
Oil and Gas - Realized foreign exchange gain due to Cuban currency unification (10.0) (0.03) - -
Oil and Gas - Inventory obsolescence - - 2.0 0.01
Oil and Gas and Power - ACL revaluation (1.4) - 0.6 -
Other 0.7 - 1.9 -
Total adjustments, before tax $ 1.8 $ 0.01 $ (26.9) $ (0.07)
Tax adjustments 0.3 - (0.6) -
Adjusted net loss from continuing operations $ (13.4) $ (0.03) $ (16.1) $ (0.04)

Sherritt International Corporation 47
2021 2020
For the nine months ended September 30 $ millions $/share $ millions $/share
Net loss from continuing operations $ (27.8) $ (0.07) $ (36.4) $ (0.09)
Adjusting items: Sherritt - Unrealized foreign exchange gain - continuing operations (3.3) (0.01) (8.7) (0.02)Corporate - Gain on debenture exchange - - (143.4) (0.36)Corporate - Gain on repurchase of notes (2.1) (0.01) - -Corporate - Severance and other contractual benefits expense 5.5 0.02 - -Corporate - Unrealized losses on commodity put options 3.0 0.01 - -Corporate - Realized losses on commodity put options 2.5 0.01 - -Corporate - Moa JV expansion loans receivable ACL revaluation - - (6.4) (0.02)Moa JV - Inventory obsolescence 1.3 - - -Fort Site - Inventory obsolescence 1.2 - - -
Oil and Gas - Impairment loss of Oil assets - - 115.6 0.29
Oil and Gas - Gain on disposal of assets (1.2) - - -
Oil and Gas - Realized foreign exchange gain due to Cuban currency unification (10.0) (0.03) - -Oil and Gas - Inventory obsolescence - - 2.0 0.01Oil and Gas and Power - ACL revaluation 0.1 - 2.3 0.01
Other 2.3 0.01 2.6 0.01
Total adjustments, before tax $ (0.7) $ - $ (36.0) $ (0.09)
Tax adjustments (0.2) - (0.6) -
Adjusted net loss from continuing operations $ (28.7) $ (0.07) $ (73.0) $ (0.18)

Management’s discussion and analysis
48 Sherritt International Corporation
Combined free cash flow
The Corporation defines combined free cash flow as cash flow provided (used) by continuing operations for operating activities, less cash expenditures on property plant and equipment and intangible assets, including exploration and evaluation assets. Corporate’s cash used by continuing operations for operating activities is adjusted to exclude distributions received from Moa Joint Venture and these distributions are added to the Adjustment for Moa Joint Venture to arrive at total cash provided (used) by continuing operations per the financial statements.
Free cash flow is used by management, and management believes this information is used by investors, to analyze cash flows generated from operations and assess its operations’ ability to provide cash or its use of cash, after funding cash capital requirements, to service current and future working capital needs and service debt.
The tables below reconcile cash provided (used) by continuing operations per the financial statements to combined free cash flow: $ millions, for the three months ended September 30 2021
Total Adjustment derived for Moa from Moa JV and Metals Oil and Technol- Combined Joint financial Fort Site Other Gas Power ogies Corporate total Venture statements
Cash provided (used) by continuing operations for operating activities(1)
$ 36.5 $ (2.3) $ 2.1 $ 3.0 $ (2.9) $ (3.6) $ 32.8 $ (16.6) $ 16.2
Less:
Property, plant and equipment expenditures (13.3) - - - - (0.1) (13.4) 9.9 (3.5)
Intangible expenditures - - (0.1) - - - (0.1) - (0.1)
Free cash flow $ 23.2 $ (2.3) $ 2.0 $ 3.0 $ (2.9) $ (3.7) $ 19.3 $ (6.7) $ 12.6
$ millions, for the three months ended September 30 2020
Total Adjustment derived for Moa from Moa JV and Metals Oil and Technol- Combined Joint financial Fort Site Other Gas Power ogies Corporate total Venture statements
Cash provided (used) by continuing operations for operating activities(1)
$ 23.1 $ 0.1 $ (5.2) $ 20.9 $ (2.4) $ (1.3) $ 35.2 $ (9.9) $ 25.3
Less:
Property, plant and equipment expenditures (6.8) - (0.6) (0.7) - - (8.1) 5.6 (2.5)
Intangible expenditures - - - - - - - - -
Free cash flow $ 16.3 $ 0.1 $ (5.8) $ 20.2 $ (2.4) $ (1.3) $ 27.1 $ (4.3) $ 22.8
$ millions, for the nine months ended September 30 2021
Total Adjustment derived for Moa from Moa JV and Metals Oil and Technol- Combined Joint financial Fort Site Other Gas Power ogies Corporate total Venture statements
Cash provided (used) by continuing operations for operating activities(2)
$ 81.6 $ 8.2 $ 1.9 $ 17.3 $ (8.8) $ (32.6) $ 67.6 $ (52.9) $ 14.7
Less:
Property, plant and equipment expenditures (25.7) - (0.2) - - (0.2) (26.1) 18.9 (7.2)
Intangible expenditures - - (0.6) - - - (0.6) - (0.6)
Free cash flow $ 55.9 $ 8.2 $ 1.1 $ 17.3 $ (8.8) $ (32.8) $ 40.9 $ (34.0) $ 6.9

Sherritt International Corporation 49
$ millions, for the nine months ended September 30 2020
Total Adjustment derived for Moa from Moa JV and Metals Oil and Technol- Combined Joint financial Fort Site Other Gas Power ogies Corporate total Venture statements
Cash provided (used) by continuing operations for operating activities(2)
$ 40.3 $ 7.0 $ (21.2) $ 47.6 $ (7.2) $ (12.0) $ 54.5 $ (19.2) $ 35.3
Less:
Property, plant and equipment expenditures (19.9) - (3.4) (0.7) (0.1) (0.1) (24.2) 16.3 (7.9)
Intangible expenditures - - (0.8) - - - (0.8) - (0.8)
Free cash flow $ 20.4 $ 7.0 $ (25.4) $ 46.9 $ (7.3) $ (12.1) $ 29.5 $ (2.9) $ 26.6
(1) Cash provided (used) by continuing operations for operating activities for the Moa Joint Venture and Fort Site was $29.3 million and $7.2 million, respectively, for the
three months ended September 30, 2021. (September 30, 2020 - $9.8 million and $13.3 million, respectively).
(2) Cash provided (used) by continuing operations for operating activities for the Moa Joint Venture and Fort Site was $88.8 million and $(7.2) million, respectively, for
the nine months ended September 30, 2021. (September 30, 2020 - $32.4 million and $7.9 million, respectively).
CONTROLS AND PROCEDURES
Disclosure controls and procedures
Disclosure controls and procedures are designed to provide reasonable assurance that all relevant information is gathered and reported to management, including the CEO and CFO, on a timely basis so that appropriate decisions can be made regarding public disclosure.
Internal controls over financial reporting
Internal control over financial reporting means a process designed by or under the supervision of the CEO and CFO, management and other personnel to provide reasonable assurance regarding the reliability of financial reporting and the preparation of financial statements for external purposes in accordance with IFRS.
The internal controls are not expected to prevent and detect all misstatements due to error or fraud.
As at September 30, 2021, the Corporation’s CEO and CFO have certified that the disclosure controls and procedures are effective and that during the quarter ended September 30, 2021, the Corporation did not make any material changes in the internal controls over financial reporting that materially affected or are reasonably likely to materially affect the Corporation’s internal control over financial reporting.

Management’s discussion and analysis
50 Sherritt International Corporation
FORWARD-LOOKING STATEMENTS
This MD&A contains certain forward-looking statements. Forward-looking statements can generally be identified by the use of statements that include such words as “believe”, “expect”, “anticipate”, “intend”, “plan”, “forecast”, “likely”, “may”, “will”, “could”, “should”, “suspect”, “outlook”, “potential”, “projected”, “continue” or other similar words or phrases. Specifically, forward-looking statements in this document include, but are not limited to, statements regarding strategies, plans and estimated production amounts resulting from expansion of mining operations at the Moa Joint Venture, growing and increasing nickel and cobalt production, extending the Moa life of mine, conversion of mineral resources to reserves, commercializing Technologies projects, growing shareholder value, updating technical reports and optimizing mine planning and performance; statements set out in the “Outlook” section of this MD&A and certain expectations regarding production volumes, operating costs and capital spending; supply, demand and pricing outlook in the nickel, cobalt and electric vehicle markets; the impact of COVID-19; Sherritt’s strategy, plans, targets and goals in respect of environmental and social governance issues, including climate change and greenhouse gas emissions reduction targets; anticipated payments of outstanding receivables, including re-directed distributions from the Corporation’s Moa Joint Venture partner; the impact of U.S. sanctions on Cuba; anticipated economic conditions in Cuba; the anticipated renewal of a joint venture agreement; and amounts of certain other commitments.
Forward-looking statements are not based on historical facts, but rather on current expectations, assumptions and projections about future events, including commodity and product prices and demand; the level of liquidity and access to funding; share price volatility; production results; realized prices for production; earnings and revenues; global demand for electric vehicles; the commercialization of certain proprietary technologies and services; advancements in environmental and greenhouse gas reduction technology; environmental rehabilitation provisions; availability of regulatory and creditor approvals and waivers; compliance with applicable environmental laws and regulations; debt repayments; redemptions and interest deferrals; collection of accounts receivable; and certain corporate objectives, goals and plans. By their nature, forward-looking statements require the Corporation to make assumptions and are subject to inherent risks and uncertainties. There is significant risk that predictions, forecasts, conclusions or projections will not prove to be accurate, that those assumptions may not be correct and that actual results may differ materially from such predictions, forecasts, conclusions or projections. The Corporation cautions readers of this MD&A not to place undue reliance on any forward-looking statement as a number of factors could cause actual future results, conditions, actions or events to differ materially from the targets, expectations, estimates or intentions expressed in the forward-looking statements. These risks, uncertainties and other factors include, but are not limited to, the impact of the COVID-19 pandemic, changes in the global price for nickel, cobalt, oil and gas, fertilizers or certain other commodities; security market fluctuations and price volatility; level of liquidity; access to capital; access to financing; the risk to Sherritt’s entitlements to future distributions from the Moa Joint Venture; uncertainty about the pace of technological advancements required in relation to achieving ESG targets; risk of future non-compliance with debt restrictions and covenants and mandatory repayments; Sherritt’s ability to replace depleted mineral reserves; risks associated with the Corporation’s joint venture partners; variability in production at Sherritt’s operations in Cuba; risks related to Sherritt’s operations in Cuba; risks related to the U.S. government policy toward Cuba, including the U.S. embargo on Cuba and the Helms-Burton legislation; potential interruptions in transportation; uncertainty of gas supply for electrical generation; the Corporation’s reliance on key personnel and skilled workers; growth opportunity risks; the possibility of equipment and other failures; risks associated with mining, processing and refining activities; uncertainty of resources and reserve estimates; the potential for shortages of equipment and supplies, including diesel; supplies quality issues; risks related to environmental liabilities including liability for reclamation costs, tailings facility failures and toxic gas releases; risks related to the Corporation’s corporate structure; political, economic and other risks of foreign operations; risks associated with Sherritt’s operation of large projects generally; risks related to the accuracy of capital and operating cost estimates; foreign exchange and pricing risks; compliance with applicable environment, health and safety legislation and other associated matters; risks associated with governmental regulations regarding climate change and greenhouse gas emissions; risks relating to community relations and maintaining the Corporation’s social license to grow and operate; credit risks; competition in product markets; future market access; interest rate changes; risks in obtaining insurance; uncertainties in labour relations; uncertainty in the ability of the Corporation to enforce legal rights in foreign jurisdictions; uncertainty regarding the interpretation and/or application of the applicable laws in foreign jurisdictions; legal contingencies; risks related to the Corporation’s accounting policies; identification and management of growth opportunities; uncertainty in the ability of the Corporation to obtain government permits; risks to information technologies systems and cybersecurity; failure to comply with, or changes to, applicable government regulations; bribery and corruption risks, including failure to comply with the Corruption of Foreign Public Officials Act or applicable local anti-corruption law; the ability to accomplish corporate objectives, goals and plans for 2021; and the Corporation’s ability to meet other factors listed from time to time in the Corporation’s continuous disclosure documents.

Sherritt International Corporation 51
The Corporation, together with its Moa Joint Venture and Fort Site and Technologies segments, are pursuing a range of growth and expansion opportunities, including without limitation, process technology solutions, development projects, commercial implementation opportunities, life of mine extension opportunities and the conversion of mineral resources to reserves. In addition to the risks noted above, factors that could, alone or in combination, prevent the Corporation from successfully achieving these opportunities may include, without limitation: identifying suitable commercialization and other partners; successfully advancing discussions and successfully concluding applicable agreements with external parties and/or partners; successfully attracting required financing; successfully developing and proving technology required for the potential opportunity; successfully overcoming technical and technological challenges; successful environmental assessment and stakeholder engagement; successfully obtaining intellectual property protection; successfully completing test work and engineering studies, prefeasibility and feasibility studies, piloting, scaling from small scale to large scale production, commissioning, procurement, construction, commissioning, ramp-up to commercial scale production and completion; and securing regulatory and government approvals. There can be no assurance that any opportunity will be successful, commercially viable, or will generate any meaningful revenues, savings or earnings, as the case may be, for the Corporation. In addition, the Corporation will incur costs in pursuing any particular opportunity, which may be significant. Additional risks, uncertainties and other factors include, but are not limited to, the ability of the Corporation to achieve its financial goals; the ability of the Corporation to continue to realize its assets and discharge its liabilities and commitments; the Corporation’s future liquidity position, and access to capital, to fund ongoing operations and obligations (including debt obligations); the ability of the Corporation to stabilize its business and financial condition; the ability of the Corporation to implement and successfully achieve its business priorities; and the ability of the Corporation to comply with its contractual obligations, including without limitation, its obligations under debt arrangements. Readers are cautioned that the foregoing list of factors is not exhaustive and should be considered in conjunction with the risk factors described in the Corporation’s other documents filed with the Canadian securities authorities, including without limitation the Annual Information Form of the Corporation dated March 17, 2021 for the period ending December 31, 2020, which is available on SEDAR at www.sedar.com.
The Corporation may, from time to time, make oral forward-looking statements. The Corporation advises that the above paragraph and the risk factors described in this MD&A and in the Corporation’s other documents filed with the Canadian securities authorities should be read for a description of certain factors that could cause the actual results of the Corporation to differ materially from those in the oral forward-looking statements. The forward-looking information and statements contained in this MD&A are made as of the date hereof and the Corporation undertakes no obligation to update publicly or revise any oral or written forward-looking information or statements, whether as a result of new information, future events or otherwise, except as required by applicable securities laws. The forward-looking information and statements contained herein are expressly qualified in their entirety by this cautionary statement.

52 Sherritt International Corporation
CONDENSED CONSOLIDATED FINANCIAL STATEMENTS As at and for the three and nine months ended September 30, 2021 and 2020
CONDENSED CONSOLIDATED FINANCIAL STATEMENTS Condensed consolidated statements of comprehensive income (loss) 53 Condensed consolidated statements of financial position 54 Condensed consolidated statements of cash flow 55 Condensed consolidated statements of changes in shareholders’ equity 56
NOTES TO THE CONDENSED CONSOLIDATED FINANCIAL STATEMENTS Note 1 – Nature of operations and corporate information 57 Note 2 – Basis of presentation 57 Note 3 – Summary of significant accounting policies, judgments and estimates 57 Note 4 – Segmented information 58 Note 5 – Expenses 61 Note 6 – Joint arrangements 62 Note 7 – Net finance (expense) income 63 Note 8 – Discontinued operations 64 Note 9 – (Loss) earnings per share 65 Note 10 – Financial instruments 66 Note 11 – Advances, loans receivable and other financial assets 67 Note 12 – Loans, borrowings and other financial liabilities 68 Note 13 – Provisions 69 Note 14 – Commitments for expenditures 70 Note 15 – Supplemental cash flow information 70 Note 16 – Shareholders’ equity 70 Note 17 – Financial risk management 71 Note 18 – Related party transactions 71

Sherritt International Corporation 53
Condensed consolidated statements of comprehensive income (loss) For the three months ended For the nine months ended
2021 2020 2021 2020
Unaudited, Canadian $ millions, except per share amounts Note September 30 September 30 September 30 September 30
Revenue 4 $ 20.7 $ 24.9 $ 73.6 $ 91.6Cost of sales 5 (27.7) (32.4) (98.4) (109.5)Administrative expenses 5 (11.3) (5.8) (40.5) (26.8)Impairment loss of Oil assets - (115.6) - (115.6)Share of earnings (loss) of Moa Joint Venture, net of tax 6 7.5 4.2 53.3 (2.9)Loss from operations and joint venture (10.8) (124.7) (12.0) (163.2)Gain on debenture exchange 7 - 143.4 - 143.4Interest income on financial assets measured at amortized cost 7 3.7 3.8 11.2 15.8Revaluation of allowances for expected credit losses 7 1.4 (0.6) (0.1) 4.1Other financing items 7 (0.3) (0.3) (5.5) (0.8)Financing expense 7 (9.5) (10.1) (20.7) (35.4)Net finance (expense) income (4.7) 136.2 (15.1) 127.1(Loss) earnings before income tax (15.5) 11.5 (27.1) (36.1)Income tax expense - (0.1) (0.7) (0.3)Net (loss) earnings from continuing operations (15.5) 11.4 (27.8) (36.4)(Loss) earnings from discontinued operations, net of tax 8 (0.7) 217.1 (4.7) 108.2Net (loss) earnings for the period $ (16.2) $ 228.5 $ (32.5) $ 71.8 Other comprehensive income (loss) Items that may be subsequently reclassified to profit or loss:
Foreign currency translation differences on foreign operations, net of tax
16.3 (16.7) (1.0) 22.3
Items that will not be subsequently reclassified to profit or loss: Actuarial (losses) gains on pension plans, net of tax (0.1) 0.1 (0.1) -
Other comprehensive income (loss) 16.2 (16.6) (1.1) 22.3Total comprehensive income (loss) $ - $ 211.9 $ (33.6) $ 94.1 Net (loss) earnings from continuing operations per common share: Basic and diluted 9 $ (0.04) $ 0.03 $ (0.07) $ (0.09)
Net (loss) earnings per common share: Basic and diluted 9 $ (0.04) $ 0.58 $ (0.08) $ 0.18 The accompanying notes are an integral part of these condensed consolidated financial statements.

Condensed consolidated financial statements (unaudited)
54 Sherritt International Corporation
Condensed consolidated statements of financial position 2021 2020
Unaudited, Canadian $ millions, as at Note September 30 December 31
ASSETS Current assets Cash and cash equivalents 10 $ 163.4 $ 167.4Restricted cash 1.3 5.3Advances, loans receivable and other financial assets 11 12.8 37.6Trade accounts receivable, net, and unbilled revenue 10 132.9 140.3Inventories 34.7 27.0Prepaid expenses 6.8 3.7 351.9 381.3 Non-current assets Investment in Moa Joint Venture 6 612.6 597.4Advances, loans receivable and other financial assets 11 192.6 169.6Property, plant and equipment 148.3 166.4Intangible assets 27.7 37.5 981.2 970.9Total assets $ 1,333.1 $ 1,352.2 LIABILITIES AND SHAREHOLDERS' EQUITY Current liabilities Loans and borrowings 12 $ 8.0 $ 8.0Trade accounts payable and accrued liabilities 137.3 135.0Income taxes payable 1.1 12.3Other financial liabilities 12 8.4 4.8Deferred revenue 15 23.1 7.5Provisions 13 3.6 1.9 181.5 169.5 Non-current liabilities Loans and borrowings 12 436.7 433.4Other financial liabilities 12 31.8 24.7Other non-financial liabilities 8.5 6.2Provisions 13 99.8 110.2Deferred income taxes 1.5 1.4 578.3 575.9Total liabilities 759.8 745.4 Shareholders' equity Capital stock 16 2,894.9 2,894.9Deficit (2,912.6) (2,880.1)Reserves 233.4 233.3Accumulated other comprehensive income 357.6 358.7 573.3 606.8Total liabilities and shareholders' equity $ 1,333.1 $ 1,352.2Commitments for expenditures (note 14) The accompanying notes are an integral part of these condensed consolidated financial statements.

Sherritt International Corporation 55
Condensed consolidated statements of cash flow For the three months ended For the nine months ended
2021 2020 2021 2020
Unaudited, Canadian $ millions Note September 30 September 30 September 30 September 30
Operating activities
Net (loss) earnings from continuing operations $ (15.5) $ 11.4 $ (27.8) $ (36.4)Add (deduct):
Depletion, depreciation and amortization 4, 5 8.2 9.8 26.6 29.9
Share-based compensation expense 5 0.8 1.9 15.0 2.0
Share of (earnings) loss of Moa Joint Venture, net of tax 6 (7.5) (4.2) (53.3) 2.9
Impairment loss of Oil assets - 115.6 - 115.6
Net finance expense (income) 7 4.7 (136.2) 15.1 (127.1)
Income tax expense - 0.1 0.7 0.3Net change in non-cash working capital 15 13.5 21.7 16.1 14.4Interest received 0.4 4.5 4.4 21.8Interest paid (0.6) (0.6) (17.2) (1.9)Income tax paid (0.7) (0.2) (1.7) (1.3)Distributions received from Moa Joint Venture 6 12.7 - 35.9 13.3Other operating items 0.2 1.5 0.9 1.8Cash provided by continuing operations 16.2 25.3 14.7 35.3Cash used by discontinued operations 8 (4.9) (4.6) (5.5) (5.7)Cash provided by operating activities 11.3 20.7 9.2 29.6 Investing activities
Property, plant and equipment expenditures 4 (3.5) (2.5) (7.2) (7.9)Intangible asset expenditures 4 (0.1) - (0.6) (0.8)Receipts of advances, loans receivable and other financial assets 0.2 0.2 0.6 0.5Cash used by continuing operations (3.4) (2.3) (7.2) (8.2)Cash used by investing activities (3.4) (2.3) (7.2) (8.2) Financing activities
Repurchase of notes 12 - - (4.6) -Repayment of other financial liabilities (0.5) (0.4) (1.1) (1.5)Fees paid on debenture exchange - (23.3) (0.2) (23.3)
Cash used by continuing operations (0.5) (23.7) (5.9) (24.8)Cash used by financing activities (0.5) (23.7) (5.9) (24.8)Effect of exchange rate changes on cash and cash equivalents 2.2 (2.0) (0.1) 2.4Increase (decrease) in cash and cash equivalents 9.6 (7.3) (4.0) (1.0)Cash and cash equivalents at beginning of the period 153.8 172.4 167.4 166.1Cash and cash equivalents at end of the period 10 $ 163.4 $ 165.1 $ 163.4 $ 165.1
The accompanying notes are an integral part of these condensed consolidated financial statements.

Condensed consolidated financial statements (unaudited)
56 Sherritt International Corporation
Condensed consolidated statements of changes in shareholders’ equity Unaudited, Canadian $ millions
Accumulated
other
comprehensive
Capital stock Deficit Reserves income (loss) Total
Balance as at December 31, 2019 $ 2,894.9 $ (2,902.3) $ 233.7 $ 495.8 $ 722.1 Total comprehensive income: Net earnings for the period - 71.8 - - 71.8
Foreign currency translation differences on foreign operations, net of tax
- - - 22.3 22.3
- 71.8 - 22.3 94.1 Reclassification of accumulated other comprehensive income on disposal of foreign operation
- - - (129.7) (129.7)
Balance as at September 30, 2020 $ 2,894.9 $ (2,830.5) $ 233.7 $ 388.4 $ 686.5 Total comprehensive loss: Net loss for the period - (49.6) - - (49.6)
Foreign currency translation differences on foreign operations, net of tax
- - - (28.8) (28.8)
Actuarial losses on pension plans, net of tax - - - (0.9) (0.9) - (49.6) - (29.7) (79.3) Stock option plan recovery - - (0.4) - (0.4)Balance as at December 31, 2020 $ 2,894.9 $ (2,880.1) $ 233.3 $ 358.7 $ 606.8 Total comprehensive loss: Net loss for the period - (32.5) - - (32.5)
Foreign currency translation differences on foreign operations, net of tax
- - - (1.0) (1.0)
Actuarial losses on pension plans, net of tax - - - (0.1) (0.1) - (32.5) - (1.1) (33.6) Stock option plan expense - - 0.1 - 0.1Balance as at September 30, 2021 $ 2,894.9 $ (2,912.6) $ 233.4 $ 357.6 $ 573.3 The accompanying notes are an integral part of these condensed consolidated financial statements.

Sherritt International Corporation 57
Notes to the condensed consolidated financial statements (All dollar amounts presented in tables are expressed in millions of Canadian dollars except share and per share amounts)
1. NATURE OF OPERATIONS AND CORPORATE INFORMATION
Sherritt International Corporation (“Sherritt” or the “Corporation”) is a world leader in the mining and refining of nickel and cobalt – metals essential for the growing adoption of electric vehicles. Its Technologies Group creates innovative, proprietary solutions for oil and mining companies around the world to improve environmental performance and increase economic value. The Corporation is also the largest independent energy producer in Cuba.
The Corporation is domiciled in Ontario, Canada and its registered office is 22 Adelaide Street West, Toronto, Ontario, M5H 4E3. These condensed consolidated financial statements were approved and authorized for issuance by the Board of Directors of Sherritt on November 3, 2021. The Corporation is listed on the Toronto Stock Exchange.
2. BASIS OF PRESENTATION
The condensed consolidated financial statements of the Corporation are prepared in accordance with International Accounting Standard 34 Interim Financial Reporting (IAS 34), as issued by the International Accounting Standards Board (IASB). Accordingly, certain information and footnote disclosures normally included in the annual financial statements prepared in accordance with International Financial Reporting Standards (IFRS), as issued by the IASB, have been omitted or condensed. These condensed consolidated financial statements include the financial results of the Corporation’s interest in its subsidiaries and joint arrangements. All financial information is presented in Canadian dollars rounded to the nearest hundred thousand, except as otherwise noted.
The condensed consolidated financial statements are prepared on a going concern basis, under the historical cost convention, except for certain financial assets and liabilities and cash-settled share-based payments, which have been measured at fair value. The going concern basis assumes that the Corporation will continue in operation for the foreseeable future and will be able to realize its assets and discharge its liabilities and commitments in the normal course of business.
3. SUMMARY OF SIGNIFICANT ACCOUNTING POLICIES, JUDGMENTS AND ESTIMATES
These condensed consolidated financial statements have been prepared using the same accounting policies and methods of computation as the annual consolidated financial statements of the Corporation as at and for the year ended December 31, 2020.
These condensed consolidated financial statements have been prepared using the same critical accounting estimates and judgments as the annual consolidated financial statements of the Corporation as at and for the year ended December 31, 2020. The annual consolidated financial statements included a critical accounting judgment related to impairment of non-financial assets, in part due to uncertainty as a result of COVID-19 and its potential impact on commodity prices and collection of Cuban receivables.
The condensed consolidated financial statements should be read in conjunction with the annual consolidated financial statements for the year ended December 31, 2020.

Notes to the condensed consolidated financial statements
58 Sherritt International Corporation
4. SEGMENTED INFORMATION
The Corporation revised the presentation of its segmented information during the three months ended March 31, 2021 as a result of Technologies being identified as a reportable segment during that period in accordance with quantitative thresholds and as information for the Technologies operating segment is separately reviewed by the chief operating decision maker. Segmented information for the prior period has been restated for comparative purposes to reflect this change.
Canadian $ millions, for the three months ended September 30 2021 Moa JV and Metals Oil and Tech- Adjustments for Fort Site(1) Other(2) Gas Power nologies Corporate(2) Moa Joint Venture Total Revenue(3) $ 108.9 $ 1.3 $ 2.2 $ 7.3 $ 0.2 $ 0.3 $ (99.5) $ 20.7Cost of sales (92.1) (1.8) (3.6) (6.5) (3.0) - 79.3 (27.7)Administrative expenses (2.2) - (0.6) (0.6) - (9.1) 1.2 (11.3)Share of earnings of Moa Joint Venture, net of tax
- - - - - - 7.5 7.5
Earnings (loss) from operations and joint venture
14.6 (0.5) (2.0) 0.2 (2.8) (8.8) (11.5) (10.8)
Interest income on financial assets measured at amortized cost
3.7
Revaluation of allowances for expected credit losses
1.4
Other financing items (0.3)Financing expense (9.5)Net finance expense (4.7)Loss before income tax (15.5)Income tax expense -Net loss from continuing operations (15.5)Loss from discontinued operations, net of tax
(0.7)
Net loss for the period $ (16.2) Supplementary information Depletion, depreciation and amortization $ 12.5 $ 0.1 $ 1.3 $ 3.9 $ - $ 0.3 $ (9.9) $ 8.2Property, plant and equipment expenditures 13.3 - - - - 0.1 (9.9) 3.5Intangible asset expenditures - - 0.1 - - - - 0.1 Canadian $ millions, as at September 30 2021Non-current assets(4) $ 624.4 $ 0.5 $ 13.4 $ 23.3 $ 0.9 $ 6.8 $ (493.3) $ 176.0Total assets 908.8 73.8 57.9 321.0 1.2 84.4 (114.0) 1,333.1

Sherritt International Corporation 59
2020Canadian $ millions, for the three months ended September 30 (Restated) Moa JV and Metals Oil and Tech- Adjustments for Fort Site(1) Other(2) Gas Power nologies Corporate(2) Moa Joint Venture Total Revenue(3) $ 97.7 $ 2.3 $ 5.6 $ 9.4 $ 0.1 $ 0.2 $ (90.4) $ 24.9Cost of sales (92.8) (3.0) (9.0) (7.4) (2.2) - 82.0 (32.4)Administrative expenses (1.9) 0.1 (1.4) (0.4) - (3.3) 1.1 (5.8)Impairment loss of Oil assets - - (115.6) - - - - (115.6)Share of earnings of Moa Joint Venture, net of tax
- - - - - - 4.2 4.2
Earnings (loss) from operations and joint venture
3.0 (0.6) (120.4) 1.6 (2.1) (3.1) (3.1) (124.7)
Gain on debenture exchange 143.4Interest income on financial assets measured at amortized cost 3.8
Revaluation of allowances for expected credit losses
(0.6)
Other financing items (0.3)Financing expense (10.1)Net finance income 136.2Earnings before income tax 11.5Income tax expense (0.1)Net earnings from continuing operations 11.4Earnings from discontinued operations, net of tax
217.1
Net earnings for the period $ 228.5 Supplementary information Depletion, depreciation and amortization $ 14.4 $ 0.1 $ 1.6 $ 5.2 $ - $ 0.2 $ (11.7) $ 9.8Property, plant and equipment expenditures 6.8 - 0.6 0.7 - - (5.6) 2.5Intangible asset expenditures - - - - - - - - 2020Canadian $ millions, as at December 31 (Restated)Non-current assets(4) $ 652.6 $ 0.6 $ 18.5 $ 35.4 $ 1.0 $ 7.2 $ (511.4) $ 203.9Total assets 897.8 71.3 71.9 327.4 1.3 100.8 (118.3) 1,352.2
Canadian $ millions, for the nine months ended September 30 2021 Moa JV and Metals Oil and Tech- Adjustments for Fort Site(1) Other(2) Gas Power nologies Corporate(2) Moa Joint Venture Total Revenue(3) $ 377.4 $ 4.7 $ 10.9 $ 20.2 $ 0.4 $ 0.6 $ (340.6) $ 73.6Cost of sales (308.7) (6.4) (18.5) (19.1) (9.4) - 263.7 (98.4)Administrative expenses (6.6) 0.1 (3.3) (2.2) - (32.2) 3.7 (40.5)Share of earnings of Moa Joint Venture, net of tax
- - - - - - 53.3 53.3
Earnings (loss) from operations and joint venture
62.1 (1.6) (10.9) (1.1) (9.0) (31.6) (19.9) (12.0)
Interest income on financial assets measured at amortized cost 11.2
Revaluation of allowances for expected credit losses
(0.1)
Other financing items (5.5)Financing expense (20.7)Net finance expense (15.1)Loss before income tax (27.1)Income tax expense (0.7)Net loss from continuing operations (27.8)Loss from discontinued operations, net of tax
(4.7)
Net loss for the period $ (32.5) Supplementary information Depletion, depreciation and amortization $ 40.8 $ 0.2 $ 5.6 $ 11.7 $ 0.1 $ 0.7 $ (32.5) $ 26.6Property, plant and equipment expenditures 25.7 - 0.2 - - 0.2 (18.9) 7.2Intangible asset expenditures - - 0.6 - - - - 0.6 Canadian $ millions, as at September 30 2021Non-current assets(4) $ 624.4 $ 0.5 $ 13.4 $ 23.3 $ 0.9 $ 6.8 $ (493.3) $ 176.0Total assets 908.8 73.8 57.9 321.0 1.2 84.4 (114.0) 1,333.1

Notes to the condensed consolidated financial statements
60 Sherritt International Corporation
2020Canadian $ millions, for the nine months ended September 30 (Restated) Moa JV and Metals Oil and Tech- Adjustments for Fort Site(1) Other(2) Gas Power nologies Corporate(2) Moa Joint Venture Total Revenue(3) $ 306.7 $ 6.4 $ 18.7 $ 28.4 $ 0.4 $ 0.5 $ (269.5) $ 91.6Cost of sales (300.4) (8.1) (29.4) (22.4) (7.9) - 258.7 (109.5)Administrative expenses (6.8) 0.2 (4.2) (1.5) - (18.6) 4.1 (26.8)Impairment loss of Oil assets - - (115.6) - - - - (115.6)Share of loss of Moa Joint Venture, net of tax
- - - - - - (2.9) (2.9)
(Loss) earnings from operations and joint venture
(0.5) (1.5) (130.5) 4.5 (7.5) (18.1) (9.6) (163.2)
Gain on debenture exchange 143.4Interest income on financial assets measured at amortized cost
15.8
Revaluation of allowances for expected credit losses
4.1
Other financing items (0.8)Financing expense (35.4)Net finance income 127.1Loss before income tax (36.1)Income tax expense (0.3)Net loss from continuing operations (36.4)Earnings from discontinued operations, net of tax
108.2
Net earnings for the period $ 71.8 Supplementary information Depletion, depreciation and amortization $ 44.4 $ 0.2 $ 5.0 $ 15.8 $ 0.1 $ 0.7 $ (36.3) $ 29.9Property, plant and equipment expenditures 19.9 - 3.4 0.7 0.1 0.1 (16.3) 7.9Intangible asset expenditures - - 0.8 - - - - 0.8 2020Canadian $ millions, as at December 31 (Restated)Non-current assets(4) $ 652.6 $ 0.6 $ 18.5 $ 35.4 $ 1.0 $ 7.2 $ (511.4) $ 203.9Total assets 897.8 71.3 71.9 327.4 1.3 100.8 (118.3) 1,352.2
(1) Included in the Moa JV and Fort Site segment are the operations of the Corporation’s 50% interest in the Moa Joint Venture and its 100% interest in the utility and fertilizer
operations in Fort Saskatchewan.
(2) During the three and nine months ended September 30, 2021, eliminations were included in determining reported segment earnings (loss) from operations and joint venture
given a change to the measure of the segment earnings (loss) that is used by the chief operating decision maker. The prior period has been restated for this change.
(3) Revenue in the Metals Other segment includes $0.6 million and $2.1 million of intersegment revenue, net of elimination, with the Moa JV and Fort Site segment related to
marketing of nickel and cobalt for the three and nine months ended September 30, 2021, respectively ($0.9 million and $2.5 million for the three and nine months ended
September 30, 2020, respectively).
(4) Non-current assets are composed of property, plant and equipment and intangible assets.
Disaggregation of revenue by product type
Revenue in the below table excludes the revenue of the equity-accounted investment in the Moa Joint Venture:
For the three months ended For the nine months ended
2021 2020 2021 2020
Canadian $ millions September 30 September 30 September 30 September 30
Total Total Total Total
revenue revenue revenue revenue
Fertilizer(1) $ 9.8 $ 8.3 $ 38.2 $ 39.5Oil and gas 0.4 4.9 8.3 16.3Power generation(2) 6.0 8.7 17.3 26.4Other 4.5 3.0 9.8 9.4 $ 20.7 $ 24.9 $ 73.6 $ 91.6
(1) Due to the seasonal nature of the fertilizer operations in Fort Saskatchewan, higher fertilizer revenue is expected in the second and fourth quarters of the year. For the
year ended December 31, 2020, 45% of fertilizer revenue was recognized in the second quarter, 23% was recognized in the fourth quarter and the remaining 32% was
recognized in the first and third quarters combined. Revenues for other product types are recognized more evenly throughout the year.
(2) Included in power generation revenue for the three and nine months ended September 30, 2021 is $4.8 million and $13.8 million of revenue from service concession
arrangements ($7.1 million and $19.5 million for the three and nine months ended September 30, 2020).

Sherritt International Corporation 61
5. EXPENSES
Cost of sales includes the following:
For the three months ended For the nine months ended
2021 2020 2021 2020
Canadian $ millions September 30 September 30 September 30 September 30
Employee costs(1) $ 14.8 $ 10.7 $ 43.1 $ 40.6Severance 0.1 0.9 0.7 2.5
Depletion, depreciation and amortization of property, plant and equipment and intangible assets
7.8 9.4 25.4 28.5
Raw materials and consumables 14.1 8.0 44.6 25.4Repairs and maintenance 14.0 16.2 35.9 33.3Shipping and treatment costs 0.3 0.8 1.4 2.3Share-based compensation expense - 0.3 1.5 0.3Changes in inventories and other (23.4) (13.9) (54.2) (23.4) $ 27.7 $ 32.4 $ 98.4 $ 109.5
Administrative expenses include the following:
For the three months ended For the nine months ended
2021 2020 2021 2020
Canadian $ millions September 30 September 30 September 30 September 30
Employee costs(1) $ 5.2 $ 4.9 $ 16.4 $ 18.5Severance and other contractual benefits 3.4 0.1 6.0 1.1Depreciation 0.4 0.4 1.2 1.4Share-based compensation expense 0.8 1.6 13.5 1.7Consulting services and audit fees 0.9 0.3 2.2 2.2Other 0.6 (1.5) 1.2 1.9 $ 11.3 $ 5.8 $ 40.5 $ 26.8
(1) Employee costs for the three and nine months ended September 30, 2021 include recoveries for the Canada Emergency Wage Subsidy within cost of sales of $0.1 million
and $0.3 million, respectively, and recoveries within administrative expenses of nil and $0.1 million, respectively (recoveries within cost of sales $3.8 million and $4.2 million
and recoveries within administrative expenses $0.9 million and $1.5 million for the three and nine months September 30, 2020, respectively).
Corporate office workforce reduction and departures
Administrative expenses for the three and nine months ended September 30, 2021 includes nil and $1.0 million, respectively, of severance expense and nil and $0.8 million, respectively, of accelerated share-based compensation expense related to the May 2021 reduction of 10% of the Corporate office salaried workforce (nil for the three and nine months ended September 30, 2020). The severance liability is included in the current portion of trade accounts payable and accrued liabilities in the condensed consolidated statements of financial position as at September 30, 2021.
Administrative expenses for the three and nine months ended September 30, 2021 include $3.1 million and $4.5 million, respectively, of other contractual benefits expense and $0.5 million and $4.6 million, respectively, of accelerated share-based compensation expense related to the departures of two senior executives on September 30, 2021 and December 31, 2021, who are key management personnel.
Accelerated share-based compensation expense is a result of changes in accounting estimates to reduce the above employees’ vesting periods and forfeiture rates for share-based units previously granted (nil for the three and nine months ended September 30, 2020).
Additional other contractual benefits and share-based compensation expense for one of the departing senior executives will be recognized during the three months ended December 31, 2021 as they complete their service. The amount of share-based compensation expense to be recognized in future periods will be based on the Corporation’s share price in those periods.

Notes to the condensed consolidated financial statements
62 Sherritt International Corporation
6. JOINT ARRANGEMENTS
Investment in Moa Joint Venture
During the three and nine months ended September 30, 2021, the Moa Joint Venture paid dividend distributions of $25.4 million and $71.7 million, respectively, of which $12.7 million and $35.9 million, respectively, were paid to the Corporation representing its 50% ownership interest (nil and $26.6 million, and nil and $13.3 million, respectively, for the three and nine months ended September 30, 2020, respectively).
The following provides additional information relating to the Corporation’s investment in the Moa Joint Venture on a 100% basis:
Statements of financial position
2021 2020
Canadian $ millions, 100% basis, as at September 30 December 31
Current assets(1) $ 454.5 $ 401.2Non-current assets 1,083.7 1,116.4Current liabilities(2) 91.7 85.8Non-current liabilities(3) 136.8 151.5Net assets of Moa Joint Venture $ 1,309.7 $ 1,280.3Proportion of Sherritt's ownership interest 50% 50%Total 654.9 640.2Intercompany capitalized interest elimination (42.3) (42.8)Investment in Moa Joint Venture $ 612.6 $ 597.4
(1) Included in current assets is $75.2 million of cash and cash equivalents (December 31, 2020 - $26.2 million).
(2) Included in current liabilities is $12.6 million of financial liabilities (December 31, 2020 - $22.4 million).
(3) Included in non-current liabilities is $13.2 million of financial liabilities (December 31, 2020 - $20.9 million).
Statements of comprehensive income (loss) For the three months ended For the nine months ended
2021 2020 2021 2020
Canadian $ millions, 100% basis September 30 September 30 September 30 September 30
Revenue $ 198.8 $ 180.8 $ 681.1 $ 539.0Cost of sales(1)(2) (158.5) (163.9) (527.4) (517.4)Administrative expenses(2) (2.6) (2.3) (7.5) (8.2)Earnings from operations 37.7 14.6 146.2 13.4Financing income 0.1 - 0.2 0.4Financing expense (4.9) (1.3) (4.2) (24.4)Net finance expense (4.8) (1.3) (4.0) (24.0)Earnings (loss) before income tax 32.9 13.3 142.2 (10.6)Income tax expense(3) (19.8) (7.3) (41.3) (10.2)
Net earnings (loss) and comprehensive income (loss) of Moa Joint Venture
$ 13.1 $ 6.0 $ 100.9 $ (20.8)
Proportion of Sherritt's ownership interest 50% 50% 50% 50%Total 6.6 3.0 50.5 (10.4)Intercompany elimination 0.9 1.2 2.8 7.5Share of earnings (loss) of Moa Joint Venture, net of tax $ 7.5 $ 4.2 $ 53.3 $ (2.9)
(1) Included in cost of sales for the three and nine months ended September 30, 2021 is depreciation and amortization of $19.7 million and $65.0 million, respectively ($23.4 million and $72.6 million for the three and nine months ended September 30, 2020, respectively).
(2) For the three and nine months ended September 30, 2021, recoveries for the Canada Emergency Wage Subsidy within cost of sales of $0.2 million and $2.7 million, respectively, and within administrative expenses of nil and $0.1 million, respectively, were recognized (recoveries within cost of sales of $6.9 million and $7.0 million and recoveries within administrative expenses of $0.3 million and $0.3 million for the three and nine months ended September 30, 2020, respectively).
(3) Income tax expense for the three and nine months ended September 30, 2021 increased since the comparative periods primarily due to an increase in taxable earnings of the operating companies in the Moa Joint Venture.

Sherritt International Corporation 63
Joint operations
The following provides information relating to the Corporation’s interest in Energas S.A. (Energas) on a 33⅓% basis:
2021 2020
Canadian $ millions, 33⅓% basis, as at September 30 December 31
Current assets(1) $ 93.2 $ 89.2Non-current assets 20.3 30.6Current liabilities 2.6 15.9Non-current liabilities 99.2 85.8Net assets $ 11.7 $ 18.1
(1) Included in current assets is $76.7 million of cash and cash equivalents (December 31, 2020 - $75.0 million).
For the three months ended For the nine months ended
2021 2020 2021 2020
Canadian $ millions, 33⅓% basis September 30 September 30 September 30 September 30
Revenue $ 7.3 $ 9.4 $ 20.2 $ 28.4Expenses (5.6) (11.1) (23.5) (23.5)Net earnings (loss) $ 1.7 $ (1.7) $ (3.3) $ 4.9
7. NET FINANCE (EXPENSE) INCOME
For the three months ended For the nine months ended
2021 2020 2021 2020
Canadian $ millions Note September 30 September 30 September 30 September 30
Gain on debenture exchange $ - $ 143.4 $ - $ 143.4 Interest income on trade accounts receivable, net 0.1 0.2 0.3 0.7Interest income on advances and loans receivable 3.6 3.6 10.9 12.1Interest income on accretion of advances and loans receivable - - - 3.0Interest income on financial assets measured at amortized cost 3.7 3.8 11.2 15.8 Revaluation of allowances for expected credit losses: Trade accounts receivable, net 1.4 (0.6) (0.1) (2.3) Moa Joint Venture expansion loans receivable - - - 6.4Revaluation of allowances for expected credit losses 1.4 (0.6) (0.1) 4.1 Revaluation of cobalt-linked warrants - (0.3) 0.2 0.2Unrealized gains (losses) on commodity put options 1.3 - (3.0) -Realized losses on commodity put options (1.7) - (2.5) -Gain on repurchase of notes 12 - - 2.1 -Other interest income and unrealized gains (losses) on financial instruments
0.1 - (2.3) (1.0)
Other financing items (0.3) (0.3) (5.5) (0.8) Interest expense and accretion on loans and borrowings (10.7) (13.8) (31.5) (43.4)Unrealized foreign exchange (loss) gain (7.9) 3.6 3.3 8.7Realized foreign exchange gain 9.6 0.4 9.5 1.5Other interest expense and finance charges (0.5) (0.2) (1.8) (2.0)Accretion expense on environmental rehabilitation provisions 13 - (0.1) (0.2) (0.2)Financing expense (9.5) (10.1) (20.7) (35.4)Net finance (expense) income $ (4.7) $ 136.2 $ (15.1) $ 127.1

Notes to the condensed consolidated financial statements
64 Sherritt International Corporation
Foreign exchange gain due to Cuban currency unification
During the three and nine months ended September 30, 2021, the Corporation recognized a $10.0 million realized foreign exchange gain within financing expense relating to a Cuban tax liability due to Cuban currency unification. Prior to currency unification, the Cuban tax liability was payable in Cuban convertible pesos (CUC) at the previous exchange rate of 1 CUC:US$1. As a result of Cuban currency unification and confirmation from the Government of Cuba received during the three months ended June 30, 2021, the Cuban tax liability was payable in Cuban pesos (CUP) at the current exchange rate of 24 CUP:US$1, resulting in an unrealized foreign exchange gain. The Cuban tax liability was paid during the three months ending September 30, 2021 and the foreign exchange gain previously recognized as an unrealized foreign exchange gain was reclassified to realized foreign exchange gain.
8. DISCONTINUED OPERATIONS
The (loss) earnings from discontinued operations, net of tax, is presented net in the condensed consolidated statements of comprehensive income (loss) and is composed of the following discontinued operations components: For the three months ended For the nine months ended
2021 2020 2021 2020
Canadian $ millions Note September 30 September 30 September 30 September 30
(Loss) earnings from discontinued operations, net of tax - Ambatovy Joint Venture $ - $ 217.1 $ (0.6) $ 108.2Loss from discontinued operations, net of tax - Other discontinued operations 13 (0.7) - (4.1) -(Loss) earnings from discontinued operations, net of tax $ (0.7) $ 217.1 $ (4.7) $ 108.2
Ambatovy Joint Venture
On August 31, 2020, the Corporation completed a transaction resulting in the extinguishment of all of Sherritt’s obligations under the Corporation’s Ambatovy Joint Venture partner loans, plus all accrued and unpaid interest in respect thereof, in exchange for the Corporation’s remaining 12% interest in the Ambatovy Joint Venture and its loans and operator fee receivable from the Ambatovy Joint Venture (collectively, the “Ambatovy Joint Venture Interests”).
During the nine months ended September 30, 2021, Sherritt ceased being the operator of the Ambatovy Joint Venture.
The loss from discontinued operations, net of tax related to the Ambatovy Joint Venture is composed of the following earnings (loss) components reclassified from continuing operations:
For the three months ended For the nine months ended
2021 2020 2021 2020
Canadian $ millions September 30 September 30 September 30 September 30
Share of loss of an associate, net of tax $ - $ - $ - $ (49.9)Interest income on Ambatovy Joint Venture subordinated loans receivable - - - 4.4Revaluation of allowance for expected credit losses on Ambatovy Joint Venture subordinated loans receivable - - - (68.7)Interest income on Ambatovy Joint Venture subordinated loans receivable - post-financial completion - 0.4 - 3.6Revaluation of allowance for expected credit losses on Ambatovy Joint Venture subordinated loans receivable - post-financial completion - (41.7) - (47.4)Revenue on Ambatovy Joint Venture operator fee receivable - 0.3 - 1.2Revaluation of Ambatovy Joint Venture operator fee receivable - 0.3 - 1.8Realized foreign exchange (loss) gain on monetary assets - (1.2) - 4.2Loss from discontinued operations, net of tax $ - $ (41.9) $ - $ (150.8)

Sherritt International Corporation 65
The loss on disposal of the Ambatovy Joint Venture Interests, net of tax, for the nine months ended September 30, 2021 relates to transaction and other closing costs. The gain on disposal of the Ambatovy Joint Venture Interests, net of tax, for the three and nine months ended September 30, 2020 primarily relates to the extinguishments of the Ambatovy Joint Venture partner loans, including accrued interest, and the Ambatovy Joint Venture operator fee receivable, the reclassification of accumulated other comprehensive income on disposal of foreign operation and transaction and other closing costs. The gain (loss) on disposal of the Ambatovy Joint Venture Interests, net of tax, and loss from discontinued operations, net of tax are presented net in the condensed consolidated statements of comprehensive income (loss) within (loss) earnings from discontinued operations, net of tax as follows:
For the three months ended For the nine months ended
2021 2020 2021 2020
Canadian $ millions September 30 September 30 September 30 September 30
Gain (loss) on disposal of the Ambatovy Joint Venture Interests, net of tax $ - $ 259.0 $ (0.6) $ 259.0Loss from discontinued operations, net of tax - (41.9) - (150.8)Earnings (loss) from discontinued operations, net of tax – Ambatovy Joint Venture
$ - $ 217.1 $ (0.6) $ 108.2
Other discontinued operations
For the three and nine months ended September 30, 2021, the Corporation recognized $0.7 million and $4.1 million, respectively, of losses from discontinued operations, net of tax as a result of a revision to the estimated future costs of a provision retained by the Corporation following the sale of its Coal operations in 2014 (nil for the three and nine months ended September 30, 2020). Cash used by discontinued operations includes payments of $1.2 million and $1.8 million made in respect of this provision during the three and nine months ended September 30, 2021, respectively (note 13) ($1.9 million and $3.0 million in cash used by discontinued operations for the three and nine months ended September 30, 2020, respectively).
9. (LOSS) EARNINGS PER SHARE
For the three months ended For the nine months ended
2021 2020 2021 2020Canadian $ millions, except share amounts in millions and per share amounts in dollars September 30 September 30 September 30 September 30
Net (loss) earnings from continuing operations $ (15.5) $ 11.4 $ (27.8) $ (36.4)(Loss) earnings from discontinued operations, net of tax (0.7) 217.1 (4.7) 108.2Net (loss) earnings for the period - basic and diluted $ (16.2) $ 228.5 $ (32.5) $ 71.8 Weighted-average number of common shares - basic and diluted(1) 397.3 397.3 397.3 397.3 Net (loss) earnings from continuing operations per common share: Basic and diluted $ (0.04) $ 0.03 $ (0.07) $ (0.09) (Loss) earnings from discontinued operations, net of tax, per common share: Basic and diluted $ 0.00 $ 0.55 $ (0.01) $ 0.27 Net (loss) earnings per common share: Basic and diluted $ (0.04) $ 0.58 $ (0.08) $ 0.18
(1) The determination of the weighted-average number of common shares - diluted excludes 8.6 million shares related to stock options, nil million shares related to warrants
from the 2016 debenture extension and nil shares related to the cobalt-linked warrants that were anti-dilutive for the three and nine months ended September 30, 2021,
respectively (9.0 million, 10.4 million and 47.2 million, respectively, that were anti-dilutive for the three and nine months ended September 30, 2020).

Notes to the condensed consolidated financial statements
66 Sherritt International Corporation
10. FINANCIAL INSTRUMENTS
Cash and cash equivalents
Cash and cash equivalents consist of:
2021 2020Canadian $ millions, as at September 30 December 31
Cash equivalents $ 24.1 $ 41.0Cash held in banks 139.3 126.4 $ 163.4 $ 167.4
The Corporation’s cash balances are deposited with major financial institutions rated A- or higher by Standard and Poor’s except for institutions located in Cuba that are not rated. The total cash held in Cuban bank deposit accounts was $80.1 million as at September 30, 2021 (December 31, 2020 - $80.0 million).
As at September 30, 2021, $76.7 million of the Corporation’s cash and cash equivalents was held by Energas (December 31, 2020 - $75.0 million). These funds are for use locally by the joint operation and will be transferred to the Corporation upon foreign exchange approval.
Cuban currency unification
On January 1, 2021, the Cuban government unified its two currencies and discontinued use of the Cuban convertible peso (CUC), with a six-month transition period for the CUC to be phased out of the economy. The Cuban peso (CUP) remains as the sole Cuban currency at a current exchange rate of 24 CUP:US$1. Further legislation and regulation may be enacted in 2021 as the Cuban government evaluates the impact of the currency unification process.
There was no impact to the functional currencies of the Corporation’s Cuban entities as a result of currency unification and the U.S. dollar remains the functional currency of these Cuban entities. The Corporation recognized a realized foreign exchange gain of $10.0 million within financing expense upon payment of a Cuban tax liability during the three and nine months ended September 30, 2021 as a result of currency unification and confirmation received from the Government of Cuba during the nine months ended September 30, 2021 (note 7). During the three and nine months ended September 30, 2021, the Corporation also incurred lower labour and other service costs at its Cuban entities as a result of Cuban currency unification. The Corporation continues to monitor the impact of currency unification on its Cuban operations. All Cuban receivables remain owing to the Corporation and are denominated in U.S. dollars.
Fair value measurement
The following table presents financial instruments with carrying values different from their fair values:
2021 2020
Canadian $ millions, as at Note September 30 December 31
Hierarchy Carrying Fair Carrying Fair
level value value value value
Liabilities: 8.50% second lien secured notes due 2026(1) 12 1 $ 354.1 $ 210.3 $ 358.4 $ 185.9 10.75% unsecured PIK option notes due 2029(1) 12 1 82.6 33.9 75.0 16.9
(1) The fair values of the 8.50% second lien secured notes due 2026 and 10.75% unsecured PIK option notes due 2029 are based on market closing prices.

Sherritt International Corporation 67
Trade accounts receivable, net, and unbilled revenue
Trade accounts receivable, net, and unbilled revenue consist of:
2021 2020Canadian $ millions, as at September 30 December 31
Trade accounts receivable, net $ 132.9 $ 139.8Unbilled revenue - 0.5 $ 132.9 $ 140.3
Trade accounts receivable, net 2021 2020Canadian $ millions, as at September 30 December 31
Trade accounts receivable $ 124.1 $ 128.7Allowance for expected credit losses (21.3) (21.4)Accounts receivable from joint operations - 0.3Accounts receivable from Moa Joint Venture 13.1 13.8Other 17.0 18.4 $ 132.9 $ 139.8
Aging of trade accounts receivable, net 2021 2020Canadian $ millions, as at September 30 December 31
Not past due $ 102.7 $ 108.5Past due no more than 30 days 0.7 2.6Past due for more than 30 days but no more than 60 days 0.5 2.2Past due for more than 60 days 29.0 26.5 $ 132.9 $ 139.8
11. ADVANCES, LOANS RECEIVABLE AND OTHER FINANCIAL ASSETS 2021 2020Canadian $ millions, as at September 30 December 31
Advances and loans receivable Energas conditional sales agreement $ 201.5 $ 197.0 Other financial assets Commodity put options 0.1 5.7Other 3.8 4.5 205.4 207.2Current portion of advances, loans receivable and other financial assets(1) (12.8) (37.6)Non-current portion of advances, loans receivable and other financial assets $ 192.6 $ 169.6
(1) Included in the current portion of advances, loans receivable and other financial assets is the Energas conditional sales agreement of $11.9 million (December 31, 2020 -
$31.1 million).
Moa Joint Venture working capital facility
The Moa Joint Venture working capital facility is a working capital facility from the Corporation for use by the Moa Joint Venture. On October 28, 2021, subsequent to period-end, the Moa Joint Venture working capital facility was amended and its maturity extended for two years from April 30, 2022 to April 30, 2024. The maximum credit available increased from $45.0 million to $75.0 million and the interest rates are bankers’ acceptance plus 4.00%, which remain unchanged. Borrowings on the facility are available to fund working capital and capital expenditures of $45.0 million and $30.0 million, respectively. As at September 30, 2021, no amounts were drawn on the facility (December 31, 2020 – nil).

Notes to the condensed consolidated financial statements
68 Sherritt International Corporation
12. LOANS, BORROWINGS AND OTHER FINANCIAL LIABILITIES
Loans and borrowings
For the nine months ended
September 30, 2021
Cash flows Non-cash changes
As at As at
2020 Repurchase of notes
2021
Canadian $ millions Note December 31 Other September 30
8.50% second lien secured notes due 2026 10 $ 358.4 $ (4.6) $ 0.3 $ 354.110.75% unsecured PIK option notes due 2029 10 75.0 - 7.6 82.6Syndicated revolving-term credit facility 8.0 - - 8.0 $ 441.4 $ (4.6) $ 7.9 $ 444.7Current portion of loans and borrowings (8.0) (8.0)Non-current portion of loans and borrowings $ 433.4 $ 436.7
8.50% second lien secured notes due 2026
During the nine months ended September 30, 2021, the Corporation repurchased $7.0 million of principal of the 8.50% second lien secured notes due 2026 on the open market at a cost of $4.6 million, plus $0.2 million of accrued interest, resulting in a gain on repurchase of notes of $2.1 million (note 7).
As at September 30, 2021, the outstanding principal amount of the 8.50% second lien secured notes due 2026 is $350.5 million.
Other non-cash changes on the 8.50% second lien secured notes due 2026 consists of the gain on repurchase of notes, net of accretion of a 7% premium. This premium is due upon the earlier of optional redemption and maturity of the 8.50% second lien secured notes due 2026 and is accreted over the life of the instrument.
10.75% unsecured PIK option notes due 2029
During the nine months ended September 30, 2021, the Corporation elected not to pay cash interest of $7.6 million on the 10.75% unsecured PIK option notes due 2029 and added the payment-in-kind interest to the principal amount owed to noteholders.
As at September 30, 2021, the outstanding principal amount of the 10.75% unsecured PIK option notes due 2029 is $82.6 million.
Other non-cash changes on the 10.75% unsecured PIK option notes due 2029 consists of accretion and capitalized interest. Accrued and unpaid interest on these loans is capitalized to the principal balance semi-annually in January and July at the election of the Corporation.
Syndicated revolving-term credit facility
On October 28, 2021, subsequent to period-end, the syndicated revolving-term credit facility was amended and its maturity extended for two years from April 30, 2022 to April 30, 2024. The maximum credit available increased from $70.0 million to $100.0 million and the interest rates are bankers’ acceptance plus 4.00%, which remain unchanged. Borrowings on the credit facility are available to fund working capital and capital expenditures. Spending on capital expenditures cannot exceed $75.0 million in a fiscal year. This restriction does not apply to capital expenditures of Moa Nickel S.A. The total available draw is based on eligible receivables and inventories, which are pledged as collateral. Certain cash held in banks in Canada is also pledged as collateral.
The facility is subject to the following financial covenants and restrictions as of October 28, 2021:
Net Available Cash covenant, as defined in the agreement, of $25.0 million. The amount compared against this covenant is comprised of cash and cash equivalents and short-term investments of the Corporation and its wholly-owned subsidiaries held in Canada, plus undrawn amounts on the credit facility;

Sherritt International Corporation 69
Senior Secured Net Debt-to-EBITDA covenant, as defined in the agreement, of less than 2:1. Senior Secured Net Debt is calculated as first-lien debt, or amounts drawn on the credit facility, any derivative liability and any additional security ranked equal to first-lien debt, less cash and cash equivalents and short-term investments of the Corporation and its wholly-owned subsidiaries held in Canada up to $25.0 million. EBITDA is calculated on a 12-month trailing basis with Energas included on a cash basis.
EBITDA-to-Interest Expense covenant, as defined in the agreement, of not less than 1.5:1 prior to September 30, 2022 and not less than 2:1 thereafter. EBITDA is calculated on a 12-month trailing basis with Energas included on a cash basis. Interest expense excludes the payment-in-kind (PIK) interest on the Corporation’s 10.75% unsecured PIK option notes due 2029; and
Minimum Tangible Net Worth covenant, as defined in the agreement, of $600.0 million plus 50% of positive net earnings. In the event of expiration of the Corporation’s current contract term for power generation from Energas in March 2023, the Minimum Tangible Net Worth covenant decreases to $550.0 million plus 50% of positive net earnings, effective upon the date of expiration, if applicable. Tangible Net Worth is calculated as total assets, less intangible assets, less amounts drawn on the credit facility, less the principal amount of the 8.50% second lien secured notes due in 2026, less the principal amount of the 10.75% unsecured PIK option notes due in 2029, less any derivative liability and less any additional secured financing ranked equal to first-lien debt.
Effective September 30, 2020, the Corporation did not renew a $47.0 million letter of credit issued to support its share of the environmental rehabilitation obligations held by its Spanish Oil and Gas operations. Subsequent to period-end, the environmental rehabilitation obligations held by the Corporation’s Spanish Oil and Gas operations were secured by a parent company guarantee of €31.5 million until December 31, 2023, with no impact on the Corporation’s available liquidity.
Other financial liabilities
2021 2020
Canadian $ millions, as at Note September 30 December 31
Lease liabilities $ 14.6 $ 15.7Share-based compensation liability 5 23.8 10.5Other financial liabilities 1.8 3.3 40.2 29.5Current portion of other financial liabilities (8.4) (4.8)Non-current portion of other financial liabilities $ 31.8 $ 24.7
13. PROVISIONS
2021 2020
Canadian $ millions, as at Note September 30 December 31
Environmental rehabilitation provisions $ 98.9 $ 109.9Other provisions 8 4.5 2.2 103.4 112.1Current portion of provisions (3.6) (1.9)Non-current portion of provisions $ 99.8 $ 110.2
The following is a reconciliation of the environmental rehabilitation provisions:
For the nine For the
months ended year ended
2021 2020Canadian $ millions Note September 30 December 31
Balance, beginning of the period $ 109.9 $ 97.9Change in estimates (7.3) 8.6Gain on settlement of environmental rehabilitation provisions (1.1) (0.3)Accretion 7 0.2 0.3Effect of movement in exchange rates (2.8) 3.4Balance, end of the period $ 98.9 $ 109.9

Notes to the condensed consolidated financial statements
70 Sherritt International Corporation
The following is a reconciliation of other provisions: For the nine For the
months ended year ended
2021 2020Canadian $ millions Note September 30 December 31
Balance, beginning of the period $ 2.2 $ 6.5Change in estimates 8 4.1 -Utilized during the period 8 (1.8) (4.3)Balance, end of the period $ 4.5 $ 2.2
14. COMMITMENTS FOR EXPENDITURES
Canadian $ millions, as at September 30 2021
Property, plant and equipment commitments $ 6.5
Joint venture: Property, plant and equipment commitments 27.1
15. SUPPLEMENTAL CASH FLOW INFORMATION
Net change in non-cash working capital
For the three months ended For the nine months ended
2021 2020 2021 2020Canadian $ millions September 30 September 30 September 30 September 30
Trade accounts receivable, net, and unbilled revenue $ 42.1 $ 2.5 $ 10.0 $ 4.9Inventories (9.5) (5.4) (9.8) (0.7)Prepaid expenses (2.0) (0.4) (2.9) (2.5)Trade accounts payable and accrued liabilities (26.6) 21.7 0.3 7.5Deferred revenue 9.5 3.3 18.5 5.2
$ 13.5 $ 21.7 $ 16.1 $ 14.4
During the three months ended September 30, 2021, deferred revenue increased due to prepayments for fertilizers. During the nine months ended September 30, 2021, deferred revenue increased due to prepayments for fertilizers and a prepayment against nickel deliveries in 2021.
16. SHAREHOLDERS’ EQUITY
Capital stock
The Corporation’s common shares have no par value and the authorized share capital is composed of an unlimited number of common shares. The changes in the Corporation’s outstanding common shares were as follows:
For the nine For the
months ended year ended
2021 2020
Canadian $ millions, except share amounts September 30 December 31
Number Capital stock Number Capital stock
Balance, beginning of the period 397,284,652 $ 2,894.9 397,282,785 $ 2,894.9Warrants exercised - 2016 debenture extension 4,028 - 1,867 -Balance, end of the period 397,288,680 $ 2,894.9 397,284,652 $ 2,894.9
During the nine months ended September 30, 2021, the 2016 debenture warrants expired and were not exercised.

Sherritt International Corporation 71
17. FINANCIAL RISK MANAGEMENT
COVID-19 and Cuba risk
The Corporation’s operations are subject to the risk of emerging infectious diseases or the threat of outbreaks of viruses or other contagions or epidemic diseases, including the novel COVID-19 pandemic. The global response to the COVID-19 pandemic has resulted in, among other things, border closures, severe travel restrictions, as well as quarantine, self-isolation and other emergency measures imposed by various governments. Additional government or regulatory actions or inactions around the world in jurisdictions where the Corporation operates may also have potentially significant economic and social impacts. If the business operations of the Corporation are disrupted or suspended as a result of these or other measures, it may have a material adverse effect on the Corporation’s business, results of operations and financial performance. There are potentially significant adverse impacts of COVID-19 which may include decreased demand or the inability to sell nickel or cobalt or declines in the price of nickel and cobalt or other unknown but potentially significant impacts. COVID-19 and efforts to contain it may have a significant effect on commodity prices, and the possibility of a prolonged global economic downturn may further impact commodity demand and prices.
While COVID-19 impacted the Corporation’s mining and refining operations and supply chain during the three months ended September 30, 2021, finished nickel and cobalt production at the Moa Joint Venture and Fort Site during the three and nine months ended September 30, 2021 was not materially impacted by COVID-19.
During the three and nine months ended September 30, 2021, Cuba experienced increased hardships as a result of the impact of COVID-19 and continued U.S. sanctions, impacting the country’s tourism and other industries, hampering the country’s foreign currency liquidity and resulting in prolonged border closures, food and medicine shortages, electricity outages and sporadic civil demonstrations. In addition, the number of new cases of COVID-19 in Cuba increased during the nine months ended September 30, 2021, which have since decreased subsequent to period-end. As at October 31, 2021, 88% of Cuba’s population had received at least one vaccine dose and 64% have been fully vaccinated, per Our World in Data. The foregoing may contribute to increased political, economic and related risks to the Corporation. See the discussion of risks associated with COVID-19 in “Risk Factors – Liquidity and Access to Capital” and “Risk Factors – Political, Economic and Other Risks of Foreign Operations” in the Corporation’s Annual Information Form.
The timing and amount of receipts of Cuban energy payments are dependent upon Cuba’s economy, which has been impacted by restrictions on tourism as a result of COVID-19 and ongoing impact of U.S. sanctions limiting Cuba’s access to foreign currency, in addition to the impact of Cuban currency unification. The carrying values of trade accounts receivable for the Oil and Gas and Power segments and the Energas conditional sales agreement within the Corporation’s condensed consolidated statements of financial position reflect the Corporation’s exposure to credit risk. The net carrying value represents the Corporation’s best estimate of amounts collectible as at the reporting date.
As a result of the COVID-19 pandemic, the Corporation's financial position, performance and cash flows could be impacted by COVID-19, the full extent of the impact cannot be reasonably estimated at this time. For the three and nine months ended September 30, 2021, there have been no significant impacts from COVID-19 on the Corporation, other than the items described above.
18. RELATED PARTY TRANSACTIONS
The Corporation enters into transactions related to its joint arrangements (note 6). Transactions between related parties are generally based on standard commercial terms. All amounts outstanding are unsecured and will be settled in cash. No guarantees have been given or received on the outstanding amounts. No expense has been recognized in the current or prior periods for bad debts in respect of amounts owed by related parties.

Sherritt International Corporation
22 Adelaide Street West, Suite 4220
Toronto, ON M5H 4E3
For further investor information contact:
Telephone: 416.935.2451
Toll-free 1.800.704.6698
www.sherritt.com