2021 notice & proxy statement 2020 annual report
TRANSCRIPT

2020 Annual Report2021 Notice & Proxy Statement
15099 Eagle Financial Bancorp AR Cover.indd 1 3/2/2021 9:47:55 AM

STOCKHOLDER INFORMATION
Annual Meeting
The Annual Meeting of Shareholders will be held at 4:00 p.m. on Tuesday April 20, 2021 at the Western Hills Country Club, located at 5780 Cleves Warsaw Pike, Cincinnati, Ohio 45233.
Stock Listing
The Company’s Common Stock is listed on OTCQB Market under the symbol “EFBI”.
Special Counsel
Luse Gorman, PC5335 Wisconsin Avenue, N.W., Suite 780Washington, D.C. 20015
Independent Registered Public Accounting Firm
BKD, LLP312 Walnut Street, Suite 3000Cincinnati, OH 45202
Transfer Agent
Continental Stock Transfer & Trust Company1 State Street30th FloorNew York, New York 10004
If you have any questions concerning your stockholder account, please call our transfer agent, noted above, at 1-800-509-5586. This is the number to call if you require a change of address, records or information about lost certificates.
DIRECTORS AND EXECUTIVE OFFICERS
Directors
James W. BraunChairman of the Board
Guy W. CagneyDirector
Steven J. DulleDirector
Gary J. KoesterDirector, President and Chief Executive Officer
Adam B. GoetzmanDirector
Steven C. KehoeDirector
Executive Officers
Gary J. KoesterPresident and Chief Executive Officer
Patricia L. WalterExecutive Vice President
Kevin R. SchrammVice President, Chief Financial Officer and Treasurer
W. Raymond McCleeseVice President of Commercial Lending
15099 Eagle Financial Bancorp AR Inside Front and Back Cover.indd 1 3/2/2021 11:54:41 AM

March 19, 2021 Dear Shareholder:
You are cordially invited to attend the annual meeting of shareholders of Eagle Financial Bancorp, Inc. The meeting will be held at Western Hills Country Club, located at 5780 Cleves Warsaw Pike, Cincinnati, Ohio, 45233, at 4:00 p.m., local time, on Tuesday, April 20, 2021.
The notice of annual meeting and proxy statement appearing on the following pages describe the formal business to be transacted at the meeting. Officers of the Company are expected to be present to respond to appropriate questions of shareholders.
It is important that your shares are represented at this meeting, whether or not you attend the meeting in person and regardless of the number of shares you own. To make sure your shares are represented, we urge you to complete and mail the enclosed proxy card promptly. If you attend the meeting, you may vote in person even if you have previously mailed a proxy card.
We are monitoring the effects in our region of the coronavirus disease 2019 (COVID-19)
pandemic. The health and well-being of our employees, shareholders, directors, officers and other stakeholders are paramount. If public health developments warrant, we may change the date, time or location of the annual meeting, including the possibility that we may hold the annual meeting through a “virtual” or online method. Any such change will be announced as promptly as practicable, through a press release and notice on our website at www.eaglesavings.com, as well as any other notification required by state law.
We hope to see you at the meeting.
Sincerely,
Gary J. Koester President and Chief Executive Officer


Eagle Financial Bancorp, Inc. 6415 Bridgetown Road Cincinnati, Ohio 45248
(513) 574-0700 ______________________
NOTICE OF 2021 ANNUAL MEETING OF SHAREHOLDERS ______________________
TIME AND DATE .................... 4:00 p.m. on Tuesday, April 20, 2021.
PLACE ....................................... Western Hills Country Club, located at 5780 Cleves Warsaw Pike, Cincinnati, Ohio 45233.
ITEMS OF BUSINESS ............. (1) To elect two directors to serve for a term of three years.
(2) To ratify the selection of BKD, LLP as our independentregistered public accounting firm for the fiscal year endingDecember 31, 2021.
(3) To transact such other business as may properly come beforethe meeting and any adjournment or postponement thereof.
RECORD DATE ....................... To vote, you must have been a shareholder at the close of business on March 1, 2021.
PROXY VOTING ..................... It is important that your shares be represented and voted at the meeting. You can vote your shares by completing and returning the proxy card or voting instruction card sent to you. Voting instructions, including how to vote by phone or internet, are printed on your proxy or voting instruction card. You can revoke a proxy at any time before its exercise at the meeting by following the instructions in the proxy statement.
Important Notice Regarding COVID-19
We are monitoring the effects in our region of the coronavirus disease 2019 (COVID-19) pandemic. The health and well-being of our employees, shareholders, directors, officers and other stakeholders are paramount. If public health developments warrant, we may change the date, time or location of the annual meeting, including the possibility that we may hold the annual meeting through a “virtual” or online method. Any such change will be announced as promptly as practicable, through a press release and notice on our website at www.eaglesavings.com, as well as any other notification required by state law.
By Order of the Board of Directors
Patricia L. Walter Corporate Secretary March 19, 2021
The Proxy Statement, Notice and 2020 Annual Report are Available at: http://www.cstproxy.com/eaglesavings/2021.


Eagle Financial Bancorp, Inc.
Proxy Statement
This proxy statement is furnished in connection with the solicitation of proxies by the Board of Directors of Eagle Financial Bancorp, Inc. (the “Company” or “Eagle Financial”) to be used at the annual meeting of shareholders of the Company. The Company is the holding company for EAGLE.bank (the “Bank”). The annual meeting will be held at Western Hills Country Club, located at 5780 Cleves Warsaw Pike, Cincinnati, Ohio 45233 on Tuesday, April 20, 2021 at 4:00 p.m. local time. This proxy statement and the enclosed proxy card are being mailed to shareholders of record on or about March 19, 2021.
Voting and Proxy Procedure
Who Can Vote at the Meeting
You are entitled to vote your Company common stock if the records of the Company show that you held your shares as of the close of business on March 1, 2021. If your shares are held through a broker, bank or similar holder of record, you are considered the beneficial owner of shares held in “street name” and these proxy materials are being forwarded to you by your broker or other holder of record. As the beneficial owner, you have the right to direct your broker or other holder of record how to vote by filling out a voting instruction form that accompanies these proxy materials. Your broker or other holder of record may allow you to provide voting instructions by telephone or by the Internet. Please see the voting instruction form provided by your broker or other holder of record that accompanies this proxy statement.
As of the close of business on March 1, 2021, there were 1,525,753 shares of Company common stock outstanding. Each share of common stock has one vote. The Company’s articles of incorporation provide that record owners of Company common stock beneficially owned by a person who beneficially owns in excess of 10% of the Company’s outstanding common stock (a “10% beneficial owner”), shall not be entitled to vote, in the aggregate, shares beneficially owned by the 10% beneficial owner in excess of 10% of the Company’s outstanding common stock, unless a majority of unaffiliated directors (as defined in the articles of incorporation) grant such entitlement by resolution in advance of the acquisition of the excess shares.
Attending the Meeting
If you were a shareholder as of the close of business on March 1, 2021, you may attend the meeting. However, if your shares of Company common stock are held in street name, you will need proof of ownership to be admitted to the meeting. A recent account statement or letter from your broker or other holder of record are examples of proof of ownership. If you want to vote your shares of Company common stock held in street name in person at the meeting, you will have to get a written proxy in your name from your broker or other holder of record.
Quorum and Vote Required for Proposals
Quorum. A majority of the outstanding shares of common stock entitled to vote is required to be represented at the meeting to constitute a quorum for the transaction of business.

Votes Required for Proposals. At this year’s annual meeting, shareholders will elect two directors to serve for a term of three years and until their successors are elected and qualified. In voting on the election of directors, you may vote in favor of the nominees, withhold votes as to all nominees, or withhold votes as to a specific nominee. There is no cumulative voting for the election of directors. Directors must be elected by a plurality of the votes cast at the annual meeting. This means that the nominees receiving the greatest number of votes will be elected.
In voting on the ratification of the appointment of BKD, LLP (“BKD”) as the Company’s independent registered public accounting firm, you may vote in favor of the proposal, vote against the proposal or abstain from voting. To ratify the selection of BKD as our independent registered public accounting firm for the fiscal year ending December 31, 2021, the affirmative vote of a majority of the votes cast on the proposal is required.
Broker Non-Votes. If you do not provide your broker or other record holder with voting instructions on certain non-routine matters, your broker will not have discretion to vote your shares on such matters. The election of directors is a non-routine matter. In the case of routine matters (e.g., the ratification of the appointment of the Company’s independent registered public accounting firm), your broker or other holder of record is permitted to vote your shares in the record holder’s discretion if you have not provided voting instructions. A “broker non-vote” occurs when your broker submits a proxy for the meeting with respect to routine matters, but does not vote on non-routine matters because you did not provide voting instructions on such matters.
How Votes Are Counted. If you return valid proxy instructions or attend the meeting in person, we will count your shares for purposes of determining whether there is a quorum, even if you abstain from voting. Broker non-votes also will be counted for purposes of determining the existence of a quorum.
In counting votes for the election of directors, votes that are withheld and broker non-votes will have no effect on the outcome of the election.
In counting votes on the proposal to ratify the selection of the independent registered public accounting firm, abstentions will have no effect on the outcome of the vote.
Voting by Proxy
The Company’s Board of Directors is sending you this proxy statement to request that you allow your shares of Company common stock to be represented at the annual meeting by the persons named in the enclosed proxy card. All shares of Company common stock represented at the meeting by properly executed and dated proxies will be voted according to the instructions indicated on the proxy card. If you sign, date and return a proxy card without giving voting instructions, your shares will be voted as recommended by the Company’s Board of Directors.
The Board of Directors recommends that you vote:
for each of the nominees for director; and
for ratification of the appointment of BKD as the Company’s independent registeredpublic accounting firm.
If any matters not described in this proxy statement are properly presented at the annual meeting, the persons named in the proxy card will use their judgment to determine how to vote your shares. This
2

includes a motion to adjourn or postpone the meeting to solicit additional proxies. If the annual meeting is postponed or adjourned for less than 30 days, your Company common stock may be voted by the persons named in the proxy card on the new meeting date, provided you have not revoked your proxy. The Company does not currently know of any other matters to be presented at the meeting.
You may revoke your proxy at any time before the vote is taken at the meeting. To revoke your proxy, you must advise the Corporate Secretary of the Company in writing before your common stock has been voted at the annual meeting, deliver a later dated proxy or attend the meeting and vote your shares in person by ballot. Attendance at the annual meeting will not in itself constitute revocation of your proxy.
Participants in the Eagle Savings Bank ESOP or 401(k) Plan
If you participate in the Eagle Savings Bank Employee Stock Ownership Plan (the “ESOP”), you will receive a vote authorization form for the plan that reflects all shares you may direct the trustees to vote on your behalf under the ESOP. Under the terms of the ESOP, the ESOP trustee votes all shares held by the ESOP, but each ESOP participant may direct the trustee how to vote the shares of common stock allocated to his or her account. The ESOP trustee, subject to the exercise of its fiduciary responsibilities, will vote all unallocated shares of Eagle Financial common stock held by the ESOP and allocated shares for which no voting instructions are received in the same proportion as shares for which it has received timely voting instructions. Under the terms of the Eagle Savings Bank 401(k) Profit Sharing Plan (the “401(k) Plan”), a participant is entitled to vote the shares credited to his or her 401(k) Plan account. Shares for which no voting instructions are given or for which instructions were not timely received may be voted by the 401(k) Plan trustee as directed in the sole discretion of the Plan Administrator, subject to the determination that such a vote is for the exclusive benefit of plan participants and beneficiaries. The deadline for returning your ESOP and 401(k) Plan voting instructions is April 13, 2021.
3

Corporate Governance and Board Matters
The Company periodically reviews its corporate governance policies and procedures to ensure that the Company reports results with accuracy and transparency and maintains full compliance with the laws, rules and regulations that govern the Company’s operations.
Proposal 1 — Election of Directors
Eagle Financial Bancorp, Inc. and EAGLE.bank each have six directors. Directors serve three-year staggered terms so that approximately one-third of the directors are elected at each annual meeting. James W. Braun, the Chairman of the Board, will retire at the annual meeting creating one vacancy on the Company’s Board of Directors, which the Board has determined to fill with the appointment of Patricia L. Walter, the Company’s Executive Vice President. Directors of EAGLE.bank will be elected by Eagle Financial Bancorp, Inc. as its sole stockholder. The table below sets forth certain information regarding the composition of the Board of Directors and management as well as stock ownership of directors and executive officers as of March 1, 2021. Except as indicated herein each of the named individuals has sole voting power and sole investment power with respect to the number of shares shown. Percentages are based on 1,525,753 shares of Company common stock issued and outstanding as of March 1, 2021.
Name(1) Age as of 12/31/20
Positions Held in Eagle Financial Bancorp, Inc.
Directors Since(2)
Term to Expire
Shares of Common Stock Beneficially
Owned on the Record Date(3)
Percent of Class
Directors Gary J. Koester 67 President, Chief Executive
Officer and Director 1982 2022 70,110(4) 4.59%
James W. Braun 73 Chairman of the Board 1995 2021 15,160(5) (*) Guy W. Cagney 68 Director 2002 2023 40,160(6) 2.63% Steven J. Dulle 63 Director 1996 2023 35,160(7) 2.30% Adam B. Goetzman 61 Director 2008 2021 23,160(8) 1.52% Steven C. Kehoe 65 Director 2008 2022 25,160(9) 1.65%
Named Executive Officers Who Are Not Directors Patricia L. Walter 45 Executive Vice President 48,220(10) 3.16% Kevin R. Schramm 56 Vice President, Chief
Financial Officer and Treasurer
29,043(11) 1.90%
All directors and executive officers as a group (9 persons)
294,152 19.28%
____________________________________________ (*) Less than 1%. (1) The mailing address for each person listed is 6415 Bridgetown Road, Cincinnati, Ohio 45248.(2) Includes service since initial appointment to the Board of Directors of our mutual bank predecessor. Service on the
Company Board of Directors began on the later of the year listed or July 2017 when the Company acquired the Bank inconnection with the Bank’s mutual to stock conversion.
(3) Shares of common stock are held directly unless indicated otherwise in the footnotes below.(4) Includes 5,700 shares of common stock held in Mr. Koester’s individual retirement account, 20,000 shares held by Mr.
Koester’s spouse, 14,300 shares held in Mr. Koester’s 401(k) plan account, 8,130 shares of unvested restricted stock awards,14,192 shares that can be acquired pursuant to stock options within 60 days of March 1, 2021 and 2,368 shares held in Mr.Koester’s employee stock ownership plan (“ESOP”) account.
(5) Includes 10,000 shares of common stock held in Mr. Braun’s individual retirement account, 1,548 shares of unvestedrestricted stock awards and 2,580 shares that can be acquired pursuant to stock options within 60 days of March 1, 2021.
4
(6) Includes 20,000 shares of common stock held in Mr. Cagney’s individual retirement account, 10,700 shares held by Mr.Cagney’s spouse’s individual retirement account, 1,548 shares of unvested restricted stock awards and 2,580 shares that canbe acquired pursuant to stock options within 60 days of March 1, 2021.
(7) Includes 15,000 shares of common stock held in Mr. Dulle’s individual retirement account, 15,000 shares held by Mr.Dulle’s spouse’s individual retirement account, 1,548 shares of unvested restricted stock awards and 2,580 shares that can beacquired pursuant to stock options within 60 days of March 1, 2021.
(8) Includes 1,548 shares of unvested restricted stock awards and 2,580 shares that can be acquired pursuant to stock optionswithin 60 days of March 1, 2021.
(9) Includes 16,000 shares of common stock held in Mr. Kehoe’s individual retirement account, 1,548 shares of unvestedrestricted stock awards and 2,580 shares that can be acquired pursuant to stock options within 60 days of March 1, 2021.
(10) Includes 15,999 shares of common stock held in Ms. Walter’s individual retirement account, 12,650 shares held by Ms.Walter’s spouse’s individual retirement account, 1,350 shares held by Ms. Walter’s three children, 5,034 shares of unvestedrestricted stock awards, 8,388 shares that can be acquired pursuant to stock options within 60 days of March 1, 2021 and1,443 shares held in Ms. Walter’s ESOP account.
(11) Includes 10,000 shares of common stock held in Mr. Schramm’s individual retirement account, 10,000 shares held in Mr.Schramm’s 401(k) plan account, 2,322 shares of unvested restricted stock awards, 3,872 shares that can be acquiredpursuant to stock options within 60 days of March 1, 2021 and 1,301 shares held in Mr. Schramm’s ESOP account.
Nominees for Election as Directors
The nominees for election as directors at the 2021 annual meeting of shareholders are Adam B. Goetzman and Patricia L. Walter. Mr. Goetzman is a current director of the Company and the Bank, and Ms. Walter has been nominated by the Nominating and Corporate Governance Committee of the Board to fill the vacancy created by the retirement of Chairman of the Board James W. Braun.
It is intended that the proxies solicited by the Board of Directors will be voted for the election of the nominees named above unless other instructions are provided. If any nominee is unable to serve, the proxy committee will vote your shares to approve the election of any substitute proposed by the Board of Directors. Alternatively, the Board of Directors may adopt a resolution to reduce the size of the Board. At this time, the Board of Directors knows of no reason why any nominee might be unable to serve.
THE BOARD OF DIRECTORS RECOMMENDS A VOTE “FOR” THE ELECTION OF BOTH NOMINEES.
The Business Background of Nominees and Continuing Directors and Executive Officers
The business experience for the past five years of each of our nominees and continuing directors is set forth below. Unless otherwise indicated, directors have held their positions for the past five years.
Nominees
The nominees standing for election for a term of three years are:
Adam B. Goetzman is the Development Director and Zoning Administrator of Northeast Green Township Zoning District. Mr. Goetzman is responsible for zoning, code enforcement and development review services with county and/or state agencies. He performs comprehensive land use planning and promotes business development and retention. Mr. Goetzman brings the Board extensive knowledge of the building industry and business in the Bank’s market.
Patricia L. Walter is our Executive Vice President and was hired on July 6, 2016. For 11 years prior to joining the Bank, Ms. Walter served as the Controller and then the Senior Vice President of Finance for the former Cheviot Savings Bank. Ms. Walter began her career in 1997 working for six years
5

with Grant Thornton LLP as an auditor, and then for two years with Comair, Inc., a former subsidiary of Delta Air Lines, as the Manager of Corporate Accounting.
Directors Continuing in Office
The following directors have terms ending in 2022:
Steven C. Kehoe is a founding member of Kehoe Financial Services, LLC, a regional office of Kestra and a Registered Investment Advisor in Cincinnati, Ohio since 1982. Mr. Kehoe’s practice is an independent fee-based financial planning practice primarily focusing on small business planning, investments, retirement planning and estate planning. Mr. Kehoe is also a Registered Representative with Kestra and a licensed agent with many leading insurance companies. Mr. Kehoe brings the Board extensive financial experience and will serve as the Board’s audit committee financial expert.
Gary J. Koester is our President and Chief Executive Officer and has served in those capacities with EAGLE.bank since 1996. Mr. Koester began his career at EAGLE.bank in 1977 and has held various other positions during his time with the Bank. His experience at EAGLE.bank includes all facets of the Bank including lending, operations, and information technology.
The following directors have terms ending in 2023:
Guy W. Cagney is a local real estate agent with Coldwell Banker West Shell since 2012. Mr. Cagney is a licensed Real Estate Agent in Ohio, Indiana and Florida. He has built a 42 year successful real estate career and reputation mostly in residential real estate sales. He is a member of the Western Hills Lions Club, Elder High School Alumni Board and Cincinnati Area Board of Realtors Grievance Advisory Committee. Mr. Cagney offers the Board experience in marketing, community involvement and the real estate market in the Bank’s lending areas.
Steven J. Dulle is the founder and President of Dulle and Company, a Cincinnati based advertising and marketing firm, which he started in 1982. His experience includes a wide variety of clients in the technology, service, manufacturing, home building, health care, financial services and consumer products industries. Mr. Dulle offers the Board his experience in developing marketing strategies and branding campaigns for local, national and international clients.
Executive Officers Who Are Not Directors
Kevin R. Schramm is our Vice President, Chief Financial Officer and Treasurer. Mr. Schramm has served as Chief Financial Officer and Treasurer with EAGLE.bank since September 2006, and was named Vice President in 2017. Mr. Schramm began his career in 1986 with Cinco Federal Credit Union where he spent 17 years in various positions, including Operations Manager and Controller. Mr. Schramm’s experience also includes service as the Chief Financial Officer of the former Cottage Savings Bank.
W. Raymond McCleese is our Vice President of Commercial Lending since being hired in May2016. Prior to joining EAGLE.bank, he served two years as a Vice President of Commercial Lending for First Financial Bank, and for over four years as a Vice President and a part of senior management with the former Merchants Bank and Trust, heading up the Commercial and Industrial division. He has also served as a Federal SBSE Agent for the Internal Revenue Service, Chief Financial Officer of a mid-sized interior design firm, and as a staff accountant for a well-established local CPA firm.
6
Proposal 2 — Ratification of Independent Audit Firm
The Audit Committee of the Board of Directors has appointed BKD to be the Company’s independent audit firm for the year ending December 31, 2021, subject to ratification by shareholders.
If the ratification of the appointment of BKD is not approved by a majority of the votes cast by shareholders at the annual meeting, other independent audit firms may be considered by the Audit Committee of the Board of Directors.
Even if the selection of BKD is ratified, the Audit Committee, in its discretion, may direct the appointment of a different independent audit firm at any time during the year if it determines that such change is in the best interest of the Company and its shareholders.
The Board of Directors recommends a vote “FOR” the ratification of BKD, LLP as independent audit firm for the year ending December 31, 2021.
Submission of Business Proposals and Shareholder Nominations
The Company’s bylaws provide that, in order for a shareholder to make nominations for the election of directors or proposals for business to be brought before the annual meeting, a shareholder must deliver notice of such nominations and/or proposals to the Secretary not less than 110 days nor more than 120 days prior to the anniversary of the prior year’s annual meeting of stockholders; provided, however, that if the date of the annual meeting is advanced more than 30 days prior to the anniversary of the preceding year’s annual meeting, a stockholder’s written notice shall be timely only if delivered or mailed to and received by the Secretary of the Company no earlier than the day on which public disclosure of the date of such annual meeting is first made and no later than the tenth day following the day on which public disclosure of the date of such annual meeting is first made. The bylaws provide specific requirements for the contents of the notice regarding any such nomination or proposal.
Miscellaneous
The Company’s Annual Report to Shareholders has been included with this proxy statement. Any shareholder who has not received a copy of the Annual Report may obtain a copy by writing to the Corporate Secretary of the Company. The Annual Report is not to be treated as part of the proxy solicitation material or as having been incorporated by reference into this proxy statement.
Whether or not you plan to attend the annual meeting, please vote by marking, signing, dating and promptly returning the enclosed proxy card in the enclosed envelope.
BY ORDER OF THE BOARD OF DIRECTORS
Patricia L. Walter Corporate Secretary
Cincinnati, Ohio March 19, 2021
7

Message from Our Chief Executive Officer:
On behalf of Eagle Financial Bancorp, Inc. (the Company), and its wholly owned subsidiary, EAGLE.Bank (the Bank), I am pleased to present our 2020 annual financial report. The board of directors, officers and employees are optimistic regarding opportunities for our Company in the future. As previously announced, the Bank has received regulatory approval to change its name from Eagle Savings Bank to EAGLE.bank. We expect to transition to EAGLE.bank during the second quarter of 2021.
Financial highlights:
Net income available to common shareholders totaled $2.1 million for 2020 as compared to $658,000
for 2019, representing an increase of $1.4 million, or 216.7%. Earnings per share available to common shareholders totaled $1.43 per share for the year ended
December 31, 2020 compared to $0.43 per share for 2019. Total assets of the Company were $160.4 million at December 31, 2020, an increase of $17.7 million
from $142.8 million at December 31, 2019. Net loans receivable increased $12.8 million to $119.4 million at December 31, 2020, from $106.6
million at December 31, 2019. Deposits increased $16.4 million to $128.4 million at December 31, 2020, from $112.0 million at
December 31, 2019. Non-accrual loans decreased $116,000 to $737,000 at December 31, 2020, from $853,000 at December
31, 2019. Classified substandard assets increased $1.4 million to $2.8 million at December 31, 2020, from $1.4
million at December 31, 2019. The Bank’s Tier 1 leverage capital ratio, risked-based common equity Tier 1 capital ratio, Tier 1 capital
ratio and risk-based total capital ratios of 15.5%, 17.3%, 17.3% and 18.3%, respectively, at December 31, 2020 exceeded all regulatory requirements and categorize the Bank as well capitalized under applicable regulations.
Total assets were $160.4 million at December 31, 2020, an increase of $17.7 million, or 12.4%, over the $142.8 million at December 31, 2019. The increase was primarily due to an increase in loans, net of allowance for loan losses of $12.8 million and an increase in loans held for sale of $7.6 million, offset by a decrease in interest-bearing time deposits in other banks of $2.7 million. Net loans totaled $119.4 million at December 31, 2020, as compared to $106.6 million at December 31, 2019, an increase of $12.8 million or 12.0%. During the year ended December 31, 2020, we originated $210.6 million of loans, $167.2 million of which were one- to four-family residential real estate loans, and sold $147.4 million of loans in the secondary market. During the year ended December 31, 2020, one- to four-family residential real estate loans decreased $581,000, or 1.0%, to $59.3 million, multi-family loans increased $287,000, or 27.0%, to $1.4 million, commercial real estate loans and land loans increased $69,000, or 0.3%, to $20.9 million, construction loans decreased $1.0 million, or 8.7%, to $10.7 million, home equity and other consumer loans decreased $2.5 million, or 25.9% to $7.2 million, and commercial loans increased $19.7 million, or 332.2% to $25.6 million, of which $20.4 million was due to loans made under the Small Business Administration’s Payment Protection Program (or “PPP”) . Management continues to emphasize the origination of high quality loans for retention in the loan portfolio. Deposits increased by $16.4 million, or 14.7%, to $128.4 million at December 31, 2020 from $112.0 million at December 31, 2019. Our core deposits, which are all deposits other than certificates of deposit, increased $21.3 million, or 33.1%, to $85.7 million at December 31, 2020 from $64.4 million at December 31, 2019. Certificates of deposit decreased $4.9 million, or 10.2%, to $42.7 million at December 31, 2020 from $47.6 million at December 31, 2019. During the year ended December 31, 2020, management continued its strategy of pursuing growth in
8

demand accounts and other lower cost core deposits. Management intends to continue its efforts to increase core deposits, with a special emphasis on growth in consumer and business demand deposits. Shareholders’ equity increased $1.1 million, or 4.0%, to $29.0 million at December 31, 2020 from $27.9 million at December 31, 2019. The increase resulted from net income of $2.1 million during the year ended December 31, 2020, expense of $104,000 related to the ESOP shares committed to be released and expense of $246,000 related to stock-based compensation, offset by a repurchase of common stock of $1.1 million and dividends paid of $232,000. Our net income for the year ended December 31, 2020 was $2.1 million, compared to a net income of $658,000 for the year ended December 31, 2019, an increase of $1.4 million, or 216.7%. The increase in net income was due to an increase in non-interest income of $2.7 million, offset by an increase in provision for loan losses of $290,000, a decrease in net interest income of $182,000, and an increase in income taxes of $389,000 for the year ended December 31, 2020 as compared to the year ended December 31, 2019.
9
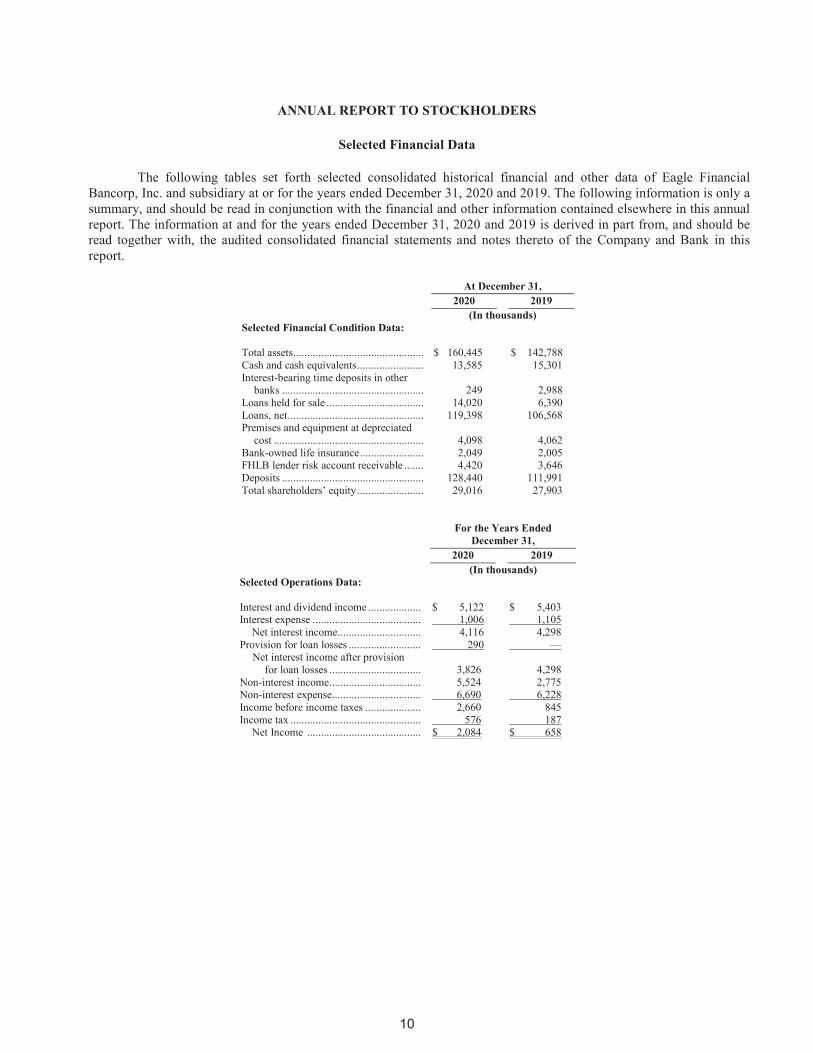
ANNUAL REPORT TO STOCKHOLDERS
Selected Financial Data
The following tables set forth selected consolidated historical financial and other data of Eagle Financial
Bancorp, Inc. and subsidiary at or for the years ended December 31, 2020 and 2019. The following information is only a summary, and should be read in conjunction with the financial and other information contained elsewhere in this annual report. The information at and for the years ended December 31, 2020 and 2019 is derived in part from, and should be read together with, the audited consolidated financial statements and notes thereto of the Company and Bank in this report.
At December 31, 2020 2019
(In thousands) Selected Financial Condition Data: Total assets ............................................... $ 160,445 $ 142,788 Cash and cash equivalents ........................ 13,585 15,301 Interest-bearing time deposits in other
banks ................................................... 249 2,988 Loans held for sale ................................... 14,020 6,390 Loans, net ................................................. 119,398 106,568 Premises and equipment at depreciated
cost ...................................................... 4,098 4,062 Bank-owned life insurance ....................... 2,049 2,005 FHLB lender risk account receivable ....... 4,420 3,646 Deposits ................................................... 128,440 111,991 Total shareholders’ equity ........................ 29,016 27,903
For the Years Ended December 31,
2020 2019 (In thousands) Selected Operations Data: Interest and dividend income ................... $ 5,122 $ 5,403 Interest expense ....................................... 1,006 1,105
Net interest income .............................. 4,116 4,298 Provision for loan losses .......................... 290 —
Net interest income after provision for loan losses ................................. 3,826 4,298
Non-interest income ................................. 5,524 2,775 Non-interest expense................................ 6,690 6,228 Income before income taxes .................... 2,660 845 Income tax ............................................... 576 187
Net Income ......................................... $ 2,084 $ 658
10

At or For the Years Ended December 31,
2020 2019 Selected Financial Ratios and Other Data: Performance Ratios: Return on average assets ............................................................ 1.36% 0.47% Return on average equity ............................................................ 7.39% 2.36% Interest rate spread (1) ................................................................ 2.98% 3.26% Net interest margin (2) ............................................................... 3.09% 3.44% Efficiency ratio (3) ..................................................................... 69.40% 88.05% Non-interest expense to average total assets .............................. 4.16% 4.46% Average interest-earning assets to average
interest-bearing liabilities....................................................... 115.68% 121.38% Average equity to average total assets ........................................ 18.47% 19.98% Asset Quality Ratios: Non-performing assets to total assets ......................................... 0.65% 0.80% Non-performing loans to total loans ........................................... 0.79% 1.00% Non-performing assets excluding accruing troubled debt
restructurings to total assets ................................................... 0.48% 0.60% Non-performing loans excluding accruing troubled debt
restructurings to total loans .................................................... 0.57% 0.74% Allowance for loan losses to non-performing loans ................... 136.69% 101.83% Allowance for loan losses to total loans ..................................... 1.08% 1.02% Capital Ratios: Total capital (to risk-weighted assets) ........................................ 18.3% 17.2% Common equity Tier 1 capital (to risk-weighted assets) 17.3% 16.3% Tier 1 capital (to risk-weighted assets) ....................................... 17.3% 16.3% Tier 1 capital (to average assets) ................................................ 15.5% 15.4% Other Data: Number of full service offices .................................................... 3 3
(1) Represents the difference between the weighted-average yield on interest-earning assets and the weighted-average cost of interest-bearing liabilities for the year.
(2) The net interest margin represents net interest income as a percent of average interest-earning assets for the year. (3) The efficiency ratio represents non-interest expense divided by the sum of net interest income and non-interest
income.
Management’s Discussion and Analysis of Financial Condition and Results of Operations
This discussion is intended to help investors understand the financial performance of the Company through a discussion of the factors affecting our financial condition at December 31, 2020 and 2019 and our results of operations for the years ended December 31, 2020 and 2019. This information should be read in conjunction with the consolidated financial statements and notes to the consolidated financial statements that appear in this annual report.
Name Change
The Board of Directors has received regulatory approval to change the Bank’s legal name from Eagle Savings Bank to EAGLE.bank effective December 28, 2020. Later this year, the Company plans to register as a bank holding company with the Federal Reserve Bank of Cincinnati in connection with EAGLE.bank’s acceptance of the universal bank charter as provided for under Ohio law.
Cautionary Note Regarding Forward-Looking Statements
This quarterly report contains forward-looking statements, which can be identified by the use of words such as “estimate,” “project,” “believe,” “intend,” “anticipate,” “assume,” “plan,” “seek,” “expect,” “will,” “may,”
11

“should,” “indicate,” “would,” “contemplate,” “continue,” “target” and words of similar meaning. These forward-looking statements include, but are not limited to:
These forward-looking statements are based on our current beliefs and expectations and are inherently
subject to significant business, economic and competitive uncertainties and contingencies, many of which are beyond our control. In addition, these forward-looking statements are subject to assumptions with respect to future business strategies and decisions that are subject to change. We are under no duty to and do not take any obligation to update any forward-looking statements after the date of this report.
The following factors, among others, could cause actual results to differ materially from the anticipated results or other expectations expressed in the forward-looking statements:
· our ability to continue to manage our operations successfully;
· effect of the coronavirus disease 2019 (COVID-19) pandemic on our Company, the communities where we have our branches, the state of Ohio and the United States, related to the economy and overall financial stability, which may also exacerbate the effects of the other factors listed herein;
· our ability to successfully implement our business plan of managed growth, diversifying our loan portfolio and increasing mortgage banking operations to improve profitability;
· our success in increasing our commercial business, commercial real estate, construction and home equity lending;
· adverse changes in the financial industry, securities, credit and national local real estate markets (including real estate values);
· significant increases in our loan losses, including as a result of our inability to resolve classified and non-performing assets or reduce risks associated with our loans, and management’s assumptions in determining the adequacy of the allowance for loan losses;
· credit risks of lending activities, including changes in the level and trend of loan delinquencies and write-offs and in our allowance for loan losses and provision for loan losses;
· the use of estimates in determining fair value of certain of our assets, which may prove to be incorrect and result in significant declines in valuations;
· competition among depository and other financial institutions;
· our ability to attract and maintain deposits and our success in introducing new financial products;
· our ability to maintain our asset quality even as we intend to increase our commercial real estate and multi-family and commercial business lending;
· changes in interest rates generally, including changes in the relative differences between short term and long term interest rates and in deposit interest rates, that may affect our net interest margin and funding sources;
· fluctuations in the demand for loans, which may be affected by the number of unsold homes, land and other properties in our market areas and by declines in the value of real estate in our market area;
· changes in consumer spending, borrowing and saving habits;
· declines in the yield on our assets resulting from the current low interest rate environment;
· risks related to a high concentration of loans secured by real estate located in our market area;
· the results of examinations by our regulators, including the possibility that our regulators may, among other things, require us to increase our allowance for loan losses, write down assets, change our regulatory capital
12
position, limit our ability to borrow funds or maintain or increase deposits, or prohibit us from paying dividends, which could adversely affect our dividends and earnings;
· changes in the level of government support of housing finance;
· our ability to enter new markets successfully and capitalize on growth opportunities;
· changes in laws or government regulations or policies affecting financial institutions, including the Dodd-Frank Act and the JOBS Act, which could result in, among other things, increased deposit insurance premiums and assessments, capital requirements, regulatory fees and compliance costs, particularly the new capital regulations, and the resources we have available to address such changes;
· changes in accounting policies and practices, as may be adopted by the bank regulatory agencies, the Financial Accounting Standards Board, the Securities and Exchange Commission and the Public Company Accounting Oversight Board;
· changes in our compensation and benefit plans, and our ability to retain key members of our senior management team and to address staffing needs in response to product demand or to implement our strategic plans;
· loan delinquencies and changes in the underlying cash flows of our borrowers;
· our ability to control costs and expenses, particularly those associated with operating as a publicly traded company;
· the failure or security breaches of computer systems on which we depend;
· the ability of key third-party service providers to perform their obligations to us;
· changes in the financial condition or future prospects of issuers of securities that we own; and
· other economic, competitive, governmental, regulatory and operational factors affecting our operations, pricing, products and services described elsewhere in our SEC filings.
Given its ongoing and dynamic nature, it is difficult to predict the full impact of the COVID-19 outbreak on
our business. The extent of such impact will depend on future developments, which are highly uncertain, including when the coronavirus that has caused the COVID-19 pandemic can be controlled and abated and when and how the economy may be reopened. As the result of the COVID-19 pandemic and the related adverse local and national economic consequences, our forward-looking statements are subject to the following additional risks, uncertainties and assumptions: · demand for our products and services may decline;
· if the economy is unable to substantially reopen, and high levels of unemployment continue for an extended period of time, loan delinquencies, problem assets, and foreclosures may increase;
· collateral for loans, especially real estate, may decline in value;
· our allowance for loan losses may have to be increased if borrowers experience financial difficulties;
· the net worth and liquidity of loan guarantors may decline;
· as the result of the decline in the Federal Reserve Board’s target federal funds rate to near 0%, the yield on our assets may decline to a greater extent than the decline in our cost of interest-bearing liabilities;
· a material decrease in net income or a net loss over several quarters could result in a decrease in the rate of our quarterly cash dividend;
13

· actions taken by the federal, state or local governments to cushion the impact of COVID-19 on consumers and businesses may have a negative impact on us and our business;
· our cyber security risks are increased as the result of an increase in the number of employees working remotely; and
· FDIC premiums may increase if the agency experiences additional resolution costs.
Because of these and a wide variety of other uncertainties, our actual future results may be materially different from the results indicated by these forward-looking statements.
Coronavirus Disease 2019 (COVID-19) Impact
The following is a description of the impact the coronavirus disease 2019 (COVID-19) pandemic is having on our financial condition and the results of operations and certain risks to our business that the pandemic creates or exacerbates.
Loan Modifications
The Coronavirus Aid, Relief, and Economic Security (CARES) Act was passed by Congress and signed into law by the President on March 27, 2020. The CARES Act provides financial institutions the option of temporarily not accounting for eligible loans as troubled debt restructurings in accordance with GAAP. In addition, Interagency Statements were issued on March 22, 2020 and April 7, 2020 by bank regulatory agencies to encourage financial institutions to work prudently with borrowers. The agencies confirmed with the FASB that loans that were not more than 30 days past due as of December 31, 2019 and receive short-term modifications of six months or less, are not considered to be delinquent or troubled debt restructurings and are not reported as nonaccrual.
We began receiving requests from borrowers for loan deferrals in March 2020. Modifications include the deferral of principal and interest for generally 90 days. Requests were evaluated individually and approved modifications were based on the unique circumstances of each borrower. We are committed to working with our clients to allow time to work through the challenges of this pandemic. The Company will be using the provisions of the CARES Act and the Interagency Statements to account for the loans receiving forbearance, which means the loans will remain on accrual status unless the borrower is unable to satisfy the terms of the loans once the forbearance period ends. At this time, it is uncertain what future impact loan modifications related to COVID-19 difficulties will have on our financial condition, results of operations and reserve for loan losses. The following table shows CARES Act related loan modifications outstanding at December 31, 2020. Of these modifications, all were performing in accordance with their modified terms. Details with respect to actual modifications are as follows:
Weighted Average
(Dollars in thousands)
Types of Loans Number of
Loans Balance Interest Rate Commercial real estate and land loans 1 $1,732 5.73% Commercial loans 2 1,148 5.65%
Total 3 $2,880 5.70% Paycheck Protection Program (PPP)
As part of the CARES Act, the Small Business Administration (SBA) has been authorized to guarantee loans under the PPP through June 30, 2020 for small businesses who meet the necessary eligibility requirements in order to keep their workers on the payroll. As of December 31, 2020, we have received approximately 84 applications for up to $22.3 million of loans under the PPP. At December 31, 2020 we have received forgiveness for 20 loans totaling $2.0 million, and have $20.4 million in PPP loans remaining in portfolio.
14

Financial Position and Results of Operations
Our December 31, 2020 financial condition and results of operations reflect a slightly negative impact on our allowance for loan losses as a result of COVID-19. See discussions in “Allowance for Loan Losses” below. While we have not yet experienced any charge-offs related to COVID-19, our allowance for loan losses calculation and resulting provision for credit losses were impacted by changes in forecasted economic conditions. Given that forecasted economic scenarios have been negatively impacted since the pandemic was declared in early March, our need for additional reserve for credit loss increased. Should economic conditions worsen, we could experience further increases in our required allowance for loan losses and record additional credit loss expense. The execution of the payment deferrals discussed above under “Loan Modifications” assisted our ratio of past due loans to total loans. It is possible that our asset quality measures could worsen at future measurement periods if the effects of COVID-19 are prolonged.
Our fee income could be reduced due to COVID-19. At this time, we do not anticipate a material impact on our fee income.
Our interest income could be reduced due to COVID-19. In keeping with guidance from regulators, we are actively working with COVID-19 affected borrowers to defer their payments, interest, and fees. While interest and fees will still accrue to income, through normal GAAP accounting, should eventual credit losses on these deferred payments emerge, interest income and fees accrued would need to be reversed. In such a scenario, interest income in future periods could be negatively impacted. At this time, we are unable to project the materiality of such an impact but recognize the breadth of the economic impact may affect our borrowers’ ability to repay in future periods. Capital and Liquidity
As of December 31, 2020, all of our capital ratios were in excess of all regulatory requirements. While we believe that we have sufficient capital to withstand an extended economic recession brought about by COVID-19, our reported and regulatory capital ratios could be adversely impacted by further credit losses.
We maintain access to multiple sources of liquidity. Wholesale funding markets have remained open to us, but rates for short term funding have recently been volatile. If funding costs are elevated for an extended period of time, it could have an adverse effect on our net interest margin. If an extended recession caused large numbers of our deposit customers to withdraw their funds, we might become more reliant on volatile or more expensive sources of funding.
The ability to pay dividends or conduct stock repurchases is limited under applicable banking regulations and regulatory policies, including for any losses for the relevant period, expected losses for future periods and/or the inability to upstream funds from a financial institution to its holding company as a result of lower income or regulatory capital levels. We may consider, or be required to, suspend stock repurchase activities, or may suspend, or reduce the level of dividends we pay. Asset valuation
Currently, we do not expect COVID-19 to affect our ability to account timely for the assets on our balance sheet; however, this could change in future periods. While certain valuation assumptions and judgments will change to account for pandemic-related circumstances such as widening credit spreads, we do not anticipate significant changes in methodology used to determine the fair value of assets measured in accordance with GAAP. As of December 31, 2020 we did not have any impairment with respect to our intangible assets, premises and equipment or other long-lived assets. Retail Operations
With the health and safety of our customers and staff in mind, and consistent with recommendations from the CDC and State and Local governments concerning COVID-19, all banking offices, with the exception of the Edwards Road location began operating as drive-up only facilities on March 17, 2020. The lobby of the Bridgetown Road location remained open by appointment only. Most banking transactions continue through the drive-ups,
15

including opening new deposit accounts. Online and mobile banking is available for customers to check their balance, transfer funds, and pay bills. Checks can be deposited using mobile banking. Our network of over 30,000 ATMs are available for cash withdrawals with no service charge. Although our lobbies are closed, we are still open, operating and serving our customers with uninterrupted access to their account information and the ability to complete banking transactions. Comparison of Financial Condition at December 31, 2020 and December 31, 2019
Total Assets. Total assets were $160.4 million at December 31, 2020, an increase of $17.7 million, or 12.4%, over the $142.8 million at December 31, 2019. The increase was primarily due to an increase in loans, net of allowance for loan losses of $12.8 million and an increase in loans held for sale of $7.6 million, offset by a decrease in interest-bearing time deposits in other banks of $2.7 million.
Net Loans. Net loans totaled $119.4 million at December 31, 2020, as compared to $106.6 million at December 31, 2019, an increase of $12.8 million or 12.0%. During the year ended December 31, 2020, we originated $210.6 million of loans, $167.2 million of which were one- to four-family residential real estate loans, and sold $147.4 million of loans in the secondary market. During the year ended December 31, 2020, one- to four-family residential real estate loans decreased $581,000, or 1.0%, to $59.3 million, multi-family loans increased $287,000, or 27.0%, to $1.4 million, commercial real estate loans and land loans increased $69,000, or 0.3%, to $20.9 million, construction loans decreased $1.0 million, or 8.7%, to $10.7 million, home equity and other consumer loans decreased $2.5 million, or 25.9% to $7.2 million, and commercial loans increased $19.7 million, or 332.2% to $25.6 million, of which $20.4 million was due to loans made under the Small Business Administration’s Payment Protection Program (or “PPP”) . Management continues to emphasize the origination of high quality loans for retention in the loan portfolio.
The following table sets forth the composition of our loan portfolio, by type of loan at the dates indicated.
At December 31, 2020 2019 Amount Percent Amount Percent (Dollars in thousands) One- to four-family residential:
Owner occupied................................... $ 59,278 46.07% $ 59,859 52.26% Non-owner occupied ........................... 3,740 2.91 5,522 4.82
Commercial real estate and land .............. 20,869 16.22 20,800 18.16 Home equity and other consumer (1) ....... 7,177 5.58 9,690 8.46 Residential construction .......................... 10,667 8.29 11,684 10.20 Multi-family real estate ............................ 1,352 1.05 1,065 0.93 SBA PPP 20,393 15.84 — — Commercial ............................................. 5,198 4.04 5,921 5.17 Total gross loans receivable ..................... 128,674 100.00% 114,541 100.00% Deferred loan (fees) costs ........................ (234) 4 Loans in process ...................................... (7,656) (6,811) Allowance for loan losses ........................ (1,386) (1,166) Total loans receivable, net ....................... $ 119,398 $ 106,568 (1) At December 31, 2020 and 2019, other consumer loans totaled $10,000 and $8,000, respectively.
We primarily sell one- to four-family residential loans on a servicing released basis. We sell loans in transactions with the FHLB-Cincinnati, through its mortgage purchase program, and to other investors. We sold $147.4 million of loans in fiscal 2020. Loans serviced for these investors were $1.3 million at December 31, 2020. Management intends to continue this sales activity in future periods.
Interest-Bearing Deposits in Other Banks. The Bank’s investment in certificates of deposit in other banks decreased by $2.7 million, or 91.7%, to a total of $249,000 at December 31, 2020, compared to $3.0 million at December 31, 2019.
16

Federal Home Loan Bank Stock. We hold common stock of the FHLB-Cincinnati in connection with our FHLB borrowing activities totaling (at cost) $1.3 million and $816,000 at December 31, 2020 and 2019. The FHLB-Cincinnati common stock is carried at cost and classified as restricted equity securities. We may be required to purchase additional FHLB-Cincinnati stock if we increase our FHLB-Cincinnati advances in the future.
Foreclosed Real Estate Held for Sale, Net. Foreclosed assets increased to $34,000, at December 31, 2020, from none at December 31, 2019, due to the foreclosure of a owner-occupied one-to four-family residential property.
Deposits. Deposits increased by $16.4 million, or 14.7%, to $128.4 million at December 31, 2020 from $112.0 million at December 31, 2019. Our core deposits, which are all deposits other than certificates of deposit, increased $21.3 million, or 33.1%, to $85.7 million at December 31, 2020 from $64.4 million at December 31, 2019. Certificates of deposit decreased $4.9 million, or 10.2%, to $42.7 million at December 31, 2020 from $47.6 million at December 31, 2019. During the year ended December 31, 2020, management continued its strategy of pursuing growth in demand accounts and other lower cost core deposits. Management intends to continue its efforts to increase core deposits, with a special emphasis on growth in consumer and business demand deposits.
The following table sets forth the distribution of our average total deposit accounts, by account type, for the years indicated.
For the Years Ended December 31, 2020 2019
Average Balance Percent
Weighted Average
Rate Average Balance Percent
Weighted Average
Rate (Dollars in thousands) Non-interest-bearing checking ........ $ 5,882 4.92% ---% $ 5,474 5.06% ---% Interest-bearing checking ................ 24,189 20.23 0.18 19,632 18.13 .17 Savings ........................................... 19,738 16.51 0.14 16,623 15.35 .14 Money market demand ................... 24,322 20.34 0.50 18,559 17.14 .49 Certificates of deposit ..................... 45,431 38.00 1.78 47,984 44.32 1.99
Total deposits ............................. $ 119,562 100.00% 0.88% $ 108,272 100.00% 1.07 %
Federal Home Loan Bank Advances. The Bank had no advances from the Federal Home Loan Bank at December, 31 2020 and 2019. At December 31, 2020 and 2019 the Bank had an unused line of credit with the Federal Home Loan Bank of $25.0 million and $10.0 million, respectively.
Our Federal Home Loan Bank advances may be made pursuant to several different credit programs, each of which has its own interest rate and range of maturities. To the extent such borrowings have different terms to reprice than our deposits, they can change our interest rate risk profile. See Note 8 to the Financial Statements for additional information on the maturity of our FHLB-Cincinnati advances. At December 31, 2020, we had no outstanding advances from the FHLB-Cincinnati. At December 31, 2020, based on available collateral, our ownership of FHLB stock, and based upon our internal policy, we had access to additional FHLB-Cincinnati advances of up to $47.3 million.
Shareholders’ Equity. Total shareholders’ equity increased $1.1 million, or 4.0%, to $29.0 million at December 31, 2020 from $27.9 million at December 31, 2019. The increase resulted from net income of $2.1 million during the year ended December 31, 2020, expense of $104,000 related to the ESOP shares committed to be released and expense of $246,000 related to stock-based compensation, offset by a repurchase of common stock of $1.1 million and dividends paid of $232,000.
17
Comparison of Operating Results for the Years Ended December 31, 2020 and December 31, 2019
General. Our net income for the year ended December 31, 2020 was $2.1 million, compared to a net income of $658,000 for the year ended December 31, 2019, an increase of $1.4 million, or 216.7%. The increase in net income was due to an increase in non-interest income of $2.7 million, offset by an increase in provision for loan losses of $290,000, a decrease in net interest income of $182,000, and an increase in income taxes of $389,000 for the year ended December 31, 2020 as compared to the year ended December 31, 2019.
Interest Income. Interest income decreased $281,000, or 5.2%, to $5.1 million for the year ended December 31, 2020 from $5.4 million for the year ended December 31, 2019. This decrease was attributable to a $83,000 decrease in interest income on loans receivable, a decrease on FHLB stock dividends of $25,000, and a decrease in interest income on other interest-earning deposits of $173,000. The average balance of loans for the year ended December 31, 2020 increased by $7.9 million, or 7.1%, from the average balance for the year ended December 31, 2019, but the average yield on loans decreased by 38 basis points to 4.25% for the year ended December 31, 2020 from 4.63% for the year ended December 31, 2019. This decrease was largely due to the effect of issuing $22.3 million in loans under the PPP at reduced interest rates. The average balance of interest earning deposits increased $493,000, however, the average yield on those deposits decreased by 138 basis points to 0.68% for the year ended December 31, 2020 from 2.06% for the year ended December 31, 2019.
Interest Expense. Total interest expense decreased $99,000, or 9.0%, to $1.0 million for the year ended December 31, 2020 from $1.1 million for the year ended December 31, 2019. Interest expense on deposit accounts decreased $103,000, or 9.3%, to $1.0 million for the year ended December 31, 2020 from $1.1 million for the year ended December 31, 2019. The average balance of deposits during the year ended December 31, 2020 increased by $10.9 million, or 10.6% from the average balance for the year ended December 31, 2019, while the average cost of deposits decreased by 19 basis points to 0.88% for the year ended December 31, 2020 from 1.07% for the year ended December 31, 2019, respectively.
Interest expense on FHLB advances increased $4,000, or 400.0%, to $4,000 for the year ended December 31, 2020. The average balance of FHLB advances during the year ended December 31, 2020 increased by $1.4 million from the average balance for the year ended December 31, 2019, and the average cost of FHLB advances was 0.28% and 2.58% for the years ended December 31, 2020 and 2019.
Net Interest Income. Net interest income decreased $182,000, or 4.2, to $4.1 million for the year ended December 31, 2020, compared to $4.3 million for the year ended December 31, 2019. The decrease reflected a decrease in total interest and dividend income of $281,000, and a decrease in total interest expense of $99,000. Our net interest margin decreased to 3.09% for the year ended December 31, 2020 from 3.44% for the year ended December 31, 2019. Our net interest rate spread decreased to 2.98% for the year ended December 31, 2020 from 3.26% for the year ended December 31, 2019. The interest rate spread and net interest margin were impacted by declining interest rates in the year ended December 31, 2020.
Provision for Loan Losses. Based on our analysis of the factors described in “Critical Accounting Policies—Allowance for Loan Losses,” we recorded a $290,000 provision for loan losses for the year ended December 31, 2020, as compared to $0 for the year ended December 31, 2019. The allowance for loan losses was $1.4 million, or 1.08% of total loans, at December 31, 2020, compared to $1.2 million, or 1.02% of total loans, at December 31, 2019. Total nonperforming loans were $1.0 million at December 31, 2020, compared to $1.1 million at December 31, 2019. Classified loans increased to $2.8 million at December 31, 2020, compared to $1.4 million at December 31, 2019. Total loans past due 30 days or more were $2.4 million and $952,000 at December 31, 2020 and December 31, 2019, respectively. Net charge-offs totaled $70,000 for the year ended December 31, 2020, compared to $21,000 of net loan charge-off for the year ended December 31, 2019. The allowance for loan losses reflects the estimate we believe to be appropriate to cover incurred probable losses which were inherent in the loan portfolio at December 31, 2020 and 2019. While we believe the estimates and assumptions used in our determination of the adequacy of the allowance are reasonable, such estimates and assumptions could be proven incorrect in the future, and the actual amount of future provisions may exceed the amount of past provisions, and the increase in future provisions that may be required may adversely impact our financial condition and results of operations. In addition, bank regulatory agencies periodically review our allowance for loan losses and may require
18
an increase in the provision for possible loan losses or the recognition of further loan charge-offs, based on judgments different than those of management.
Non-Interest Income. Non-interest income increased $2.7 million, or 99.1%, to $5.5 million for the year ended December 31, 2020 from $2.8 million for the year ended December 31, 2019. The increase was primarily due to an increase in the net gain on sale of loans of $2.6 million, and a $173,000 increase in other service charges and fees during the year ended December 31, 2020 as compared to the year ended December 31, 2019.
Non-Interest Expense. Non-interest expense increased $462,000, or 7.4%, to $6.7 million for the year ended December 31, 2020, compared to $6.2 million for the year ended December 31, 2019. The increase was primarily the result of an increase in compensation and employee benefits of $478,000, offset by a $35,000 decrease in other operating expenses.
Federal Income Taxes. Federal income taxes increased by $389,000 to an income tax expense of $576,000 for the year ended December 31, 2020, compared to an income tax expense of $187,000 for the year ended December 31, 2019. The increase in income tax expense for the year ended December 31, 2020 was a direct result of the increase in gain on loans sales, and the resulting increase in net income.
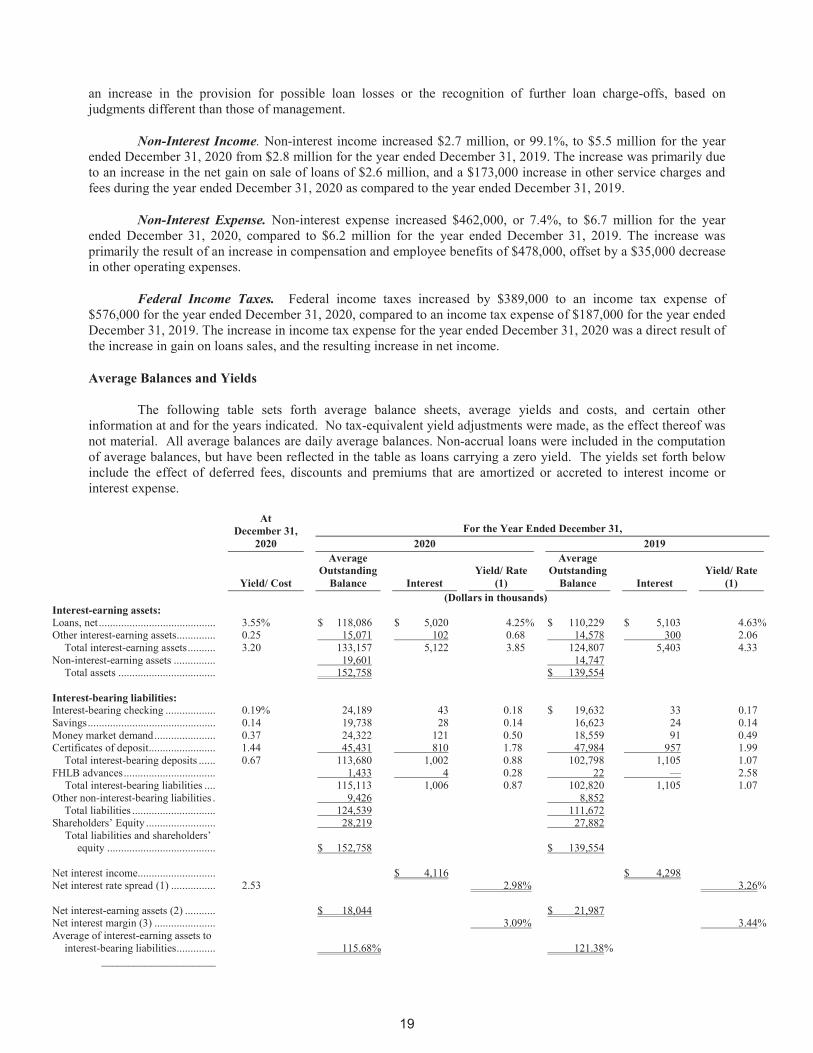
Average Balances and Yields
The following table sets forth average balance sheets, average yields and costs, and certain other information at and for the years indicated. No tax-equivalent yield adjustments were made, as the effect thereof was not material. All average balances are daily average balances. Non-accrual loans were included in the computation of average balances, but have been reflected in the table as loans carrying a zero yield. The yields set forth below include the effect of deferred fees, discounts and premiums that are amortized or accreted to interest income or interest expense.
At December 31,
2020 For the Year Ended December 31,
2020 2019
Yield/ Cost
Average Outstanding
Balance Interest Yield/ Rate
(1)
Average Outstanding
Balance Interest Yield/ Rate
(1) (Dollars in thousands) Interest-earning assets: Loans, net .......................................... 3.55% $ 118,086 $ 5,020 4.25% $ 110,229 $ 5,103 4.63% Other interest-earning assets .............. 0.25 15,071 102 0.68 14,578 300 2.06
Total interest-earning assets .......... 3.20 133,157 5,122 3.85 124,807 5,403 4.33 Non-interest-earning assets ............... 19,601 14,747
Total assets ................................... 152,758 $ 139,554 Interest-bearing liabilities: Interest-bearing checking .................. 0.19% 24,189 43 0.18 $ 19,632 33 0.17 Savings .............................................. 0.14 19,738 28 0.14 16,623 24 0.14 Money market demand ...................... 0.37 24,322 121 0.50 18,559 91 0.49 Certificates of deposit ........................ 1.44 45,431 810 1.78 47,984 957 1.99
Total interest-bearing deposits ...... 0.67 113,680 1,002 0.88 102,798 1,105 1.07 FHLB advances ................................. 1,433 4 0.28 22 — 2.58
Total interest-bearing liabilities .... 115,113 1,006 0.87 102,820 1,105 1.07 Other non-interest-bearing liabilities . 9,426 8,852
Total liabilities .............................. 124,539 111,672 Shareholders’ Equity ......................... 28,219 27,882
Total liabilities and shareholders’ equity .......................................
$ 152,758 $ 139,554
Net interest income ............................ $ 4,116 $ 4,298 Net interest rate spread (1) ................ 2.53 2.98% 3.26%
Net interest-earning assets (2) ........... $ 18,044 $ 21,987
Net interest margin (3) ...................... 3.09% 3.44% Average of interest-earning assets to
interest-bearing liabilities ..............
115.68% 121.38% _____________________
19

(1) Interest rate spread represents the difference between the yield on average interest-earning assets and the cost of average interest-bearing liabilities.
(2) Net interest-earning assets represents total interest-earning assets less total interest-bearing liabilities. (3) Net interest margin represents net interest income divided by total interest-earning assets.
Management of Market Risk
General. A significant form of market risk is interest rate risk because, as a financial institution, the majority of our assets and liabilities are sensitive to changes in interest rates. Therefore, a principal part of our operations is to manage interest rate risk and limit the exposure of our financial condition and results of operations to changes in market interest rates. Our Asset-Liability Committee is responsible for evaluating the interest rate risk inherent in our assets and liabilities, for determining the level of risk that is appropriate, given our business strategy, operating environment, capital, liquidity and performance objectives, and for managing this risk consistent with the policy and guidelines approved by our board of directors.
Our asset/liability management strategy attempts to manage the impact of changes in interest rates on net interest income, our primary source of earnings. Among the techniques we use to manage interest rate risk are:
originating commercial real estate and multi-family, commercial business and construction loans, and home equity loans and lines of credit, all of which tend to have shorter terms to maturity or repricing and higher interest rates than one- to four-family residential real estate loans, and can generate non-interest-bearing checking accounts;
selling substantially all of our newly-originated longer-term fixed-rate one- to four-family residential real estate loans and retaining the shorter-term fixed- and adjustable-rate one- to four-family residential real estate loans that we originate, subject to market conditions and periodic review of our asset/liability management needs; and
increasing core deposits, including checking accounts, money market accounts and savings accounts, which are less interest rate sensitive than certificates of deposit.
Our board of directors is responsible for the review and oversight of our Asset/Liability Committee, which is comprised of our executive management team and other essential operational staff. This committee is charged with developing and implementing an asset/liability management plan, and meets at least monthly to review pricing and liquidity needs and assess our interest rate risk. We look at two types of simulations impacted by changes in interest rates, which are net portfolio value analysis and net interest income analysis.
Net Portfolio Value. We compute amounts by which the net present value of our cash flow from assets, liabilities and off-balance sheet items (net portfolio value or “NPV”) would change in the event of a range of assumed changes in market interest rates. We measure our interest rate risk and potential change in our NPV through the use of an internal financial model integrated with our core service provider. This model uses a discounted cash flow analysis and an option-based pricing approach to measure the interest rate sensitivity of net portfolio value. Historically, the model estimated the economic value of each type of asset, liability and off-balance sheet contract under the assumption that the United States Treasury yield curve increases or decreases instantaneously by 100 to 300 basis points in 100 basis point increments. However, given the current low level of market interest rates, an NPV calculation for an interest rate decrease of greater than 100 basis points has not been prepared. A basis point equals one-hundredth of one percent, and 100 basis points equals one percent. An increase in interest rates from 3% to 4% would mean, for example, a 100 basis point increase in the “Change in Interest Rates” column below.
20

The table below sets forth, as of December 31, 2020, the calculation of the estimated changes in our net portfolio value that would result from the specified immediate changes in interest rates.
Change in Interest Rates (basis points) (1)
Estimated NPV (2)
Estimated Increase (Decrease) in NPV
NPV as a Percentage of Present Value of Assets (3)
NPV Ratio (4)
Increase (Decrease)
(basis points) Amount Percent (Dollars in thousands)
+300 $37,372 $(4,951) (11.70)% 23.58% (241) +200 38,783 (3,540) (8.36)% 24.27% (172) +100 40,392 (1,931) (4.56)% 25.06% (93)
— 42,323 — — 25.99% — -100 37,592 (4,731) (11.18)% 23.00% (299)
(1) Assumes an immediate uniform change in interest rates at all maturities. (2) NPV is the discounted present value of expected cash flows from assets, liabilities and off-balance sheet contracts. (3) Present value of assets represents the discounted present value of incoming cash flows on interest-earning assets. (4) NPV Ratio represents NPV divided by the present value of assets.
The table above indicates that at December 31, 2020, in the event of an instantaneous parallel 100 basis
point decrease in interest rates, we would experience a 11.2% decrease in net portfolio value. In the event of an instantaneous 100 basis point increase in interest rates, we would experience a 4.56% decrease in net portfolio value. The net portfolio value as calculated in our model decreases in both rising and falling interest rate environments. The value of assets move inversely to interest rates while the value of liabilities move directly with interest rates. In a rising interest rate environment, the economic value of assets would decrease while liabilities would increase. In a falling interest rate environment, the increase in economic value for deposits (i.e., the value of our liabilities) would exceed that of loans. Due to the historically low current interest rate environment, the discount rate applied to the deposits drive the economic value higher while cash flows are stable.
Net Interest Income Analysis. We analyze our sensitivity to changes in interest rates through our net interest income simulation model. Net interest income is the difference between the interest income we earn on our interest-earning assets, such as loans and securities, and the interest we pay on our interest-bearing liabilities, such as deposits and borrowings. We estimate what our net interest income would be for a one-year period based on current interest rates. We then calculate what the net interest income would be for the same period under different interest rate assumptions. The following table shows the estimated impact on net interest income for the one-year period beginning December 31, 2020 resulting from potential changes in interest rates, expressed in basis points. These estimates require certain assumptions to be made, including loan and mortgage-related investment prepayment speeds, reinvestment rates, and deposit maturities and decay rates. These assumptions are inherently uncertain. As a result, no simulation model can precisely predict the impact of changes in interest rates on our net interest income.
Although the net interest income table below provides an indication of our interest rate risk exposure at a particular point in time, such estimates are not intended to, and do not, provide a precise forecast of the effect of changes in market interest rates on our net interest income and will differ from actual results.
Rate Shift (1) Net Interest Income
Year 1 Forecast Year 1 Change
from Level (Dollars in thousands)
+400 $2,746 (36.78)% +300 3,145 (27.61)% +200 3,534 (18.64)% +100 3,928 (9.57)% Level 4,344 ------ -100 4,271 (1.69)%
____________________ (1) The calculated changes assume an immediate shock of the static yield curve.
21

Depending on the relationship between long- and short-term interest rates, market conditions and consumer preference, we may place greater emphasis on maximizing our net interest margin than on strictly matching the interest rate sensitivity of our assets and liabilities. We believe that the increased net income which may result from an acceptable mismatch in the actual maturity or re-pricing of our assets and liabilities can, during periods of declining or stable interest rates, provide sufficient returns to justify an increased exposure to sudden and unexpected increases in interest rates.
We do not engage in hedging activities, such as engaging in futures, options or swap transactions, or investing in high-risk mortgage derivatives, such as collateralized mortgage obligation residual interests, real estate mortgage investment conduit residual interests or stripped mortgage backed securities.
Liquidity and Capital Resources
Liquidity describes our ability to meet the financial obligations that arise in the ordinary course of business. Liquidity is primarily needed to meet the borrowing and deposit withdrawal requirements of our customers and to fund current and planned expenditures. Our primary sources of funds are deposits, principal and interest payments on loans and proceeds from the sale of loans. We also have the ability to borrow from the FHLB-Cincinnati. At December 31, 2020, we had the capacity to borrow approximately $47.3 million from the FHLB-Cincinnati. At December 31, 2020, we had no outstanding advances from the FHLB-Cincinnati.
While maturities and scheduled amortization of loans are predictable sources of funds, deposit flows and loan prepayments are greatly influenced by general interest rates, economic conditions, and competition. Our most liquid assets are cash and short-term investments including interest-bearing demand deposits. The levels of these assets are dependent on our operating, financing, lending, and investing activities during any given period.
Our cash flows are comprised of three primary classifications: cash flows from operating activities, investing activities, and financing activities. Net cash used in operating activities was $6.0 million for the year ended December 31, 2020, while net cash provided by operating activities was $4.2 million for the year ended December 31, 2019, respectively. Net cash used in investing activities, which consists primarily of disbursements for loan originations, offset by principal collections on loans, was $10.9 million for the year ended December 31, 2020, while the net cash provided by investing activities was $7.4 million for the year ended December 31, 2019, respectively. Net cash provided by financing activities, consisting primarily of a net increase in deposits was $15.1 million and $4.7 million for the years ended December 31, 2020 and 2019, respectively.
We are committed to maintaining a strong liquidity position. We monitor our liquidity position on a daily basis. We anticipate that we will have sufficient funds to meet our current funding commitments. Based on our deposit retention experience and current pricing strategy, we anticipate that a significant portion of maturing time deposits will be retained.
At December 31, 2020, we exceeded all of our regulatory capital requirements with a Tier 1 leverage capital level of $24.6 million, or 15.5% of adjusted total assets, which is above the well-capitalized required level of $7.9 million, or 5.0%; and total risk-based capital of $25.9 million, or 18.3% of risk-weighted assets, which is above the well-capitalized required level of $14.1 million, or 10.0%. Accordingly, EAGLE.bank was categorized as well capitalized at December 31, 2020 and 2019. Management is not aware of any conditions or events since the most recent notification that would change our category.
Delinquencies, Classified Assets and Non-Performing Assets
Troubled Debt Restructurings. We occasionally modify loans to help a borrower stay current on his or her loan and to avoid foreclosure. We consider modifications only after analyzing the borrower’s current repayment capacity, evaluating the strength of any guarantors based on documented current financial information, and assessing the current value of any collateral pledged. We generally do not forgive principal or interest on loans, but may do so if it is in our best interest and increases the likelihood that we can collect the remaining principal balance. We may modify the terms of loans to lower interest rates (which may be at below market rates), to provide for fixed interest rates on loans where fixed rates are otherwise not available, or to provide for interest-only terms. These
22

modifications are made only when there is a reasonable and attainable workout plan that has been agreed to by the borrower and that is in our best interests. At December 31, 2020, we had seven loans totaling $277,000 that were classified as troubled debt restructurings. Troubled debt restructurings may also be included in non-accrual loans if they are not performing in accordance with their modified terms or had been performing in accordance with their modified terms for less than six months since the date of restructuring.
At December 31, 2020 and during the twelve months then ended, there were no non-accruing troubled debt restructurings. For the year ended December 31, 2020, we recognized $15,000 of interest income on such loans, the same amount that would have been recorded on the loans under their original terms.
Delinquent Loans. The following table sets forth our loan delinquencies by type and amount at the dates indicated.
Loans Delinquent For Total 30-89 Days 90 Days and Over
Number Amount Number Amount Number Amount (Dollars in thousands) At December 31, 2020 One- to four-family residential:
Owner occupied .................................. 1 $ 117 6 $ 309 7 $ 426 Non-owner occupied ........................... — — — — — —
Commercial real estate and land .............. 1 1,571 — — 1 1,571 Home equity and other consumer ............ — — — — — — Residential construction .......................... — — — — — — Multi-family real estate ........................... — — — — — — Commercial ............................................. — — 1 428 1 428
Total .................................................... 2 $ 1,688 7 $ 737 9 $ 2,425 At December 31, 2019 One- to four-family residential:
Owner occupied .................................. 1 $ 75 7 $ 364 8 $ 439 Non-owner occupied ........................... — — 1 489 1 489
Commercial real estate and land .............. — — — — — — Home equity and other consumer ............ 2 24 — — 2 24 Residential construction .......................... — — — — — — Multi-family real estate ........................... — — — — — — Commercial ............................................. — — — — — —
Total .................................................... 3 $ 99 8 $ 853 11 $ 952
Classified Assets. Federal regulations provide for the classification of loans and other assets, such as debt
and equity securities considered by the FDIC to be of lesser quality, as “substandard,” “doubtful” or “loss.” An asset is considered “substandard” if it is inadequately protected by the current net worth and paying capacity of the obligor or of the collateral pledged, if any. “Substandard” assets include those characterized by the “distinct possibility” that the insured institution will sustain “some loss” if the deficiencies are not corrected. Assets classified as “doubtful” have all of the weaknesses inherent in those classified “substandard,” with the added characteristic that the weaknesses present make “collection or liquidation in full,” on the basis of currently existing facts, conditions, and values, “highly questionable and improbable.” Assets classified as “loss” are those considered “uncollectible” and of such little value that their continuance as assets without the establishment of a specific allowance for loan losses is not warranted. Assets that do not currently expose the insured institution to sufficient risk to warrant classification in one of the aforementioned categories but possess weaknesses are designated as “special mention” by management.
When an insured institution classifies problem assets as either substandard or doubtful, it may establish general allowances in an amount deemed prudent by management to cover losses that were both probable and reasonable to estimate. General allowances represent allowances which have been established to cover accrued losses associated with lending activities that were both probable and reasonable to estimate, but which, unlike specific allowances, have not been allocated to particular problem assets. When an insured institution classifies problem assets as “loss,” it is required either to establish a specific allowance for losses equal to 100% of that portion of the asset so classified or to charge-off such amount. An institution’s determination as to the classification
23

of its assets and the amount of its valuation allowances is subject to review by the regulatory authorities, which may require the establishment of additional general or specific allowances.
In connection with the filing of our periodic regulatory reports and in accordance with our classification of assets policy, we regularly review the problem loans in our portfolio to determine whether any loans require classification in accordance with applicable regulations. Loans are listed on the “watch list” initially because of emerging financial weaknesses even though the loan is currently performing as agreed, or delinquency status, or if the loan possesses weaknesses although currently performing. Management reviews the status of each loan on our watch list on a quarterly basis with the board of directors. If a loan deteriorates in asset quality, the classification is changed to “special mention,” “substandard,” “doubtful” or “loss” depending on the circumstances and the evaluation. Generally, loans 90 days or more past due are placed on nonaccrual status and classified “substandard.”
On the basis of this review of our assets, our classified loans, special mention loans, and foreclosed real estate held for sale at the dates indicated were as follows:
At December 31,
2020 2019
(Dollars in thousands)
Classified loans: Substandard........................................................... $ 2,805 $ 1,414 Doubtful assets ...................................................... — — Loss assets ............................................................ — —
Total classified assets ....................................... $ 2,805 $ 1,414
Special mention loans ........................................... $ 2,881 $ — Foreclosed real estate held for sale ........................ $ 34 $ —
24

Non-Performing Assets. The table below sets forth the amounts and categories of our non-performing assets at the dates indicated.
At December 31, 2020 2019 (Dollars in thousands) Non-accrual loans: One- to four-family residential:
Owner occupied ............................................ $ 309 $ 364 Non-owner occupied ..................................... — 489
Commercial real estate and land ........................ — — Home equity and other consumer ...................... — — Residential construction .................................... — — Multi-family real estate ..................................... — — Commercial ....................................................... 428 —
Total ............................................................. 737 853 Accruing loans 90 days or more past due: One- to four-family residential:
Owner occupied ............................................ $ — $ — Non-owner occupied ..................................... — —
Commercial real estate and land ........................ — — Home equity and other consumer ...................... — — Residential construction .................................... — — Multi-family real estate ..................................... — — Commercial ....................................................... — —
Total loans 90 days or more past due ............ — — Accruing troubled debt restructurings: One- to four-family residential:
Owner occupied ............................................ $ 68 $ 71 Non-owner occupied ..................................... 174 182
Commercial real estate and land ........................ — — Home equity and other consumer ...................... 35 39 Residential construction .................................... — — Multi-family real estate ..................................... — — Commercial ....................................................... — —
Total ............................................................. $ 277 $ 292 Total non-performing loans ............................... $ 1,014 $ 1,145 Foreclosed real estate ........................................ 34 — Total non-performing assets .............................. $ 1,048 $ 1,145
Ratios: Total non-performing loans to total loans ......... 0.79% 1.00% Total non-performing assets to total assets ........ 0.65% 0.80% Non-performing assets excluding accruing
troubled debt restructurings to total assets ..... 0.48% 0.60% Non-performing loans excluding accruing
troubled debt restructurings to total loans ...... 0.57% 0.74% Other Loans of Concern. There were no other loans at December 31, 2020 that are not already disclosed
where there is information about possible credit problems of borrowers that caused management to have serious doubts about the ability of the borrowers to comply with present loan repayment terms and that may result in disclosure of such loans in the future.
25

Allowance for Loan Losses. The following table sets forth activity in our allowance for loan losses for the years indicated.
At or For the Years Ended December 31,
2020 2019 (Dollars in thousands)
Balance at beginning of year.................. $ 1,166 $ 1,187 Charge-offs: One- to four-family residential:
Owner occupied................................. — — Non-owner occupied ......................... — —
Commercial real estate and land ............ — — Home equity and other consumer .......... — (39) Residential construction ......................... — — Multi-family real estate .......................... — — Commercial ........................................... (82) —
Total charge-offs .............................. (82) (39) Recoveries: One- to four-family residential:
Owner occupied................................. 9 15 Non-owner occupied ......................... 1 2
Commercial real estate and land ............ — — Home equity and other consumer .......... 2 1 Residential construction ......................... — — Multi-family real estate .......................... — — Commercial ........................................... — —
Total recoveries................................ 12 18
Net charge-offs ...................................... (70) (21) Provision for loan losses ........................ 290 — Balance at end of year............................ $ 1,386 $ 1,166 Ratios: Net charge-offs to average loans
outstanding ........................................ (0.06)% (0.02)% Allowance for loan losses to non-
performing loans at end of year ......... 136.69% 101.83% Allowance for loan losses to total
loans at end of year ............................ 1.08% 1.02%
There were $70,000 in net loan charge-offs for the year ended December 31, 2020 and $21,000 in net loan charge-offs during the year ended December 2019, respectively.
At December 31, 2020 and 2019, our allowance for loan losses represented 1.08% and 1.02% of total loans and 136.69% and 101.83% of non-performing loans. Although we believe that we use the best information available to establish the allowance for loan losses, future adjustments to the allowance for loan losses may be necessary and results of operations could be adversely affected if circumstances differ substantially from the assumptions used in making the determinations. Because future events affecting borrowers and collateral cannot be predicted with certainty, the existing allowance for loan losses may not be adequate and management may determine that increases in the allowance are necessary if the quality of any portion of our loan portfolio deteriorates as a result. Furthermore, as an integral part of its examination process, the FDIC and ODFI will periodically review our allowance for loan losses. The FDIC and ODFI may require that we increase our allowance based on its judgments of information available to it at the time of its examination. The regulatory agencies are not, however, directly involved in the determination of the allowance for loan losses, and decisions to increase and decrease the allowance are the responsibility of EAGLE.bank management. Any material increase in the allowance for loan losses may adversely affect our financial condition and results of operations.
26

Stock Repurchases On December 12, 2019, the Company announced the adoption of a stock repurchase program (the “Stock
Repurchase Program”) under which the Company could repurchase up to 81,285 shares of its common stock, or approximately 5% of the then current outstanding shares. During the year ended December 31, 2020, the Company completed this stock repurchase program and repurchased 21,185 shares of its common stock at an average price of $15.94 per share. On August 5, 2020, the Company announced the adoption of a second stock repurchase program under which the Company could repurchase up to 78,673 of its common stock, or approximately 5% of the then outstanding shares. Through this program and during the year ended December 31, 2020, the Company purchased 47,120 shares of its common stock at an average price of $15.95 per share. At December 31, 2020, there were 31,553 shares remaining that could be repurchased under the Stock Repurchase Program. The timing of the purchases will depend on certain factors, including but not limited to, market conditions and prices, available funds and alternative uses of capital. The stock repurchase program may be carried out through open-market purchases, block trades, negotiated private transactions and pursuant to a trading plan that will be adopted in accordance with Rule 10b5-1 under the Securities Exchange Act of 1934. Any repurchased shares will be held by the Company as authorized but unissued shares. The repurchase program has no expiration date, but may be suspended, terminated or modified at any time for any reason, including market conditions, the cost of repurchasing shares, the availability of alternative investment opportunities, liquidity, and other factors deemed appropriate. The repurchase program does not obligate the Company to purchase any particular number of shares.
27

Index to Financial Statements of Eagle Financial Bancorp, Inc.
Independent Auditor’s Report ................................................................................................................ 29
Consolidated Balance Sheets at December 31, 2020 and 2019 ............................................................. 30
Consolidated Statements of Income and Comprehensive Income for the Years Ended
December 31, 2020 and 2019 ....................................................................................................... 31
Consolidated Statements of Shareholders’ Equity for the Years Ended
December 31, 2020 and 2019 ....................................................................................................... 32
Consolidated Statements of Cash Flows for the years ended December 31, 2020 and 2019................. 33
Notes to the Consolidated Financial Statements .................................................................................... 35
* * *
28

Independent Auditor’s Report
Board of Directors Eagle Financial Bancorp, Inc. Cincinnati, Ohio
We have audited the accompanying consolidated financial statements of Eagle Financial Bancorp, Inc. and its subsidiary, which comprise the consolidated balance sheets as of December 31, 2020 and 2019, and the related consolidated statements of income and comprehensive income, shareholders’ equity and cash flows for the years then ended, and the related notes to the consolidated financial statements.
Management’s Responsibility for the Financial Statements Management is responsible for the preparation and fair presentation of these consolidated financial statements in accordance with accounting principles generally accepted in the United States of America; this includes the design, implementation and maintenance of internal control relevant to the preparation and fair presentation of consolidated financial statements that are free from material misstatement, whether due to fraud or error.
Auditor’s Responsibility Our responsibility is to express an opinion on these consolidated financial statements based on our audits. We conducted our audits in accordance with auditing standards generally accepted in the United States of America. Those standards require that we plan and perform the audit to obtain reasonable assurance about whether the consolidated financial statements are free from material misstatement.
An audit involves performing procedures to obtain audit evidence about the amounts and disclosures in the consolidated financial statements. The procedures selected depend on the auditor’s judgment, including the assessment of the risks of material misstatement of the consolidated financial statements, whether due to fraud or error. In making those risk assessments, the auditor considers internal control relevant to the entity’s preparation and fair presentation of the consolidated financial statements in order to design audit procedures that are appropriate in the circumstances, but not for the purpose of expressing an opinion on the effectiveness of the entity’s internal control. Accordingly, we express no such opinion. An audit also includes evaluating the appropriateness of accounting policies used and the reasonableness of significant accounting estimates made by management, as well as evaluating the overall presentation of the consolidated financial statements.
We believe that the audit evidence we have obtained is sufficient and appropriate to provide a basis for our audit opinion.
OpinionIn our opinion, the consolidated financial statements referred to above present fairly, in all material respects, the financial position of Eagle Financial Bancorp, Inc. and its subsidiary as of December 31, 2020 and 2019, and the results of their operations and their cash flows for the years then ended in accordance with accounting principles generally accepted in the United States of America.
Report on Other Information Our audit was performed for the purpose of forming an opinion on the basic consolidated financial statements as a whole. The message from the chief executive officer and annual report to stockholders are presented for purposes of additional analysis and are not a required part of the basic consolidated financial statements. Such information has not been subjected to the auditing procedures applied in the audit of the basic consolidated financial statements, and accordingly, we do not express an opinion or provide any assurance on it.
Cincinnati, Ohio March 5, 2021
29

Eagle Financial Bancorp, Inc. Consolidated Balance Sheets December 31, 2020 and 2019
(Amounts in thousands, except share and per share data)
Assets 2020 2019
Cash and due from banks $ 526 $ 408 Federal Reserve and Federal Home Loan Bank (FHLB) demand accounts 13,059 14,893 Cash and cash equivalents 13,585 15,301 Interest-bearing time deposits in other banks 249 2,988 Loans held for sale 14,020 6,390 Loans, net of allowance for loan losses of $1,386 and $1,166 for 2020 and 2019, respectively 119,398 106,568 Premises and equipment - at depreciated cost 4,098 4,062 FHLB stock - at cost 1,294 816 Foreclosed real estate held for sale, net 34 - Bank-owned life insurance (BOLI) 2,049 2,005 FHLB lender risk account receivable 4,420 3,646 Accrued interest receivable 445 326 Deferred federal tax asset 249 77 Other assets 604 609
Total assets $ 160,445 $ 142,788
Liabilities and Shareholders' Equity
LiabilitiesDeposits
Noninterest-bearing $ 7,410 $ 5,967 Interest-bearing 121,030 106,024
Total deposits 128,440 111,991
Advances from borrowers for taxes and insurance 850 858 Accrued interest payable 2 2 Accrued supplemental retirement plans 1,672 1,518 Accrued federal income tax - 9 Other liabilities 465 507
Total liabilities 131,429 114,885 Shareholders' Equity
Preferred stock, $0.01 par value, 5,000,000 shares - - authorized; none issued and outstanding Common stock, $0.01 par value, 50,000,000 shares 16 16 at December 31, 2020 and 2019; issued 1,654,758 at December 31, 2020 and 2019; outstanding 1,526,373 and 1,594,658 at December 31, 2020 and 2019
Additional paid-in capital 13,361 14,165 Retained earnings 16,671 14,819 Unearned Employee Stock Ownership Plan ("ESOP") shares (1,032) (1,097)
Total shareholders' equity 29,016 27,903
Total liabilities and shareholders' equity $ 160,445 $ 142,788
December 31,
See Notes to the Consolidated Financial Statements
30

Eagle Financial Bancorp, Inc. Consolidated Statements of Income and Comprehensive Income
Years Ended December 31, 2020 and 2019 (Amounts in thousands, except share and per share data)
2020 2019Interest and Dividend Income
Interest earned on loans $ 5,020 $ 5,103 Dividends on FHLB stock 13 38 Other interest-earning deposits 89 262
Total interest and dividend income 5,122 5,403
Interest ExpenseInterest on deposits 1,002 1,105 Interest on FHLB advances 4 -
Total interest expense 1,006 1,105
Net Interest Income 4,116 4,298
Provision for Loan Losses 290 -
Net Interest Income After Provision for Loan Losses 3,826 4,298
Noninterest IncomeNet gains on loan sales 4,946 2,386 Other service charges and fees 487 314 Income from BOLI 44 47 Gain on sale of foreclosed real estate 47 28
Total noninterest income 5,524 2,775
Noninterest ExpenseCompensation and benefits 4,770 4,292 Occupancy and equipment, net 307 255 Data processing 369 317 Legal and professional services 358 359 FDIC premium expense 24 16 Foreclosed real estate impairments and expenses, net 78 21 Franchise and other taxes 120 222 Advertising 51 96 ATM processing expense 83 85 Other expenses 530 565
Total noninterest expense 6,690 6,228
Income Before Income Taxes 2,660 845
Income TaxesCurrent 748 395 Deferred (172) (208)
Total income taxes 576 187
Net Income and Comprehensive Income $ 2,084 $ 658
Earnings per share - basic and diluted $ 1.43 $ 0.43 Weighted-average shares outstanding - basic and diluted 1,423,564 1,475,876
See Notes to the Consolidated Financial Statements
31

Eagle Financial Bancorp, Inc. Consolidated Statements of Shareholders’ Equity
Years Ended December 31, 2020 and 2019 (Amounts in thousands, except share and per share data)
Additional UnearnedCommon Paid-In Retained ESOP
Stock Capital Earnings Shares TotalBalance at January 1, 2019 $ 16 $ 14,758 $ 14,161 $ (1,161) 27,774$
Net income - - 658 - 658 ESOP shares earned - 38 - 64 102 Stock based compensation expense 246 246 Repurchase of common stock - (877) - - (877)
Balance at December 31, 2019 $ 16 $ 14,165 $ 14,819 $ (1,097) 27,903$ Net income - - 2,084 - 2,084 ESOP shares earned - 39 - 65 104 Stock based compensation expense - 246 - - 246 Dividends on common stock, $0.15 per share - - (232) - (232) Repurchase of common stock - (1,089) - - (1,089)
Balance at December 31, 2020 $ 16 $ 13,361 $ 16,671 $ (1,032) $ 29,016
See Notes to the Consolidated Financial Statements
32

Eagle Financial Bancorp, Inc. Consolidated Statements of Cash Flows
Years ended December 31, 2020 and 2019 (Amounts in thousands, except share and per share data)
2020 2019Operating Activities
Net income $ 2,084 $ 658 Items not requiring (providing) cash:
Depreciation and amortization 195 199 Proceeds on sale of loans in the secondary market 152,341 84,893 Loans originated for sale in the secondary market (155,025) (87,070)Gain on sale of loans (4,946) (2,386)Provision for loan losses 290 - Gain on sale of foreclosed real estate (47) (28)Deferred federal taxes (172) (208)Increase in cash surrender value of BOLI (44) (47)Stock based compensation expense 246 246 ESOP compensation expense 104 102
Changes in:FHLB lender risk account receivable (774) (269)Accrued interest receivable (119) 28 Other assets and prepaid federal income taxes 68 (458)Accrued federal income taxes (72) (173)Accrued supplemental retirement plans 154 217 Accrued expenses and other liabilities (42) 131
Net cash flows used in operating activities (5,759) (4,165)
Investing ActivitiesNet decrease in interest-bearing time deposits in other banks 2,739 498 Net (increase) decrease in loans (13,597) 6,751 Purchase of FHLB stock (478) (62)Purchase of premises and equipment (231) (53)Proceeds from sale of foreclosed real estate 490 245
Net cash (used in) provided by investing activities (11,077) 7,379
Financing ActivitiesNet increase in deposits 16,449 5,622 Repurchase of common stock (1,089) (877)Dividends paid (232) - Net decrease in advances from borrowers for taxes and insurance (8) (92)
Net cash provided by financing activities 15,120 4,653
(Decrease) Increase in Cash and Cash Equivalents (1,716) 7,867
Cash and Cash Equivalents, Beginning of Year 15,301 7,434
Cash and Cash Equivalents, End of Year $ 13,585 $ 15,301 (Continued)
33
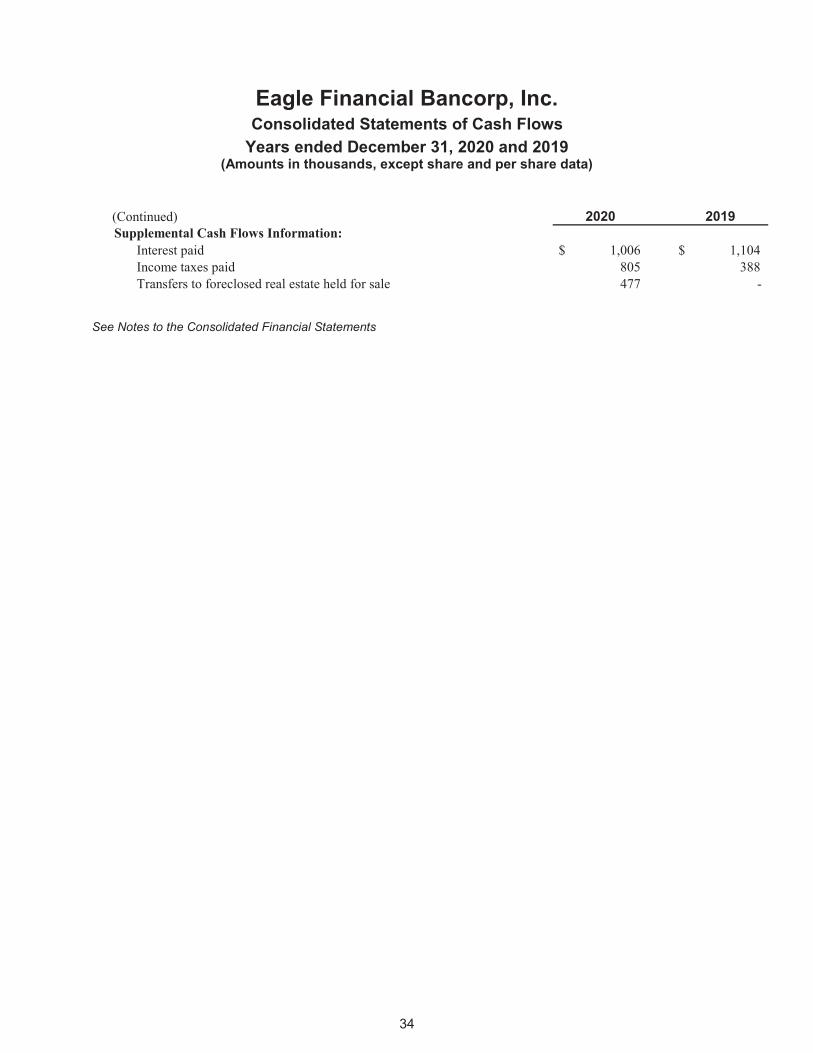
Eagle Financial Bancorp, Inc. Consolidated Statements of Cash Flows
Years ended December 31, 2020 and 2019 (Amounts in thousands, except share and per share data)
(Continued) 2020 2019Supplemental Cash Flows Information:
Interest paid $ 1,006 $ 1,104 Income taxes paid 805 388 Transfers to foreclosed real estate held for sale 477 -
See Notes to the Consolidated Financial Statements
34

Eagle Financial Bancorp, Inc. Notes to the Consolidated Financial Statements
For the years ended December 31, 2020 and 2019 (Amounts in thousands, except share and per share data)
Note 1: Nature of Operations and Summary of Significant Accounting Policies
General
Eagle Financial Bancorp, Inc. (the “Company”), a Maryland corporation and registered bank holding company, was formed on February 21, 2017 to become the bank holding company for EAGLE.bank (the “Bank”). The Bank, an Ohio chartered savings and loan association, completed its mutual-to-stock conversion on July 20, 2017. In connection with the Bank’s conversion, the Company acquired 100% ownership of the Bank and the Company offered and sold 1,572,808 shares of its common stock at $10.00 per share, for gross offering proceeds of $15,728. The cost of the conversion and issuance of common stock was approximately $1,423, which was deducted from the gross offering proceeds. The Company also contributed 40,000 shares of its common stock and $100 of cash to Eagle Savings Bank Charitable Foundation (the “Foundation”), a charitable foundation formed in connection with the Bank’s conversion. The Bank’s employee stock ownership plan (“ESOP”) purchased 129,024 shares of the common stock sold by the Company, which was 8% of the 1,612,808 shares of common stock issued by the Company, including the shares contributed to the Foundation. The ESOP purchased the shares using a loan from the Company. The Company contributed $7,153 of the net proceeds from the offering to the Bank, loaned $1,290 of the net proceeds to the ESOP, contributed $100 to the Foundation and retained approximately $5,763 of the net proceeds.
Following the Bank’s conversion, voting rights are held and exercised exclusively by the shareholders of the holding company. Deposit account holders continue to be insured by the FDIC. A liquidation account was established in an amount equal to the Bank’s total equity as of the latest balance sheet date in the final offering circular used in the conversion. Each eligible account holder or supplemental account holder are entitled to a proportionate share of this account (a“subaccount”) in the event of a complete liquidation of the Bank, and only in such event. The value of this subaccount is subject to an annual decrease based on decreases in the eligible account holder’s or supplemental account holder’s deposit balance, and will cease to exist if the account is closed. The liquidation account will never be increased despite any increase after conversion in the related deposit balance. The Bank may not pay a dividend on its capital stock, if the effect thereof would cause retained earnings to be reduced below the liquidation account amount or regulatory capital requirements. In addition, the stock holding company is subject to certain laws and regulations that may restrict the payout of dividends by the holding company and the repurchase of its capital stock.
The conversion was accounted for as a change in corporate form with the historic basis of the Bank’s assets, liabilities and equity unchanged as a result.
Basis of Presentation and Consolidation
The consolidated financial statements as of and for the years ended December 31, 2020 and 2019 include Eagle Financial Bancorp, Inc. and its wholly-owned subsidiary, EAGLE.bank, together referred to as “the Company”. Intercompany transactions and balances have been eliminated in consolidation.
35

Eagle Financial Bancorp, Inc. Notes to the Consolidated Financial Statements
For the years ended December 31, 2020 and 2019 (Amounts in thousands, except share and per share data)
Revenue Recognition Accounting Standards Codification ("ASC") 606, Revenue from Contracts with Customers ("ASC 606"), establishes principles for reporting information about the nature, amount, timing and uncertainty of revenue and cash flows arising from the entity's contracts to provide goods or services to customers. The core principle requires an entity to recognize revenue to depict the transfer of goods or services to customers in an amount that reflects the consideration that it expects to be entitled to receive in exchange for those goods or services recognized as performance obligations are satisfied. The majority of our revenue-generating transactions are not subject to ASC 606, including revenue generated from financial instruments, such as our loans, as well as revenue related to our mortgage banking activities, as these activities are subject to other GAAP discussed elsewhere within our disclosures. Descriptions of our revenue-generating activities that are within the scope of ASC 606, which are presented in our income statements as components of non-interest income are as follows:
Service charges on deposit accounts - these represent general service fees for monthly account maintenance and activity- or transaction-based fees and consist of transaction-based revenue, time-based revenue (service period), item-based revenue or some other individual attribute-based revenue. Revenue is recognized when our performance obligation is completed which is generally monthly for account maintenance services or when a transaction has been completed (such as a wire transfer). Payment for such performance obligations are generally received at the time the performance obligations are satisfied.
Use of Estimates
The preparation of financial statements in conformity with accounting principles generally accepted in the United States of America requires management to make estimates and assumptions that affect the reported amounts of assets and liabilities and disclosure of contingent assets and liabilities at the date of the financial statements and the reported amounts of revenues and expenses during the reporting period. Actual results could differ from those estimates.
Material estimates that are particularly susceptible to significant change relate to the determination of the allowance for loan losses, valuation of real estate acquired in connection with foreclosures or in satisfaction of loans, and fair values of financial instruments.
Cash Equivalents
For purposes of reporting cash flows, cash and cash equivalents include cash and due from banks and interest-earning deposits in other financial institutions. The Company considers all liquid investments with original maturities of three months or less to be cash equivalents.
From time to time, the Bank’s cash accounts may exceed the FDIC’s insured limit of $250. Management considers the risk of loss to be very low and management monitors the account balance and periodically assesses the financial condition of its correspondent banks. The Company had no
36

Eagle Financial Bancorp, Inc. Notes to the Consolidated Financial Statements
For the years ended December 31, 2020 and 2019 (Amounts in thousands, except share and per share data)
funds in banks that exceeded federally insured limits at December 31, 2020. Funds of $7,594 held at Federal Home Loan Bank, and $4,741 at Federal Reserve Bank are not subject to FDIC insurance.
Interest-bearing Time Deposits in Other Banks
Interest-bearing time deposits in other banks mature within one year and are carried at cost.
Loans Held for Sale
Mortgage loans originated and intended for sale in the secondary market are carried at the lower of cost or fair value in the aggregate. Net unrealized losses, if any, are recognized through a valuation allowance by charges to noninterest income. Gains and losses on loan sales are recorded in noninterest income, and direct loan origination costs and fees are deferred at origination of the loan and are recognized in noninterest income upon sale of the loan.
Loans
Loans that management has the intent and ability to hold for the foreseeable future or until maturity or payoff are reported at their outstanding principal balances adjusted for charge-offs, the allowance for loan losses, any unamortized deferred fees or costs on originated loans and unamortized premiums or discounts on purchased loans.
Loan origination fees, net of certain direct origination costs are deferred and amortized as a level yield adjustment over the respective term of the loan.
The accrual of interest on mortgage and commercial loans is discontinued at the time the loan is 90 days past due unless the credit is well-secured and in process of collection. Past due status is based on contractual terms of the loan. In all cases, loans are placed on nonaccrual or charged off at an earlier date if collection of principal or interest is considered doubtful.
All interest accrued but not collected for loans that are placed on nonaccrual or charged off are reversed against interest income. The interest on these loans is accounted for on the cash-basis or cost-recovery method, until qualifying for return to accrual status. Loans are returned to accrual status when all the principal and interest amounts contractually due are brought current and future payments are reasonably assured.
When cash payments are received on impaired loans in each loan class, the Company records the payment as interest income unless collection of the remaining recorded principal amount is doubtful, at which time payments are used to reduce the principal balance of the loan. Troubled debt restructured loans recognize interest income on an accrual basis at the renegotiated rate if the loan is in compliance with the modified terms, no principal reduction has been granted and the loan has demonstrated the ability to perform in accordance with the renegotiated terms for a period of at least six consecutive months.
37

Eagle Financial Bancorp, Inc. Notes to the Consolidated Financial Statements
For the years ended December 31, 2020 and 2019 (Amounts in thousands, except share and per share data)
Allowance for Loan Losses
The allowance for loan losses is established as losses are estimated to have occurred through a provision for loan losses charged to income. Loan losses are charged against the allowance when management believes the uncollectability of a loan balance is confirmed. Subsequent recoveries, if any, are credited to the allowance.
The allowance for loan losses is evaluated on a regular basis by management and is based upon management’s periodic review of the collectability of the loans in light of historical experience, the nature and volume of the loan portfolio, adverse situations that may affect the borrower’s ability to repay, estimated value of any underlying collateral and prevailing economic conditions. This evaluation is inherently subjective as it requires estimates that are susceptible to significant revision as more information becomes available.
The allowance consists of allocated and general components. The allocated component relates to loans that are classified as impaired. For those loans that are classified as impaired, an allowance is established when the discounted cash flows (or collateral value or observable market price) of the impaired loan is lower than the carrying value of that loan. The general component covers nonclassified loans and is based on a historical three-year charge-off experience and expected loss given default derived from the Company’s internal risk rating process. Other adjustments related to changes in lending policies, changes in economic conditions, trends in volume and terms of loans, delinquency levels and trends, changes in value of underlying collateral and the effect of the concentrations of credit are made to the allowance for pools of loans after an assessment of internal or external influences on credit quality that are not fully reflected in the historical losses or risk rating data.
A loan is considered impaired when, based on current information and events, it is probable that the Company will be unable to collect the scheduled payments of principal or interest when due according to the contractual terms of the loan agreement. Factors considered by management in determining impairment include payment status, collateral value and the probability of collecting scheduled principal and interest payments when due. Loans that experience insignificant payment delays and payment shortfalls generally are not classified as impaired. Management determines the significance of payment delays and payment shortfalls on a case-by-case basis, taking into consideration all of the circumstances surrounding the loan and the borrower, including the length of the delay, the reasons for the delay, the borrower’s prior payment record and the amount of the shortfall in relation to the principal and interest owed. Impairment is measured on a loan-by-loan basis for commercial real estate and land loans, multi-family loans, commercial loans, construction loans and troubled debt restructurings by either the present value of expected future cash flows discounted at the loan’s effective interest rate, the loan’s obtainable market price or the fair value of the collateral if the loan is collateral dependent.
Groups of loans with similar risk characteristics are collectively evaluated for impairment based on the group’s historical loss experience adjusted for changes in trends, conditions and other relevant factors that affect repayment of the loans. Accordingly, the Company does not separately identify individual consumer and residential loans for impairment measurements, unless such loans are the subject of a restructuring agreement due to financial difficulties of the borrower.
38

Eagle Financial Bancorp, Inc. Notes to the Consolidated Financial Statements
For the years ended December 31, 2020 and 2019 (Amounts in thousands, except share and per share data)
Premises and Equipment
Depreciable assets are stated at cost less accumulated depreciation. Depreciation is charged to expense using the straight-line method over the estimated useful lives of the assets.
The estimated useful lives for each major depreciable classification of premises and equipment are as follows:
Buildings and improvements 35-40 years Furniture, fixtures and equipment 3-5 years
Long-lived Asset Impairment
The Company evaluates the recoverability of the carrying value of long-lived assets whenever events or circumstances indicate the carrying amount may not be recoverable. If a long-lived asset is tested for recoverability and the undiscounted estimated future cash flows expected to result from the use and eventual disposition of the asset is less than the carrying amount of the asset, the asset cost is adjusted to fair value and an impairment loss is recognized as the amount by which the carrying amount of a long-lived asset exceeds its fair value.
No long-lived asset impairment was recognized during the years ended December 31, 2020 and 2019.
Federal Home Loan Bank Stock
Federal Home Loan Bank stock is a required investment for institutions that are members of the Federal Home Loan Bank system. The required investment in the common stock is based on a predetermined formula, carried at cost and evaluated for impairment.
Foreclosed Real Estate Held for Sale, Net
Assets acquired through, or in lieu of, loan foreclosure are held for sale and are initially recorded at fair value less cost to sell at the date of foreclosure, establishing a new cost basis. Subsequent to foreclosure, valuations are periodically performed by management and the assets are carried at the lower of carrying amount or fair value less cost to sell. Revenue and expenses from operations of foreclosed real estate are included in noninterest expense.
Bank-owned Life Insurance
The Company has purchased life insurance policies on certain key executives. Bank-owned life insurance is recorded at the amount that can be realized under the insurance contract at the balance sheet date, which is the cash surrender value adjusted for other charges or other amounts due that are probable at settlement. Death benefit proceeds received in excess of the policy’s cash surrender value are recognized to noninterest income. Investment returns on the bank-owned life insurance assets are added to the carrying value and included as non-interest income in the statements of income. Any receipt of benefit proceeds is recorded as a reduction of the carrying value of the bank-owned life insurance asset.
39

Eagle Financial Bancorp, Inc. Notes to the Consolidated Financial Statements
For the years ended December 31, 2020 and 2019 (Amounts in thousands, except share and per share data)
FHLB Lender Risk Account Receivable
Certain loan sales transactions with the FHLB of Cincinnati provide for establishment of a Lender Risk Account (LRA). The LRA consists of amounts withheld from loan sale proceeds by the FHLB for absorbing inherent losses that are probable on those sold loans. These withheld funds are an asset to the Company as they are scheduled to be paid to the Company in future years, net of any credit losses on those loans sold. The receivables are initially measured at fair value. The fair value is estimated by discounting the cash flows over the life of each master commitment contract. The accretable yield is amortized over the life of the master commitment contract. Expected cash flows are re-evaluated at each measurement date. If there is an adverse change in expected cash flows, the accretable yield would be adjusted on a prospective basis and the asset would be evaluated for impairment.
Accrued Interest Receivable
For loans amortized at cost, interest income is accrued based on the unpaid principal balance. The accrual of interest on mortgage and commercial loans is discontinued at the time the loan is 90 days past due unless the credit is well-secured and in process of collection. Past due status is based on contractual terms of the loan. In all cases, loans are placed on nonaccrual or charged off at an earlier date if collection of principal or interest is considered doubtful.
All interest accrued but not collected for loans that are placed on nonaccrual or charged off are reversed against interest income. The interest on these loans is accounted for on the cash-basis or cost-recovery method, until qualifying for return to accrual. Loans are returned to accrual status when all the principal and interest amounts contractually due are brought current and future payments are reasonably assured.
Accrued interest receivable was as follows:
2020 2019Loans 440$ 314$ FHLB stock and other 5 12
445$ 326$
December 31,
40

Eagle Financial Bancorp, Inc. Notes to the Consolidated Financial Statements
For the years ended December 31, 2020 and 2019 (Amounts in thousands, except share and per share data)
Income Taxes
The Company accounts for income taxes in accordance with authoritative guidance (ASC 740, Income Taxes). The guidance results in two components of income tax expense: current and deferred. Current income tax expense reflects taxes to be paid or refunded for the current period by applying the provisions of the enacted tax law to the taxable income or excess of deductions over revenues. The Company determines deferred income taxes using the liability (or balance sheet) method. Under this method, the net deferred tax asset or liability is based on the tax effects of the differences between the book and tax bases of assets and liabilities, and enacted changes in tax rates and laws are recognized in the period in which they occur. Deferred income tax expense results from changes in deferred tax assets and liabilities between periods. Deferred tax assets are reduced by a valuation allowance if, based on the weight of evidence available, it is more likely than not that some portion or all of a deferred tax asset will not be realized.
Uncertain tax positions are recognized if it is more likely than not, based on the technical merits, that the tax position will be realized or sustained upon examination. The term more likely than not means a likelihood of more than 50 percent; the terms examined and upon examination also include resolution of the related appeals or litigation processes, if any. A tax position that meets the more likely than not recognition threshold is initially and subsequently measured as the largest amount of tax benefit that has a greater than 50 percent likelihood of being realized upon settlement with a taxing authority that has full knowledge of all relevant information. The determination of whether or not a tax position has met the more likely than not recognition threshold considers the facts, circumstances and information available at the reporting date and is subject to management’s judgment.
The Company recognizes interest and penalties on income taxes as a component of income tax expense. With few exceptions, the Company is no longer subject to U.S. federal, state and local income tax examinations by tax authorities for years before 2017. At December 31, 2020 and 2019, the Company had no uncertain income tax positions.
Stock Options and Restricted Stock Awards Plan
The cost of employee services received in exchange for stock option grants is the grant-date fair value of the awards estimated using an option pricing model. The Company uses a Black-Scholes pricing model and related assumptions for estimating the fair value of stock option grants. The compensation costs for restricted stock awards is based on the market price of the Company’s common stock at the date of grant multiplied by the number of shares granted. The impact of forfeitures on compensation cost is recognized in the period the award is forfeited. The estimated cost is recognized on a straight-line basis over the period the employee is required to provide services in exchange for the awards.
Repurchase of Common Stock
Common shares repurchased are at related cost. Cost of shares retired or reissued is determined using the weighted-average method.
41

Eagle Financial Bancorp, Inc. Notes to the Consolidated Financial Statements
For the years ended December 31, 2020 and 2019 (Amounts in thousands, except share and per share data)
Reclassifications Certain reclassifications have been made to the 2019 consolidated financial statements to conform to the 2020 consolidated financial statement presentation. These reclassifications had no effect on net income.
Note 2: Earnings per Share
Basic earnings per common share (“EPS”) allocated to common shareholders is calculated using the two-class method and is computed by dividing net income allocated to common shareholders by the weighted average number of common shares outstanding during the period. Unallocated common shares held by the Company’s Employee Stock Ownership Plan (“the ESOP”) are shown as a reduction in shareholder’s equity and are excluded from weighted-average common shares outstanding for both basic and diluted EPS calculations until they are committed to be released. Diluted earnings per share is adjusted for the dilutive effects of stock-based compensation and is calculated using the two-class method or the treasury method. There were no dilutive effects at December 31, 2020 or 2019.
The computation for the years ended December 31, 2020 and December 31, 2019 are as follows:
Year Ended Year EndedDecember 31, 2020 December 31, 2019
Net Income 2,084$ 658$ Less allocation of earnings to participating securities 44 17 Net income allocated to common shareholders 2,040$ 641$
Shares Outstanding for basic earnings per common share:
Weighted Average shares outstanding: 1,529,741 1,588,504 Less: Average Unearned ESOP shares: 106,177 112,628
Weighted average number of shares outstanding used in the calculation of basic earnings per common share 1,423,564 1,475,876
Basic earnings per common share: 1.43$ 0.43$
Effect of dilutive securities: Stock Options - - Weighted average number of shares outstanding used in the calculation of dilutive earnings per common share 1,423,564 1,475,876 Diluted earnings per common share: 1.43$ 0.43$
42

Eagle Financial Bancorp, Inc. Notes to the Consolidated Financial Statements
For the years ended December 31, 2020 and 2019 (Amounts in thousands, except share and per share data)
Note 3: Loans and Allowance for Loan Losses
The composition of the loan portfolio at December 31, 2020 and 2019 was as follows:
2020 2019Residential mortgage loans $ 59,278 59,859$ Commercial real estate and land loans 20,869 20,800 Home equity and other consumer 7,177 9,690 Residential construction loans 10,667 11,684 Residential mortgage loans, non-owner occupied 3,740 5,522 Multi-family real estate loans 1,352 1,065 SBA PPP Loans 20,393 - Commercial loans 5,198 5,921
128,674 114,541
Net deferred loan (fees) costs (234) 4 Loans in process (7,656) (6,811)Allowance for loan losses (1,386) (1,166)
Net loans $ 119,398 $ 106,568
December 31,
Loans serviced for the benefit of others at December 31, 2020 and 2019 amounted to $1,316 and $1,633, respectively. Loans in process relates to primarily residential mortgage loans.
Risk characteristics applicable to each segment of the loan portfolio are described as follows.
Residential Mortgage Loans, including Construction Loans and Land Loans: The residential 1-4 family real estate loans and construction loans are generally secured by owner-occupied 1-4 family residences. Repayment of these loans is primarily dependent on the personal income and credit rating of the borrowers. Credit risk in these loans can be impacted by economic conditions within the Company’s market areas that might impact either property values or a borrower’s personal income. Land loans are secured primarily by unimproved land for future residential use. Risk is mitigated by the fact that the loans are of smaller individual amounts and spread over a large number of borrowers.
Residential Mortgage Loans, Non-Owner Occupied: One-to-four family, non-owner occupied loans carry greater inherent risks than one-to-four family, owner occupied loans, since the repayment ability of the borrower is generally reliant on the success of the income generated from the property.
Commercial Real Estate and Multi-Family Real Estate: Commercial real estate loans typically involve larger principal amounts, and repayment of these loans is generally dependent on the successful operations of the property securing the loan or the business conducted on the property securing the loan. Multi-family real estate loans are generally secured by apartment complexes.
43
Eagle Financial Bancorp, Inc. Notes to the Consolidated Financial Statements
For the years ended December 31, 2020 and 2019 (Amounts in thousands, except share and per share data)
These loans are viewed primarily as cash flow loans and secondarily as loans secured by real estate. Credit risk in these loans may be impacted by the creditworthiness of a borrower, property values and the local economies in the Bank’s market areas.
Commercial: The commercial portfolio includes loans to commercial customers for use in financing working capital needs, equipment purchases and expansions. The loans in this category are repaid primarily from the cash flow of a borrower’s principal business operation. Credit risk in these loans is driven by creditworthiness of a borrower and the economic conditions that impact the cash flow stability from business operations.
Home Equity and Other Consumer: The consumer loan portfolio consists of home equity loans and term and line of credit loans such as automobile loans and loans for other personal purposes. Repayment of the home equity loans is primarily dependent on the personal income and credit rating of the borrowers. Credit risk in these loans can be impacted by economic conditions within the Company’s market areas that might impact either property values or a borrower’s personal income. Repayment for term and line of credit loans will come from a borrower’s income sources that are typically independent of the loan purpose. Credit risk is driven by consumer economic factors (such as unemployment and general economic conditions in the Company’s market area) and the creditworthiness of a borrower.
SBA PPP Loans: This category includes Small Business Administration Paycheck Protection Program ("PPP") loans that were authorized under the Coronavirus Aid, Relief, and Economic Security Act (the "CARES Act"). The PPP was implemented by the Small Business Administration ("SBA") with support from the Department of the Treasury and provided small businesses that were negatively impacted by the COVID-19 pandemic with government guaranteed and potentially forgivable loans that could be used to pay up to eight or twenty-four weeks, depending on the date of the loan, of payroll costs including benefits. Funds could also be used to pay interest on mortgages, rent, and utilities. PPP loans made by the Company have a maturity of two years and an interest rate of 1%. In addition, the SBA pays originating lenders processing fees based on the size of the loan, ranging from 1% to 5% of the loan amount. A borrower who meets certain requirements can request loan forgiveness from the SBA. If loan forgiveness is granted, the SBA will forward the forgiveness amount to the lender.
44
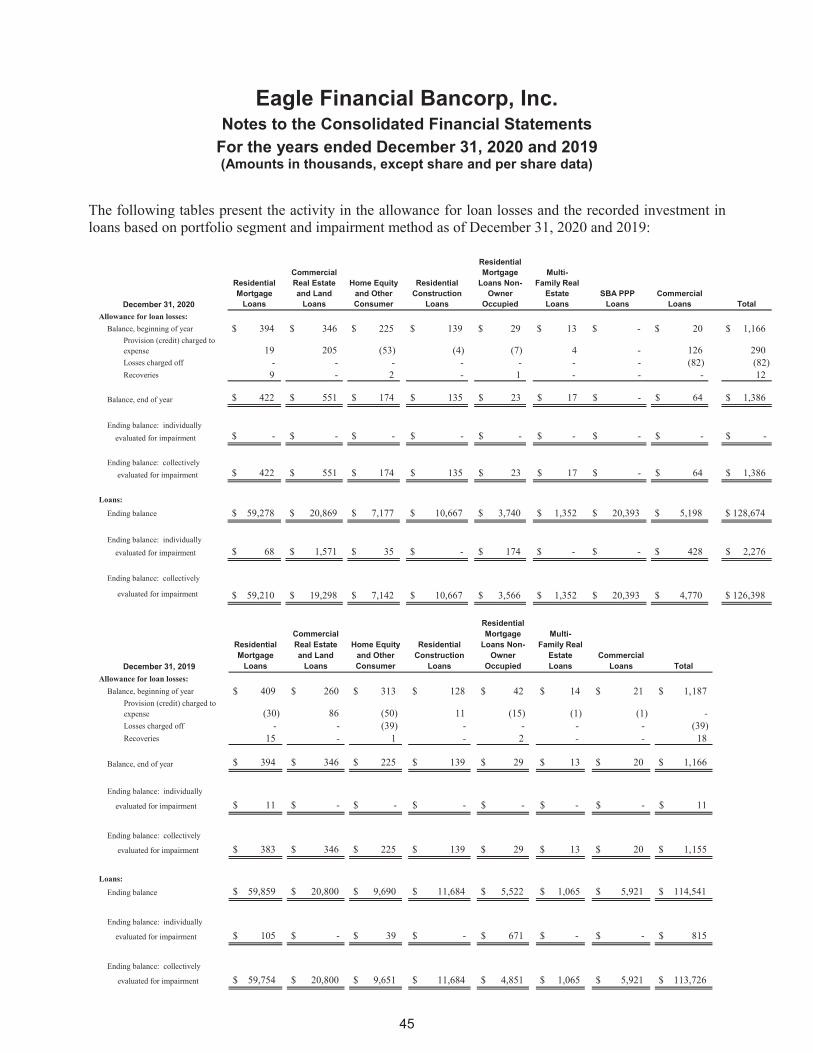
Eagle Financial Bancorp, Inc. Notes to the Consolidated Financial Statements
For the years ended December 31, 2020 and 2019 (Amounts in thousands, except share and per share data)
The following tables present the activity in the allowance for loan losses and the recorded investment in loans based on portfolio segment and impairment method as of December 31, 2020 and 2019:
December 31, 2020
Residential Mortgage
Loans
Commercial Real Estate and Land
Loans
Home Equity and Other Consumer
Residential Construction
Loans
Residential Mortgage
Loans Non-Owner
Occupied
Multi-Family Real
Estate Loans
SBA PPP Loans
Commercial Loans Total
Allowance for loan losses:Balance, beginning of year $ 394 $ 346 $ 225 $ 139 $ 29 $ 13 $ - $ 20 $ 1,166
Provision (credit) charged to expense 19 205 (53) (4) (7) 4 - 126 290 Losses charged off - - - - - - - (82) (82)Recoveries 9 - 2 - 1 - - - 12
Balance, end of year $ 422 $ 551 $ 174 $ 135 $ 23 $ 17 $ - $ 64 $ 1,386
Ending balance: individually evaluated for impairment $ - $ - $ - $ - $ - $ - $ - $ - $ -
Ending balance: collectively evaluated for impairment $ 422 $ 551 $ 174 $ 135 $ 23 $ 17 $ - $ 64 $ 1,386
Loans:
Ending balance $ 59,278 $ 20,869 $ 7,177 $ 10,667 $ 3,740 $ 1,352 $ 20,393 $ 5,198 $ 128,674
Ending balance: individually evaluated for impairment $ 68 $ 1,571 $ 35 $ - $ 174 $ - $ - $ 428 $ 2,276
Ending balance: collectively
evaluated for impairment $ 59,210 $ 19,298 $ 7,142 $ 10,667 $ 3,566 $ 1,352 $ 20,393 $ 4,770 $ 126,398
December 31, 2019
Residential Mortgage
Loans
Commercial Real Estate and Land
Loans
Home Equity and Other Consumer
Residential Construction
Loans
Residential Mortgage
Loans Non-Owner
Occupied
Multi-Family Real
Estate Loans
Commercial Loans Total
Allowance for loan losses:Balance, beginning of year $ 409 $ 260 $ 313 $ 128 $ 42 $ 14 $ 21 $ 1,187
Provision (credit) charged to expense (30) 86 (50) 11 (15) (1) (1) - Losses charged off - - (39) - - - - (39)Recoveries 15 - 1 - 2 - - 18
Balance, end of year $ 394 $ 346 $ 225 $ 139 $ 29 $ 13 $ 20 $ 1,166
Ending balance: individually
evaluated for impairment $ 11 $ - $ - $ - $ - $ - $ - $ 11
Ending balance: collectively
evaluated for impairment $ 383 $ 346 $ 225 $ 139 $ 29 $ 13 $ 20 $ 1,155
Loans:
Ending balance $ 59,859 $ 20,800 $ 9,690 $ 11,684 $ 5,522 $ 1,065 $ 5,921 $ 114,541
Ending balance: individually
evaluated for impairment $ 105 $ - $ 39 $ - $ 671 $ - $ - $ 815
Ending balance: collectively
evaluated for impairment $ 59,754 $ 20,800 $ 9,651 $ 11,684 $ 4,851 $ 1,065 $ 5,921 $ 113,726
45

Eagle Financial Bancorp, Inc. Notes to the Consolidated Financial Statements
For the years ended December 31, 2020 and 2019 (Amounts in thousands, except share and per share data)
Internal Risk Categories
Loan grades are numbered 1 through 8. Grades 5 through 8 are considered satisfactory grades. The grade of 1, or Special Mention, represents loans of lower quality and is considered criticized. The grades of 2, or Substandard, 3, or Doubtful, and 4, or Loss refer to assets that are classified. The use and application of these grades by the Company will be uniform and shall conform to the Bank’s policy.
Special Mention (grade 1) assets have potential weaknesses that deserve management’s close attention. If left uncorrected, these potential weaknesses may result in deterioration of the repayment prospects for the asset or in the institution’s credit position at some future date. Special mention assets are not adversely classified and do not expose an institution to sufficient risk to warrant adverse classification. Ordinarily, special mention credits have characteristics which corrective management action would remedy.
Substandard (grade 2) loans are inadequately protected by the current sound worth and paying capacity of the obligor or of the collateral pledged, if any. Loans so classified must have a well-defined weakness or weaknesses that jeopardize the liquidation of the debt. They are characterized by the distinct possibility that the Bank will sustain some loss if the deficiencies are not corrected.
Doubtful (grade 3) loans classified as doubtful have all the weaknesses inherent in those classified Substandard with the added characteristic that the weaknesses make collection or liquidation in full, on the basis of current known facts, conditions and values, highly questionable and improbable.
Loss (grade 4) loans classified as loss are considered uncollectible and of such little value that their continuance as assets is not warranted. This classification does not mean that the loan has absolutely no recovery or salvage value but rather it is not practical or desirable to defer writing off even though partial recovery may be affected in the future.
Satisfactory (grades 5 through 8) represent loans for which quality is considered to be satisfactory.
46

Eagle Financial Bancorp, Inc. Notes to the Consolidated Financial Statements
For the years ended December 31, 2020 and 2019 (Amounts in thousands, except share and per share data)
The following tables present the credit risk profile of the Company’s loan portfolio based on rating category and payment activity as of December 31, 2020 and 2019:
December 31, 2020
Residential Mortgage
Loans
Commercial Real Estate and Land
Loans
Home Equity and Other Consumer
Residential Construction
Loans
Residential Mortgage Loans
Non-Owner Occupied
Multi-Family Real Estate
LoansSBA PPP
LoansCommercial
Loans TotalRating
Satisfactory (5-8) $ 58,771 $ 17,385 $ 7,065 $ 10,667 $ 3,740 $ 1,352 $ 20,393 $ 3,615 $ 122,988 Special mention (1) - 1,733 - - - - - 1,148 2,881 Substandard (2) 507 1,751 112 - - - - 435 2,805 Doubtful (3) - - - - - - - - - Loss (4) - - - - - - - - -
Total $ 59,278 $ 20,869 $ 7,177 $ 10,667 $ 3,740 $ 1,352 $ 20,393 $ 5,198 $ 128,674
December 31, 2019
Residential Mortgage
Loans
Commercial Real Estate and Land
Loans
Home Equity and Other Consumer
Residential Construction
Loans
Residential Mortgage Loans
Non-Owner Occupied
Multi-Family Real Estate
LoansCommercial
Loans TotalRating
Satisfactory (5-8) $ 59,395 $ 20,611 $ 9,566 $ 11,684 $ 5,033 $ 1,065 $ 5,773 $ 113,127 Special mention (1) - - - - - - - - Substandard (2) 464 189 124 - 489 - 148 1,414 Doubtful (3) - - - - - - - - Loss (4) - - - - - - - -
Total $ 59,859 $ 20,800 $ 9,690 $ 11,684 $ 5,522 $ 1,065 $ 5,921 $ 114,541
47

Eagle Financial Bancorp, Inc. Notes to the Consolidated Financial Statements
For the years ended December 31, 2020 and 2019 (Amounts in thousands, except share and per share data)
The following tables present the Company’s loan portfolio aging analysis as of December 31, 2020 and 2019:
December 31, 202030-59 Days Past Due
60-89 Days Past Due
90 Days Past Due or
More
Total Past Due Current
Total Loans
Receivable
Recorded Investment 90
Days and Accruing
Residential mortgage loans -$ 117$ 309$ 426$ 58,852$ 59,278$ -$ Commercial real estate and land loans 1,571 - - 1,571 19,298 20,869 - Home equity and other consumer - - - - 7,177 7,177 - Residential construction loans - - - - 10,667 10,667 - Residential mortgage loans, non-owner occupied - - - - 3,740 3,740 - Multi-family real estate loans - - - - 1,352 1,352 - SBA PPP Loans - - - - 20,393 20,393 - Commercial loans - - 428 428 4,770 5,198 -
Total 1,571$ 117$ 737$ 2,425$ 126,249$ 128,674$ -$
December 31, 201930-59 Days Past Due
60-89 Days Past Due
90 Days Past Due or
More
Total Past Due Current
Total Loans
Receivable
Recorded Investment 90
Days and Accruing
Residential mortgage loans 75$ -$ 364$ 439$ 59,420$ 59,859$ -$ Commercial real estate and land loans - - - - 20,800 20,800 - Home equity and other consumer 6 18 - 24 9,666 9,690 - Residential construction loans - - - - 11,684 11,684 - Residential mortgage loans, non-owner occupied - - 489 489 5,033 5,522 - Multi-family real estate loans - - - - 1,065 1,065 - Commercial loans - - - - 5,921 5,921 -
Total 81$ 18$ 853$ 952$ 113,589$ 114,541$ -$
A loan is considered impaired, in accordance with the impairment accounting guidance (ASC 310-10-35-16), when based on current information and events, it is probable the Company will be unable to collect all amounts due from the borrower in accordance with the contractual terms of the loan.
48

Eagle Financial Bancorp, Inc. Notes to the Consolidated Financial Statements
For the years ended December 31, 2020 and 2019 (Amounts in thousands, except share and per share data)
The following tables present impaired loans as of December 31, 2020 and 2019:
AverageUnpaid Investment Interest
Recorded Principal Allocated in Impaired IncomeDecember 31, 2020 Balance Balance Allowance Loans Recognized
Loans without an allocated allowance:Residential mortgage loans 68$ 68$ -$ 270$ 4$ Commercial real estate and land loans 1,571 1,571 - 1,571 51 Home equity and other consumer 35 35 - 37 2 Residential construction loans - - - - - Residential mortgage loans, non-owner occupied 174 174 - 504 9 Multi-family real estate loans - - - - - SBA PPP loans - - - - - Commercial loans 428 428 - 428 7
Loans with an allocated allowance:Residential mortgage loans - - - - - Commercial real estate and land loans - - - - - Home equity and other consumer - - - - - Residential construction loans - - - - - Residential mortgage loans, non-owner occupied - - - - - Multi-family real estate loans - - - - - SBA PPP loans - - - - - Commercial loans - - - - -
Total 2,276$ 2,276$ -$ 2,810$ 73$
AverageUnpaid Investment Interest
Recorded Principal Allocated in Impaired IncomeDecember 31, 2019 Balance Balance Allowance Loans Recognized
Loans without an allocated allowance:Residential mortgage loans 71$ 71$ -$ 73$ 4$ Commercial real estate and land loans - - - - - Home equity and other consumer 39 39 - 41 2 Residential construction loans - - - - - Residential mortgage loans, non-owner occupied 671 671 - 307 19 Multi-family real estate loans - - - - - Commercial loans - - - - -
Loans with an allocated allowance:Residential mortgage loans 34 34 11 8 1 Commercial real estate and land loans - - - - - Home equity and other consumer - - - - - Residential construction loans - - - - - Residential mortgage loans, non-owner occupied - - - - - Multi-family real estate loans - - - - - Commercial loans - - - - -
Total 815$ 815$ 11$ 429$ 26$
Interest income recognized is not materially different than interest income that would have been recognized on a cash basis.
49

Eagle Financial Bancorp, Inc. Notes to the Consolidated Financial Statements
For the years ended December 31, 2020 and 2019 (Amounts in thousands, except share and per share data)
The following table presents the Company’s nonaccrual loans at December 31, 2020 and 2019. This table excludes performing troubled debt restructurings.
2020 2019Residential mortgage loans 309$ 364$ Commercial real estate and land loans - - Home equity and other consumer - - Residential construction loans - - Residential mortgage loans, non-owner occupied - 489 Multi-family real estate loans - - SBA PPP Loans - - Commercial loans 428 -
Total 737$ 853$
December 31,
50

Eagle Financial Bancorp, Inc. Notes to the Consolidated Financial Statements
For the years ended December 31, 2020 and 2019 (Amounts in thousands, except share and per share data)
Following is a summary of troubled debt restructurings at December 31, 2020 and 2019:
Number of Contracts
Recorded Investment
At December 31, 2020Residential mortgage loans 1 68$ Commercial real estate and land loans - - Home equity and other consumer 2 35 Residential construction loans - - Residential mortgage loans, non-owner occupied 4 174 Multi-family real estate loans - - Commercial loans - -
7 277$
At December 31, 2019Residential mortgage loans 1 71$
Commercial real estate and land loans - - Home equity and other consumer 2 39 Residential construction loans - - Residential mortgage loans, non-owner occupied 4 182 Multi-family real estate loans - - Commercial loans - -
7 292$
As of December 31, 2020, the Company had total troubled debt restructurings of $277. There were five residential mortgage loans and residential non-owner occupied loans totaling $242 in troubled debt restructurings with the largest totaling $68. The remaining $35 in troubled debt restructurings consisted of two home equity loans. As of December 31, 2019, the Company had total troubled debt restructurings of $292. There were five residential mortgage loans and residential non-owner occupied loans totaling $253 in troubled debt restructurings with the largest totaling $71. The remaining $39 in troubled debt restructurings consisted of two home equity loans. These loans were modified due to short term concessions. The Company made no commitments to lend additional funds to these debtors owing receivables whose terms have been modified in troubled debt restructurings.
During the year ended December 31, 2020 one owner-occupied residential loan for $347,000 was modified as a troubled debt restructuring. That loan was subsequently paid off during the year. During the year ended December 31, 2019 there were no loans modified as troubled debt restructurings.
51

Eagle Financial Bancorp, Inc. Notes to the Consolidated Financial Statements
For the years ended December 31, 2020 and 2019 (Amounts in thousands, except share and per share data)
Loans to executive officers, directors and their affiliates of the Company for the years ended December 31, 2020 and 2019 are summarized as follows:
2019 2019
Balance, beginning of year 59$ 79$ Loan disbursements - - Principal repayments (4) (20) Balance, end of year 55$ 59$
December 31,
At December 31, 2020 and 2019, there was an additional $50 in available credit on loans to executive officers, directors and their affiliates.
In management’s opinion, such loans and other extensions of credit were made in the ordinary course of business and were made on substantially the same terms (including interest rates and collateral) as those prevailing at the time for comparable transactions with other persons. Further, in management’s opinion, these loans did not involve more than normal risk of collectability or present other unfavorable features.
Note 4: Premises and Equipment
Major classifications of premises and equipment, stated at cost, at December 31, 2020 and 2019, are as follows:
2020 2019
Land 1,169$ 1,169$ Buildings and improvements 3,677 3,629Furniture, fixtures and equipment 2,048 1,865
6,894 6,663 Less accumulated depreciation 2,796 2,601
Net premises and equipment 4,098$ 4,062$
December 31,
Depreciation expense for the years ended December 31, 2020 and 2019 was $195 and $199, respectively.
52

Eagle Financial Bancorp, Inc. Notes to the Consolidated Financial Statements
For the years ended December 31, 2020 and 2019 (Amounts in thousands, except share and per share data)
Note 5: FHLB Lender Risk Account (LRA) Receivable
The Company has an established LRA with the FHLB of Cincinnati consisting of amounts withheld from loan sale proceeds by the FHLB for absorbing inherent losses that are probable on sold loans. The funds withheld to settle these inherent losses that are probable totaled $7,064 and $6,191 at December 31, 2020 and 2019, respectively; however, these receivables are recorded at fair value at the time of sale, which includes consideration for inherent losses that are probable. In the event that the credit losses do not exceed the withheld funds, the LRA agreements provide for payment of these funds from the FHLB to the Company in 26 annual installments, beginning five years after the sale date. The carrying value of the LRA totaled $4,420 and $3,646 at December 31, 2020 and 2019, respectively. The Company had mandatory delivery contracts outstanding of $18,524 at December 31, 2020.
Note 6: Foreclosed Real Estate Held for Sale, Net
Foreclosed real estate held for sale, net is summarized as follows:
2020 2019
Owner-occupied residential real estate 34$ -$ 34$ -$
December 31,
At December 31, 2020 foreclosed real estate included one owner-occupied residential property totaling $34. At December 31, 2019 there was no foreclosed real estate.
Activity in foreclosed real estate held for sale, net is summarized as follows:
2020 2019
Balance, beginning of year -$ 217$ Foreclosures 477 - Proceeds from sale (490) (245) Loans to facilitate sales - - Impairment - - Gain on sale 47 28 Balance, end of year 34$ -$
December 31,
At December 31, 2020 the Company had two commercial real estate loans in the process of foreclosure totaling $2.0 million.
53
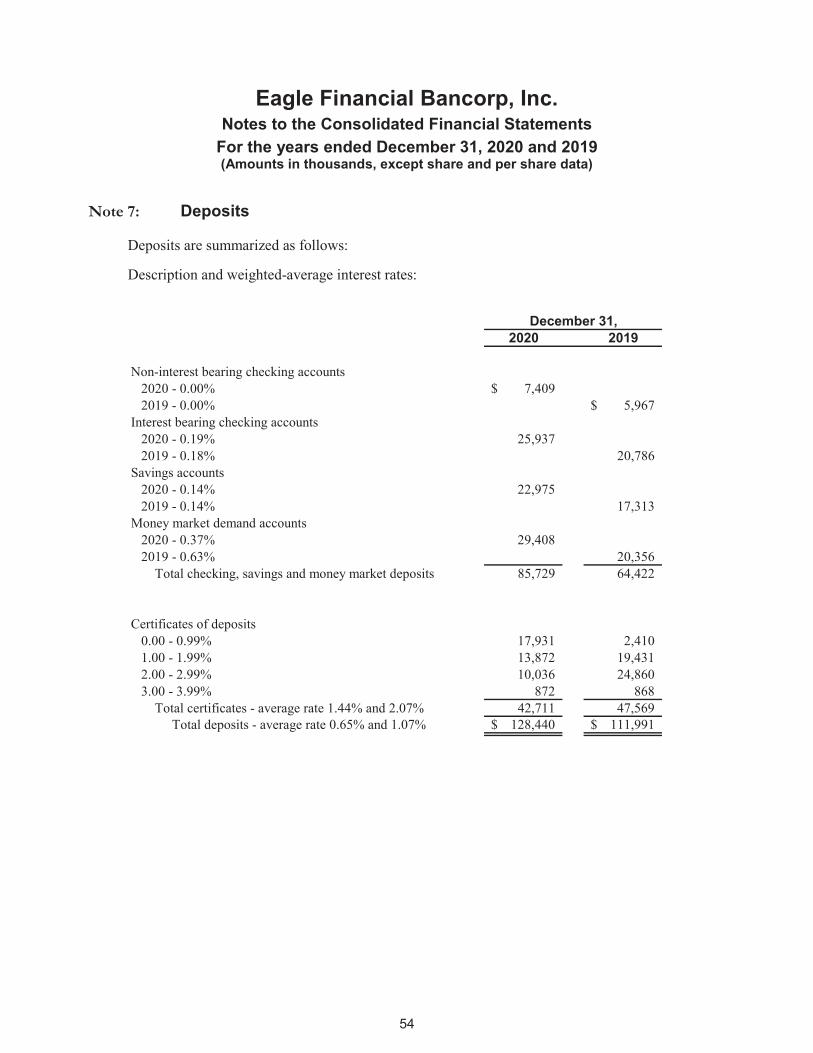
Eagle Financial Bancorp, Inc. Notes to the Consolidated Financial Statements
For the years ended December 31, 2020 and 2019 (Amounts in thousands, except share and per share data)
Note 7: Deposits
Deposits are summarized as follows:
Description and weighted-average interest rates:
2020 2019
Non-interest bearing checking accounts 2020 - 0.00% 7,409$ 2019 - 0.00% 5,967$ Interest bearing checking accounts 2020 - 0.19% 25,937 2019 - 0.18% 20,786 Savings accounts 2020 - 0.14% 22,975 2019 - 0.14% 17,313 Money market demand accounts 2020 - 0.37% 29,408 2019 - 0.63% 20,356 Total checking, savings and money market deposits 85,729 64,422
Certificates of deposits 0.00 - 0.99% 17,931 2,410 1.00 - 1.99% 13,872 19,431 2.00 - 2.99% 10,036 24,860 3.00 - 3.99% 872 868 Total certificates - average rate 1.44% and 2.07% 42,711 47,569 Total deposits - average rate 0.65% and 1.07% 128,440$ 111,991$
December 31,
54

Eagle Financial Bancorp, Inc. Notes to the Consolidated Financial Statements
For the years ended December 31, 2020 and 2019 (Amounts in thousands, except share and per share data)
At December 31, 2020, the scheduled maturities of certificates of deposits are summarized as follows:
December 31,2020
2021 27,530$ 2022 6,691 2023 1,705 2024 3,985 2025 2,800
42,711$
Certificates of deposits in denominations of $250 or more were $3,133 and $5,018 at December 31, 2020 and 2019, respectively. There were no brokered deposits at December 31, 2020 and 2019. Under the Federal Deposit Insurance Act and the FDIC’s implementing regulations, $250 is the standard maximum deposit insurance amount for deposits in an insured depository institution that are maintained in the same ownership right and capacity. Deposits maintained in different rights and capacities are insured separately from each other.
Deposits from executive officers, directors and affiliates held by the Bank at December 31, 2020 and 2019 totaled $1,346 and $576, respectively.
Interest expense on deposits is summarized as follows:
2020 2019
Checking accounts 43$ 33$ Savings accounts 28 24 Money market demand accounts 121 91 Certificates of deposits 810 957
1,002$ 1,105$
Years Ended December 31,
55

Eagle Financial Bancorp, Inc. Notes to the Consolidated Financial Statements
For the years ended December 31, 2020 and 2019 (Amounts in thousands, except share and per share data)
Note 8: FHLB Advances
The Bank had no advances from the Federal Home Loan Bank at December, 31 2020 and 2019. At December 31, 2020, the Bank had an additional $47.3 million of available borrowing capacity.
At December 31, 2020 the Bank had an unused line of credit with the Federal Home Loan Bank of $25.0 million.
Note 9: Income Taxes
The provision for income taxes includes these components:
2020 2019
Federal taxes currently payable 748$ 395$ Federal deferred income taxes (172) (208)
Federal income tax expense 576$ 187$
Years Ended December 31,
In lieu of state income taxes, the Company pays a franchise tax. Franchise taxes for 2020 and 2019 were $160 and $222, respectively.
56

Eagle Financial Bancorp, Inc. Notes to the Consolidated Financial Statements
For the years ended December 31, 2020 and 2019 (Amounts in thousands, except share and per share data)
A reconciliation of federal income tax expense at the statutory rate to the Company’s actual federal income tax expense is shown below:
2020 2019
Computed at the statutory rate of 21% 559$ 177$ Increase (decrease) resulting from
Tax-exempt BOLI income (9) (10) Incentive Stock Options 16 16 ESOP 8 7 Other 2 (3)
Actual federal income tax expense 576$ 187$
Years Ended December 31,
The tax effects of temporary differences related to the deferred federal tax asset (liability) shown on the balance sheets were:
2020 2019
Deferred tax assetsAllowance for loan losses 291$ 245$ Deferred compensation 315 282 Charitable contributions - 20 Non-Incentive Stock Options 18 10 Restricted stock and 83B elections 1 - Other assets - 33
625 590 Deferred tax liabilities
FHLB stock basis difference (87) (87) Depreciation (119) (92) Restricted stock and 83B elections (1) (1) Prepaid expenses (5) - FHLB lender risk account receivable (164) (333)
(376) (513)
Net deferred federal tax asset 249$ 77$
December 31,
57

Eagle Financial Bancorp, Inc. Notes to the Consolidated Financial Statements
For the years ended December 31, 2020 and 2019 (Amounts in thousands, except share and per share data)
Retained earnings at December 31, 2020 and 2019, includes approximately $559, for which no deferred federal income tax liability has been recognized. This amount represents an allocation of income to bad debt deductions for tax purposes only. Reduction of amounts so allocated for purposes other than tax bad debt losses or adjustments arising from carryback of net operating losses would create income for tax purposes only, which would be subject to the then-current corporate income tax rate. The deferred federal income tax liabilities on the preceding amount that would have been recorded if they were expected to reverse into taxable income in the foreseeable future was approximately $117 at December 31, 2020 and 2019.
Note 10: Regulatory Matters
The Bank is subject to various regulatory capital requirements administered by the federal banking agencies. Failure to meet minimum capital requirements can initiate certain mandatory and possibly additional discretionary actions by regulators that, if undertaken, could have a direct material effect on the Bank’s financial statements. Under capital adequacy guidelines and the regulatory framework for prompt corrective action, the Bank must meet specific capital guidelines that involve quantitative measures of the Bank’s assets, liabilities and certain off-balance-sheet items as calculated under United States Generally Accepted Accounting Principles, regulatory reporting requirements and regulatory capital standards. The Bank’s capital amounts and classification are also subject to qualitative judgments by the regulators about components, risk weightings and other factors. Furthermore, the Bank’s regulators could require adjustments to regulatory capital not reflected in these financial statements.
Quantitative measures established by regulatory reporting standards, to ensure capital adequacy require the Bank to maintain minimum amounts and ratios (set forth in the table below) of Total capital (as defined), Tier I capital (as defined) and common equity Tier 1capital (as defined) to risk-weighted assets (as defined) and Tier I capital (as defined) to average assets (as defined). Management believes, as of December 31, 2020 and 2019, that the Bank meets all capital adequacy requirements to which it is subject.
As of December 31, 2020 and 2019, the most recent notification from the Bank’s regulators categorized the Bank as well capitalized under the regulatory framework for prompt corrective action. To be categorized as well capitalized, the Bank must maintain minimum total risk-based capital, Tier I risk-based capital, common equity Tier 1 risk-based capital and Tier I leverage ratios as set forth in the table. There are no conditions or events since that notification that management believes have changed the Bank’s category.
In addition to the minimum capital ratios, the Bank must maintain a capital conservation buffer of common equity Tier 1 capital in an amount greater than 2.5% of total risk-weighted assets to avoid being subject to limitations on capital distributions and discretionary bonuses.
As a result of the recently enacted Economic Growth, Regulatory Relief, and Consumer Protection Act (the “Act”), banking regulatory agencies including the Federal Reserve Board must establish for institutions with less than $10 billion of assets a “community bank leverage ratio” of tangible equity capital to total average consolidated assets of between 8 to 10%. Institutions with capital meeting the specified requirement and electing to follow the alternative regulatory capital structure will be considered to comply with the applicable regulatory capital requirements, in1cluding the risk-based requirements. The establishment of the community bank leverage ratio is subject to
58

Eagle Financial Bancorp, Inc. Notes to the Consolidated Financial Statements
For the years ended December 31, 2020 and 2019 (Amounts in thousands, except share and per share data)
notice and comment rulemaking by the federal regulators and the agencies issued a proposed rule in February 2019 that would set the “community bank leverage ratio” at 9%.
In addition, as a result of the Act, the Federal Reserve Board has amended its small bank holding company and savings and loan holding company policy statement to provide that holding companies with consolidated assets of less than $3 billion that are (i) not engaged in significant nonbanking activities, (ii) do not conduct significant off-balance sheet activities, and (3) do not have a material amount of SEC-registered debt or equity securities, other than trust preferred securities, that contribute to an organization’s complexity, are not subject to consolidated regulatory capital requirements.
59

Eagle Financial Bancorp, Inc. Notes to the Consolidated Financial Statements
For the years ended December 31, 2020 and 2019 (Amounts in thousands, except share and per share data)
The Bank’s actual capital amounts and ratios are presented in the following tables (minimum capital requirements exclude the capital conservation buffer):
As of December 31, 2020 Amount Ratio Amount Ratio Amount Ratio
Equity $ 24,550 Allowance for loan losses 1,386
Total risk-based capital(to risk-weighted assets) $ 25,936
Tier I capital(to risk-weighted assets)
Common equity Tier I capital(to risk-weighted assets)
Tier I capital(to adjusted total assets) 6,318 7,897 24,550 4.0%
10.0%
15.5% 5.0%
24,550 17.3%
8,508
6,381 4.5%
24,550
Minimum to Be Well Capitalized Under Prompt Corrective Action Provisions
18.3% $ 11,344 8.0%
Actual
11,344
Minimum Capital Requirement
8.0%6.0%
9,217 6.5%
17.3%
$ 14,181
As of December 31, 2019 Amount Ratio Amount Ratio Amount Ratio
Equity $ 22,013 Allowance for loan losses 1,166
Total risk-based capital(to risk-weighted assets) $ 23,179
Tier I capital(to risk-weighted assets)
Common equity Tier I capital(to risk-weighted assets)
Tier I capital(to adjusted total assets)
6.5%
16.3% 8,107 6.0% 10,809 8.0%
22,013 16.3% 6,080 4.5% 8,782
ActualMinimum Capital
Requirement
Minimum to Be Well Capitalized Under Prompt Corrective Action Provisions
10.0%
22,013
17.2% $ 10,809 8.0% $ 13,511
5.0% 22,013 15.4% 5,709 4.0% 7,136
60

Eagle Financial Bancorp, Inc. Notes to the Consolidated Financial Statements
For the years ended December 31, 2020 and 2019 (Amounts in thousands, except share and per share data)
Note 11: Employee Benefits
The Company has supplemental retirement plans for directors, certain senior officers and key employees. Participants in the directors plan, shall be fully vested upon retirement and will receive an annual benefit for five years equal to $1 for each year of service provided by the director to the Company. Participants in the plan for certain senior officers and key employees, upon retirement, will receive annually, for fifteen years, 45% of their final three-year annual base salary amount average. The plans are uniquely designed for each participant. The charge to expense for 2020 and 2019 for both plans was approximately $153 and $218, respectively. Such charges reflect the straight-line accrual over the period until full eligibility date at normal retirement of 66 years of age of the present value of benefits due each participant, using a 5% discount factor at both December 31, 2020 and December 31, 2019. The resulting liability at December 31, 2020 and 2019 for both plans was approximately $1,672 and $1,518, respectively. The Company purchased life insurance on the participants. The cash surrender value of such insurance was $2,049 and $2,005 at December 31, 2020 and 2019, respectively.
The Bank has a 401(k) profit-sharing plan covering substantially all employees who have attained the age of 21 and have completed one year of eligibility service. The Company may, in its sole discretion, make a matched employee contribution during the plan year in an amount as determined by the Company. The Internal Revenue Code may also further restrict matching contributions for highly compensated employees. The Company may, in its sole discretion, make a Profit Sharing Contribution to the Profit Sharing Plan. Employees will be eligible to receive an allocation if they have completed at least 1000 hours of service during the Plan Year and are employed by the Company on the last day of the Plan Year. Profit Sharing Contributions will be allocated to the Profit Sharing Contribution Accounts of each Participant eligible to share in such allocation after the end of the Plan Year. The Company’s contributions to the plan are determined annually by the Board of Directors. Contributions to the plan were $137 and $95 for the years ended December 31, 2020 and 2019, respectively.
Note 12: Equity Incentive Plan
In September 2018, the Company’s stockholders approved the Eagle Financial Bancorp, Inc. 2018 Equity Incentive Plan (the “2018 Plan”). The 2018 Plan authorizes the issuance or delivery to participants of up to 225,792 shares of the Company’s common stock pursuant to the grants of restricted stock awards, incentive stock options, and non-qualified stock options. Of this number, the maximum number of shares of Company common stock that may be issued under the 2018 Plan pursuant to the exercise of stock options is 161,280 shares and the maximum number of shares of Company common stock that may be issued as restricted stock awards is 64,512 shares. Stock options awarded to employees may be incentive stock options or non-qualified stock options. Shares awarded under the 2018 Plan may be authorized but unissued shares or treasury shares. The 2018 Plan contains annual and lifetime limits on certain types of awards to individual participants.
Awards may vest or become exercisable only upon the achievement of performance measures or based solely on the passage of time after award. Stock options and restricted stock awards provide for accelerated vesting if there is a change in control (as defined in the 2018 Plan).
61

Eagle Financial Bancorp, Inc. Notes to the Consolidated Financial Statements
For the years ended December 31, 2020 and 2019 (Amounts in thousands, except share and per share data)
In September 2018, the Company granted stock options for 32,255 shares to members of the Board of Directors. Awards under the Plan were granted with a vesting rate not exceeding twenty percent (20%) per year for five years. Options granted in September 2018 have an exercise price $15.89, as determined on the grant date and expire ten years from the grant date.
The fair value was calculated using the Black-Scholes model for stock options granted in September 2018 using the following assumptions: expected volatility of 24.56%, a risk free interest rate of 3.01%, and an expected term of 7.5 years. The Company utilized the simplified method to determine the expected term because it does not have sufficient historical exercise data to provide a reasonable basis upon which to estimate the expected term.
The weighted average grant-date fair value of options granted in September 2018 was $5.57 per share.
In October 2018, the Company granted stock options for 69,356 shares to Executive Officers of the Company. Awards under the Plan were granted with a vesting rate not exceeding twenty percent (20%) per year for five years. Options granted in October 2018 have an exercise price $15.75, as determined on the grant date and expire ten years from the grant date.
The fair value was calculated using the Black-Scholes model for stock options granted in September 2018 using the following assumptions: expected volatility of 24.63%, a risk free interest rate of 3.14%, and an expected term of 7.5 years. The Company utilized the simplified method to determine the expected term because it does not have sufficient historical exercise data to provide a reasonable basis upon which to estimate the expected term.
The weighted average grant-date fair value of options granted in October 2018 was $5.59 per share.
At December 31, 2020, 12,900 of the stock options granted to the Board of Directors were exercisable at an average price of $15.89, and 27,742 of the stock options granted to the Executive Officers were exercisable at an average price of $15.75. At December 31, 2020, no stock options were exercised.
62

Eagle Financial Bancorp, Inc. Notes to the Consolidated Financial Statements
For the years ended December 31, 2020 and 2019 (Amounts in thousands, except share and per share data)
The table below represents the stock option activity for the period shown:
RemainingWeighted-Average Contractual Life
Options Exercise Price (Years)
Options outstanding at January 1, 2020 101,611 15.79$ 3.7
Granted - - -
Exercised - - - Forfeited - - - Expired - - -
Options outstanding at December 31, 2020 101,611 15.79$ 2.7
Options Exercisable at December 31, 2020 40,642 15.79$ 2.7
Options outstanding at January 1, 2019 101,611 15.79$ 4.7
Granted - - -
Exercised - - - Forfeited - - - Expired - - -
Options outstanding at December 31, 2019 101,611 15.79 3.7
Options Exercisable at December 31, 2019 20,321 15.79$ 3.7
In September 2018, the Company awarded 12,900 restricted shares to members of the Board of Directors. The restricted stock awards have a five year vesting period. During the restricted period, the holder is entitled to full voting rights and dividends, thus are considered participating securities. At December 31, 2020, 5,160 restricted shares awarded to the Board of Directors were vested.
In October 2018, the Company awarded 29,050 restricted shares to Executive Officers and other employees of the Company. The restricted stock awards have a five year vesting period. During the restricted period, the holder is entitled to full voting rights and dividends, thus are considered participating securities. At December 31, 2020, 11,620 restricted shares awarded to Executive Officers were vested.
63

Eagle Financial Bancorp, Inc. Notes to the Consolidated Financial Statements
For the years ended December 31, 2020 and 2019 (Amounts in thousands, except share and per share data)
The table below presents the restricted stock activity for the period shown:
Weighted-AverageRestricted grant date
stock awards fair value
Non-vested at January 1, 2020 33,560 15.79$
Granted - - Vested 8,390 16.37 Forfeited - -
Non-vested at December 31, 2020 25,170 15.79$
Weighted-AverageRestricted grant date
stock awards fair value
Non-vested at January 1, 2019 41,950 15.79$
Granted - - Vested 8,390 15.95 Forfeited - -
Non-vested at December 31, 2019 33,560 15.79$
Total compensation cost recognized in the income statement for share-based payment arrangements during 2020 and 2019 was $246 each year.
As of December 31, 2020, there was approximately $670 of total unrecognized compensation cost related to unvested share-based compensation arrangements granted under the Plan. That cost is expected to be recognized over a remaining weighted-average period of 2.7 years.
Note 13: Employee Stock Ownership Plan
In connection with the conversion to an entity owned by stockholders, the Company established an Employee Stock Ownership Plan (“ESOP”) for the exclusive benefit of eligible employees. The ESOP borrowed funds from the Company in an amount sufficient to purchase 129,024 shares (approximately 8.0% of the common stock sold in the stock offering). The loan is secured by the shares purchased and will be repaid by the ESOP with funds from contributions made by the Company and dividends received by the ESOP. Contributions will be applied to repay interest on the loan first, then the remainder will be applied to principal. The loan is expected to be repaid over a period of up to 20 years. Shares purchased with the loan proceeds are held in a suspense account for allocation among participants as the loan is repaid. Contributions to the ESOP and shares released from the suspense
64

Eagle Financial Bancorp, Inc. Notes to the Consolidated Financial Statements
For the years ended December 31, 2020 and 2019 (Amounts in thousands, except share and per share data)
account are allocated among participants in proportion to their compensation, relative to total compensation of all active participants. Participants will vest in their accrued benefits under the ESOP at the rate of 20 percent per year after two years of service. Vesting is accelerated upon retirement, death or disability of the participant, or a change in control of the Company. Forfeitures will be reallocated to remaining participants. Benefits may be payable upon retirement, death, disability, separation of service, or termination of the ESOP.
The debt of the ESOP is eliminated in consolidation. Contributions to the ESOP shall be sufficient to pay principal and interest currently due under the loan agreement. As shares are committed to be released from collateral, the Company reports the compensation expense equal to the average market price of the shares for the respective period, and the shares become outstanding for earnings per share computations. Dividends on unallocated ESOP shares, if any, are recorded as a reduction of debt and accrued interest. ESOP compensation was $104 and $102 for the years ended December 31, 2020 and 2019, respectively.
A summary of the ESOP shares as of December 31 are as follows:
Year Ended Year EndedDecember 31, 2020 December 31, 2019
Shares released to participants 6,451 6,451Shares allocated to participants 19,353 12,902Unreleased shares 103,220 109,671Total 129,024 129,024
Fair Value of unreleased shares 1,699,001$ 1,738,285$
In the event the ESOP is unable to satisfy the obligation to repurchase the shares held by each beneficiary upon the beneficiary’s termination or retirement, the Company is obligated to repurchase the shares. In addition, there are no outstanding shares held by former employees that are subject to an ESOP related repurchase option.
Note 14: Operating Leases (Lessee)
The Company has a noncancellable operating lease for a branch that expires in 2025. The remaining future minimum lease payments for 2020 through 2025 are $189. Rental expense for this lease was $46, and $45 for both years ended December 31, 2020 and 2019.
65

Eagle Financial Bancorp, Inc. Notes to the Consolidated Financial Statements
For the years ended December 31, 2020 and 2019 (Amounts in thousands, except share and per share data)
Future minimum lease payments at December 31, 2020 are:
2021 42 2022 42 2023 42 2024 42 2025 21
Total minimum lease payments 189$
Note 15: Operating Leases (Lessor)
The Company has entered into agreements as lessor for office space for its main corporate building. The leases all have an initial term of five years with options to renew at various terms. Rental income for these leases, included in occupancy and equipment, net of noninterest expense, was approximately $132 and $178 for the years ended December 3, 2020 and 2019, respectively.
Future minimum payments to be received at December 31, 2020 are:
2021 27 2022 14 2023 14
Total minimum lease receipts 55$
Note 16: Disclosures About Fair Value of Assets and Liabilities
ASC Topic 820, Fair Value Measurements, defines fair value as the price that would be received to sell an asset or paid to transfer a liability in an orderly transaction between market participants at the measurement date. Topic 820 also specifies a fair value hierarchy which requires an entity to maximize the use of observable inputs and minimize the use of unobservable inputs when measuring fair value. The standard describes three levels of inputs that may be used to measure fair value:
Level 1 Quoted prices in active markets for identical assets or liabilities
Level 2 Observable inputs other than Level 1 prices, such as quoted prices for similar assets or liabilities; quoted prices in markets that are not active; or other inputs that are observable or can be corroborated by observable market data for substantially the full term of the assets or liabilities
Level 3 Unobservable inputs that are supported by little or no market activity and that are significant to the fair value of the assets or liabilities
66

Eagle Financial Bancorp, Inc. Notes to the Consolidated Financial Statements
For the years ended December 31, 2020 and 2019 (Amounts in thousands, except share and per share data)
Nonrecurring Measurements
The following table presents the fair value measurement of assets measured at fair value on a nonrecurring basis and the level within the fair value hierarchy in which the fair value measurements fall at December 31, 2020 and 2019:
Quoted Prices in Active Markets
for Identical Assets
Significant Other
Observable Inputs
Significant Unobservable
InputsDecember 31, 2020 (Level 1) (Level 2) (Level 3)
Impaired loans (collateral dependent) 68$ -$ -$ 68$
Fair Value Measurements Using
Fair Value
Quoted Prices in Active Markets
for Identical Assets
Significant Other
Observable Inputs
Significant Unobservable
InputsDecember 31, 2019 (Level 1) (Level 2) (Level 3)
Impaired loans (collateral dependent) 105$ -$ -$ 105$
Fair Value Measurements Using
Fair Value
Following is a description of the valuation methodologies and inputs used for assets measured at fair value on a nonrecurring basis and recognized in the accompanying balance sheets, as well as the general classification of such assets pursuant to the valuation hierarchy. For assets classified within Level 3 of the fair value hierarchy, the process used to develop the reported fair value is described below.
Collateral-dependent Impaired Loans, Net of ALLL
The estimated fair value of collateral-dependent impaired loans is based on the appraised fair value of the collateral, less estimated cost to sell. Collateral-dependent impaired loans are classified within Level 3 of the fair value hierarchy. The Bank considers the appraisal or evaluation as the starting point for determining fair value and then considers other factors and events in the environment that may affect the fair value. Appraisals of the collateral underlying collateral-dependent loans are obtained when the loan is determined to be collateral-dependent and subsequently as deemed necessary. Appraisals are reviewed for accuracy and consistency by the lending department. Appraisers are selected from the list of approved appraisers maintained by management. The appraised values are reduced by discounts to consider lack of marketability and estimated cost to sell if repayment or satisfaction of the loan is dependent on the sale of the collateral. These discounts and estimates are developed by comparison to historical results.
67

Eagle Financial Bancorp, Inc. Notes to the Consolidated Financial Statements
For the years ended December 31, 2020 and 2019 (Amounts in thousands, except share and per share data)
Unobservable (Level 3) Inputs
The following table presents quantitative information about unobservable inputs used in nonrecurring Level 3 fair value measurements.
Fair Value at Valuation12/31/2020 Technique Unobservable Inputs Range
Impaired loans (collateral dependent) 68$ Market comparable properties Marketability discount 10% - 15%
Fair Value at Valuation12/31/2019 Technique Unobservable Inputs Range
Impaired loans (collateral dependent) 105$ Market comparable properties Marketability discount 10% - 15%
The following methods were used to estimate the fair value of all other financial instruments recognized in the accompanying consolidated balance sheets at amounts other than fair value.
Cash and Cash Equivalents and Interest-bearing Time Deposits in other Banks
The carrying amount approximates fair value.
Loans Held For Sale
The carrying amount approximates fair value due to the insignificant time between origination and date of sale. The carrying amount is the amount funded.
Loans
The estimated fair value of loans as of December 31, 2020 and 2019 follows the guidance in ASU 2016-01, which prescribes an “exit price” approach in estimating and disclosing fair value of financial instruments. The fair value calculation at that date discounted estimated future cash flows using rates that incorporated discounts for credit, liquidity and marketability factors.
FHLB Stock
Fair value is estimated at book value due to restrictions that limit the sale or transfer of such securities.
FHLB Lender Risk Account Receivable
The fair value of the Federal Home Loan Bank lender risk account receivable is estimated by discounting the estimated remaining cash flows of each strata of the receivable at current rates applicable to each strata for the same remaining maturities.
Accrued Interest Receivable and Payable
The carrying amount approximates fair value. The carrying amount is determined using the interest rate, balance and last payment date.
68

Eagle Financial Bancorp, Inc. Notes to the Consolidated Financial Statements
For the years ended December 31, 2020 and 2019 (Amounts in thousands, except share and per share data)
Deposits
Fair value of term deposits is estimated by discounting the future cash flows using rates of similar deposits with similar maturities. The market rates used were obtained from a knowledgeable independent third party and reviewed by the Company. The rates were the average of current rates offered by local competitors of the Company.
The estimated fair value of checking, NOW, savings and money market deposits is the book value since rates are regularly adjusted to market rates and amounts are payable on demand at the reporting date.
Advances from Borrowers for Taxes and Insurance
The carrying amount approximates fair value.
Commitments to Originate Loans, Forward Sale Commitments, Letters of Credit and Lines of Credit
The fair value of commitments to originate loans is estimated using the fees currently charged to enter into similar agreements, taking into account the remaining terms of the agreements and the present creditworthiness of the counterparties. For fixed-rate loan commitments, fair value also considers the difference between current levels of interest rates and the committed rates. The fair value of commitments to sell securities is estimated based on current market prices for securities of similar terms and credit quality. The fair values of letters of credit and lines of credit are based on fees currently charged for similar agreements or on the estimated cost to terminate or otherwise settle the obligations with the counterparties at the reporting date. At December 31, 2020 and 2019, the fair value of such commitments was not material.
69

Eagle Financial Bancorp, Inc. Notes to the Consolidated Financial Statements
For the years ended December 31, 2020 and 2019 (Amounts in thousands, except share and per share data)
The following tables present estimated fair values of the Company’s financial instruments at December 31, 2020 and 2019.
December 31, 2020Carrying Amount
Fair Value (Level 1) (Level 2) (Level 3)
Financial AssetsCash and cash equivalents 13,585$ 13,585$ 13,585$ -$ -$ Interest-bearing time deposits 249 249 249 - - Loans held for sale 14,020 14,020 - - 14,020 Loans, net of allowance
for losses 119,398 120,276 - - 120,276 FHLB stock 1,294 1,294 - 1,294 - FHLB lender risk account receivable 4,420 4,810 - - 4,810 Interest receivable 445 445 - 445 -
Financial LiabilitiesDeposits 128,440 128,931 85,627 43,304 - Advances from borrowers
for taxes and insurance 850 850 - 850 - Interest payable 2 2 - 2 -
Fair Value Measurements Using
December 31, 2019Carrying Amount
Fair Value (Level 1) (Level 2) (Level 3)
Financial AssetsCash and cash equivalents 15,301$ 15,301$ 15,301$ -$ -$ Interest-bearing time deposits 2,988 2,988 2,988 - - Loans held for sale 6,390 6,390 - - 6,390 Loans, net of allowance
for losses 106,568 107,360 - - 107,360 FHLB stock 816 816 - 816 - FHLB lender risk account receivable 3,646 3,805 - - 3,805 Interest receivable 326 326 - 326 -
Financial LiabilitiesDeposits 111,991 112,197 64,423 47,774 - Advances from borrowers
for taxes and insurance 858 858 - 858 - Interest payable 2 2 - 2 -
Fair Value Measurements Using
70

Eagle Financial Bancorp, Inc. Notes to the Consolidated Financial Statements
For the years ended December 31, 2020 and 2019 (Amounts in thousands, except share and per share data)
Note 17: Significant Estimates and Concentrations
Accounting principles generally accepted in the United States of America require disclosure of certain significant estimates and current vulnerabilities due to certain concentrations. Estimates related to the allowance for loan losses are reflected in Note 3 regarding loans. Current vulnerabilities due to certain concentrations of credit risk are discussed in the footnote on commitments and credit risk.
At December 31, 2020 and 2019, the Company held $20,869 and $20,800, respectively, in commercial real estate and land loans collateralized by commercial real estate and land in the Cincinnati geographic area. The accompanying financial statements have been prepared using values and information currently available to the Company.
Note 18: Commitments and Credit Risk
Commitments to Originate Loans
Commitments to originate loans are agreements to lend to a customer as long as there is no violation of any condition established in the contract. Commitments generally have fixed expiration dates or other termination clauses and may require payment of a fee. Since a portion of the commitments may expire without being drawn upon, the total commitment amounts do not necessarily represent future cash requirements. Each customer’s creditworthiness is evaluated on a case-by-case basis. The amount of collateral obtained, if deemed necessary, is based on management’s credit evaluation of the counterparty. Collateral held varies, but may include accounts receivable, inventory, property, plant and equipment, commercial real estate and residential real estate.
At December 31, 2020 the bank had 11 loans totaling 1.7 million that had been closed but were yet to fund. They had interest rates ranging from 2.250% to 4.250%. At December 31, 2019 the Bank had no loans closed but yet to fund. At December 31, 2020 and 2019, the Company had undisbursed loans in process of $7,656 with interest rate ranges of 3.125% - 4.875% and $6,811 with interest rate ranges of 3.875% - 4.875%, respectively.
Lines of Credit
Lines of credit are agreements to lend to a customer as long as there is no violation of any condition established in the contract. Lines of credit generally have fixed expiration dates. Since a portion of the line may expire without being drawn upon, the total unused lines do not necessarily represent future cash requirements. Each customer’s creditworthiness is evaluated on a case-by-case basis. The amount of collateral obtained, if deemed necessary, is based on management’s credit evaluation of the counterparty. Collateral held varies but may include accounts receivable, inventory, property, plant and equipment, commercial real estate and residential real estate.
71

Eagle Financial Bancorp, Inc. Notes to the Consolidated Financial Statements
For the years ended December 31, 2020 and 2019 (Amounts in thousands, except share and per share data)
Management uses the same credit policies in granting lines of credit as it does for on-balance-sheet instruments.
Lines of credit at December 31, 2020 were as follows:
Unused lines of credit 4,582$ Standby letters of credit - Unused home equity lines 10,606
Total commitments 15,188$
Impact of COVID-19 on the Company
In March 2020, the COVID-19 coronavirus was identified as a global pandemic and began affecting the health of large populations around the world. As a result of the spread of COVID-19, economic uncertainties arose which can ultimately affect the financial position, results of operations and cash flows of the Company as well as the Company's customers. In response to economic concerns over COVID-19, in March 2020 the Coronavirus Aid, Relief, and Economic Security Act (CARES Act) was passed into law by Congress. The CARES Act included relief for individual Americans, health care workers, small businesses and certain industries hit hard by the COVID-19 pandemic. The 2021 Consolidated Appropriations Act, passed by Congress in December 2020, extended certain provisions of the CARES Act affecting the Company into 2021. The CARES Act included several provisions designed to help financial institutions like the Company in working with their customers. Section 4013 of the CARES Act, as extended, allows a financial institution to elect to suspend generally accepted accounting principles and regulatory determinations with respect to qualifying loan modifications related to COVID-19 that would otherwise be categorized as a troubled debt restructuring (TDR) until January 1, 2022. The Company has taken advantage of this provision to extend certain payment modifications to loan customers in need. As of December 31, 2020, the Company has $2.9 million of outstanding loans that were modified during 2020 under the CARES Act guidance, that remain on modified terms. The Company modified other loans during 2020 under the guidance that have since returned to normal repayment status as of December 31, 2020. The CARES Act also approved the Paycheck Protection Program (PPP), administered by the Small Business Administration (SBA) with funding provided by financial institutions. The 2021 Consolidated Appropriations Act approved a new round of PPP loans in 2021. The PPP provides loans to eligible businesses through financial institutions like the Company, with loans being eligible for forgiveness of some or all of the principal amount by the SBA if the borrower meets certain requirements. The SBA guarantees repayment of the loans to the Company if the borrower's loan is not forgiven and is then not repaid by the customer. The Company earns a 1% interest rate on PPP loans, plus a processing fee from the SBA for processing and originating a loan. The Company originated approximately $22.3 million in PPP loans during 2020, of which approximately $20.4 million are still outstanding at December 31, 2020.
72
Eagle Financial Bancorp, Inc. Notes to the Consolidated Financial Statements
For the years ended December 31, 2020 and 2019 (Amounts in thousands, except share and per share data)
Note 19: Recent Accounting Pronouncements
In February 2016, the FASB issued ASU No. 2016-02 "Leases (Topic 842)." ASU 2016-02 establishes a right of use model that requires a lessee to record a right of use asset and a lease liability for all leases with terms longer than 12 months. Leases will be classified as either finance or operating, with classification affecting the pattern of expense recognition in the income statement. For lessors, the guidance modifies the classification criteria and the accounting for sales-type and direct financing leases. A lease will be treated as sale if it transfers all of the risks and rewards, as well as control of the underlying asset, to the lessee. If risks and rewards are conveyed without the transfer of control, the lease is treated as a financing. If the lessor doesn't convey risks and rewards or control, an operating lease results. Public business entities should apply the amendments in ASU 2016-02 for fiscal years beginning after December 15, 2018, including interim periods within those fiscal years. Entities are required to use a modified retrospective approach for leases that exist or are entered into after the beginning of the earliest comparative period in the financial statements, with certain practical expedients available. The impact is not expected to have a material effect on the Company’s financial position or results of operations since the Company does not have a material amount of lease agreements. The standard is effective but was not adopted since the impact is not material to the Company’s financial position or results of operations.
In June 2016, the FASB issued ASU No. 2016-13, "Financial Instruments-Credit Losses (Topic 326) -Measurement of Credit Losses on Financial Instruments." The provisions of ASU 2016-13 were issued to provide financial statement users with more decision-useful information about the expected credit losses on financial instruments that are not accounted for at fair value through net income, including loans held for investment, held-to-maturity debt securities, trade and other receivables, net investment in leases and other commitments to extend credit held by a reporting entity at each reporting date. ASU 2016-13 requires that financial assets measured at amortized cost be presented at the net amount expected to be collected, through an allowance for credit losses that is deducted from the amortized cost basis. The amendments in ASU 2016-13 eliminate the probable incurred loss recognition in current GAAP and reflect an entity's current estimate of all expected credit losses. The measurement of expected credit losses is based upon historical experience, current conditions, and reasonable and supportable forecasts that affect the collectibility of the financial assets. For public business entities that are U.S. Securities and Exchange Commission (SEC) filers, the amendments are effective for fiscal years beginning after December 15, 2019, including interim periods within those fiscal years. For all other public business entities, the amendments were initially effective for fiscal years beginning after December 15, 2020, including interim periods within those fiscal years. On October 16, 2019 FASB voted to delay implementation of ASU No. 2016-13, "Financial Instruments-Credit Losses (Topic 326) -Measurement of Credit Losses on Financial Instruments.” For non SEC filers, the amendments are now effective for fiscal years beginning after December 15, 2022, and interim periods within fiscal years beginning after December 15, 2022. Early adoption is permitted for fiscal years, and interim periods within those fiscal years, beginning after December 15, 2018. The Company continues to evaluate the impact of these amendments to the Company’s financial position and results of operations and currently does not know or cannot reasonably quantify the impact of the adoption of the amendments as a result of the complexity and extensive changes from the amendments. The Allowance for Loan Losses (ALL) estimate is material to the Company and given the change from an incurred loss model to a methodology that considers the credit loss over the life of the loan, there is the potential for an increase in the ALL at the adoption date. The Company is anticipating a significant
73

Eagle Financial Bancorp, Inc. Notes to the Consolidated Financial Statements
For the years ended December 31, 2020 and 2019 (Amounts in thousands, except share and per share data)
change in processes and procedures to calculate the ALL, including changes in assumptions and estimates to consider the expected credit losses over the life of the loan versus the current accounting practice that utilizes the incurred loss model. In addition, the current accounting policy and procedures for the other-than temporary impairment on available-for-sale securities will be replaced with an allowance approach. The Company has continued developing processes during the fourth quarter of 2020. Management continues to focus its attention on collecting historical loan loss data, loan level data, and evaluating data capabilities to ensure it is fully compliant with the amendments at adoption date. For additional information on the allowance for loan losses, see Note 3.
74

Eagle Financial Bancorp, Inc. Notes to the Consolidated Financial Statements
For the years ended December 31, 2020 and 2019 (Amounts in thousands, except share and per share data)
Note 20: Condensed Financial Information (Parent Company Only)
Presented below is condensed financial information as to the financial position, results of operations and cash flows of the company:
Condensed Balance Sheet
2020 2019Assets
Cash $ 3,337 $ 4,658 Prepaid expenses 12 - Loan receivable - ESOP 1,085 1,132 Investment in EAGLE.bank 24,550 22,013 Deferred federal income tax - 20 Prepaid federal income tax 51 92
Total assets $ 29,035 $ 27,915
Liabilities and Shareholders' Equity
LiabilitiesTotal liabilities $ 19 $ 12
Shareholder' EquityTotal shareholders' equity 29,016 27,903
Total liabilities and shareholders' equity $ 29,035 $ 27,915
Condensed Statement of Income and Comprehensive Income
2020 2019
IncomeInterest Income - ESOP 48 50 Equity in earnings of EAGLE.bank 2,187 816
Total income 2,235 866
ExpenseLegal and professional services 85 142 Other expense 90 110
Total expense 175 252
Earnings before federal income tax benefit 2,060 614
Federal income tax benefit (24) (44)
Net Income and Comprehensive Income $ 2,084 $ 658
75

Eagle Financial Bancorp, Inc. Notes to the Consolidated Financial Statements
For the years ended December 31, 2020 and 2019 (Amounts in thousands, except share and per share data)
2020 2019
Operating ActivitiesNet income $ 2,084 $ 658 Items not requiring (providing) cash:
Equity in undistributed income of subsidiary (2,187) (816)Changes in:
Accrued expenses and other liabilities 7 12 Other assets and prepaid federal income taxes 49 20
Net cash flows used in operating activities (47) (126)
Investing ActivitiesPayments received on ESOP loan 47 45
Net cash provided by investing activities 47 45
Financing ActivitiesDividends paid (232) - Repurchase of common stock (1,089) (877)
Net cash used in financing activities (1,321) (877)
Decrease in Cash and Cash Equivalents (1,321) (958)
Cash and Cash Equivalents, Beginning of Year 4,658 5,616
Cash and Cash Equivalents, End of Year $ 3,337 $ 4,658
Condensed Statement of Cash Flows
Note 21: Subsequent Events
Subsequent events have been evaluated through March 5, 2021 which is the date the financial statements were available to be issued.
76

Cincinnati
Cincinnati
ButlerCounty
WarrenCounty
DearbornCounty
ClermontCounty
HamiltonCounty
CampbellCounty
KentonCounty
BooneCounty
OHIO
KENTUCKY
INDIANA
75
71
275
71
74
23
Eagle Savings BankMain Office - Bridgetown6415 Bridgetown RoadCincinnati, OhioDelhi5681 Rapid Run RoadCincinnati, OhioHyde Park3420 Edwards RoadCincinnati, Ohio
2
3
OHIO
KENTUCKY
INDIANA
