2021 mercer science and engineering fair research report
TRANSCRIPT

2021 Mercer Science and Engineering Fair Research Report
Modeling COVID-19 Transmission in Aircraft Cabin by Integrating Particle Dynamics, Dilution Effect,
and Risk Assessment
Xinkai Yu Princeton International School of Mathematics and Science

1
Abstract
Taking airplanes is crucial for many people’s lives, so passengers’ risks of getting
Covid-19 are necessary to be considered. To get a more comprehensive view of the risk
of taking airplanes with the possible existence of Covid-19 infected passengers, we
conducted a project aiming to assess Covid-19 infection risk in aircraft cabins and
propose possible measures and modifications that can be implemented to improve the
safety of air travel under the pandemic of COVID-19. By developing models that are
capable to simulate the fields inside of the cabin and introducing the concept of dilution
ratio, the infection risk at different locations inside the aircraft cabin can be estimated.
By using the model, several cabin circumstances such as wearing different types of face
masks or having different sitting patterns of passengers are considered respectively, and
the risk distributions are also found out. Results show that rather than spreading through
the entire cabin, the virus-laden bioaerosols exhaled from infectors are restricted to
limited zones. As a result, the infection risk to most passengers would be low except to
locations in close proximity to the infector. Moreover, the result shows that mechanisms
such as wearing face masks, sitting distantly are effective to reduce the infection risk.
The study would be helpful to enhance public awareness of self-protection on airplanes
and to assist airlines to implement means to protect passengers.

2
1. Introduction
As Covid-19 becomes a global pandemic, effectively slowing down its
transmission has become a challenge worldwide. With high occupant density and long
exposure time, aircraft cabin environment is susceptible to the transmission of airborne
infectious diseases [1][2]. Variety of respiratory infectious diseases, including
tuberculosis [3], influenza [4], SARS [5] and norovirus transmission [6], are reported to
have cross infection during flights. Recently, there have also been cases of suspected
in-flight cross infection of Covid-19, indicating that the potential risk cannot be
neglected [7].
Figure 1 Three likely transmission routes of Covid-19 The pathogens of respiratory infectious diseases may be produced by sneezing,
coughing, exhalation of infectors. Particles carrying these pathogens may reach the
respiratory tract of susceptible persons through different routes, including 1) direct
contact transmission, 2) short-range droplet transmission, and 3) long-distance, aerosol
(or airborne) transmission [8]. For the first two, the transmissions are limited to the close

3
range of the infector. The aerosol transmission, on the other hand, can reach much
longer distances together with the airflow. Hence, an accurate model that can accurately
predict the airflow and aerosol dispersion in the cabin is critical to assess the risk of
airborne transmission of COVID-19.
Quantitative infection risk models are essential tools for understanding risks and
evaluating the effectiveness of infection control measures. Risk assessment uses a
probabilistic method to quantitatively describe the possibility of an individual or a
population of infectious diseases. Risk assessment models are based on theories and
mathematical equations. These theories and equations are biologically reasonable and
in line with clinical or laboratory evidence.
The Well-Riley equation is a classic aerosol-borne infection probability model. In
1974, Riley et al. proposed the equation in order to describe the spread of an infectious
disease and achieved remarkable success in explaining the spread of a measles outbreak [9]. In the ASHRAE report, it is recommended to use the Wells-Riley equation to
describe the aerosol transmission of the new coronavirus [10]. It has been proved that
certain factors (especially ventilation rate) are important to influence aerosol
transmission [11].
However, the classic Wells-Riley equation is only suitable for risk assessment in a
uniform and steady-state environment, and cannot be directly used in a dynamic non-
uniform distribution scenario such as an aircraft cabin. In order to solve this problem,
we developed an improved model based on the traditional Wells-Riley equation.
Improvement was made by introducing the local dilution factor distributions for given
pollutant release sources and ventilation conditions. Combining the local dilution factor
with the Wells-Riley model, the quantitative transmission risks at different locations
can be obtained. The improved model can not only simulate the effects of general
parameters such as ventilation, source of infection, and exposure time, but also reflect
the unique characteristics of the aircraft cabin such as time variability, spatial
inhomogeneity, and personalized behavior including wearing masks.
This study details the above risk assessment model and related key parameters and

4
ranges. Based on the risk assessment model, the infection risks inside the aircraft cabin
under different conditions and with varied locations of infection source was analyzed.
Modification plans such as seats with isolation were also tested in this task.
2. Methods
2.1 Cabin flow field characteristics and CFD simulation
Due to the high density of occupancy in the cabin, the air flow field in the cabin is
influenced by both the forced convection due to mechanical ventilation and natural
convection due to human buoyance. Figure 2 shows the flow field characteristics of
the aircraft cabin section [12]. This special flow can form two vortex areas near the
passengers. The upper supply diffuser causes downwards flow in the corridor, and
the buoyance effect generates upward flow near the passengers. The entire cabin
forms a "saddle"-shaped flow field distribution.
Figure 2 Illustration of flow field characteristics of aircraft cabin
CFD (computational fluid dynamics) model has been widely used in simulating
the flow, temperature and pollutant distribution in aircraft cabins [13].
The particle phase is regarded as a continuous phase to solve the conservation
equation of particles. There are two widely used Eulerian methods: multiphase flow
model and drift flux model. The basic idea of the multiphase flow model is that the
particle phase is a pseudo fluid that interacts with the real fluid. The method is
characterized by solving the momentum equation and the continuity equation,

5
respectively. Each phase is coupled by interphase force. This model can fully consider
the turbulent diffusion of mass, momentum and energy of particles, and can consider
large slip and particle diffusion, respectively, but it takes a long time and takes up a lot
of computer memory, requires high computational skills, and sometimes it is difficult
to converge and obtain accurate results. Based on the above reasons, drift flux model is
more widely used in particular for simulating small particles. The drift flux model can
easily consider Brownian force, turbulent diffusion effect and gravity sedimentation
effect in the equation. Euler method is used to solve a new transport equation, in which
the gravitational slip of particles is considered. Eulerian equations couple the particle
concentration, air momentum and turbulent flow. The Euler transport equation of
particle concentration distribution is as follows:
(1)
Where C is the concentration of particulates, ρ is the density of air, is the
velocity of air, and is the slip velocity caused by gravity. is the turbulent
viscosity coefficient, is the turbulent Strouhal number. Each term of Euler
transport equation has a certain physical meaning, namely: unsteady term, convection
term, gravitational drift flux term and diffusion term. Because the airflow in aircraft
cabin can be regarded as a steady-state and quasi steady-state process, the first term can
be ignored. For the fourth term, because the airflow in the cabin is turbulent flow, the
dominant role is turbulent diffusion, so this term mainly reflects turbulent diffusion.
The difference between Eulerian transport equation of particulates and that of
gaseous pollutant is the drift flux term of gravity, so the calculation of gravity settling
velocity is fundamental. The expression of gravity settling velocity is as follows:
(2)
Where is the acceleration of gravity, is the particle diameter, is the
( ) ( ) ( ) ( )tst
C vC V C Ct Sc
µr r r¶+Ñ× +Ñ× =Ñ× Ñ
!!
v!
sV!
tµ
tSc
( )43
p p as
drag a
gdV
fr rr-
=!
g pd dragf

6
drag force constant, is the density of the particles, is the density of air.
A complete aircraft cabin often has dozens of rows of seats, simulating the entire
cabin would be extremely time consuming and expensive. Liu et al. [14] and other studies
suggested that, for the purpose of understanding the detailed effect of ventilation and
microenvironment around a person (infector) and surrounding passengers (susceptible),
simulating a section of the cabin would not lose insight for this particular purpose. The
reasonable number of rows in the passenger cabin is suggested to be five, preferably
seven. Hence, we adopted a section of seven rows for detailed simulations (Figure 3).
The tetrahedral grid was adopted in this study. The grid number of the 7-row cabin
simulated in this study reached at least 9 million.
a) Outline b) Interior
Figure 3 Outline of the seven-row cabin mockup
2.2 Definition and calculation of local dilution ratio for infection risk assessment
According to the Wells- Riley model, the infection risk of an aerosol-borne disease in a
well-mixed stable environment can be estimated by [9]
(3)
where P is the infection risk; C is the number of cases that develop infection; S is the
number of susceptible people; I is the number of source patients (infectors); q is the
quanta generation rate produced by one infector (h-1); p is the pulmonary ventilation
rate of each susceptible person (m3/h); t is the exposure time (h); Q is the total
ventilation (virus free) flow rate (m3/h).
pr ar
/(1 )Iqpt QCP eS
-= = -

7
The quanta generation rate (q) is the most important parameter in the model. 1
quantum is defined as a collection of pathogen particles that can infect a susceptible
individual. Assuming that the susceptible object will be infected after inhaling N parts
of pathogen particles, the N parts of pathogen particles can be "packaged" and called 1
quantum. The number of pathogen particles in a quantum is uncertain, which is related
to the specific disease. Therefore, quantum is similar to the release source intensity of
a droplet nuclei, but is different from the release source intensity of a continuous gas
source. It can be considered that the emitted quanta are discrete.
Susceptible persons will be infected once they inhale 1 quantum of pathogens,
indicating that 1 quantum of "package" contains enough pathogen particles, so that the
pathogenicity rate for any susceptible individual is 100%. In this way, the infection risk
for susceptible persons will depend on the probability of exposure to at least 1 quantum
pathogen. Therefore, q is the number of pathogens "packages" released into the air by
each infector per unit time. In brief, quanta can be simply regarded as discrete particles
carrying viruses in most cases.
When the environment is complex and there is an uneven spatial distribution of
pathogen particles, the classical Wells-Riley equation is no longer directly applicable.
A new parameter, the local dilution ratio, is thus proposed. The dilution ratio (Dr) is the
“concentration” of quanta at the location of the susceptible person divided by the
“concentration” of quanta in the breath of the infected person. Therefore, it is a
dimensionless parameter. In addition, the dilution ratio can vary from location to
location, making it possess the property of the "field". This parameter is proposed by
us and is used in the prediction of aircraft environment for the first time.
Figure 4 Schematic diagram of the distribution of virus particles exhaled by an

8
infector in the aircraft cabin and illustration of the concept dilution ratio (Dr).
Since the "concentration" of quanta contained in the breath of an infector is the
generation rate of quanta divided by the volume of respiration, the expected quantum
pathogen per unit volume at the point where a susceptible person is located is:
(4)
Where E is the quanta concentration (qunata/m3) at the location of the susceptible
person; E0 is the quanta concentration in the breath of the infector (qunata/m3); Dr is
the local dilution ratio; and q is a the quanta generation rate of the infector (quanta/h);
p is the respiratory ventilation of the susceptible person (m3/h); and ηI is the particle
filtration efficiency of the mask to the exhaled breath of the infector.
It can be seen that the expected number of inhalation per unit time is q (1-ηI)/Dr.
Therefore, local infection risk based on the dilution ratio can be obtained as follows:
(5)
Where P is the estimated infection rate at a local position; q is the quanta generation
rate of an infector (quanta/h); t is the exposure time (h); Dr is the dilution ratio; ηI and
ηs are the mask filtration efficiency of the infector and susceptible person, respectively;
pI and ps are the respiratory rate of the infector and susceptible person respectively,
which are considered the same in most cases.
The introduction of the dilution ratio makes it easier to analyze the risk in a
complex and non-uniform environment in combination with the CFD simulation.
Taking the breath of the infector as the particle source, the dilution ratio of the exhaled
breath of the infector at the location of the susceptible person can be calculated by CFD,
so as to further estimate the infection risk.
The formula for calculating the dilution ratio is:
𝐷𝑟 =Theconcentrationininfector!sexhalation
Theconcentrationinsusceptible′sexhalation (6)
0 (1 ) (1 )I IE qEDr pDrh h- -
= =
(1 )(1 )( / )/(1 )I s s Iqt p p DrlocalP e h h- - -= -

9
2.3 The calculation of infection risk in aircraft cabin
An accurate boundary condition of temperature is essential for flow field
simulation. Table 1 lists the boundary condition settings of temperature. The human
body surface temperature mainly comes from the literature [18],[19]. At this temperature,
the human body can produce a thermal plume similar to the actual situation. Other
boundary conditions come from the research of Li and others on the simulation of
pollutant in the aircraft cabin [17].
Table 1 Boundary condition setting for temperature
Location Temperature
Inlets 19℃ (66.2 ℉) [17]
Respiration 33℃ (91.4 ℉) [17]
Floor 25 ℃ (77 ℉) [17]
Walls and ceiling 24 ℃ ℃ (75.2 ℉) [17]
Sits Adiabatic
Human surface 31 ℃ (87.8 ℉) [18] [19]
The key parameters and boundary conditions are shown in Table 2. The infector
was assumed to be at the middle seat of the fourth row. The temperature boundary
conditions were set according to Table 1. The exposure time was 2 hours and the quanta
generation rate from the infector was 20 quanta/h. The air supply volume was set
according to the value of Airworthiness Standards, and the corresponding ventilation
volume was 8L/s/p.
Table 2 Key parameters and boundary conditions of the seven-row simulation
cabin
Key parameters and boundary conditions Set values
Total number of seats 42

10
Passenger occupancy 100%
Cabin pressure 85kPa
Air density 1.04125 kg/m3
Total air supply rate per passenger 0.5kg/min/p
Total supply air 0.35 kg/s
Air supply mode Attached flow
Respiratory rate 0.3 m3/h (8.677E-05 kg/s)
Facial masks are the simplest and easy-to-implement personal protection device
in the cabin so it is considered in the study. There are uncertainties of the particle
filtration efficiency of different types of masks. Masks of the same specification from
different manufacturers could also have differences in filtration efficiency. Table 3 lists
the measured average filtration efficiency of several masks that can be purchased.
Table 3 Measured filtration efficiency for different types of facial masks [20]
Type of mask Filtration efficiency (%)
Surgical 33.3
Preforming 6.1
Handkerchief 11.3
N95 89.6
3 Results and discussion
3.1 Characteristics of the flow field
The whole field was planned and marked with the axis shown in Figure 5. The
lateral direction were marked with the X axis. The up and down were marked with the
Y axis. And the anterior and posterior direction were marked with the Z axis (Figure
5a). In addition, different positions can be further numbered. Each column was 1 to 7,

11
and the lateral direction was a to f (as shown in Figure 5b). Two locations of Z = 3.1 m
and Z = 3.5 m were intercepted for further flow field analysis.
a) Axis identification
b) Seat identification
Figure 5 Identification method of the aircraft cabin
It can be observed that the whole air supply forms a "saddle"-shaped flow field
distribution in the aircraft cabin, as shown in Figures 6 and 7, which was the "main air
supply area". The "thermal plume dominant area" could also be observed, which was
circled by the red dotted line in Figures 6 and 7. The air flow around the human body
was affected by the human thermal plume and moved upward along the human body.
When it reached the head position, it was suppressed by the horizontal air supply and
could not continue to flow upward, resulting in an area named "thermal plume dominant

12
zone". The characteristics of the whole flow field were similar to those in the literature [12].
Figure 6. Flow field characteristics at cross section Z=3.5
Figure 7 Flow field characteristics at cross section Z=3.1
3.2 Characteristics of dilution ratio
Figure 8 shows the distribution of dilution ratio (Dr) at the same plane. The dilution
ratio has been increased to 5000 at two rows away from the infector. The passenger
next to the 4-b infector at the aisle side had the greatest impact. The main reason was
that the special "saddle"-shaped flow field led to the droplet nuclei from the infector in

13
the middle sucked to the aisle side passenger. The transmission of virus particles seems
to be basically limited to the front and back row around the infector. Such a zoning
effect would be beneficial to controlling the wide spread of infection inside the
cabin.
Figure 8. Distribution of dilution ratio (Dr) at Y = 1.2m
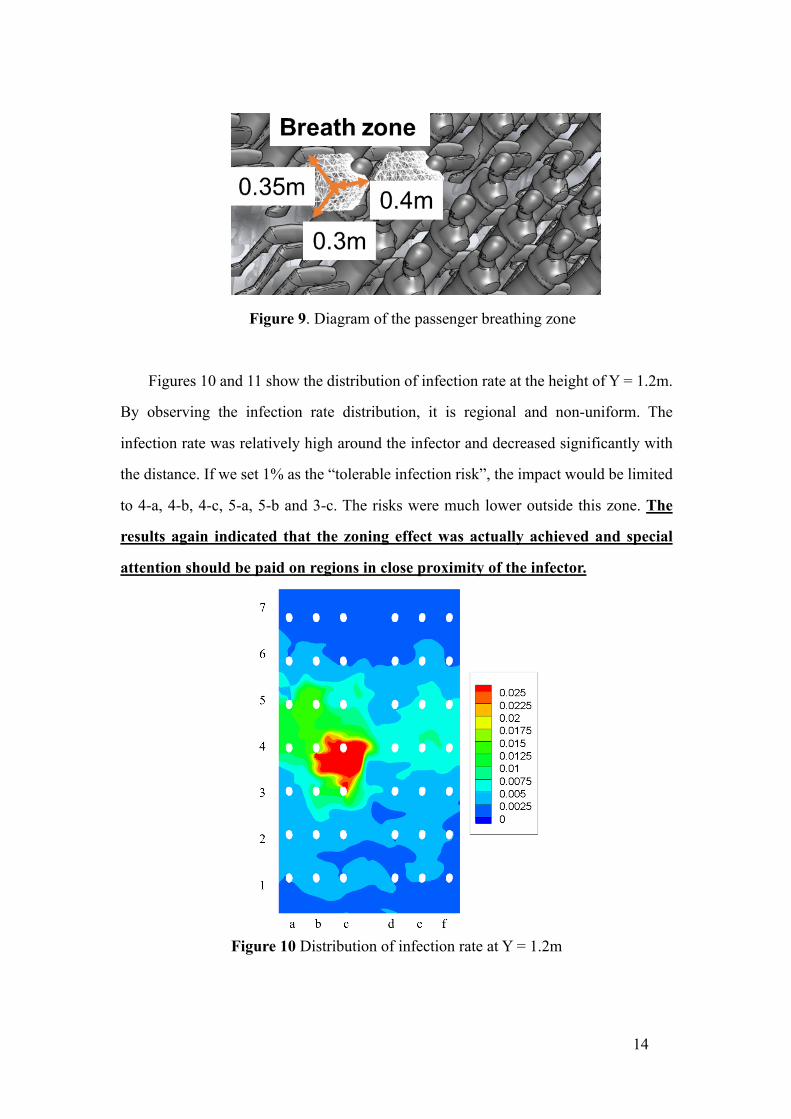
3.3 Distribution characteristics of infection risk
The infection risk of passengers in different locations was further analyzed. A
breathing zone was defined for each passenger, and the average concentration or
dilution ratio in the breathing area was used to assess the risk of infection of the
passenger. The breathing zone was defined as 0.35m (X direction) by 0.3m (Y direction)
by 0.4m (Z direction) taking the mouth as the center, as shown in Figure 9.
14
Figure 9. Diagram of the passenger breathing zone
Figures 10 and 11 show the distribution of infection rate at the height of Y = 1.2m.
By observing the infection rate distribution, it is regional and non-uniform. The
infection rate was relatively high around the infector and decreased significantly with
the distance. If we set 1% as the “tolerable infection risk”, the impact would be limited
to 4-a, 4-b, 4-c, 5-a, 5-b and 3-c. The risks were much lower outside this zone. The
results again indicated that the zoning effect was actually achieved and special
attention should be paid on regions in close proximity of the infector.
Figure 10 Distribution of infection rate at Y = 1.2m

15
Figure 11 The infection rate of different passengers’ breath zones
3.4 The influence of wearing different types of masks
The influence of the mask on the infection risk were further investigated. With the
increase of the filtration efficiency of mask, and the infection risk was significantly
reduced, from the highest infection risk of 10% in the case of all without mask to the
lowest infection risk of 0.11% in the case of all with N95 masks, as shown in Figure 12.
The results indicated that wearing of masks plays an important role in reducing
the infection risk. The results also pointed out the importance of wearing the mask with
high filtration efficiency. However, the method of wearing N95 masks should be treated
with caution. Study indicated that improper wearing of N95 masks might result to a
much lower filtration efficiency than that of the surgical mask [20]. Therefore, all
passengers are required to wear N95 mask might not be the best management method,
while if passengers can wear N95 mask correctly, it has obvious effect on protecting
themselves and others. In addition, wearing masks can also inhibit the other two kinds
of transmission of infection diseases (contact transmission and droplet transmission).

16
a) All with N95 masks b) All with surgical masks
c) Infector with a surgical mask d) No mask
Figure 12 Infection risk of passengers under mask conditions (Q = 0.5 kg/min/p, infector = 4-b, q = 20 quanta / h, exposure time = 2 h)
3.5 The influence of the location of the infector
Different locations are not completely equivalent in aircraft cabin, the location of
the infector will affect the infection risk of different passengers. The seats of economic

17
class of Boeing 737 series can be divided into three types: window seat, middle seat
and aisle seat (as shown in Figure 13).
The infection risk under different types of seats is shown in Figure 14. By
comparing the difference of the highest infection risk, the case with an infector on the
middle seat was the most adverse case, followed by the window-seat case, and the best
was the aisle-seat case. It was mainly because the flow with droplet nuclei from the
infector on the window seat or middle seat could be directly sucked to the aisle seat.
Figure 13 Three different types of seats in narrow-body aircraft
a) 4-c b) 4-b c) 4-a Figure 14 Infection risk of passengers under different location of the infector (Q = 0.5
kg/min/p, q = 20 quanta / h, all with surgical masks, exposure time = 2 h)

18
3.6 Safe distance and Scenarios design
In most condition, the identification of the infectors is difficult. Therefore, we need
more temporary improvement measures to control the spread of infectious diseases with
the unidentified infectors. The effectiveness and necessity of increasing the distance
between passengers was firstly considered, and the number or distance requirements of
passengers in high-risk flights was advised.
The location of the infected person is uncertain, so it is necessary to design a
reasonable seats arrangement to reduce the infection risk among passengers. Three
scenarios are designed and evaluated to find out the reasonable seats arrangement in
epidemic period to reduce the infection risk in the cabin. Scenario A is vacating next
seats, Scenario B is vacating alternatively, and Scenario C is vacating both rows and
next seats, as shown in Figure 15. Among the three different arrangements, the
passenger density is A = 66% > B =50% >C = 38%. According to the results above, the
spread more widely occurred when the infector was close to the window. Therefore, the
infector positions were all set to the window position, detailed in Figure 15.
a) Scenario A (n=21, 66%) b) Scenario B (n = 28, 50%) c) Scenario C (n=16,
38%)
Figure 15 Three designed scenarios

19
3.6.1 Analysis vacating next seats (Scenario A)
Comparison of infection risk between Scenario A and Standard case is shown in
Figure 16. In Scenario A, the location with the highest infection risk was 4-c, the
infection risk was 2.72%. Except for this, the infection risk of location 4-f is also higher
than 1%. The infection rate of all other locations in the cabin is very low, lower than
1%.
a) Scenario A b) Standard case
Figure 16 Comparison of infection risk between Scenario A and Standard case (Q =
0.5 kg/min/seat, q = 20 quanta / h, all with surgical masks, exposure time = 2 h)
3.6.2 Scenario B
Comparison of infection risk between Scenario B and Standard case is shown in
Figure 17. In Scenario B, the location with the highest infection risk is 4-c, the infection
risk is 2.09%. Except for this, the infection risk of location 4-e is also higher than 1%.
The infection rate of all other locations in the cabin is very low, lower than 1%.

20
a) Scenario B b) Standard case
Figure 17 Comparison of infection risk between Scenario B and Standard case
3.6.3 Scenario C
Comparison of infection risk between Scenario C and Standard case is shown in
Figure 18. In Scenario C, the location with the highest infection risk is 5-c, the infection
risk is 1.05%. The infection rate of all other locations in the cabin is very low, lower
than 1%.

21
a) Scenario C b) Standard case
Figure 18 Comparison of infection risk between Scenario C and Standard case
3.6.4 Comparison of the three Scenarios
From the infection risk assessment results of the three scenarios, reducing the
passenger density or increasing the distance between the passengers in the cabin can
effectively reduce the infection risk in the cabin. The reduction of the highest infection
risk in the cabin changed with the number of passengers in the cabin is shown in Figure
19. Comparing the highest infection risks of the three cases and the standard case, the
highest infection risk of Scenario A, Scenario B and Scenario C is reduced 54%, 38%
and 77% respectively. No matter which scenario, the infected person still has a
significant impact on the passenger near the corridor in the same row. For the Scenario
C who has the least number of passengers, except for the same side and row, the
infection rate of other positions can be controlled within 0.5%.

22
Figure 19. The reduction of the highest infection risk in the cabin changed with the
number of passengers in the cabin
5. Conclusions
5.1 Innovative Approach
In this project, the airflow and pollutant fields inside the aircraft cabin are treated
as non-uniform which is closer to reality. To deal with this situation, the COVID-19
risk assessment model has been established. Based on the actual parameters in the
aircraft cabin and the infector, the model provides simulations of the flow field and
concentration field inside the aircraft cabin. Combining with the new concept, dilution
ratio, we are able to apply the modified Wells-Riley equation to different locations
within the cabin, and the infection risk can therefore be estimated.
5.2 Infection Risk Assessment
The infection risk distribution indicated that the influence of the infection source
was limited between the front and rear two rows of the infector, mainly affecting the
passengers on the same side. Under a typical simulated condition, the maximum risk
0.00%0.50%1.00%1.50%2.00%2.50%3.00%3.50%4.00%4.50%5.00%
10 15 20 25 30 35 40 45
The
high
est i
nfec
tion
risk
Passenger number

23
of infection to the passenger sitting next to the infector would be below 5%, and in
most other locations less than 1%. This project also found an important “zoning
effect” around the infector, whereby special attention could be paid to locations that
are in close proximity to the infectors. The finding of this zoning effect is of great
significance for the prevention and control of airborne transmission in the aircraft
cabin.
5.3 Masks’ Value
After comparing the infection risk distribution for people wearing different types
of masks, the results show that whether or not wearing a mask and the particle
filtration efficiency of the masks have a significant impact on the infection risk. If the
N95 mask is used correctly, the infection risk can be reduced by 99% compared with
that without wearing masks. Even the use of surgical masks can reduce the infection
risk by 55%.
5.4 Vacating Seats is Beneficial
Reducing the passenger density or increasing the distances between the
passengers in the cabin can also effectively reduce the infection risk in the cabin.
Comparing to the “standard” situation, the highest infection risk by vacating seats
could cut the infection risk by half or more, at the price of reduced revenues by
airliners. An optimization scheme could be obtained based on the simulation model
by considering simultaneously lowering the infection risk and losing operation
revenue.
Acknowledgments
This project was conducted under the guidance of Prof. Xudong Yang and Dr.
Junzhou He at Tsinghua University, Beijing.

24
References
[1] Houk, V.N., Baker, J.H., Sorensen, K. and Dent, D.C. (1968) The epidemiology of
tuberculosis infection in a closed environment, Arch. Environ. Health, 16, 26–50.
[2] Mangili, A. and Gendreau, M.A. 2005, Transmission of infectious disease during
commercial air travel, Lancet, 365, 989–996.
[3] Kenyon, T.A., Valway, S.E., Ihle, W.W., Onorato, I.M. and Castro, K.G. (1996)
Transmission of multidrug resistant mycobacterium tuberculosis during a long
airplane flight, N. Engl. J. Med., 334, 933–938.
[4] Moser, M.R., Bender, T.R., Margolis, H.S., Noble, G.R., Kendal, A.P. and Ritter,
D.G. (1979) An outbreak of influenza aboard a commercial airliner, Am. J.
Epidemiol., 110, 1–6.
[5] Olsen, S.J., Chang, H.L., Cheung, T.Y., Tang, A.F., Fisk, T.L., Ooi, S.P., Kuo,
H.W., Jiang, D.D., Chen, K.T., Lando, J., Hsu, K.H., Chen, T.J. and Dowell, S.F.
(2003) Transmission of the severe acute respiratory syndrome on aircraft, N. Engl.
J. Med., 349, 2416– 2422.
[6] Kirking, H.L., Cortes, J., Sherry, B., Hall, A.J., Cohen, N.J., Lipman, H., Kim, C.,
Daly, E
[7] Jianyun, L., G. Jieni, and L. Kuibiao. (2020) COVID-19 Outbreak Associated with
Air Conditioning in Restaurant, Guangzhou, China. Emerg. Infect. Dis. 26.7.
[8] Tellier R, Li Y, Cowling B J, et al. Recognition of aerosol transmission of infectious agents:
a commentary. BMC Infectious Diseases 2019, 19(1): 101.
[9] Riley E C, Murphy G, Riley R L. Airborne spread of measles in a suburban elementary
school. American Journal of Epidemiology 1978, 107(5): 421-432.
[10] Schoen L J, Hodgson M J, McCoy W F, et al. ASHRAE position document on airborne
infectious diseases. ASHRAE: Atlanta, GA, USA. 2020-04-29.
[11] Escombe AR, Oeser CC, Gilman RH, Navincopa M, Ticona E, et al. Natural ventilation
for the prevention of airborne contagion. PLoS Medicine 2007, 4: e68.
[12] Yang Caiqing, 2016. Study on the distribution and diffusion characteristics of

25
environmental pollutants in aircraft cockpit (postdoctoral report, Tsinghua University).
[13] Chen Q, Ventilation performance prediction for buildings: A method overview and recent
applications. Building and Environment 2009,44(4), 848-858.
[14] Liu Sumei, 2012. Numerical Simulation of Reasonable Row Number and Pollutant
Dispersion in Passenger Cabin (Master's Thesis, Tianjin University, China).
[15] Liu W, Wen J, Lin CH, Liu J, Long Z, Chen Q, Evaluation of various categories of
turbulence models for predicting air distribution in an airliner cabin. Building and
Environment 2013, 65: 118-131.
[16] Yu G, Yu B, Sun S, and Tao W Q, Comparative study on triangular and quadrilateral
meshes by a finite-volume method with a central difference scheme. Numerical Heat
Transfer B-Fundamentals 2012, 62(4):243-263.
[17] Li M, Zhao B, Tu J, et al. Study on the carbon dioxide lockup phenomenon in aircraft
cabin by computational fluid dynamics. Building Simulation. 2015, 8(4): 431-441. [18] Gao N, Niu J. CFD study on micro-environment around human body and personalized
ventilation. Building and Environment, 2004, 39(7): 795-805. [19] Sørensen D N, Voigt L K. Modelling flow and heat transfer around a seated human body
by computational fluid dynamics. Building and Environment, 2003, 38(6): 753-762
[20] Bowen L E. Does that face mask really protect you? Applied biosafety, 2010, 15(2): 67-
71.